Submitted:
06 June 2025
Posted:
09 June 2025
You are already at the latest version
Abstract
Meningiomas are the most common primary intracranial tumors in adults. Surgical resection of most meningiomas is effective in reducing recurrence risk. Visualization of meningiomas helps radiologists assess the distribution and volume of the tumor within the brain and facilitates planning the surgery by neurosurgeons. This paper introduces an innovative realistic 3D medical visualization system, namely SegR3D. It incorporates a 3D medical image segmentation pipeline, which preprocesses the data via semi-supervised learning-based multi-target segmentation to generate masks of the lesion areas. Subsequently, both the original medical images and segmentation masks are utilized as non-scalar volume data inputs into the realistic rendering pipeline. We propose a novel importance transfer function, assigning varying degrees of importance to different mask values to emphasize the areas of interest. Our rendering pipeline integrates physically based rendering with advanced illumination techniques to enhance the depiction of the structural characteristics and shapes of lesion areas. We conducted a user study involving medical practitioners to evaluate the effectiveness of SegR3D. Our experimental results indicate that SegR3D demonstrates superior efficacy in the visual analysis of meningiomas compared to conventional visualization methods.
Keywords:
Medical visualization
; Semi-supervised learning
; Image segmentation
; Realistic volume rendering
1. Introduction
Medical visualization is crucial for assisting physicians in analyzing diseases [1,2], particularly for different lesions. Meningiomas are the most common primary intracranial tumors in adults. Most meningiomas can be surgically resected to reduce the risk of recurrence [3]. Visualization of meningiomas helps radiologists assess the location and volume of the tumor within the brain and facilitates neurosurgeons’ surgery planning.
However, traditional medical 3D visualization methods struggle to effectively distinguish lesion areas from normal tissue due to overlapping pixel value ranges between tumor and non-tumor regions [1,4]. Conventional methods usually fail to accurately identify lesion areas and highlight them automatically. For a more effective analysis of tumors’ 3D structures, segmentation of tumors is frequently required. In recent years, with the development of deep learning, automatic segmentation technique has been significantly improved [5]. However, the technique relies on meticulously annotated data of high quality, which is expensive and time-consuming to acquire. More and more deep learning methods have adopted semi-supervised learning (SSL) strategies to reduce the dependence on annotations [6,7,8,9]. Therefore, we embed the SSL-based segmentation method into our visualization system to reduce the cost of manual annotations.
The visualization of segmentation results is also crucial. Traditional approaches involve extracting meshes from segmented masks, yet they struggle to analyze tumor positions across the brain. Direct volume rendering (DVR) can reveal the internal structure of volume data and stands as a pivotal technique in medical visualization [1,10,11,12]. It aids in displaying richer hierarchical details in the rendered results. Existing DVR techniques [10,13] face challenges in achieving the desired fusion display of original data and segmentation results. Hence, an advanced visualization technique is needed to achieve it.
In this paper, our realistic rendering system SegR3D is introduced. It aims to enhance tumor visualization to assist the physician in surgical planning. Two examples of the visualization results using SegR3D are provided in Figure 1. Our main contributions are as follows: (1) We present an interactive visualization system that integrates a segmentation pipeline to obtain lesion regions of meningiomas. Our system offers a visualization method that fuses the original medical images and the segmentation results. (2) An SSL-based segmentation model is proposed to acquire the lesion area of meningiomas, named uncertainty correction pyramid model based on probability-aware cropping (UCPPA). This model offers a simple training process, as it eliminates the need for multiple forward passes [15], thereby enhancing SegR3D’s inference efficiency [9]. The probability-aware weighted random cropping employs a finite set of labels to construct a cropping probability mask. The mask is used to extract more sub-volumes from the lesion regions in both labeled and unlabeled images, optimizing the use of data. (3) We propose a novel importance transfer function to enhance the rendering outcome by emphasizing areas that we consider to be more significant for identifying tumors. We integrate advanced illumination techniques to enhance the stereoscopic quality of the rendering outcome [10,11,16,17,18,19]. The spatial partitioning acceleration technique is used to enable real-time interaction for users [20,21].
Based on the evaluation conducted by multiple clinicians, our system shows outstanding performance in tumor analysis and surgical planning compared to conventional methods. It can be used as a useful tool for medical visualization.
2. Materials and Methods
2.1. Public MRI Datasets
We used a publicly available dataset from the Brain Tumor Segmentation 2023 Meningioma Challenge (BraTS2023-MEN) [14]. This dataset consists of 1650 cases from six medical centers, with an annotated training set of 1000 cases, each providing multiparametric MRI (mpMRI) (T1-weighted, T2-weighted, T2-FLAIR, T1Gd) and ground truth annotations by radiologists with 10+ years of experience. The annotations consist of non-enhancing tumor core (NETC), enhancing tumor (ET) and SNFH.
In our experiments, NETC and ET were categorized as meningiomas, representing the primary surgical targets for gross total resection. We divided the 1000 T2-FLAIR series into three subsets: 666 for training, 134 for validation, and 200 for testing. Patient demographics are given in Table 1.
2.2. The Realistic 3D Medical Visualization System
In this section, we describe the realistic 3D medical visualization system: SegR3D. It utilized a semi-supervised segmentation model and interactive realistic rendering for the visualization analysis of lesion regions, as illustrated in Figure 2.
2.2.1. Semi-Supervised Segmentation Model
Uncertainty Correction Pyramid Model.The SegR3D system adopted a 3D semi-supervised segmentation method for outlining lesion areas of meningiomas in MRI. The training set was divided into a labeled data set and an unlabeled data set , where was the input volume and was the ground-truth annotation (2 foreground categories). We referred to the design of uncertainty rectified pyramid consistency (URPC) [9]. The auxiliary segmentation headers were added to V-Net [22] decoders at different resolution levels. For the input image , the network generates a set of segmentation results of different scales. The results were resized to match the dimensions of by upsampling, yielding the sequence . For the inputs with labeled y, the supervised optimization objective was the combination of two loss functions and can be formulated as:
where is the robust cross-entropy loss, and is the soft dice loss.
For unlabeled data, we calculated the loss through a scale-level uncertainty-aware approach [9]. The total optimization objective includes the supervised loss and the unsupervised loss, which is formulated as:
where is a widely-used time-dependent Gaussian warming up function [9]. It can be used to control the trade-off between supervised and unsupervised losses, which is defined as:
where means the final regularization weight, t denotes the current training step, and is the maximal training step.
Probability-Aware Weighted Random Cropping.Most meningiomas are small in comparison to the brain and appear in a limited number of sequences in MRI. Inspired by the work of Lin et al. [23], we develop the probability-aware weighted random cropping strategy to make the model focus more on the lesion region. For each labeled image , we establish a list with the length of D, where each element’s index represents the starting point on the depth axis for cropping. An element at index j in list is assigned a value of 1 only if the cropping window starting at j contains more than k voxels labeled as foreground. Then these lists are aggregated across all labeled images to form a list . The element values in L represent the probabilities of the elements, and the indexes of the elements in L are selected for cropping through a weighted random selection process. Empirically, we set the threshold k to 50 in our experiments.
2.2.2. Visualization
Our research work focused on three key aspects for the visualization of meningiomas in MRI: (1) We integrated and displayed lesion segmentation results with the original medical images. This allows physicians to easily identify lesion areas and perform an objective volumetric assessment of meningiomas. (2) We incorporated advanced illumination and shadowing to enhance the 3D sense. (3) We emphasized efficient real-time computation to meet interactive requirements.
Visualization of Non-Scalar Data.Each pixel of the input data for the renderer comprised a 2D vector , representing the original medical image pixel value and the mask value generated by the segmentation pipeline. A 2D transformation function was defined, which mapped voxel values to material attributes [1]. These material attributes commonly used in realistic DVR include opacity, phase function coefficients, albedo, and smoothness [24].
We designated the foreground in the segmentation results as "important regions". In visualization, it is imperative to prevent unimportant regions from impacting the observation of important regions in the rendered results. To address this issue, we proposed a novel importance transfer function as the second dimension of T. The transfer function can be used to translate the mask value into the importance value I, which is defined as:
The material attribute values, namely opacity, smoothness and albedo, were readjusted based on importance value. The new attribute values were obtained by multiplying them with I. If the importance value I was lower than 1, each of the attribute values was reduced by I. I represented a nonlinear transformation of g, providing finer control over regions with higher importance. In this equation, controls the level of precision, with higher values enabling more detailed control over regions of greater importance. The importance transfer function was applied to smoothness, albedo and opacity to highlight regions of interest. The effects of this function were discussed in Section 3.2.
Realistic DVR.Hybrid volumetric scattering and surface scattering model [24,25] was employed as the shading model. Utilizing this shading model can yield rendering outcomes with realistic material appearances. The radiative transfer equation (RTE) simulates the process of light propagation within a volumetric space, constituting a technique for achieving realistic DVR [18,24,26]. The Monte Carlo-based null-scattering algorithm [26] represents an advanced method for solving the RTE and was used in SegR3D.
Acceleration Structure.The maximum density value in the volumetric space is higher than the density in the majority of regions. This results in a significantly reduced average sampling step length [20,21,26], thus greatly impacting sampling efficiency. In SegR3D, the volumetric space was divided into multiple macrocells, and 3D-DDA traversal algorithm was used to enhance sampling efficiency [20,21].
2.3. Implementation Details
Before training the segmentation model, the input scans were normalized to zero mean and unit variance. The size of each image was 240 × 240 × 150. During training, the patch size was 128 × 128 × 32. The total number of epochs for training was set to 500. The initial value of the learning rate was set to 0.001, which was adaptively adjusted using the ReduceLROnPlateau method. Stochastic gradient descent (SGD) was used as the optimizer. The batch size was set to 4, which included 2 labeled images and 2 unlabeled images. Data enhancement methods included probability-aware weighted random cropping, flipping and rotation. The segmentation network was crafted with PyTorch 1.8 and trained on a GRID V100D-8Q.
Our rendering system was implemented using C++ and CUDA, incorporating an embedded Python environment. It operated seamlessly on an RTX 4070 Ti GPU. Realistic DVR capabilities were achieved through C++ and CUDA programming languages.
3. Results
3.1. Segmentation Metrics and Results
Dice and 95% Hausdorff Distance (HD95) were employed as segmentation evaluation metrics. The segmentation performance of various methods on the testing set is presented in Table 2, with the first row detailing the outcomes for V-Net [22] trained via supervised learning. Additionally, we have implemented several cutting-edge SSL segmentation techniques for comparison, including calibrating label distribution (CLD) [23] and URPC (baseline) [9] in Table 2. The lack of labels in the training set diminished segmentation accuracy across all categories. UCPPA gained 72.9% and 80.0% Dice on meningiomas and SNFH respectively, which improved the segmentation results compared to both CLD and URPC.
Furthermore, various segmentation examples from different networks were visualized using the SegR3D system, as illustrated in Figure 3. UCPPA produced precise segmentation outcomes for both meningioma and SNFH regions. This demonstrates the effectiveness of probability-aware weighted random cropping.
3.2. The Role of Importance Transfer Function
Lowering the albedo value and smoothness value of unimportant regions helps mitigate the accumulation of highlights, which could otherwise affect observations. Lowering the opacity of unimportant regions aims to prevent them from obstructing important regions. Various visual effects can be created by adjusting the importance transfer function, as illustrated in Figure 4.
3.3. User Evaluation of the SegR3D System
We engaged a cohort of physicians in a user survey, comprising a total of 15 participants, including 8 radiologists and 7 surgeons. We presented four descriptors, and the physicians rated their level of agreement with these descriptions. Ratings ranged from 1 to 5, with 1 indicating "strongly disagree" and 5 indicating "strongly agree." The first three descriptions are utilized for assessing visualization algorithms, as depicted in Figure 5. The inquiry assesses Q1 whether our approach is more conducive to perceiving the location and distribution of lesions, Q2 whether it facilitates better perception of tumor shape, and Q3 whether it holds advantages over other methods. We exclude methods that require complex manual operations to achieve the desired visualization. The fourth description pertains to assessing Q4 whether our system’s visualization outcomes have reached a sufficient level of precision for lesion analysis and surgical planning when compared to those obtained from ground truth.
The statistical results of user experiment ratings are presented in Figure 6 using a Gantt chart. It can be observed that all participating physicians consider our system as the optimal visualization tool. They can selectively emphasize lesion areas through the adjustment of the importance transfer function, thereby enhancing comprehension of tumor location and morphology.
4. Discussion
In this study, we developed a realistic 3D medical visualisation system named SegR3D, which combines a segmentation pipeline and a realistic rendering pipeline. The segmentation pipeline can segment the tumor region and the SNFH region in meningiomas automatically. The realistic rendering pipeline provides an interactive visualisation of the region of interest and allows the user to adjust the target object’s appearance and observation direction. SegR3D helps radiologists to assess the distribution and volume of meningiomas in the brain and facilitates neurosurgeons to make surgical plans.
To reduce the reliance on expert annotations, the segmentation pipeline used a semi-supervised training approach. The proposed UCPPA network achieved results comparable to fully supervised methods V-Net using only 20% of annotated data (Meningiomas: Dice of 72.9% 80.0%, HD95 of 12.8mm 9.2mm; SNFH: Dice of 80.0% 83.0%, HD95 of 10.8mm 9.7mm). This success can be attributed to the novel probability-aware weighted random cropping we introduced, which enabled UCPPA to focus more effectively on the lesion regions.
Our visualization system employs AI segmentation technology as a pre-classifier to distinguish between diseased and healthy tissue regions. The visualization engine integrates medical image segmentation with photorealistic rendering to effectively highlight regions of interest, such as lesions. The system not only displays the shape of the lesions but also provides a clear representation of their distribution within the surrounding brain tissue. Furthermore, the design of the importance transfer function simplifies user interaction, allowing users to adjust the importance of different tissues to emphasize specific areas. Compared to existing visualization methods, our approach offers significant advantages. Furthermore, through discussions with physicians, we have learned that the majority of user experiment participants indicated their willingness to consider the visualization outcomes of SegR3D in clinical practice. However, they have also expressed a desire for SegR3D to visualize the relationship between tumors, blood vessels, and nerves to mitigate surgical risks. This constitutes a prospective avenue for our future research endeavors.
Although this work used a large publicly available dataset of meningiomas (BraTS2023-MEN), the segmentation model was still trained and evaluated using a single dataset. This may limit the generalizability of SegR3D. Validation in a variety of clinical settings would be beneficial. Additionally, our system was unable to visualise the relationship between tumors, blood vessels and nerves, whose positional relationship is extremely important for surgical planning. Overall, future work will focus on improving the accuracy and versatility of the segmentation model, enhancing the visualization imaging effect, and improving real-time interaction quality, thereby making SegR3D an ideal tool for physicians.
5. Conclusions
In this paper, we proposed an interactive visualization system SegR3D for meningiomas that integrates a semi-supervised segmentation pipeline and a realistic rendering pipeline. Considering the relative smallness of meningiomas compared to the brain, we introduced probability-aware weighted random cropping into the segmentation model, substantially enhancing segmentation performance beyond the baseline. To highlight the lesion location in the visualization results, we proposed an importance transfer function to adjust the material parameters by evaluating the importance of different regions. Furthermore, we introduced realistic rendering to enhance the spatial three-dimensionality of the rendered results. SegR3D has undergone evaluation by multiple clinicians and has been recognized as highly valuable for tumor analysis and surgical planning.
Supplementary Materials
The following supporting information can be downloaded at the website of this paper posted on Preprints.org.
Funding
This research and APC were funded by the National Natural Science Foundation of China grant number Nos. 82473472 and Suzhou Basic Research Pilot Project grant number SJC2021022.
Data Availability Statement
The data presented in this study are available in BraTS 2023 Challenge at https://www.synapse.org/Synapse:syn51156910/wiki/627000.
Conflicts of Interest
The authors declare no conflicts of interest.
References
- Preim, B. , Botha, C. P.: Visual computing for medicine: theory, algorithms, and applications. Meg, D., Heather, S., Newnes (2013).
- Linsen, L. , Hagen, H., et al.: Visualization in medicine and life sciences. Gerald, F., Hans-Christian, H., Berlin/Heidelberg, Germany: Springer, (2008).
- Ogasawara, C. , Philbrick, B. D., et al.: Meningioma: a review of epidemiology, pathology, diagnosis, treatment, and future directions. Biomedicines 9(3), 319 (2021).
- Agus, M. , Aboulhassan, A., et al.: Volume Puzzle: visual analysis of segmented volume data with multivariate attributes. 2022 IEEE Visualization and Visual Analytics (VIS), LNCS, pp. 130-134 (2022).
- Jiao, R. , Zhang, Y., et al.: Learning with limited annotations: a survey on deep semi-supervised learning for medical image segmentation. Computers in Biology and Medicine, 107840 (2023).
- Zeng, L. L.; Gao, K.; et al. SS-TBN: A Semi-Supervised Tri-Branch Network for COVID-19 Screening and Lesion Segmentation. IEEE Transactions on Pattern Analysis and Machine Intelligence. (2023) 2023.
- Wang, X. , Yuan, Y., et al.: SSA-Net: Spatial self-attention network for COVID-19 pneumonia infection segmentation with semi-supervised few-shot learning. Medical Image Analysis 79, 102459 (2022).
- Huang, W. , Chen, C., et al.: Semi-supervised neuron segmentation via reinforced consistency learning. IEEE Transactions on Medical Imaging 41(11), 3016-3028 (2022).
- Luo, X. , Wang, G., et al.: Semi-supervised medical image segmentation via uncertainty rectified pyramid consistency. Medical Image Analysis 80, 102517 (2022).
- Denisova, E. , Manetti, L., et al.: AR2T: Advanced Realistic Rendering Technique for Biomedical Volumes. In: Elisa, B., Wen, G. (eds.) MICCAI 2023. LNCS, vol. 14225, pp. 347-357. Springer, Vancouver (2023).
- Rowe, S. P. , Johnson, P. T., et al.: Initial experience with cinematic rendering for chest cardiovascular imaging. The British journal of radiology 91(1082), 20170558 (2018).
- Li, Q. , Nishikawa, R. M.: Computer-aided detection and diagnosis in medical imaging. Taylor & Francis, (2015).
- Igouchkine, O. , Zhang, Y., et al.: Multi-Material Volume Rendering with a Physically-Based Surface Reflection Model. IEEE Transactions on Visualization and Computer Graphics 2018(12), 3147-3159 (2017).
- LaBella, D. , Adewole, M., et al.: The ASNR-MICCAI Brain Tumor Segmentation (BraTS) Challenge 2023: Intracranial Meningioma. arXiv, arXiv:2305.07642 (2023).
- Wang, Y. , Zhang, Y., et al.: Double-uncertainty weighted method for semi-supervised learning. In: Anne, L., Martel, P. A. (eds.) MICCAI 2020. LNCS, vol. 12261, pp. 542-551. Springer, Peru (2020).
- Lindemann, F. , Ropinski, T.: About the Influence of Illumination Models on Image Comprehension in Direct Volume Rendering. IEEE Transactions on Visualization and Computer Graphics 17(12), 1922-1931 (2011).
- Jönsson, D. , Sundén, E., et al.: A Survey of Volumetric Illumination Techniques for Interactive Volume Rendering. Computer Graphics Forum 33(1), 27-51 (2014).
- Dappa, E. , Higashigaito, K., et al.: Cinematic rendering - an alternative to volume rendering for 3D computed tomography imaging. Insights Into Imaging 7(6), 849-856 (2016).
- Kraft, V. , Schumann, C., et al.: A Clinical User Study Investigating the Benefits of Adaptive Volumetric Illumination Sampling. IEEE Transactions on Visualization and Computer Graphics, (2024).
- Szirmay-Kalos, L. , Tóth, B., et al.: Free path sampling in high resolution inhomogeneous participating media. Computer Graphics Forum 30(1), 85-97 (2011).
- Pharr, M.; Jakob, W.; et al. Physically based rendering: From theory to implementation. MIT Press. 2023. [Google Scholar]
- Milletari, F. , Navab, N., et al.: V-net: Fully convolutional neural networks for volumetric medical image segmentation. In: 2016 fourth international conference on 3D vision (3DV), pp. 565-571. Ieee, Stanford, CA, USA (2016).
- Lin, Y. , Yao, H., et al.: Calibrating label distribution for class-imbalanced barely-supervised knee segmentation. In: Elisa, B., Wen, G. (eds.) MICCAI 2022. LNCS, vol. 13438, pp. 109-118. Springer, Switzerland (2022).
- Kroes, T. , Post, F. H., et al.: Exposure render: An interactive photo-realistic volume rendering framework. PloS one 7(7), e38586 (2012).
- von Radziewsky, P. , Kroes, T., et al.: Efficient stochastic rendering of static and animated volumes using visibility sweeps. IEEE Transactions on Visualization and Computer Graphics 23(9), 2069-2081 (2016).
- Miller, B. , Georgiev, I., et al.: A null-scattering path integral formulation of light transport. ACM Transactions on Graphics (TOG) 38(4), 1-13 (2019).
Figure 1.
The visualization of meningiomas (encompassing both enhancing tumor and non-enhancing tumor core regions) and the surrounding non-enhancing T2/FLAIR hyperintensity (SNFH) from BraTS 2023 dataset [14] using the SegR3D system.
Figure 1.
The visualization of meningiomas (encompassing both enhancing tumor and non-enhancing tumor core regions) and the surrounding non-enhancing T2/FLAIR hyperintensity (SNFH) from BraTS 2023 dataset [14] using the SegR3D system.
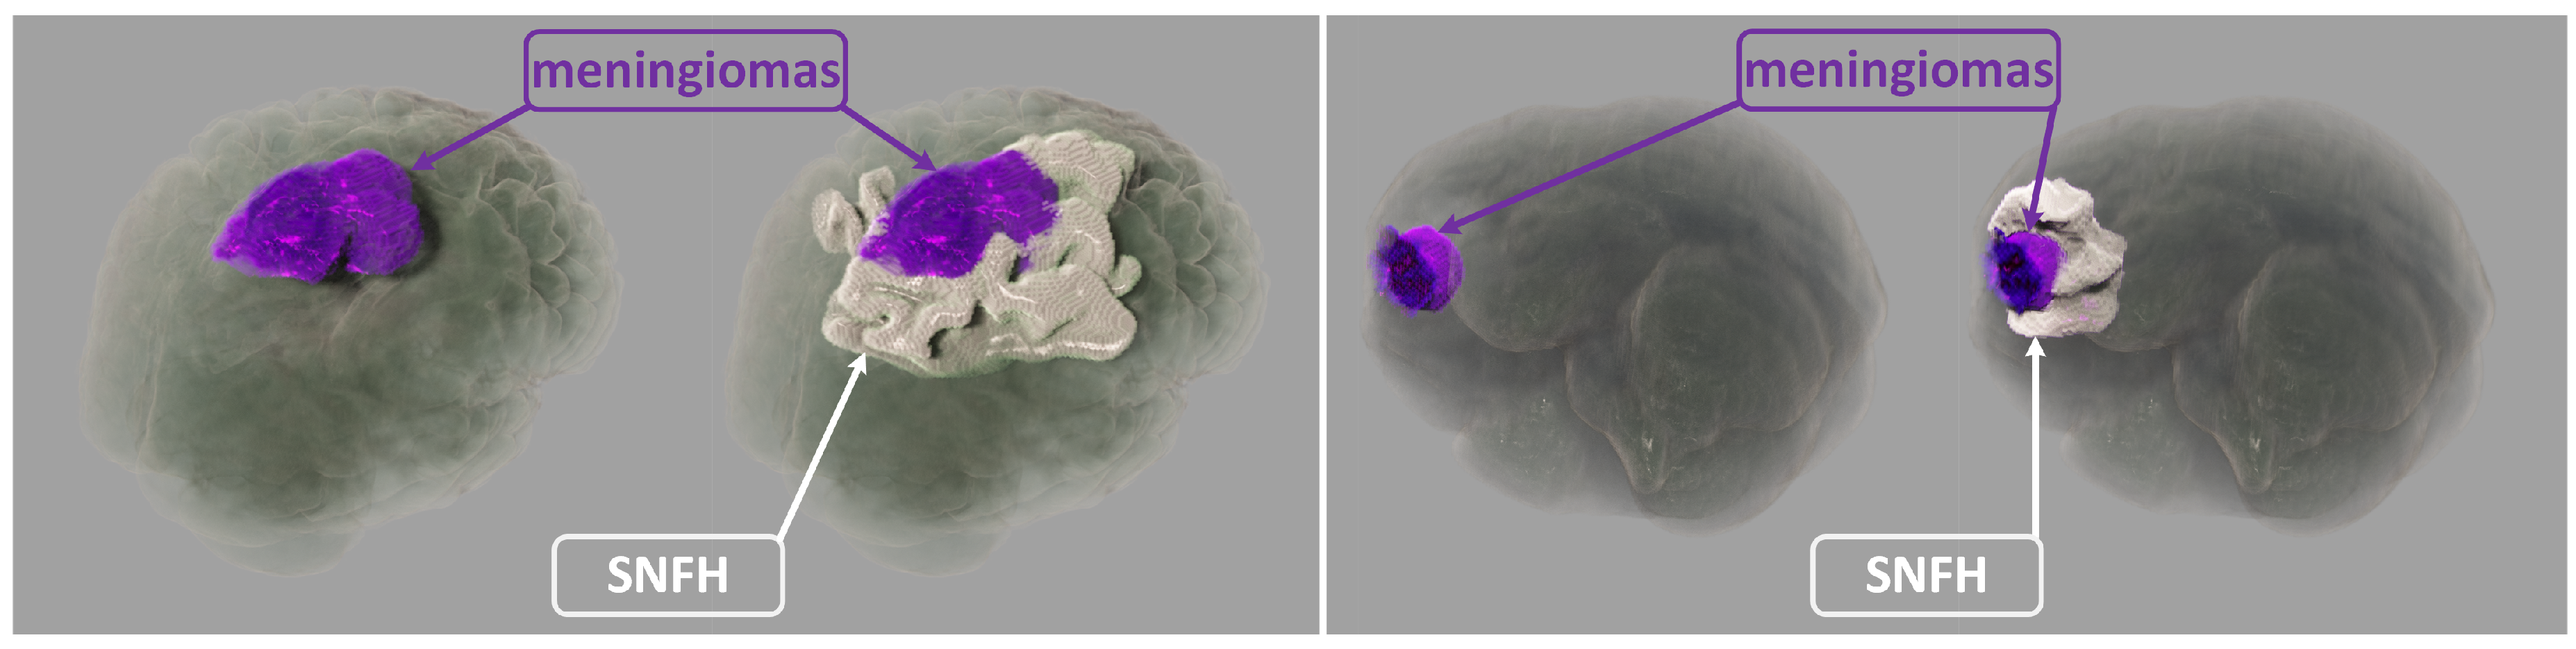
Figure 2.
The framework of SegR3D. Medical images are input into the segmentation model (UCPPA) to acquire segmentation results. Subsequently, both the medical images and masks are provided as input to the volume renderer. SegR3D offers interactive volume visualization effects. Users can adjust the target object’s appearance and observation direction.
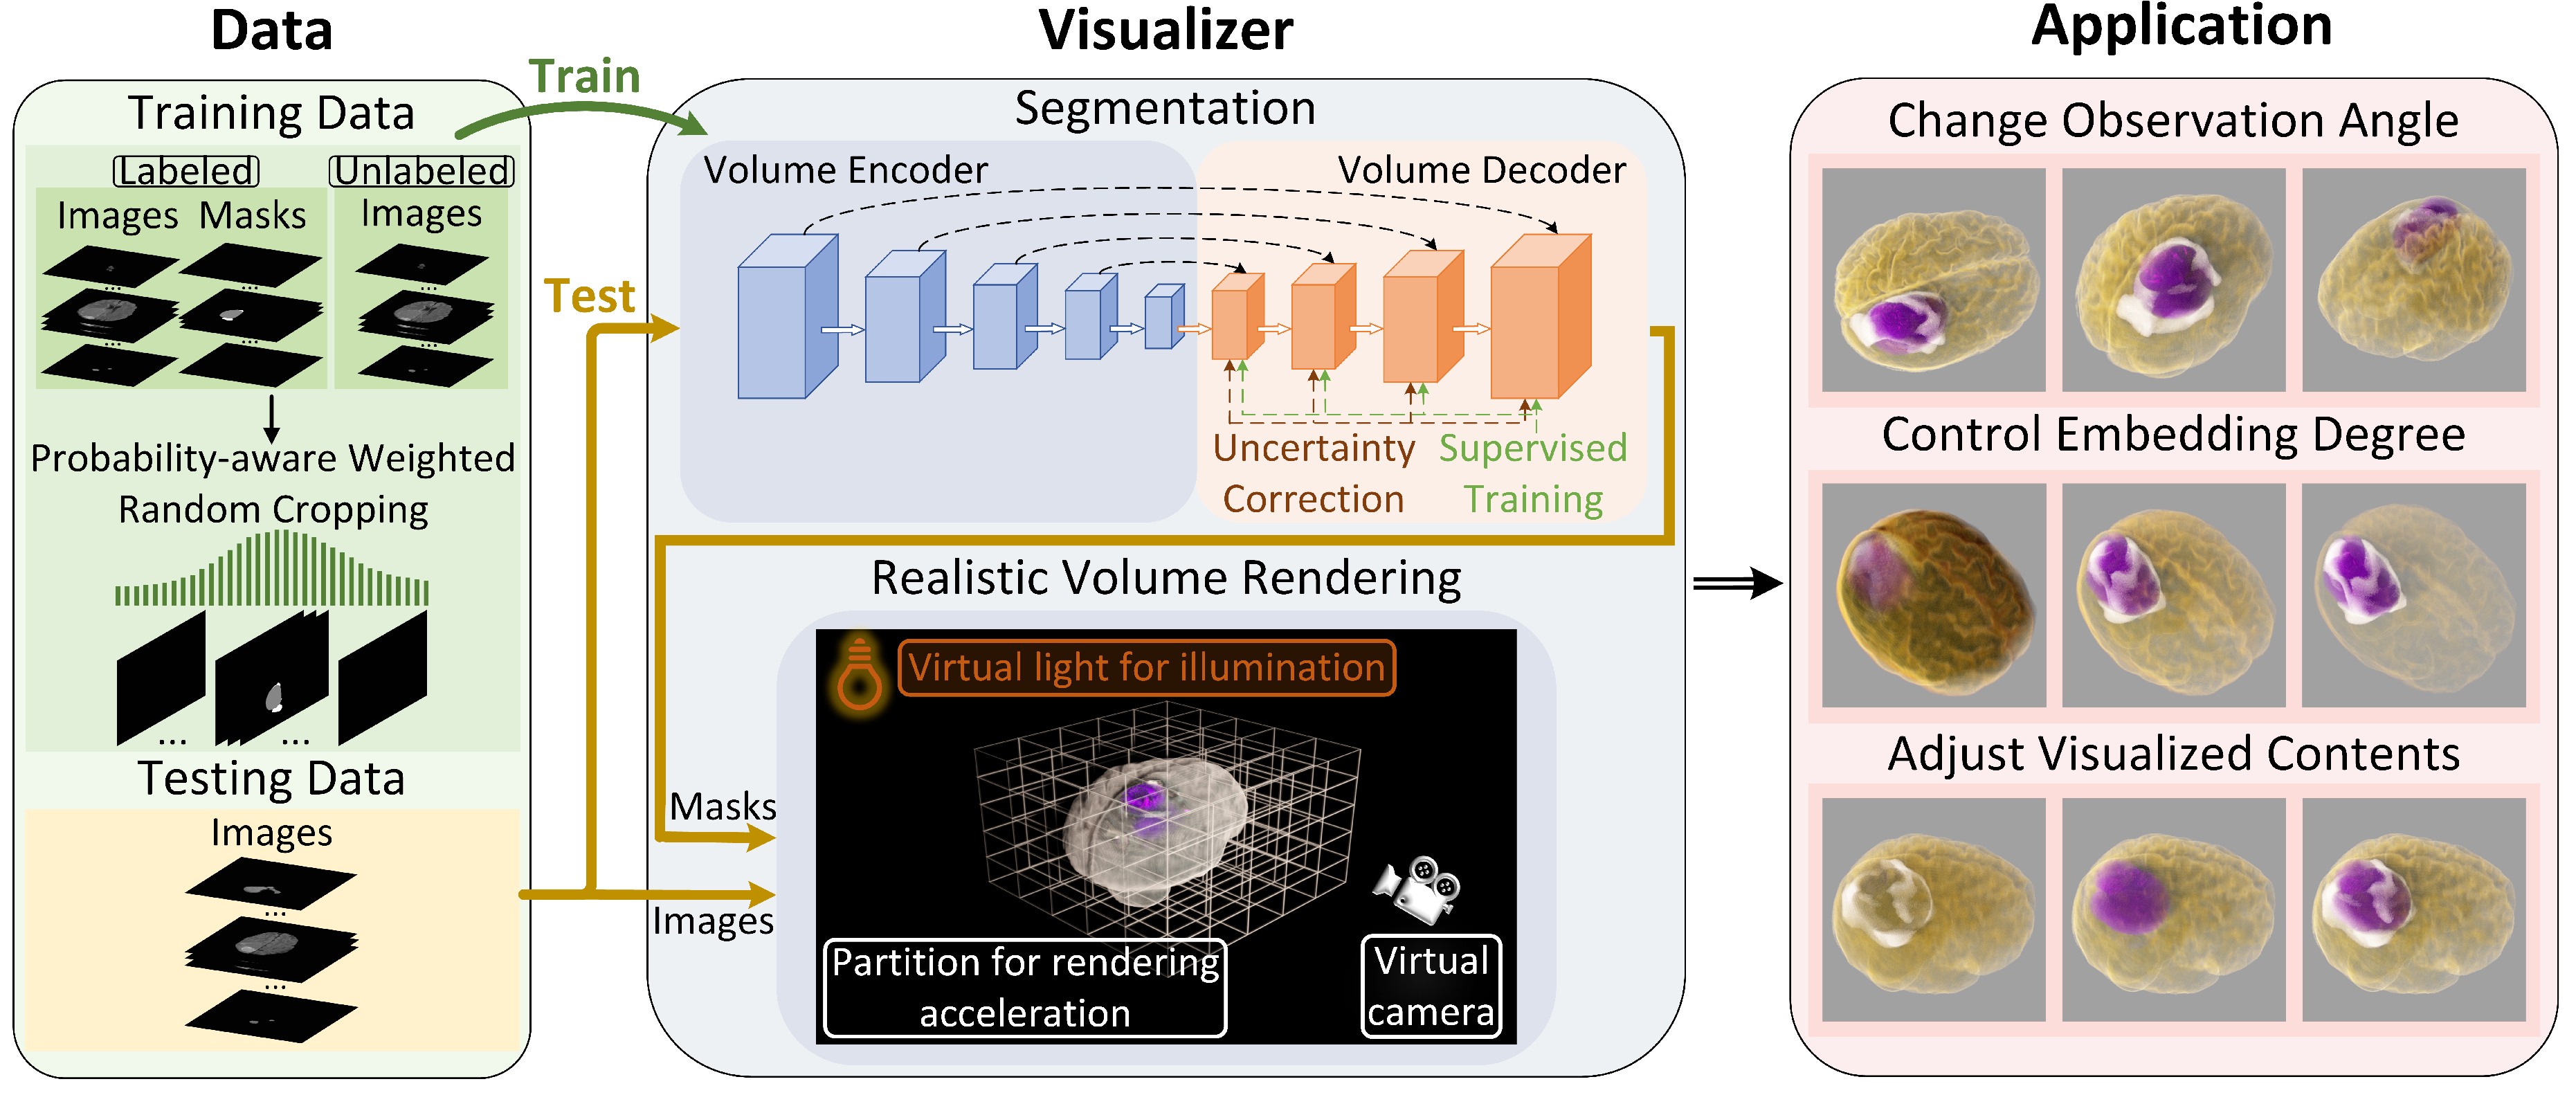
Figure 3.
Visualization of different network segmentation results. Compared to the baseline, our network shows superior performance for the segmentation of meningiomas and SNFH (colored in purple and white).
Figure 3.
Visualization of different network segmentation results. Compared to the baseline, our network shows superior performance for the segmentation of meningiomas and SNFH (colored in purple and white).
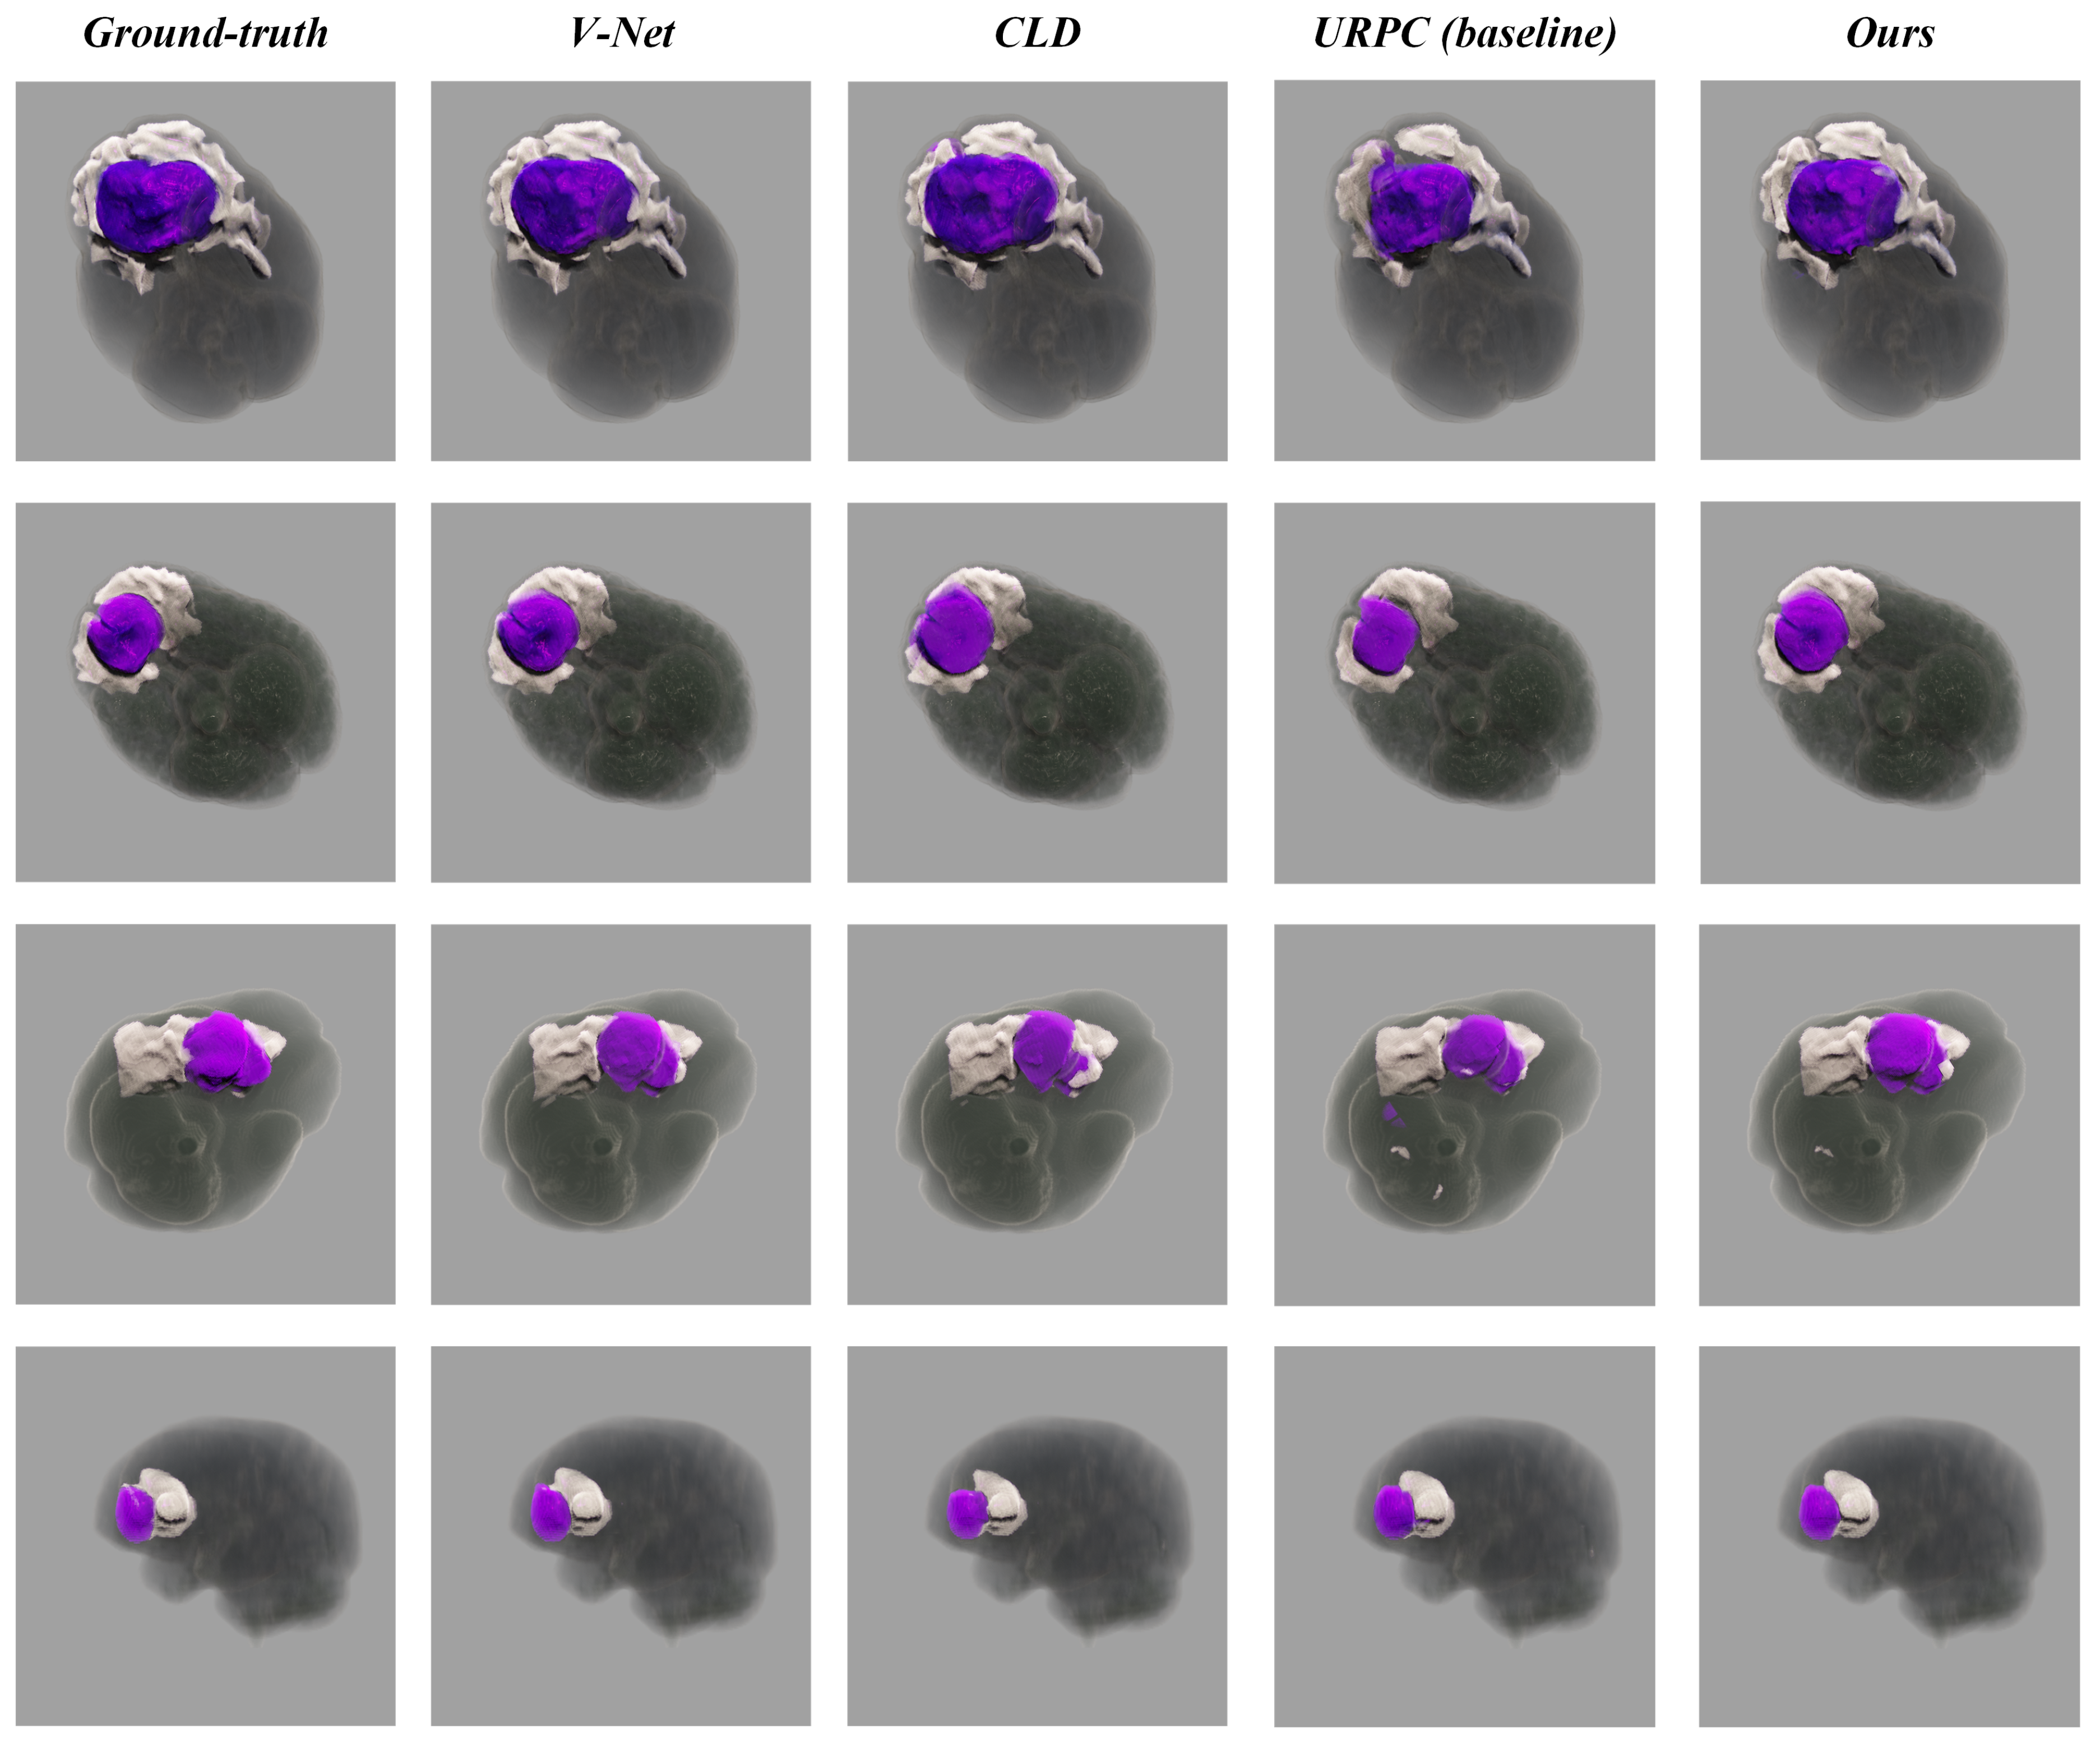
Figure 4.
The demonstration focuses on the role of the importance transfer function. No-X signifies that the importance transfer function does not affect X. It can be observed that importance functions play a critical role in rendered appearance.
Figure 4.
The demonstration focuses on the role of the importance transfer function. No-X signifies that the importance transfer function does not affect X. It can be observed that importance functions play a critical role in rendered appearance.
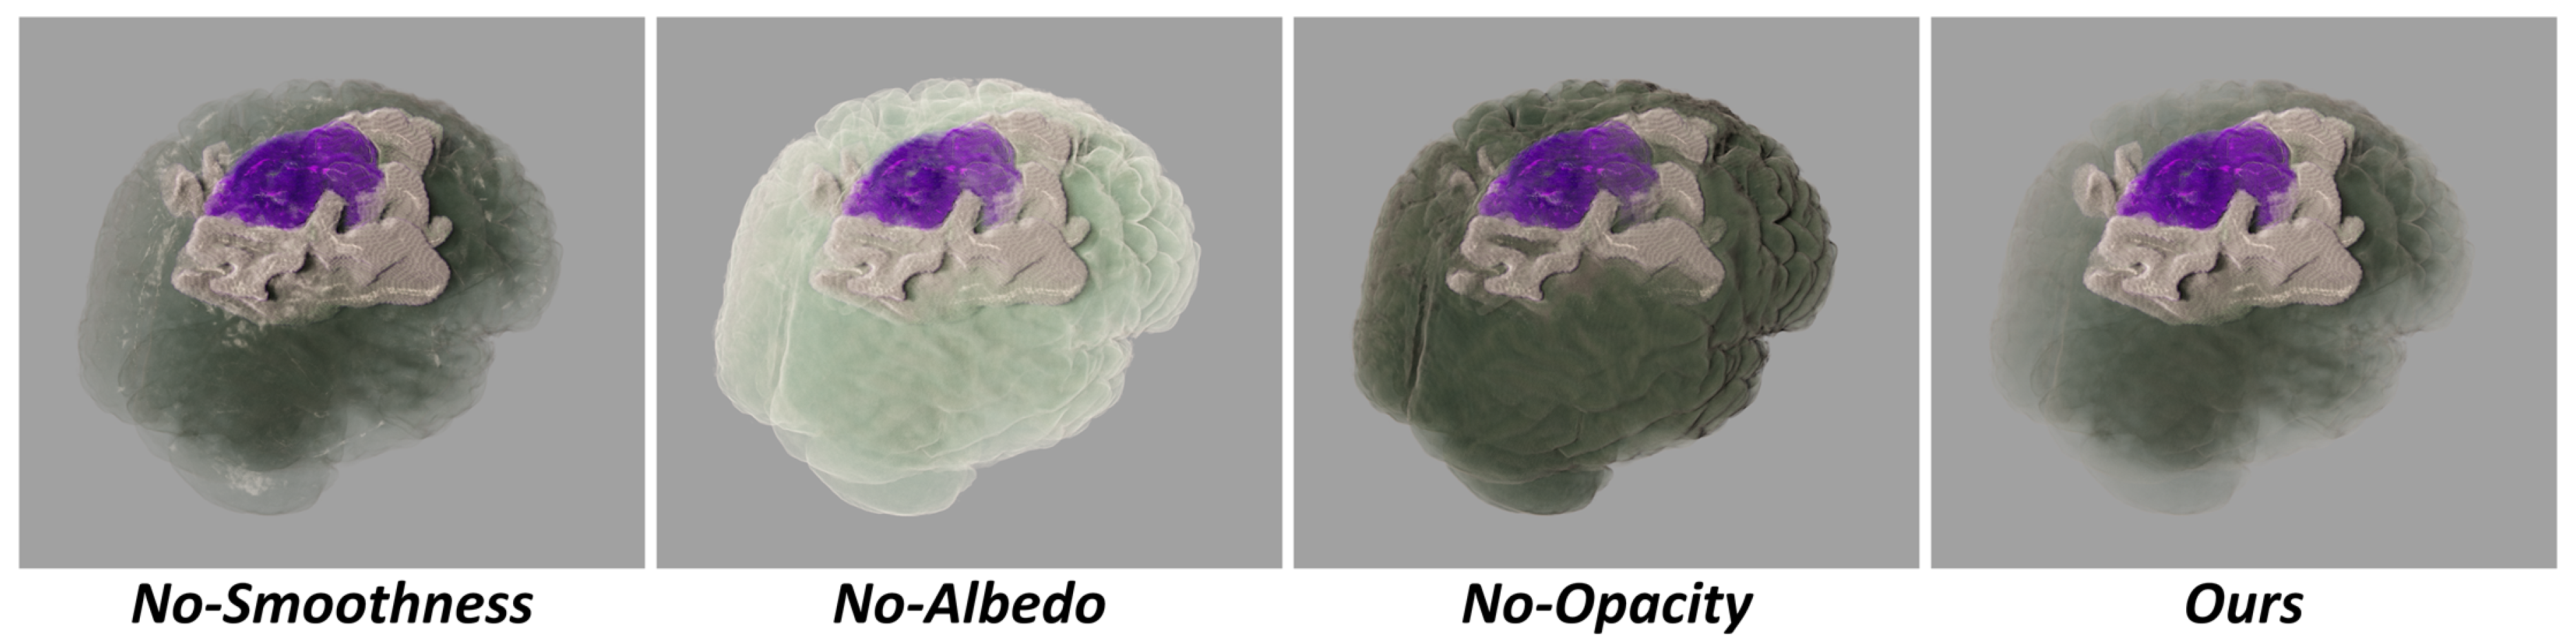
Figure 5.
Mesh refer to renderings of meshes extracted from masks, representing a commonly used approach for displaying 3D segmentation outcomes in academic literature [9]. RR refer to realistic rendering results of original medical data [10]. RC are the Ray-Casting results using original data and segmentation results [1].
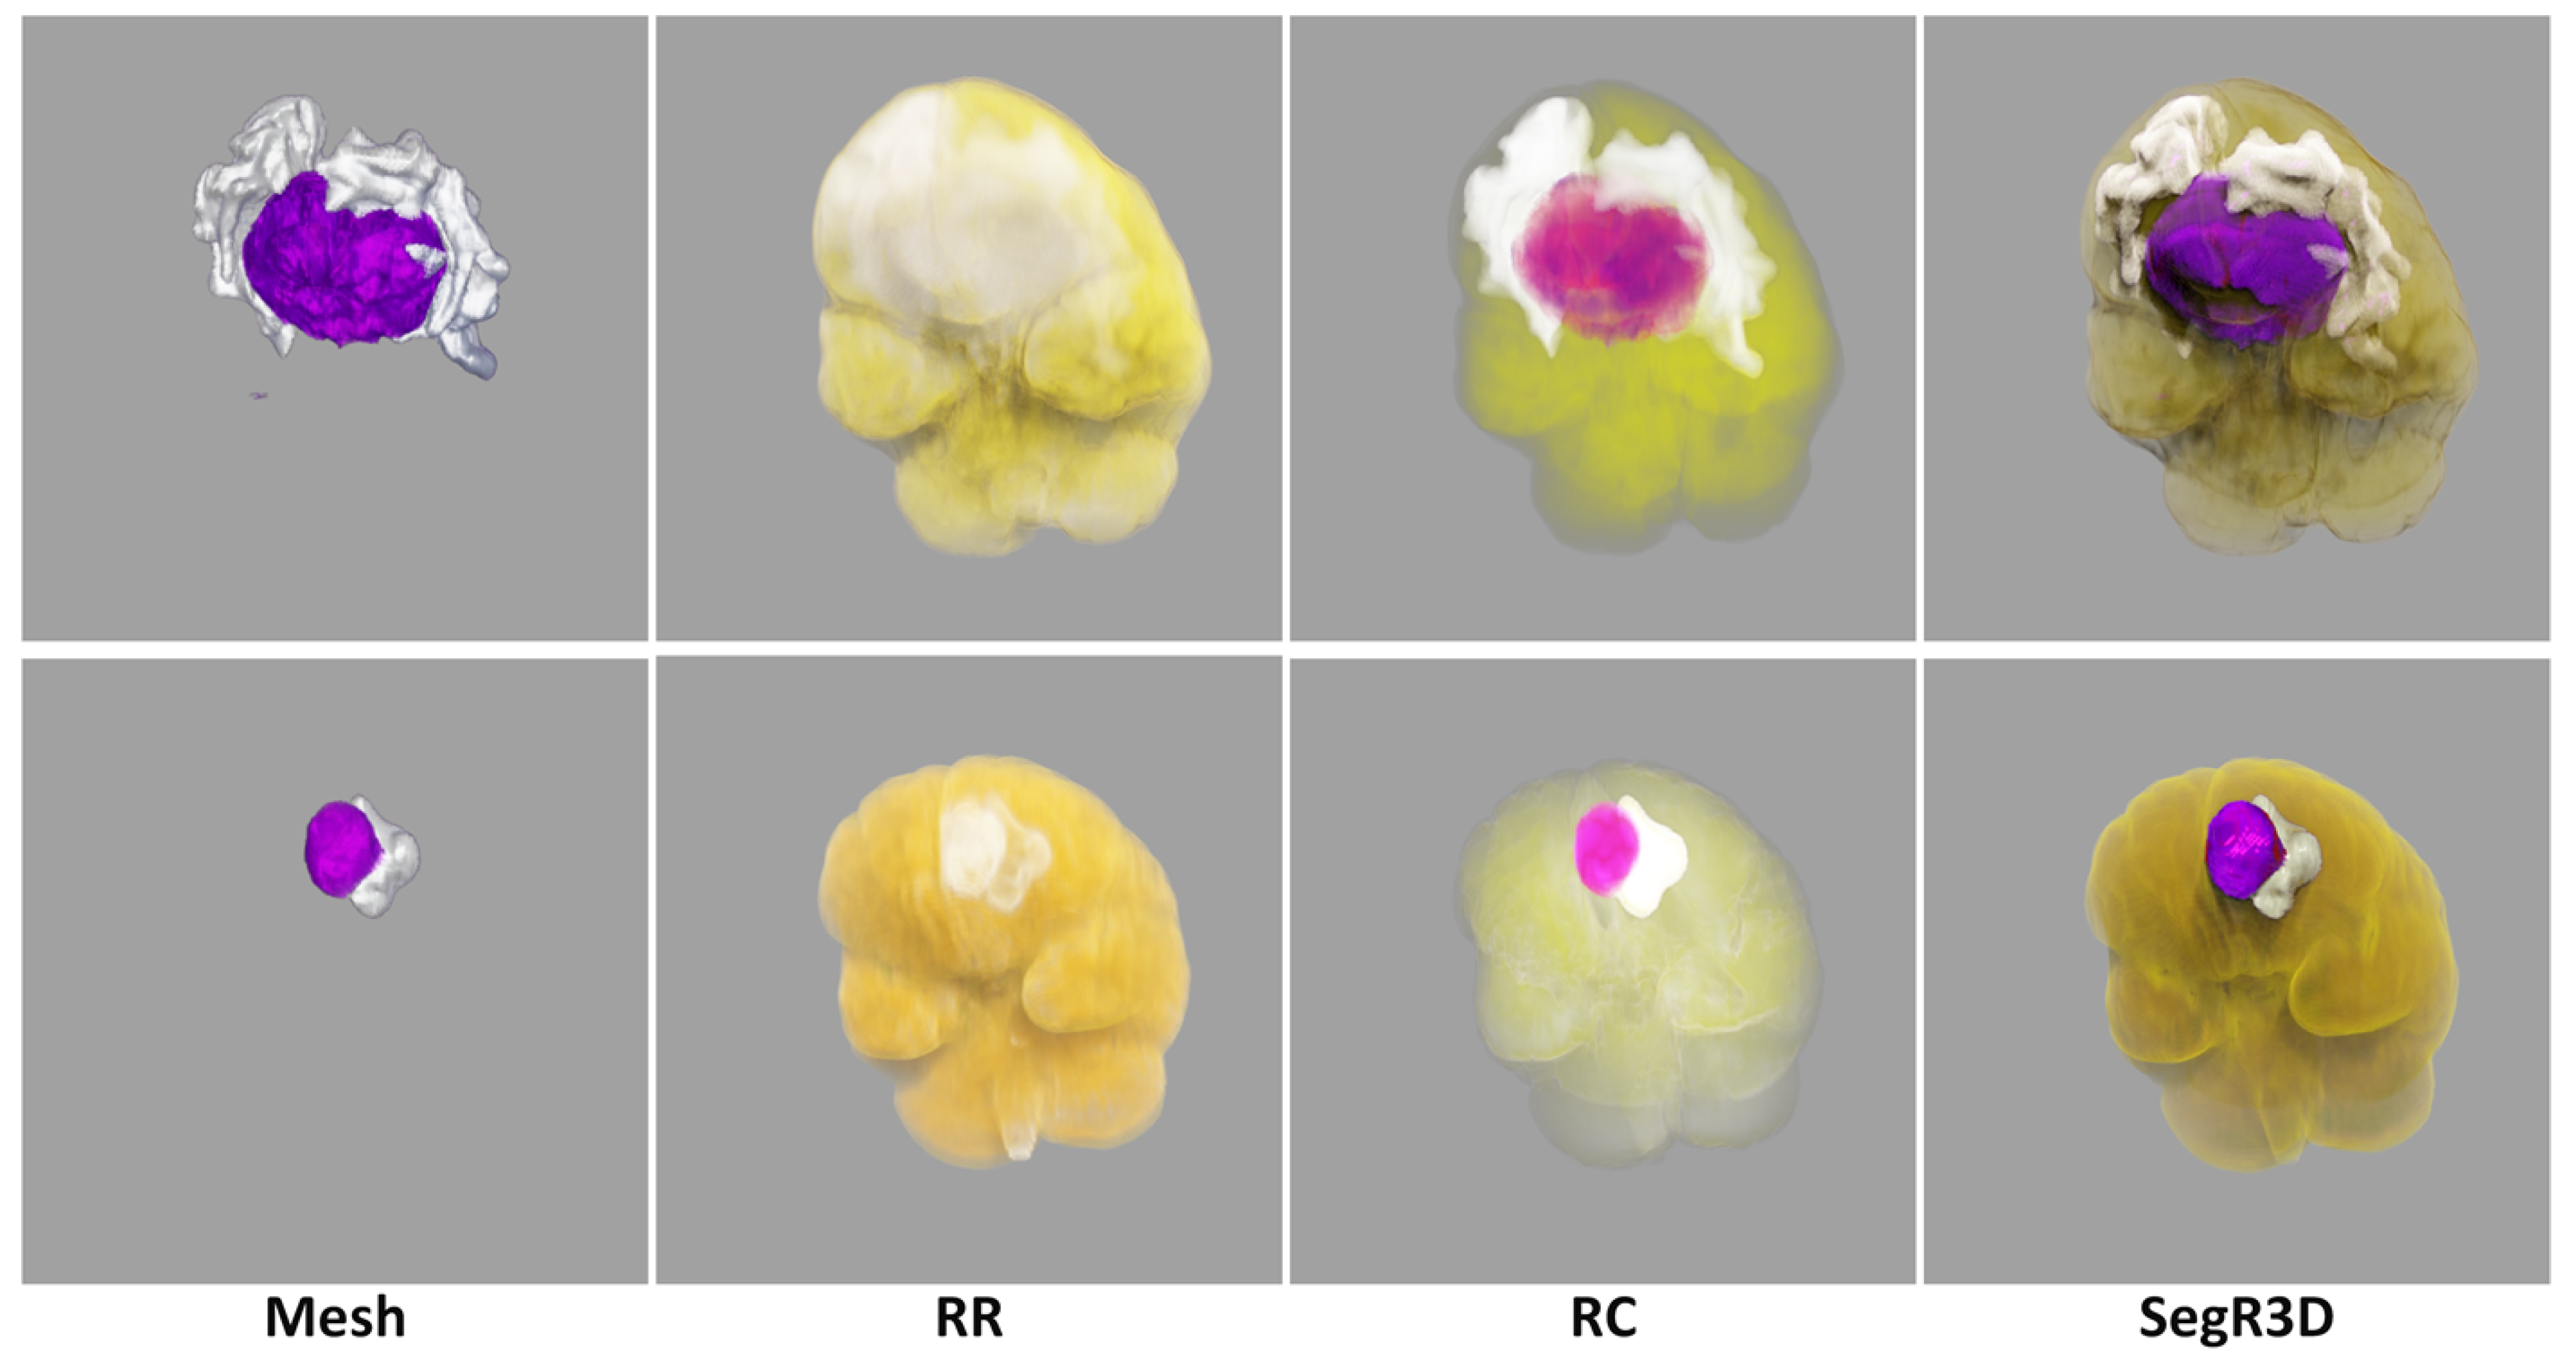
Figure 6.
Gantt chart for user experiment rating results.
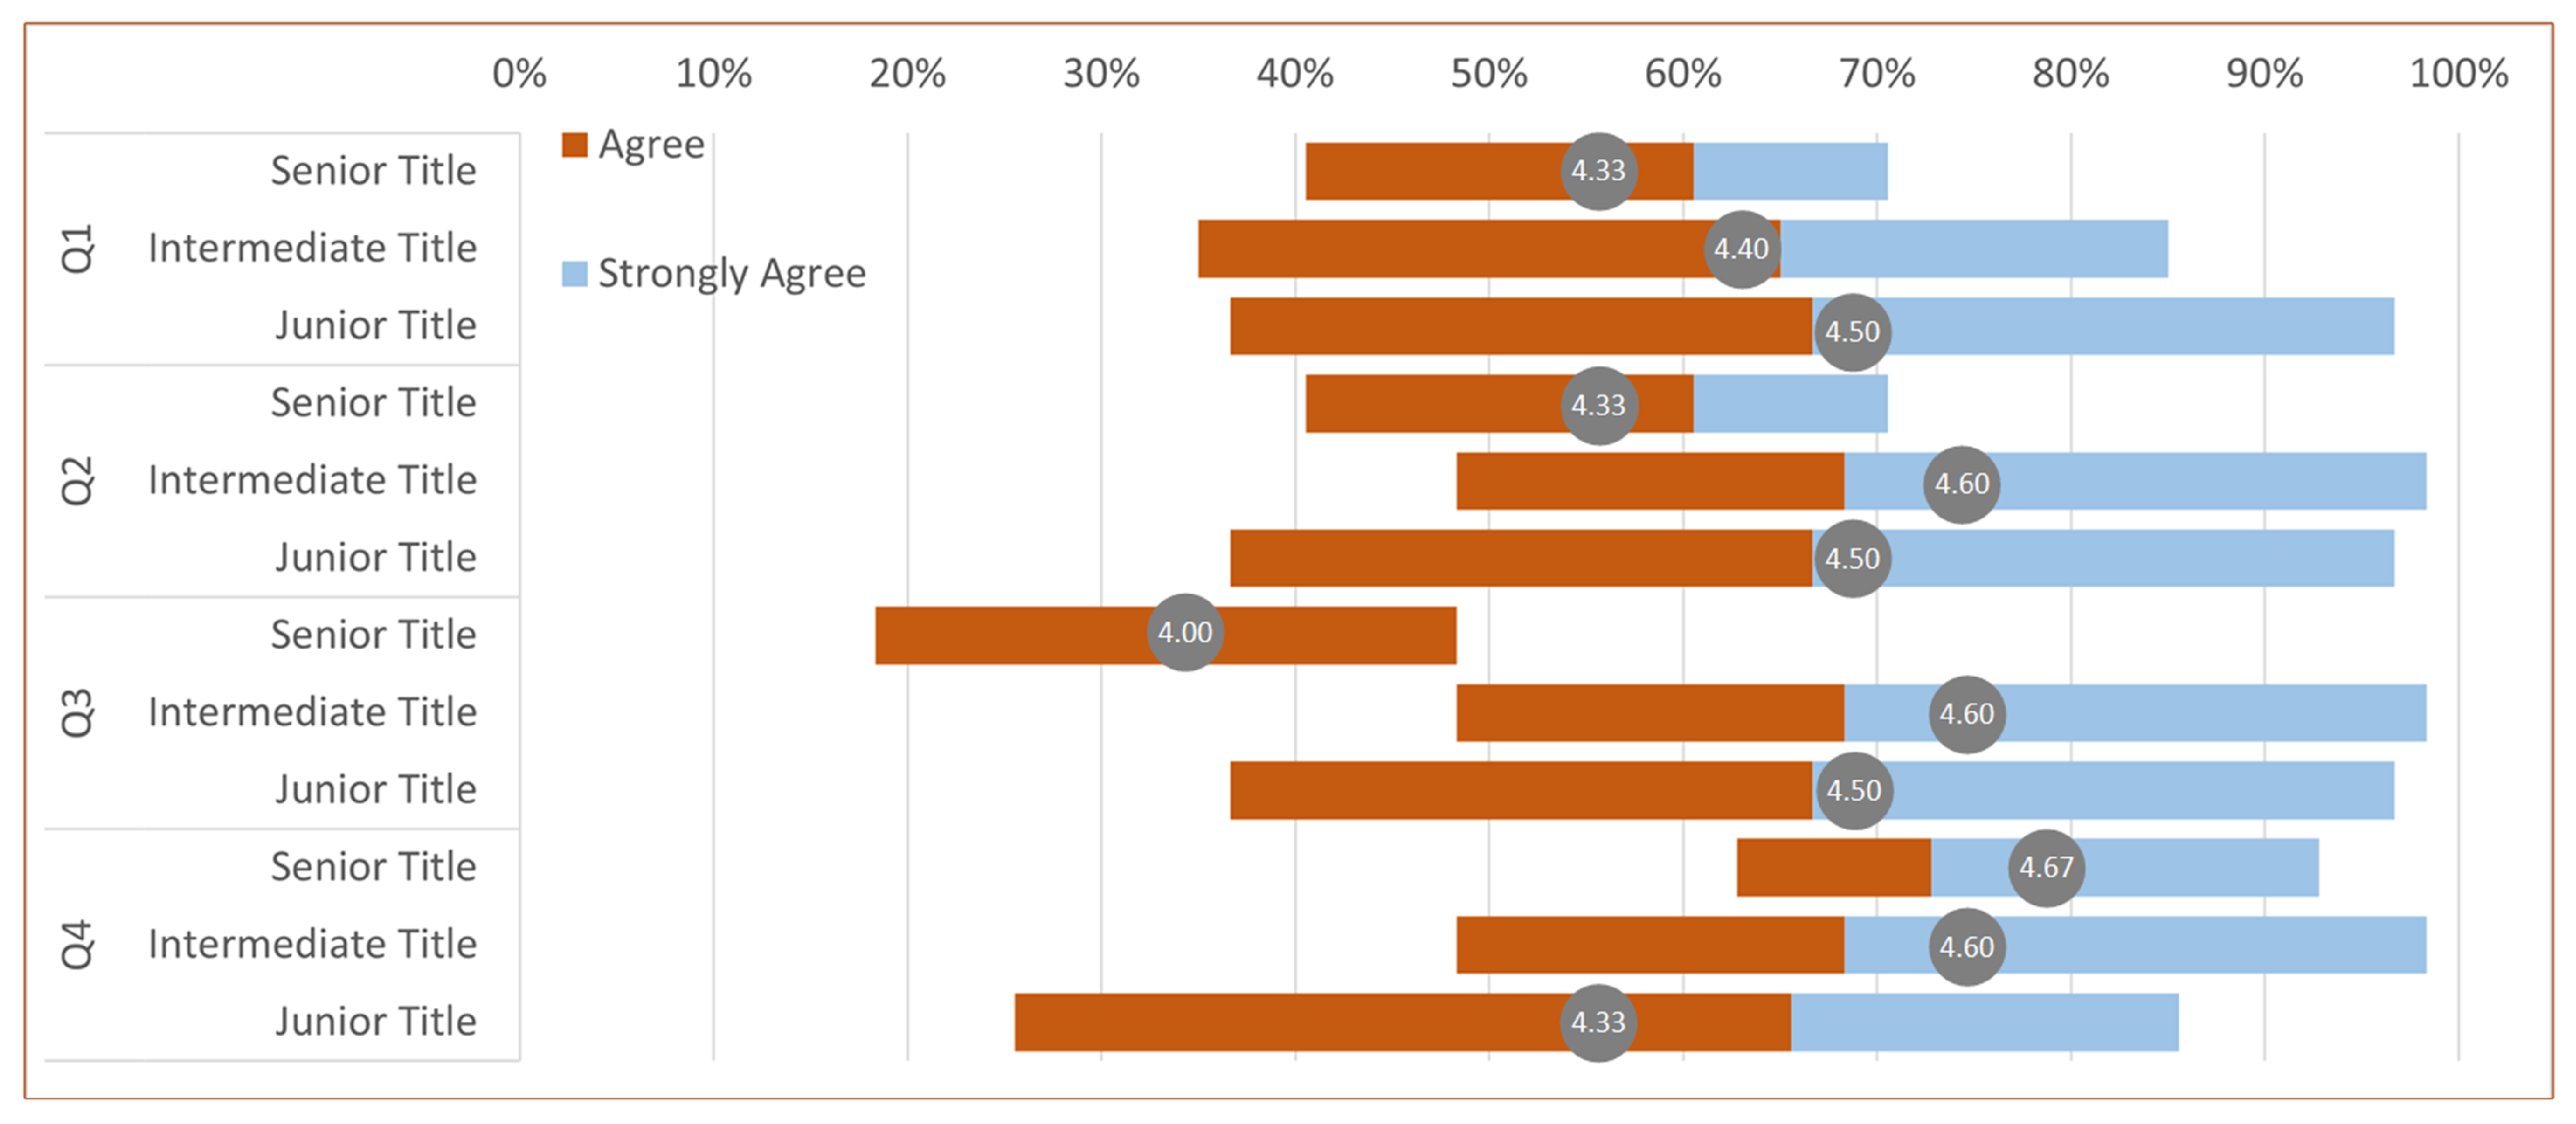

Table 1.
Patient Demographics of BraTS2023-MEN Dataset.
| Training Set | Validation Set | Testing Set | |
|---|---|---|---|
| Patient Count | 666 | 134 | 200 |
| Age (mean±SD) | 60.1 ± 14.9 | 60.8 ± 13.8 | 59.8 ± 13.6 |
| Gender | |||
| Male | 194 | 38 | 53 |
| Female | 464 | 94 | 147 |
| n/a1 | 8 | 2 | 0 |
1 n/a represents that the gender of the patient is not applicable.
Table 2.
Comparison between our method with previous methods (Labeled 20%). All experiments are conducted in an identical setting.
Table 2.
Comparison between our method with previous methods (Labeled 20%). All experiments are conducted in an identical setting.
| Method | Labeled | Meningiomas | SNFH | ||
|---|---|---|---|---|---|
| Dice(%) | HD95 | Dice(%) | HD95 | ||
| V-Net [22] | 100% | 80.0 | 9.2 | 83.0 | 9.7 |
| CLD [23] | 20% | 63.3 | 16.9 | 77.4 | 11.9 |
| URPC [9] | 20% | 70.4 | 14.0 | 79.1 | 11.1 |
| UCPPA | 20% | 72.9 | 12.8 | 80.0 | 10.8 |
* SNFH: the surrounding non-enhancing T2/FLAIR hyperintensity; HD95: 95% Hausdorff Distance.
Disclaimer/Publisher’s Note: The statements, opinions and data contained in all publications are solely those of the individual author(s) and contributor(s) and not of MDPI and/or the editor(s). MDPI and/or the editor(s) disclaim responsibility for any injury to people or property resulting from any ideas, methods, instructions or products referred to in the content. |
© 2025 by the authors. Licensee MDPI, Basel, Switzerland. This article is an open access article distributed under the terms and conditions of the Creative Commons Attribution (CC BY) license (http://creativecommons.org/licenses/by/4.0/).
Copyright: This open access article is published under a Creative Commons CC BY 4.0 license, which permit the free download, distribution, and reuse, provided that the author and preprint are cited in any reuse.


