Submitted:
05 June 2025
Posted:
06 June 2025
You are already at the latest version
Abstract
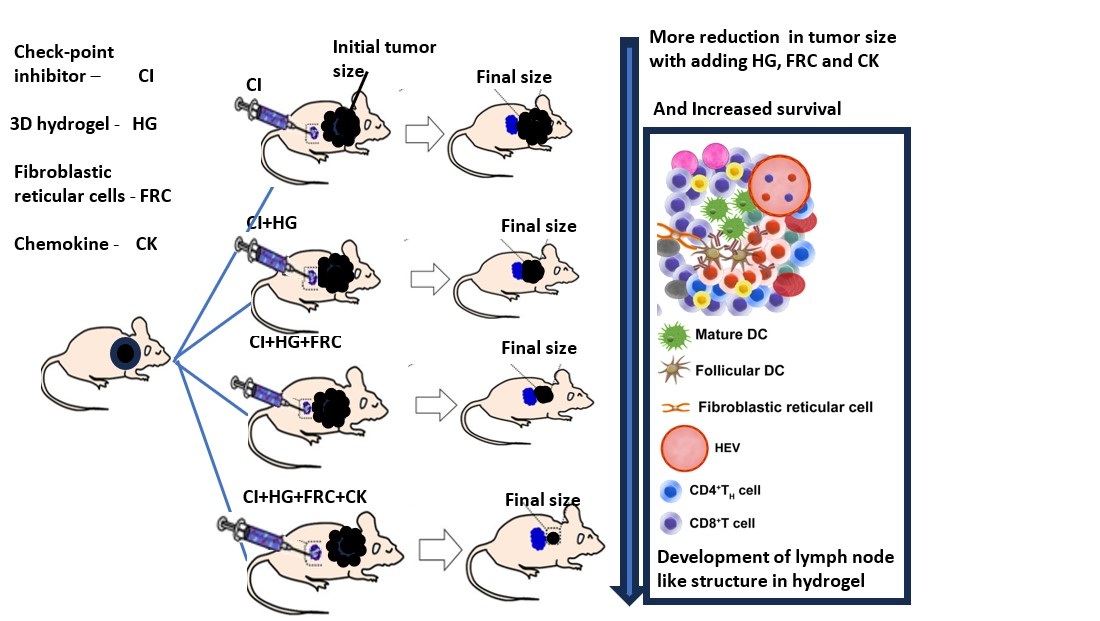
Background: This study explored the use of a 3D hydrogel, a tissue-engineering method designed to enhance stromal lymphoid cell therapy and boost the immune response of antibodies. Mouse models of two tumor types—B16F10 melanoma and MC-38 colorectal carcinoma—were used in two separate studies to assess the in vivo immune response to this approach.Methods: In the B16F10 melanoma study, 42 mice were randomized into six groups: Group 1, saline; Groups 2 &3, escalating doses of anti-cytotoxic T-lymphocyte-associated protein 4(anti-CTLA4 and anti-programmed death 1( anti-PD-1) antibodies; Group 4, combination of hydrogel, inhibitors, and fibroblastic reticular cells (FRCs); Group 5, 3D hydrogel, FRCs, and cytokines; Group 6, hydrogel, checkpoint inhibitors, FRCs, and cytokines.In the MC-38 colorectal carcinoma study, 100 mice were randomized into ten groups: Group 1, saline; Groups 2 to 4, escalating doses of anti-CTLA4 and anti-PD-1 antibodies; Groups 5 to 7, the same escalating doses combined with a 3D hydrogel; Groups 8 to 10, higher doses combined with a 3D hydrogel, along with the addition of FRCs.Results: Hydrogel capsules harvested five days post-injection revealed lymph node-like structures. Mice treated with FRCs and biologics in 3D hydrogel showed a remarkable increase in survival rate and complete response. Conclusion: The study highlights the potential of 3D hydrogels to improve immunotherapy. While promising survival outcomes were observed in animal models, further research is needed to confirm these findings in humans. The results support the approach’s clinical potential and lay the groundwork for future advancements in cancer treatment.
Keywords:
artificial lymph node
; tissue engineering
; biomaterials
; immune checkpoint inhibitors
; tumor oncology
; 3D human hydrogel
1. Introduction
Immunotherapy has gained popularity for treating a wide range of malignancies. While it has improved tumor control and survival in some patients, it presents challenges such as high costs and side effects. [1] To mitigate off-target effects, new delivery strategies are being investigated to enhance the precision of treatment on target lesions [2]. Improvements in site-targeted drug delivery could reduce the required dose and minimize immunotherapy-associated side effects.
Lymph nodes (LNs) play a central role in the immune system, especially in the context of immunotherapy for cancer treatment. While T cells, B cells, and other immune cells are generated in primary lymphoid organs like the thymus and bone marrow, secondary and tertiary lymphoid organs, including LNs, support their survival, facilitate interactions with other immune cells, and mediate adaptive immune responses, including cell activation and maintenance. [4] Thus, developing functional LN models could enhance the intensity and sustainability of the immune response, thereby improving the efficacy and safety of immunotherapies, especially biologics and cell therapies.[9] The 3D hydrogel would promote the immune response by facilitating the migration of dendritic cells from peripheral tissues, activating T and B cells, and guiding mature dendritic cells to regional LNs and lymphoid stromal networks.[10]
Novel injectable biomaterials and biocompatible scaffolds are being explored as drug delivery strategies to enhance tumor targeting and enable controlled, localized release of therapeutics at the tumor site. These effects can be further enhanced by modifying the physicochemical properties of the materials used.[3]
The development of biomaterials that mimic LNs has the potential to improve cancer vaccine potency, enhance immune checkpoint blockade or adoptive cell transfer, and serve as immune niches for cell programming and drug delivery. [5] cytotoxic T-lymphocyte-associated protein 4 and B7 receptor (CTLA-4/B7) and programmed cell death protein 1 and ligand 1 (PD-1/PD-L1) axes are the most prominent targeted checkpoint inhibitors. These inhibitors block negative regulatory signals, allowing T cells to become activated and attack tumor cells.[6] Many studies have emphasized the importance of tumor-draining LNs in the context of immune checkpoint blockade response.[7] Therefore, developing strategies to enhance the delivery of checkpoint antibodies while expanding LN like activity is a promising approach for cancer immune response treatment.
In this study, we report the development of a tissue-engineered 3D hydrogel that encapsulates biologics and stromal lymphoid cells to mimic LN-like functions. We test this approach in two cancer models: B16F10 melanoma and MC-38 colorectal carcinoma in mouse model. We further evaluate the effect of checkpoint blockade by encapsulating two widely studied checkpoint inhibitors—CTLA-4/B7 and PD-1/PD-L1 axes—within the 3D hydrogel artificial LNs. We compare the immunotherapy outcomes from encapsulated and unencapsulated treatments to assess efficacy.[6] The study examines the impact of drug dose, the 3D hydrogel, and stromal cells on the immune response.
2. Materials and Methods
Antibodies, chemokines, and other biologic were used from the following sources: Anti-CTLA (Bioxcell, Cat#BE0131), Anti PD1 (Bioxcell, Cat# BE0146), Human collagen (Humabiologics, Inc., HumaDerm-Human Skin Collagen Type I, Lyophilized 0.1 Kg), Lymphotoxin α1β2 (LTα1β2) (R&D systems, Cat# 9968-LYICF) reconstituted with 2.5 x 10⁻⁵ Phosphate-buffered saline (PBS) to obtain 1 mg/ml, Chemokine igand 20 (CCL20) (Peprotech, Cat# 250-27, 250 µg) reconstituted with 250 µl water to obtain 1mg/ml, and Chemokine ligand 13(CXCL13) (Peprotech, Cat# 250-24-250 µg) reconstituted with 250 µl water to obtain 1mg/mL. Additional materials included distilled Water (Gibco, Cat# 15230162), NaOH 0.1 and 1N (Fisher, Cat# 1310-73-2),10X PBS (Sigma, Cat# D1408), and 1X PBS (Gibco, Cat# 10010049). Fibroblastic reticular cells (FRC) were extracted from mice LNs and expanded to provide 800 million cells.
2.1. Culture of Primary FRCs for Both Studies
FRCs were isolated and purified as described previously. Harvested LNs from mice were digested in a solution containing DNase I (0.1 mg/mL), collagenase P (0.2 mg/mL, Roche Diagnostics), and dispase II (0.8 mg/mL, MilliporeSigma) in a water bath at 37°C for 15 minutes. This digestion process was repeated until the tissue was fully broken down into a single-cell suspension. The digested cells were then resuspended in complete Dulbecco’s Modified Eagle Medium (DMEM) with 10% Fetal bovine serum (FBS) (Lonza) and cultured in flasks following isolation by centrifugation. Only cells from passages 4 to 6 were used in the experiments. [34]
2.2. Animals
2.2.1. Implantation of C57BL/6 Mouse with B16F10 Melanoma Cells
Frozen B16F10 melanoma cells were thawed according to standard protocols and expanded in complete DMEM (high glucose) culture medium, supplemented with 10% fetal bovine serum (inactivated at 56°C), 2 mM glutamine, and 0.5% Penicillin/Streptomycin. The cells were cultured at 37°C in a 5% CO2 atmosphere. Additionally, B16F10 cells were also cultured in complete Roswell Park Memorial Institute (RPMI) 1640 medium (Lonza) as an alternative growth medium
Prior to inoculation, the B16F10 cells were harvested, washed with sterile Dulbecco’s phosphate-buffered saline (DPBS), and counted. The cells were then resuspended at a concentration of 20×10⁶ cells/mL, with the volume adjusted to ensure the desired injection parameters were met.
This study used 55 female C57BL/6 inbred mice, aged 8–10 weeks. On the day of inoculation, 200,000 B16F10 cells were suspended in 0.1 mL PBS and subcutaneously injected into the right flank of each mouse, ensuring consistent cell dose per injection. By Day 6, tumors had reached the target size of ~50 mm³, in 42 of the 55 inoculated mice. These 42 mice were subsequently assigned to treatment groups as outlined in Table 1. Blinding was not considered necessary due to objective endpoints. The treatments included:
- Control Group (G1): Subcutaneous saline injections for baseline comparison.
- Checkpoint Inhibitor Groups (G2 & G3): Mice received immune checkpoint inhibitors targeting PD-1 and CTLA-4, with Group 2 receiving a standard dose of 100 µg of each antibody, and Group 3 receiving an escalated dose of 300 µg of each antibody.
-
Hydrogel-Based Therapies (G4, G5, G6): 3D hydrogels containing various therapeutic components were administered subcutaneously to evaluate synergistic effects:
- o
- G4: Combination of checkpoint inhibitors (300 µg each) and 2 million FRCs.
- o
- G5: 2 million FRCs and 90 ng of cytokines/chemokines, without checkpoint inhibitors.
- o
- G6: All components—checkpoint inhibitors (300 µg each), 2 million FRCs, and 90 ng cytokines (anti-mouse CTLA-4, LTα1β2, CXCL13, and CCL20)—to test maximal immune response.
2.2.2. Implantation of C57BL/6 Mouse with MC-38 Colorectal Carcinoma Cancer in Mice
This study was conducted by Science in Action (SIA) in Israel and approved by the Israel Board for Animal Experiments in accordance with the Israel Animal Welfare Act and the Ethics Committee. Mice were inoculated with MC-38 colorectal carcinoma cells to establish the animal model for evaluating the efficacy of various treatments. Tumors with initial volumes between 50 and 80 mm³ were selected for inclusion at the start of the study. Animal handling followed the guidelines set by the National Institutes of Health (NIH) and the Accreditation of Laboratory Animal Care (AAALAC). Mice were housed in IVC cages within HVAC-monitored animal facilities with controlled temperature and humidity, and were provided an ad libitum diet.
On Day 0, female C57BL/6 mice aged 8 weeks were inoculated with 200,000 MC-38 cells via subcutaneous injection into the right flank. Following inoculation, the mice were randomly assigned to one of ten treatment groups, with initial tumor volumes ranging from 50 to 80 mm³. Treatments commenced seven days after randomization, and all treatments were administered via subcutaneous (SC) injection at three sites per mouse, as outlined in Table 2. The treatment groups were:
- Control Group (G1): Subcutaneous saline injections as a baseline comparison.
-
Checkpoint Inhibitor Groups (G2, G3 & G4): Immune checkpoint inhibitors targeting PD-1 and CTLA-4, with varying doses:
- o
- G2: 50 µg of each antibody (anti-CTLA4 and anti-PD-1) per site, totaling 150 µg per mouse.
- o
- G3: 100 µg of each antibody per site, totaling 300 µg per mouse.
- o
- G4: 150 µg of each antibody per site, totaling 450 µg per mouse.
-
Hydrogel and Checkpoint Inhibitor-Based Therapy Groups (G5, G6 & G7): Mice received 3D hydrogels combined with checkpoint inhibitors to evaluate synergistic effects:
- o
- G5: Hydrogel plus 50 µg of each antibody (anti-CTLA4 and anti-PD-1) per site, totaling 150 µg per mouse.
- o
- G6: Hydrogel plus 100 µg of each antibody per site, totaling 300 µg per mouse.
- o
- G7: Hydrogel plus 150 µg of each antibody per site, totaling 450 µg per mouse.
-
Hydrogel, Checkpoint Inhibitor, and FRC-Based Therapy Groups (G8, G9 & G10): These groups were treated with 3D hydrogels, immune checkpoint inhibitors, and 5 million FRCs per mouse:
- o
- G8: Hydrogel + 100 µg of each antibody per site (300 µg per mouse) + 5 million FRCs.
- o
- G9: Hydrogel + 150 µg of each antibody per site (450 µg per mouse) + 5 million FRCs.
- o
- G10: Hydrogel + 200 µg of each antibody per site (600 µg per mouse) + 5 million FRCs.
2.3. Immunofluorescence Staining
The harvested injected gel samples from two mice were embedded in the optimum cutting temperature (OCT) compound (Thermo Scientific) and frozen at -80°C. Serial cryostat sections (8-μm-thick) were prepared from frozen samples. The sections were fixed for 5 min in cold acetone, followed by blocking with 3% bovine serum albumin (BSA, 160069) solution. Sections were then incubated with primary antibodies overnight at 4oC. The primary antibodies included goat anti-mouse PDPN (R&D Systems, AF3244) and rat anti-mouse MECA79 (Novus Biologicals, NB100-77673; 1:200). The next day, samples were washed and fluoro-labeled with secondary antibodies- donkey anti-goat 594 IgG (Jackson ImmunoResearch, no. 705-587) and goat anti-rat 488 IgM (Jackson Immuno Research, no. 112-547-020, 1:200). Nuclei were stained with 4′,6-diamidino-2-phenylindole (DAPI) (VECTASHIELD, Vector Laboratories). Stained slides were imaged using a fluorescent microscope (EVOS M7000, Thermo Fisher Scientific).
2.4. Statistical Analysis
Parameters to assess the efficacy included average reduction in tumor weight, survival length, and percentage of cured mice. Average tumor volume was calculated as the mean tumor volume of all the surviving mice in a particular group on a specific study day. Percent survival was calculated as the proportion of surviving mice compared to the baseline for each group on a specific day. Percent cured was calculated as the percentage of mice with a tumor volume of 0 mm3 in each group on a specific study day. As this was an exploratory study, data analysis was done to find in any pattern or trend in the data. Data analysis was performed in MATLAB, and results are presented in tables and graphs, with each parameter plotted against the study day.
3. Results Summary
3.1. B16F10 Melanoma Cancer in Mice
Tumor growth in the control group progressed more rapidly than in any of the treatment groups in melanoma cancer model study (Figure 1). By day 16, all untreated mice were sacrificed due to tumor sizes reaching 2000 mg or more.
Up to day 14, the most effective treatments were antibodies alone (Groups 2 and 3) and a combination of antibodies and stromal cells in a 3D hydrogel (Group 6). However, Group 6 showed reduced inhibition compared to Groups 2 and 3, likely due to lower antibody release from the 3D hydrogel in contrast to the repeated dosing of antibodies alone. In a subsequent experiment the MC-38 colorectal cancer, adding a second dose of the 3D hydrogel containing antibodies and FRCs on day 14 corrected this decline in inhibition.
Groups treated with antibodies in the 3D hydrogel (Group 4) and those receiving chemokines and cytokines in the 3D hydrogel (Group 5) also demonstrated significant tumor growth inhibition compared to the control, though their inhibition levels were lower than those of the other groups (Figure 1a). A similar trend was seen in survival data (Figure 1b), with treated mice surviving up to day 28, while the control mice survived only until day 16.
3.2. MC-38 Colorectal Cancer in Mice
The tumor volume comparison across different groups is described below in section 3.2.1, and percent survival in section 3.2.2.
3.2.1. Tumor Volume
Tumor volumes and standard errors for each group are summarized in Table 3.
The tumor volume graphs (Figure 2) demonstrate that tumor weight was reduced across different doses, both individually and in combination with 3D hydrogel and FRCs. Graph 1 of Figure 2A highlights an anomaly in Group 4 between days 24 and 31, where a sharp decline in tumor volume on day 24 occurred due to only two surviving mice, with tumor volumes of 0 mm³ and 397 mm³. The remaining mice were euthanized as their tumors surpassed 1500 mm³, causing the tumor volume to rise to 1563 mm³ by day 31. One mouse that survived beyond this point was completely cured, maintaining a stable tumor volume of 0 mm³. Notably, only Group 4 had surviving and cured mice, but the varying number of mice in each group complicates the interpretation of tumor weight differences, indicating a dose-dependent response to the treatment.
Similarly, Figure 2B shows that for the same dose, the addition of the 3D hydrogel significantly enhanced tumor weight reduction, further improved by co-administering FRCs with the 3D hydrogel. Since the number of surviving mice changed over time, average tumor weight might be misleading, as it reflects only the surviving mice. Therefore, trends from the initial period, when all mice were alive, are more reliable. During the first 10 days, all groups had 10 surviving mice, making the trends observed during this period more representative of the treatment’s impact on average tumor weight. Figure 2A shows a reduction in tumor volume with increasing doses of biologics, a trend also observed in the 3D hydrogel groups (Graph 2 of Figure 2A) and the 3D hydrogel with FRCs groups (Graph 3 of Figure 2A). The addition of the 3D hydrogel and FRCs significantly improved outcomes, with higher doses leading to increased survival rates, as depicted in Figure 3A and 3B.
3.2.2. Percent Survival
Percent survival data for each group was used to create individual graphs for each treatment to evaluate the effects of different doses. Figure 3A and 3B show group survival relative to the PBS control, with Figure 3A detailing survival across various treatments involving anti-CTLA-4, 3D hydrogel, and anti-PD-1, while Figure 3B compares survival among specific groups. Both figures demonstrate increased survival from antibodies alone to combinations of antibodies with 3D hydrogel and FRCs, with outcomes influenced by dose escalation.
Figure 3B depicts the percentage of mice that survived over time after initial treatment, with some groups showing mice achieving a tumor weight of 0 mm³, indicating a complete treatment response. This led to estimating the percentage of tumor cures in treated groups, with Figure 4A showing that Groups 1, 2, and 3 (antibodies alone) increased survival, while Group 4 (higher dose) achieved approximately 10% cure (Figure 4B). Cures increased to about 35% for Groups 5, 6, and 7 (antibodies + 3D hydrogel) (Figure 4B), and the best survival and 50% tumor cure were observed for Groups 8, 9, and 10 (antibodies + 3D hydrogel + FRC) (Figure 3B).
In summary, the anti-tumor activity of the anti-CTLA-4 and anti-PD-1 groups significantly improved with higher dosages, supporting the notion that the optimal biologic dose maximizes the benefit-risk ratio. The addition of 3D hydrogel to anti-CTLA-4 and anti-PD-1 significantly enhanced all endpoints compared to increased dosing alone, suggesting that 3D hydrogel aids in controlled biologic release, resulting in a more sustainable immune response. The combination of 3D hydrogel, anti-CTLA-4, and FRCs exhibited the highest efficacy, surpassing higher doses alone, indicating that the 3D hydrogel with FRCs mimics LN functions, enhancing antitumor activity. Figure 4 illustrates cure percentages for each group, with the most effective treatment being Group 10, combining 600 µg of anti-CTLA-4 and anti-PD-1 antibodies with 3D hydrogel and 5 million FRCs.
3.3. Staining Study
Gel capsules harvested from treated mice were stained with various agents to examine the substructure associated with the 3D hydrogel capsules containing antibodies and stromal lymphoid cells. On days five and seven, the mice were sacrificed, and the developed gel capsules were collected and prepared for 8 to 10 microtome slices for H&E and immunofluorescence staining by Hooki Labs, MA.
Figure 5A, 5B, 5C, and 5D present detailed staining results, including Hematoxylin and Eosin (H&E) (5A), PDPN & DAPI (5B), CD3 (5C), and MECA79 (5D). The staining revealed the architecture, highlighting T cells, high endothelial venules (HEVs), and angiogenic vessels. HEVs play a crucial role in cancer treatment by serving as centers for activating antitumor B and T cells. In the HEV, dendritic cells present antigens to B and T cells, stimulating them for tumor elimination and initiating inflammatory responses. Further studies and quantification are necessary to understand these findings fully.
4. Discussion
In these studies using B16F10 melanoma and MC-38 colorectal carcinoma models, we aimed to enhance antitumor activity by incorporating FRCs and immune biologics into a 3D hydrogel scaffold. This biomimetic setup was designed to simulate LN functionality, supporting the recruitment, organization, and activation of immune cells directly at the tumor site. Prior research has demonstrated the capacity of hydrogels to localize and control the release of drugs, such as immune checkpoint inhibitors and other biologics, thereby amplifying antitumor effects. [22] Expanding on this concept, we incorporated FRCs and immune checkpoint inhibitors into the 3D hydrogel to create an environment that effectively recruits and organizes immune cells, closely mimicking LN functionality.
FRCs play a central role in supporting immune responses within the 3D hydrogel by facilitating several key functions that enhance immune cell recruitment and activation. First, FRCs contribute to the formation of high endothelial venules (HEVs), which are essential for trafficking lymphocytes to the tumor site. FRCs also provide structural support, maintaining a lymphoid-like environment within the 3D hydrogel scaffold, thereby mimicking the organization of a natural LN. They secrete key signaling molecules, such as Vascular Endothelial Growth Factor (VEGF), that guide endothelial cells to form HEVs and promote immune cell activation. Through the expression of adhesion molecules and structural support, FRCs ensure that immune cells are optimally organized and localized, significantly amplifying the antitumor response. [23]
These specialized structures (HEVs), which are supported by FRCs, play a crucial role in the trafficking of lymphocytes into the tumor microenvironment, facilitating an efficient immune response. HEVs are lined with sialomucin-expressing endothelial cells, and interact with lymphocytes via L-selectin, aiding in their recruitment and activation at the tumor site. [25] Surrounded by FRCs, HEVs establish an immune cell organization that bolsters the antitumor response. VEGF release by FRCs also supports HEV expansion, enhancing immune cell engagement within the 3D hydrogel scaffold. [25]
While the establishment of HEVs and lymphocyte organization within the 3D hydrogel scaffold demonstrates a substantial step forward, creating a complete LN like microenvironment remains challenging, particularly due to the difficulty in sustaining lymphoid stromal cell function outside the physiological context. However, stimulating stem cells with LTa1b2 and TNF alpha can mimic this environment, promoting the expression of adhesion molecules typical of LN stromal cells.[26] In one study, transplanting stromal cells in a biocompatible scaffold to the renal subcapsular space in mice successfully generated lymphoid organ-like structures, suggesting a potential strategy for developing functional immune environments in therapeutic scaffolds. [27,28,29]
In this enhanced immune environment, we administered a combination of anti-CTLA4 and anti-PD1 checkpoint inhibitors, known for increasing T-cell activation in advanced metastatic cancers[6]. In our studies, the combination showed synergistic, dose-dependent response and better outcomes with the higher dose. So, there is a need to find the optimum dose to balance the antitumor activity and the adverse effects. as underscored by previous studies, including the landmark CheckMate 067 trial.[15] The controlled, sustained release of these biologics through the 3D hydrogel’s nanoscale pore structure maintained therapeutic concentrations at the tumor site, amplifying the antitumor response. Ultimately, this structured approach not only optimized immune checkpoint therapy but also supported immune cell recruitment and antitumor activity with the help of FRCs.
The study demonstrates a significant enhancement in antitumor activity through the use of a 3D hydrogel loaded with biologics and stromal lymphoid cells, effectively acting as an artificial LN. This setup facilitated antigen presentation, lymphocyte homing, and immune cell activation, resulting in reduced tumor weight and improved survival. In the MC-38 colorectal model, we observed high cure rates in mice treated with both drug and FRCs, emphasizing the 3D hydrogel’s capacity for encapsulating drugs and cells and delivering biologics with augmented response and improved outcomes. Both melanoma and colorectal cancer models validated the pivotal role of FRCs in antitumor responses.
Our findings underscore the potential of drug delivery strategies that incorporate artificial LN like structures, with applications beyond direct cancer therapy. This approach also holds promise in cancer vaccines, which mimic immune activation seen in pathogen-associated responses. By coordinating tumor antigen presentation within a macro-scale hydrogel, we can engineer immune outcomes to support anticancer therapies. The 3D hydrogel encapsulates stromal cells derived from LNs, fostering the formation of a lymphoid stromal network that mimics LN interactions. This structured network promotes the accumulation and priming of dendritic cells, as well as T and B cell responses, contributing to the enhanced antitumor effects observed.
5. Conclusion
In these studies using animal models of melanoma (B16F10) and colorectal carcinoma (MC-38), we assessed the impact of a tissue-engineered 3D hydrogel formulation containing checkpoint inhibitors and stromal lymphoid cells (FRCs). The results demonstrated a significant improvement in survival and tumor cure rates, highlighting the enhanced immune activation facilitated by the hydrogel. This strategy supports the recruitment of T and B cells, mimicking lymph node (LN)-like functionality at the tumor site, and enhancing the overall antitumor immune response.
The biologics used in this study, including T cell-activating checkpoint inhibitors and FRCs, effectively promoted immune cell recruitment and organization, which is crucial for improving antitumor immunity. The 3D hydrogel acted as a controlled delivery system, sustaining the release of biologics at the tumor site and amplifying their therapeutic effects. The incorporation of FRCs further enhanced this immune environment by promoting the formation of structures similar to LNs, which are essential for immune cell activation and tumor response.
These findings demonstrate the potential of tissue-engineered 3D hydrogels to enhance immunotherapy outcomes, particularly in cancer treatments that rely on immune checkpoint inhibition. Though the study reveals significantly positive trend in the survival outcome, more studies are needed to validate the results. There are some limitations in extrapolating the results of these animal models to humans due to species differences still the success observed in these animal models supports the potential translation of this approach into clinical applications, with broader implications for improving cancer therapies and optimizing immune responses. The results provide a foundation for future research aimed at refining this strategy for better efficacy in treating advanced and metastatic cancers.
Table of Contents
This study investigates a 3D hydrogel-based tissue-engineering approach to enhance stromal lymphoid cell therapy and boost immune responses in mouse models of B16F10 melanoma and MC-38 colorectal carcinoma. Mice are assigned to various groups receiving combinations of checkpoint inhibitors, FRCs, cytokines, and 3D hydrogel. Results show increased survival and tumor cures, with 3D hydrogel capsules forming lymph node-like structures five days post-injection.
Figure 6.
Drugs and Cells Loaded Tissue Engendered 3D Human Hydrogel Formulations, a Promise for Cancer Vaccines and Treatment.
Figure 6.
Drugs and Cells Loaded Tissue Engendered 3D Human Hydrogel Formulations, a Promise for Cancer Vaccines and Treatment.
Author Contributions
Conceptualization, David R. Elmaleh, Ph.D.; Methodology, Salomon Stemmer, MD,; Software, Fotini Kioutsouki ; Validation, Salomon Stemmer, MD.; Formal Analysis, Fotini Kioutsouki,.; Investigation, Aram Akbarzadeh, PhD; Resources, David R. Elmaleh; Data Curation, Atul Gupta, MD.; Writing – Atul Gupta, MD.; Writing – Review & Editing, Atul Gupta, MD.; Visualization, Atul Gupta, MD.; Supervision, David R. Elmaleh, Ph.D; Project Administration, Salomon Stemmer, MD. And Aram Akbarzadeh; Funding Acquisition, David R. Elmaleh, Ph.D.”
Funding
This research received no external funding and The APC was funded by Phenonet Inc in this section.
Ethical Considerations
Cephrim Biosciences; Melanoma study Woubrn, MA USA. All animal handling procedures were performed in compliance with the guidelines and protocols approved by the Institutional Animal Care and Use Committee (IACUC), the National Institutes of Health (NIH) and the Accreditation of Laboratory Animal Care (AAALAC). Mice were housed in IVC cages within HVAC-monitored animal facilities with controlled temperature and humidity, and were provided an ad libitum diet. Science in Action, Colorectal study, Ness Ziona Israel . Science in Action is accredited for OECD principles of Good Laboratory Practice ENV/MC/CHEM (98)17 for toxicity studies; however, this study was not intended for claiming GLP compliance and did not follow the complete GLP regulations. Thus, this study is considered a non-GLP study. The study followed the study protocol and the Science in Action SOPs.
Data Availability Statement
All data and materials are available for appropriate reviewers at CellsRegen, Inc. data room.
Acknowledgments
We thank all members of the scientific consultants for helpful discussions. This work was supported in part/entirely by private donations and research grants awarded to Author contributions.
Conflicts of Interest
Dr. Elmaleh is the founder, chairman, and chief scientific officer of CellsRegen, the company that sponsored melanoma and colorectal studies. CellsRegen employed Aram and Khanh during these studies. Dr. Salomon acted as a consultant for CellsRegen and received compensation for his services during the study. Dr. Atul also served as a consultant to CellsRegen for the authorship of the manuscript and was compensated accordingly. “The sponsors had no role in the design, execution, interpretation, or writing of the study”.
References
- Kichloo, A.; Albosta, M.; Dahiya, D. S.; Guidi, J. C.; Aljadah, M.; Singh, J. P.; Shaka, H.; Wani, F.; Kumar, A.; Lekkala, M. R. Systemic Adverse Effects and Toxicities Associated with Immunotherapy: A Review. World journal of clinical oncology 2021, 12(3), 150–163. [Google Scholar] [CrossRef] [PubMed]
- Zhao, Z.; Zheng, L.; Chen, W.; Weng, W.; Song, J.; Ji, J. Delivery Strategies of Cancer Immunotherapy: Recent Advances and Future Perspectives. Journal of Hematology & Oncology 2019, 12 (1), 126. [CrossRef]
- Cunningham, N.; Lapointe, R.; Lerouge, S. Biomaterials for Enhanced Immunotherapy. APL bioengineering 2022, 6. [Google Scholar] [CrossRef] [PubMed]
- Liao, S.; Von Der Weid, P.-Y. Lymphatic System: An Active Pathway for Immune Protection. Seminars in Cell & Developmental Biology 2015, 38, 83–89. [Google Scholar] [CrossRef]
- Yang, F.; Shi, K.; Jia, Y.; Hao, Y.; Peng, J.; Qian, Z. Advanced Biomaterials for Cancer Immunotherapy. Acta Pharmacologica Sinica 2020, 41(7), 911–927. [Google Scholar] [CrossRef]
- Seidel, J. A.; Otsuka, A.; Kabashima, K.; Kabashima, K. Anti-PD-1 and Anti-CTLA-4 Therapies in Cancer: Mechanisms of Action, Efficacy, and Limitations. Frontiers in Oncology 2018, 8, 86. [Google Scholar] [CrossRef]
- Delclaux, I.; Ventre, K. S.; Jones, D.; Lund, A. W. The Tumor-Draining Lymph Node as a Reservoir for Systemic Immune Surveillance. Trends in cancer 10 (1), 28–37. [CrossRef]
- Notarbartolo, S.; Abrignani, S. Human T Lymphocytes at Tumor Sites. Seminars in Immunopathology 2022, 44(6), 883–901. [Google Scholar] [CrossRef] [PubMed]
- Nosenko, M. A.; Drutskaya, M. S.; Moisenovich, M. M.; Nedospasov, S. A. Bioengineering of Artificial Lymphoid Organs. Acta Naturae 2016, 8(2), 10–23. [Google Scholar] [CrossRef]
- Najibi, A. J.; Mooney, D. J.; Mooney, D. J. Cell and Tissue Engineering in Lymph Nodes for Cancer Immunotherapy. Advanced Drug Delivery Reviews 2020, 42–62. [Google Scholar] [CrossRef]
- Sznol, M.; Melero, I. Revisiting Anti-CTLA-4 Antibodies in Combination with PD-1 Blockade for Cancer Immunotherapy. Annals of Oncology 2021, 32(3), 295–297. [Google Scholar] [CrossRef]
- Savoia, P.; Astrua, C.; Fava, P. Ipilimumab (Anti-Ctla-4 Mab) in the Treatment of Metastatic Melanoma: Effectiveness and Toxicity Management. Human Vaccines & Immunotherapeutics 2016, 12 (5), 1092–1101. [CrossRef]
- FDA fast tracks nivolumab for advanced non-squamous non-small cell lung cancer. pharmaceutical-journal.com. https://pharmaceutical-journal.com/article/news/fda-fast-tracks-nivolumab-for-advanced-non-squamous-non-small-cell-lung-cancer.
- FDA Approval Summary: Pembrolizumab for Treatment of Metastatic Non-Small Cell Lung Cancer: First-Line Therapy and Beyond. Oncologist 2017, 22(11), 1392–1399. [CrossRef]
- Chae, Y. K.; Arya, A.; Iams, W. T.; Rocha Cruz, M.; Chandra, S.; Choi, J.; Giles, F. J. Current Landscape and Future of Dual Anti-CTLA4 and PD-1/PD-L1 Blockade Immunotherapy in Cancer; Lessons Learned from Clinical Trials with Melanoma and Non-Small Cell Lung Cancer (NSCLC). Journal for ImmunoTherapy of Cancer 2018, 6(1), 39. [Google Scholar] [CrossRef] [PubMed]
- Callahan, M. K.; Kluger, H. M.; Postow, M. A.; Segal, N. H.; Lesokhin, A. M.; Atkins, M. B.; Kirkwood, J. M.; Krishnan, S.; Bhore, R.; Horak, C.; Wolchok, J. D.; Sznol, M. Nivolumab Plus Ipilimumab in Patients With Advanced Melanoma: Updated Survival, Response, and Safety Data in a Phase I Dose-Escalation Study. Journal of Clinical Oncology 2017, 36(4), 391–398. [Google Scholar] [CrossRef] [PubMed]
- Lebbé, C.; Meyer, N.; Mortier, L.; Marquez-Rodas, I.; Robert, C.; Rutkowski, P.; Menzies, A. M.; Eigentler, T.; Ascierto, P. A.; Smylie, M.; Schadendorf, D.; Ajaz, M.; Svane, I. M.; Gonzalez, R.; Rollin, L.; Lord-Bessen, J.; Saci, A.; Grigoryeva, E.; Pigozzo, J. Evaluation of Two Dosing Regimens for Nivolumab in Combination With Ipilimumab in Patients With Advanced Melanoma: Results From the Phase IIIb/IV CheckMate 511 Trial. Journal of Clinical Oncology 2019, 37(11), 867–875. [Google Scholar] [CrossRef] [PubMed]
- Five-Year Survival Outcomes with Nivolumab (NIVO) plus Ipilimumab (IPI) versus Chemotherapy (Chemo) as First-Line (1L) Treatment for Metastatic Non–Small Cell Lung Cancer (NSCLC): Results from CheckMate 227. Journal of Clinical Oncology 2022, 40 (17_suppl), LBA9025. [CrossRef]
- Kim, D.; Cha, B.-H.; Ahn, J.; Arai, Y.; Choi, B.; Lee, S.-H. Physicochemical Properties in 3D Hydrogel Modulate Cellular Reprogramming into Induced Pluripotent Stem Cells. Advanced Functional Materials 2021, 31(7), 2007041. [Google Scholar] [CrossRef]
- Lavrentev, F.V.; Shilovskikh, V.V.; Alabusheva, V.S.; Yurova, V.Y.; Nikitina, A.A.; Ulasevich, S.A.; Skorb, E.V. Diffusion-Limited Processes in Hydrogels with Chosen Applications from Drug Delivery to Electronic Components. Molecules 2023, 28, 5931. [Google Scholar] [CrossRef]
- C. Wu, L. Z. Teng, C. Wang, T. Qian, Z. Hu, Z. Zeng, Gels. 2023, 9, 116.
- Najibi, A. J.; Mooney, D. J.; Mooney, D. J. Cell and Tissue Engineering in Lymph Nodes for Cancer Immunotherapy. Advanced Drug Delivery Reviews 2020, 42–62. [Google Scholar] [CrossRef]
- Perez-Shibayama, C.; Gil-Cruz, C.; Ludewig, B. Fibroblastic Reticular Cells at the Nexus of Innate and Adaptive Immune Responses. Immunological Reviews 2019, 289(1), 31–41. [Google Scholar] [CrossRef] [PubMed]
- Vella, G.; Guelfi, S.; Bergers, G.; Bergers, G. High Endothelial Venules: A Vascular Perspective on Tertiary Lymphoid Structures in Cancer. Frontiers in Immunology 2021, 12, 736670. [Google Scholar] [CrossRef]
- Milutinovic, S.; Abe, J.; Godkin, A. J.; Stein, J. V.; Gallimore, A. The Dual Role of High Endothelial Venules in Cancer Progression versus Immunity. Trends in cancer 2021, 7(3), 214–225. [Google Scholar] [CrossRef]
- Lu, T. T.; Lu, T. T.; Browning, J. L. Role of the Lymphotoxin/LIGHT System in the Development and Maintenance of Reticular Networks and Vasculature in Lymphoid Tissues. Frontiers in Immunology 2014, 5, 47. [Google Scholar] [CrossRef] [PubMed]
- Sardi, M.; Lubitz, A.; Giese, C. Modeling Human Immunity In Vitro: Improving Artificial Lymph Node Physiology by Stromal Cells. 2016, 2 (3), 143–150. [CrossRef]
- Suematsu, S.; Watanabe, T. Generation of a Synthetic Lymphoid Tissue–like Organoid in Mice. Nature Biotechnology 2004, 22(12), 1539–1545. [Google Scholar] [CrossRef] [PubMed]
- Maarouf, O. H.; Uehara, M.; Kasinath, V.; Solhjou, Z.; Banouni, N.; Bahmani, B.; Jiang, L.; Yilmam, O. A.; Guleria, I.; Lovitch, S. B.; Grogan, J. L.; Fiorina, P.; Sage, P. T.; Bromberg, J. S.; McGrath, M. M.; Abdi, R. Repetitive Ischemic Injuries to the Kidneys Result in Lymph Node Fibrosis and Impaired Healing. JCI insight 2018, 3 (13). [CrossRef]
Figure 1.
Tumor weight progression (Figure 1a) and survival (Figure 1b) in five treatment groups compared to the PBS control group, in melanoma cancer model (N=42).
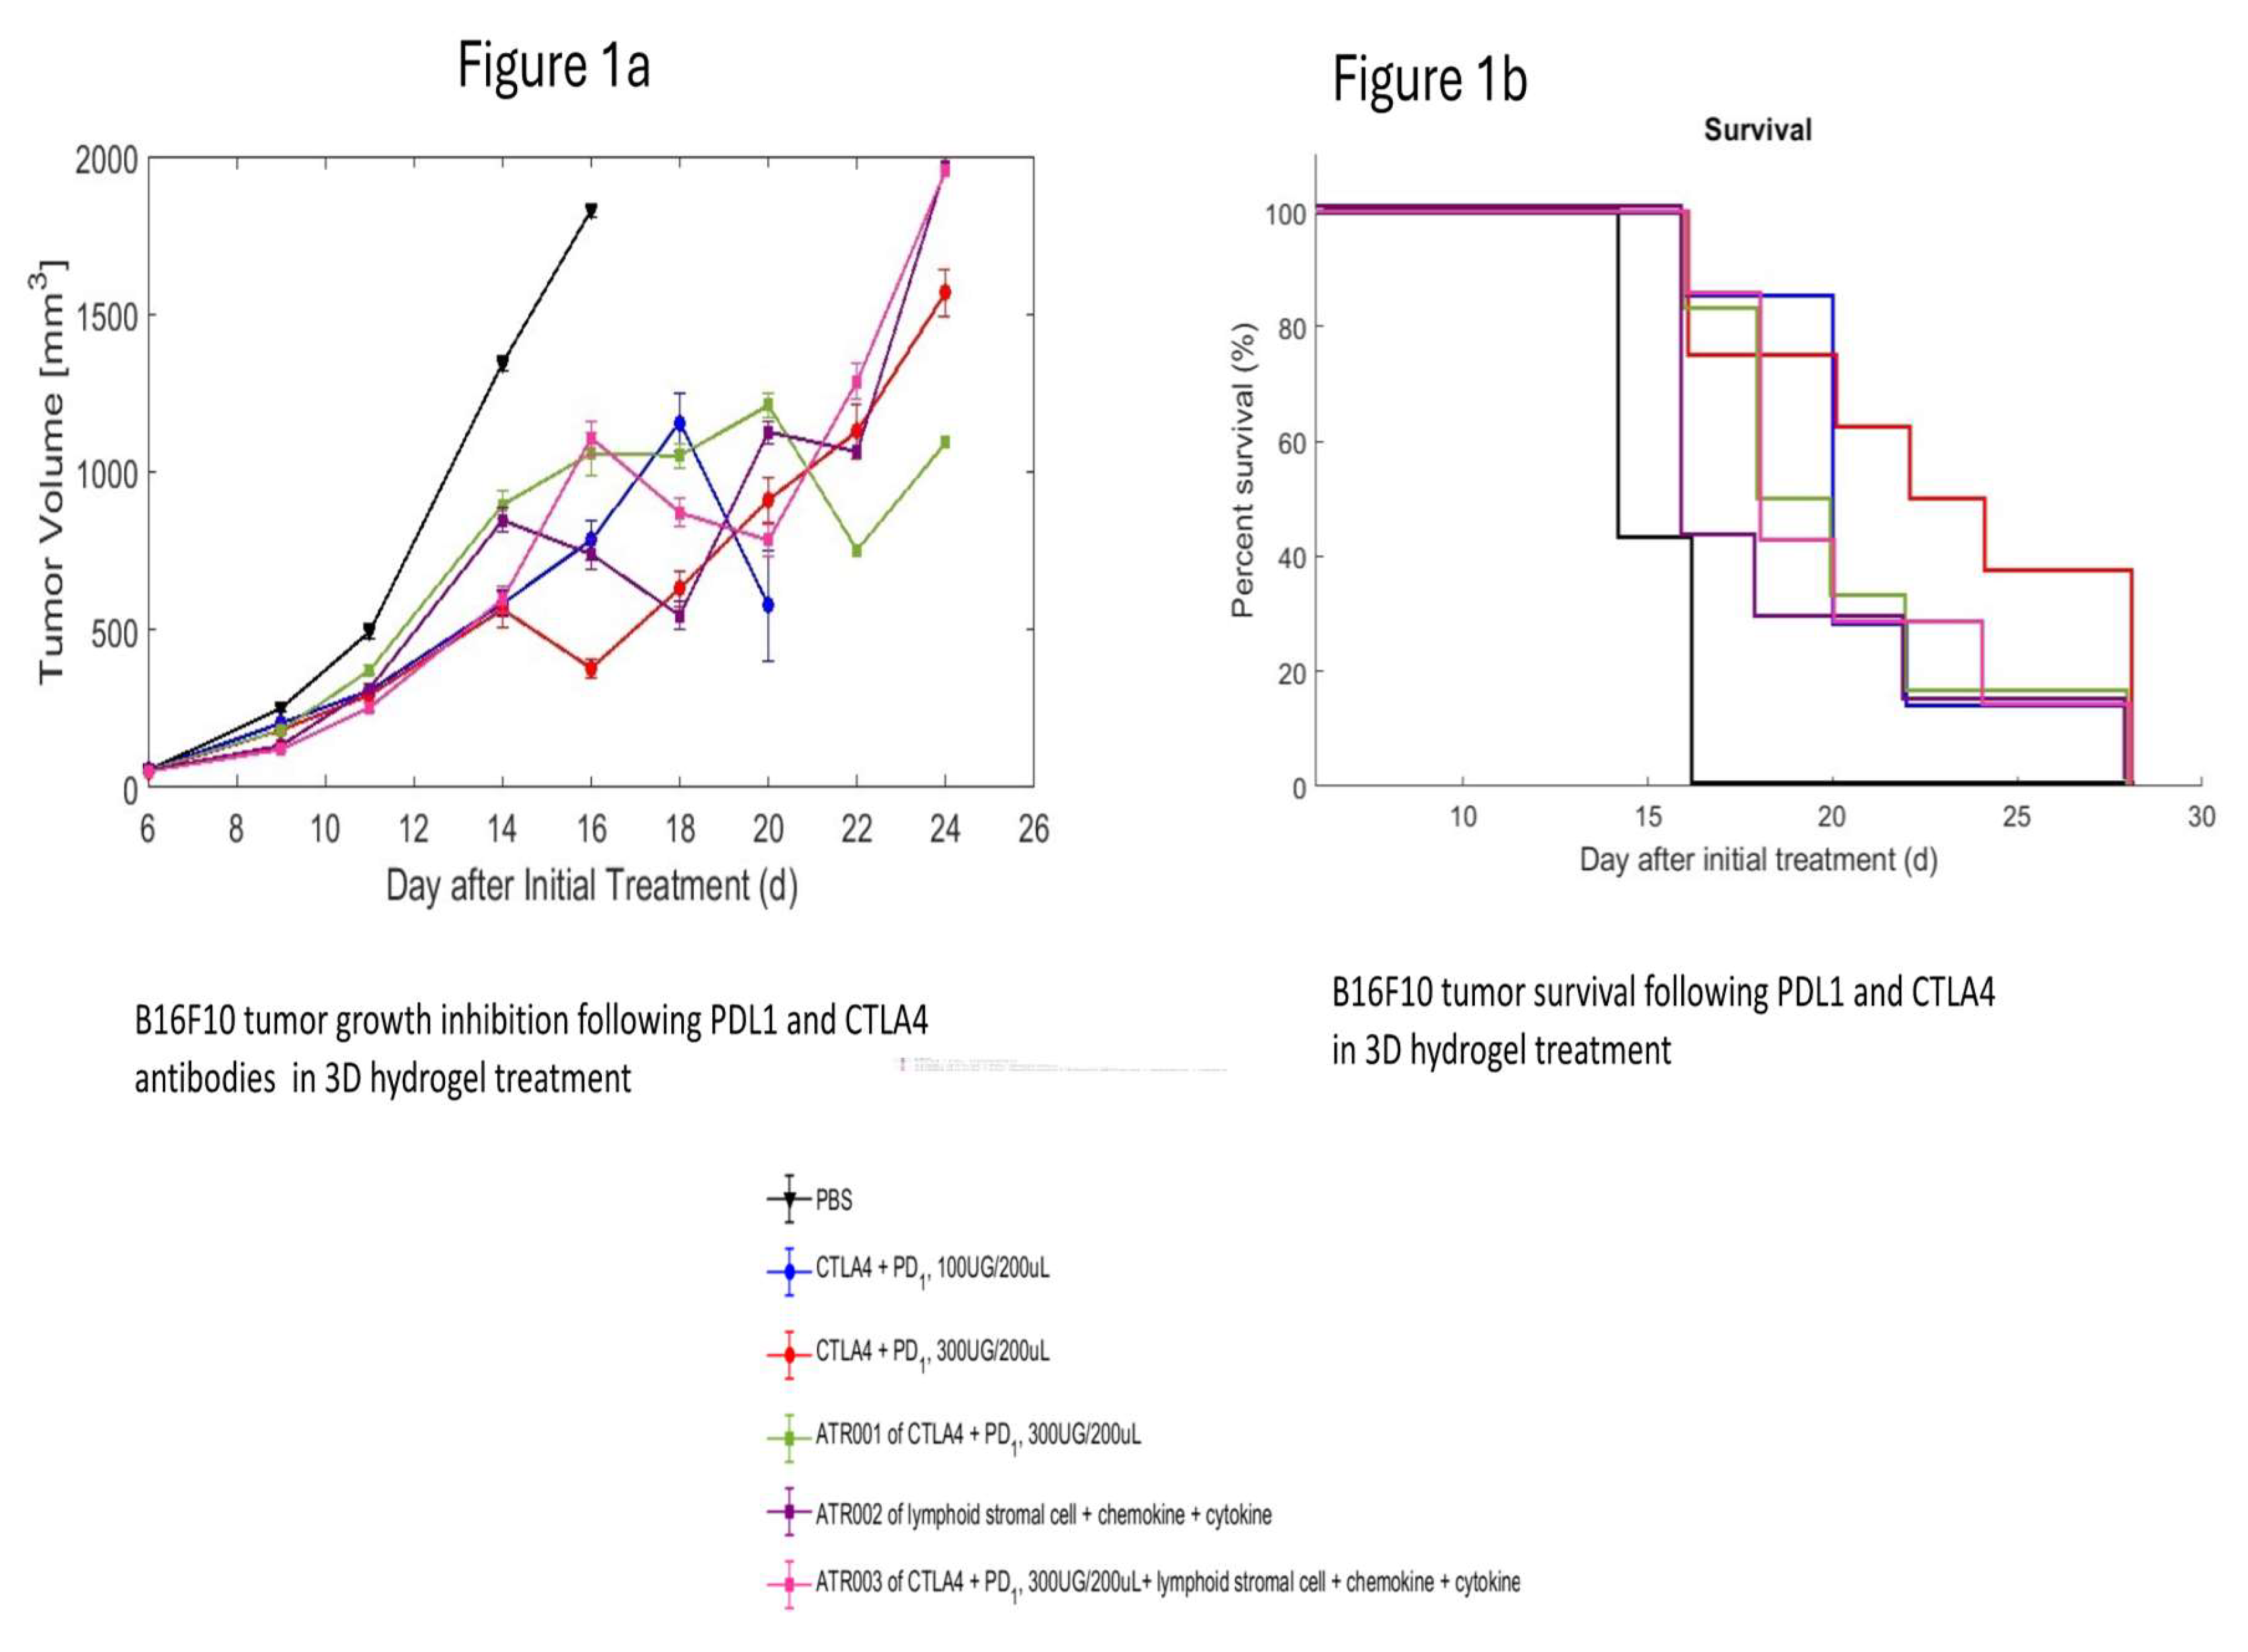
Figure 2.
Tumor Weights across different groups in colorectal cancer study. Figure 2A: Effect of varying doses of anti-CTLA-4 and anti-PD-1 on tumor weights in colorectal cancer. Graph 1: Effect of different doses of anti-CTLA-4 + anti-PD-1 without hydrogel and FRC (Groups 1, 2, 3, and 4). Graph 2: Effect of different doses of anti-CTLA-4 + anti-PD-1 with hydrogel, but without FRC (Groups 1, 5, 6, and 7). Graph 3: Effect of different doses of anti-CTLA-4 + anti-PD-1 with hydrogel and FRC (Groups 1, 8, 9, and 10). Figure 2B: Effect of addition of 3D hydrogel and FRC to anti-CTLA-4 and anti-PD-1 on tumor weights in colorectal cancer. Graph 1: Effect of addition of addition of 3D hydrogel and FRC to low doses of anti-CTLA-4 + anti-PD-1 (Groups 1, 2, 5, and 8). Graph 2: Effect of addition of addition of 3D hydrogel and FRC to medium doses of anti-CTLA-4 + anti-PD-1 (Groups 1, 3, 6, and 9). Graph 3: Effect of addition of addition of 3D hydrogel and FRC to high doses of anti-CTLA-4 + anti-PD-1 (Groups 1, 4, 7, and 10).
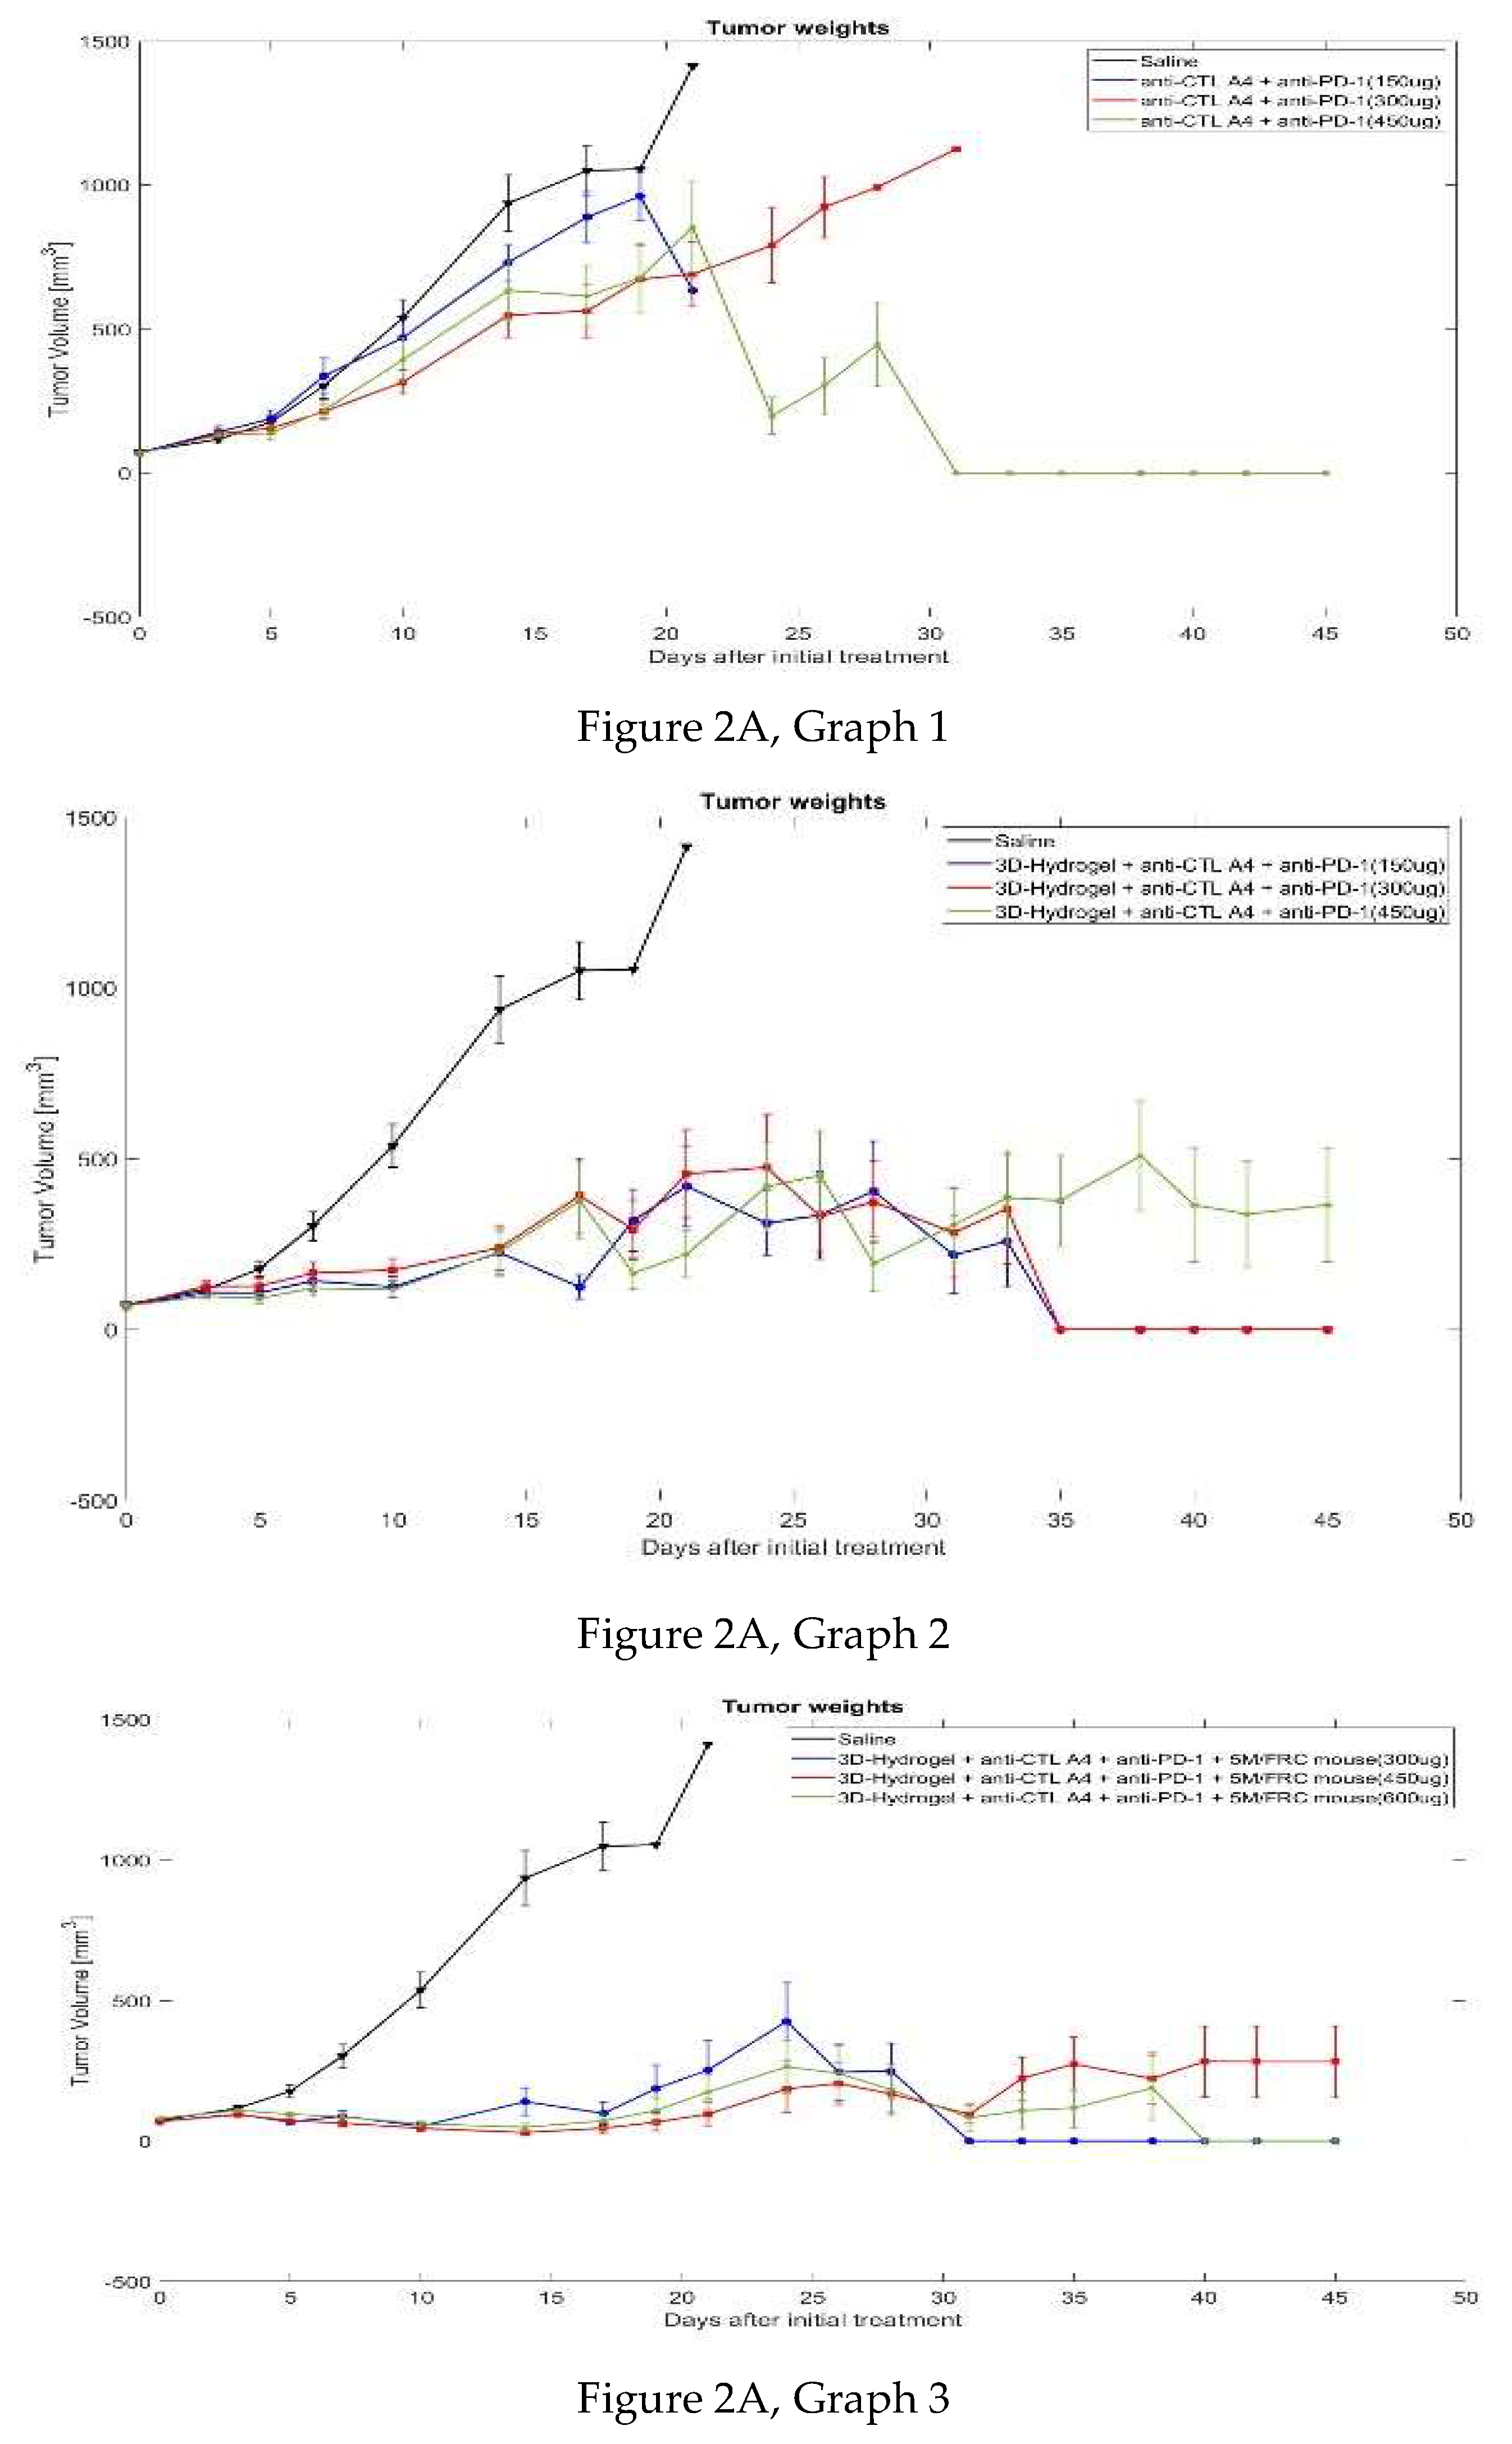
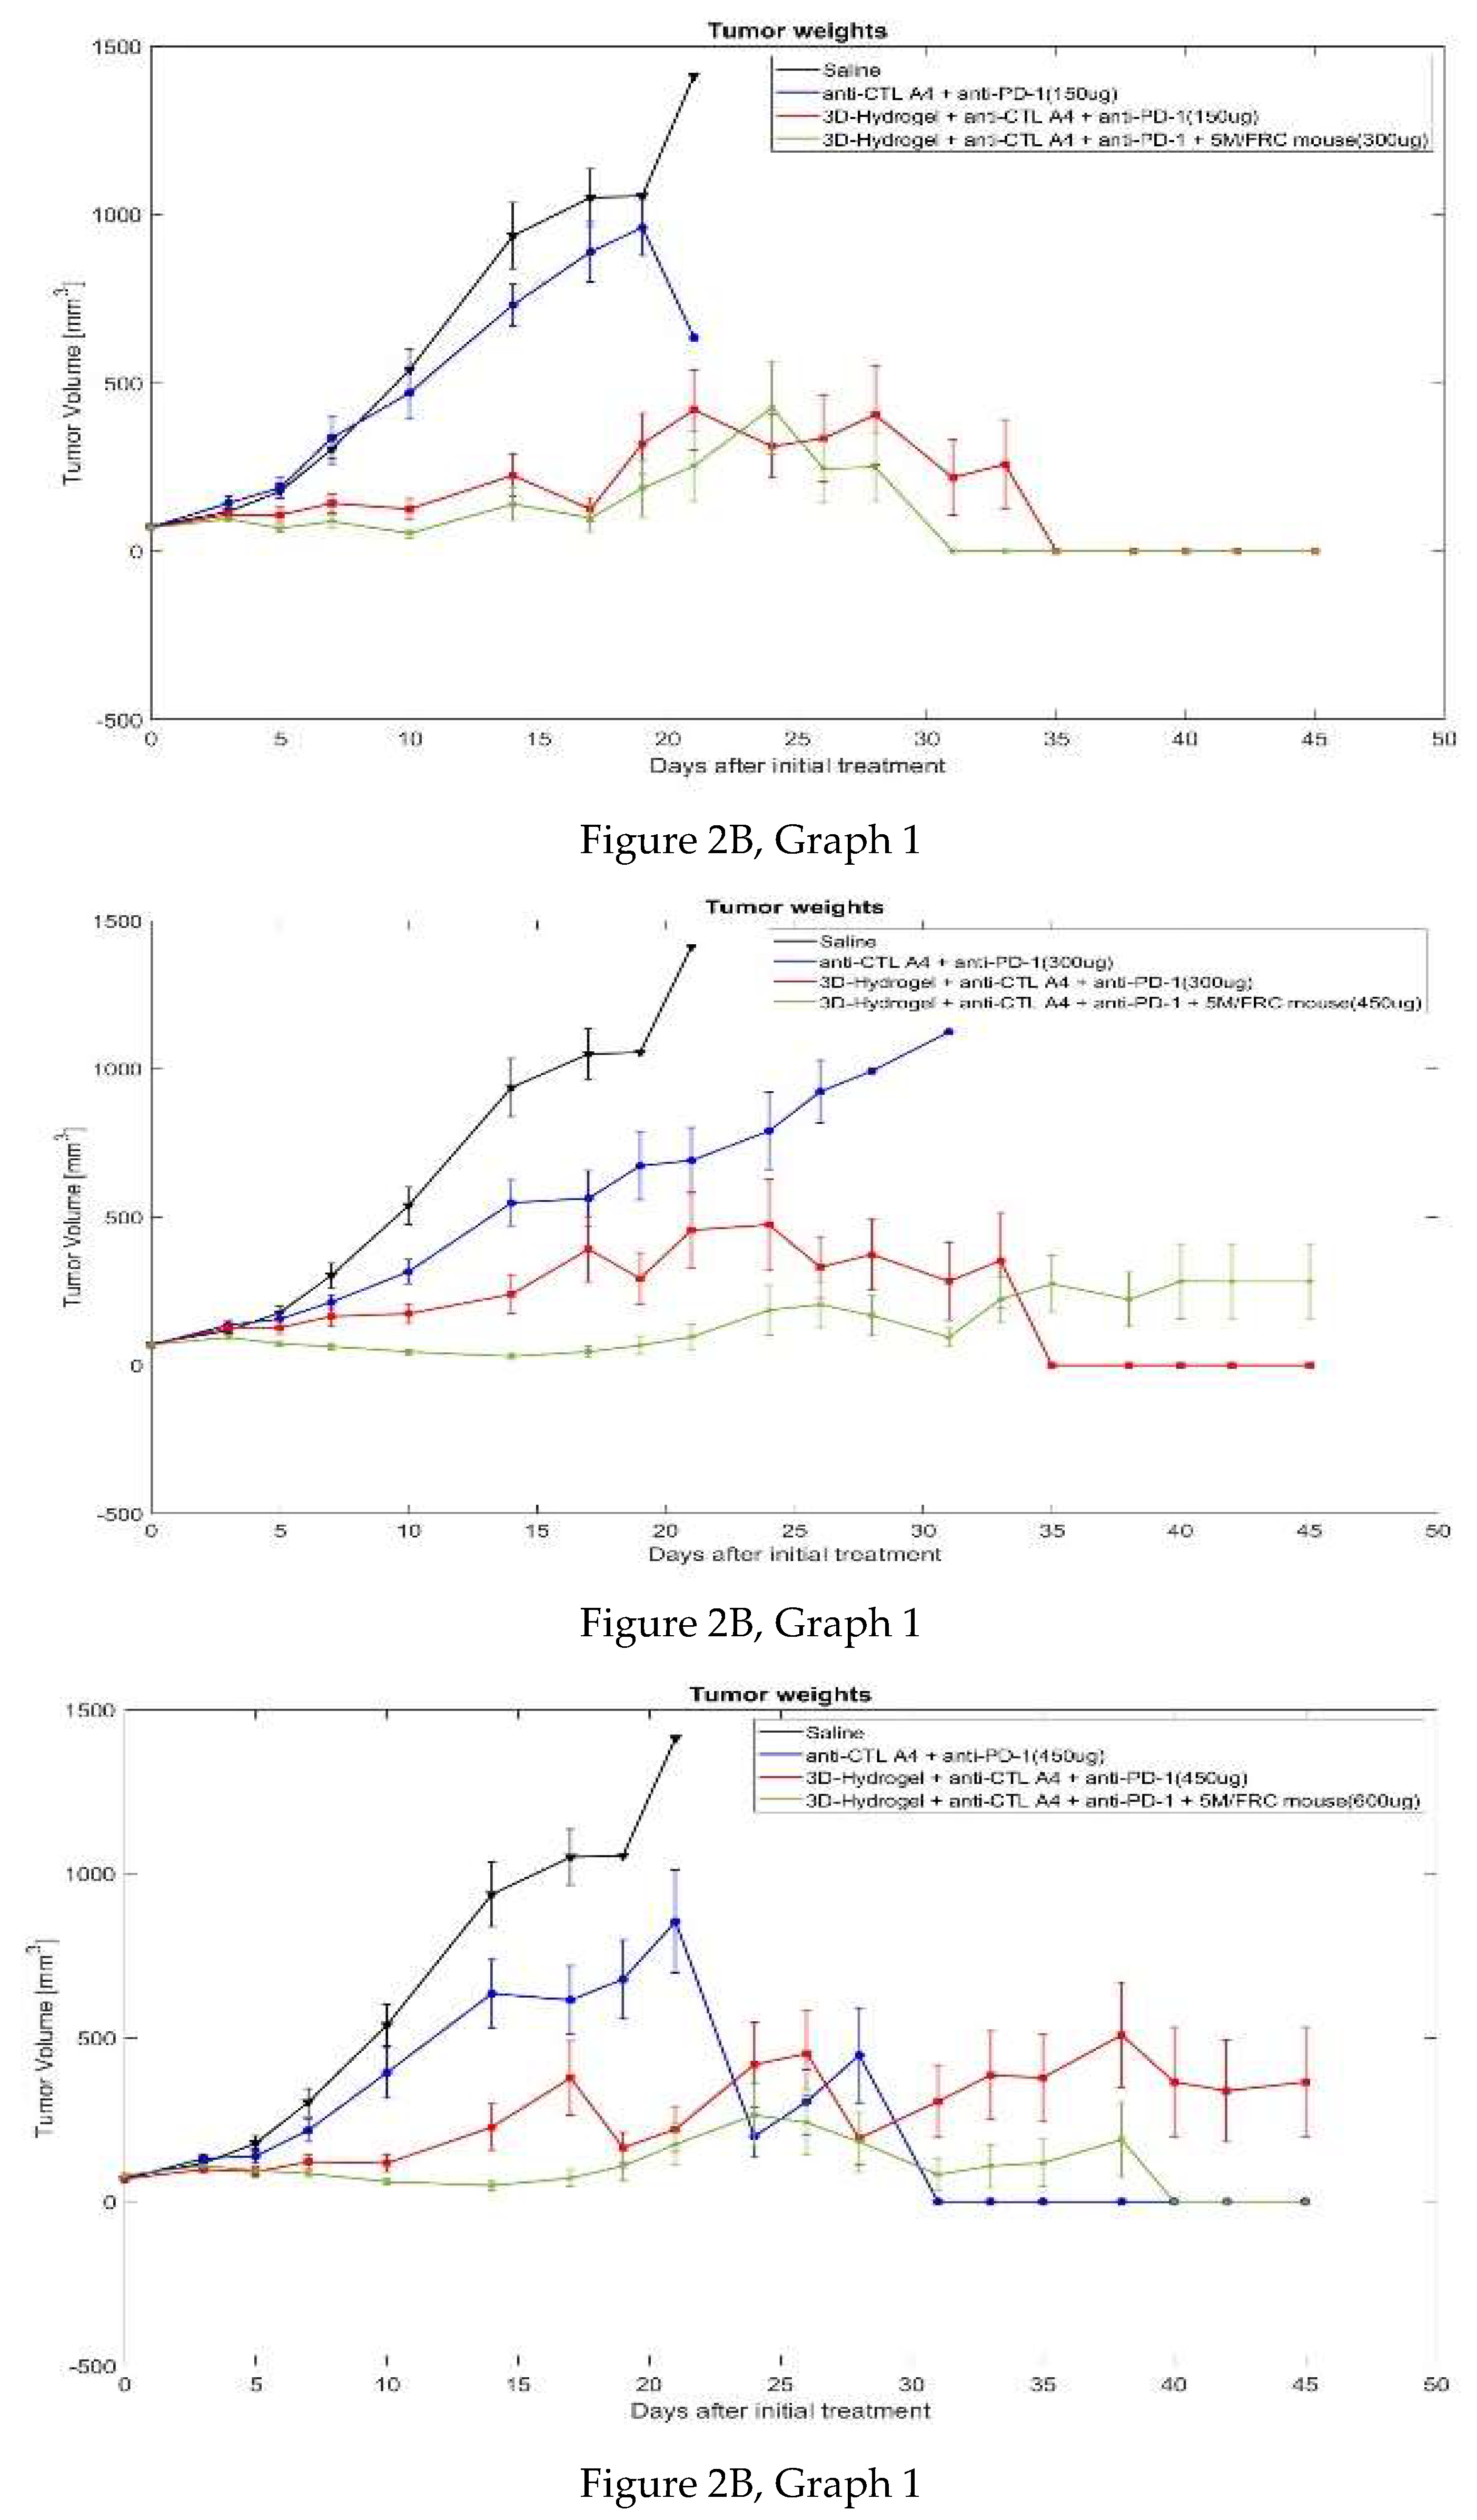
Figure 3.
Survival Rate across different groups in colorectal cancer study. Figure 3A: Effect of varying doses of anti-CTLA-4 and anti-PD-1 on survival rates in colorectal cancer. Graph 1: Effect of different doses of anti-CTLA-4 + anti-PD-1 without hydrogel and FRC (Groups 1, 2, 3, and 4). Graph 2: Effect of different doses of anti-CTLA-4 + anti-PD-1 with hydrogel, but without FRC (Groups 1, 5, 6, and 7). Graph 3: Effect of different doses of anti-CTLA-4 + anti-PD-1 with hydrogel and FRC (Groups 1, 8, 9, and 10). Figure 3B: Effect of addition of 3D hydrogel and FRC to anti-CTLA-4 and anti-PD-1 on survival rates in colorectal cancer. Graph 1: Effect of addition of addition of 3D hydrogel and FRC to low doses of anti-CTLA-4 + anti-PD-1 (Groups 1, 2, 5, and 8). Graph 2: Effect of addition of addition of 3D hydrogel and FRC to medium doses of anti-CTLA-4 + anti-PD-1 (Groups 1, 3, 6, and 9). Graph 3: Effect of addition of addition of 3D hydrogel and FRC to high doses of anti-CTLA-4 + anti-PD-1 (Groups 1, 4, 7, and 10).
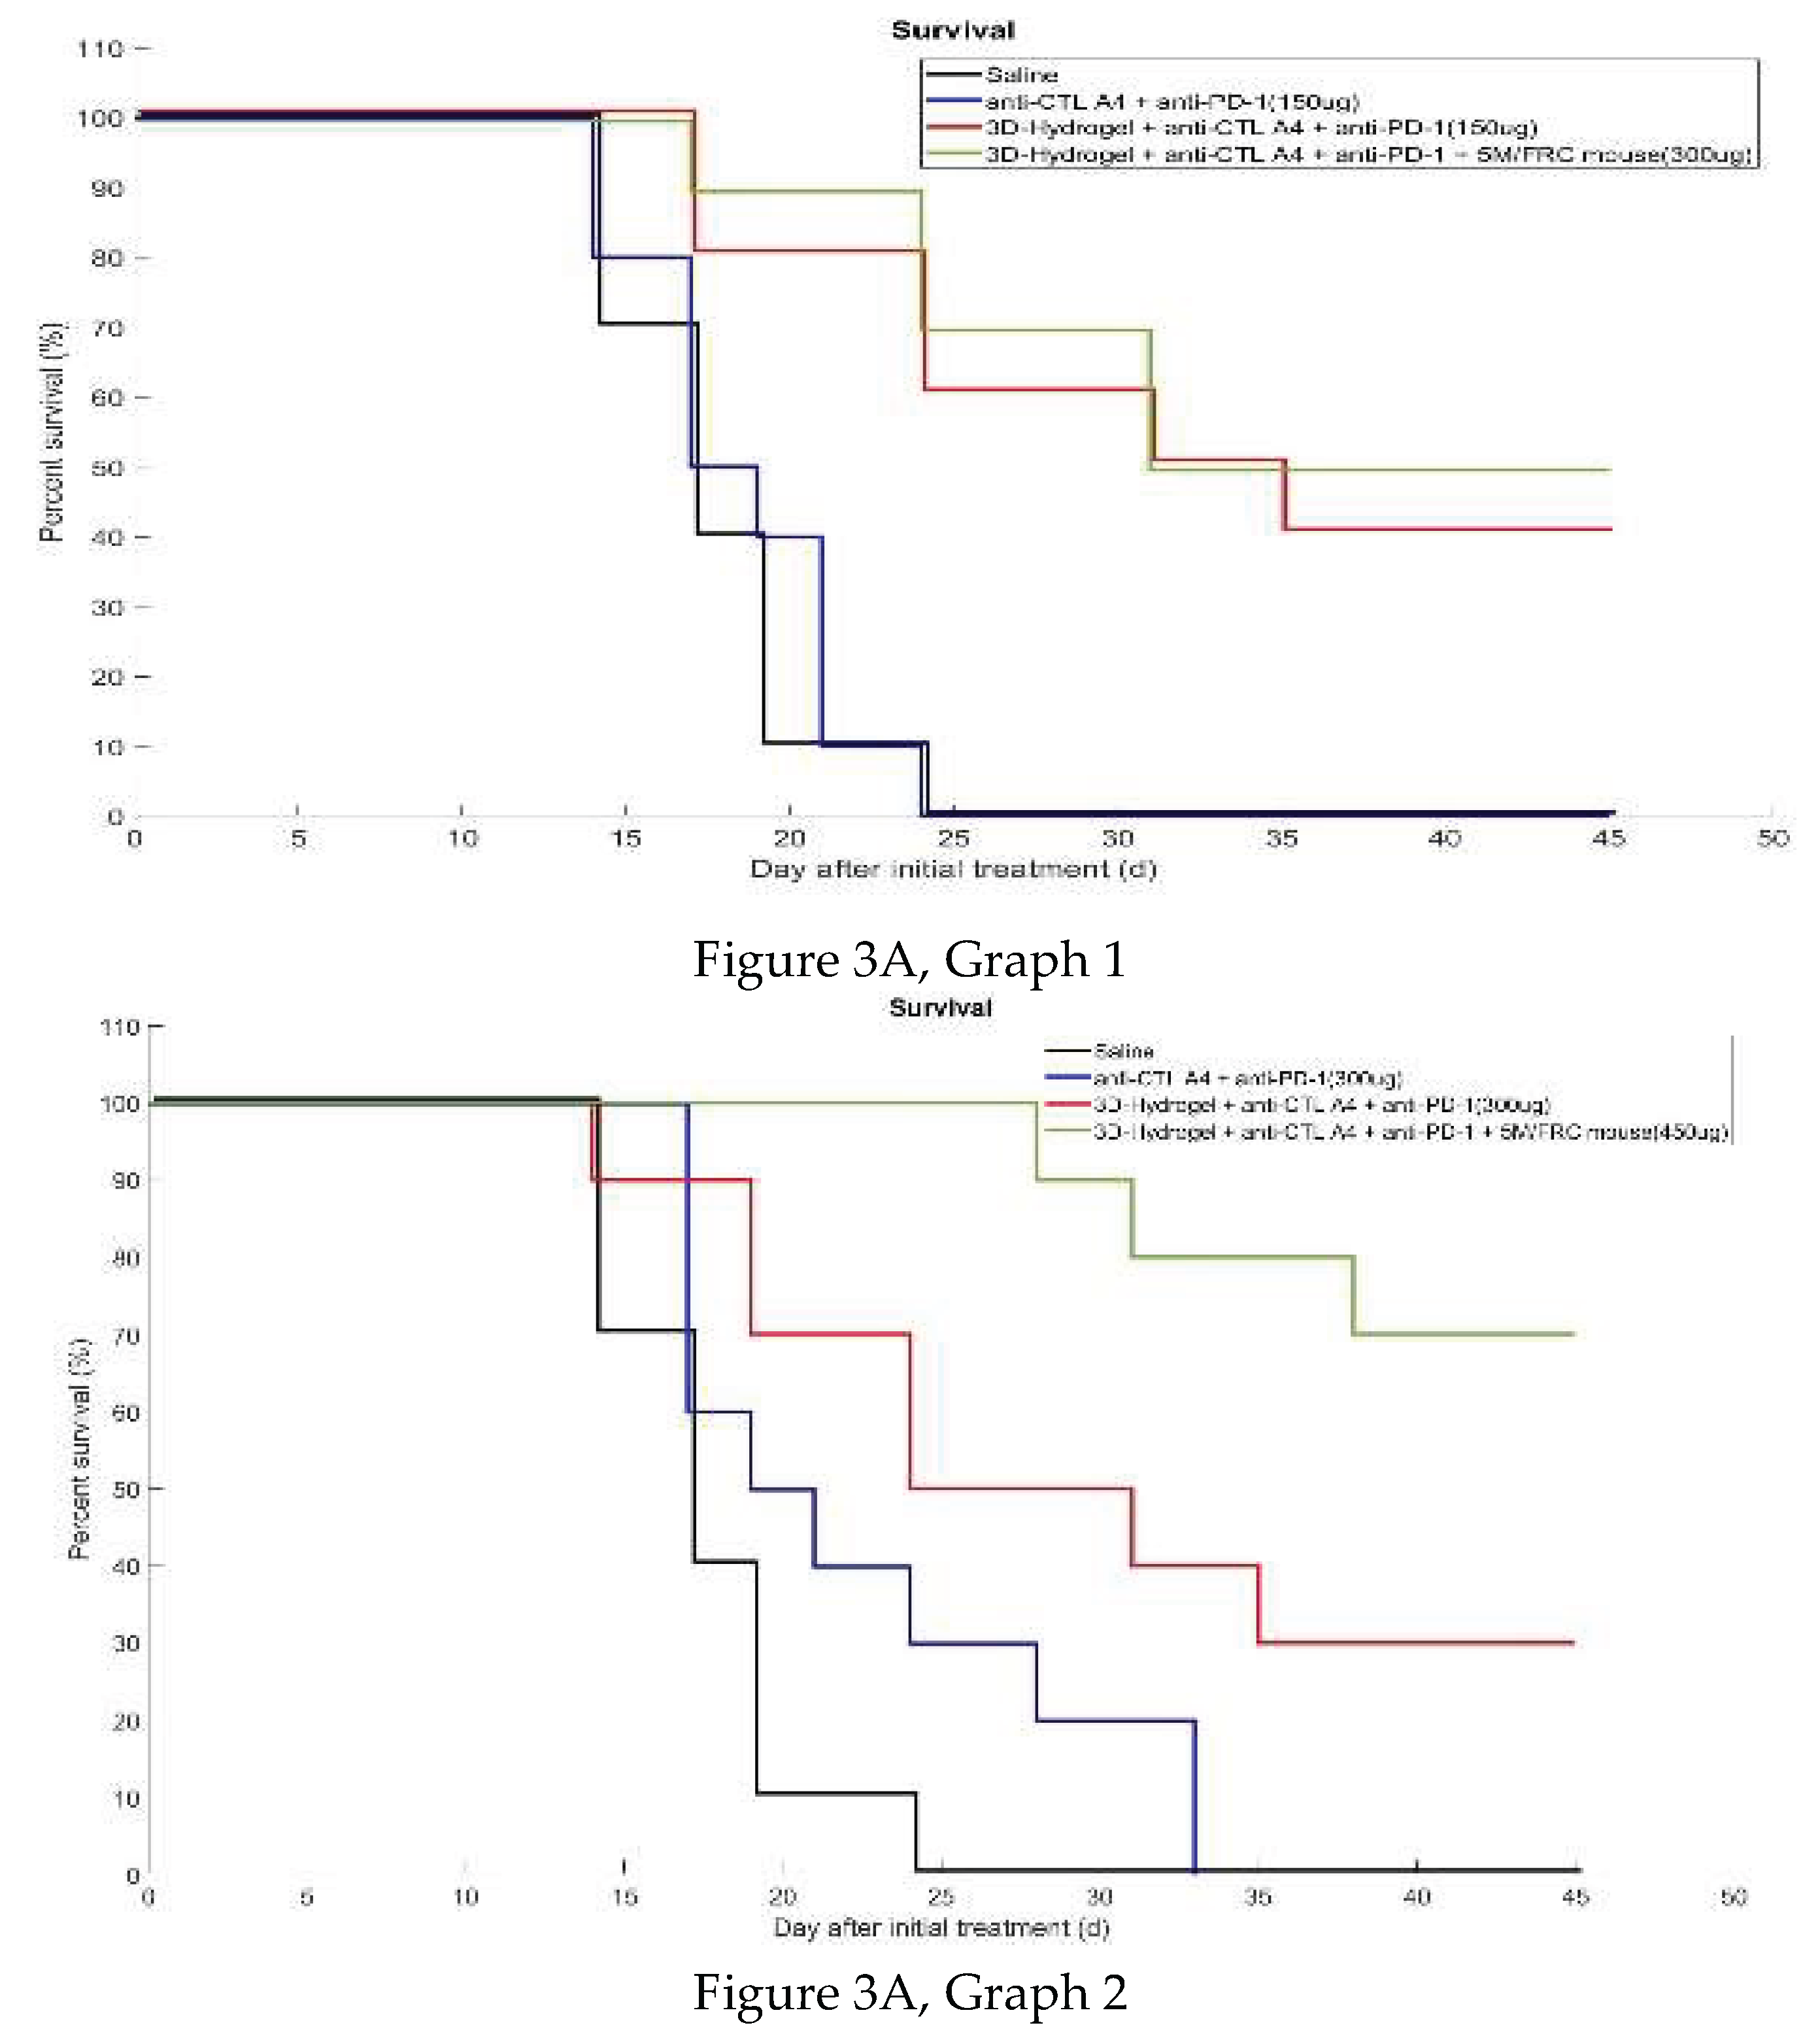
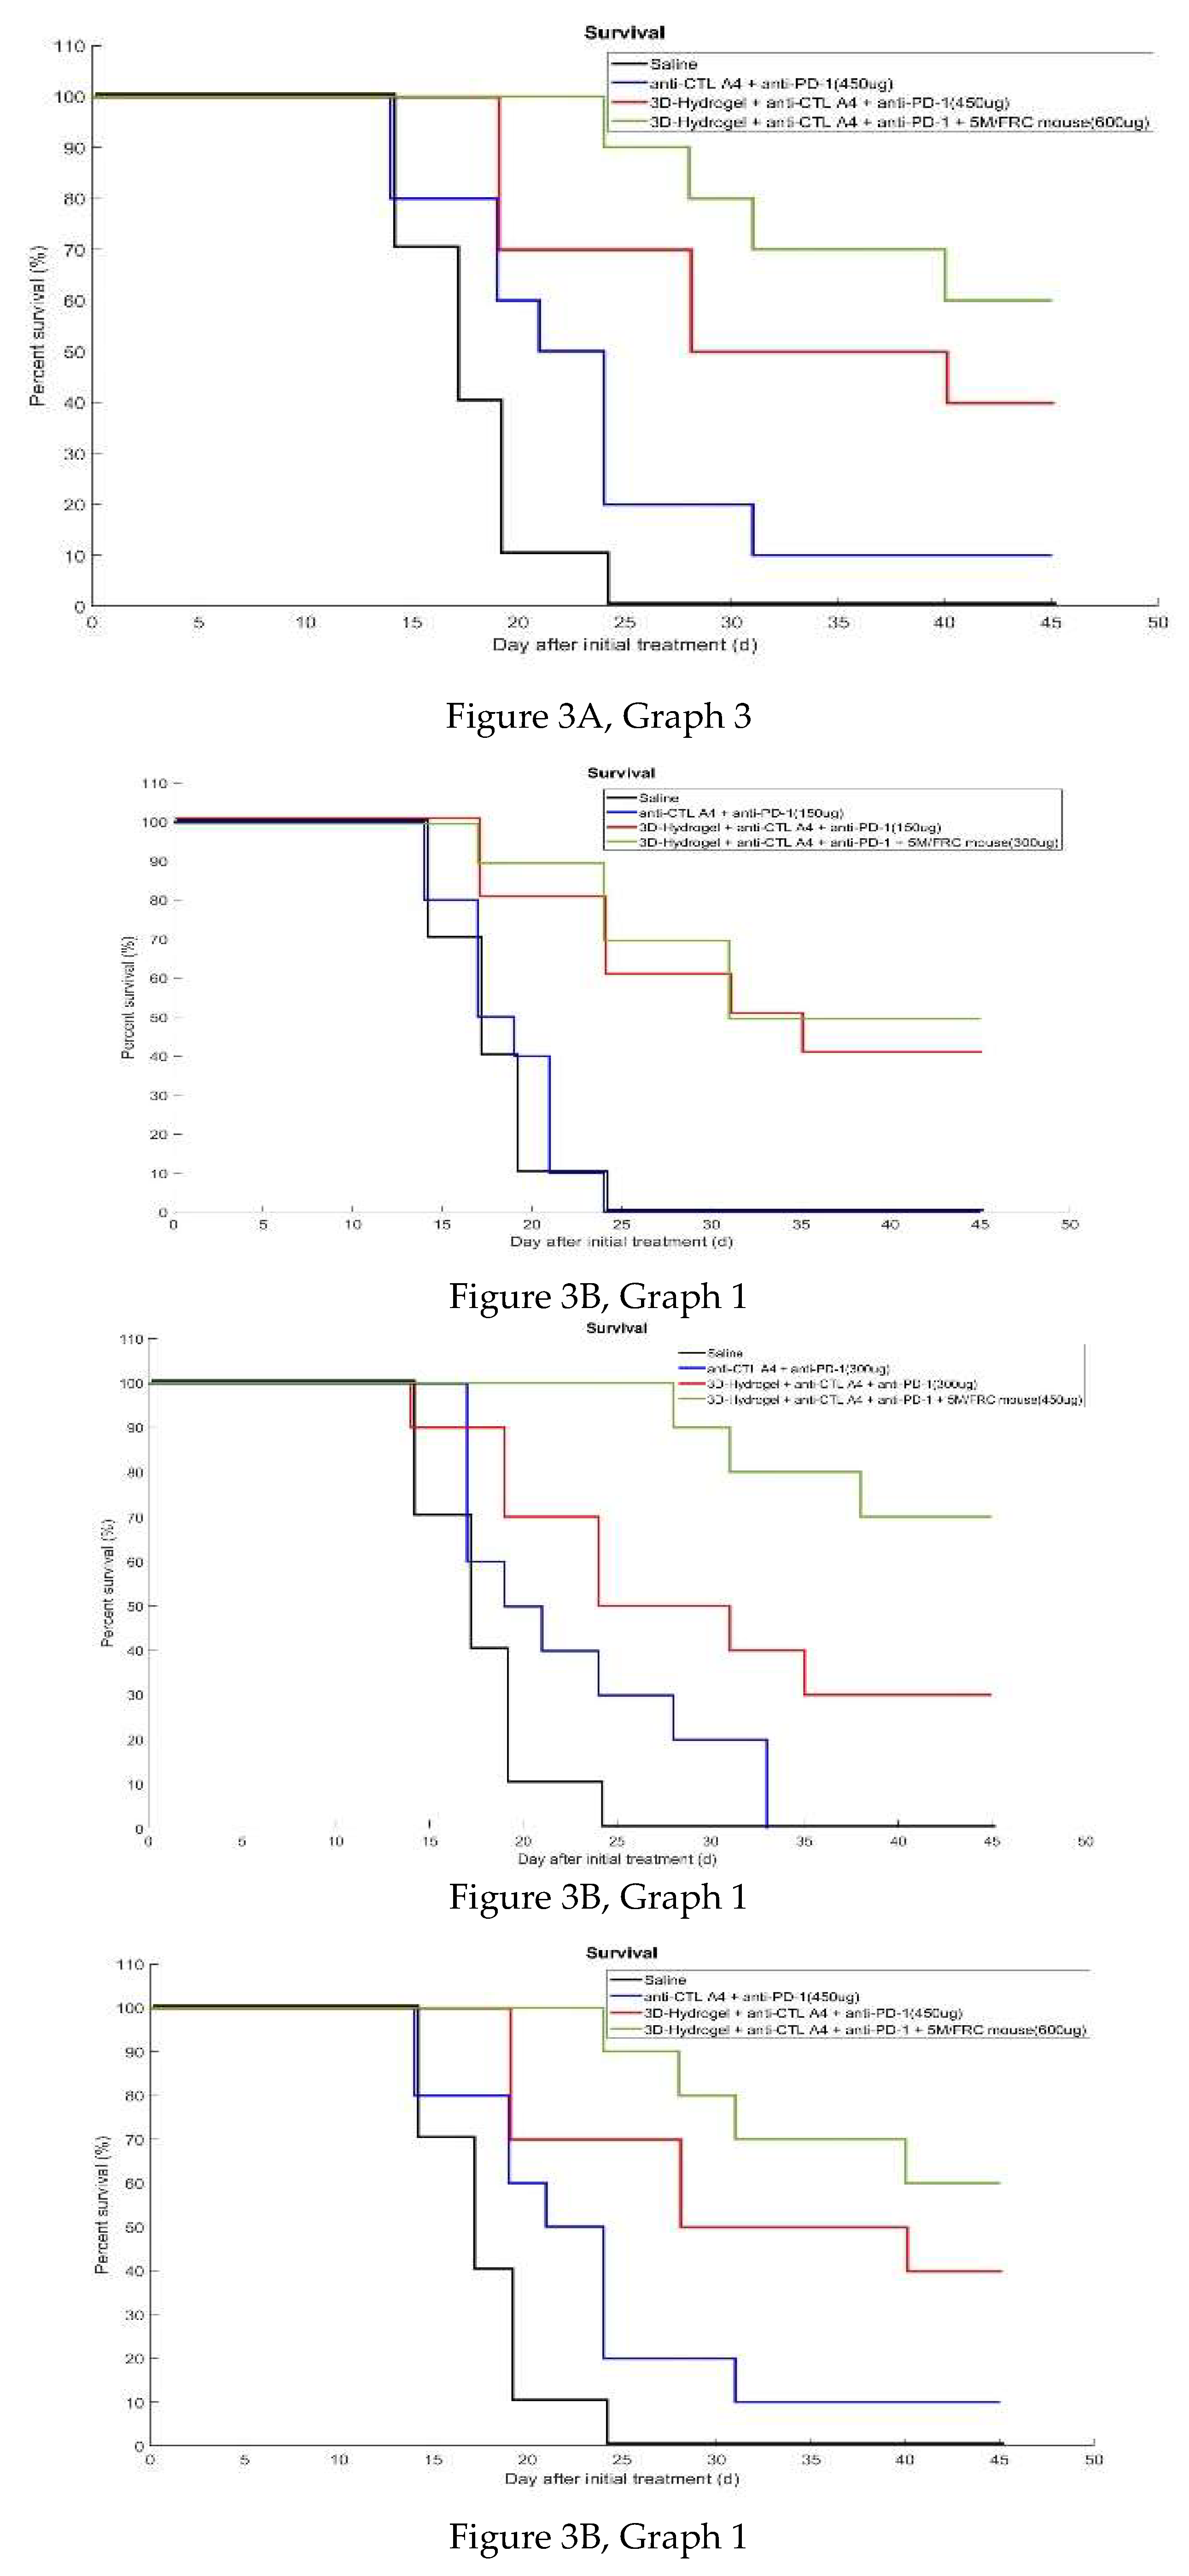
Figure 4.
Graphs A and B showing the percentage of mice cured after 45 days in each group. Graph A: Percentage cured in each group. Graph B: Average percentage cured for each treatment.
Figure 4.
Graphs A and B showing the percentage of mice cured after 45 days in each group. Graph A: Percentage cured in each group. Graph B: Average percentage cured for each treatment.
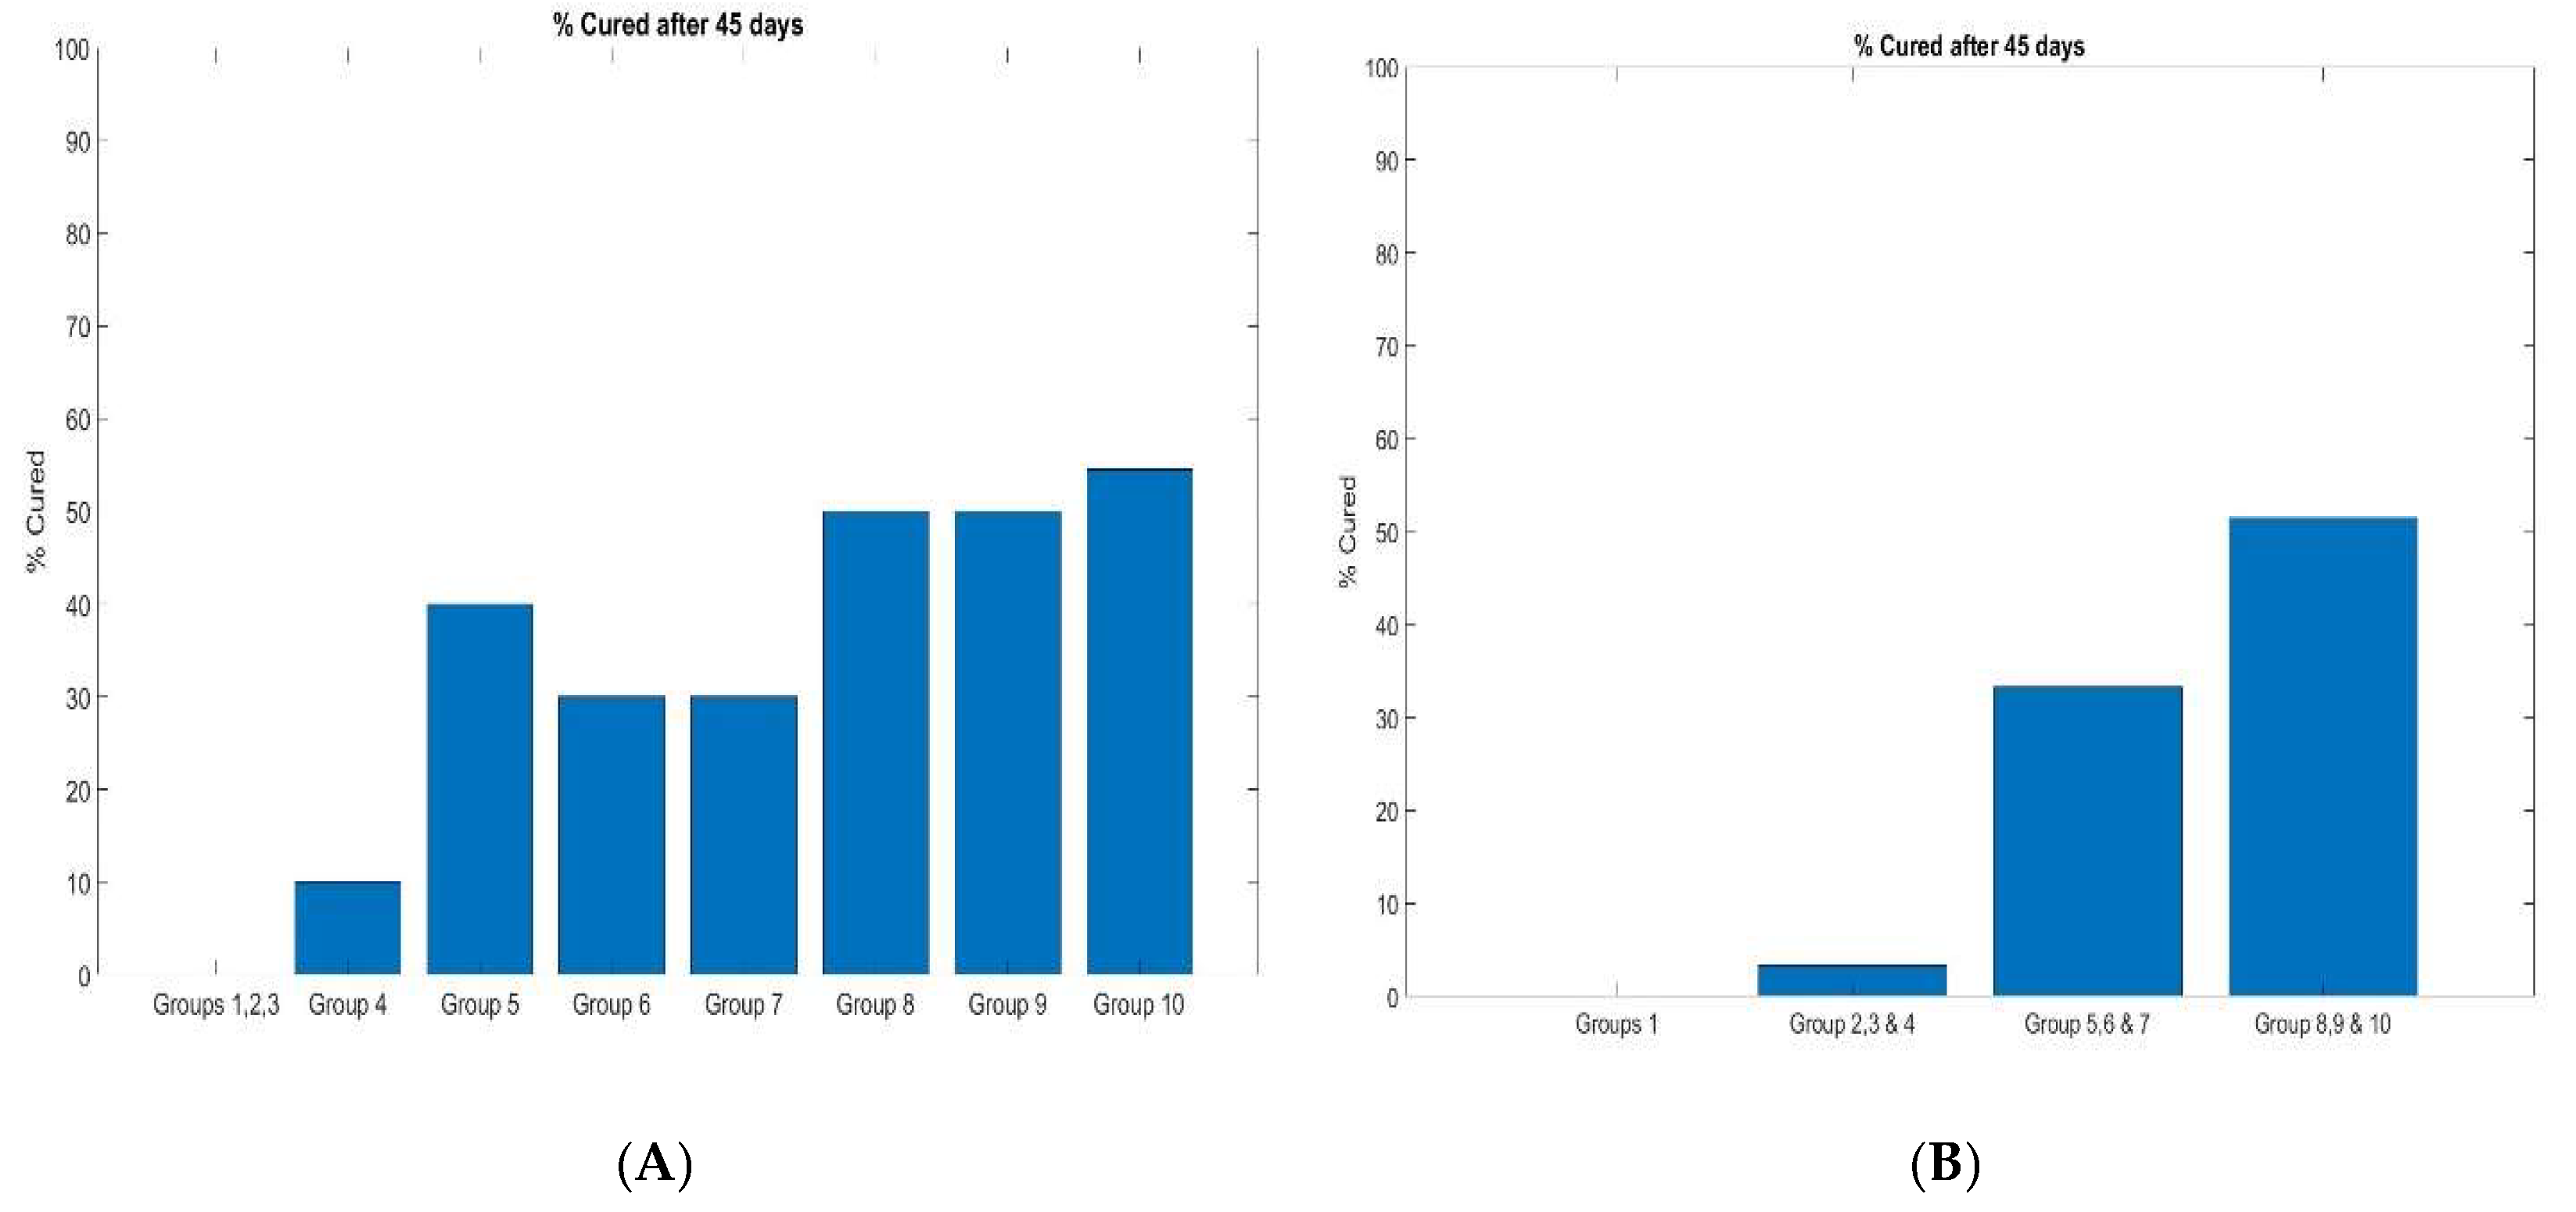
Figure 5.
Staining Analysis of Gel Capsules from Treated Mice. Figure 5A: H&E staining of gel capsules, highlighting lymph node structure. Figure 5B: PDPN and DAPI staining, showing stromal lymphoid cell distribution. Figure 5C: CD3 staining, indicating T cell presence within the gel capsules. Figure 5D: MECA79 staining, illustrating high endothelial venules and angiogenic vessels.
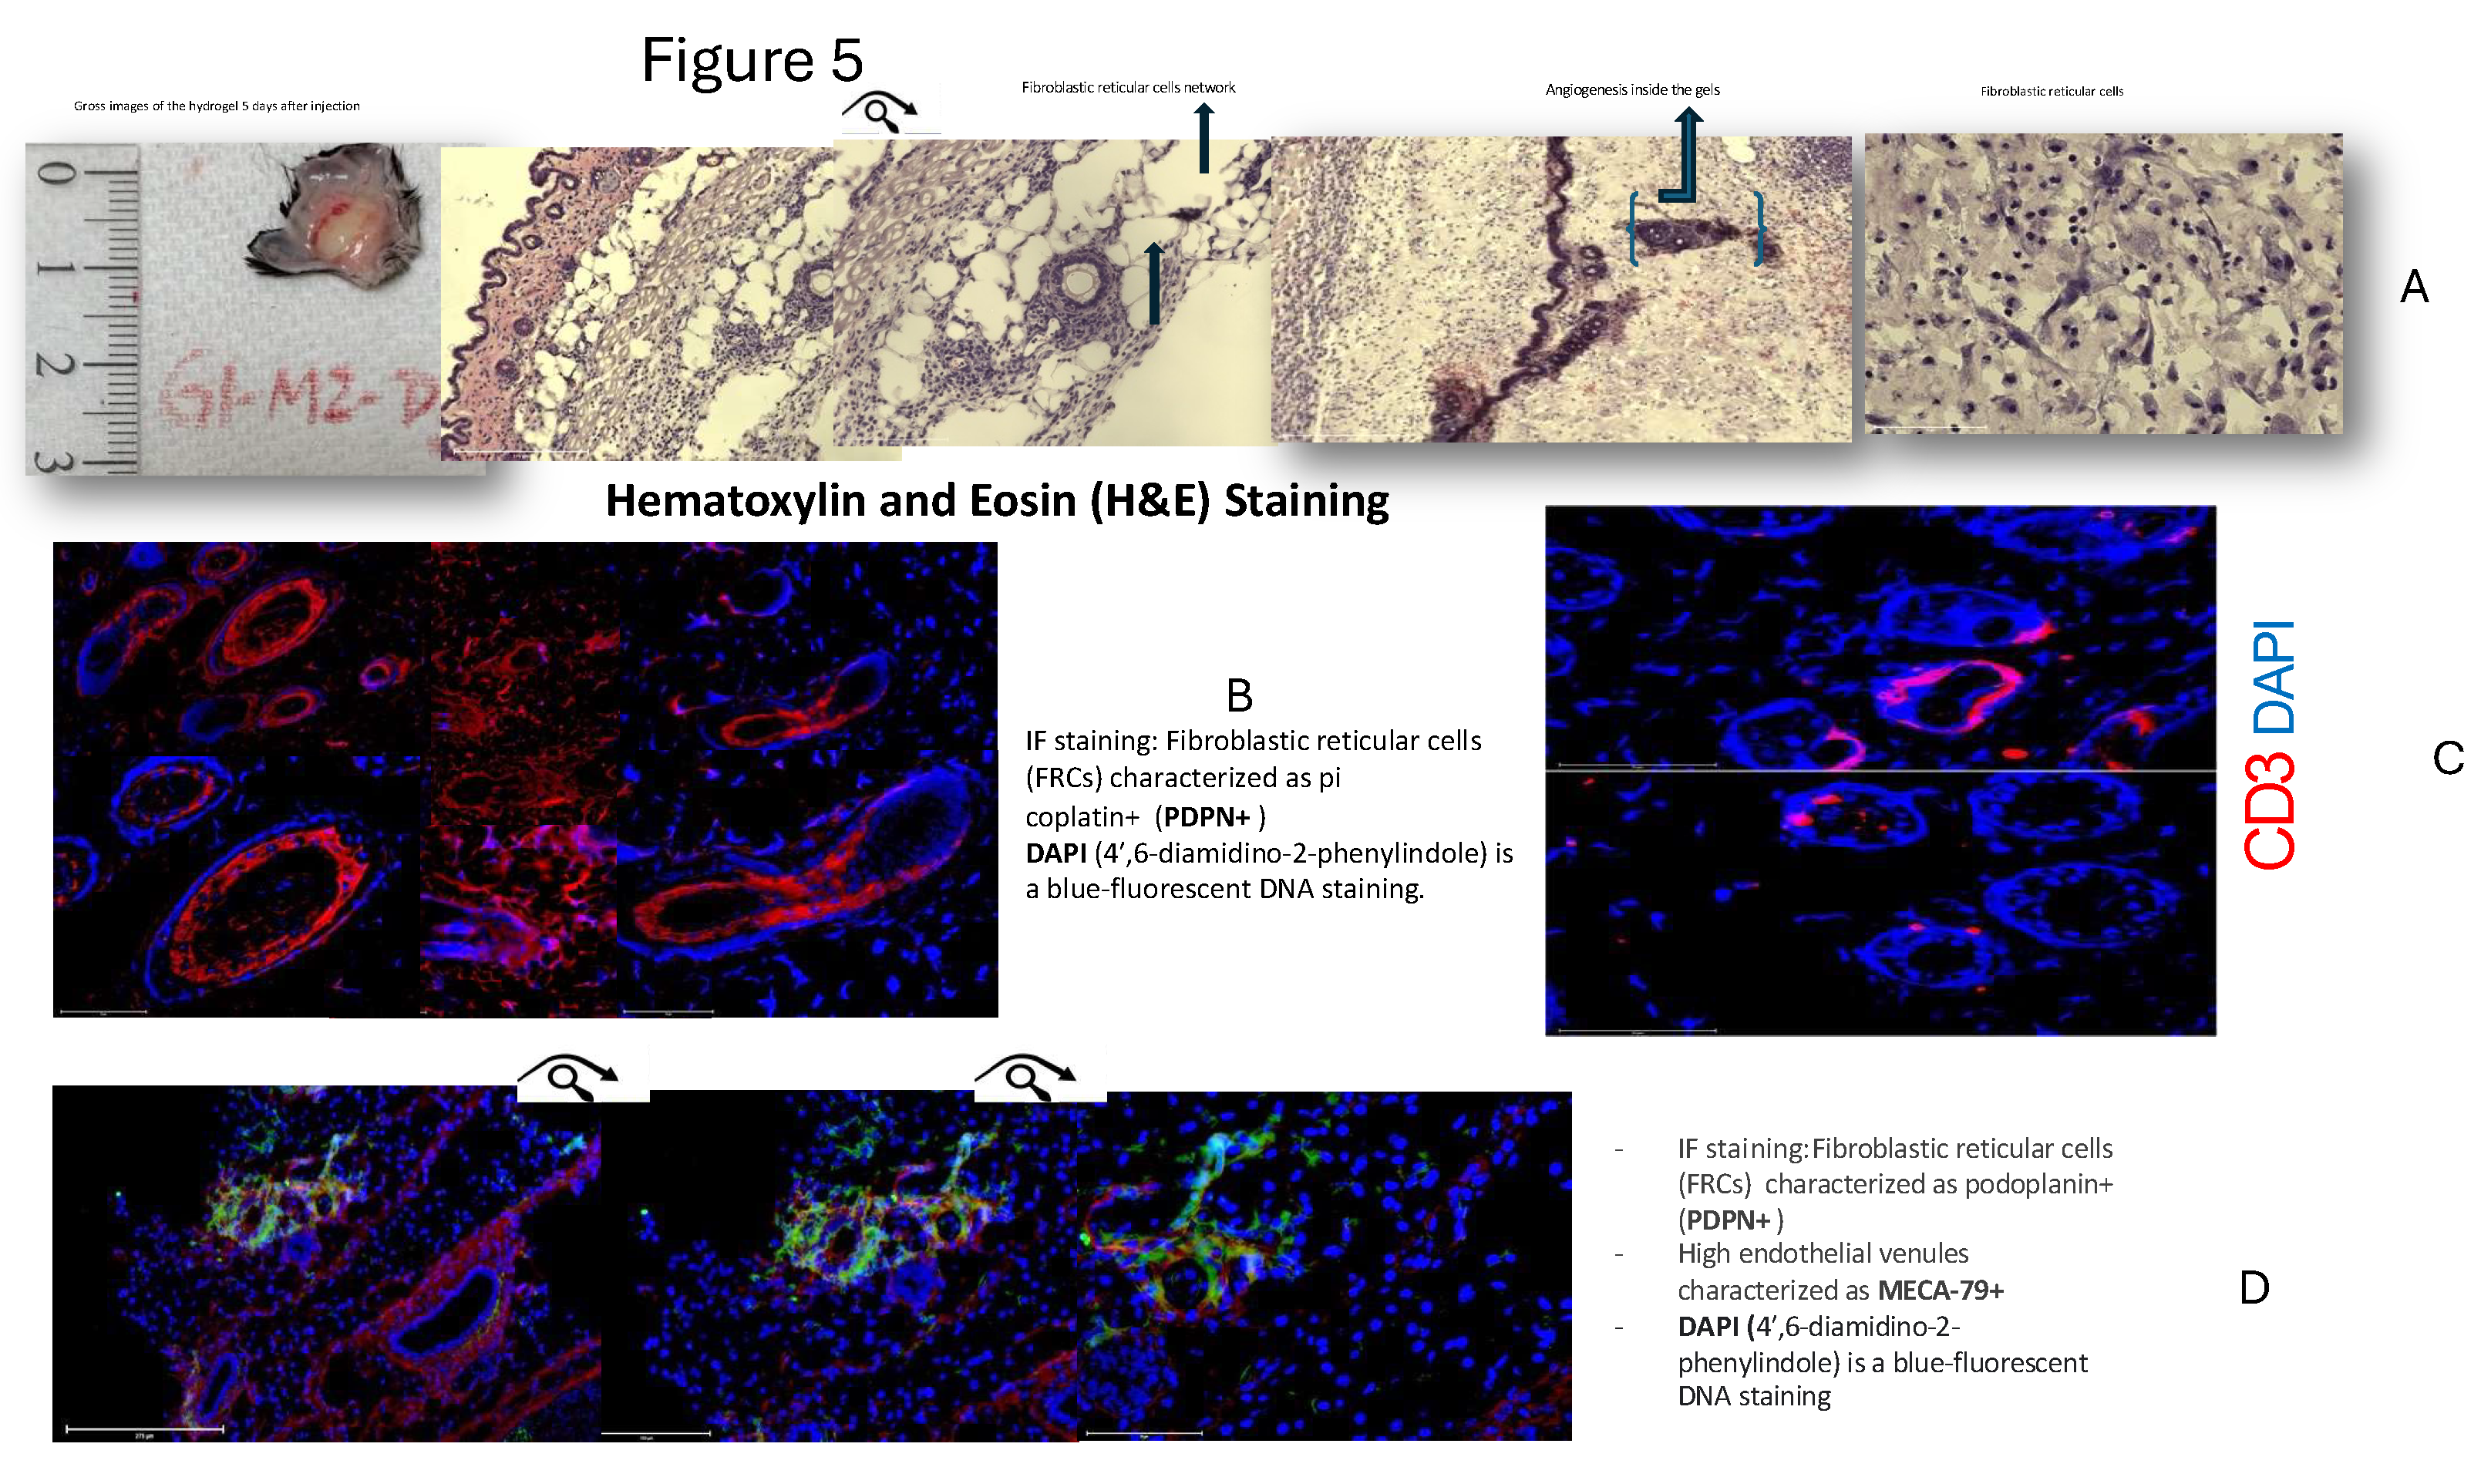

Table 1.
Treatment Regimen of Different Groups in B16F10 Melanoma Study.
| Group | No. of mice | Treatment | DOSE, Route (mg/kg) | % MAX TGI on (Day) | MST* (Day) |
| G1 | 7 | Vehicle | ----, SC | ---- | 16.0 |
| G2 | 7 | Anti-mouse PD-1Ab + Anti-mouse CTLA4 Ab | 100μg + 100μg, IP | 56.7% (14) | 20.2 |
| G3 | 8 | 3D hydrogel + PD-1Ab + Anti-mouse CTLA4 Ab | 300μg + 300μg, IP | 58.8% (16) | 23.4 |
| G4 | 6 | 3D hydrogel + PD-1Ab + Anti-mouse CTLA4 Ab + FRC | 200μL+ 300μg + 300μg +2m FRC, SC | 40.5% (16) | 19.6 |
| G5 | 7 | 3D hydrogel + FRC +chemokines/cytokine | 2m FRC, 90ng Chemokine/cytokine, SC | 47.1% (9) | 16.8 |
| G6 | 7 | 3D hydrogel + PD-1Ab + Anti-mouse CTLA4 Ab + FRC +chemokines/cytokine | 200μL+ 300μg + 300μg +2m FRC, Chemokine/cytokine, SC | 55.7% (14) | 17 |
Note: %MAX TGI = 100 x [(TVc-TVx)/TVc] TVc: Tumor Volume of Control Group; TVx: Tumor Volume of Treatment Group. MST: median survival time; SC: Subcutaneous; IP: Intraperitoneal.
Table 2.
Treatment Regimen of Different Groups in MC-38 Colorectal Carcinoma Study.
| Group | No. of mice | Treatment | Dose | Treatment Schedule(Est)** |
| G1 | 10 | Saline | Q3D, Days 7, 10, 13, 16, and 19** (injection in three sites every 3 days from day 7 until day 20) | |
| G2 | 10 | anti- CTLA4 + anti-PD-1 | 50ug per mAB Per site (3 sites total 150ug per mouse) |
Q3D, Days 7, 10, 13, 16, and 19**(Injection in three sites every 3 days from day 7 until day 19) |
| G3 | 10 | anti- CTLA4 + anti-PD-1 |
100ug per mAB Per site (3 sites total 300ug mouse) | Q3D, Days 7, 10, 13, 16, and 20** (Injection in three sites every three days from day 7 until day 20) |
| G4 | 10 | anti- CTLA4 + anti-PD-1 |
150ug per mAB Per site (3 sites total 450ug mouse) | Q3D, Days 7, 10, 13, 16, and 20** (Injection in three sites every 3 days from day 7 until day 19) |
| G5 | 10 | 3D hydrogel + anti- CTLA4 + anti-PD-1 |
50ug per mAB Per site (3 sites total 150ug mouse)) |
Q3D, Days 7, 10, 13, 16, and 20** (Injection in three sites every 3 days from day 7 until day 20) |
| G6 | 10 | 3D hydrogel + anti- CTLA4 + anti-PD-1 |
100ug per mAB Per site (3 sites total 300ug mouse) | Q3D, Days 7, 10, 13, 16, and 20** (Injection in three sites every 3 days from day 7 until day 20) |
| G7 | 10 | 3D hydrogel + anti- CTLA4 +anti-PD-1 | 150ug per mAB Per site (3 sites total 450ug mouse) | Q3D, Days 7, 10, 13, 16, and 20** (Injection in three sites every 3 days from day 7 until day 20) |
| G8 | 10 | 3D hydrogel + anti- CTLA4 + anti-PD-1+ 5M FRC/mouse |
100ug per mAB Per site (3 sites total 300ug mouse) | QD, Days 7 **and 13 |
| G9 | 10 | 3D hydrogel + anti- CTLA4 + anti-PD-1+ 5M FRC/mouse |
150ug per mAB Per site (3 sites total 450ug mouse) | QD, Days 7 **and 13 |
| G10 | 10 | 3D hydrogel + anti- CTLA4 + anti-PD-1+ 5M FRC/mouse |
200ug per mAB Per site (3 sites total 600ug per mouse) | QD, Days 7 **and 13 |
Route: SC (subcutaneous in all Groups).
Table 3.
Day-wise tumor volume for each group (Standard error of the mean in Table 3a). Table 3a: Standard error calculated in MATLAB.
Table 3.
Day-wise tumor volume for each group (Standard error of the mean in Table 3a). Table 3a: Standard error calculated in MATLAB.
| Day | 0 | 3 | 5 | 7 | 10 | 14 | 17 | 19 | 21 | 24 | 26 | 28 | 31 | 33 | 35 | 38 | 40 | 42 | 45 | ||||||||||||||||||
| Group 1 | 72.9 | 116 | 177 | 302 | 538 | 936 | 1050 | 1054 | 1412 | ||||||||||||||||||||||||||||
| Group 2 | 70.6 | 142 | 188 | 336 | 470 | 731 | 888 | 961 | 633 | ||||||||||||||||||||||||||||
| Group 3 | 68.6 | 136 | 155 | 213 | 315 | 547 | 563 | 672 | 690 | 790 | 923 | 992 | 1124 | ||||||||||||||||||||||||
| Group 4 | 68.7 | 131 | 138 | 217 | 393 | 634 | 614 | 677 | 853 | 198 | 304 | 446 | 0 | 0 | 0 | 0 | 0 | 0 | 0 | ||||||||||||||||||
| Group 5 | 69.2 | 108 | 107 | 142 | 124 | 224 | 124 | 319 | 419 | 311 | 335 | 404 | 218 | 257 | 0 | 0 | 0 | 0 | 0 | ||||||||||||||||||
| Group 6 | 67.9 | 126 | 127 | 164 | 173 | 239 | 391 | 292 | 455 | 474 | 330 | 373 | 283 | 353 | 0 | 0 | 0 | 0 | 0 | ||||||||||||||||||
| Group 7 | 69.6 | 97.8 | 91.3 | 121 | 117 | 227 | 376 | 164 | 221 | 417 | 451 | 193 | 305 | 385 | 377 | 508 | 364 | 338 | 364 | ||||||||||||||||||
| Group 8 | 69.7 | 95.0 | 68.2 | 88.3 | 52.9 | 139 | 98.4 | 186 | 253 | 425 | 245 | 249 | 0 | 0 | 0 | 0 | 0 | 0 | 0 | ||||||||||||||||||
| Group 9 | 69.6 | 93.8 | 72.9 | 63.6 | 45.5 | 30.1 | 45.9 | 67.0 | 96.0 | 186 | 204 | 167 | 94.6 | 223 | 274 | 222 | 283 | 282 | 282 | ||||||||||||||||||
| Group 10 | 78.1 | 111 | 98.1 | 89.5 | 61.0 | 49.3 | 71.8 | 108 | 174 | 264 | 241 | 182 | 82.7 | 108 | 118 | 188 | 0 | 0 | 0 | ||||||||||||||||||
| (a) | |||||||||||||||||||||||||||||||||||||
| Day | 0 | 3 | 5 | 7 | 10 | 14 | 17 | 19 | 21 | 24 | 26 | 28 | 31 | 33 | 35 | 38 | 40 | 42 | 45 | ||||||||||||||||||
| Group 1 | 4.7 | 10.3 | 21.8 | 42.5 | 63.7 | 98.6 | 85.2 | 0 | 0 | ||||||||||||||||||||||||||||
| Group 2 | 4.6 | 21.7 | 29.7 | 62.4 | 77.5 | 61.4 | 90.3 | 83.5 | 0 | ||||||||||||||||||||||||||||
| Group 3 | 4.1 | 16.7 | 19.5 | 23.6 | 42.0 | 77.7 | 93.2 | 116 | 109 | 130 | 106 | 5.1 | 2.7 | ||||||||||||||||||||||||
| Group 4 | 4.7 | 12.1 | 21.5 | 34.9 | 77.4 | 105 | 103.9 | 119 | 157 | 64.5 | 98.8 | 144 | 0 | 0 | 0 | 0 | 0 | 0 | 0 | ||||||||||||||||||
| Group 5 | 4.6 | 13.0 | 23.1 | 27.9 | 29.6 | 61.7 | 34.9 | 91 | 118 | 93.3 | 127 | 146 | 111 | 132 | 0 | 0 | 0 | 0 | 0 | ||||||||||||||||||
| Group 6 | 4.3 | 15.6 | 21.9 | 31.2 | 33.3 | 66.1 | 109.7 | 87.5 | 127 | 153 | 103 | 118 | 129 | 162 | 0 | 0 | 0 | 0 | 0 | ||||||||||||||||||
| Group 7 | 4.6 | 5.6 | 14.7 | 23.5 | 26.4 | 71.0 | 113 | 47.7 | 68.2 | 130 | 129 | 78.9 | 110 | 134 | 132 | 159 | 167 | 155 | 167 | ||||||||||||||||||
| Group 8 | 4.0 | 6.7 | 10.8 | 21.0 | 13.3 | 49.0 | 40.3 | 84.2 | 105 | 137 | 99.5 | 100 | 0 | 0 | 0 | 0 | 0 | 0 | 0 | ||||||||||||||||||
| Group 9 | 4.5 | 7.2 | 7.9 | 10.3 | 10.0 | 10.0 | 19.6 | 30.9 | 41.1 | 84.5 | 75.8 | 66.8 | 30.6 | 76.3 | 96.3 | 91 | 127 | 127 | 127 | ||||||||||||||||||
| Group 10 | 5.4 | 4.3 | 6.3 | 10.7 | 8.3 | 13.4 | 25.4 | 43.6 | 62.7 | 95 | 99.8 | 90.8 | 50.2 | 65.9 | 71.7 | 114 | 0 | 0 | 0 | ||||||||||||||||||
Disclaimer/Publisher’s Note: The statements, opinions and data contained in all publications are solely those of the individual author(s) and contributor(s) and not of MDPI and/or the editor(s). MDPI and/or the editor(s) disclaim responsibility for any injury to people or property resulting from any ideas, methods, instructions or products referred to in the content. |
© 2025 by the authors. Licensee MDPI, Basel, Switzerland. This article is an open access article distributed under the terms and conditions of the Creative Commons Attribution (CC BY) license (http://creativecommons.org/licenses/by/4.0/).
Copyright: This open access article is published under a Creative Commons CC BY 4.0 license, which permit the free download, distribution, and reuse, provided that the author and preprint are cited in any reuse.


