
Submitted:
04 June 2025
Posted:
06 June 2025
You are already at the latest version
Abstract
New brain imaging modalities and neuropsychological testing tools are used to study neuronal changes in brain disorders such as mild traumatic brain injury (mTBI). Here we utilized diffusion tensor imaging (DTI) and Wisconsin Card Sorting Test (WCST) covariates to investigate patients with chronic mTBI. Neuropsychological assessments for mTBI are used to evaluate impairments across a broad spectrum of executive functions. Our study aims to examine the relationship between fractional anisotropy (FA) and WCST covariates in patients with chronic mTBI. We hypothesize that patients who suffered chronic mTBI have significantly reduced fractional anisotropy (FA) in frontal white matter regions in association with their significant deviation from standard percentile scores in WSCT. Utilizing multi-linear regression models alongside analyzing diffusion tensor imaging scans, WCST covariates were linearly regressed to produce positive and negative contrasts to identify specific regions of interest (ROI) with reduced FA. Results show that within a group of chronic mTBI patients, patients whose WCST covariates (such as percentage perseverative responses, conceptual response, categories completed responses) percentile scores significantly deviate beyond standard percentile scores and show lower fractional anisotropy in white matter regions mainly in the frontal cortex including the inferior frontal, superior frontal, and corpus callosum demonstrating executive function deficits that correlated with greater errors. This study investigates the correlation between Wisconsin Card Sorting Test (WCST) covariates and diffusion tensor imaging (DTI) as valuable tools in the diagnostic and prognostic evaluation of patients with a history of chronic traumatic brain injury and persistent cognitive impairment.
Keywords:
Wisconsin Card Sorting Test
; Diffusion Tensor Imaging
; Traumatic Brain Injury
; Executive Function
; Fractional Anisotropy
1. Introduction
Traumatic brain injury (TBI) is an alteration in normal brain function or any other evidence of brain pathology caused by an impact from external mechanical forces, such as a bump or jolt to the head, rapid acceleration or deceleration (typically from a fatal fall or vehicle accident), or penetration by a projectile (such as a gunshot wound). (Kumar et al., 2013). The latest statistics from the Centers for Disease Control and Prevention (CDC) showed around 61,000 TBI-related deaths in the United States in 2019, averaging 166 TBI-related deaths every day. The classification system for TBI, ranging from mild, to moderate to severe, is dependent on the resulting severity, duration of loss of consciousness, post-traumatic amnesia, and neuro-radiological evidence of cerebral damage. While the classification system is highly reliable for initial diagnosis, its prognostic value for long-term neuropsychological outcomes is limited and rarely considers premorbid factors, underlying structural damage, and the impact of non-neurological factors. (e.g., Ohtani et al., 2017; Kim et al., 2009) Though other regions may be involved, damage to the prefrontal cortex is strongly linked to executive dysfunction. Executive dysfunction on the quality of life in TBI patients can range from unawareness of executive dysfunction to intrusive and crippling symptoms that negatively affect daily activities, emotional well-being, and social interactions.
Multiple neuropsychological assessments of TBI are often administered during inpatient hospitalization or within clinical and research settings to aid in the indication of new and/or existing neurological complications in patients. Among various tests used to assess executive function, the most widely used within clinical and research settings is the Wisconsin Card Sorting Test (WCST). The WCST measures attention, working memory, concept formation, and set-shifting with previous research reporting a three-factor analysis on the WSCT that indicates sensitivity to cognitive processes including cognitive flexibility, problem-solving, and response maintenance (e.g., Ord et al., 2010, Greve et al., 2009; King et al., 2002). Due to the internal structure of the test, many researchers commonly rely on no more than two or three percentile scores to report a subject's performance, with the most popular including a perseverative response. Perseverative response is a persistent response made by participants after a rule switch. This is usually due to a failure to inhibit a prepotent response. Perseverative response has been cited as a consistent indicator of cognitive flexibility and executive control (e.g., Landry and Mitchell, 2021; Matsushita et al., 2011; King et al., 2002). There have been few studies (e.g., Anderson et al., 1991; Gonzalez et al., 2021; King et al, 2002) investigating the relation between executive dysfunction from neuropsychological testing and cerebral pathological changes in TBI as a significant deviation from standard percentile scores provides a subtle indication of impairment in executive function in frontal regions of the brain. In conjunction with WCST, the utility of diffusion tensor image (DTI) is a sensitive and novel modality that emerged over the years allowing for noninvasive evaluation of the pathophysiology of head trauma on white matter nerve fibers through tracking reduction in fractional anisotropy (FA) values.
Conventional MR imaging shows additional atrophic alterations due to white matter injury. Preference sites of traumatic axonal injury commonly seen in severe cases of TBI often include subcortical white matter, corpus callosum, internal capsules, and infratentorial white matter. In contrast, DTI imaging can detect white matter microstructural changes, making it useful in identifying white matter disruption early after injury such as for mTBI cases where conventional neuroradiological imaging is often not sensitive enough to detect any white matter injury (Kim et al., 2021). DTI quantifies the microstructure of white matter by measuring the directionality of the molecular diffusion of water and allows for the 3D reconstruction of white matter fibers through fiber-tracking algorithms. The property of molecular diffusion in white matter tracts is defined as “anisotropic diffusion” where water molecules travel rapidly along the direction of nerve fiber rather than in perpendicular directions (e.g., Rutgers et al., 2008). Anisotropic diffusion can be measured as a DTI parameter called fractional anisotropy (FA), a measurement of the direction consistency, where FA reduction corresponds to local loss of structural integrity. In mTBI, reduced FA has been seen in the corpus callosum, internal and external capsules, both in acute and chronic stages of axonal injury and is assumed to be more widespread in mTBI, mainly indicated by the global decrease of white matter FA. We hypothesized that that within a group of chronic mTBI patients, patients whose percentile scores significantly deviate within WCST explanatory covariates (such as percentage perseverative responses and categories completed responses) beyond national percentiles would show reduced fractional anisotropy in white matter regions mainly in the frontal cortex including the inferior frontal, superior frontal, and corpus callosum correlational to persisting executive function deficits.
2. Materials and Methods
15 participants who suffered from a concussion and had post-concussion cognitive symptoms were included by meeting the following criteria: (a) age between 18 and 75 years; (b) at least six months between injury and evaluation; (c) administration of the WCST and (ie. Ep, Enp, CatComp, CResp); and (d) no history of severe (i.e., inpatient) neuropsychiatric conditions. 15 chronic mTBI patients participated in an initial MRI scan including usable DTI and high-resolution T1-weighted brain scans from all patients. The mean age of the final group was 30.54 ±11.37 years; mean education was 13.26±1.62; and a total of 11 men and 4 women. The inclusion criteria for TBI consisted of involvement in a rapid impact injury to the brain (such as a motor vehicle accident or fall) causing a loss of consciousness. Evidence of brain injury included admittance for emergency medical attention for one of the following symptoms: loss of consciousness, a Glasgow Coma Scale (GCS) score either at the emergency room (ER) or upon hospital admission of less than or equal to 13. All TBI patients were at least six months from injury at their first visit, with an average duration of 2.5 years and a standard deviation of 1.3 years, depending on their availability and other medical issues related to their injury. Patients had no other significant neurological injury between their traumatic brain injury and the date of MRI DTI scan and neuropsychological testing.
Neuropsychological testing including WSCT was administered to assess frontal lobe function. WCST- Computer Version 4 was used. The computerized WCST presents four key cards and 128 response cards with geometric figures (i.e. square, triangle, circle, and star) varying in color, form, or number. The test starts by having the digitalized software present a stimulus card presented one at a time and in turn, the interviewee must select a card matching the stimulus according to a criterion. After each turn, the interviewers tell the interviewee if their answer is correct or not, with learning followed through trial and error. After the interviewee yields ten consecutive correct matches, the classification criterion shifts without warning, demanding flexible working memory and concept formation to concurrently store and utilize information from completed trials while processing new cards presented. Once completed, the total and percentage of the following scores are observed: number of errors, perseverative responses, perseverative errors, conceptual level responses, and non-perseverative errors.
MR imaging studies were performed on 3.0 T systems manufactured by Siemens or Philips Medical Systems. All images were processed for spatial normalization and smoothing using statistical parametric mapping software (SPM8). DTI images were normalized using the Functional Magnetic Resonance Imaging of the Brain Structure Software (FSL).
Contrasts were created via a multiple regression model via SPM8 on MatLab. 15 patient DICOM series were used alongside patient WCST percentile scores. Percentile scores adjusted as covariates centered with an overall mean and included intercept. Relative threshold implicit masking was applied with a threshold of 0.8. Global normalization was set to proportional with a grand mean scale value of 50. The global calculation was omitted. Estimated parameters generated SPM.mat contrast files where Positive (0 1) and Negative (0 -1) t-contrasts were created. Contrasts were adjusted with no applied masking, no p-value adjustments, threshold val = 0.01, and extent voxels = 30. Whole brain contrast masks and figures were then generated and saved for ROI processing.
Mean images for the 15 chronic mTBI patients were generated using SPM8 on MatLab. All 15 patients' DICOM NIFTI files were inputted into SPM8 “ImCalc” to generate mean images with the expression “mean(x)”. Images were read into the data matrix with no implicit zero masking, trilinear interpolation, and INT16-signed short data type.
Positive and Negative Transaxial Z-Maps were created by loading covariate the mean image and positive and negative contrasts into Vinci. Positive and negative contrasts were overlaid by the mean image to create Z-Maps with the following parameters X/Y: 5x4, Cross Marker: Uncheck Show, Skip Planes: 4, Range of Planes: first = 145, last = 50. Respective Positive and Negative prominent ROIs were then selected from Z-Maps for analysis with 15 patient NIFTI files loaded into Vinci and processed using the ROI 2D define tool. Coordinates taken from the SPM figure were plugged into the Talairach client to locate anatomical regions. Additional labels were also added from FslEyes if Talairach did not identify the region.
Region of interests were obtained from the positive and negative transaxial Z-map. Mean and SD values were then extracted from the ROIs and saved to a spreadsheet for comparison. Various regions of interest were administered voxel-by-voxel multi-linear regression t-tests by loading a mean image with contrast overlays into VINCI to be compared with 15 patient DTI image scans. The ROI approach tested specific structures throughout the brain with each ROI being manually located in an anatomically identifiable white matter tract on the Talairach Client that assigns Talairach Atlas labels for a given x,y,z coordinate.
Using the IBM Statistical Package for Social Sciences (SPSS), a single sample t-test was used to compare patient WCST percentile scores to standard percentile scores and allowed for normalization. Multiple linear regression analysis was performed to examine the relationship of WSCT explanatory covariates on the results of neuropsych test in brain regions with reduced FA (with particular focus on corpus callosum, corona radiata, frontal white matter, occipital white matter). Probability values of p <0.05 we considered to be significant. Regression graphs and data visualization were created in SPSS and Excel using cluster grams with respective trend lines.
Linear regression data was analyzed and interpreted using the established WCST percentile score protocol. Reduced WCST percentile scores in the perseverative, conceptual, and non-perseverative categories were indicated as lower performance and impaired executive function. Reduced FA values were associated with structural damage and TBI. (e.g., Matsushita et al., 2011; Rutgers et al., 2008) Higher FA was also noted in some reports as being present in chronic TBI patient populations. Higher FA, however, is less common and is usually associated with chronic inflammation or gliosis (Lipton et al. 2012, Benjamin et al. 2021). Linear regression data with a positive correlation was interpreted as an association between FA and WCST percentile scores. As FA values reduced, so did WCST percentile scores.
All linear regression data was then compiled together to produce a comprehensive facet scatterplot using R studio.
3. Results
3.1. Performance on WCST
3.1.1. WCST Performance Mean Percentile Scores
Regional areas with fractional anisotropy (FA) were correlated with Ep (perseverative response), Enp percentile scores (non-perseverative response), and CResp (conceptual response) via the SPM algorithm described above. Significant differences were observed on Ep (p = .006), Enp (p = .0075), and CResp (p=.0045) compared to standard control percentile scores on any of the examined covariates (p > .05). WCST percentile scores increase as performance improves. Standard normal controls tend to have higher WCST percentile scores on average, whereas chronic mTBI patients tend to have lower WCST percentile scores on average (See Table 1).
For each WCST category (Ep, CResp, and Enp), mean patient percentile scores are significantly lower than standard control percentile scores. Lower percentile scores indicate poorer performance in each WCST category. Patients performed poorer than standard controls on average in the WCST.
3.1.2. Variance Analysis
Variance analysis indicated significant group differences across perseverative response, non-perseverative response, and conceptual response categories. We observed a statistically significant relationship between the mean WCST perseverative percentile score of the chronic mTBI patient subjects, which was 15.27 ± 6.03 compared to the mean standard control WCST perseverative percentile score of 87.6 ± 9.85. There was a statistically significant positive linear relationship between reduced percentile scores for perseverative error and reduced FA in the left anterior thalamic radiation, right cingulate gyrus, and right superior longitudinal fasciculus regions (See Figure 1). No statistically significant negative correlations were observed in the perseverative response category.
In addition, we also observed a statistically significant difference between the mean chronic mTBI patient WCST non-perseverative score of 16.67 ± and the normal mean standard WCST non-perseverative error score of 93.46 ± 15.02. A statistically significant positive linear correlation can be observed between reduced non-perseverative percentile scores and reduced FA in the right corpus callosum (CC), right anterior thalamic radiation (ATR), and right frontal pole (See Figure 2). Statistically significant negative linear correlations can be observed for the following regions: Middle Cerebellar Peduncle, Anterior corona radiata, Anterior limb of the internal capsule, Left Inferior longitudinal fasciculus, and Right Superior longitudinal fasciculus (Figure 2).
There is also a statistical difference between the mean chronic mTBI patient WCST conceptual response score (61.2 ± 18.57) and the normal mean standard WCST conceptual response score (89.73 ± 11.96). We also observed a statistically significant positive linear relationship between reduced conceptual response percentile scores and reduced FA in the right superior longitudinal fasciculus, left lateral occipital cortex, and right cingulate gyrus (posterior division) regions (See Figure 3). Two statistically significant negative linear correlations were observed for conceptual response in the Right Middle Frontal Gyrus and Right Superior Frontal Gyrus, Frontal Pole regions (Figure 3).
3.2. DTI FA Analysis
3.2.1. Perseverative Response
Figure 1 shows transaxial images of key brain regions of interest including the Anterior thalamic radiation (ATR), Cingulate Gyrus, and Pre-Central Gyrus. It also shows FA values of each region correlated with perseverative response percentile scores through linear regression plots. In the X-axis, perseverative percentile scores are depicted. In the Y-axis, FA values are depicted. Reduced FA values are consistent indicators of TBI, and reduced perseverative percentile scores are associated with higher errors and poorer performance which is associated with cognitive impairment. A consistent positive association in 4 out of 4 correlations in this category validates the premise of the hypothesis that a decrease in FA results in poorer performance on the WCST.
3.2.2. Non-Perseverative Response
Figure 2 shows transaxial images of key brain regions of interest including the Anterior thalamic radiation (ATR), Corpus Callosum (CC), and Frontal Pole. These regions are correlated with reduced FA values and reduced non-perseverative response percentile scores in Excel to produce a scatterplot with the depicted correlations above. Reduced FA values are consistent indicators of TBI, and reduced non-perseverative percentile scores are associated with higher errors and poorer performance which is associated with cognitive impairment.
Contrary to the expected results, non-perseverative response percentile scores depict both positive and negative correlations, with 3 out of 9 correlations being positive correlations. The positive correlation is observed in the anterior thalamic radiation, corpus callosum, and frontal pole. The negative correlations are observed in the anterior corona radiata, superior longitudinal fasciculus, inferior longitudinal fasciculus, and Left Anterior limb of the internal capsule. The X-axis depicts the non-perseverative percentile scores (0-100 percentile) in each graph. The Y-axis displays FA values (0-1).
The regions that are positively correlated with non-perseverative percentile scores and FA values are involved in processing visual information and transmitting signals between the frontal and temporal lobes. The reduction in FA in these tracts may reflect disruptions in the brain's ability to integrate sensory information with higher-order cognitive processes, potentially explaining patients' difficulties with non-perseverative errors, which require adaptability and learning. For example, the CC has been known to facilitate communication between the two hemispheres of the brain, and its reduced integrity in chronic mTBI patients suggests that interhemispheric transfer of information may be impaired, contributing to deficits in higher-order conceptual processing. (e.g., In-Sung Kim et al., 2009)
The regions that are negatively correlated with non-perseverative percentile scores and FA values, may be exhibiting increased FA values due to chronic inflammation or gliosis. This phenomenon might also be what is causing the reduced percentile score performance in the non-perseverative response category in chronic mTBI patients. Though the current literature largely associates low FA with lower non-perseverative percentile scores, some studies have also reported high FA in chronic mTBI populations explained by a possibility of gliosis or chronic inflammation. Gliosis is a form of scarring of axonal tissue that is observed in some TBI populations that unpredictably affects water diffusion patterns in certain brain regions. This phenomenon is still being studied and much is still unknown about it (Lipton et al. 2012, Benjamin et al. 2021).
3.2.3. Conceptual Response
Figure 3 shows transaxial images of key brain regions of interest including the Right Superior Longitudinal Fasciculus, Right Cingulate Gyrus, and Left lateral occipital cortex, superior division. These regions are correlated with reduced FA values and reduced conceptual response percentile scores using Excel. In the X-axis conceptual response percentile scores are observed (0-100 percentile). In the Y-axis FA values are observed (0-1). Reduced FA values are consistent indicators of TBI, and reduced conceptual percentile scores are associated with higher errors and poorer performance which is associated with cognitive impairment. A relatively consistent positive association with 8 out of 10 correlations being positive in this category supports the premise of the hypothesis that a decrease in FA results in poorer performance on the WCST.
3.2.4. Analysis of Multi-Linear Regression
Multi-linear regression analysis was performed to collectively examine regions showing significant reduction of FA in participants with the corresponding WCST covariates (Ep, Enp, and CResp). Contrast and lesion-related adjustments were made in partial multilinear regression analyses, revealing significant connections between WCST covariates and specific left(L) and right(R) frontal-temporal and frontal-posterior white matter regions with reduced FA. Important correlates of reduced WCST percentile scores with probability values of p <0.05 were considered statistically significant. These statistically significant regional correlations are displayed in Figure 4.
The multi-linear regression analysis of the relationship between WSCT covariates and brain regions with abnormal FA values focused on the corpus callosum, frontal white matter, and occipital white matter. A statistically significant positive linear relationship was observed between reduced WSCT (Ep, Enp, CResp) percentile scores across all WCST categories and reduced FA in frontotemporal (CC, Frontal Pole, superior longitudinal fasciculus, anterior thalamic radiation, and middle frontal gyrus), temporal (lateral occipital cortex, inferior longitudinal fasciculus), limbic (anterior corona radiata), and fronto-posterior (middle cerebellar peduncle) regions.
Notably, there were positive correlations with the right frontal hemisphere FA (r = 0.62, p < 0.014) and left frontal hemisphere FA (r = 0.38, p = 0.01) for Ep, the left MCP, left anterior limb of the internal capsule, and left inferior longitudinal fasciculus (r = 0.66, p < 0.001) for Enp, and left and right frontal superior longitudinal fasciculus (SLF) (r = 0.56, p < 0.001) for CResp.
Overall, the multi-linear regression analysis largely found statistically significant positive correlations across all WCST categories (Ep, Enp, CResp) with a large majority of correlations displaying a positive trend. In particular, a positive correlation was observed consistently between reduced perseverative error percentile scores and reduced FA values in key frontal white matter regions, such as the left superior longitudinal fasciculus (SLF) (r = 0.38, p = 0.01), along with the cingulate gyrus and anterior thalamic radiation (ATR) (r = 0.62, p = 0.014). This suggests that patients who have reduced perseverative percentile scores (indicative of cognitive inflexibility) have reduced white matter integrity in these areas, which are critical for maintaining cognitive flexibility and executive control (e.g., Matsushita et al., 2011; King et al., 2002). The SLF connects frontal regions to parietal and occipital lobes, suggesting that reduced connectivity could contribute to difficulties in task-switching and working memory.
Figure 4, is a facet scatterplot produced in R Studio. It compiles all of the statistically significant data points and correlations into one medium, and summarizes the multi-linear regression analysis. Panels on the left side show regions in the left (L) frontal-temporal and frontal-posterior white matter regions, while panels on the right side show regions in the right(R) frontal-temporal and frontal-posterior regions. The topmost panels show regions mapped using negative z-maps (0) and the bottom panels show regions mapped using positive z-maps (1). In each panel, WCST Percentile Scores from each WCST category (Cresp, Ep, and Enp) are displayed in correlation with FA values at a specific brain region (L/R) that was mapped out from a specific kind of z-map (0/1).
6 out of 8 of the correlations observed in the facet scatterplot were positive associations between WCST percentile scores and FA values. This supported the overall data from all the correlations in the study. Positive correlations mean that as WCST Percentile scores decrease across all WCST categories, FA values also decrease. Lower WCST Percentile scores mean poorer performance on the test and reduced executive function. Lower FA values are associated with mTBI (Matsushita et al., 2011; Rutgers et al., 2008).
In the perseverative response (Ep) category, 2 statistically significant positive correlations are displayed between perseverative percentile scores and FA values in the left and right frontotemporal and frontal-posterior white matter regions derived from positive z-maps. These regions include regions 1.1 (Left Anterior thalamic radiation) and 1.2 (Left Anterior thalamic radiation) on the bottom left panel shown above. Regions 1.3 (Right Cingulate Gyrus) and 1.4 (Right Pre-Central Gyrus) are shown on the bottom right panel. The positive correlations in these specific regions suggest that as perseverative percentile scores decrease, FA values also decrease. DTI FA data is validated by WCST perseverative percentile score data in the anterior thalamic radiation, cingulate gyrus, and superior longitudinal fasciculus.
2 overall positive correlations were also observed between non-perseverative (Enp) percentile scores and FA values in the left and right frontotemporal and frontal-posterior regions derived from negative z-maps (0). These regions include regions 2.4 (Left Cerebellum, Posterior Lobe, Inferior Semi-Lunar Lobule, Middle cerebellar peduncle), 2.6 (Left Anterior limb of internal capsule), and 2.7 (Left Inferior longitudinal fasciculus) which were correlated together in the top left panel. Regions 2.5 (Right Anterior Cingulate, Anterior corona radiata), 2.8 (Right Superior longitudinal fasciculus), and 2.9 (Right Superior longitudinal fasciculus) displayed in the top right panel, were correlated together. When correlated individually, the regions express both positive and negative correlations in the non-perseverative correlations across all regions (Figure 2). However, when data points from multiple regions are correlated together in the FA scatterplot, positive correlations are observed. These overall positive correlations mean that as non-perseverative percentile scores decrease, so do FA values. DTI FA data is validated by WCST non-perseverative percentile scores.
2 positive correlations were also observed between conceptual response (Cresp) percentile scores (Cresp) and FA values in the left and right frontotemporal and frontal-posterior regions derived from positive z-maps (1). The correlation of Region 3.2 (Left Lateral Occipital Cortex, Superior Division) is depicted on the bottom left panel. In the bottom right panel, regions 3.1 (Right Superior Longitudinal Fasciculus), 3.3 (Right Precentral Gyrus, Superior Longitudinal Fasciculus), 3.4 (Right Superior longitudinal fasciculus), 3.5 (Right Middle Frontal Gyrus, Superior longitudinal fasciculus), 3.6 (Right Cingulate Gyrus, Posterior Division), 3.7 (Right Superior longitudinal fasciculus), and 3.8 (Right Superior longitudinal fasciculus) are correlated together with conceptual response percentile scores. Positive correlations in this category mean that as conceptual response percentile scores decrease, so do FA values. DTI FA data is validated by WCST conceptual response percentile scores.
4. Discussion
This study investigated the correlation between WCST covariates and DTI covariates using atlas-based methods in patients with a history of mTBI (concussion) and persistent cognitive impairment. The WCST is a widely used clinical screening tool for cognitive impairment that measures four cognitive domains including attention, working memory, concept formation, and set-shifting (flexibility). DTI allows for the detection of physiological changes in white matter tracts by observing changes in fractional anisotropy (FA) and mean diffusivity. Anatomically, given their site at the front of the brain and their large size, the frontal lobes are particularly vulnerable to TBI with memory, attention, and cognitive shifting functions being the most frequently affected domains in mTBI. (Gonzales et al., 2021; Sherer et al., 2003; Greve et al., 2002) This study has 2 major findings. First, patients with mild TBI typically scored in lower percentiles compared with the national average and had multiple white matter regions with reduced FA in their brain scans, predominantly involving cerebral white matter, frontal pole, and corpus callosum. There was no significant relation between the time interval after injury and our DTI and fiber tracking findings.
There is a shortage of standardized techniques for detecting and predicting the potential long-term effects of traumatic brain injuries. mTBI is a clinical diagnosis due to the absence and limitation of validated diagnostic biomarkers (Hier et al., 2021). Several studies have examined the role of DTI in mTBI. A study by Arfanakis et al (2002)., described five patients with mTBI who underwent DTI within the first 24 hours of presenting to the emergency room. Arfanakis found regions of diffuse axonal injury that appeared normal with conventional neuroimaging. DTI in the acute phase can show changes due to cerebral edema that can be reversible and therefore doesn’t reflect the chronic brain changes related to cognitive impairment. Predicting cognitive outcomes is an integral part of the early rehabilitation process, medical care, and experimental therapies that are aimed at improving long-term prognosis. Many publications have demonstrated the usefulness of DTI in detecting microstructural disruption in concussions.
Several studies have applied other methods to have a better understanding of the anatomical changes post-concussion and how these changes can affect cognitive function. A reduction of total brain volume and cerebral atrophy are common and well-established outcomes of TBI. Previous publications have analyzed subtle volumetric changes to predict clinical outcomes post-TBI based on segmentation techniques available in Free Surfer. A study by Warner et al. found a relationship between cognitive deficits in neuropsychological domains in 24 patients with post-traumatic axonal injury (TAI) with white matter integrity and regional brain volumes. Warner’s study concluded that regional morphometrics were correlated with deficits in cognitive outcomes with volumes of gray matter structures being strongly associated with chronic damage to related white matter tracts and less associated with measures of white matter integrity in acute scans. (Warner et al., 2021) Other studies have also found that certain brain regions such as the corpus callosum, cerebellar peduncles, and corona radiata, and several associative fiber bundle systems were particularly vulnerable to atrophy post-trauma and have significant values when predicting functional outcome. (Mallot et al., 2019, Bendlin et al., 2008, Kraus et al., 2007) Therefore, brain volume and cortical tract integrity are useful tools when assessing cognitive prognosis in post-TBI patients. This study was focused on microstructural changes and their correlation with WCST covariate scores.
In the present study, WCST explanatory covariates correlate with DTI-derived scalar measures (FA) revealing WCST covariates as indicators of change in white matter integrity in multiple brain regions. Using multi-linear regression, results show multiple significant ROIs in correlation with WCST explanatory covariates, specifically perseverative response, non-perseverative response, and conceptual response. These covariates highlighted significantly lower FA values in white matter tracts in nine preference sites mainly in the frontal lobe, posterior, temporal, sub-lobar, and limbic regions. This study adds to the literature by replicating previous findings, including statistically significant relationships between validity indicators of neuropsych pre-screenings (WCST covariates) and regional FA values to help detect TBI as evidenced by their ability to somewhat effectively discriminate brain regions impacted by head injury or impact. (e.g., Gläscher et al., 2019; Gomez et al., 2020; Sherer et al., 2003) Several studies on mTBI (e.g., Bendlin et al., 2008; Douglas et al., 2015) have demonstrated a reduction in white matter (WM) integrity in specific tracts., mostly in the forceps minor, major of the corpus callosum, frontal-occipital fasciculus, in patients with “chronic” mTBI. Furthermore, these results add to coinciding evidence developing in support of the clinical utility of DTI in predicting outcome post-injury. Though chronic mTBI has been studied through DTI before, this study is one of the first to measure DTI validity directly through the lens of WCST covariates in this particular chronic mTBI patient population.
Regarding the main findings, for perseverative response percentile scores, four main frontal lobe regions including the Superior longitudinal fasciculus, Anterior thalamic radiation, Optic tract, and Middle Cerebellar Peduncle, were positively correlated with reduced FA values in the white matter tract associated with reduced perseverative response percentile scores. Conceptual response and non-perseverative scores had significant frontal lobe regions such as the Superior Longitudinal Fasciculus, Occipital Cortex, Cingulate Gyrus, Corpus Callosum, Anterior Thalamic Radiation, and Frontal Pole that were positively correlated with lower FA values and reduced conceptual response percentile scores. Contrary to our hypothesis, there were no significant correlations between WCST categories completed and tensor measures. Our results are consistent with previous literature as WCST percentile scores are a considerably accurate measure in correlating reduced executive performance to brain regions; predominantly the frontal pole and corpus callosum were impacted (e.g., Kim E et al., 2021, Kim E et al., 2009).
There is a positive correlation with reduced FA values in the frontal lobe, sub-lobar, and posterior lobe specifically in the superior longitudinal fasciculus, anterior thalamic radiation, and middle-cerebellar peduncle for patients with lower perseverative response percentile scores. The lower the score, the poorer the performance due to mental inflexibility and insight difficulty. This suggests selective neurodegeneration in significant regions. A perseverative response occurs when a participant matches a card using the same criterion (color, form, or number) used in the immediate previous match, regardless of whether the response is correct or not. Perseverative errors suggest an incapacity to inhibit a learned response despite knowing from feedback that the response is incorrect. To measure executive function, the greater the dysfunction, the higher the score in perseverative errors, and the lower the percentile score.
For conceptual percentile scores, there was a positive correlation with lower FA values in the frontal lobe, specifically in the superior longitudinal fasciculus for patients with higher conceptual response percentile scores. Conceptual level responses refer to the ability to maintain a set for three consecutive responses regardless of the criteria of ten correct.
Conflicting results were observed in the non-perseverative response category. Results showed both a negative and positive correlation in different regions of the brain. In the limbic, ILF, and sub-lober regions, a negative correlation was observed. Whereas, in the corpus callosum, anterior thalamic radiation, and frontal pole a positive correlation was observed.
The negative correlations in the non-perseverative and conceptual response categories contradict the premise of the hypothesis that FA reduction is associated with reduced non-perseverative percentile scores. These results indicate that higher FA is associated with poorer performance in the non-perseverative category. While most DTI studies associate low FA values with TBI, a handful of reports say the same for high FA (e.g., Mayer et al., 2010, Wilde et al., 2008). The literature's discrepancy regarding high and low FA may stem from differences in acute and chronic injury. Findings of high FA in TBI patients may be limited to acute cases where cytotoxic edema has caused an influx of water into axons' intracellular space (e.g., Ling et al., 2012, Mayer et al., 2010). In contrast, low FA may characterize a later stage of neuropathology involving demyelination and axonal degeneration. Some literature also observed higher FA in chronic mTBI populations due to possible chronic inflammation, gliosis, or axonal scarring that alters the pattern of water diffusion in white matter tracts (Lipton et al. 2012, Benjamin et al. 2021). The mechanism of this phenomenon is not completely understood yet. However, it may explain why abnormally high FA was observed in some regions in the non-perseverative and conceptual response correlations.
The positive correlations observed in the non-perseverative category support the premise of our hypothesis that lower FA is associated with lower WCST percentile scores, poorer performance, and higher errors. For the non-perseverative category specifically, this correlation indicates that patients with lower non-perseverative percentile scores have difficulties in forming concepts and having insights even with flexible answers. mTBI patients have lower FA in white matter tracts of the genus of corpus callosum and midbrain. From previous studies, this could suggest that axonal myelination during maturation may be altered in mTBI where we found reduced FA in patients with brain trauma that wasn't progressive (e.g., In-Sung Kim et al., 2009; King et al., 2002). The significant correlations between reduced conceptual responses and reduced FA in the corpus callosum highlight the role of interhemispheric communication in cognitive flexibility. Damage to the corpus callosum, as indicated by reduced FA, has been shown to impair coordination between hemispheres, which may explain deficits in maintaining a set of responses or conceptualizing task rules.
The cause of FA reduction in brain white matter in TBI has not been fully understood. Generally, previous literature has attributed the cause to a change in lobule structure. Structural changes could occur from multiple sources including misalignment of fibers, brain swelling (edema), axonal degeneration, or fiber disruption. (e.g., Matsushita et al., 2011; Rutgers et al., 2008) Chronic injuries can be difficult to recognize on imaging if they are small and peripherally located. However, decreases in FA are sensitive indicators of histological abnormality. Since FA values are lower in gray matter than in white matter and measurements are affected by noise in the gray matter area, the interpretation of FA reduction in gray matter is more difficult than in white matter. Therefore, precursor neuropsychological testing, specifically the relationships between WCST performance and the values of tensor measures, allows for the identification of altered myelination as a possible source of FA reduction (e.g., Anderson et al., 1991; Kumar et al., 2013). Correlation analysis revealed multiple statically significant correlations between various total WCST covariate percentile scores and FA regions in white matter. Data from this study demonstrates that patients whose percentile scores significantly deviate within explanatory covariates, such as perseverative responses, non-perseverative responses, categories completed responses, and conceptual percentile scores beyond standard percentile scores show lower FA in white matter regions; with an emphasis on demonstrating executive function deficits in the interior frontal, superior frontal, and corpus callosum.
DTI is sensitive to both changes in WM integrity over time as well as to acute WM injury in TBI, thus DTI may be a useful tool for measuring some elements of the WM alterations that occur after TBI (e.g., Arfanakis et al., 2002; Naganawa et al., 2004). However, a few limitations of this study must be considered starting with how we define regions with abnormally reduced FA. The interpretation of reduced FA as a marker of WM damage should be considered with caution as FA can be related to several tissue characteristics such as axon density, axon diameter, degree of myelination, and alignment of fibers within a voxel and partial volume effects. We also did not examine the role of other key individual covariates, such as individual differences in emotional regulation that have been linked to attention control processes. Longitudinal and further studies are needed. Careful integration with neuropsychological measures of working memory, processing speed, and other cognitive functions will result in a better overall understanding of prognosis and long-term outcomes in TBI. We compared patients with a mean image in a voxel-based ROI z-score analysis. Since ROIs were done manually, this may cause an overestimation of lesion size in these regions (e.g., Greve et al., 2002). Categories Completed (CatComp) as a covariate did not lead to any statistically significant results as there were no comparable differences between patient mean percentile scores and standard mean percentile scores. In addition, FA differences for CatComp did not reach statistical significance due to relatively small statistical power and led to statistical skewing.
Although WCST is the most used and perhaps the best-validated measure of executive functions, many issues remain complicated in both individual evaluation and group comparisons. Findings from other research have shown that performance on the WCST cannot be interpreted in isolation as an index of frontal lobe damage. (e.g., Mountain et al.,1993; Anderson et al., 1991). In general, applying conservative cognitive malingering cutoffs to classify deficient effort may also fail to identify patients with more complex psychosocial complications that could potentially impact motivation and the resulting test validity. Our multiple linear regression analysis demonstrates that specific executive dysfunctions, as captured by WCST covariates, are associated with microstructural white matter damage in regions crucial for executive functioning and cognitive control. For example, the positive correlation between reduced perseverative response percentile scores and reduced FA in the frontal white matter regions like the SLF is consistent with prior findings that show the frontal lobes are particularly vulnerable in traumatic brain injury (TBI), and these regions are responsible for higher-order cognitive tasks, including decision-making and problem-solving (e.g., Sherer et al., 2003; Greve et al., 2002). Patients may display this pattern as these measures are exclusive as excessive perseverative errors lead to non-perseverative covariates being insignificant as there is nothing left to measure. In addition, the regression values could be inaccurate due to how the multi-linear regression model was adopted from a PET study.
5. Conclusions
In conclusion, results show that within a group of mTBI patients, patients whose percentile scores significantly deviate within WCST covariates (such as percentile perseverative responses, percentile non-perseverative responses, percentile conceptual responses) beyond standard percentile scores show lower fractional anisotropy in white matter regions mainly in the frontal cortex including the superior longitudinal fasciculus, anterior corona radiata, frontal pole, and the corpus callosum demonstrating executive function deficits. Our results are consistent with previous literature as WCST covariates are a considerably accurate measure in correlating reduced executive performance to brain regions and strongly support the hypothesis that WCST performance in mTBI patients is associated with specific patterns of white matter disruption (e.g., King et al., 2002; In-Sung Kim et al., 2009). The findings contribute to our understanding of how executive dysfunction after mTBI is linked to structural brain damage, with important implications for rehabilitation strategies focused on improving cognitive flexibility and processing speed in these patients. Although many types of neuropsychological diagnoses are utilized in such cases, it has been found that WCST can highlight a significant correlation between TBI and test performances. It may be suggested significant deviation of WCST percentile scores in specific covariates indicates potential traumatic axonal injury in white matter as evidenced by a reduction in FA in white matter tracts as shown in DTI. The purpose of this study was to test the hypothesis that patients with post-concussion cognitive impairment have DTI-derived neuroimaging biomarkers specifically associated with poorer-performing WCST covariates.
Abbreviations
The following abbreviations are used in this manuscript:
| ROI | Region of Interest |
| FA | Fractional Anisotropy |
| WCST | Wisconsin Card Sorting Test |
| DTI | Diffusion Tensor Imaging |
| Ep | Perseverative Response |
| Enp | Non-Perseverative Response |
| Cresp | Conceptual Response |
| TBI | Traumatic Brain Injury |
| mTBI | Mild Traumatic Brain Injury |
| CC | Corpus Callosum |
| ATR | Anterior Thalamic Radiation |
| SLF | Superior Longitudinal Fasciculus |
| ILF | Inferior Longitudinal Fasciculus |
| MCP | Middle Cerebellar Peduncle |
Appendix A
Appendix A.1
To produce the facet scatterplot, data was first split categorically into multiple different columns in Excel (FA Values, WCST Category, WCST Percentile Score, Brain Hemisphere, and Contrasts). The Excel sheet containing the data file was then imported into R studio and the following code was run:
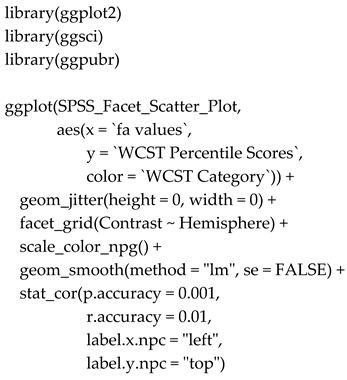
Libraries in R Studio were called (ggplot2, ggsci, ggpubr). In the ggplot function, the name of the Excel file was added to call the data in the file. The aesthetic (aes) function was used to define the main X-Y variables in the scatterplot (WCST percentile scores, and FA values). The “geom_jitter” function defined the height and width of the plot. The facet grid function defined the contrast and hemisphere columns in Excel as sections in the facet grid. The “scale_color_npg()” and ”geom_smooth” functions defined additional aesthetics of the visual. The “stat_cor” functions ran statistical correlations on the data points and displayed p-values and R-values for each correlation.
References
- Kumar, S.; Rao, S.L.; Chandramouli, B.A.; Pillai, S. Reduced contribution of executive functions in impaired working memory performance in mild traumatic brain injury patients. Clin. Neurol. Neurosurg. 2013, 115, 1326–1332. [Google Scholar] [CrossRef] [PubMed]
- Ohtani, T.; Nestor, P.G.; Bouix, S.; Newell, D.; Melonakos, E.D.; McCarley, R.W.; Shenton, M.E.; Kubicki, M. Exploring the neural substrates of attentional control and human intelligence: Diffusion tensor imaging of prefrontal white matter tractography in healthy cognition. Neuroscience 2017, 341, 52–60. [Google Scholar] [CrossRef] [PubMed]
- Kim, I.S.; Kim, Y.T.; Song, H.J.; Lee, J.J.; Kwon, D.H.; Lee, H.J.; Kim, M.N.; Yoo, D.S.; Chang, Y. Reduced corpus callosum white matter microstructural integrity revealed by diffusion tensor eigenvalues in abstinent methamphetamine addicts. Neurotoxicology 2009, 30, 209–213. [Google Scholar] [CrossRef]
- Ord, J.S.; Greve, K.W.; Bianchini, K.J.; Aguerrevere, L.E. Executive dysfunction in traumatic brain injury: the effects of injury severity and effort on the Wisconsin Card Sorting Test. J. Clin. Exp. Neuropsychol. 2010, 32, 132–140. [Google Scholar] [CrossRef]
- Greve, K.W.; Heinly, M.T.; Bianchini, K.J.; Love, J.M. Malingering detection with the Wisconsin Card Sorting Test in mild traumatic brain injury. Clin. Neuropsychol. 2009, 23, 343–362. [Google Scholar] [CrossRef]
- King, J.H.; Sweet, J.J.; Sherer, M.; Curtiss, G.; Vanderploeg, R.D. Validity indicators within the Wisconsin Card Sorting Test: application of new and previously researched multivariate procedures in multiple traumatic brain injury samples. Clin. Neuropsychol. 2002, 16, 506–523. [Google Scholar] [CrossRef]
- Landry, O.; Mitchell, P. An examination of perseverative errors and cognitive flexibility in autism. PLoS One 2021, 16, e0223160. [Google Scholar] [CrossRef] [PubMed]
- Matsushita, M.; Hosoda, K.; Naitoh, Y.; Yamashita, H.; Kohmura, E. Utility of diffusion tensor imaging in the acute stage of mild to moderate traumatic brain injury for detecting white matter lesions and predicting long-term cognitive function in adults. J. Neurosurg. 2011, 115, 130–139. [Google Scholar] [CrossRef]
- Anderson, S.; Damasio, H.; Jones, R.D.; Tranel, D. Wisconsin Card Sorting Test Performance as a Measure of Frontal Lobe Damage. J. Clin. Exp. Neuropsychol. 1991, 13, 909–922. [Google Scholar] [CrossRef]
- Gonzalez, A.C.; Kim, M.; Keser, Z.; Ibrahim, L.; Singh, S.K.; Ahmad, M.J.; Hasan, O.; Kamali, A.; Hasan, K.M.; Schulz, P.E. Diffusion Tensor Imaging Correlates of Concussion Related Cognitive Impairment. Front. Neurol. 2021, 12, 639179. [Google Scholar] [CrossRef]
- Kim, E.; Seo, H.G.; Lee, H.H.; Lee, S.H.; Choi, S.H.; Yoo, R.E.; Cho, W.S.; Yun, S.J.; Kang, M.G.; Oh, B.M. Reduced Brainstem Volume After Mild Traumatic Brain Injury. Am. J. Phys. Med. Rehabil. 2021, 100, 473–482. [Google Scholar] [CrossRef] [PubMed]
- Rutgers, D.R.; Toulgoat, F.; Cazejust, J.; Fillard, P.; Lasjaunias, P.; Ducreux, D. White matter abnormalities in mild traumatic brain injury: a diffusion tensor imaging study. AJNR Am. J. Neuroradiol. 2008, 29, 514–519. [Google Scholar] [CrossRef] [PubMed]
- Lipton, M.L.; Kim, N.; Park, Y.K.; Hulkower, M.B.; Gardin, T.M.; Shifteh, K.; Kim, M.; Zimmerman, M.E.; Lipton, R.B.; Branch, C.A. Robust Detection of Traumatic Axonal Injury in Individual Mild Traumatic Brain Injury Patients: Intersubject Variation, Change Over Time and Bidirectional Changes in Anisotropy. Brain Imaging and Behavior 2012, 6, 329–342. [Google Scholar] [CrossRef] [PubMed]
- Benjamini, D.; Iacono, D.; Komlosh, M.E.; Perl, D.P.; Brody, D.L.; Basser, P.J. Diffuse Axonal Injury has a Characteristic Multidimensional MRI Signature in the Human Brain. Brain 2021, 144, 800–816. [Google Scholar] [CrossRef]
- Sherer, M.; Nick, T.G.; Millis, S.R.; Novack, T.A. Use of the WCST and the WCST-64 in the assessment of traumatic brain injury. J. Clin. Exp. Neuropsychol. 2003, 25, 512–520. [Google Scholar] [CrossRef]
- Greve, K.W.; Love, J.M.; Sherwin, E.; Mathias, C.W.; Ramzinski, P.; Levy, J. Wisconsin Card Sorting Test in chronic severe traumatic brain injury: factor structure and performance subgroups. Brain Inj. 2002, 16, 29–40. [Google Scholar] [CrossRef]
- Hier, D.B.; Obafemi-Ajayi, T.; Thimgan, M.S.; Olbricht, G.R.; Azizi, S.; Allen, B.; Hadi, N.F.; Wunsch, D.C. Blood biomarkers for mild traumatic brain injury: a selective review of unresolved issues. Biomark. Res. 2021, 9, 70. [Google Scholar] [CrossRef]
- Warner, M.A.; Marquez de la Plata, C.; Spence, J.; et al. Assessing spatial relationships between axonal integrity, regional brain volumes, and neuropsychological outcomes after traumatic axonal injury. J. Neurotrauma 2010, 27, 2121–2130. [Google Scholar] [CrossRef]
- Mallott, J.M.; Palacios, E.M.; Maruta, J.; Ghajar, J.; Mukherjee, P. Disrupted White Matter Microstructure of the Cerebellar Peduncles in Scholastic Athletes After Concussion. Front. Neurol. 2019, 10, 518. [Google Scholar] [CrossRef]
- Bendlin, B.B.; Ries, M.L.; Lazar, M.; Alexander, A.L.; Dempsey, R.J.; Rowley, H.A.; Sherman, J.E.; Johnson, S.C. Longitudinal Changes in Patients with Traumatic Brain Injury Assessed with Diffusion-Tensor and Volumetric Imaging. NeuroImage 2008, 42, 503–514. [Google Scholar] [CrossRef]
- Kraus, M.F.; Susmaras, T.; Caughlin, B.P.; Walker, C.J.; Sweeney, J.A.; Little, D.M. White matter integrity and cognition in chronic traumatic brain injury: a diffusion tensor imaging study. Brain 2007, 130, 2508–2519. [Google Scholar] [CrossRef] [PubMed]
- Gläscher, J.; Adolphs, R.; Tranel, D. Model-based lesion mapping of cognitive control using the Wisconsin Card Sorting Test. Nat. Commun. 2019, 10, 20. [Google Scholar] [CrossRef] [PubMed]
- Gómez-de-Regil, L. Assessment of Executive Function in Patients with Traumatic Brain Injury with the Wisconsin Card-Sorting Test. Brain Sci. 2020, 10, 699. [Google Scholar] [CrossRef]
- Douglas, D.B.; Iv, M.; Douglas, P.K.; Anderson, A.; Vos, S.B.; Bammer, R.; Zeineh, M.; Wintermark, M. Diffusion Tensor Imaging of TBI: Potentials and Challenges. Top. Magn. Reson. Imaging 2015, 24, 241–251. [Google Scholar] [CrossRef]
- Mayer, A.R.; Ling, J.; Mannell, M.V.; Gasparovic, C.; Phillips, J.P.; Doezema, D.; Reichard, R.; Yeo, R.A. A Prospective Diffusion Tensor Imaging Study in Mild Traumatic Brain Injury. Neurology 2010, 74, 643–650. [Google Scholar] [CrossRef]
- Wilde, E.A.; McCauley, S.R.; Hunter, J.V.; Bigler, E.D.; Chu, Z.; Wang, Z.J.; Hanten, G.R.; Troyanskaya, M.; Yallampalli, R.; Li, X.; Chia, J.; Levin, H.S. Diffusion Tensor Imaging of Acute Mild Traumatic Brain Injury in Adolescents. Neurology 2008, 70, 948–955. [Google Scholar] [CrossRef] [PubMed]
- Ling, J.M.; Peña, A.; Yeo, R.A.; Merideth, F.L.; Klimaj, S.; Gasparovic, C.; Mayer, A.R. Biomarkers of increased diffusion anisotropy in semi-acute mild traumatic brain injury: a longitudinal perspective. Brain 2012, 135, 1281–1292. [Google Scholar] [CrossRef]
- Kim, I.-S.; Kim, Y.-T.; Song, H.-J.; Lee, J.-J.; Kwon, D.-H.; Lee, H.J.; Kim, M.-N.; Yoo, D.-S.; Chang, Y. Reduced Corpus Callosum White Matter Microstructural Integrity Revealed by Diffusion Tensor Eigenvalues in Abstinent Methamphetamine Addicts. NeuroToxicology 2009, 30, 209–213. [Google Scholar] [CrossRef]
- Arfanakis, K.; Haughton, V.M.; Carew, J.D.; Rogers, B.P.; Dempsey, R.J.; Meyerand, M.E. Diffusion tensor MR imaging in diffuse axonal injury. AJNR Am. J. Neuroradiol. 2002, 23, 794–802. [Google Scholar]
- Naganawa, S.; Sato, C.; Ishihra, S.; Kumada, H.; Ishigaki, T.; Miura, S.; Watanabe, M.; Maruyama, K.; Takizawa, O. Serial Evaluation of Diffusion Tensor Brain Fiber Tracking in a Patient with Severe Diffuse Axonal Injury. American Journal of Neuroradiology 2004, 25, 1553–1556. [Google Scholar]
- Mountain, M.A.; Snow, W.G. Wisconsin card sorting test as a measure of frontal pathology: A review. Clin. Neuropsychol. 1993, 7, 108–118. [Google Scholar] [CrossRef]
- Hanks, R.; Millis, S.; Scott, S.; Gattu, R.; O'Hara, N.B.; Haacke, M.; Kou, Z. The relation between cognitive dysfunction and diffusion tensor imaging parameters in traumatic brain injury. Brain Inj. 2019, 33, 355–363. [Google Scholar] [CrossRef] [PubMed]
- Warner, M.A.; De La Plata, C.M.; Spence, J.; Wang, J.Y.; Harper, C.; Moore, C.; et al. Assessing spatial relationships between axonal integrity, regional brain volumes, and neuropsychological outcomes after traumatic axonal injury. J. Neurotrauma 2010, 27, 2121–2130. [Google Scholar] [CrossRef] [PubMed]
- Matsui, H.; Nishinaka, K.; Oda, M.; Niikawa, H.; Komatsu, K.; Kubori, T.; Udaka, F. Wisconsin Card Sorting Test in Parkinson's disease: diffusion tensor imaging. Acta Neurol. Scand. 2007, 116, 108–112. [Google Scholar] [CrossRef]
- National Center for Injury Prevention and Control. Report to Congress on Mild Traumatic Brain Injury in the United States: Steps to Prevent a Serious Public Health Problem; Centers for Disease Control and Prevention: Atlanta, GA, USA, 2003. [Google Scholar]
- Ord, J.S.; Greve, K.W.; Bianchini, K.J.; Aguerrevere, L.E. Executive dysfunction in traumatic brain injury: the effects of injury severity and effort on the Wisconsin Card Sorting Test. J. Clin. Exp. Neuropsychol. 2010, 32, 132–140. [Google Scholar] [CrossRef]
Figure 1.
Perseverative Response Regions of Interest.
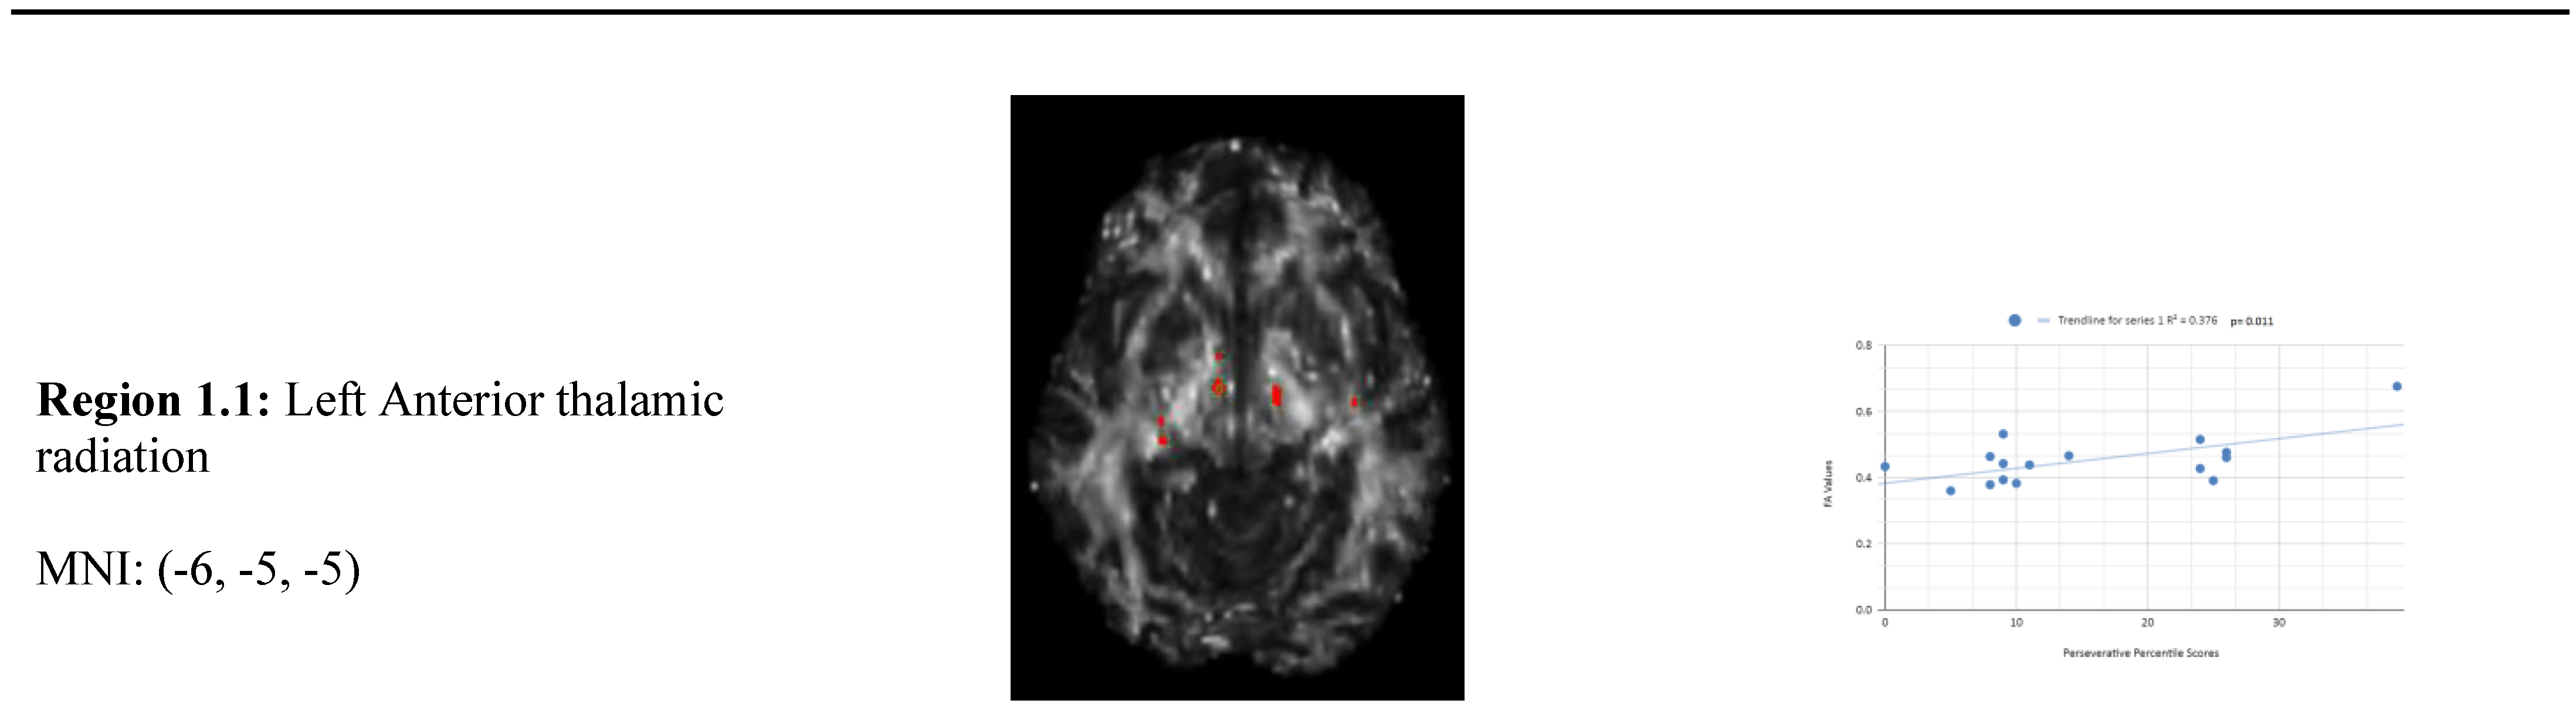
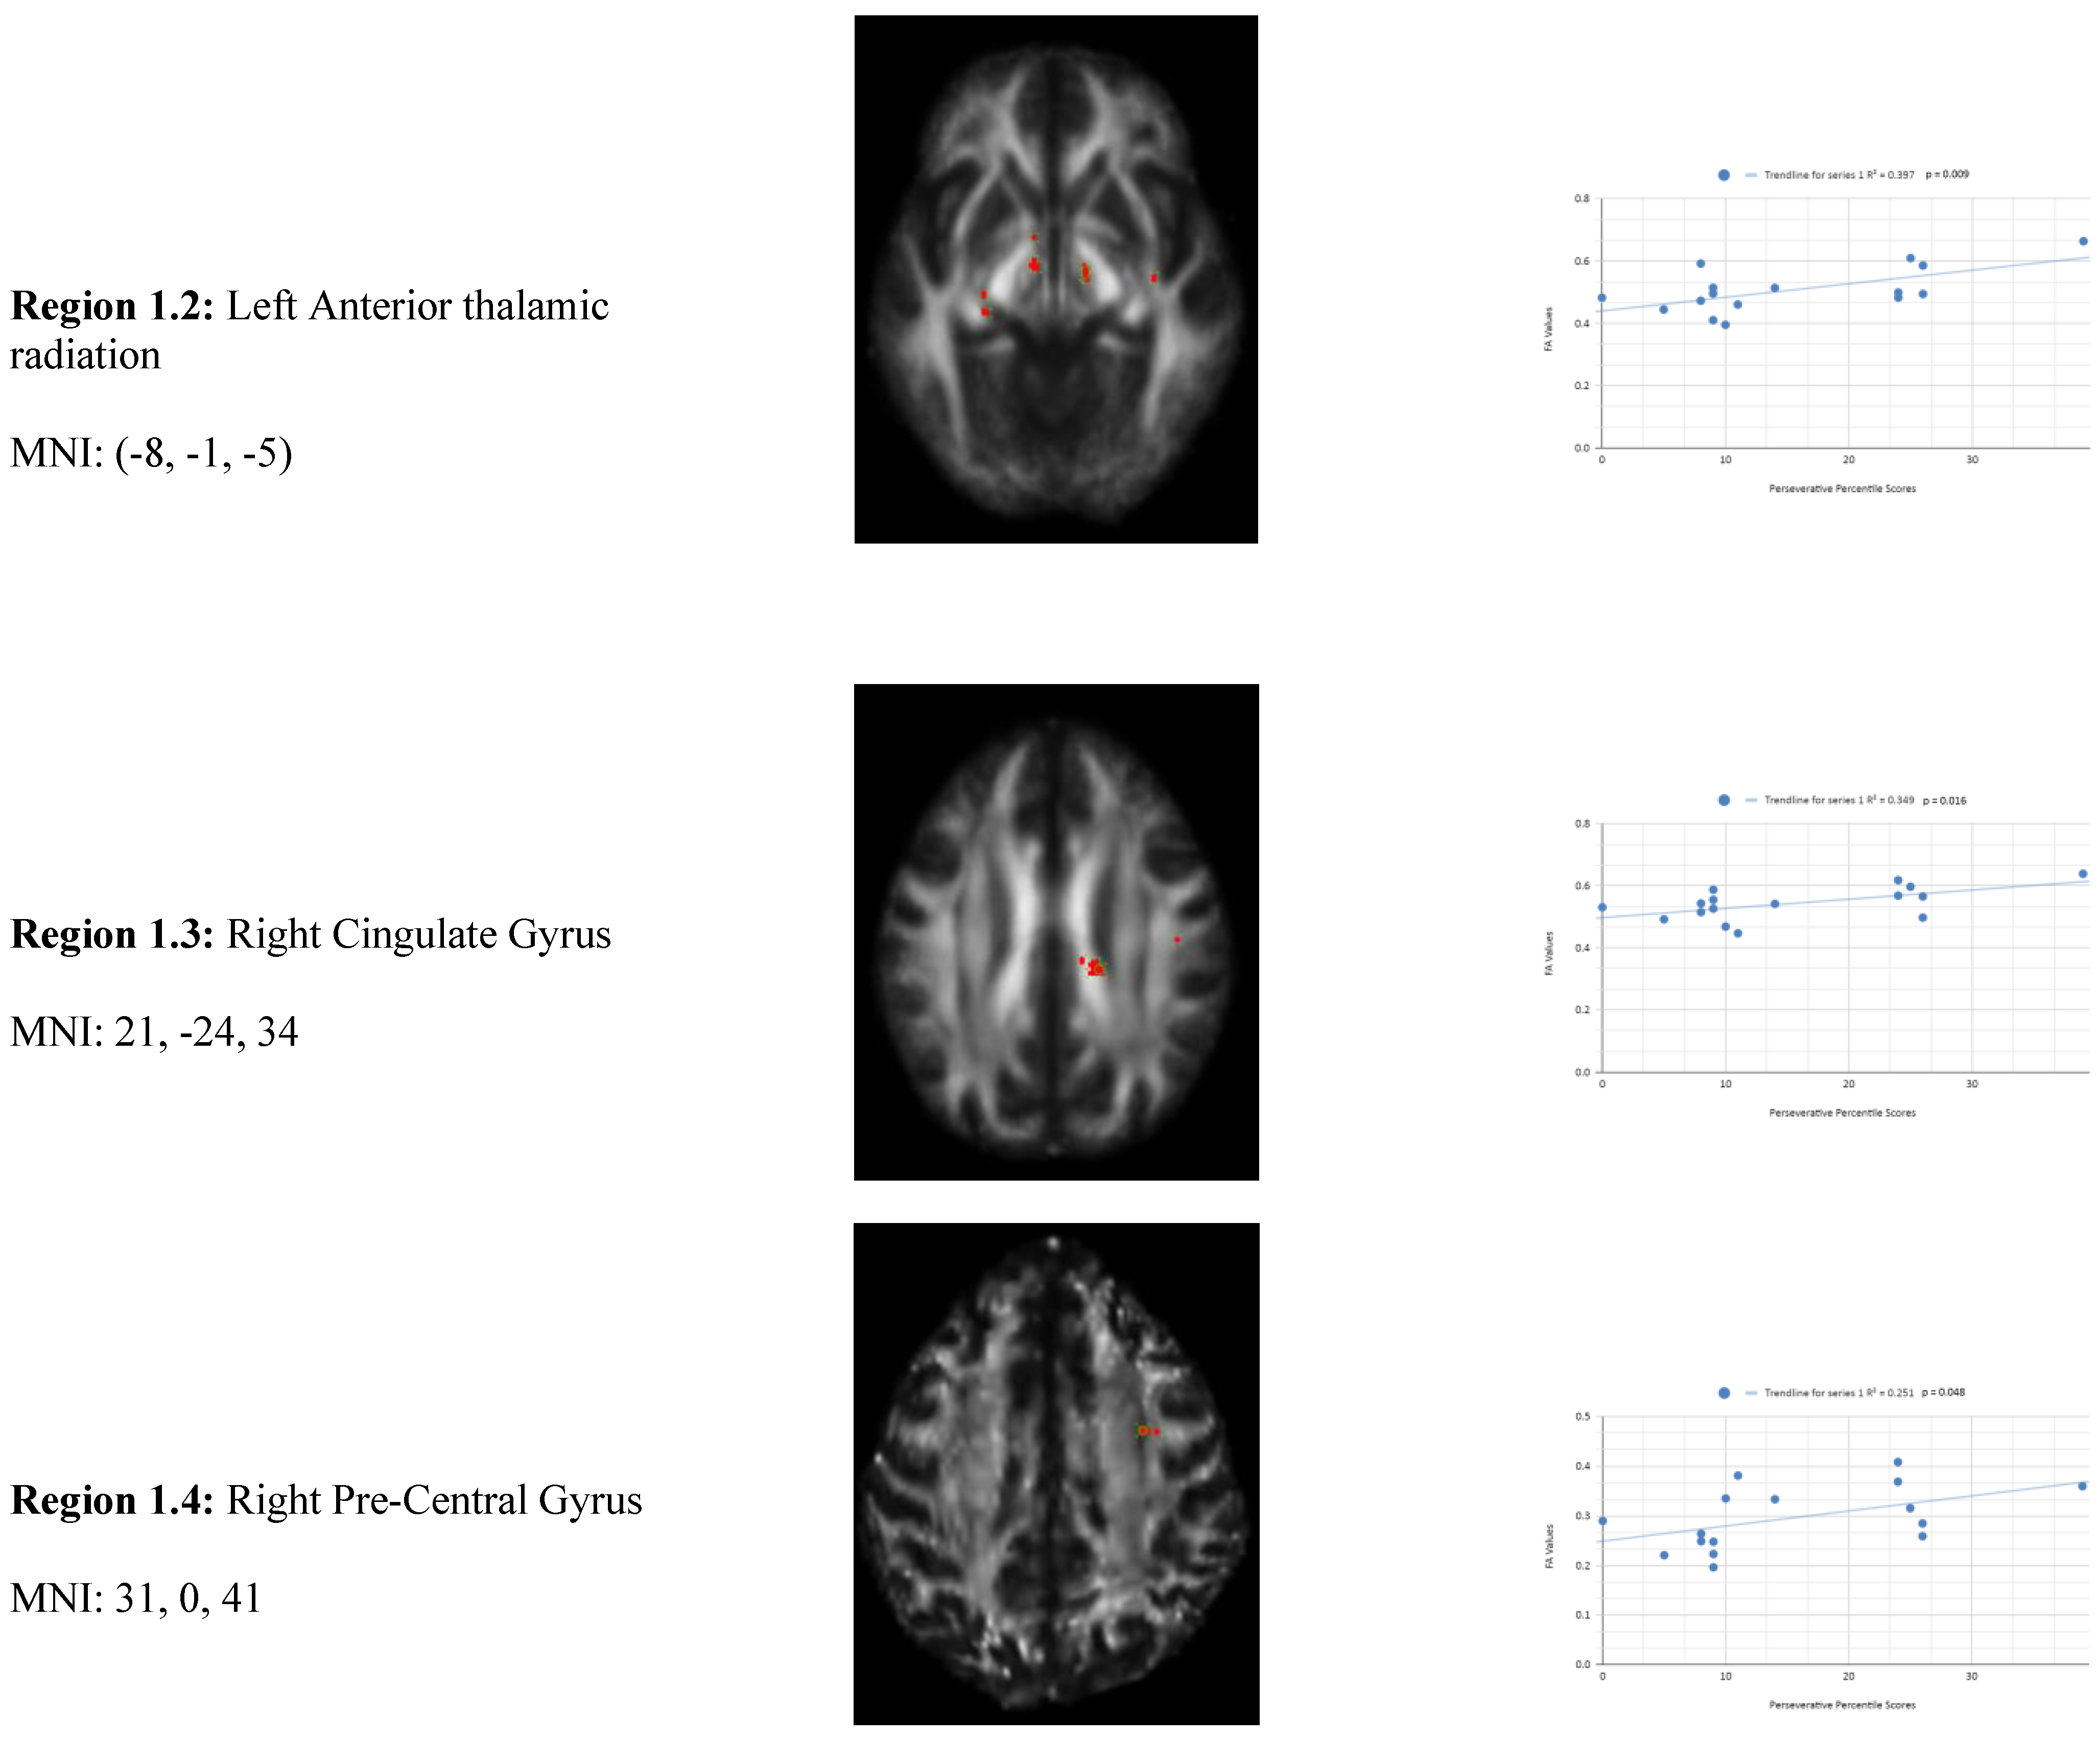
Figure 2.
Non-Perseverative Response Linear Regression Graphs.
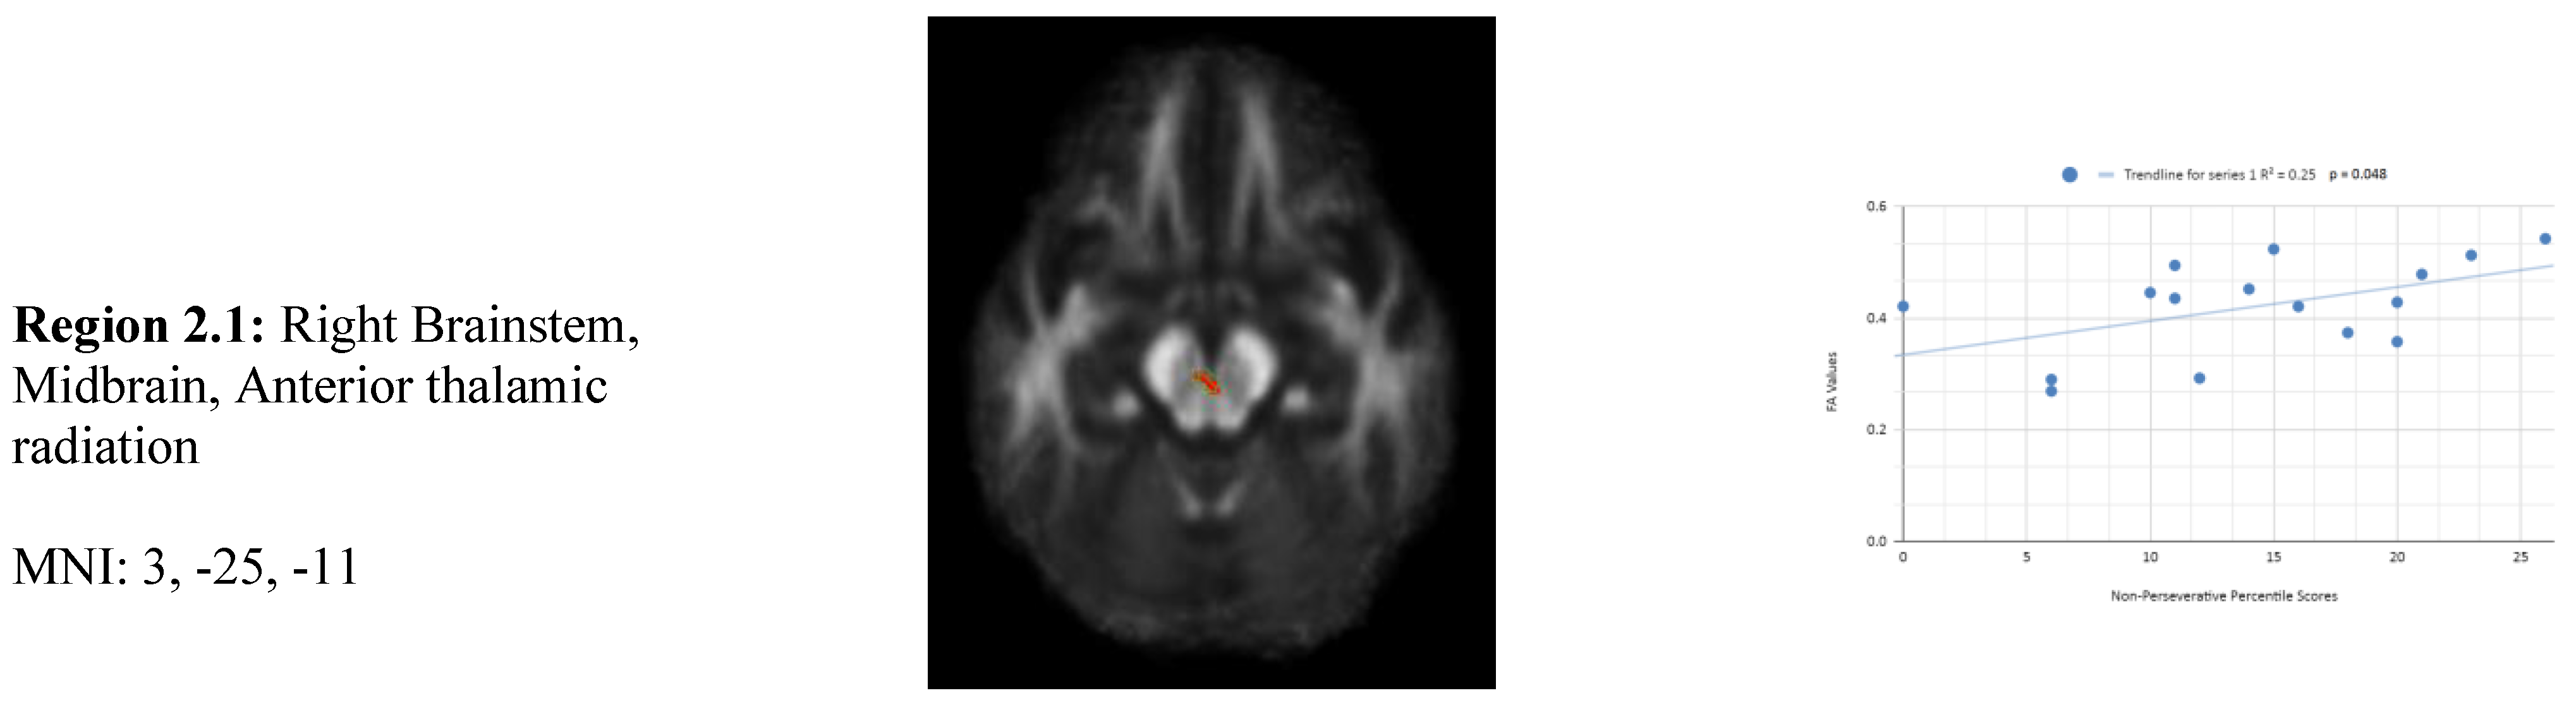
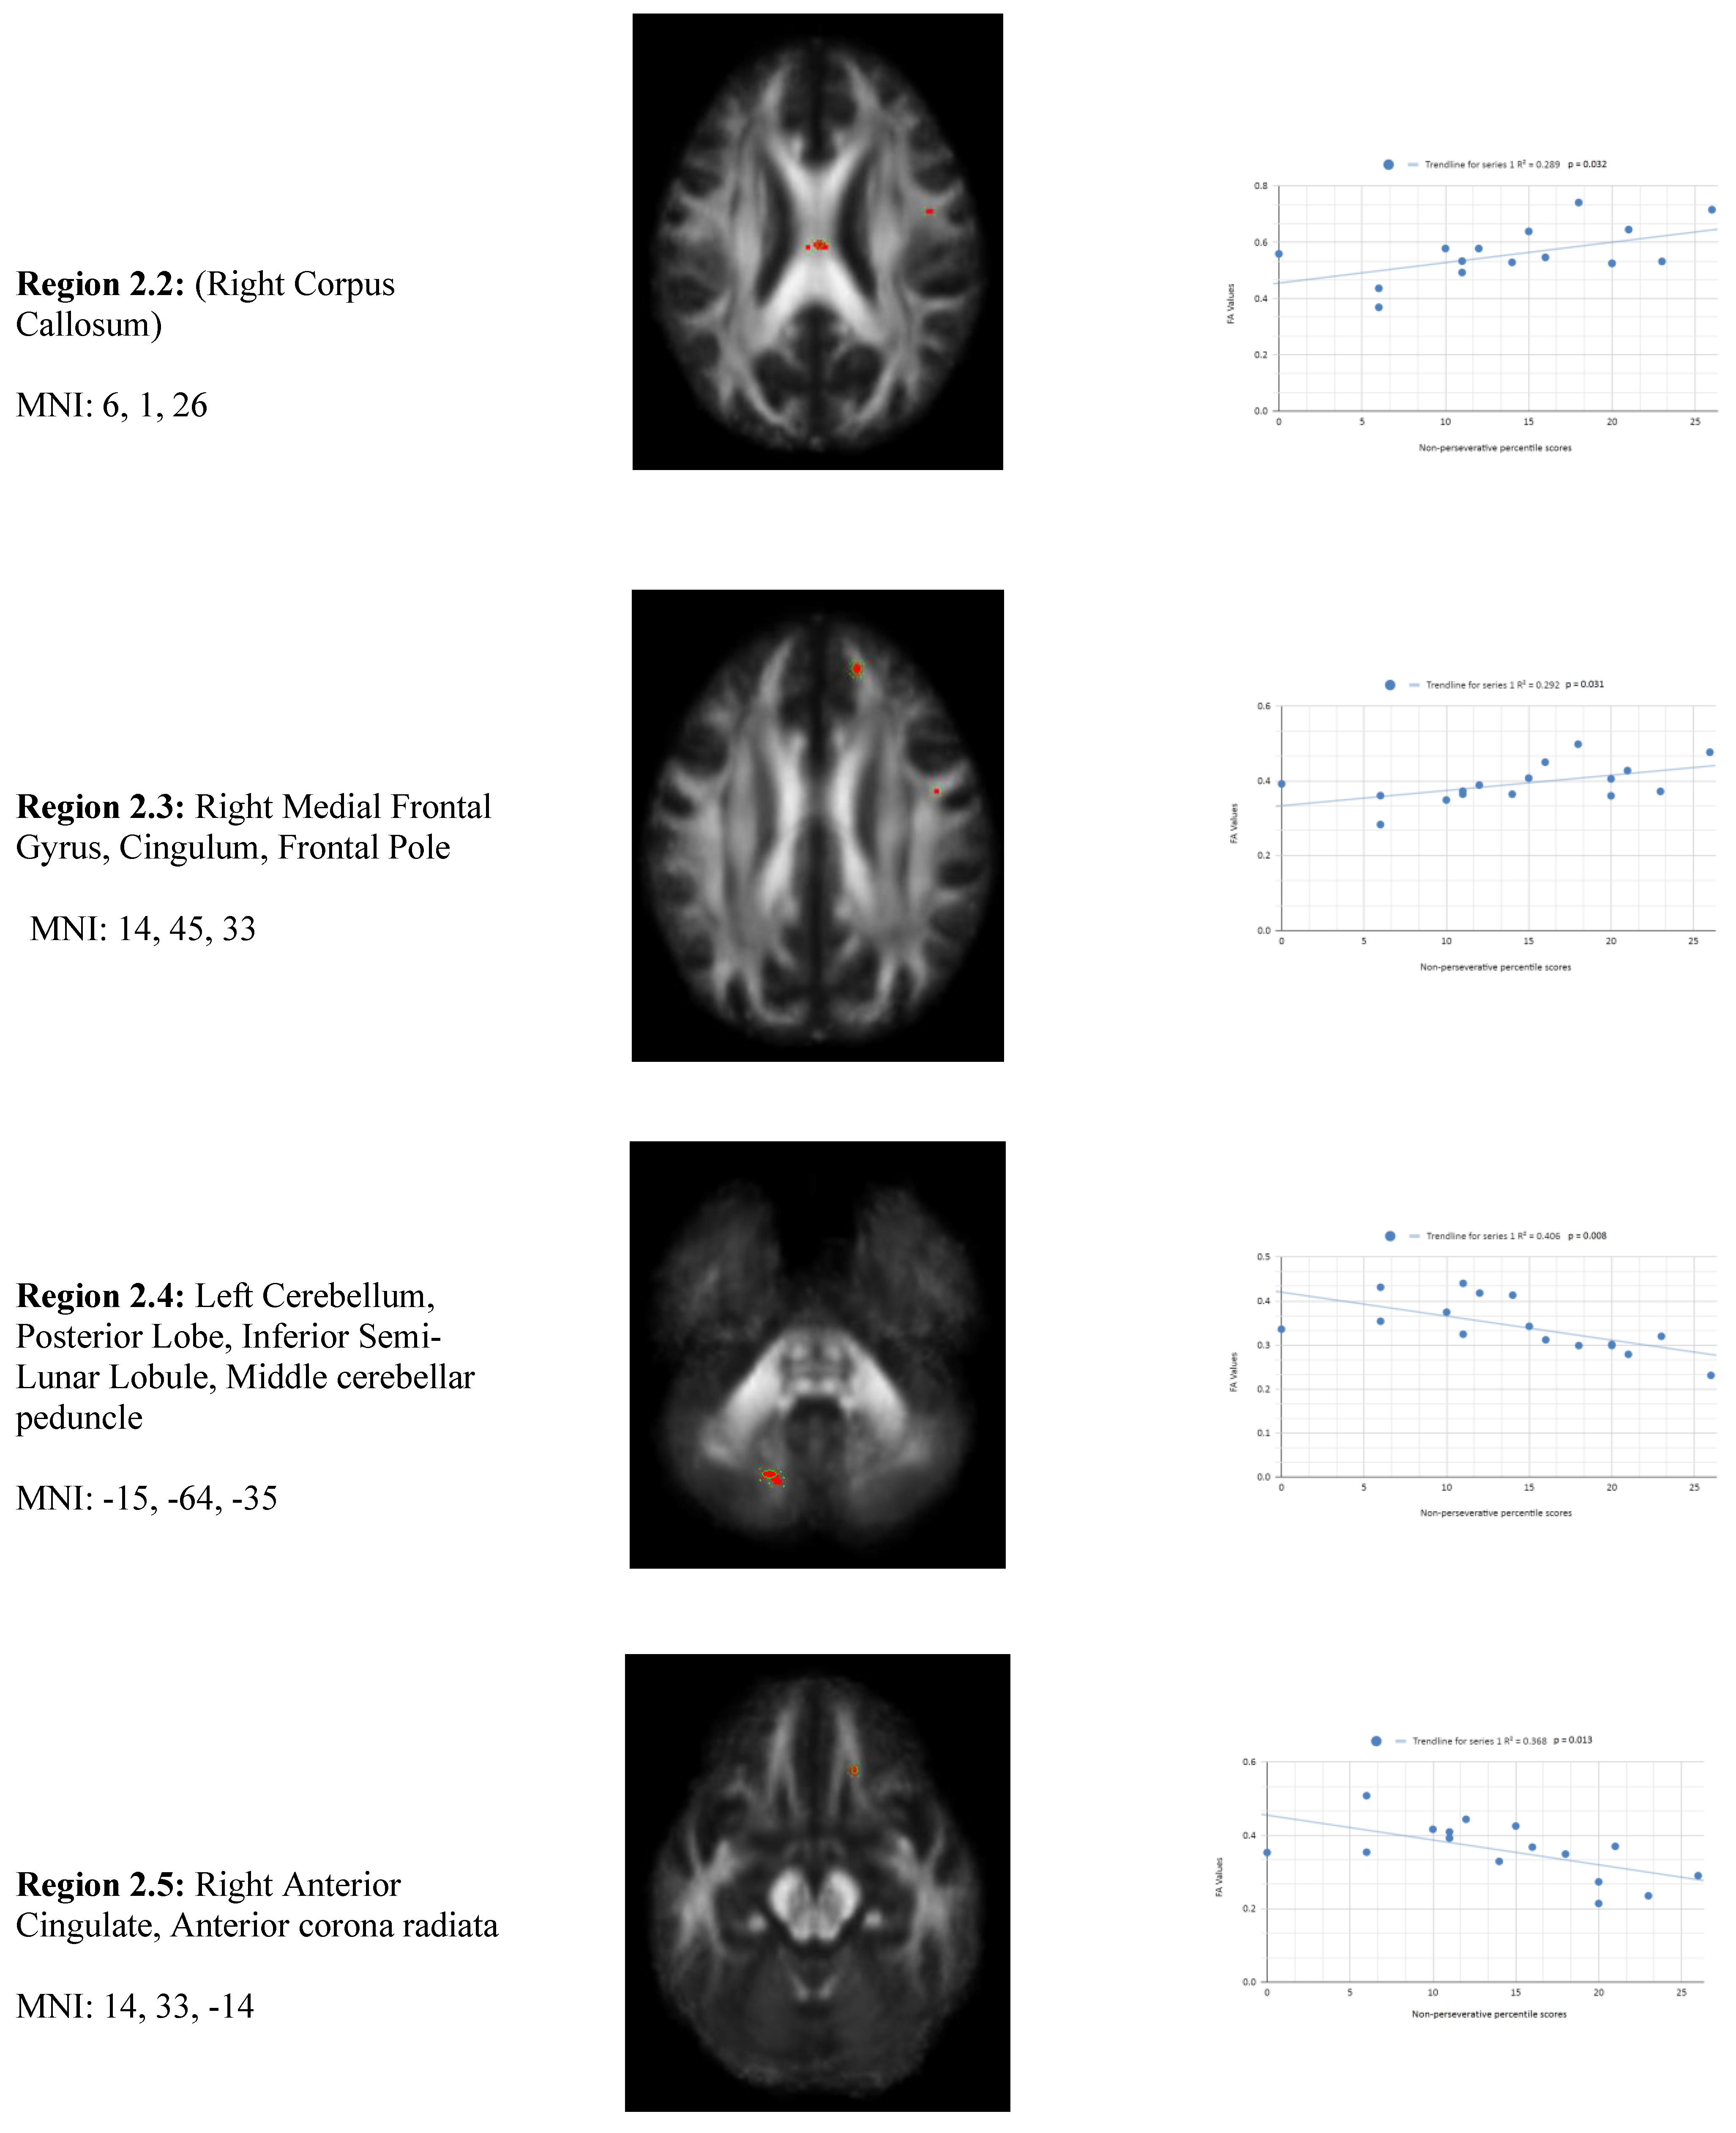
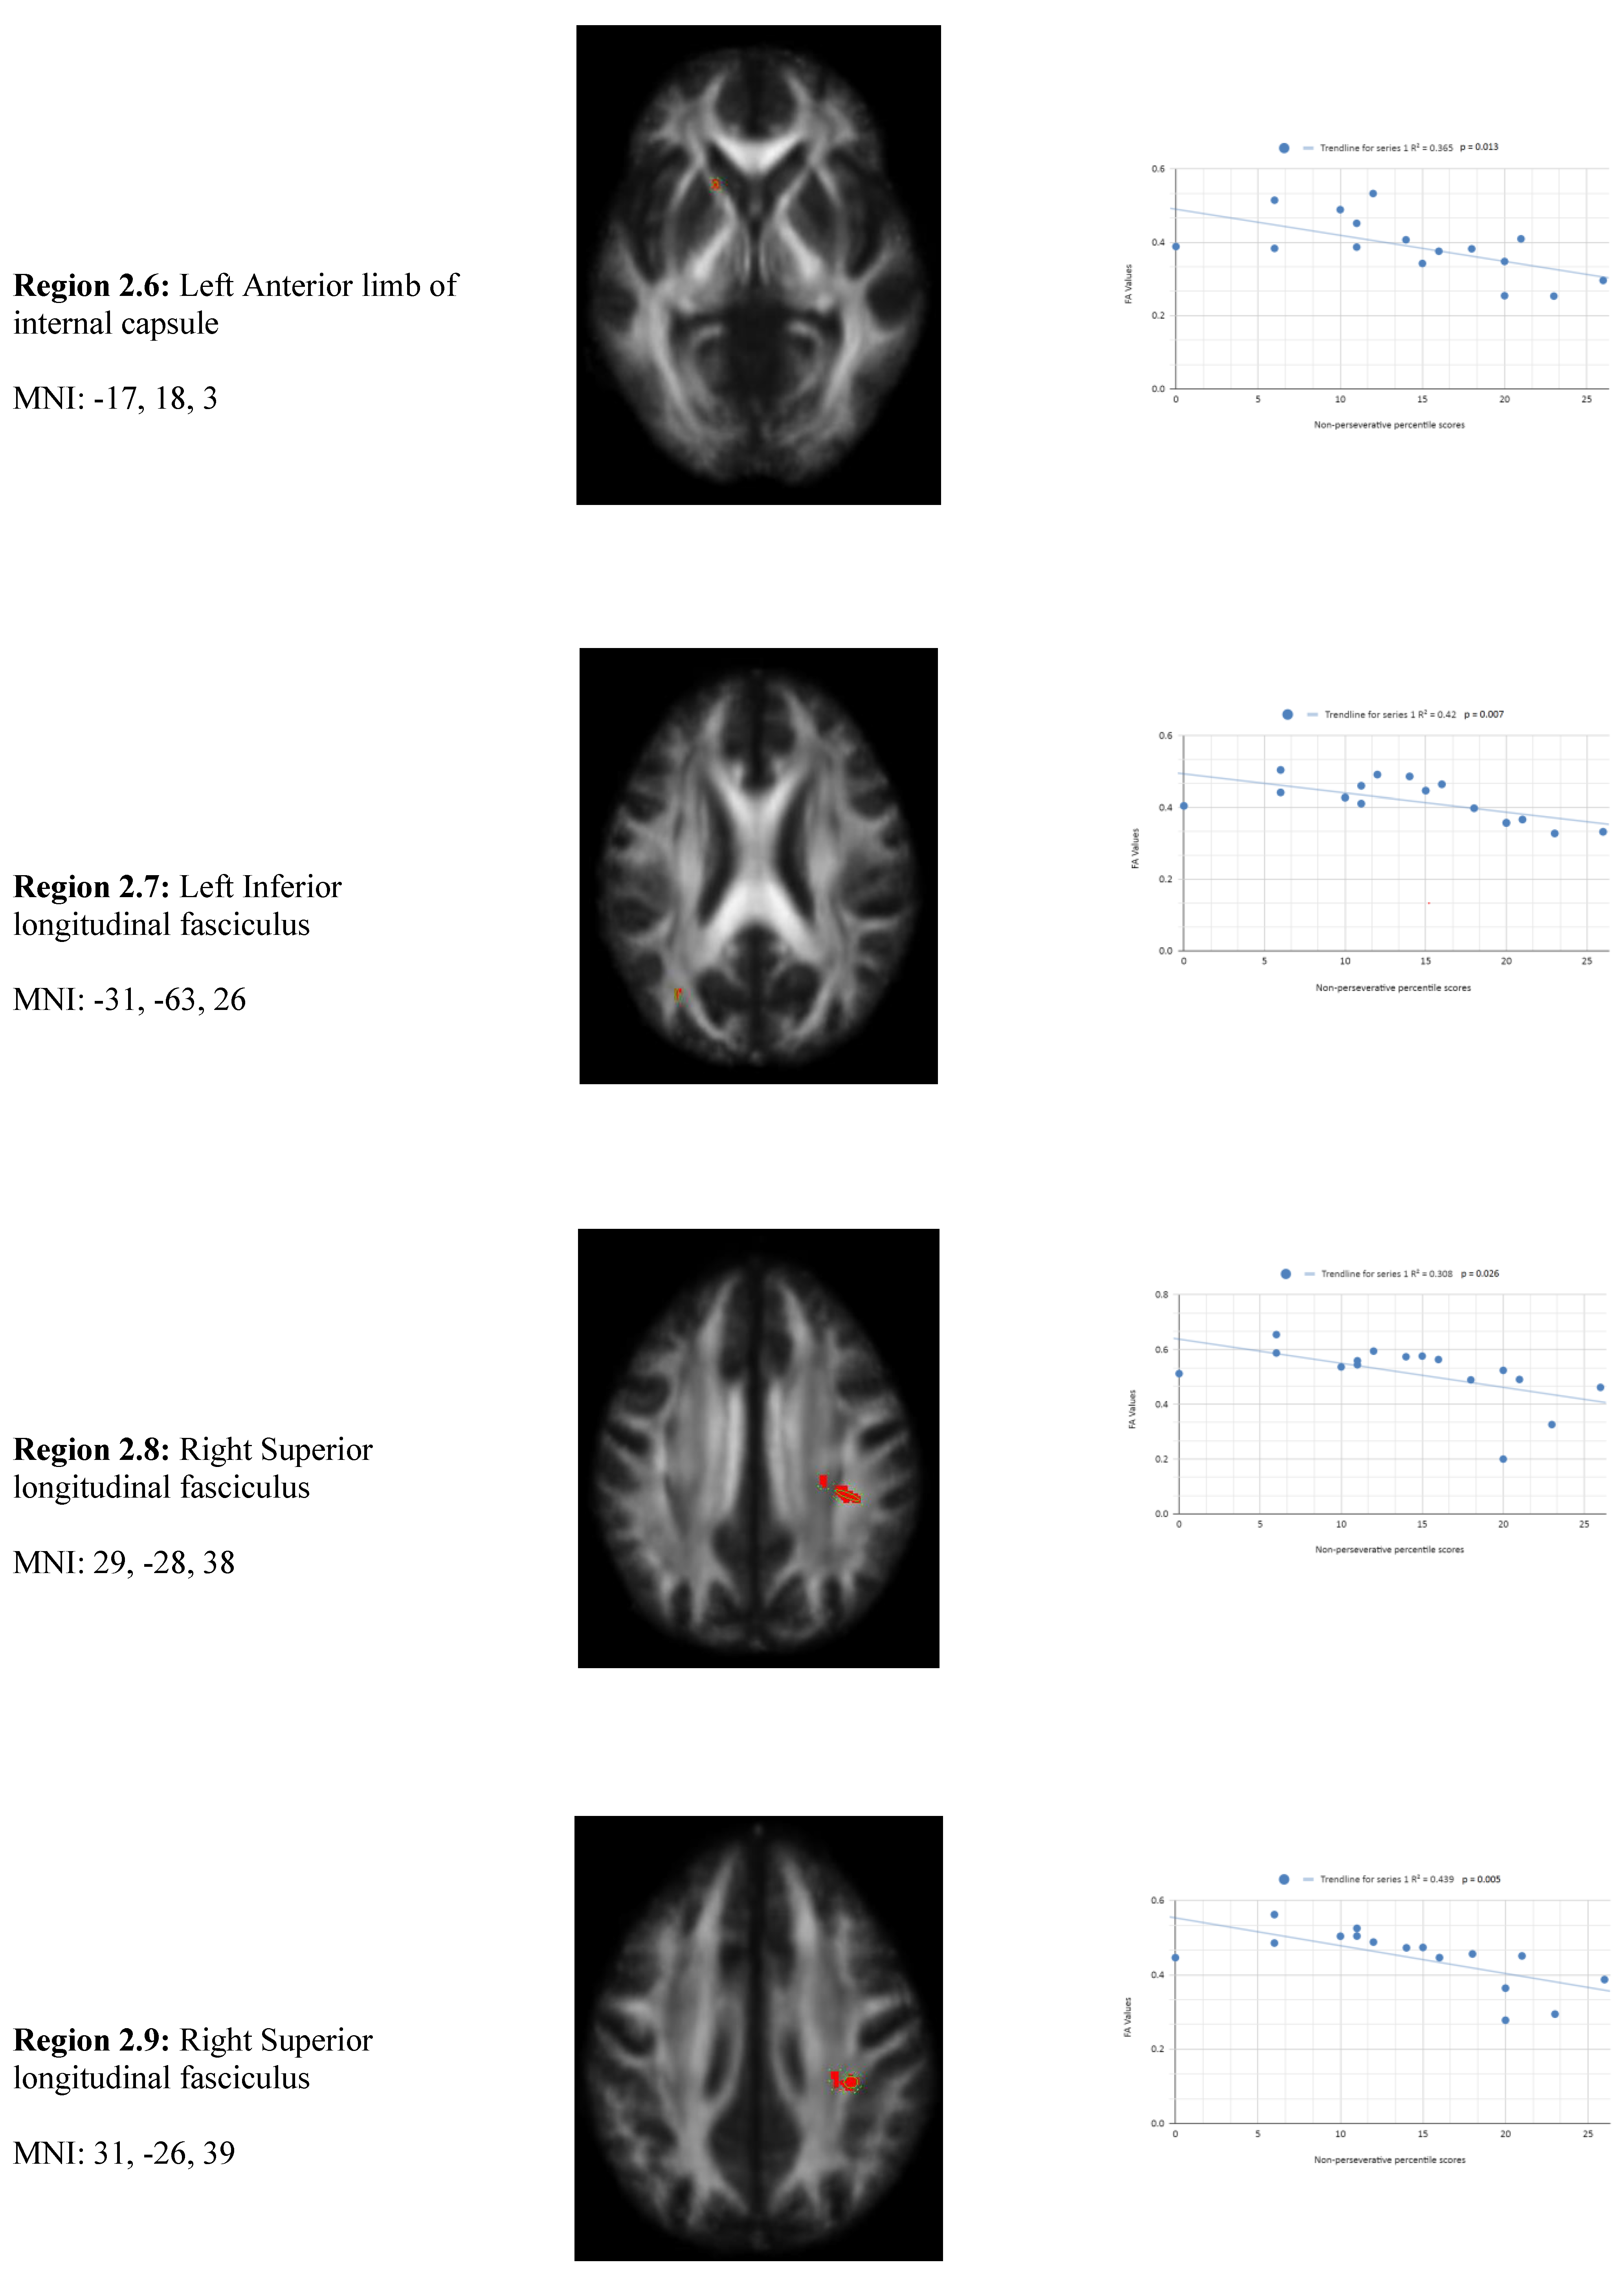
Figure 3.
Conceptual Response Regions of Interest.
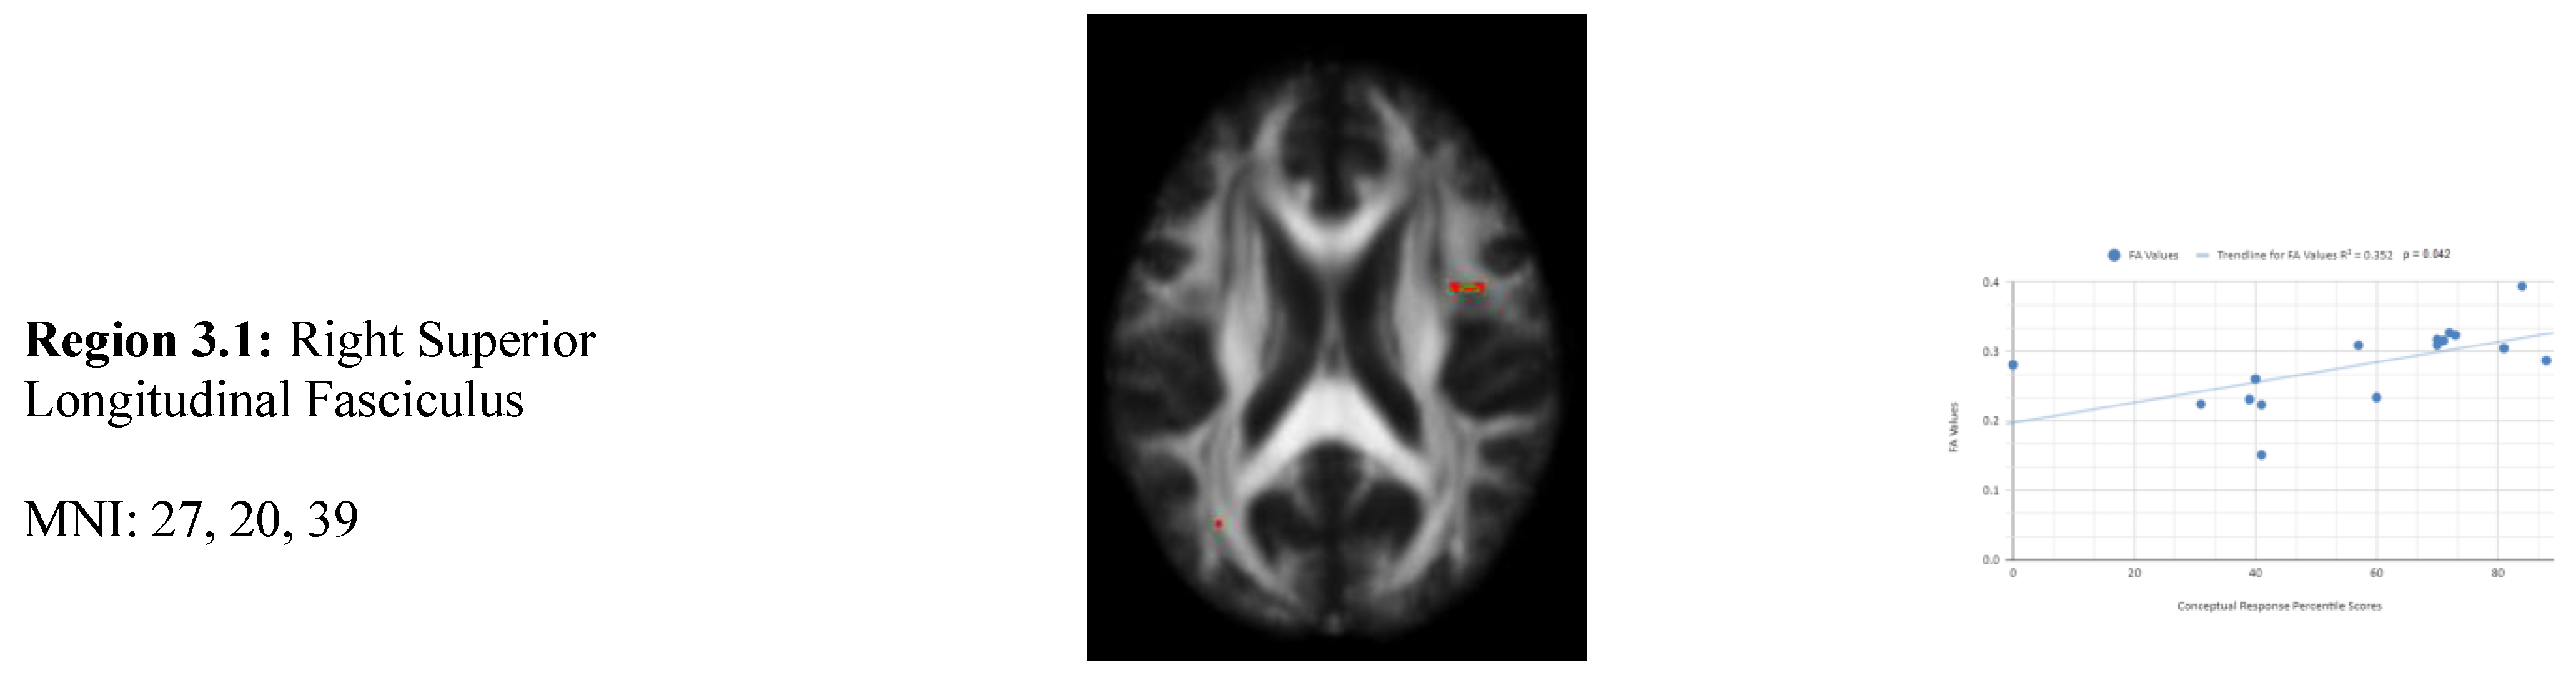
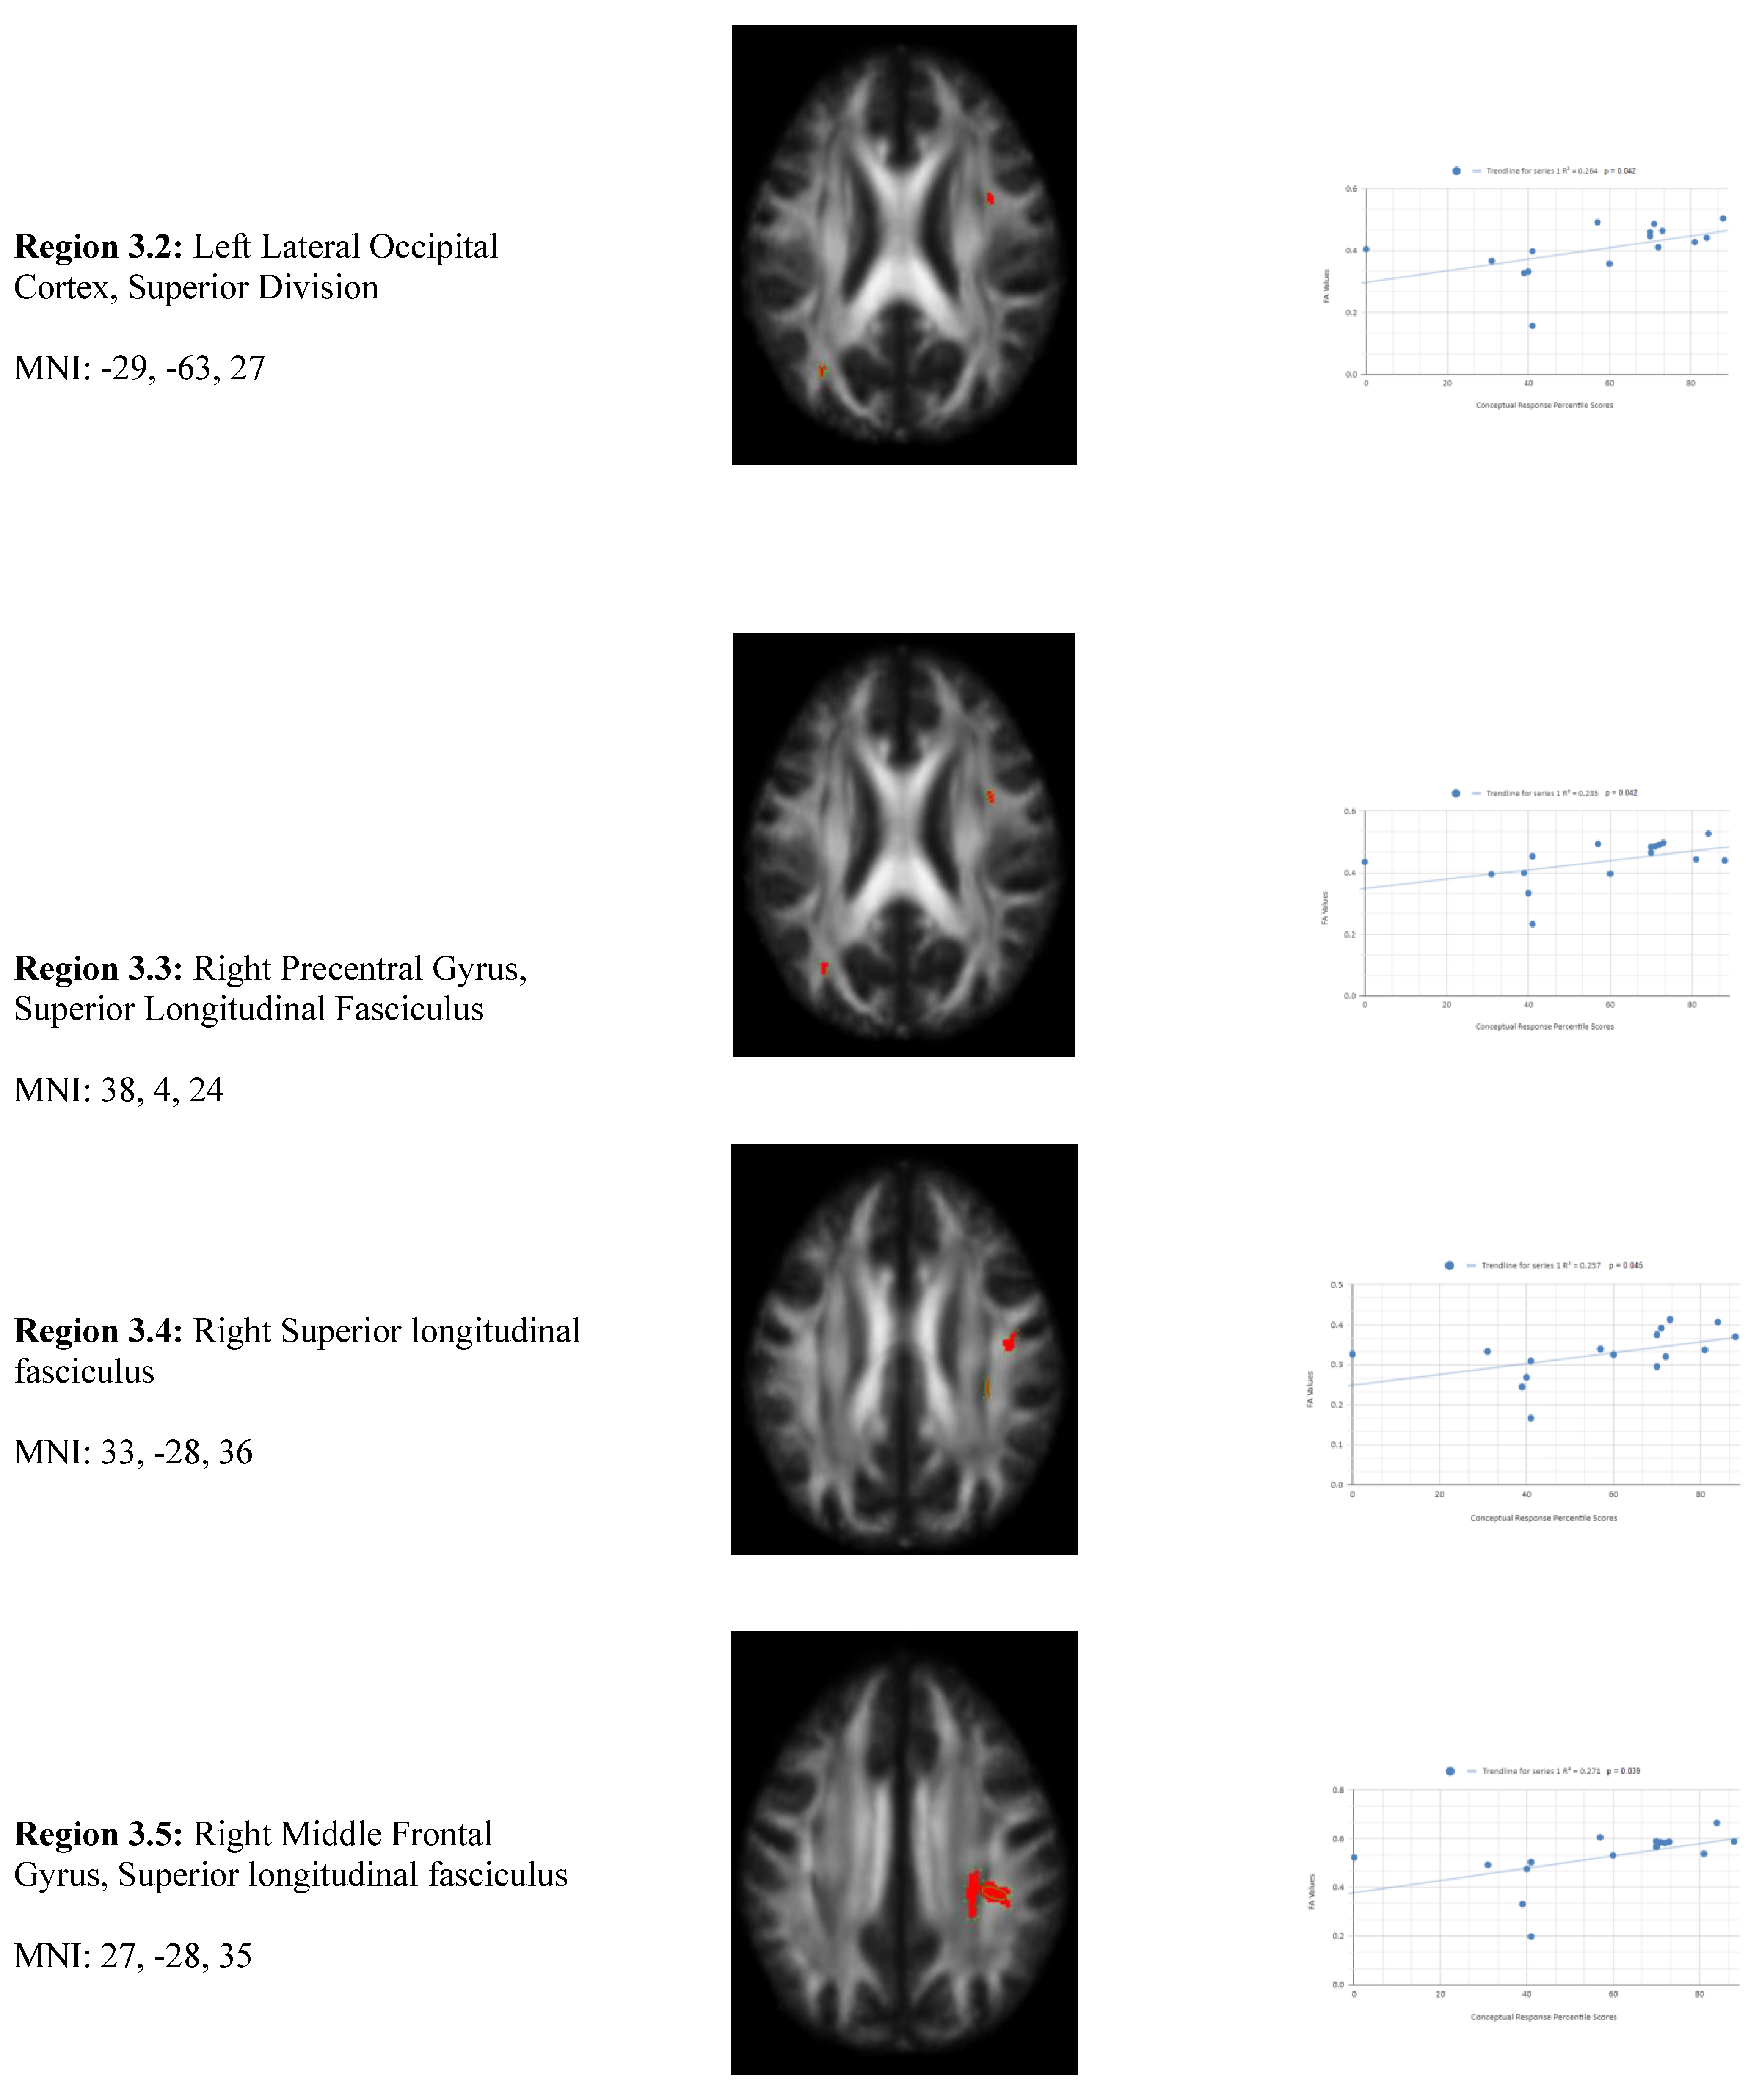
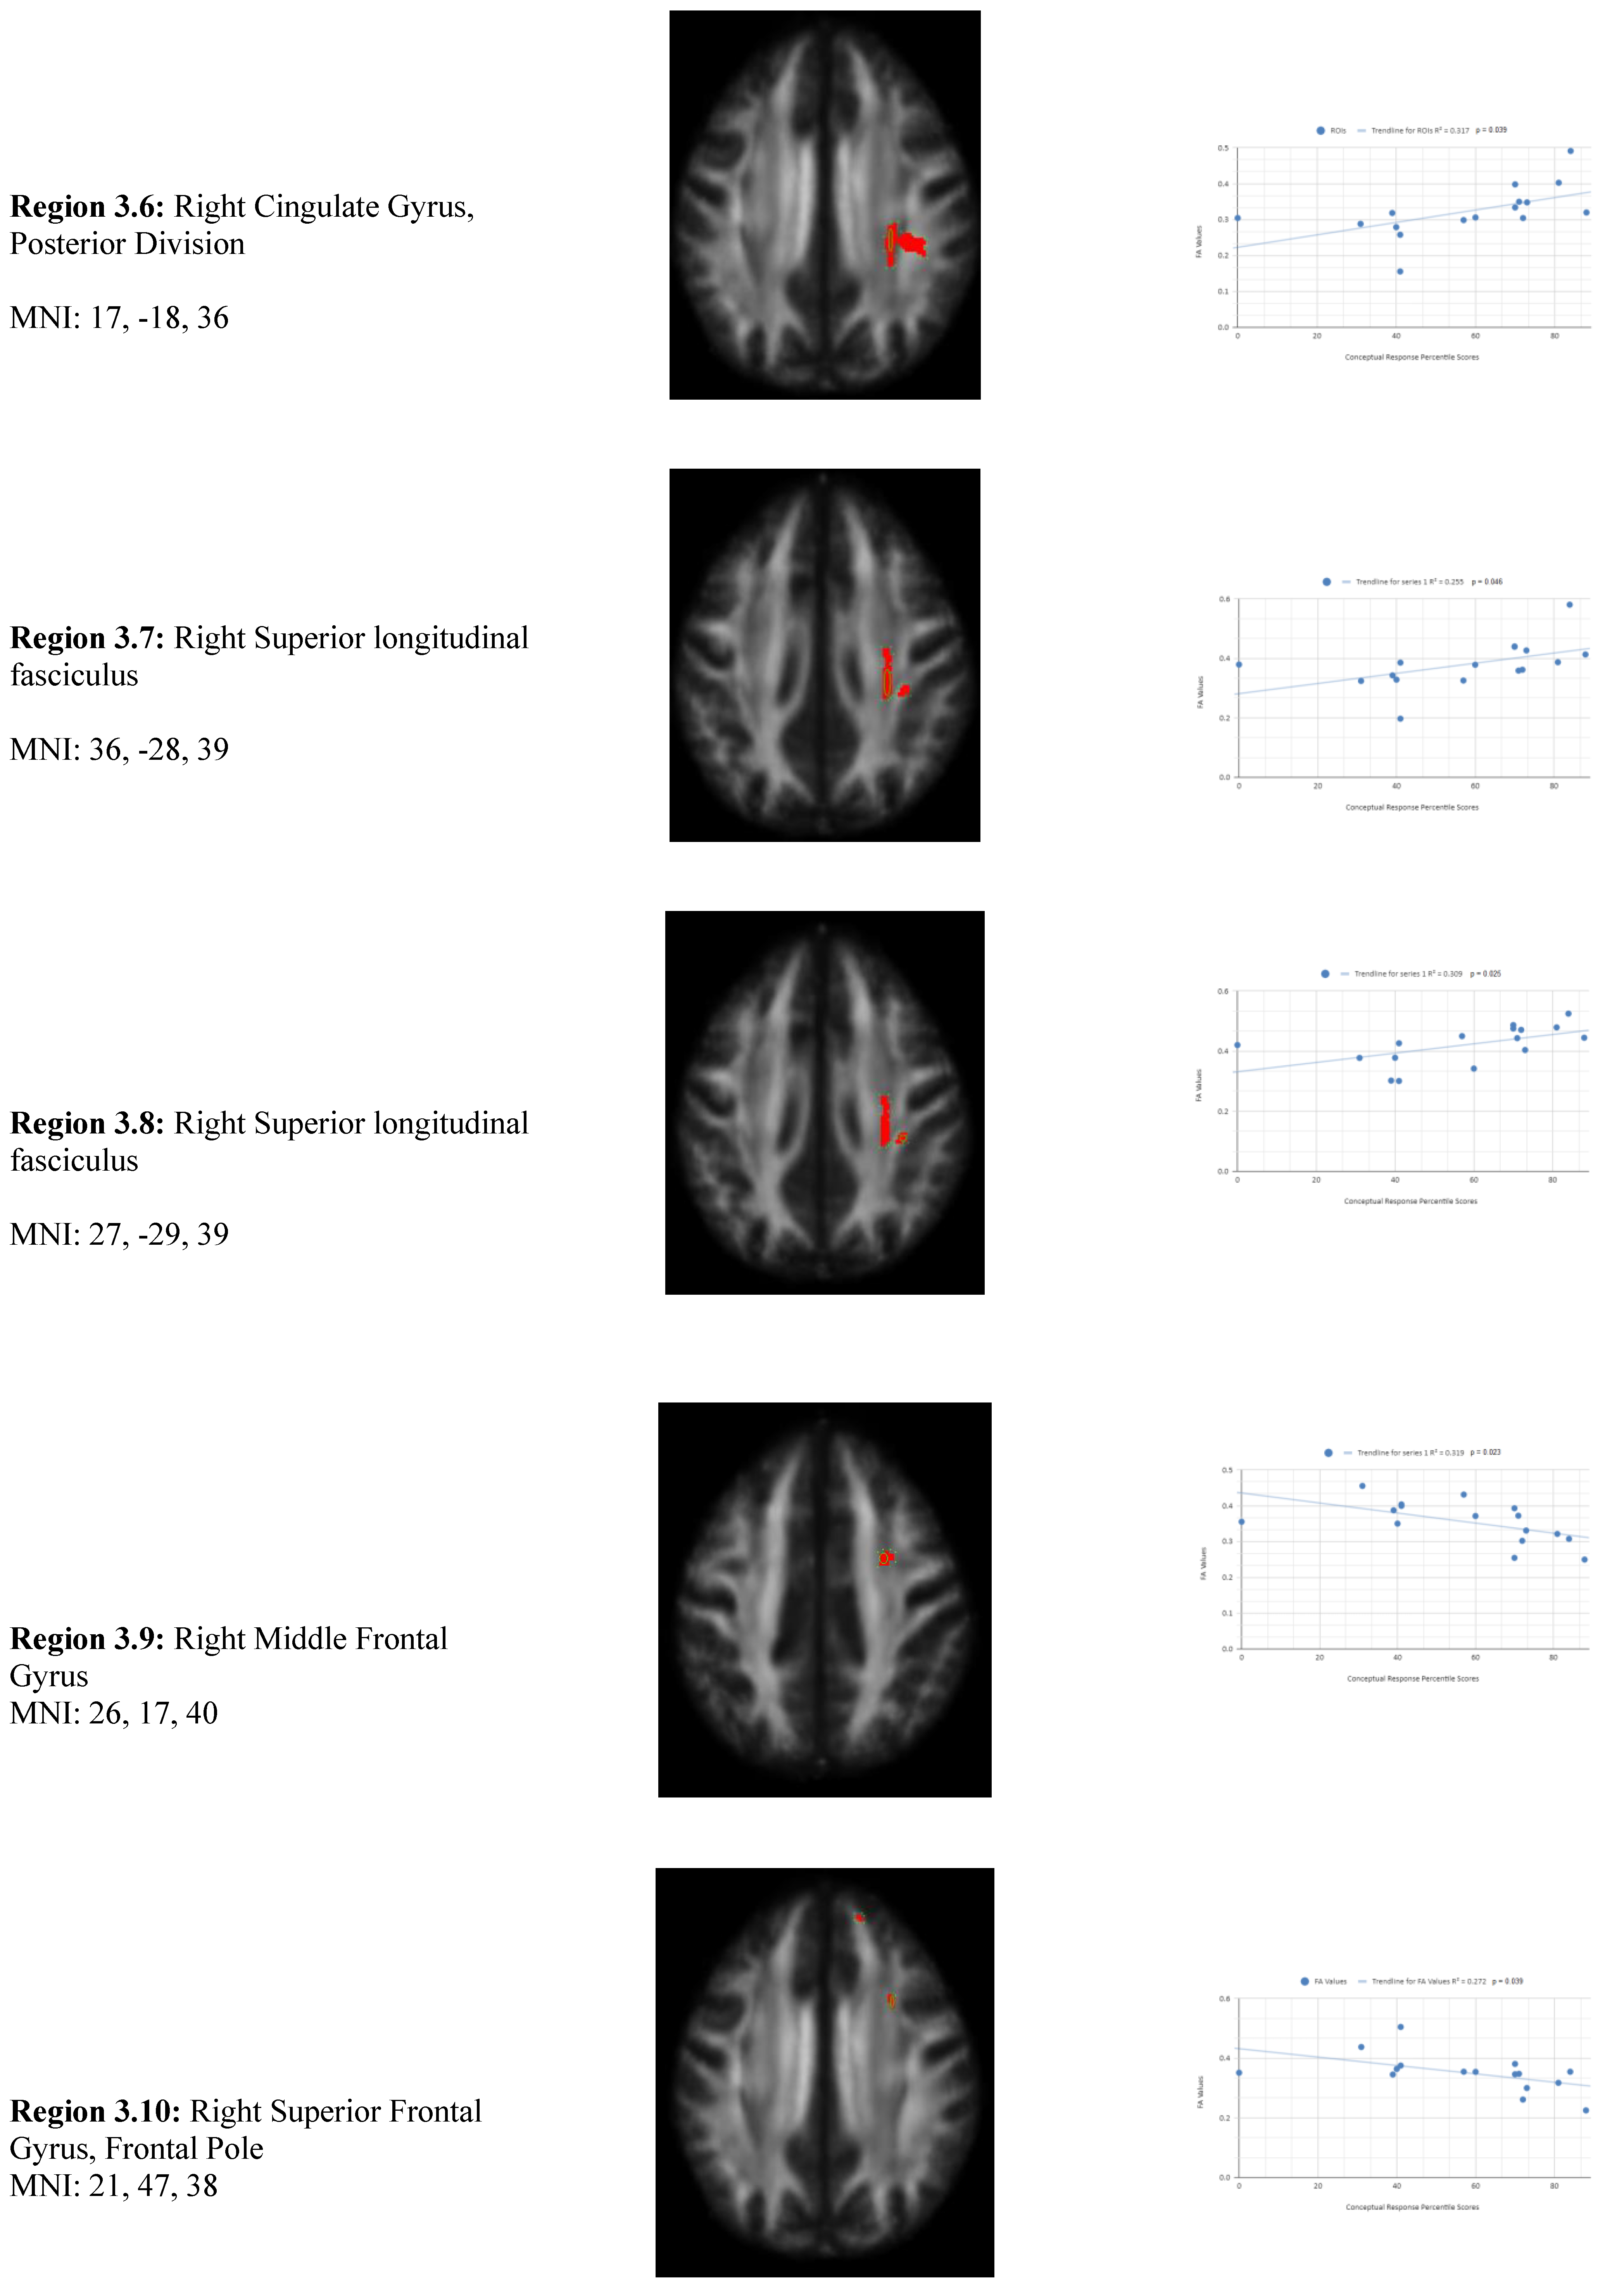
Figure 4.
Facet Scatterplot.
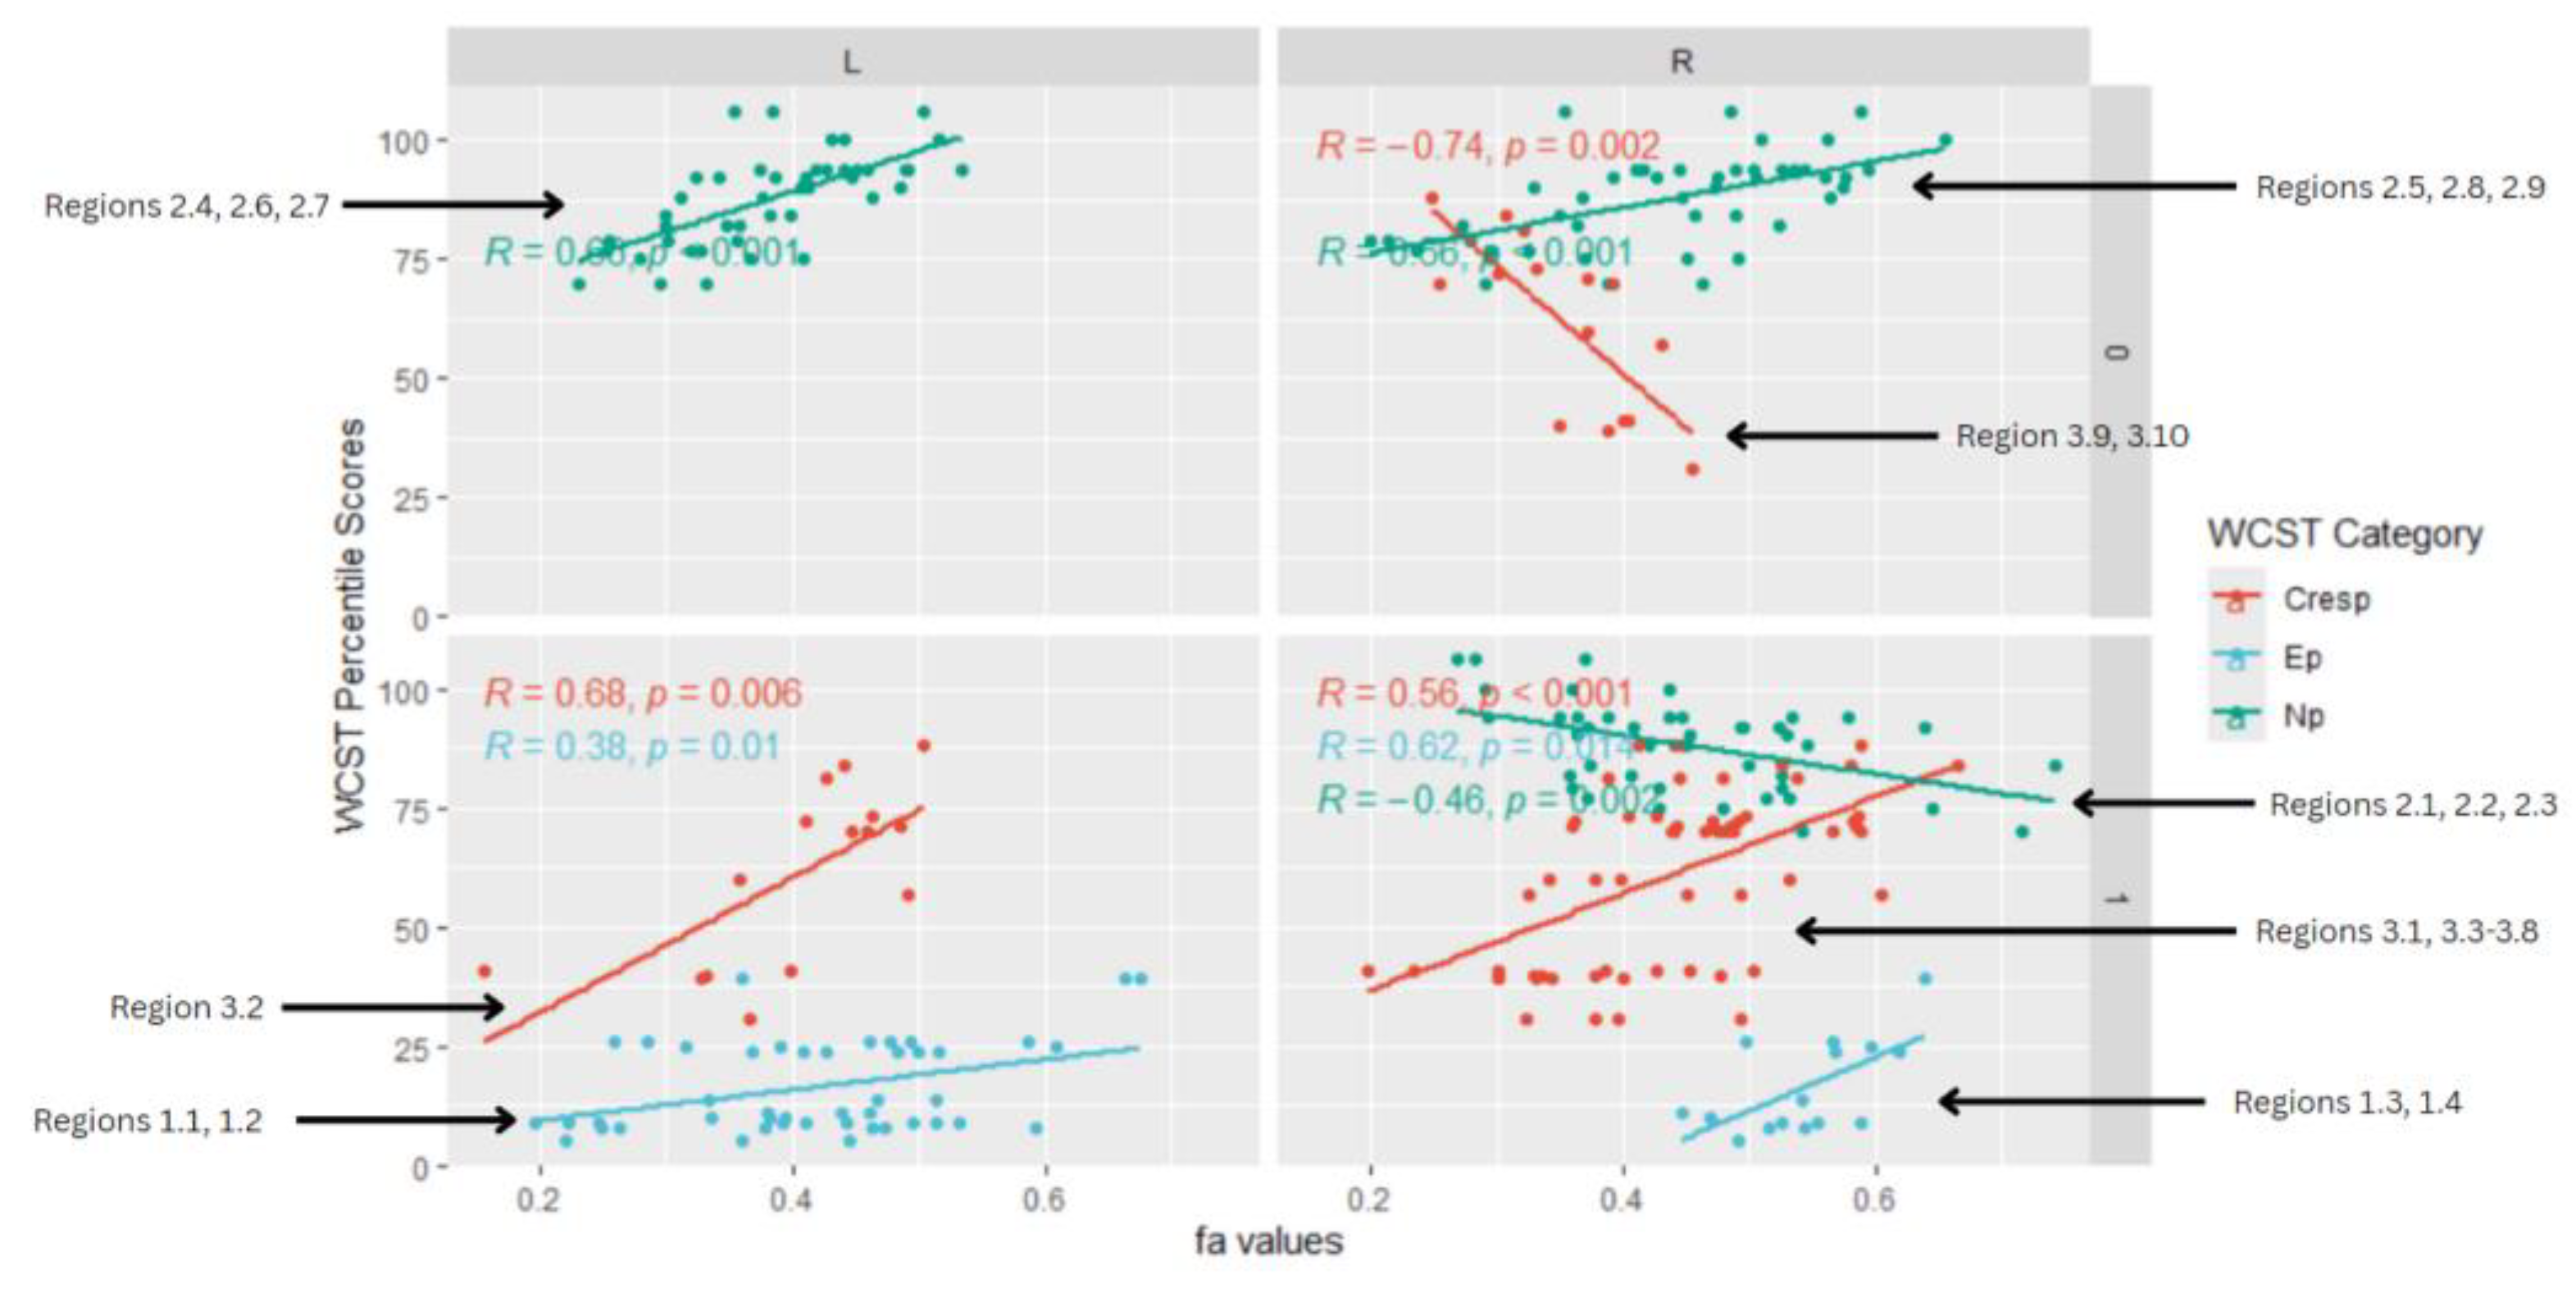

Table 1.
WCST Mean Patient Percentile Scores Compared to Mean Control Percentile Scores across Ep, CResp, and Enp.
Table 1.
WCST Mean Patient Percentile Scores Compared to Mean Control Percentile Scores across Ep, CResp, and Enp.
| WCST Category | Mean Patient Percentile Scores | Mean Control Percentile Scores |
|---|---|---|
| Perseverative Response | 15.27 ± 6.03 | 87.6 ± 9.85 |
| Conceptual Response | 61.2 ± 18.57 |
89.73 ± 11.96 |
| Non-Perseverative Response | 16.67 ± 9.98 |
93.46 ± 15.02 |
Disclaimer/Publisher’s Note: The statements, opinions and data contained in all publications are solely those of the individual author(s) and contributor(s) and not of MDPI and/or the editor(s). MDPI and/or the editor(s) disclaim responsibility for any injury to people or property resulting from any ideas, methods, instructions or products referred to in the content. |
© 2025 by the authors. Licensee MDPI, Basel, Switzerland. This article is an open access article distributed under the terms and conditions of the Creative Commons Attribution (CC BY) license (http://creativecommons.org/licenses/by/4.0/).
Copyright: This open access article is published under a Creative Commons CC BY 4.0 license, which permit the free download, distribution, and reuse, provided that the author and preprint are cited in any reuse.


