Submitted:
05 June 2025
Posted:
05 June 2025
You are already at the latest version
Abstract
Graphene, a remarkable two-dimensional material, enhances the mechanical properties of high entropy alloys as a reinforcing phase. This study uses molecular dynamics to explore the influence of vacant defects in graphene on mechanical properties of alloys. By incorporating graphene with varying vacancy defects into FeNiCrCoCu high entropy alloys containing initial dislocations, tensile and compressive simulations were conducted. Simulation results indicate that graphene, serving as the reinforcing phase in high-entropy alloy (FeNiCrCoCu), experiences a reduction in strength and load-bearing capacity due to its vacancy defects. These defects result in premature failure during the initial stages of strain and diminish the elastic strengthening effect. However, even with defects, graphene retains the ability to enhance the flow stress post-yield. A small number of defects can effectively impede dislocation motion, thereby strengthening the alloy. Conversely, an excessive number of defects allows dislocations to penetrate through the graphene, weakening the strengthening effect. Research has revealed that a defect structure characterized by a homogeneous loss of up to 5% of carbon atoms can enhance both the toughness of graphene and the yield strain of the alloy. Beyond this critical threshold, however, structural stability diminishes, leading to a significant reduction in the strengthening effect.
Keywords:
Graphene
; High entropy alloys
; Vacancy defects
; Molecular dynamics
; Dislocations
1. Introduction
In recent years, high entropy alloys (HEAs) have garnered significant attention from researchers worldwide as an innovative metallic material. Numerous experiments have demonstrated that HEA exhibits exceptional mechanical properties, encompassing superior strength, fracture toughness, creep resistance, and radiation tolerance[1]. A highly illustrative example is the FeNiCrCoCu HEA, which benefits from the significant mixing entropy effect arising from the minimal atomic size differences among its[2], which is capable of successfully forming a single-phase FCC solid solution structure[3]. Currently, it has been established that this alloy is viable and possesses vast application potential. Nevertheless, as engineering application demands continue to escalate, the pivotal challenge lies in further enhancing the strength and toughness of high-entropy alloys while preserving their exceptional performance characteristics. In recent years, numerous studies have been conducted on this type of HEA, with significant efforts made to enhance its mechanical properties. Among these efforts, the method of incorporating reinforcing phases has proven particularly effective. For instance, Zhiming Gao and his team achieved a remarkable synergistic effect through the introduction of Ti and C elements into FeNiCrCo high-entropy alloy, resulting in solid solution strengthening, second phase strengthening, and grain refinement strengthening, thereby significantly enhancing the hardness and wear resistance of the composite material[4]. These remarkable mechanical properties, along with the flexibility in their compositional design, offer immense potential for the widespread adoption and utilization of high entropy alloys.
Graphene (Gr) serves as an exceptional reinforcing phase for enhancing the strength of metal-based materials[5,6]. Zhou et al. presented a cost-effective method to produce oxidation-resistant Cu particles coated with graphene via flash joule heating, exhibiting stable conductivity and effective electromagnetic interference shielding[7]. Li et al. used molecular dynamics simulations to investigate the nano scratching response of HEA/Gr composites, revealing enhanced wear resistance and mechanism transitions due to graphene nanosheet introduction and embedding depth, aiding in the design of composites with superior mechanical and tribological properties[8]. Ye et al. demonstrated an effective strategy for enhancing the tribological performance of HEAs by incorporating a few-layer graphene, resulting in significant reductions in wear rate and friction coefficient, and clarifying the subsurface structure evolution and deformation mechanisms[9]. Nevertheless, its integration into HEA remains scarce, and there is a paucity of research exploring the mechanical properties and Gr reinforcement mechanisms of HEA/Gr composites. Prior studies have simulated the reinforcement mechanism of Gr in HEA by incorporating a monolayer of Gr, revealing that Gr can bolster model strength by inhibiting dislocation nucleation, impeding dislocation movement, and facilitating the formation of stationary dislocations. However, it’s noteworthy that Gr prepared experimentally often exhibits a certain degree of defects, necessitating crucial research into the impact of these defects on the strengthening effect of HEA.
Some experimental studies have utilized transmission electron microscopy and scanning tunneling microscopy to corroborate the presence of two distinct types of defects in Gr: inherent natural defects and exogenous defects. Among the natural defects, Stone-Wales defects, vacancy defects, and line defects are included[10-14]. Sethurajaperumal et al. emphasized that the defects present in exfoliated graphene nanosheets are influenced by both the size of the precursor graphite flakes and their inherent imperfections[15]. According to several studies, the presence of vacancy defects can lead to a reduction in the Young’s modules of Gr[16-20]. Robertson and his colleagues induced vacancy defects in graphene through techniques like ion irradiation, and conducted a study on the stability and persistence of certain defects in Gr at the nanoscale, revealing that they are sufficiently stable to persist over time[16]. Pham et al. presented the first atomic-scale investigation of point defects in oxygen plasma-treated epitaxial graphene on SiC, revealing defect-induced states and atomic configurations that may aid in precise defect engineering for metal intercalation[21]. In recent years, numerous remarkable achievements have been made in the investigation of Gr vacancy defects. Nevertheless, there has been limited exploration into the impact of these defects on Gr serving as a reinforcing phase in HEA. Given that HEA/Gr composites possess excellent mechanical properties and the incorporation of Gr as a reinforcing phase significantly enhances the performance of HEA, it is imperative to conduct thorough research on Gr defects. However, it remains challenging to specifically observe the impact of defects in Gr on the overall structure in experiments, necessitating the elucidation of the interaction between Gr and HEA at the atomic level within the nanoscale. Additionally, it is equally difficult to precisely control parameters such as the specific size, quantity, and distribution of defects in Gr during experimental procedures.
To clearly elucidate the impact of vacancy defects in Gr, serving as a reinforcing phase, on the mechanical properties of HEA/Gr composites, as well as the overall microscopic mechanisms, we must explore alternative methods beyond experimentations. Fortunately, the in molecular simulation algorithms and computing capabilities have offered us an alternative avenue to investigate reinforcement mechanisms at the atomic level. For instance, molecular dynamics (MD), a nanoscale computational technique, offers profound insights into atomic-scale observations, which have been extensively utilized to capture underlying mechanisms[22]. The OVITO software enables the visualization of deformation results from MD simulations. The Dislocation Extraction Algorithm (DXA) is employed to detect dislocation features within the model article presenting a nanoscale simulation of the tensile and compressive FeNiCrCoCu HEA/Gr composite materials, dynamics methods. During the modeling process, multiple vacancy defects were eliminating C atoms from Gr, and the impact of these Gr vacancy defects on the strength of the composite model was thoroughly analyzed. The simulation outcomes provide valuable theoretical insights for future molecular dynamics studies and the design of graphene-reinforced metal matrix composites.
2. Materials and Methods
2.1. Modeling
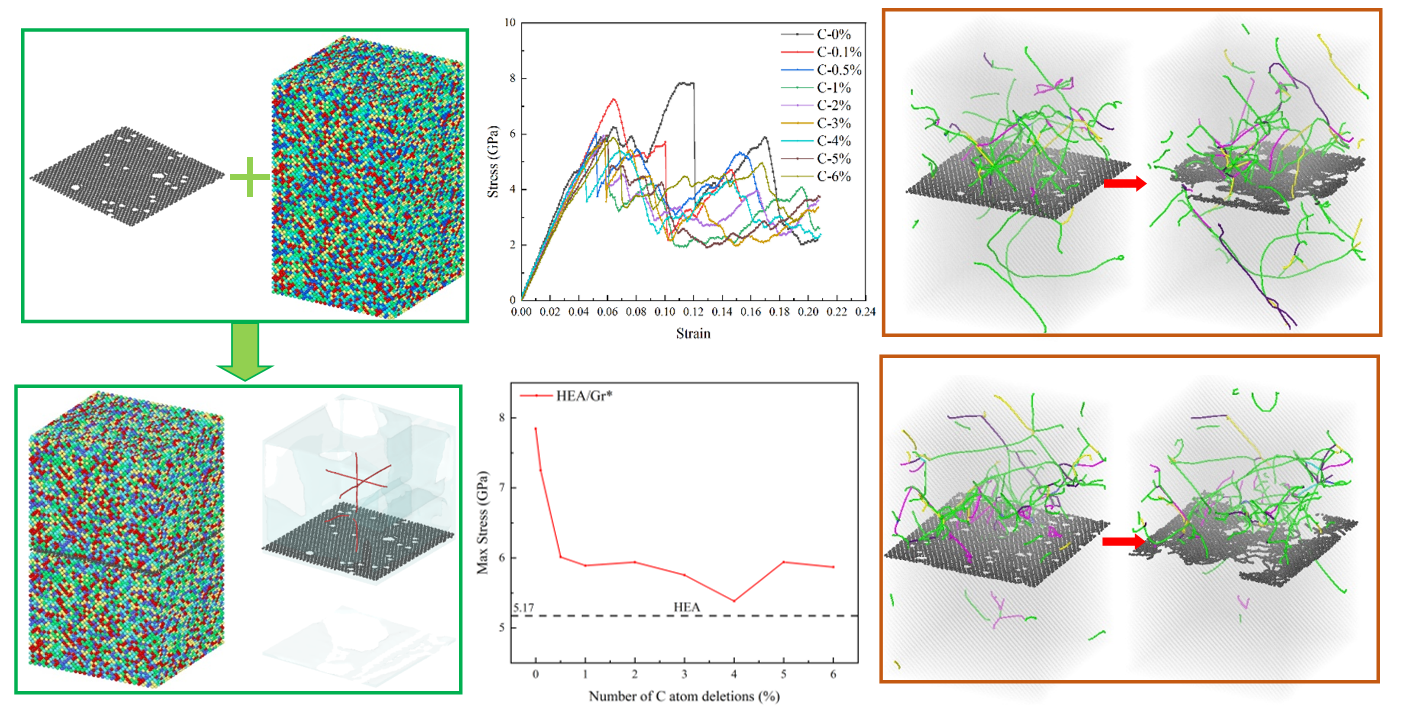
In our current work, all MD simulations are carried out utilizing the LAMMPS software[23]. During the model construction process, a single-crystal copper model was initially established. Subsequently, 4/5 of the copper atoms were uniformly replaced with four distinct metal atoms to yield a FeNiCrCoCu HEA with identical elemental proportions and a random distribution of each atomic species. The model dimensions were measured to be 101017 nm, as depicted in Figure 1(a). Ultimately, a monolayer Gr sheet, identical in base dimensions, was seamlessly integrated into the HEA model[24]. Consequently, a HEA/Gr composite model was successfully established, with its atomic configuration depicted in Figure 1(b). The x, y, and z axes are aligned with the [-110], [-112], and [111] directions of the HEA matrix, respectively. As depicted in Figure 1(c), a gap of 0.5 nm is reserved between HEAs to prevent atomic overlap, facilitating the insertion of Gr sheets. To further explore the impact of Gr on dislocations, we conducted an additional set of simulations for comparison. Specifically, edge dislocations were introduced in the central region of the upper half of the model, aligned with the coordinate system, and extending approximately 22 nm in length. The lattice configuration of the model and the precise location of the introduced dislocation lines are illustrated in Figure 1(e) and (f). After introducing dislocations, the lattice type of the upper section of the model underwent significant alterations, giving rise to unidentifiable lattice patterns on the model’s surface. The dislocations revealed by OVITO software indicated the presence of numerous defective grids at the insertion points of graphene and across the model’s surface. To create multiple vacancy defects, we randomly eliminated C atoms from Gr, relaxing the structure subsequently. The resulting model, depicted in Figure 1(d) and denoted as Gr*, was generated by removing 1% of the C atoms. Notably, when removing C atoms, if the number of atoms deleted is even, the C atoms can be fully reconstructed, thus avoiding the formation of dangling bonds. However, the absence of an odd number of atoms can render Gr more unstable and reactive due to the presence of dangling bonds[25].
2.2. Interatomic Potentials
In this article, we utilize LAMMPS to simulate the aforementioned model, employing the Embedded Atom Method (EAM) potential to delineate the intricate interactions among metal atoms. The EAM potential function model comprises both atomic and environmental attributes, effectively simulating the interactions between atoms as well as the structural behavior of atoms within crystals. This approach exhibits remarkable accuracy in characterizing the metal structure, mechanical properties, and thermodynamic behaviors of real-world materials. Specifically, the EAM potential is comprised of a pair potential and an embedding energy, which is expressed as follows:
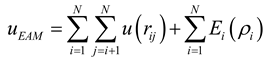
In the equation, UEAM represents the total potential energy of the entire system, rij denotes the distance between atom i and atom j, Ei signifies the embedding energy of atom i, and ρi indicates the atom i by all other atoms within the system.
To be specific, this formula can be formulated as follows:
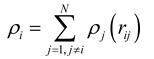
In the equation, ρj(rij) represents the electron density induced by atom j at position i.
For FeNiCrCoCu high-entropy alloys, the EAM potential reported by Farkas and Caro [26] characterizes the interactions among Fe, Ni, Cr, Co, and Cu atoms, which has been validated in prior investigations pertaining to the FeNiCrCoCu HEA system[27-29]. Using empirical potentials, the average lattice constant [30] and elastic constant [31] of FeNiCrCoCu HEA have been measured to be highly comparable to both experimental values and density functional theory calculations [32].
The Airebo potential [33] is employed to characterize the C-C bond interactions within Gr flakes, and this potential function has been extensively utilized in the investigation of carbon nanomaterials. Additionally, given that the interaction between metals and carbon is significantly weaker compared to that among metal atoms, the application of the Lennard-Jones (L-J) interaction potential suffices to furnish a reasonable approximation for the interaction between metals and carbon atoms[34-37]. It has been extensively utilized in a diverse array of composite systems to characterize metal-Gr interactions [38-41]. Consequently, the van der Waals force interaction between HEA and Gr can be accurately captured by a prototypical L-J potential [29], with the specific form of force action outlined as follows:
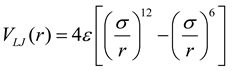
In the equation, r represents the distance between two particles, σ denotes the cutoff distance of the potential energy function, and ε signifies the depth of the potential energy function.
The L-J potential energy function comprises two components: the attraction term, which characterizes the van der Waals attraction among atoms, and the repulsion term, which accounts for the van der Waals repulsion between atoms. Together, these two terms determine the overall energy of atomic interactions. The L-J force field, a type of non-bonding force field, is employed to describe the interactions of non-covalent bonds, including van der Waals forces and electrostatic interactions, within molecules. The parameters of the L-J force field can be derived through experimental measurements or computational methods and can be further adjusted and optimized based on the specific simulated system. The values of σ and ε for various elements are detailed in Table 1.
2.3. Simulations
During the simulation, all three boundaries are periodic, and the entire process can be categorized into two distinct stages: relaxation and loading. Prior to loading the model, the conjugate gradient method was employed to minimize the model’s energy, utilizing a step size of 0.001 ps. Temperature control was achieved through the utilization of NVT and NPT ensembles. Given the diminished thermal stability of Gr once it reaches 800K, we established 800K as the maximum relaxation temperature to prevent any potential damage to Gr during the relaxation phase. Subsequently, the temperature was maintained at a constant 300K throughout the loading process. During the relaxation process, the temperature is initially raised from 300K to 800K using the NPT ensemble, followed by maintaining a constant temperature of 800K for 50 ps with the NVT ensemble. Subsequently, the NPT ensemble is employed for the cooling phase, gradually reducing the temperature from 800K back to 300K, and the model is then maintained at a constant temperature of 300K for an additional 50ps. This heating and cooling relaxation procedure allows the model to effectively release internal stress. Upon completion of relaxation, loading is initiated. Two distinct loading modes are employed in this study: stretching along the x-axis and compression along the z-axis, both with a loading strain rate of 109s-1. All model simulations presented in this article adhere to the relaxation and loading procedures outlined above.
3. Results
3.1. The Impact of Gr Vacancy Defects on the Tensile Performance
Figure 2 presents the stress-strain curves and dislocation distributions across various strain levels for three distinct models: pure HEA, HEA/Gr, and HEA/Gr*. Notably, all these datasets were derived from tensile simulations conducted along the x-axis, sans the introduction of initial dislocations. Specifically, HEA/Gr* denotes a modified version of the model where 1% of the C atoms in Gr have been removed. Prior investigations have thoroughly analyzed and drawn conclusions from the data obtained from both the HEA and HEA/Gr models. However, due to the premature failure of Gr, unexpected defects emerged in the single-crystal HEA, ultimately leading to a significantly lower yield strength in the HEA/Gr model compared to the pure HEA model. After introducing defects into Gr, similar outcomes were observed. As depicted in Figure 2(a), during the initial stages of strain, the high modulus of Gr contributed to an enhancement in the overall elastic modulus. Notably, the curves of the two models incorporating Gr exhibited a close resemblance, albeit with the elastic modulus of HEA/Gr* being slightly inferior to that of HEA/Gr. Examining the dislocation distribution depicted in Figure 2, it becomes evident that during the subsequent stretching process, the failure of Gr precedes the failure of HEA, resulting in the formation of numerous defects within the model. These defects provide fertile ground for dislocation nucleation, manifesting as a downward shift in stress within the stress-strain curve. Notably, even though HEA retains its load-bearing capacity during this phase, the HEA/Gr model exhibits a lower yield stress compared to the pure HEA model. Furthermore, in the case of the HEA/Gr* model, the presence of vacancy defects within Gr renders it more susceptible to failure. Consequently, Figure 2(a) illustrates an earlier occurrence of stress mutation in Gr. However, given the similarity in the state of HEA, the yield stress and yield strain of the HEA/Gr* model remain closely aligned with those of the HEA/Gr model. Nevertheless, a noteworthy observation is that the HEA/Gr* model exhibits a higher flow stress following yield. As evident from (c4) and (d4) in Figure 2, the model exhibits a significant generation of dislocations following yielding. Notably, the quantity of dislocations observed in (d4) is conspicuously greater than that in (c4). This disparity can be attributed to the inherent vacancy defects in Gr*, which contribute to the formation of a higher number of defects upon failure. Consequently, during the overall yielding process of the model, a greater number of dislocations nucleate, leading to the emergence of numerous dislocation lines. Among these dislocation lines, the green Shockley dislocation and Stair-rod dislocation constitute the largest proportion. Notably, the Stair-rod dislocation possesses the lowest dislocation energy among all types, indicating its ability to counteract substantial stress. Therefore, it is widely recognized that the Stair-rod dislocation plays a pivotal role in enhancing the strength of the matrix. An increase in the number of dislocations enhances the strength of the matrix, evident from the comparison of stress-strain curves between the HEA/Gr and HEA/Gr* models, where the flow stress after yielding is notably higher in the HEA/Gr* model than in the HEA/Gr model.
The stress-strain data and dislocation distribution across various strain levels, obtained through the tensile simulation of the model incorporating initial dislocations along the x-axis, are depicted in Figure 3. Upon examination of Figure 3(a), it becomes evident that the strength of all three models has undergone a notable decline. Notably, the curves within the elastic phase exhibit remarkable similarity, with a narrowed gap in elastic modulus. This observation suggests a diminished role of Gr in load-bearing capabilities, with its primary influence being the modulation of the model’s initial dislocations. Prior to entering the local yielding stage, specifically during the initial yielding of the HEA/Gr model, the stress levels exhibited by both the HEA/Gr and HEA/Gr* models are approximately equivalent and significantly surpass that of the pure HEA model. Upon the local yielding of HEA, Gr assumes the role of load bearing. However, at this juncture, Gr* with vacancy defects experience rapid failure, rendering it incapable of enduring further stress. Consequently, the subsequent curve trend of the model closely resembles that of the pure HEA, lacking any subsequent secondary elasticity or overall yielding stages. From a comparative analysis of (b1-b3) and (c1-c3) in Figure 3, it becomes evident that Gr serves as an effective barrier, significantly impeding the migration of initial dislocations from the upper section of the model towards the region beneath Gr. This hindrance mitigates the detrimental impact of initial dislocations on the overall structural integrity of the model, thereby enhancing its overall yield strength. Furthermore, Figure 3(d1) illustrates that despite the presence of vacancy defects in Gr, it retains a certain degree of resistance against dislocations. Consequently, only a minimal number of dislocation lines are formed in the lower portion. However, these vacancies compromise the strength of Gr, leading to its fracture as depicted in Figure 3(d2). Subsequently, the overall strength experiences a sudden downward shift, resulting in a rapid yield.
In Figure 4(a), the variations in HCP scores across models are evident. of these changes exhibits a remarkable similarity among the models, with the numerical ranking being HEA/Gr > HEA/Gr* > pure HEA. This alignment coincides with the descending order of their respective strengths. This concordance can be attributed to the fact that the number of HCPs influences the degree of difficulty in model deformation; specifically, a higher count of HCPs renders the model less susceptible to deformation. A comparative analysis of the HEA/Gr curves in Figure 3(a) and Figure 4(a) reveals a pattern: abrupt changes in stress are frequently accompanied by corresponding shifts in HCP scores. A similar trend is observed in HEA/Gr*, albeit with a narrower range of variation and a more undulating curve. Comparing the twinning variations among the three models depicted in Figure 4, it becomes evident that only HEA/Gr exhibits a significant generation of twins in both the upper and lower sections of the model. In contrast, pure HEA and HEA/Gr* primarily exhibit twinning in the upper portion, with only a minor presence in the lower Prior to the failure of Gr, the twinning directions vary among the three models. This variance can be attributed to the fact that once the HEA model enters the local yield stage in the upper section, its lower section remains capable of bearing the load. Consequently, a contraction force, opposing the tensile direction, arises at the junction between the upper and lower parts, giving rise to the twinning direction observed in Figure 4(b2). For the HEA/Gr model, Gr’s central position and superior strength enable it to exert a contraction force that extends to the lower half of the model. Consequently, this results in the twinning transformation depicted in Figure 4 (c2), where numerous twins are formed in both the upper and lower sections due to the contraction force. Once the model reaches its overall yield point, it ceases to generate a reverse contraction force, leading to the formation of twins as observed in Figures 4 (b5) and (c5). On the other hand, in the HEA/Gr* model, the presence of vacancy defects weakens the strength of Gr, preventing it from exerting a contraction force that affects both halves of the model. Instead, similar to pure HEA, a contraction force is generated at the interface between HEA and Gr, primarily affecting the upper part of the model, along with the lower part that can still sustain the load. Consequently, twinning is primarily concentrated in the upper section, and the twinning direction exhibits significant differences from the subsequent stages.
It can be concluded that, during tensile simulations conducted parallel to the graphene direction, Gr* exhibits a hindering effect on dislocations even when containing a certain number of vacancy defects. By limiting the diffusion of dislocation defects, it prevents initial dislocations from causing structural damage, thereby exerting a certain strengthening effect on the model. Nevertheless, the presence of vacancy defects compromises the inherent strength of Gr*, leading to earlier fracture and a reduced number of twins generated. Consequently, the strengthening effect is attenuated compared to Gr without vacancy defects.
3.2. The Impact of Gr Vacancy Defects on the Compressive Performance
Compared to tensile simulations, Gr exhibits more pronounced strengthening when the model is subjected to pressure, and the influence of vacancy defects on Gr* strengthening is also more evident. The model utilized in this simulation remains identical to the one employed in the preceding section. Figure 5 illustrates the stress-strain curve under compression along the z-axis. Notably, during the elastic stage, there are distinct disparities in the elastic modulus and yield strength among the three models. Specifically, the HEA/Gr model exhibits the highest elastic modulus and yield strength. However, the presence of vacancy defects in Gr* significantly diminishes the elastic modulus and yield strength of the HEA/Gr* model, albeit still remaining significantly superior to the pure HEA model. Concurrently, these vacancy defects compromise the load bearing and deformation capabilities of Gr. Consequently, due to the failure of Gr, the HEA/Gr* model is the first to yield among the three simulations. In fact, the strengthening mechanism of Gr on the matrix model primarily relies on its influence on dislocations. For models devoid of initial dislocations, there is no nucleation of dislocations prior to yielding. Consequently, the enhancement of the yield strength of the model by Gr is primarily attributed to its inherent high compressive strength. However, once the model yields, a significant number of dislocations nucleate, and Gr effectively hinders these dislocations, thereby strengthening the flow stress of the model. As evident from the plastic stage depicted in Figure 5 and Figure 6, the flow stress of both the HEA/Gr and HEA/Gr* models is comparable and superior to that of the pure HEA model. This underscores the fact that, despite reducing the strength of Gr* itself, vacancy defects do not impede its ability to affect dislocations and consequently strengthen the model by hindering their movement.
After incorporating initial dislocations, the stress-strain curves and dislocation distributions resulting from the compression simulation of the three models are presented in Figure 6. It is established that Gr primarily enhances the matrix strength by influencing dislocations, and its impact is even more pronounced in the presence of initial dislocations. From the stress-strain curves depicted in Figure 6(a), the yield stress of both models incorporating Gr exceeds that of the pure HEA model. Notably, the* model retains a high strength level during the initial yield, comparable to the HEA/Gr model, suggesting that despite having vacancy defects, Gr* can effectively hinder the propagation of initial dislocations. Furthermore, the dislocation distribution shown in Figures 6(b1) and (d1) reveals that the model containing Gr* exhibits a significantly reduced number of dislocations in its lower half, whereas the initial dislocations in the pure HEA model have diffused into other regions. After experiencing stress oscillation and entering the second elastic stage, Gr* is unable to sustain further stress and is promptly crushed, leading to the overall transition into the yield stage. Conversely, in the HEA/Gr model, the absence of vacancy defects allows Gr to endure greater forces, thereby enhancing the overall model strength.
In summary, it can be deduced that Gr plays a more significant role in the compression simulation conducted perpendicular to the graphene surface, while vacancy defects exert a greater influence on the strengthening effect of Gr. Despite the presence of dislocation defects, Gr can still impede dislocations, exerting a certain strengthening impact on the model during the initial stages of strain. Furthermore, it continues to enhance flow stress even after the overall yield of the model. Nevertheless, the inherent strength of Gr* is rather low, rendering it susceptible to rapid damage when subjected to loading. Consequently, its strengthening effect is attenuated compared to Gr without vacancy defects.
3.3. The Impact of Varying Quantities of Vacancy Defects on the Enhancement Effect
After discussing the distinct strengthening effects of Gr and Gr* on the model, we further investigated the impact of varying vacancy defect concentrations on the strengthening capabilities of Gr by meticulously controlling the number of randomly deleted C atoms. Based on our prior discussions, it is evident that the primary mechanism of Gr’s strengthening effect lies in its ability to hinder dislocations. Consequently, in this section, we introduced initial dislocations to the upper portion of the model, ensuring that the number and location of these dislocations remained consistent across all models, with the sole exception being the varying number of C atoms within Gr. Figure 7 presents the relaxed Gr models obtained after randomly deleting different percentages of C atoms, specifically 0.1%, 0.5%, 1%, 2%, 3%, 4%, 5%, and 6%. Notably, in the preceding the Gr* utilized HEA/Gr* composite had a C atom deletion rate of 1%.
Tensile simulations along the x-direction and compressive simulations along the y-direction were conducted on the HEA/Gr* models and the HEA/Gr models without vacancy defects, respectively, which were composed of the aforementioned eight sets of models. The stress-strain curves obtained are depicted in Figure 8. The number of C atoms in Gr totals 2640, with the number of atoms deleted rounded off to the nearest whole number according to the rule of four rounding. Notably, the model with the minimal defect count involved the deletion of merely 3 C atoms (C-0.1%), whereas the model with the highest defect count saw the removal of 158 C atoms (C-6%). Evidently, Figure 8 illustrates that vacancy defects exert an influence on the overall strength of the models throughout various stages of strain, and this impact becomes increasingly significant with a rise in the number of defects. Figure 8(a) depicts the stress-strain curve obtained from the tensile simulation. Evidently, the models incorporating vacancy defects exhibit inferior strength compared to the HEA/Gr model. Notably, in models where the deletion of C atoms exceeds or equals 0.5%, a downward stress anomaly is observed during the elastic phase. This anomaly arises due to the proliferation of vacancy defects, which diminishes the strength of Gr* and precipitates its premature failure. Since Gr’s reinforcement mechanism primarily relies on its inherent strength and the impediment it poses to dislocations, the absence of Gr* following its failure negates its load-bearing capacity. Consequently, dislocations are able to traverse the failed region of Gr*, thereby not only diminishing the yield stress of the model but also advancing the overall yield strain.
Figure 8(b) depicts the stress-strain curve obtained from the compression simulation, allowing for similar inferences as drawn from the tensile simulation. Nevertheless, due to the variance in the direction of applied force, Gr* exhibits remarkable compressive resilience under perpendicular pressure loads to its plane, enabling it to sustain greater strains. Notably, Gr* fails only after the yield point of HEA is reached, contrasting with observations from the tensile simulation. Consequently, our analysis primarily focuses on elucidating the failure mechanisms and dislocation distributions of Gr* during the compression simulation. Figure 9 illustrates the atomic views of Gr* with varying defect concentrations, both prior to and following its failure, along with the corresponding dislocation patterns under specific strain conditions during the compression simulation. Evidently, the failure mode of Gr* is significantly influenced by defects, with the size and distribution of vacancy defects exerting a profound impact on its deformation behavior. This is attributed to the generation of elevated local stresses at the vacancy defects, which primarily accounts for the reduction in Gr* strength. Figure 9 further reveals that upon the destruction of Gr, dislocations initiate their passage through the damaged area, whereas the unaffected regions continue to impede their movement. Notably, even after the overall yield of the model, Gr retains its capacity to enhance the flow stress. At this juncture, the disparity in defect counts exerts minimal influence, as the flow stress exhibited by HEA/Gr* incorporating various vacancy defects remains comparable to that of the defect-free variant and surpasses the pure HEA model. Prior to the destruction of Gr, the lower section of the model witnessed the emergence of only a limited number of dislocations. However, an increase in defect concentration significantly impacts the dislocation density in this region. A closer inspection of (a1), (b1), (g1), and (h1) in Figure 9 offers a clearer picture of this phenomenon. As the number of vacancy defects escalates, dislocations begin to penetrate Gr in smaller quantities, ultimately contributing to the overall reduction in the model’s strength. Contrary to yield strength, the yield strain of the model does not consistently decrease with the augmentation of defects. In fact, when the number of vacancy defects is relatively small, a concentrated distribution of a few defects is more prone to causing damage to the model, whereas a larger but uniformly distributed number of vacancy defects tends to stabilize the material structure and enhance its toughness. Consequently, for (g) and (h) in Figure 9, which depict the removal of two sets of models containing 5% and 6% C atoms, the strain at Gr* failure was observed to be higher than that of HEA/Gr* models with varying defect concentrations. This noteworthy trend is also evident in tensile simulations.
When the quantity of deleted C atoms surpasses 6% (C>6%), Gr experiences an excessive number of vacancy defects, greatly compromising its structural stability. Consequently, the enhancement effect on the model approaches zero, and its overall strength approximates that of the pure HEA model. Conversely, when the deletion of C atoms remains below 1% (C<1%), Gr exhibits minimal vacancy defects, rendering the model nearly flawless. In this scenario, Gr* retains a notable enhancement effect on the model. Figure 10 illustrates the trend in maximum stress values across various model groups, with the dashed line representing the maximum stress value simulated by the pure HEA model under identical conditions. Notably, Figure 10 reveals that as the percentage of deleted C atoms ranges from 1% to 6% (1%≤C* ≤6%), the model’s strength stabilizes gradually. Interestingly, when precisely 4% of C atoms are removed, the model’s strength lags behind all other HEA/Gr* configurations. This anomaly arises from the formation of larger, more clustered vacancies and dangling bonds within the model during the random deletion of 4% C atoms, ultimately reducing the strength of Gr* compared to other groups. Furthermore, it is evident that Gr* exhibits a more pronounced impact on enhancing the model’s compressive strength when confronted with dislocations.
4. Conclusions
In summary, we employed molecular dynamics to investigate the impact of vacancy defects on the strengthening effect of Gr in FeNiCrCoCu HEA/Gr systems. Graphene sheets containing varying numbers of vacancy defects were incorporated into a pristine single-crystal high-entropy alloy model. Additionally, initial edge dislocations were introduced in the upper section of the model. Tensile and compressive simulations were performed on diverse HEA/Gr models, which were subsequently compared with HEA/Gr configurations devoid of vacancy defects and pure HEA models. The key findings derived from the comprehensive data analysis are outlined as follows.
(1) Vacancy defects can lead to a reduction in the strength of Gr, rendering it more susceptible to damage when it is required to bear loads. Compared to Gr without such defects, the strengthening effect is diminished. During simulations, the strain nodes associated with Gr failure occur prematurely, yet they still contribute to a certain degree of strengthening for the overall model. Research indicates that Gr* with a minimal amount of vacancy defects remains effective in blocking the movement of dislocations, altering the direction of dislocation propagation, and increasing dislocation density. When confronted with initial dislocations, this can enhance the local yield stress of the model. Notably, in compression simulations conducted perpendicular to the graphene plane, Gr* plays a pivotal role in bolstering the flow stress of the model, even after the overall yield point has been reached.
(2) Introducing varying quantities of vacancy defects into Gr* exerts diverse degrees of influence on its strengthening effect. Both the size and distribution of these defects play a pivotal role in shaping the deformation behavior of Gr*. A small yet concentrated number of vacancy defects renders the model more susceptible to damage, whereas a larger quantity of defects distributed uniformly enhances the stability and toughness of the model. When the concentration of vacancy defects in Gr* is low (C*>6%), Gr* struggles to maintain the stability of its structure, suffering damage during the relaxation phase. Consequently, the strengthening effect disappears in the elastic stage, and the model’s overall yield strength approaches that of pure HEA.
Author Contributions
Conceptualization, X.H. Z. and C. Z.; methodology, X.H. Z.; software, X.H. Z. and H. W.; validation, X.Y. Z. and C. Z.; formal analysis, X.H. Z. and C.P. Z.; investigation, X.H. Z.; resources, X.H. Z.; data curation, C. Z.; writing—original draft preparation, X.H. Z.; writing—review and editing, X.H. Z.; visualization, X.H. Z. and H. W.; supervision, X.H. Z. and H. W.; project administration, X.H. Z.; funding acquisition, X.H. Z. and H. W. All authors have read and agreed to the published version of the manuscript.
Funding
This research was funded by National Natural Science Foundation of China [Grant number 12002223], the National Natural Science Foundation of Hebei Province [Grant no. A2020210035], the Scientific Research Plan Projects for Higher Schools in Hebei Province (Projects for young top talent) [Grant no. BJ2025102].
Data Availability Statement
The original contributions presented in the study are included in the article, further inquiries can be directed to the corresponding author.
Conflicts of Interest
The authors declare no conflicts of interest
References
- Lee, C. , et al., Lattice distortion in a strong and ductile refractory high-entropy alloy. Acta Materialia, 2018. 160: p. 158-172.
- Chung, D., Z. Ding, and Y. Yang, Hierarchical eutectic structure enabling superior fracture toughness and superb strength in CoCrFeNiNb0. 5 eutectic high entropy alloy at room temperature. Advanced Engineering Materials, 2019. 21(3): p. 1801060.
- Chou, Y., J. Yeh, and H. Shih, The effect of molybdenum on the corrosion behaviour of the high-entropy alloys Co1. 5CrFeNi1. 5Ti0. 5Mox in aqueous environments. Corrosion Science, 2010. 52(8): p. 2571-2581.
- Yang, T. , et al., Irradiation responses and defect behavior of single-phase concentrated solid solution alloys. Journal of Materials Research, 2018. 33(19): p. 3077-3091.
- Ye, Y.; Wang, Q.; Zhao, Y.; He, Q.; Lu, J.; Yang, Y. Elemental segregation in solid-solution high-entropy alloys: experiments and modeling. Journal of Alloys and Compounds 2016, 681, 167–174. [Google Scholar] [CrossRef]
- Wu, S.; Qiao, D.; Zhang, H.; Miao, J.; Zhao, H.; Wang, J.; Lu, Y.; Wang, T.; Li, T. Microstructure and mechanical properties of CxHf0. 25NbTaW0. 5 refractory high-entropy alloys at room and high temperatures. Journal of Materials Science & Technology 2022, 97, 229–238. [Google Scholar]
- Gao, Z.; Niu, Z.; Gao, Z.; Li, J.; Bai, G.; Ke, L.; Yu, Y.; Zhang, C. Microstructure and wear behavior of in-situ synthesized TiC-reinforced CoCrFeNi high entropy alloy prepared by laser cladding. Applied Surface Science 2024, 670, 160720. [Google Scholar] [CrossRef]
- Ares, P.; Novoselov, K.S. Recent advances in graphene and other 2D materials. Nano Materials Science 2022, 4, 3–9. [Google Scholar] [CrossRef]
- Ye, W.; Shi, Y.; Zhou, Q.; Xie, M.; Wang, H.; Bou-Saïd, B.; Liu, W. Recent advances in self-lubricating metal matrix nanocomposites reinforced by carbonous materials: A review. Nano Materials Science 2024. [Google Scholar] [CrossRef]
- Zhou, C.; Qing, F.; Sun, X.; Wu, R.; Wang, H.; Wen, Q.; Li, X. Preparation of graphene-coated Cu particles with oxidation resistance by flash joule heating. Carbon 2024, 224, 119060. [Google Scholar] [CrossRef]
- Li, S.; Zhou, Q.; Shi, Y.; Ye, W.; Lin, Y.; Wang, H. The deformation mechanism of graphene nanosheets embedded in high-entropy alloy upon sliding. Carbon 2024, 229, 119532. [Google Scholar] [CrossRef]
- Ye, W.; Zhou, Q.; Shi, Y.; Xie, M.; Chen, B.; Wang, H.; Liu, W. Robust wear performance of graphene-reinforced high entropy alloy composites. Carbon 2024, 224, 119040. [Google Scholar] [CrossRef]
- Hashimoto, A.; Suenaga, K.; Gloter, A.; Urita, K.; Iijima, S. Direct evidence for atomic defects in graphene layers. nature 2004, 430, 870–873. [Google Scholar] [CrossRef]
- Christian; Kisielowski. Observing Atoms at Work by Controlling Beam-Sample Interactions. Advanced materials (Deerfield Beach, Fla.) 2015.
- B, B.P.A.; A, E.M.; B, A.B.; C, M.H.R.; C, T.G.; D, J.N.; D, V.S.; B, R.J.K.; C, T.P.; A, S.R.P.S. Iron filled single-wall carbon nanotubes – A novel ferromagnetic medium. Chemical Physics Letters 2006, 421, 129–133. [Google Scholar]
- Gass, M.H.; Bangert, U.; Bleloch, A.L.; Wang, P.; Nair, R.R.; Geim, A.K. Free-standing graphene at atomic resolution. Nature Nanotechnology 2008, 3, 676–681. [Google Scholar] [CrossRef] [PubMed]
- Meyer, J.C.; Kisielowski, C.; Erni, R.; Rossell, M.D.; Crommie, M.F.; Zettl, A. Direct Imaging of Lattice Atoms and Topological Defects in Graphene Membranes. Nano Letters 2008, 8, 3582–3586. [Google Scholar] [CrossRef] [PubMed]
- Sethurajaperumal, A.; Ravichandran, V.; Merenkov, I.; Ostrikov, K.K.; Varrla, E. Delamination and defects in graphene nanosheets exfoliated from 3D precursors. Carbon 2023, 213, 118306. [Google Scholar] [CrossRef]
- Robertson, A.W.; Allen, C.S.; Wu, Y.A.; He, K.; Olivier, J.; Neethling, J.; Kirkland, A.I.; Warner, J.H. Spatial control of defect creation in graphene at the nanoscale. Nature communications 2012, 3, 1144. [Google Scholar] [CrossRef]
- Ansari, R.; Ajori, S.; Motevalli, B. Mechanical properties of defective single-layered graphene sheets via molecular dynamics simulation. Superlattices and Microstructures 2012, 51, 274–289. [Google Scholar] [CrossRef]
- Tapia, A.; Peón-Escalante, R.; Villanueva, C.; Avilés, F. Influence of vacancies on the elastic properties of a graphene sheet. Computational Materials Science 2012, 55, 255–262. [Google Scholar] [CrossRef]
- Fedorov, A.S.; Popov, Z.I.; Fedorov, D.A.; Eliseeva, N.S.; Serjantova, M.V.; Kuzubov, A.A. DFT investigation of the influence of ordered vacancies on elastic and magnetic properties of graphene and graphene-like SiC and BN structures. Physica Status Solidi 2012, 249, 2549–2552. [Google Scholar] [CrossRef]
- Lopez-Polin, G.; Gomez-Navarro, C.; Gomez-Herrero, J. The effect of rippling on the mechanical properties of graphene. Nano Materials Science 2022, 4, 18–26. [Google Scholar] [CrossRef]
- González, C.; Dappe, Y.J.; Dong, C.; Robinson, J.A.; Trampert, A.; Engel-Herbert, R. Atomic-scale characterization of defects in oxygen plasma-treated graphene by scanning tunneling microscopy. Carbon 2024, 227, 119260. [Google Scholar]
- Wei Wang, J.; Narayanan, S.; Yu Huang, J.; Zhang, Z.; Zhu, T.; Mao, S.X. Atomic-scale dynamic process of deformation-induced stacking fault tetrahedra in gold nanocrystals. Nature communications 2013, 4, 2340. [Google Scholar] [CrossRef]
- Plimpton, S. Fast parallel algorithms for short-range molecular dynamics. Journal of computational physics 1995, 117, 1–19. [Google Scholar] [CrossRef]
- Zhang, Q.; Huang, R.; Zhang, X.; Cao, T.; Xue, Y.; Li, X. Deformation mechanisms and remarkable strain hardening in single-crystalline high-entropy-alloy micropillars/nanopillars. Nano Letters 2021, 21, 3671–3679. [Google Scholar] [CrossRef] [PubMed]
- Bhatt, M.D.; Kim, H.; Kim, G. Various defects in graphene: a review. RSC advances 2022, 12, 21520–21547. [Google Scholar] [CrossRef]
- Farkas, D.; Caro, A. Model interatomic potentials and lattice strain in a high-entropy alloy. Journal of Materials Research 2018, 33, 3218–3225. [Google Scholar] [CrossRef]
- Deluigi, O.R.; Pasianot, R.C.; Valencia, F.; Caro, A.; Farkas, D.; Bringa, E.M. Simulations of primary damage in a High Entropy Alloy: Probing enhanced radiation resistance. Acta Materialia 2021, 213, 116951. [Google Scholar] [CrossRef]
- Li, J.; Dong, L.; Dong, X.; Zhao, W.; Liu, J.; Xiong, J.; Xu, C. Study on wear behavior of FeNiCrCoCu high entropy alloy coating on Cu substrate based on molecular dynamics. Applied Surface Science 2021, 570, 151236. [Google Scholar] [CrossRef]
- Xie, H.; Ma, Z.; Zhao, H.; Ren, L. Atomic perspective of contact protection in graphene-coated high-entropy films. Tribology International 2022, 174, 107748. [Google Scholar] [CrossRef]
- Zhang, H.; Siu, K.W.; Liao, W.; Wang, Q.; Yang, Y.; Lu, Y. In situ mechanical characterization of CoCrCuFeNi high-entropy alloy micro/nano-pillars for their size-dependent mechanical behavior. Materials Research Express 2016, 3, 094002. [Google Scholar] [CrossRef]
- Li, C.; Dedoncker, R.; Li, L.; Sedghgooya, F.; Zighem, F.; Ji, V.; Depla, D.; Djemia, P.; Faurie, D. Mechanical properties of CoCrCuFeNi multi-principal element alloy thin films on Kapton substrates. Surface and Coatings Technology 2020, 402, 126474. [Google Scholar] [CrossRef]
- Li, Z.; Guo, Q.; Li, Z.; Fan, G.; Xiong, D.-B.; Su, Y.; Zhang, J.; Zhang, D. Enhanced mechanical properties of graphene (reduced graphene oxide)/aluminum composites with a bioinspired nanolaminated structure. Nano letters 2015, 15, 8077–8083. [Google Scholar] [CrossRef]
- Stuart, S.J.; Tutein, A.B.; Harrison, J.A. A reactive potential for hydrocarbons with intermolecular interactions. The Journal of chemical physics 2000, 112, 6472–6486. [Google Scholar] [CrossRef]
- Zhang, C.; Lu, C.; Michal, G.; Li, J.; Wang, R. Strong strain hardening in graphene/nanotwinned metal composites revealed by molecular dynamics simulations. International Journal of Mechanical Sciences 2021, 201, 106460. [Google Scholar] [CrossRef]
- Chien, S.-K.; Yang, Y.-T. A molecular dynamics study of the mechanical properties of graphene nanoribbon-embedded gold composites. Nanoscale 2011, 3, 4307–4313. [Google Scholar] [CrossRef]
- Guo, S.-J.; Yang, Q.-S.; He, X.; Liew, K. Modeling of interface cracking in copper–graphite composites by MD and CFE method. Composites Part B: Engineering 2014, 58, 586–592. [Google Scholar] [CrossRef]
- Zhang, S.; Huang, P.; Wang, F. Graphene-boundary strengthening mechanism in Cu/graphene nanocomposites: a molecular dynamics simulation. Materials & Design 2020, 190, 108555. [Google Scholar]
- Kim, Y.; Lee, J.; Yeom, M.S.; Shin, J.W.; Kim, H.; Cui, Y.; Kysar, J.W.; Hone, J.; Jung, Y.; Jeon, S. Strengthening effect of single-atomic-layer graphene in metal–graphene nanolayered composites. Nature communications 2013, 4, 2114. [Google Scholar] [CrossRef]
- Santhapuram, R.R.; Muller, S.E.; Nair, A.K. Nanoscale bending properties of bio-inspired Ni-graphene nanocomposites. Composite Structures 2019, 220, 798–808. [Google Scholar] [CrossRef]
- Shuang, F.; Aifantis, K.E. Dislocation-graphene interactions in Cu/graphene composites and the effect of boundary conditions: a molecular dynamics study. Carbon 2021, 172, 50–70. [Google Scholar] [CrossRef]
- Xie, L.; Brault, P.; Thomann, A.-L.; Bauchire, J.-M. AlCoCrCuFeNi high entropy alloy cluster growth and annealing on silicon: A classical molecular dynamics simulation study. Applied surface science 2013, 285, 810–816. [Google Scholar] [CrossRef]
- Xie, H.; Ma, Z.; Zhang, W.; Zhao, H.; Ren, L. Strengthening effect of high-entropy alloys endowed by monolayer graphene. Materials Today Physics 2022, 27, 100800. [Google Scholar] [CrossRef]
Figure 1.
(a) Atomic configuration of a pure HEA model; (b) Atomic configuration of the HEA/Gr model; (c) Local atomic structure of the HEA matrix and Gr flakes; (d) Gr* model with 1% of C atoms removed; (e) Lattice type of the HEA/Gr* model incorporating edge dislocations; (f) Def and dislocation distribution in the HEA/Gr* model with edge dislocations incorporated.
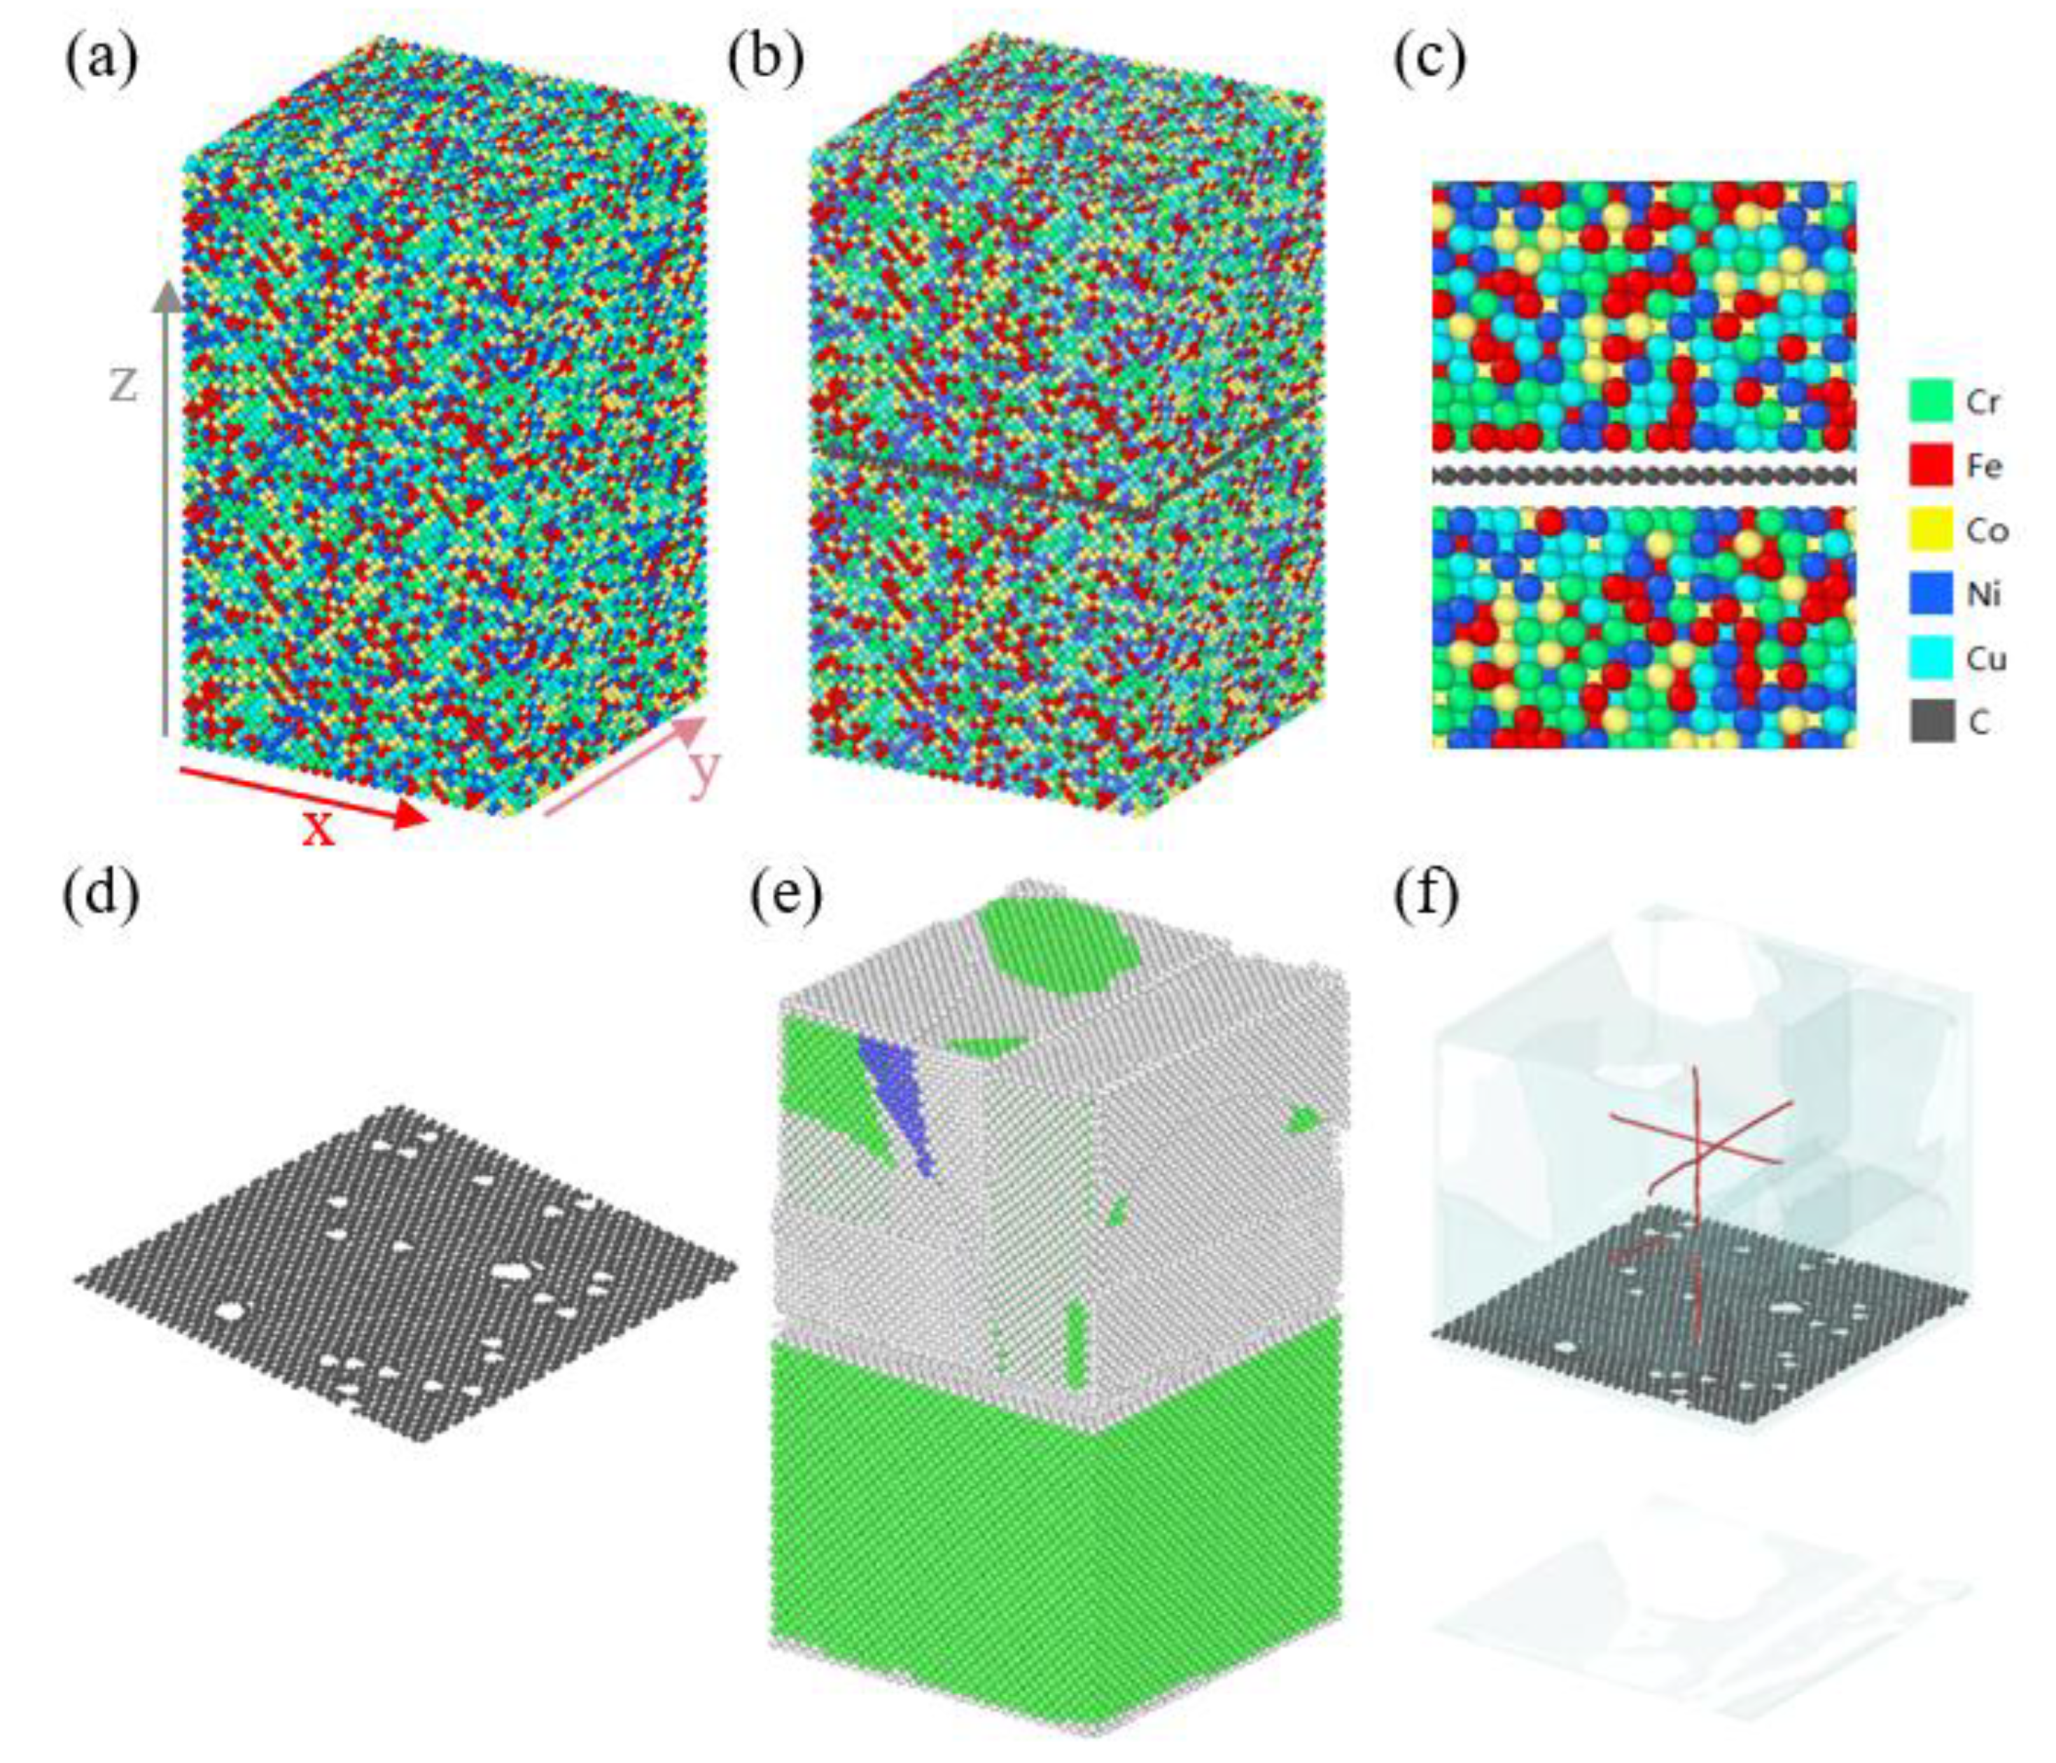
Figure 2.
Tensile stress-strain curves of pure HEA, HEA/Gr, and HEA/Gr* (with 1% of C atoms removed in Gr) models without the introduction of initial dislocations; dislocation distribution of pure HEA (b1-b4), HEA/Gr (c1-c4), and HEA/Gr (d1-d4) under various tensile strains.
Figure 2.
Tensile stress-strain curves of pure HEA, HEA/Gr, and HEA/Gr* (with 1% of C atoms removed in Gr) models without the introduction of initial dislocations; dislocation distribution of pure HEA (b1-b4), HEA/Gr (c1-c4), and HEA/Gr (d1-d4) under various tensile strains.
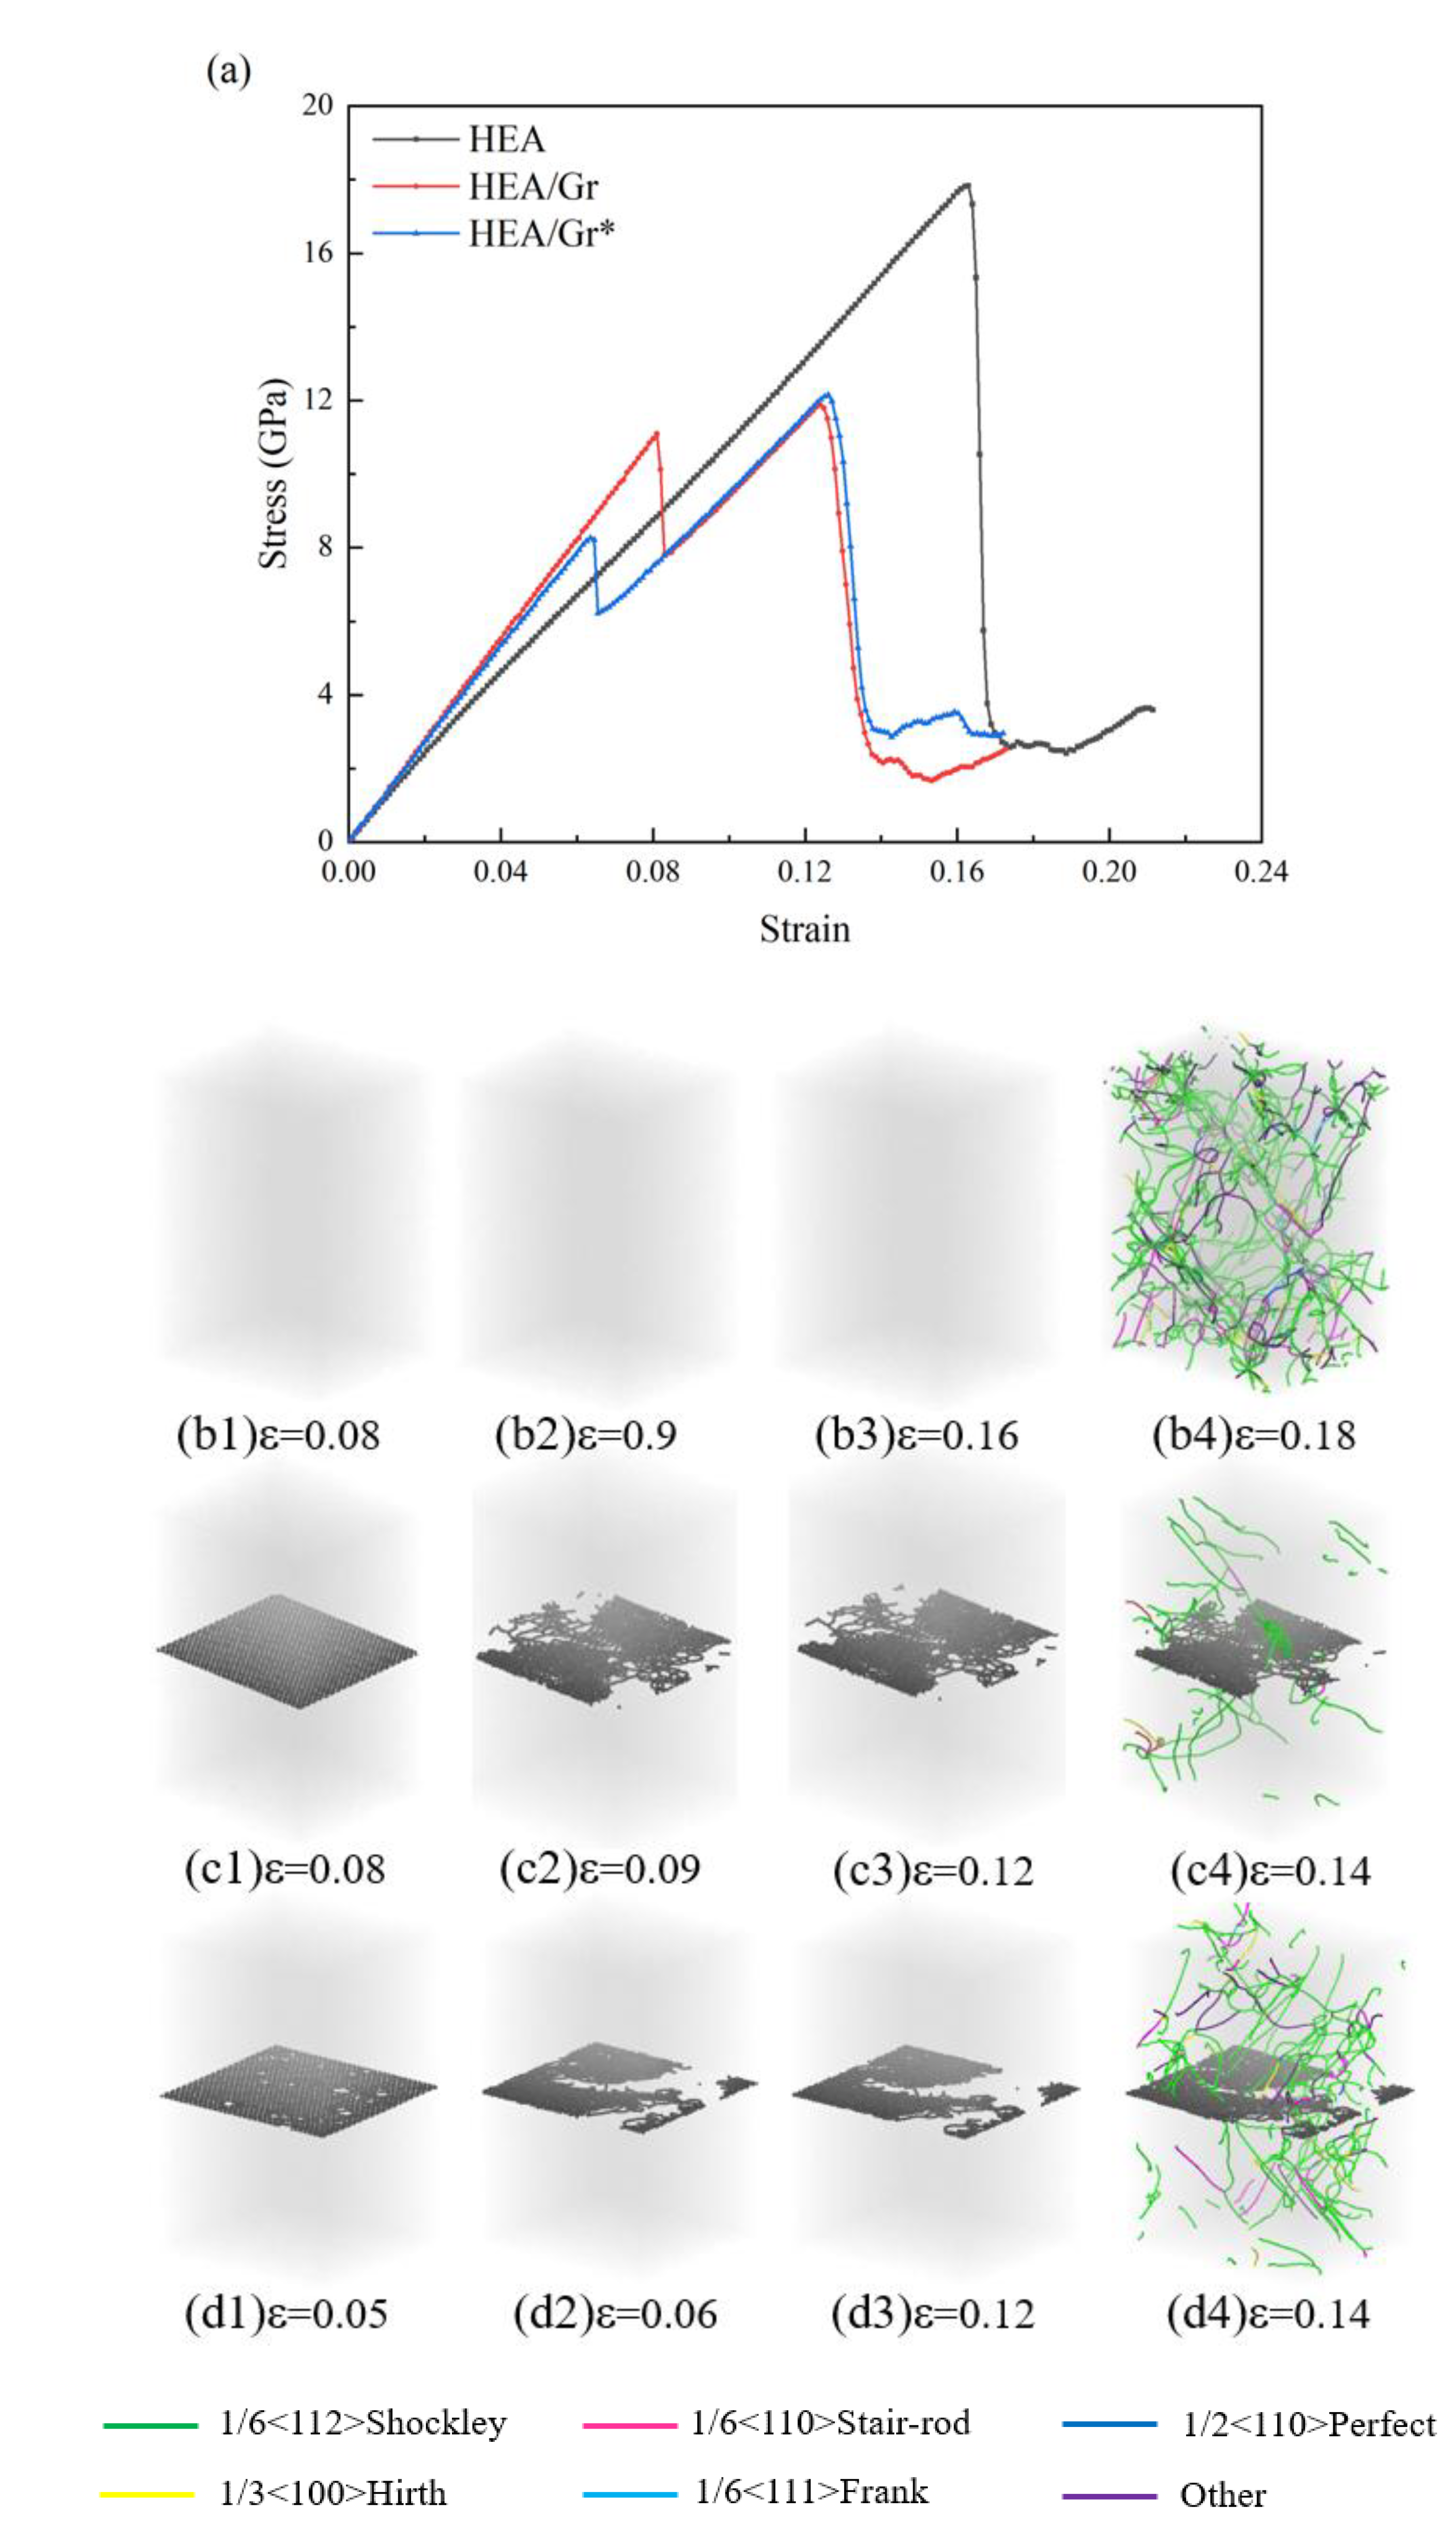
Figure 3.
Tensile stress-strain curves of pure HEA, HEA/Gr, and HEA/Gr* (with 1% of C atoms removed in Gr) models incorporating initial dislocation; dislocation distribution of pure HEA (b1-b4), HEA/Gr (c1-c4), and HEA/Gr (d1-d4) under varying tensile strains.
Figure 3.
Tensile stress-strain curves of pure HEA, HEA/Gr, and HEA/Gr* (with 1% of C atoms removed in Gr) models incorporating initial dislocation; dislocation distribution of pure HEA (b1-b4), HEA/Gr (c1-c4), and HEA/Gr (d1-d4) under varying tensile strains.
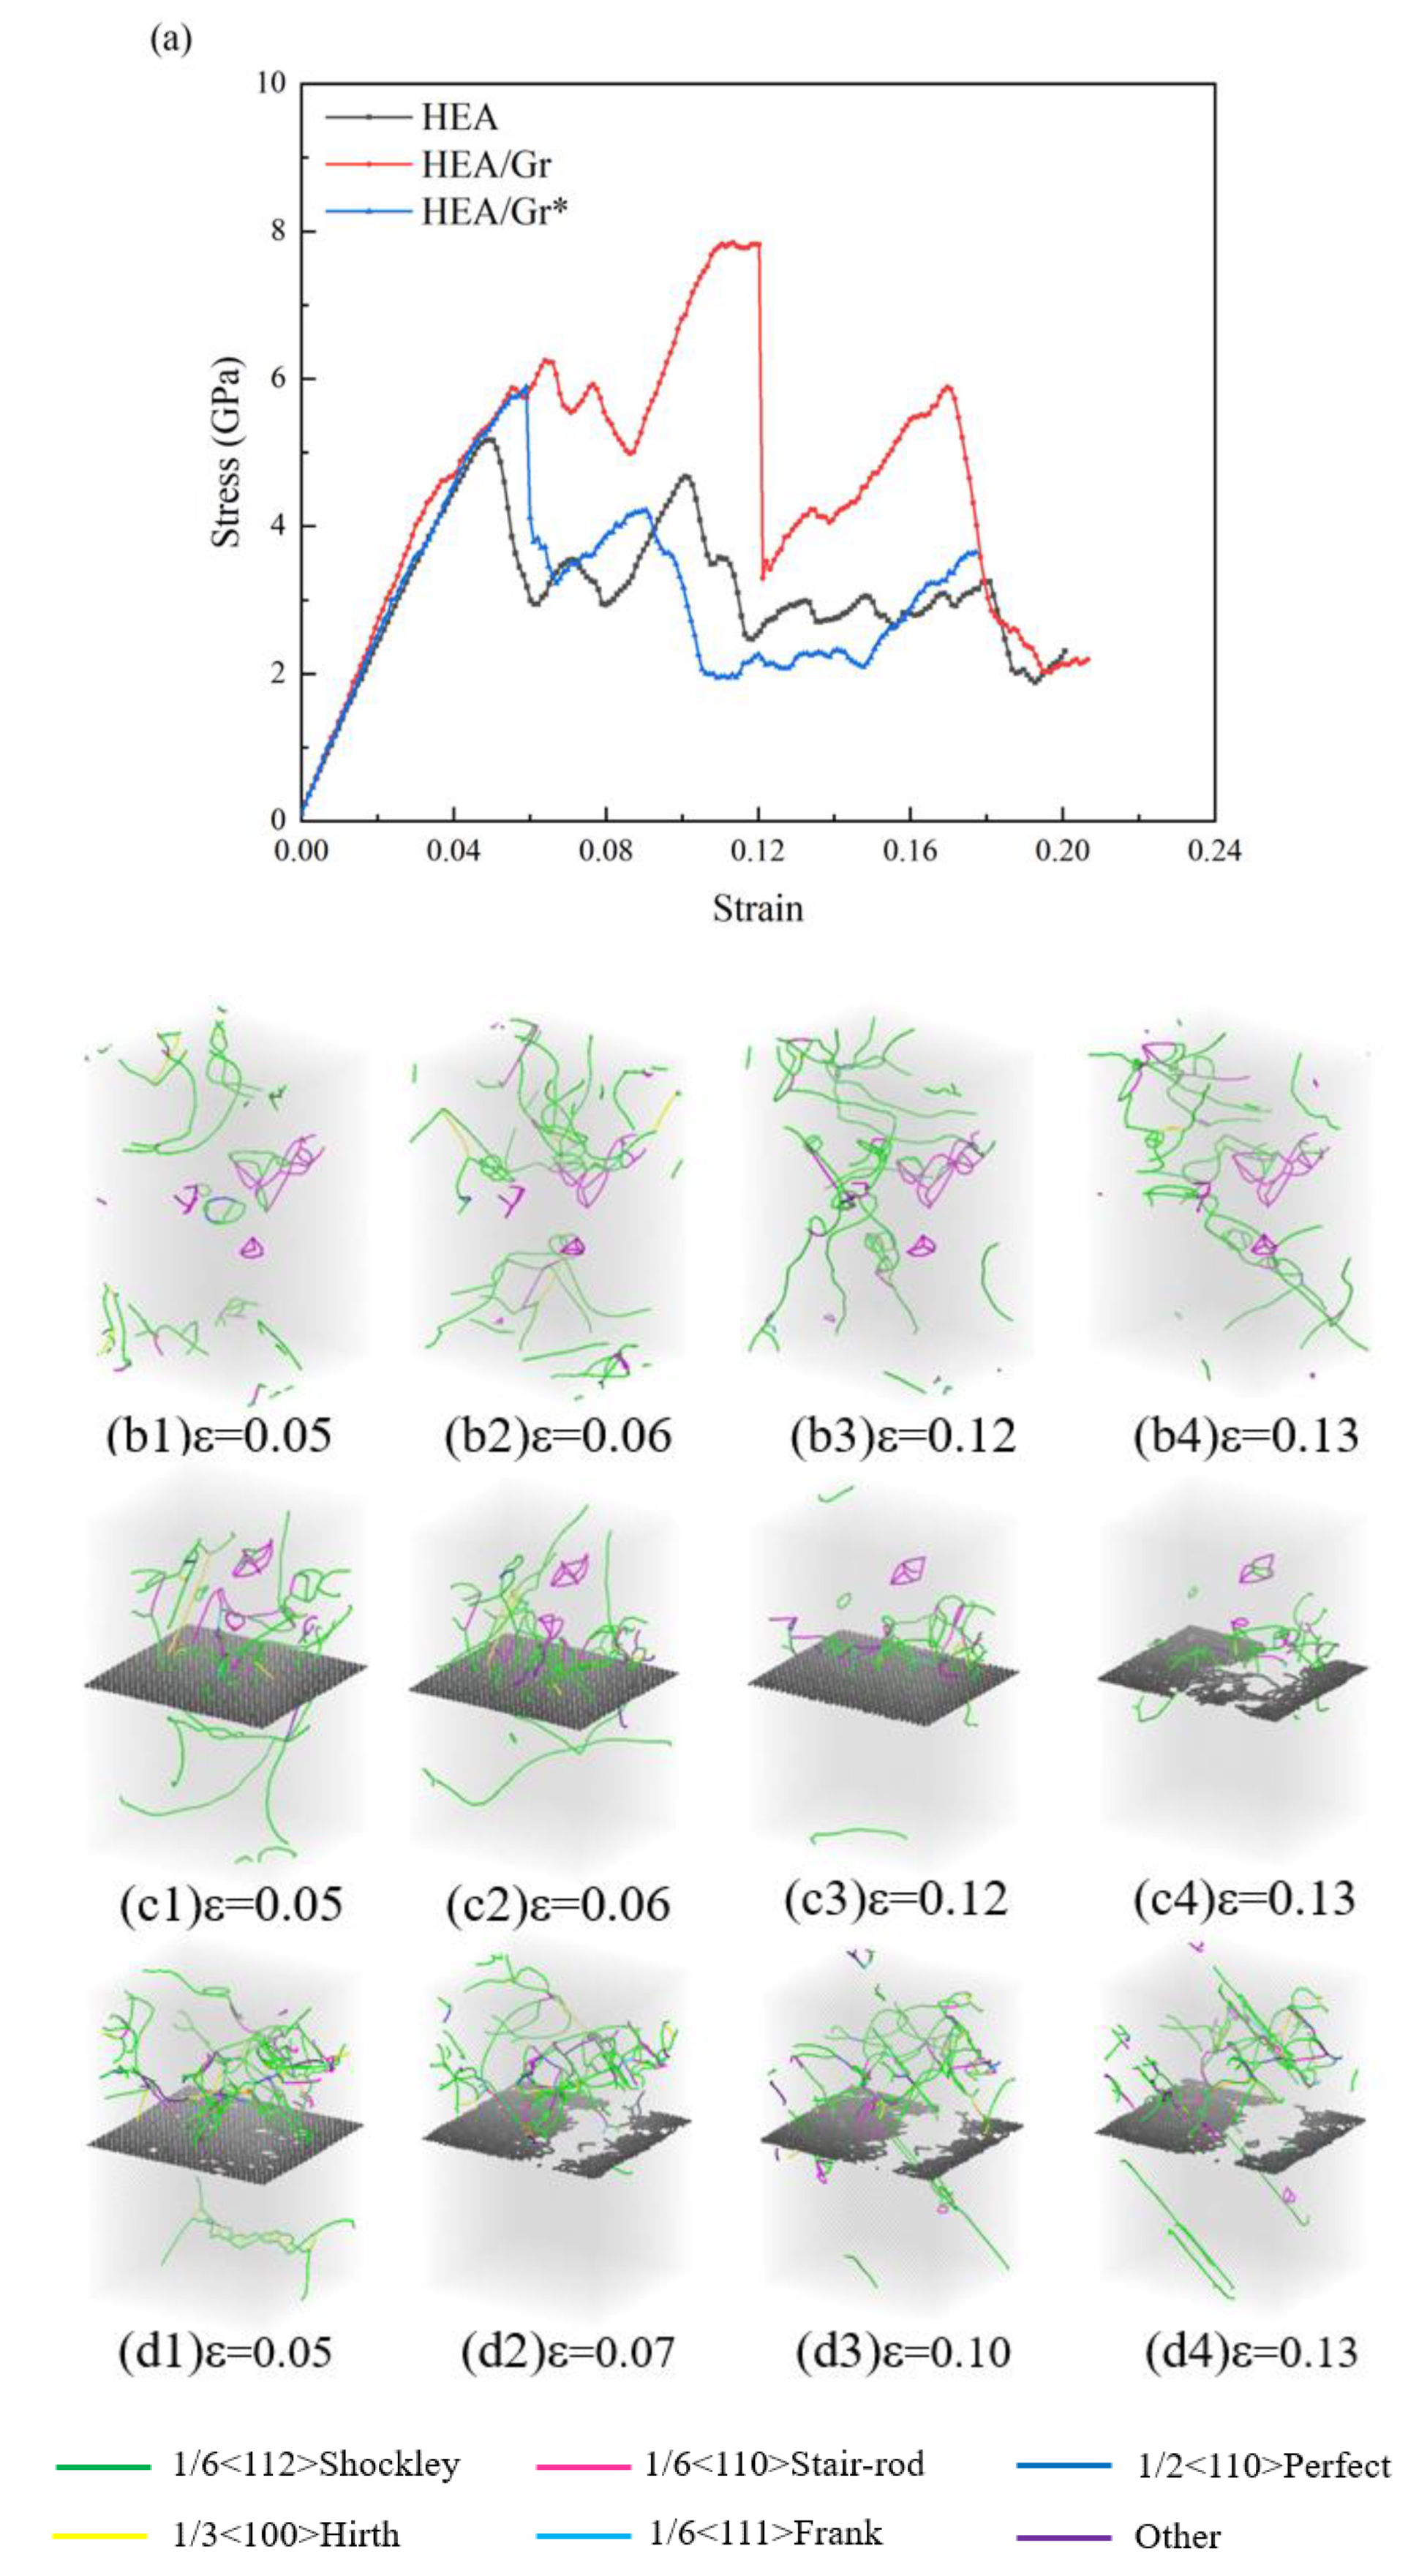
Figure 4.
Evolution of the HCP fraction during the tensile process of pure HEA, HEA/Gr, and HEA/Gr* (with 1% of C atoms removed in Gr) models in the presence of initial dislocations; Twinning variations observed in pure HEA (b1-b5), HEA/Gr (c1-c5), and HEA/Gr (d1-d5).
Figure 4.
Evolution of the HCP fraction during the tensile process of pure HEA, HEA/Gr, and HEA/Gr* (with 1% of C atoms removed in Gr) models in the presence of initial dislocations; Twinning variations observed in pure HEA (b1-b5), HEA/Gr (c1-c5), and HEA/Gr (d1-d5).
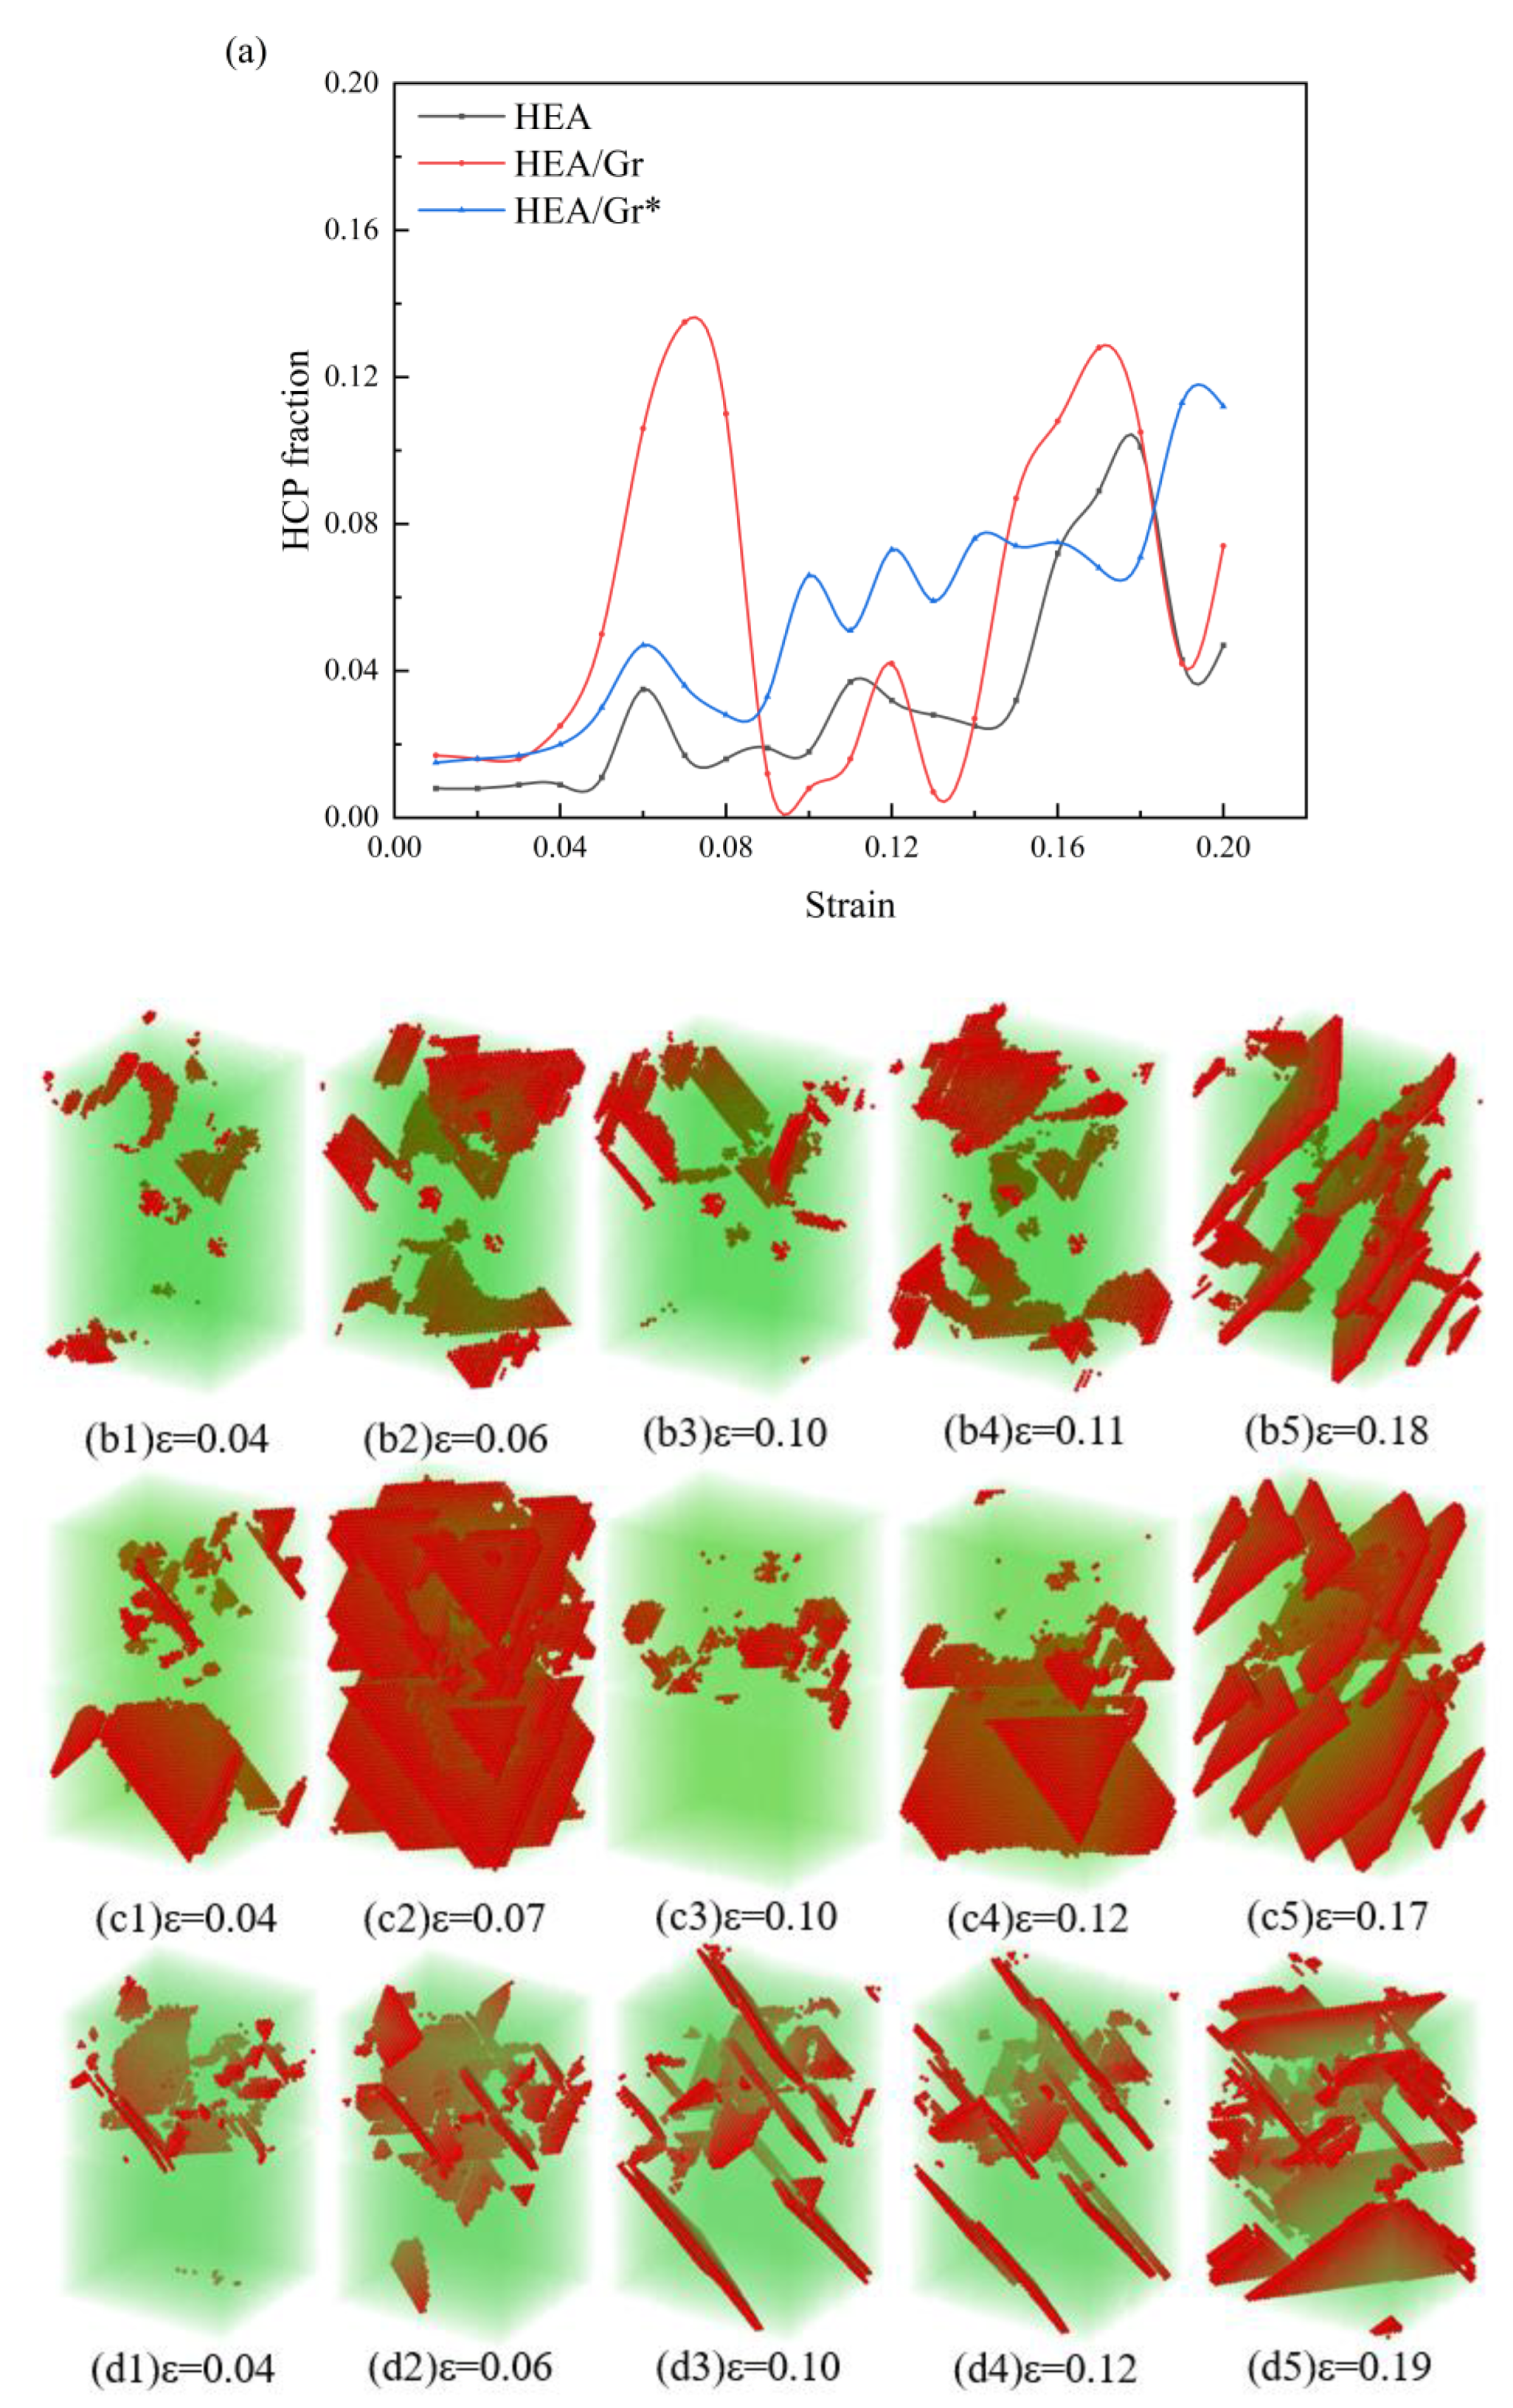
Figure 5.
Compressive stress-strain curves of pure HEA, HEA/Gr, and HEA/Gr* (with 1% of C atoms removed in Gr*) models, without the introduction of initial dislocations.
Figure 5.
Compressive stress-strain curves of pure HEA, HEA/Gr, and HEA/Gr* (with 1% of C atoms removed in Gr*) models, without the introduction of initial dislocations.
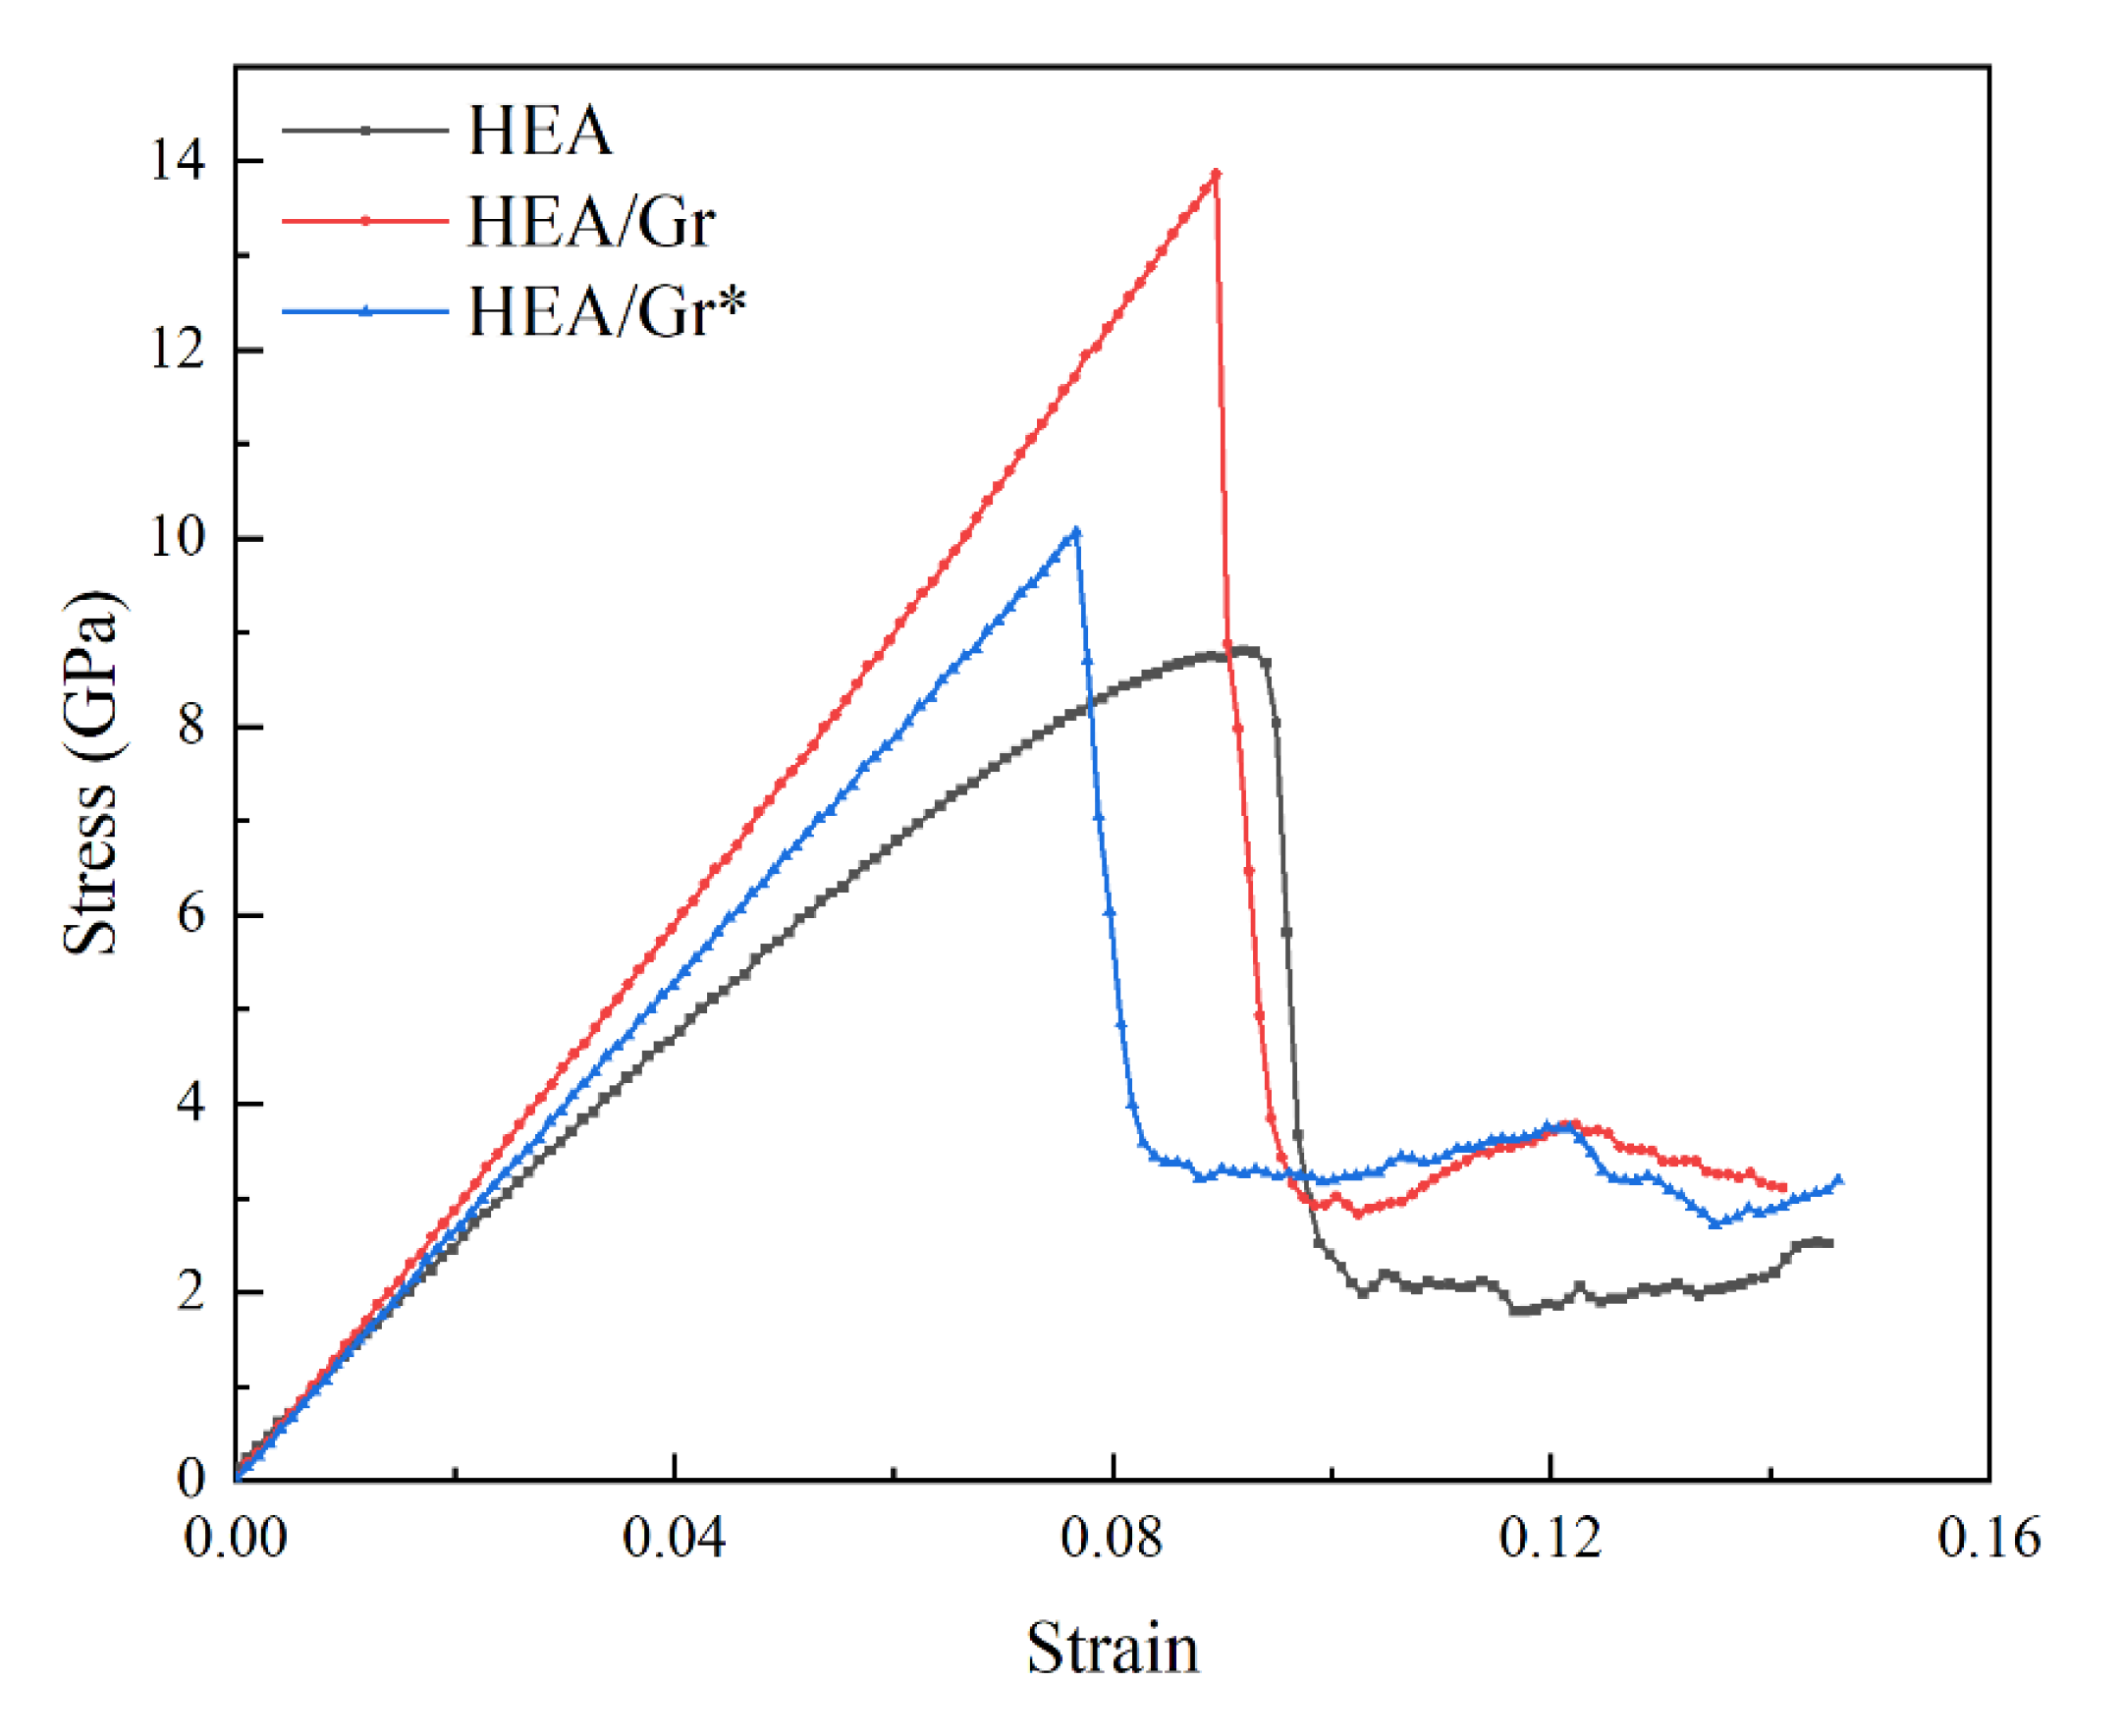
Figure 6.
Compressive stress-strain curves of pure HEA, HEA/Gr, and HEA/Gr* (with 1% of C atoms removed in Gr) models incorporating initial dislocations; dislocation distribution of pure HEA (b1-b4), HEA/Gr (c1-c4), and HEA/Gr (d1-d4) under varying compressive strains.
Figure 6.
Compressive stress-strain curves of pure HEA, HEA/Gr, and HEA/Gr* (with 1% of C atoms removed in Gr) models incorporating initial dislocations; dislocation distribution of pure HEA (b1-b4), HEA/Gr (c1-c4), and HEA/Gr (d1-d4) under varying compressive strains.
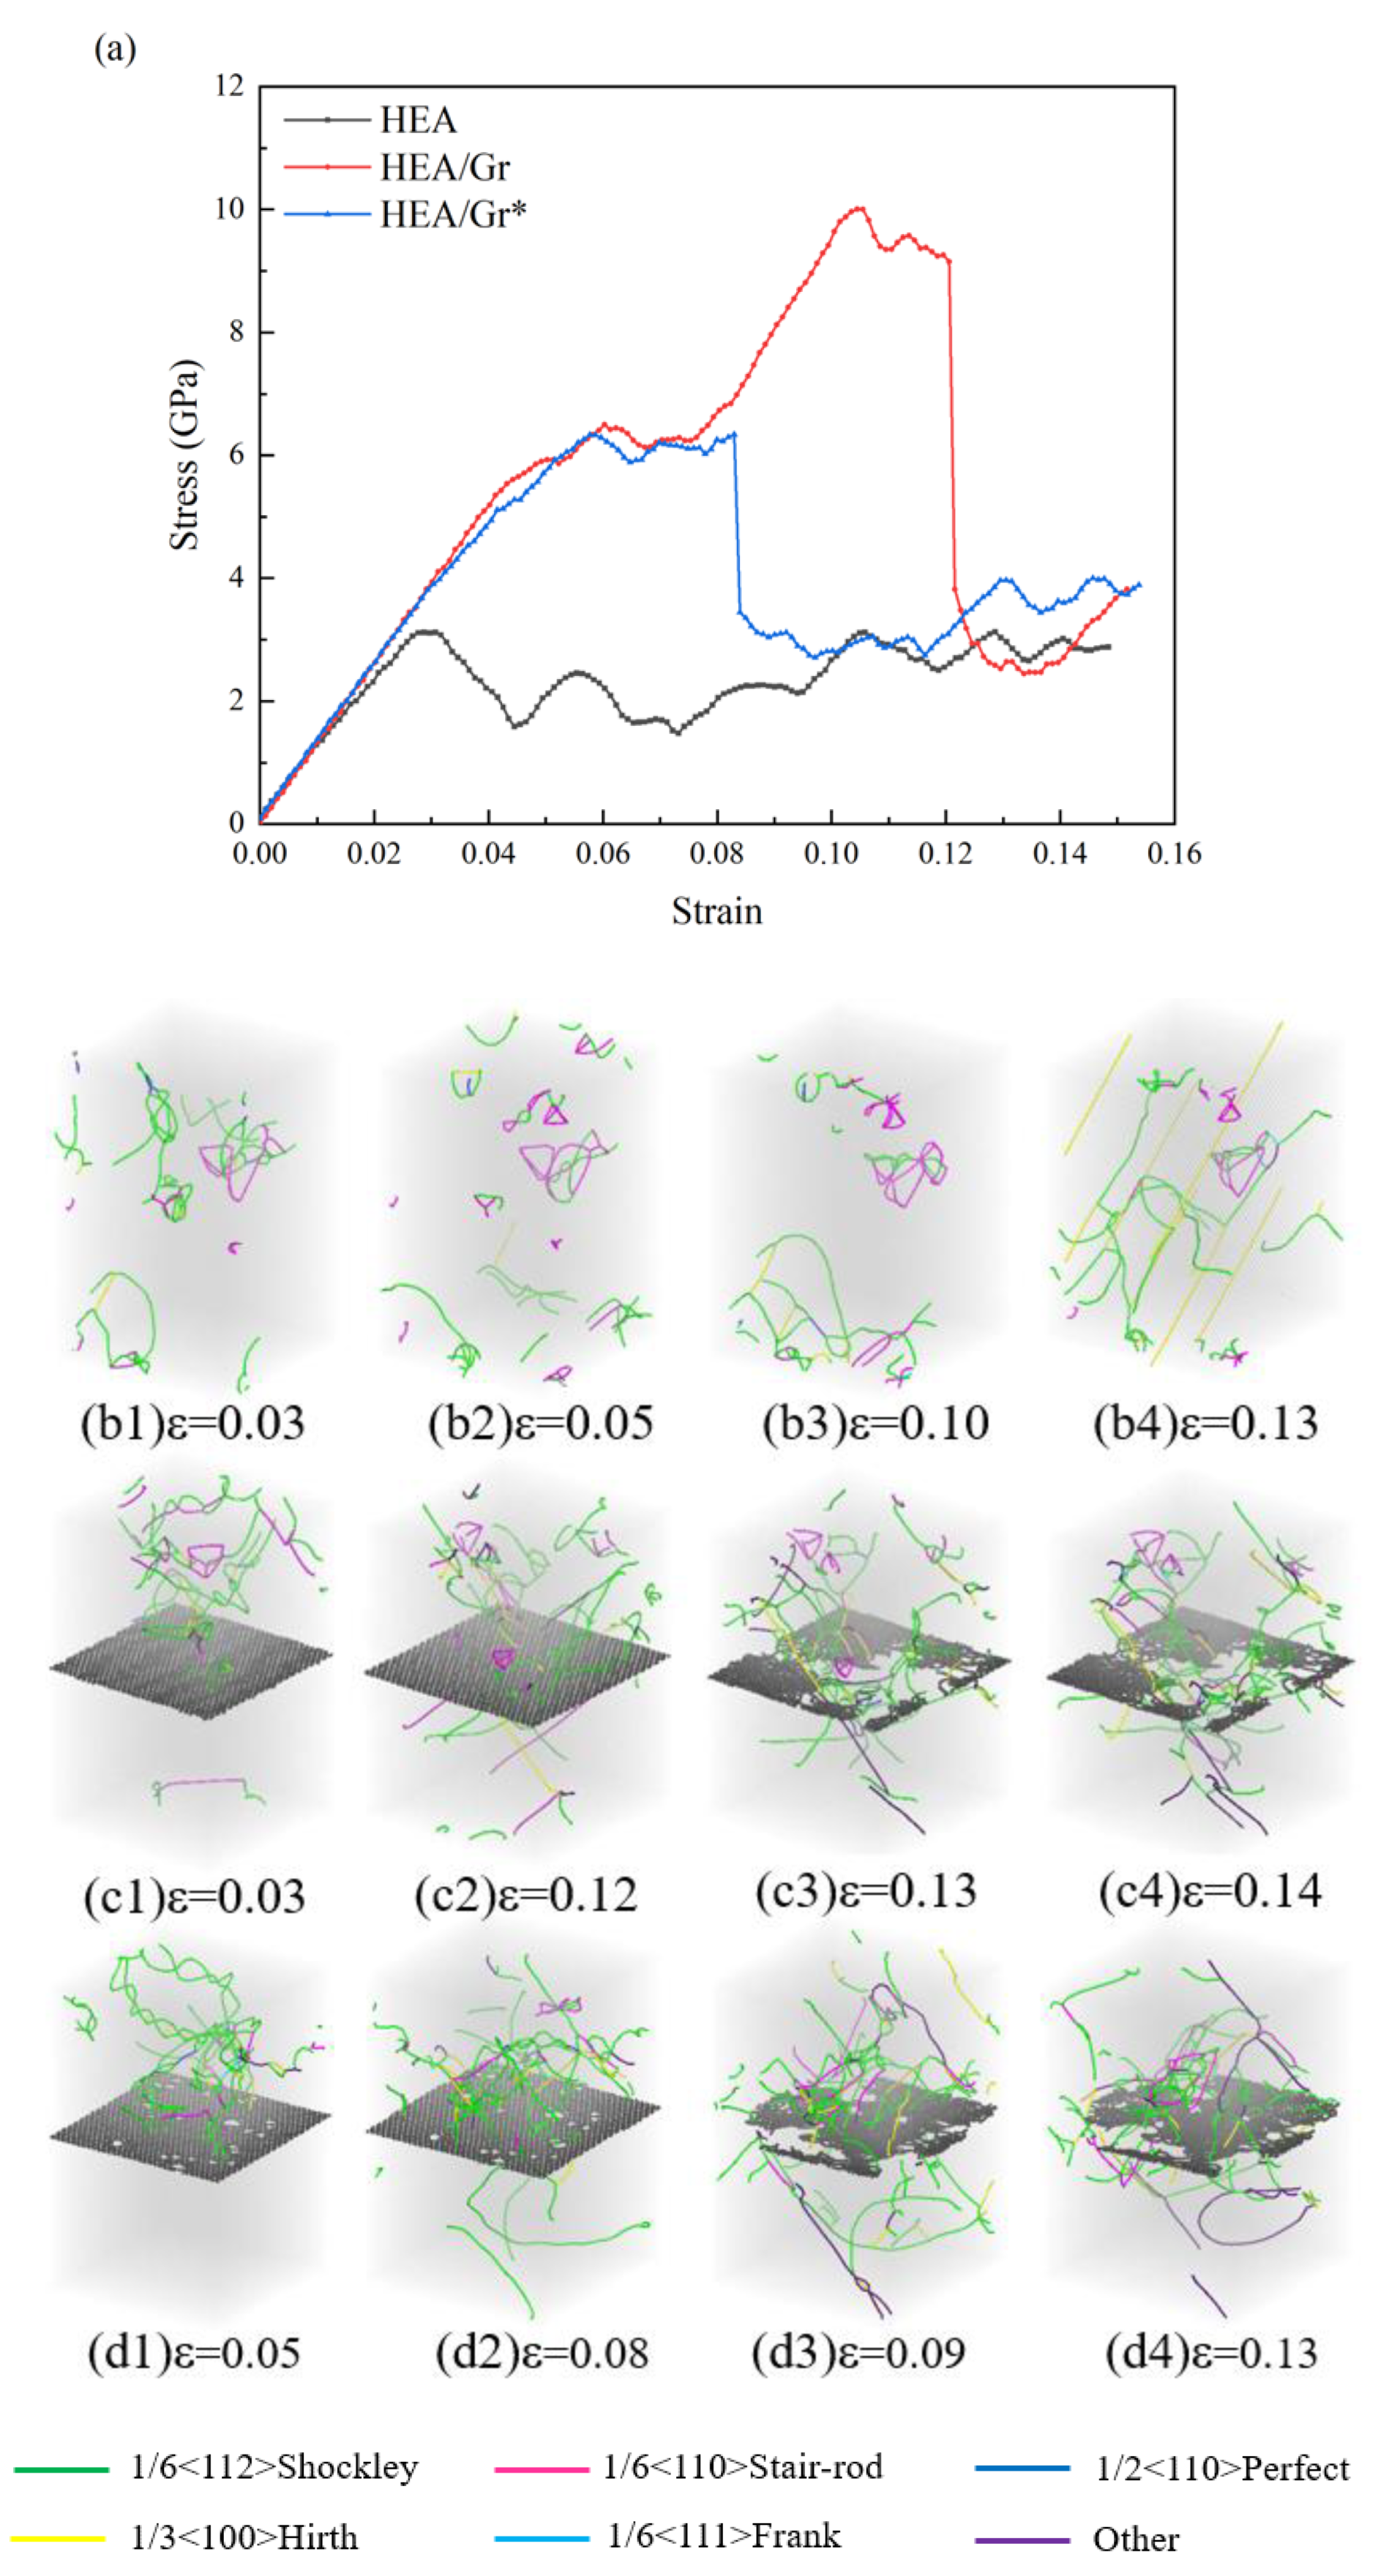
Figure 7.
Model after relaxation of Gr with varying quantities of C atoms removed.
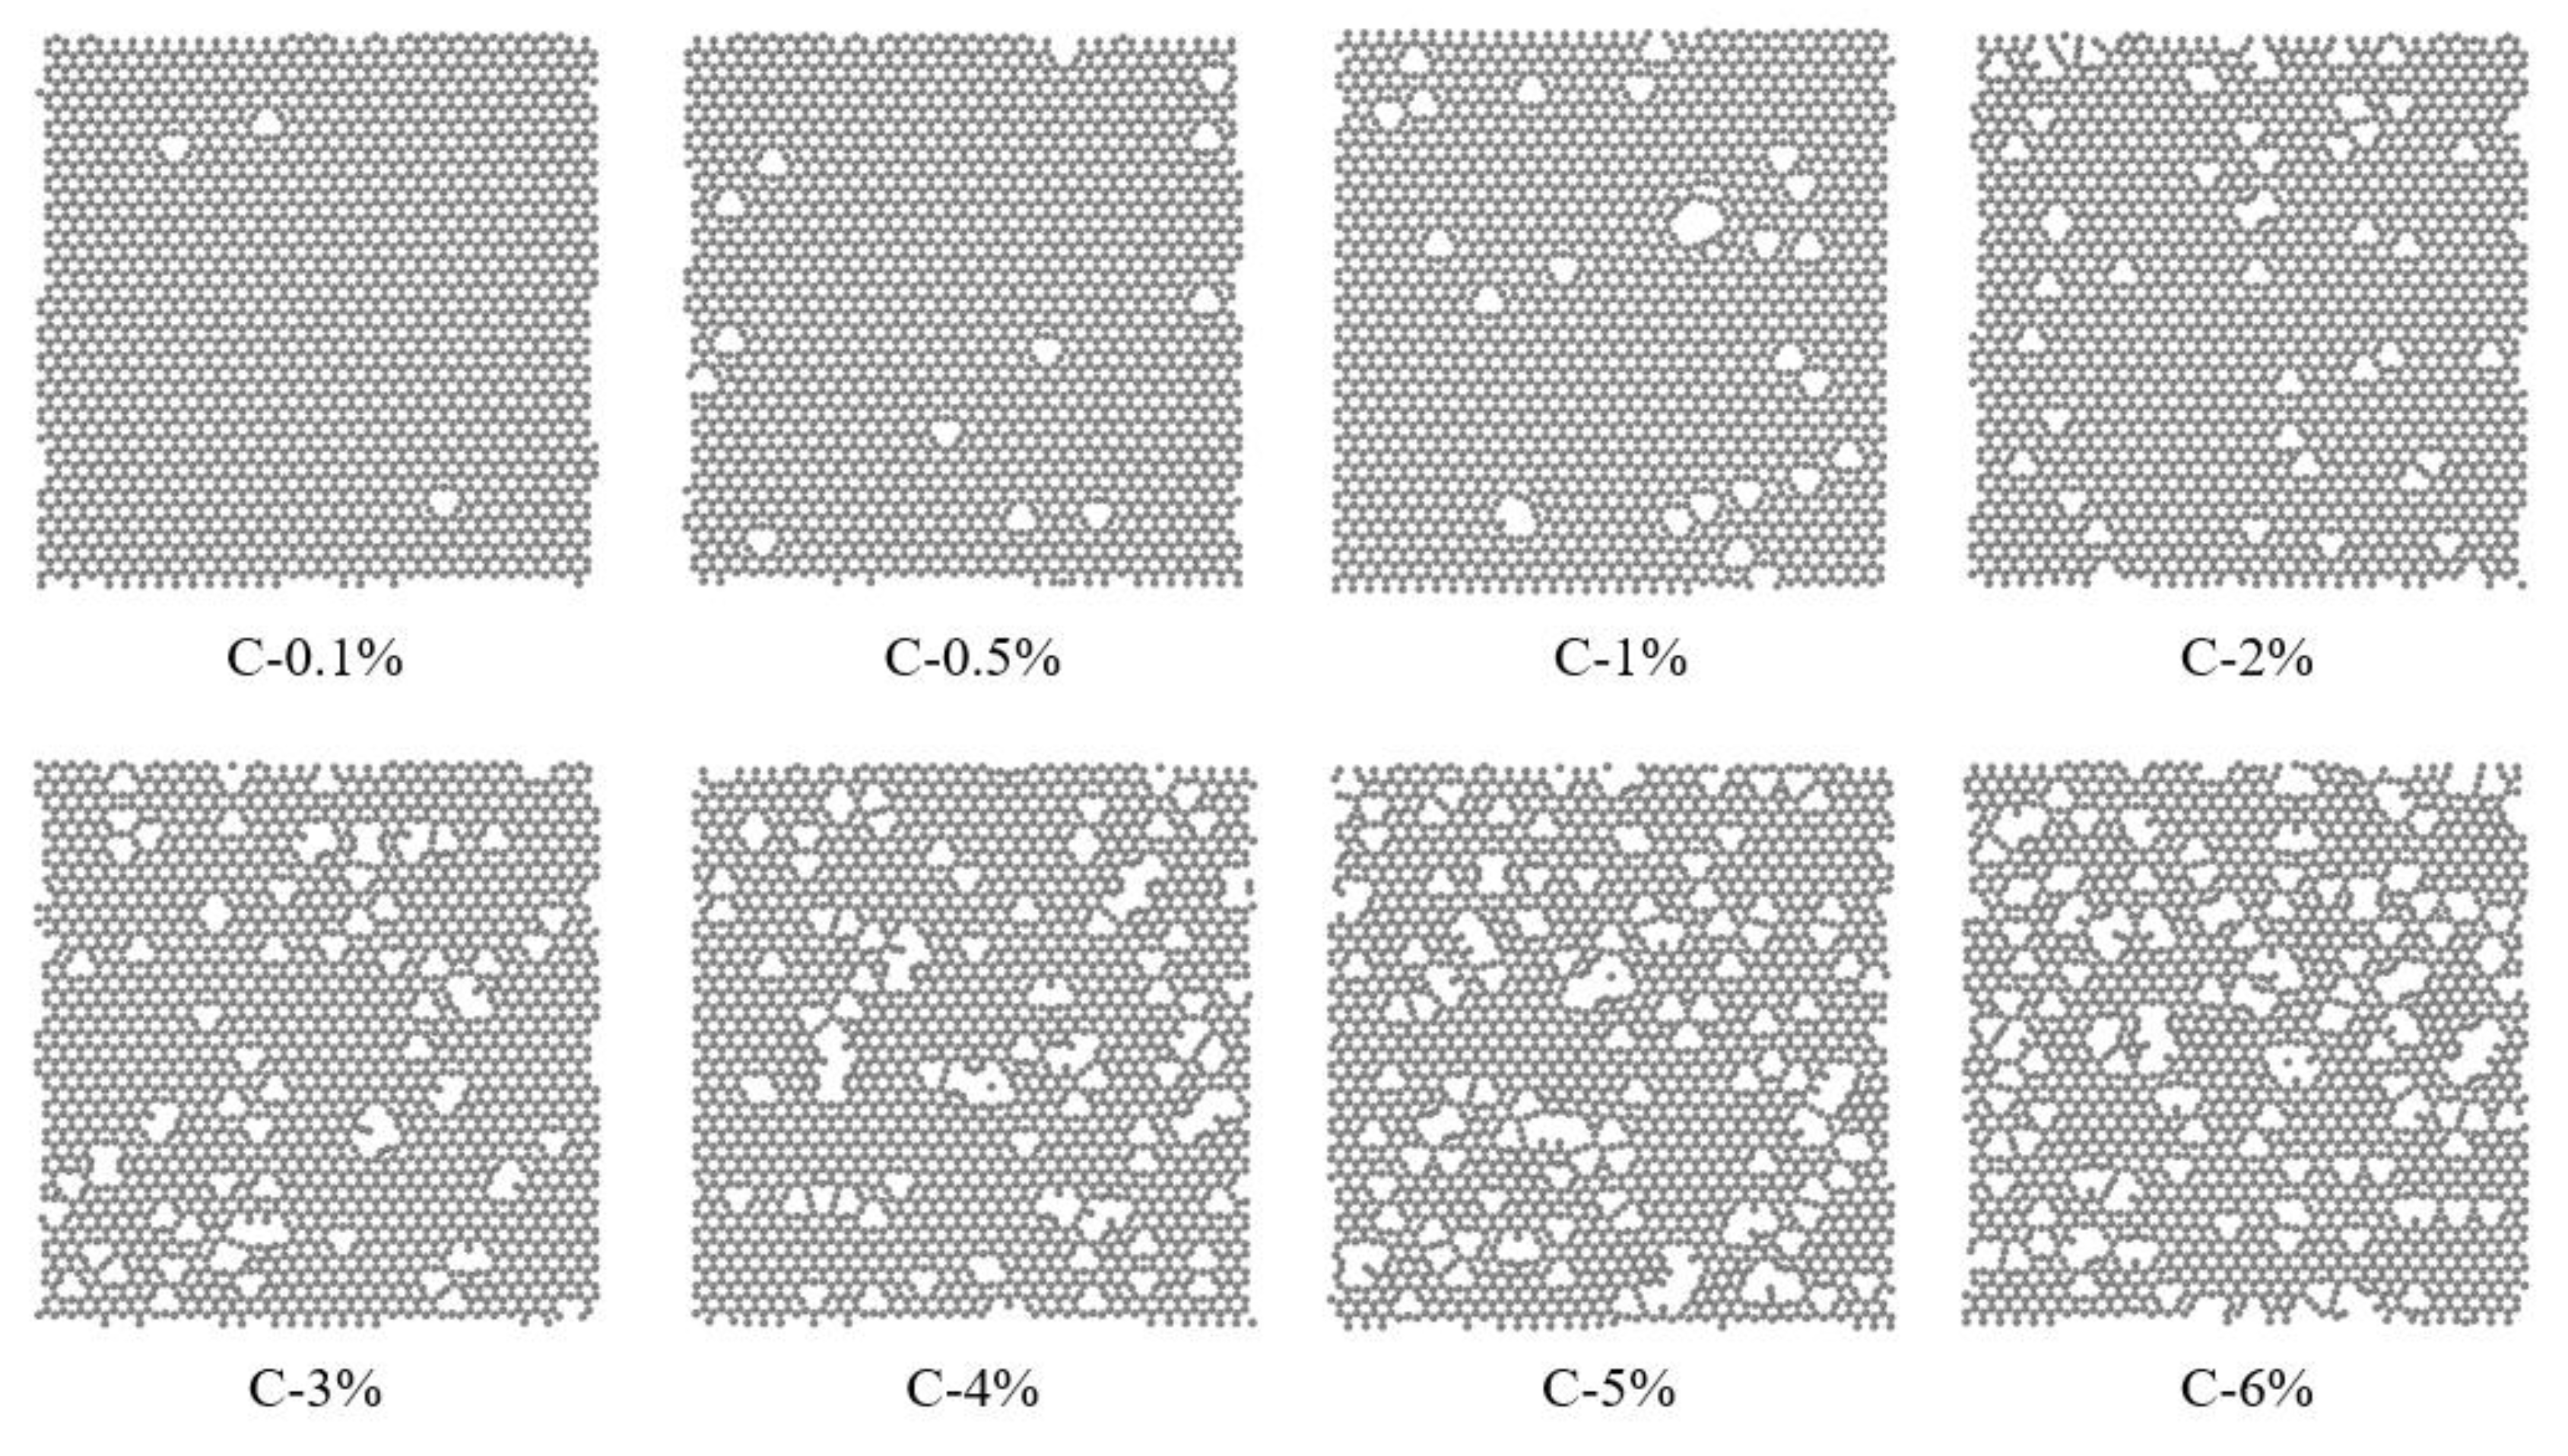
Figure 8.
The (a) tensile and (b) compressive stress-strain curves obtained for HEA/Gr* and HEA/Gr (C-0%) models with C atoms removed at concentrations of 0.1%, 0.5%, 1%, 2%, 3%, 4%, 5%, and 6%, respectively, following the introduction of initial dislocations.
Figure 8.
The (a) tensile and (b) compressive stress-strain curves obtained for HEA/Gr* and HEA/Gr (C-0%) models with C atoms removed at concentrations of 0.1%, 0.5%, 1%, 2%, 3%, 4%, 5%, and 6%, respectively, following the introduction of initial dislocations.
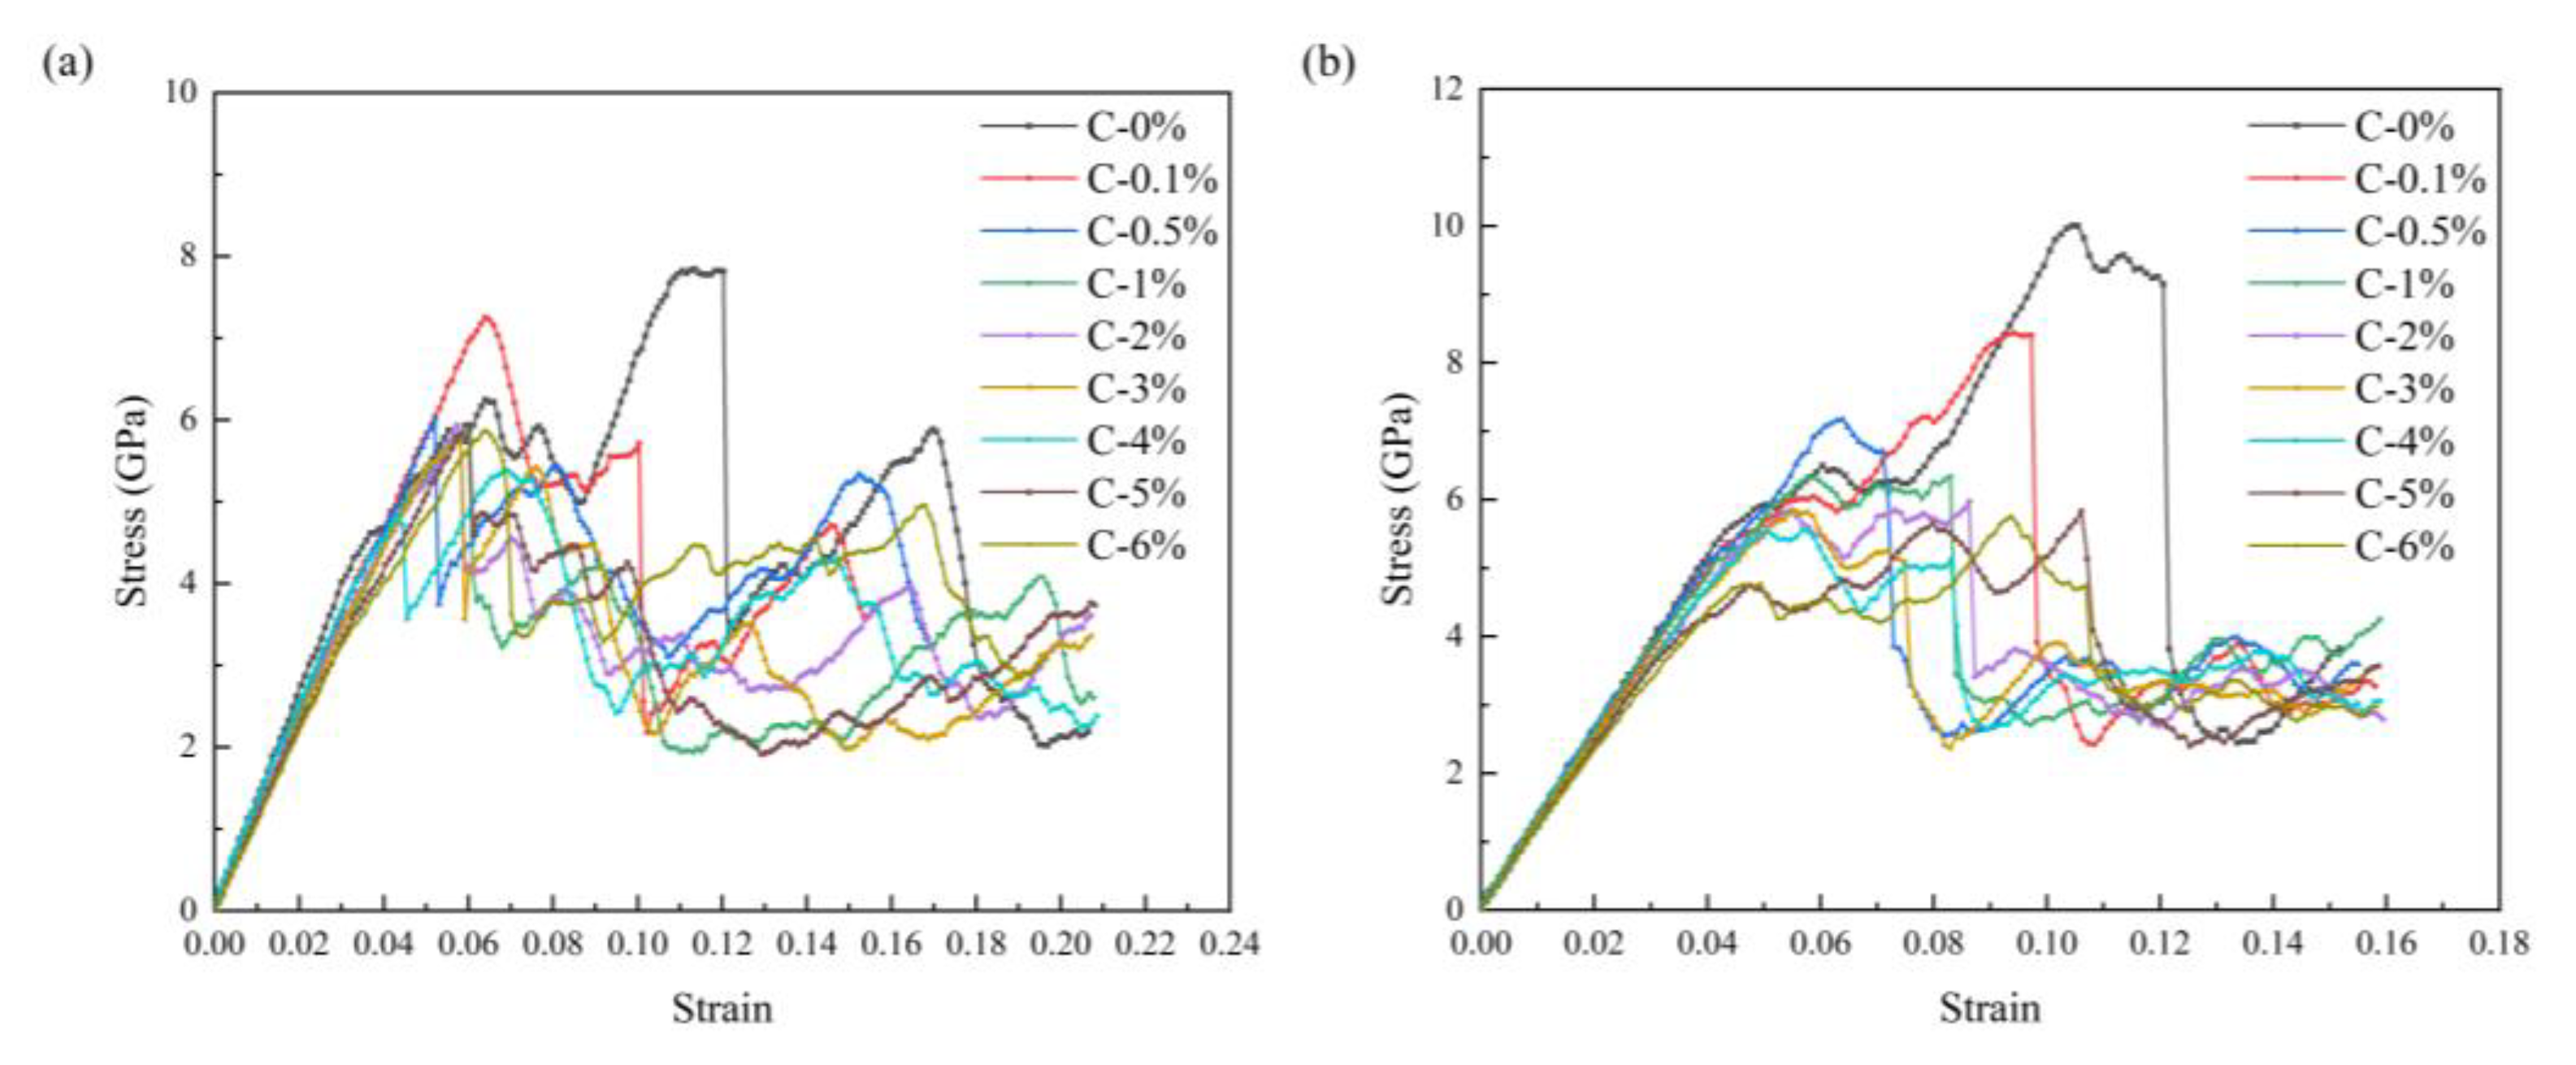
Figure 9.
Illustration of the dislocation distribution in the HEA/Gr* models prior to and following Gr* failure during compression simulations, considering various percentages of deleted C atoms ranging from 0.1% to 6% (a-h), with the inclusion of initial dislocations.
Figure 9.
Illustration of the dislocation distribution in the HEA/Gr* models prior to and following Gr* failure during compression simulations, considering various percentages of deleted C atoms ranging from 0.1% to 6% (a-h), with the inclusion of initial dislocations.
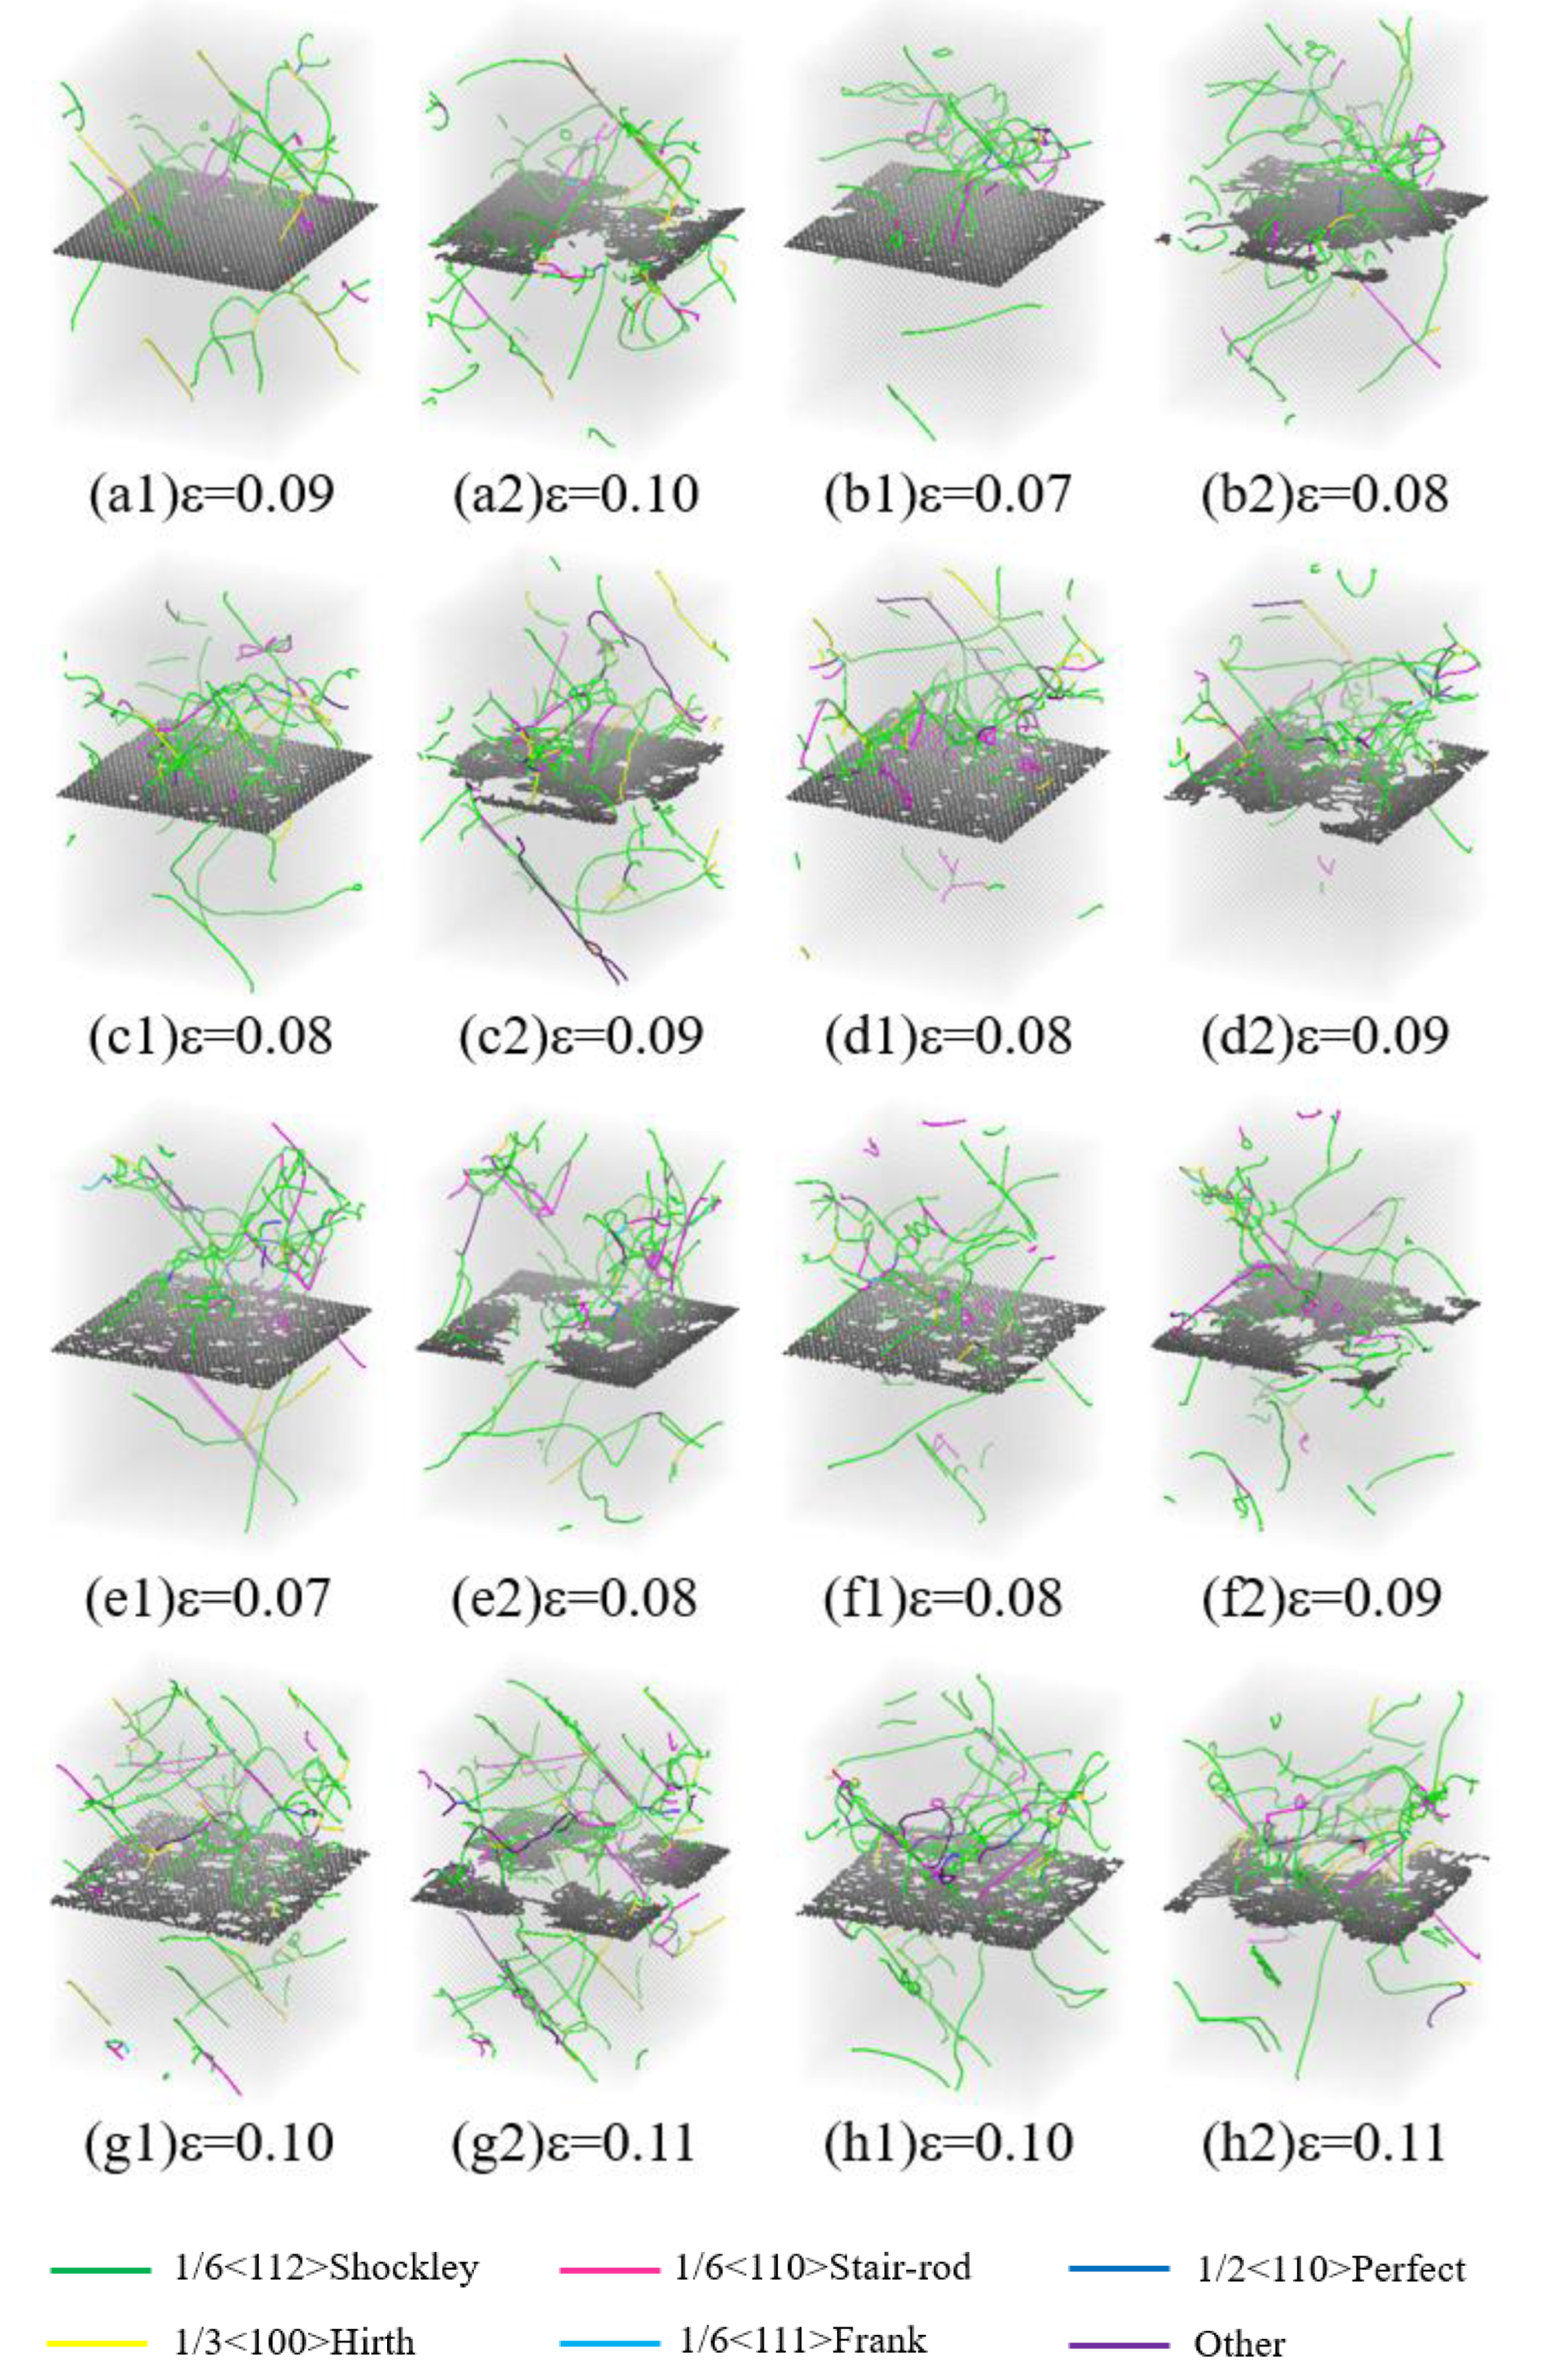
Figure 10.
Illustrates the trends in (a) maximum tensile stress and (b) maximum compressive stress for the HEA/Gr* and HEA/Gr (C-0%) models, with varying percentages of atoms removed (0.1%, 0.5%, 1%, 2%, 3%, 4%, 5%, and 6%) following the introduction of initial dislocations. The dashed line serves as a reference, depicting the maximum stress values simulated for the pure HEA model under identical conditions.


Table 1.
LJ Potential Parameters between Internal Atoms of HEA and Gr layers[42].
Table 1.
LJ Potential Parameters between Internal Atoms of HEA and Gr layers[42].
| Pair | (Å) | |
|---|---|---|
| Fe–C | 3.1000 | 0.050000 |
| Ni–C | 2.8520 | 0.230000 |
| Cr–C | 2.8680 | 0.037758 |
| Co–C | 2.8420 | 0.038281 |
| Cu–C | 3.0825 | 0.025780 |
Disclaimer/Publisher’s Note: The statements, opinions and data contained in all publications are solely those of the individual author(s) and contributor(s) and not of MDPI and/or the editor(s). MDPI and/or the editor(s) disclaim responsibility for any injury to people or property resulting from any ideas, methods, instructions or products referred to in the content. |
© 2025 by the authors. Licensee MDPI, Basel, Switzerland. This article is an open access article distributed under the terms and conditions of the Creative Commons Attribution (CC BY) license (http://creativecommons.org/licenses/by/4.0/).
Copyright: This open access article is published under a Creative Commons CC BY 4.0 license, which permit the free download, distribution, and reuse, provided that the author and preprint are cited in any reuse.


