Submitted:
04 June 2025
Posted:
05 June 2025
You are already at the latest version
Abstract
To improve the corrosion resistance of CrBN coatings in seawater, the anti-corrosion element Ni at different concentrations was incorporated. After Ni incorporation, CrNiBN coatings showed compact morphology, and the surface porosity decreased from 16.8 % to 7.7 %. As a consequence, all of CrNiBN coatings presented stronger corrosion resistance than CrBN coating. Moreover, with the increase of Ni concentration from 4.35 at% to 7.28 at%, the corrosion resistance of CrNiBN coatings became good first owing to the combination effects of compact morphology and high self-corrosion potential. However, the more Ni doping of 19.62 at% would decrease self-corrosion potential and trigger oxidation so as to weaken the corrosion resistance of CrNiBN coatings. Among all of CrNiBN coatings, the CrNiBN-240 coating with 7.28 at% Ni presented the highest charge transfer resistance Rct of 1.965×10⁴ Ω·cm² and the highest polarization resistance Rp of 74.9 kΩ·cm².
Keywords:
CrBN coatings
; Ni incorporation
; corrosion
; seawater
; porosity
1. Introduction
45 steel as one kind of carbon structural steel has been widely used to manufacture machine parts such as spindles, gears, shafts, connecting rods [1,2]. In order to meet the high requirements of wear and corrosion resistances, the post treatments such as quenching, normalizing and tempering are applied on 45 steel [3,4]. However, the improvements in mechanical properties by the above post treatments are limited since the chemical composition of 45 steel remains unchanged. Therefore, the wear and corrosion resistances of 45 steel are still insufficient to meet working requirements. As an alternative, coating is a positive technology to greatly improve the wear and corrosion resistances since it jumps out of the chemical composition of substrate [5,6,7]. Namely, the coating own performance determines its wear and corrosion resistances. For instance, Maskavizan’s research found that the wear rate of CrN coating was 0.15×10⁻⁶ mm3/Nm, which is 20 times lower than the wear rate of 45 steel (3.85×10⁻⁶ mm3/Nm) [8,9]. Similarly, Ge et al. [10] prepared densely structured and highly oriented columnar VN coatings through relatively intense ion bombardment reactive magnetron sputtering at 773 K. The coatings exhibited a hardness of 25-30 GPa and demonstrated an extremely low wear rate less than 5.0×10⁻⁸ mm3/Nm. Regarding corrosion resistance, the corrosion current density of 45 steel was 23 μA/cm2 [11]. After the deposition of the CrN coating, the corrosion current density could decrease to 0.96 μA/cm2 [12]. Chen’s study found that the chemical inertness of TiN in salt water environment can effectively prevent the corrosion of the substrate. The corrosion current density (icorr) was significantly reduced to 7.4 nA/cm2 [13]. The similar enhanced corrosion resistance could be found in literatures [14,15].
However, the binary nitride coatings such as CrN, TiN and VN have the upper limit of hardness around 30 GPa, which restricts its wear resistance [16]. At the meantime, columnar crystal is the major growth pattern for binary nitride coatings so as to inevitably form the clearance between adjacent columnar crystals. As a consequence, the clearance would offer the channel for corrosion medium to erode substrate. To solve these two issues, the composite structure coatings consist of nano crystal and amorphous matrix have been proposed. Owing to the inhibitions of dislocation multiplication and grain boundary sliding, the enhancement effect from the strong interfaces of nano crystal and amorphous matrix could increase hardness whilst the amorphous matrix could seal clearance [17,18]. For instance, Wang et al. [19] discovered that CrAlN coatings possessed a unique amorphous/crystalline structure of 5 nm crystals uniformly embedded within amorphous matrix. As a result, compared to conventional CrN coatings, CrAlN coatings exhibit relatively smaller grain sizes and a denser structure with the hardness of approximately 33.4 GPa while also demonstrating superior wear resistance. Similarly, Martinez, Park and Wang et al. also found that the columnar growth of CrN crystals was indeed disrupted after doping a certain amount of Si, and the amorphous distribution of SiNx was distributed in CrN crystals, and the microstructure and mechanical properties such as the density and hardness of the coatings were improved to a certain extent [20,21,22]. For corrosion resistance, Yoo et al. [23] studied the corrosion behavior of CrSiN coatings with different Si contents in a 3.5 wt% NaCl solution. The study found that the structure of the coating became more dense after Si doping, and therefore reducing the path for solution erosion into the interior of the coating. As a result, when the Si/(Si + Cr) content in the coating was 20%, the coating exhibited the lowest corrosion current of 0.0845 nA/cm2 and the highest porosity resistance and charge transfer resistance.
Although both of the wear and corrosion resistances are improved by the enhanced effect of nano-crystal/amorphous matrix composite structure, the insufficient toughness appears. For this issue, some toughen metals are introduced into composite coatings, such as Cu, Ni, Al, Pt. It has been reported that the critical loads Lc1 and Lc2 for crack initiation of CrAlN coatings were 27 N and 30 N with a crack propagation resistance (CPR) value of 81 N2. In contrast, the Ni-CrAlN coating exhibited higher Lc1 and Lc2 values than the CrAlN coating, and its CPR value increased to 352 N2, indicating that Ni incorporation could significantly enhance the coating’s toughness [24]. Moreover, Wang et al. found that a distinct pop-in was observed on the loading curve of CrSiN coatings, whereas the loading curve of Ni-CrSiN coatings was smooth, indicating that the Ni incorporation was able to improve coatings toughness against circular cracks. As a consequence, the wear and corrosion resistances of CrSiN coatings in seawater was enhanced after Ni incorporation [25,26]. Our previous work investigated the influence of tough metal Ni on the mechanical and tribological properties of CrBN coatings. It was found the moderate incorporation of Ni (4.35 at% and 7.28 at%) could improve the hardness of CrBN coatings, and thus enhance its tribological properties. Nevertheless, the high incorporation of Ni (12.62 at% and 19.62 at%) would deteriorate the mechanical and tribological properties of CrBN coatings [27].
As the above mentioned, the surface protection coatings are expected to posses both of good wear and corrosion resistances. However, the influence of Ni incorporation on the corrosion resistance of CrBN coatings in seawater has not been investigated. It is still unknown whether the incorporation of Ni could enhance the corrosion resistance of CrBN coatings in seawater and the corresponding optimal incorporation content of Ni. Thus, it is need to investigate the influence of Ni incorporation on the corrosion resistance of CrBN coatings in seawater in this study. More importantly, the inner enhance mechanism of anti-corrosion need to be revealed.
2. Materials and Methods
2.1. Coatings Deposition
Magnetron sputtering as one kind of physical vapor deposition technology was used to deposit CrNiBN coatings on 45 steel. Before coatings deposition, a cleaning process by ion bombardment was applied on 45 steel. Afterwards, a multi-layer transition architecture including Cr, CrN and CrBN tiers was deposited for improving adhesion strength. At last, the top layer of CrNiBN was deposited. In order to achieve the different Ni concentrations in coatings, the sputtering power of NiCr alloy target was set as 120 W, 240 W, 360 W, 480 W and 600 W during the deposition of CrNiBN top layer. The more specific details of coatings deposition could be found in our previous study [27]. To distinguish the CrNiBN coatings deposited at different sputtering powers, the code CrNiBN-120, CrNiBN-240, CrNiBN-360, CrNiBN-480 and CrNiBN-600 will be denoted in the following main text.
2.2. Structural Characterization and Morphology Observation
In order to determine the micro-structure of CrNiBN coatings, the chemical composition, crystal condition and bonding condition of coatings were characterized by using energy dispersive spectrometer (EDS), X-ray diffraction (XRD, Ultima IV, Japan) and X-ray photoelectron spectroscopy (XPS). During XRD measurement, a Cu Ka radiation (λ=0.15404 nm) was used and conducted at the voltage of 40 kV and the current of 40 mA. The scanning range of diffraction angle 2θ was from 20° to 80° with an interval of 0.02°. To investigate the influence of Ni content on the surface porosity, the surface morphology of coatings was first observed by using scanning electron microscope (SEM). Afterwards, the software ImageJ was used to process the images of surface morphology and to calculate the surface porosity. In order to minimize the measurement error, three images for each coating were used to calculate the average surface porosity.
2.3. Electrochemical Properties Measurement
The electrochemical properties of CrNiBN coatings were tested by using an electrochemical workstation (CHI660E, Shanghai Chenhua Instruments Company) in 3.5 wt% NaCl solution. The test was conducted using a three-electrode system, including working electrode, auxiliary electrode, and reference electrode, which are the CrNiBN coatings, platinum wire and saturated calomel electrode, respectively. Before testing, the coatings surface was washed by ultrasonic cleaning in ethanol for 10 minutes to remove residual contaminants and wiped to dry with dust-free paper. Afterwards, a copper wire was connected with the back of the sample, which was mounted on the test apparatus with an exposing area of 0.5 cm2 for testing. Finally, the platinum wire electrode, saturated calomel electrode (SCE) and the coatings sample were fully immersed in 3.5 wt% NaCl solution by maintaining them at the same horizontal line. The whole three-electrode system was placed in an electromagnetic shield box to reduce electromagnetic interference. The corrosion resistance of the CrNiBN coatings in 3.5 wt% NaCl solution were evaluated from the following three aspects:
1) Open circuit potential (OCP): The sample was soaked in 3.5 wt% NaCl solution, and the variation of potential was recorded for 3600s;
2) Electrochemical impedance spectroscopy (EIS): After OCP test, the stable open circuit potential was set as the starting potential, the scanning frequency was set from 1 mHz to 100 kHz, and the amplitude of the AC excitation signal was set to 10 mV.
3) Potential-dynamic polarization test (PP): After EIS test, the relationship of potential and current for sample was measured by PP test. The scanning range was set from -1.0 V to 1.0 V with the scanning rate of 20 mV/min. During test, the current sensitivity was set to be automatic.
In order to reveal the electrochemical structure of the coatings and obtain corresponding equivalent element parameters for evaluating corrosion resistance, the equivalent circuit was used to fit the EIS test results, which would discussed in Section 3.3.2. For potential-dynamic polarization test results, the self-corrosion current density (Icorr) and self-corrosion potential (Ecorr) are obtained using the Tafel curve extrapolation method [28]. Then, according to the Stern-Geary formula, as shown in Equation (1), the polarization resistance (Rp) of the coatings was calculated to analyze its dynamic corrosion resistance [29,30].

Among them, βa and βc are the slopes of the Tafel anode and cathode respectively.
3. Results and Discussion
3.1. Microstructure of CrNiBN Coatings
The variation of Cr, B, N and Ni element concentration as a function of NiCr alloy target power is illustrated in Figure 1. It has been found that with the increase sputtering power of NiCr alloy target from 120 W to 600 W, the Ni concentration in CrNiBN coatings increases from 4.35 at.% to 19.62 at.%. According to the XRD and XPS results, the existence states of Ni and B elements are amorphous Ni and amorphous BN. CrNiBN coatings present a nano-composite structure composed of CrN crystals and amorphous matrix. The details in XRD and XPS results of CrBN and CrNiBN coatings could be found in our previous published work [27].
3.2. Surface Morphology and Porosity of CrNiBN Coatings
In order to investigate the influence of Ni concentration on the surface porosity, the surface morphologies of coatings were observed and are illustrated in Figure 2. It could be seen that the CrBN coating presents the cauliflower-like morphology, and many small gaps are observed on each crystal columns marked by red line in Figure 2a. In contrast, after Ni incorporation, the CrNiBN coatings presents smooth morphology without any small gaps on crystal columns. Moreover, some crystal columns connect to each other so as to form big and long crystal columns, which have been marked by yellow line in Figure 2b,c,e.
Based on the surface morphologies, the surface porosity of coatings was calculated. The calculation process of surface porosity is illustrated as Figure 3a–c. The surface morphology was imported into software ImageJ, and the pore defect was marked manually first. Afterwards, the ImageJ would automatically identify all of the pore defects according to the machine learning and image recognition functions. As shown in Figure 3b, the white marks are pore defects identified by ImageJ while the black color are the same pore defects in Figure 3c. By this way, the surface porosity of coating could be calculated automatically. As stated in Section 2.2, in order to minimize the measurement error, three images of surface morphologies were used to calculate the surface porosity, and the average results are illustrated in Figure 3d. It could be seen that the surface porosity of CrBN coatings is 16.8% while that of CrNiBN coatings is in the range of 7.7% to 12.9%. Moreover, with the increase of Ni concentration, the surface porosity of CrNiBN coatings shows an decreasing trend from 12.9% to 7.7%. It indicates that the Ni incorporation could make CrBN coating become compact, degree of which is proportional to Ni concentration. As stated in Section 3.1, the existence state of incorporated Ni is amorphous Ni, which could fill in the small gaps between crystal columns and therefore lower the surface porosity.
3.3. Electrochemical Properties
3.3.1. Analysis of Open Circuit Potential Results
The open circuit potential can reflect the occurrence difficulty of corrosion, and therefore the OCP curves of CrBN and CrNiBN coatings are illustrated in Figure 4 for comparison. As is shown, the OCP of all coatings decreases sharply during the first 300 seconds owing to the infiltration process of 3.5 wt% NaCl solution. After 300 seconds, the OCP curves enter relatively steady state. For comparison, the OCP values at the ending point are compared. It is obvious that except CrNiBN-600 coating, the other CrNiBN coatings present higher OCP values of -0.507 V to -0.542 V than -0.554 V of CrBN coating. It indicates that the moderate incorporation of Ni (4.35 at%-12.62 at%) could lower the corrosion occurrence. Two reasons contribute to this result. The first one is the relative potential. Typically, the potential of saturated calomel electrode relative to standard hydrogen electrode is 0.244 V, and the potential of Ni relative to standard hydrogen electrode is -0.250 V. Therefore, the potential of Ni relative to saturated calomel electrode is -0.494 V. As stated above, the OCP value of CrBN coatings is -0.554 V, which is lower than -0.494 V. Thus, doping Ni into CrBN coatings would shift the OCP more positive, and the similar phenomena has been found in Ni-CrSiN coatings system [26]. The second one is the lower surface porosity after Ni incorporation which has been presented in Section 3.2. The low surface porosity would hinder the penetration of 3.5 wt% NaCl solution, thus leading to high OCP values.
3.3.2. Analysis of Electrochemical Impedance Spectroscopy Results
Electrochemical impedance spectroscopy (EIS) is a frequency-domain measurement method that uses small-amplitude sinusoidal potential or current as the perturbation signal. Due to the wide frequency range of the measurements, it can provide more kinetic information and electrode interface structure information compared to other conventional electrochemical methods. Figure 5a,b show the whole and local Nyquist curves of CrBN and CrNiBN coatings, respectively. It could be seen that the Nyquist curves of both CrBN and CrNiBN coatings present two incomplete capacitive arcs. It demonstrates that there are two time constants [31]. To compare the second capacitive arc at low frequency, the CrBN coating presents the smallest capacitive arc. As the sputtering power of NiCr alloy target increases from 120 W to 600 W, the radius of the capacitive arc first increases to the maximum for CrNiBN-240 coating and then decreases gradually.
In order to clearly compare the corrosion resistance, the corresponding Bode plots including impedance modulus (|Z|) and phase are illustrated in Figure 6a,b. As shown in Figure 6a, the CrBN coating presents the lowest |Z| of 3813 Ω·cm2 at the frequency of 10 mHz. With the NiCr alloy target power increases to 120 W and 240 W, the impedance modulus (|Z|) increases to 6701 Ω·cm2 for CrNiBN-120 coating and 25497 Ω·cm2 for CrNiBN-240 coatings. However, when the NiCr alloy target power keeps increasing to 360 W, 480 W and 600 W, the impedance modulus (|Z|) decreases gradually to 8661 Ω·cm2. It indicates that the incorporation of Ni could enhance the corrosion resistance of CrBN coatings. More importantly, the optimal incorporation of Ni is 7.28 at% for CrNiBN-240 coating, which is consistent with the variation of capacitive arc shown in Figure 5a. From another point of view, two peaks observed on the phase curve in Figure 6b demonstrate the two time constants as well. Moreover, the phase of CrNiBN-240 fluctuates between 40° and 55° over the frequency range from 100 mHz to 1000 Hz, while the phases of other coatings fluctuate between 15° and 55° at the same frequency range. It demonstrates that the CrNiBN-240 coating exhibits more capacitive characteristics over the same frequency range, providing stronger protection.
In order to understand the electrochemical construction of CrNiBN coatings, the equivalent circuit (EC) was used to fit EIS results [32,33]. Since two capacitive arcs and two peaks are observed in Nyquist and Bode plots, the equivalent circuit with a dual-time-constant as shown in Figure 7 was used to fit the EIS data. In this equivalent circuit, the electrolyte resistance (Rs) originates from the solution ohmic contribution between the working electrode and the reference electrode. The pore resistance (Rpo) reflects the coating’s barrier effect against electrolyte penetration with CPEpo being the corresponding coating capacitance. The charge transfer resistance (Rct) is related to the formation of the double layer at the 45 steel/electrolyte interface with CPEdl being the corresponding double-layer capacitance. Among these, the constant phase element (CPE) is used to describe non-ideal capacitive behavior, and its impedance expression is:
In this formula, Y0 is the capacitance (Fs/n/m2), ω is the angular frequency (rad/s), and n is the CPE index (ideal capacitance when n=1, non-ideal capacitance when n<1). The CPE index is related to the electrode surface roughness and non-uniformity.
To ensure the reliability of fitting results by equivalent circuit, the chi-squared values (χ2) were required to achieve magnitude order of ×10−4. The fitting results of the equivalent circuit components by software ZsimpWin are listed in Table 1 with the corresponding chi-squared values (χ2) of 1.035-7.203×10⁻⁴. Owing to the systemic error at high frequency [34], the Rs value fluctuates from 2.690 to 2.990 Ω·cm2. With Regard to the pore resistance Rpo, CrNiBN-600 coatings presents the highest value of 1.390×10³ Ω·cm2, which is closely related to its lowest surface porosity of 7.7%. To compare the corrosion resistance of coatings, the charge transfer resistance Rct is commonly used [35,36]. The Rct value of CrBN coating is 1.568×10³ Ω·cm2 while the Rct values of CrNiBN coatings are in the range 3.262×10³ Ω·cm2 to 1.965×10⁴ Ω·cm2. This indicates that doping with Ni enhances the corrosion resistance of the CrBN coating. Moreover, as the NiCr alloy target power increases, Rct first increases to 1.965×10⁴ Ω·cm2 for CrNiBN-240 coating and then decreases to 3.262×10³ Ω·cm2 for CrNiBN-600 coating. It demonstrates that with the increase of Ni content, the corrosion resistance becomes stronger first but then becomes weaker. Additionally, over the frequency range from 100 mHz to 1 Hz, the phase of CrBN coating increases from 5° to 25°. The low (CPE-n)dl of 0.5544 is in well agreement. In contrast, the phase of CrNiBN coating fluctuates from 40° to 50°, which is consistent with the high (CPE-n)dl of 0.6128 to 0.7641. As stated in Equation (2), n is the CPE index indicating the deviation degree from an ideal capacitor. Thus, the high (CPE-n)dl of CrNiBN coatings indicates that they act more like a capacitor as compared to CrBN coating.
3.3.3. Analysis of Potential-Dynamic Polarization Results
Generally, the self-corrosion current density reflects the corrosion rate of coatings from kinetic perspective. The lower its value, the slower the corrosion rate, indicating better corrosion resistance. Figure 8 shows the polarization curves of CrBN and CrNiBN coatings. First of all, the polarization curves of CrNiBN coatings shift to left direction as compared to that of CrBN coating after Ni incorporation as shown in Figure 8a. Namely, the corrosion current density becomes lower, and corrosion resistance becomes stronger. On the other hand, although CrNiBN-360 coating presents the highest self-corrosion potential of -0.4369 V, CrNiBN-240 coating presents the second highest self-corrosion potential of -0.4379 V as shown in Figure 8b. In contrast, the CrBN coating and CrNiBN-600 coatings presents the lowest self-corrosion potential around -0.5411 V. These results of self-corrosion potential are consistent with the OCP results shown in Figure 4.
By using the Tafel curve extrapolation method, the self-corrosion potential (Ecorr), self-corrosion current density (Icorr), anodic Tafel slope (βa) and the slope of the cathode tower (βc) were obtained. Subsequently, the polarization resistance (Rp) was calculated using the Stern-Geary equation as Equation (1). The relevant parameters are listed in Table 2. The results show that the corrosion current densities Icorr of the CrNiBN coatings are in the range of 410.5 to 2898 nA/cm2, which are lower than 12490 nA/cm2 of the CrBN coating, indicating that the Ni incorporation could significantly slows down the corrosion rate of CrBN coating. Compared with the polarization resistance Rp of the CrBN coating (3.5 kΩ·cm2), the Rp value of the CrNiBN coating first increases to 74.9 kΩ·cm2 for CrNiBN-240 and CrNiBN-360 coatings by an order of magnitude as the Ni content increases. Afterwards, the polarization resistance Rp gradually decreases to 13.2 kΩ·cm2 as the Ni content further increases.
As shown in Figure 9, the variation of the polarization resistance Rp is consistent with the variation of Rct value. Both of EIS and PP results demonstrate that CrNiBN-240 coating presents the strongest corrosion resistance.
In order to reveal the corrosion mechanism, the surface morphologies of CrBN and CrNiBN coatings after PP test were observed by SEM. The corresponding SEM images of surfaces after PP test are illustrated in Figure 10.
As compared to the original surface morphologies shown in Figure 2, the features of top surface cannot be seen clearly. Namely, the morphologies after PP test become blurred. It has been reported that this phenomena is closely related to the generation of oxides, which would cover on the top surface and lower the conductivity [26]. In order to confirm this deduction, the EDS measurements were conducted on the CrNiBN-480 coatings, and the corresponding spectra results are illustrated in Figure 11.
Two regions were chosen for measurement to minimize the error. It could be found that 4.61 at% of O element was detected in region 1 while 2.72 at% of O element was detected in region 2. This proves the generation of oxides during PP tests. According to the Gibbs energies of Equations (3) and (4), NiO is easier than Cr2O3 to form. For this reason, the more Ni incorporation would induce more oxidation even the surface porosity is low. As a consequence, CrNiBN-480 and CrNiBN-600 coatings with more Ni content present decreasing polarization resistance Rp and charge transfer resistance Rct in Table 2.
2Ni+O2=2NiO
2CrN+3H2O=Cr2O3+2NH3
According to the above results, the corrosion resistance of CrNiBN coatings is subject to three factors, which are surface porosity, self-corrosion potential and oxidation difficulty. It could be concluded that owing to the combination effects of moderate surface porosity, the highest self corrosion potential and less oxidation, the CrNiBN-240 coating presents the best corrosion resistance.
4. Conclusions
In this study, the different concentrations of Ni was incorporated into CrBN coatings by adjusting sputtering power of NiCr alloy target. The microstructure, surface porosity and electrochemical properties of CrNiBN coatings in seawater were investigated by open-circuit potential (OCP), electrochemical impedance spectroscopy (EIS) and potentio-dynamic polarization tests. The finding are as below:
1) As compared to CrBN coating, the surface morphology of CrNiBN coatings became compact with lower surface porosity. It could hinder the penetration channel.
2) After Ni incorporation, the open-circuit potential increased from -0.554 V to -0.507 V due to the low surface porosity and relative positive potential of Ni. It indicates that the occurrence of corrosion for CrNiBN coating became hard.
3) Owing to the combination effect of moderate surface porosity, the highest self corrosion potential and less oxidation, the CrNiBN-240 coating presented the best corrosion resistance with the highest charge transfer resistance of 1.965×10⁴ Ω·cm2 and the highest polarization resistance of 74.9 kΩ·cm2.
Author Contributions
Conceptualization, Z.D.Z. and Q.Z.W.; methodology, Z.D.Z. and Q.Z.W.; validation, Z.D.Z.; X.W. and Q.Z.W.; formal analysis, Z.D.Z.; X.W. and Q.Z.W.; investigation, Z.D.Z.; X.W. and Q.Z.W.; resources, Q.Z.W.; G.Z. and Z.F.Z.; data curation, Z.D.Z and X.W.; writing—original draft preparation, Z.D.Z. and X.W.; writing—review and editing, Q.Z.W.; G.Z. and Z.F.Z.; supervision, Q.Z.W.; G.Z. and Z.F.Z.; project administration, Q.Z.W. and G.Z.; funding acquisition, Z.D.Z. All authors have read and agreed to the published version of the manuscript.
Funding
This research was funded by National Students’ Platform for Innovation and Entrepreeurship Training Program (Grant No. 202510287027Z).
Data Availability Statement
The data presented in this study are available on request from the corresponding author. The data are not publicly available due to privacy or ethical restrictions.
Acknowledgments
This work has been supported by National Students’ Platform for Innovation and Entrepreeurship Training Program (Grant No. 202510287027Z). We would like to acknowledge them for their financial support.
Conflicts of Interest
The authors declare no conflicts of interest.
Abbreviations
The following abbreviations are used in this manuscript:
| SEM | Scanning Electron Microscope |
| EIS | Electrochemical Impedance Spectroscopy |
| PP | Potentio-dynamic Polarization |
| OCP | Open Circuit Potential |
References
- Li, T.; Long, H.; Qiu, C.; Wang, M.; Li, D.; Dong, Z.; Gui, Y. Multi-objective optimization of process parameters of 45 steel laser cladding Ni60PTA alloy powder. Coatings 2022, 12, 939. [Google Scholar] [CrossRef]
- Ma, S.; Zhang, C.; Li, L.; Yang, Y. Microstructure and properties of CoCrFeNiMnTix high-entropy alloy coated by laser cladding. Coatings 2024, 14, 620. [Google Scholar] [CrossRef]
- Long, H.; Li, T.; Shi, H.; Gui, Y.; Qiu, C. Experimental study of laser cladding Ni-based coating based on response surface method. Coatings 2023, 13, 1216. [Google Scholar] [CrossRef]
- Zhang, S.; Jiang, D.; Sun, S.; Zhang, B. Microstructure and tribological properties of FeCrCoMnSix high-entropy alloy coatings. Coatings 2024, 14, 1476. [Google Scholar] [CrossRef]
- Sharma, P.; Ju, H.; Figueiredo, N.; Ferreira, F. Exploring the potential of high-power impulse magnetron sputtering for nitride coatings: Advances in properties and applications. Coatings 2025, 15, 130. [Google Scholar] [CrossRef]
- Hu, X.; Xie, Y.; Li, F.; Yin, F. Research progress on environmental corrosion resistance of thermal barrier coatings: A review. Coatings 2024, 14, 1341. [Google Scholar] [CrossRef]
- Liu, Y.; Yu, S.; Shi, Q.; Ge, X.; Wang, W. Multilayer coatings for tribology: A mini review. Nanomaterials 2022, 12, 1388. [Google Scholar] [CrossRef]
- Maskavizan, A.J.; Quintana, J.P.; Dalibón, E.L.; Márquez, A.B.; Brühl, S.P.; Farina, S.B. Evaluation of wear and corrosion resistance in acidic and chloride solutions of cathodic arc PVD chromium nitride coatings on untreated and plasma nitrided AISI 4140 steel. Surf. Coat. Tech. 2024, 494, 131476. [Google Scholar] [CrossRef]
- Liu, J.; Liu, C.; Zhang, X.; Yin, X.; Meng, F.; Liu, C. The microstructure and wear resistance of laser cladding Ni60/60%WC composite coatings. Metals 2025, 15, 166. [Google Scholar] [CrossRef]
- Ge, F.; Zhu, P.; Meng, F.; Xue, Q.; Huang, F. Achieving very low wear rates in binary transition-metal nitrides: The case of magnetron sputtered dense and highly oriented VN coatings. Surf. Coat. Tech. 2014, 248, 81–90. [Google Scholar] [CrossRef]
- Chen, W.; Yang, X.; Li, X.; Chai, C.; Liu, W. Study on microstructure and properties of nickel-based self-lubricating coating by laser cladding. Coatings 2022, 12, 753. [Google Scholar] [CrossRef]
- Liu, Y.; Yang, Y.; Liu, X.; Zheng, J.; Zhang, S. Tribocorrosion of CrN coatings on different steel substrates. Surf. Coat. Tech. 2024, 484, 130829. [Google Scholar] [CrossRef]
- Chen, K.; Pan, Y.; Tang, G.; Liang, D.; Hu, H.; Liu, X.; Liang, Z. Facile fabrication of TiN coatings to enhance the corrosion resistance of stainless steel. Surf. Coat. Tech. 2024, 494, 131450. [Google Scholar] [CrossRef]
- Ruden, A.; Restrepo-Parra, E.; Paladines, A.U.; Sequeda, F. Corrosion resistance of CrN thin films produced by dc magnetron sputtering. Appl. Surf. Sci. 2013, 270, 150–156. [Google Scholar] [CrossRef]
- Wang, H.; Shu, X.; Liu, E.; Han, Z.; Li, X.; Tang, B. Assessments on corrosion, tribological and impact fatigue performance of Ti- and TiN-coated stainless steels by plasma surface alloying technique. Surf. Coat. Tech. 2014, 239, 123–131. [Google Scholar] [CrossRef]
- Kong, F.; Luan, J.; Xie, F.; Zhang, Z.; Evaristo, M.; Cavaleiro, A. The green lubricant coatings deposited by physical vapor deposition for demanding tribological applications: A review. Coatings 2024, 14, 828. [Google Scholar] [CrossRef]
- Wang, Y.; Zhang, S. Toward hard yet tough ceramic coatings. Surf. Coat. Tech. 2014, 258, 1–16. [Google Scholar] [CrossRef]
- Su, K.; Liu, D.; Shao, T. Microstructure and mechanical properties of TiAlSiN nano-composite coatings deposited by ion beam assisted deposition. Sci. China Technol. Sc. 2015, 58, 1682–1688. [Google Scholar] [CrossRef]
- Wang, L.; Zhang, G.; Wood, R.J.K.; Wang, S.C.; Xue, Q. Fabrication of CrAlN nanocomposite films with high hardness and excellent anti-wear performance for gear application. Surf. Coat. Tech. 2010, 204, 3517–3524. [Google Scholar] [CrossRef]
- Martinez, E.; Sanjinés, R.; Karimi, A.; Esteve, J.; Levy, F. Mechanical properties of nanocomposite and multilayered Cr-Si-N sputtered thin films. Surf. Coat. Tech. 2004, 180-181, 570–574. [Google Scholar] [CrossRef]
- Park, J.; Chung, W.; Cho, Y.; Kim, K. Synthesis and mechanical properties of Cr-Si-N coatings deposited by a hybrid system of arc ion plating and sputtering techniques. Surf. Coat. Tech. 2004, 188-189, 425–430. [Google Scholar] [CrossRef]
- Wang, Q.; Kim, K. Microstructural control of Cr-Si-N films by a hybrid arc ion plating and magnetron sputtering process. Acta Mater. 2009, 57, 4974–4987. [Google Scholar] [CrossRef]
- Yoo, Y.; Hong, J.; Kim, G.; Lee, H.; Han, J. Effect of Si addition to CrN coatings on the corrosion resistance of CrN/stainless steel coating/substrate system in a deaerated 3.5 wt.% NaCl solution. Surf. Coat. Tech. 2007, 201, 9518–9523. [Google Scholar] [CrossRef]
- Wang, Y.; Tang, Y.; Wan, W.; Zhang, X. Effect of Ni doping on the microstructure and toughness of CrAlN coatings deposited by magnetron sputtering. Mater. Res. Express 2020, 7, 026414. [Google Scholar] [CrossRef]
- Wang, Q.; Lin, Y.; Zhou, F.; Kong, J. The influence of Ni concentration on the structure, mechanical and tribological properties of Ni-CrSiN coatings in seawater. J Alloy. Compd. 2020, 819, 152998. [Google Scholar] [CrossRef]
- Wang, Q.; Lin, Y.; Zhou, F.; Kong, J. Electrochemical properties promotion of CrSiN coatings in seawater via Ni incorporation. J Alloy. Compd. 2021, 856, 157450. [Google Scholar] [CrossRef]
- Wang, Q.; Jin, X.; Zhou, F. Comparison of mechanical and tribological properties of CrBN coatings modified by Ni or Cu incorporation. Friction 2022, 10, 516–529. [Google Scholar] [CrossRef]
- Tao, H.; Zhylinski, V.; Vereschaka, A.; Chayeuski, V.; Huo, Y.; Milovich, F.; Sotova, C.; Seleznev, A.; Salychits, O. Comparison of the mechanical properties and corrosion resistance of the Cr-CrN, Ti-TiN, Zr-ZrN, and Mo-MoN coatings. Coatings 2023, 13, 750. [Google Scholar] [CrossRef]
- Wu, B.; Yao, J.; Dong, H.; Chen, Z.; Liu, X. Enhancing the corrosion resistance of passivation films via the synergistic effects of graphene oxide and epoxy resin. Coatings 2025, 15, 444. [Google Scholar] [CrossRef]
- Anandan, C.; Grips, V.; Selvi, V.; Rajam, K. Electrochemical studies of stainless steel implanted with nitrogen and oxygen by plasma immersion ion implantation. Surf. Coat. Technol. 2007, 201, 7873. [Google Scholar] [CrossRef]
- Wang, Q.; Zhou, F.; Zhou, Z.; Wang, C.; Zhang, W.; Li, L.; Lee, S. Effect of titanium or chromium content on the electrochemical properties of amorphous carbon coatings in simulated body fluid. Electrochim. Acta 2013, 112, 603–611. [Google Scholar] [CrossRef]
- Sui, J.; Cai, W. Effect of bias voltage on the structure and electrochemical corrosion behaviour of hydrogenated amorphous carbon(a-C:H)films on NiTi alloys. Surf. Coat. Technol. 2007, 201, 6906. [Google Scholar] [CrossRef]
- Hang, R.; Ma, S.; Chu, P. Corrosion behaviour of titanium alloy in the presence of serum proteins. Diamond Relat.Mater. 2010, 19, 1230. [Google Scholar] [CrossRef]
- Zeng, A.; Liu, E.; Zhang, S.; Tan, S.; Hing, P.; Annergren, I.; Gao, J. Impedance study on electrochemical characteristic of sputtered DLC films. Thin Solid Films 2003, 426, 258–264. [Google Scholar] [CrossRef]
- Krawiec, H.; Vignal, V.; Schwarzenboeck, E.; Banas, J. Role of plastic deformation and microstructure in the micro-electrochemical behaviour of Ti-6Al-4V in sodium chloride solution. Electrochim. Acta 2013, 104, 400–406. [Google Scholar] [CrossRef]
- Wang, W.; Alfantazi, A. Effect of microstructure and temperature on electrochemical behavior of niobium in phosphate-buffered saline solutions. J. Electrochem. Soc. 2013, 160, C1–C11. [Google Scholar] [CrossRef]
Figure 1.
The variation of element concentration as a function of NiCr alloy target power.
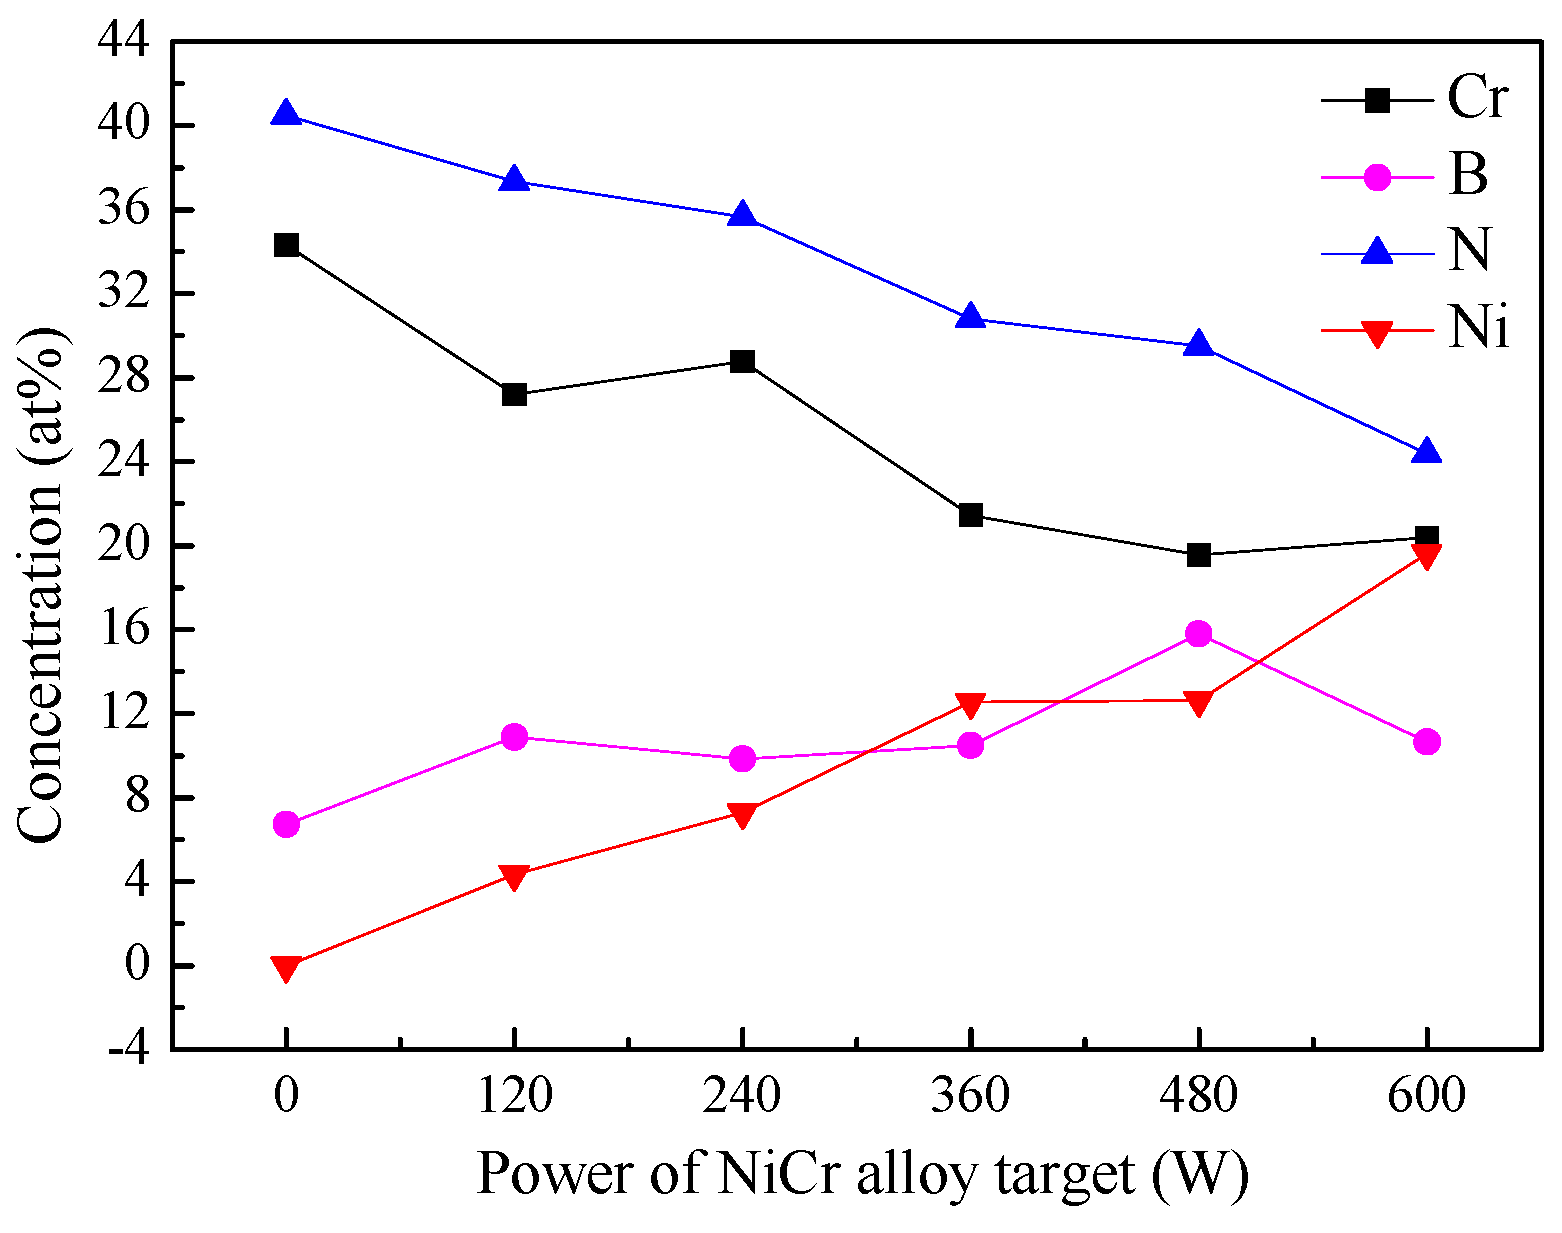
Figure 2.
Surface morphologies of (a)CrBN (b)CrNiBN-120 (c)CrNiBN-240 (d)CrNiBN-360 (e)CrNiBN-480 (f)CrNiBN-600 coatings.
Figure 2.
Surface morphologies of (a)CrBN (b)CrNiBN-120 (c)CrNiBN-240 (d)CrNiBN-360 (e)CrNiBN-480 (f)CrNiBN-600 coatings.
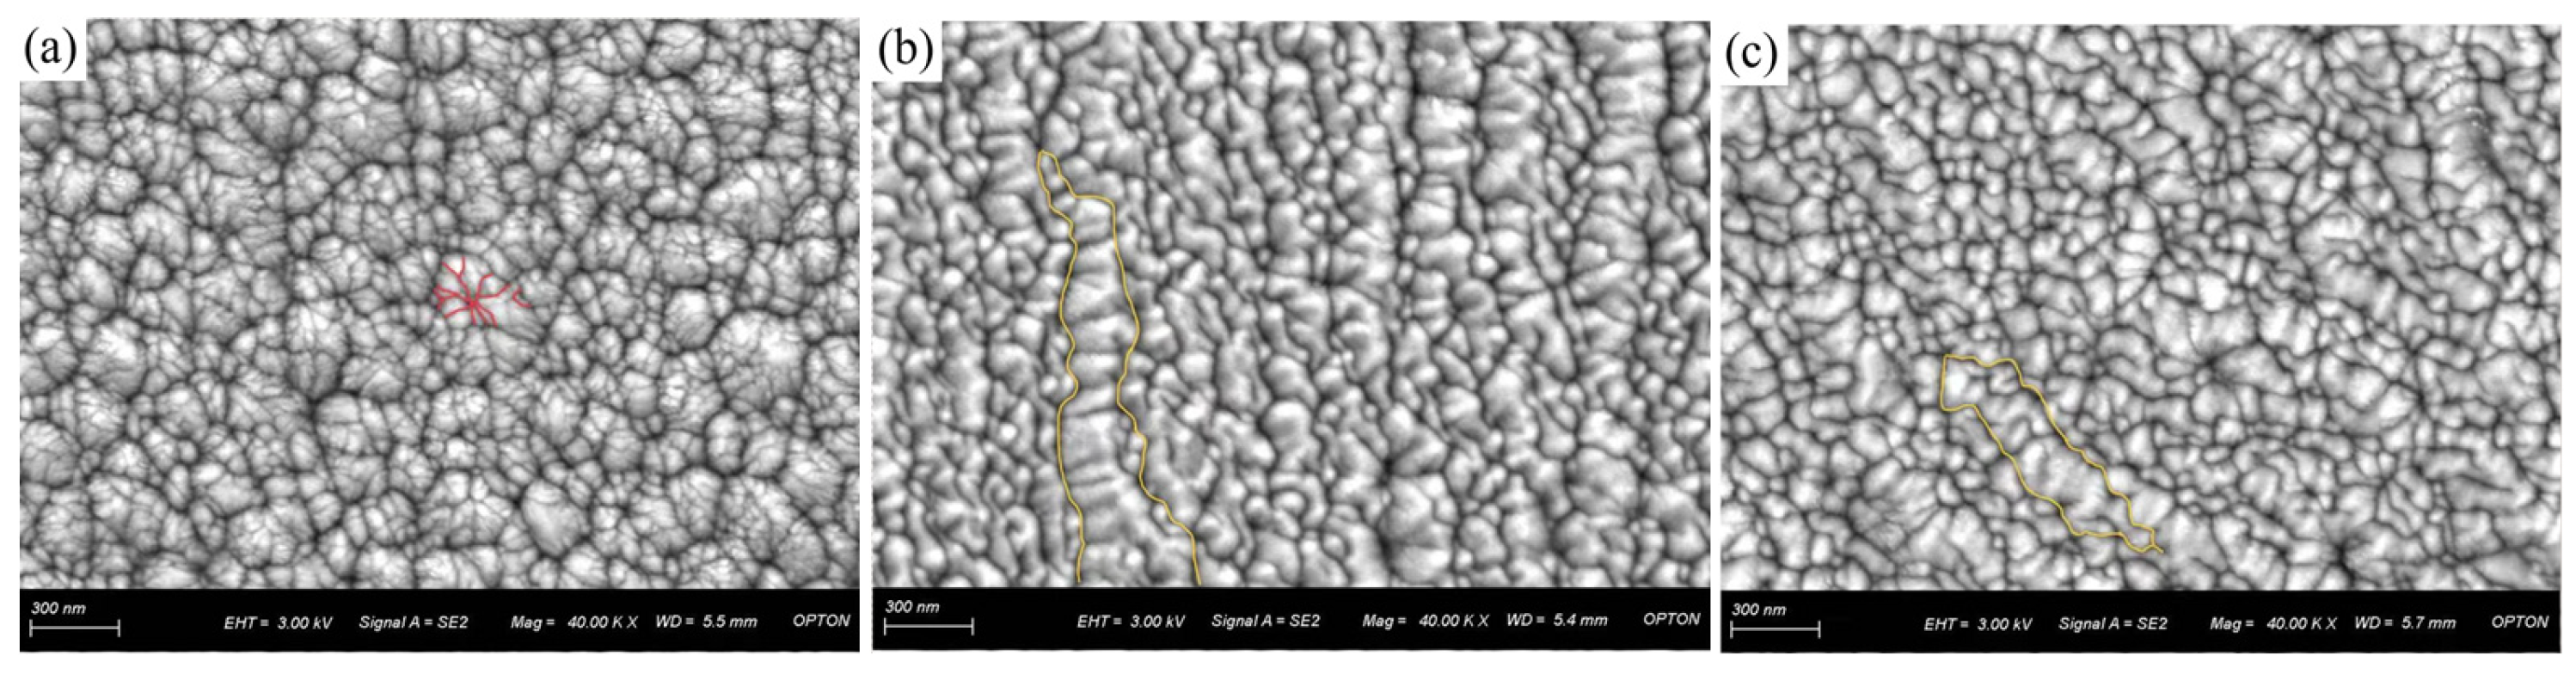
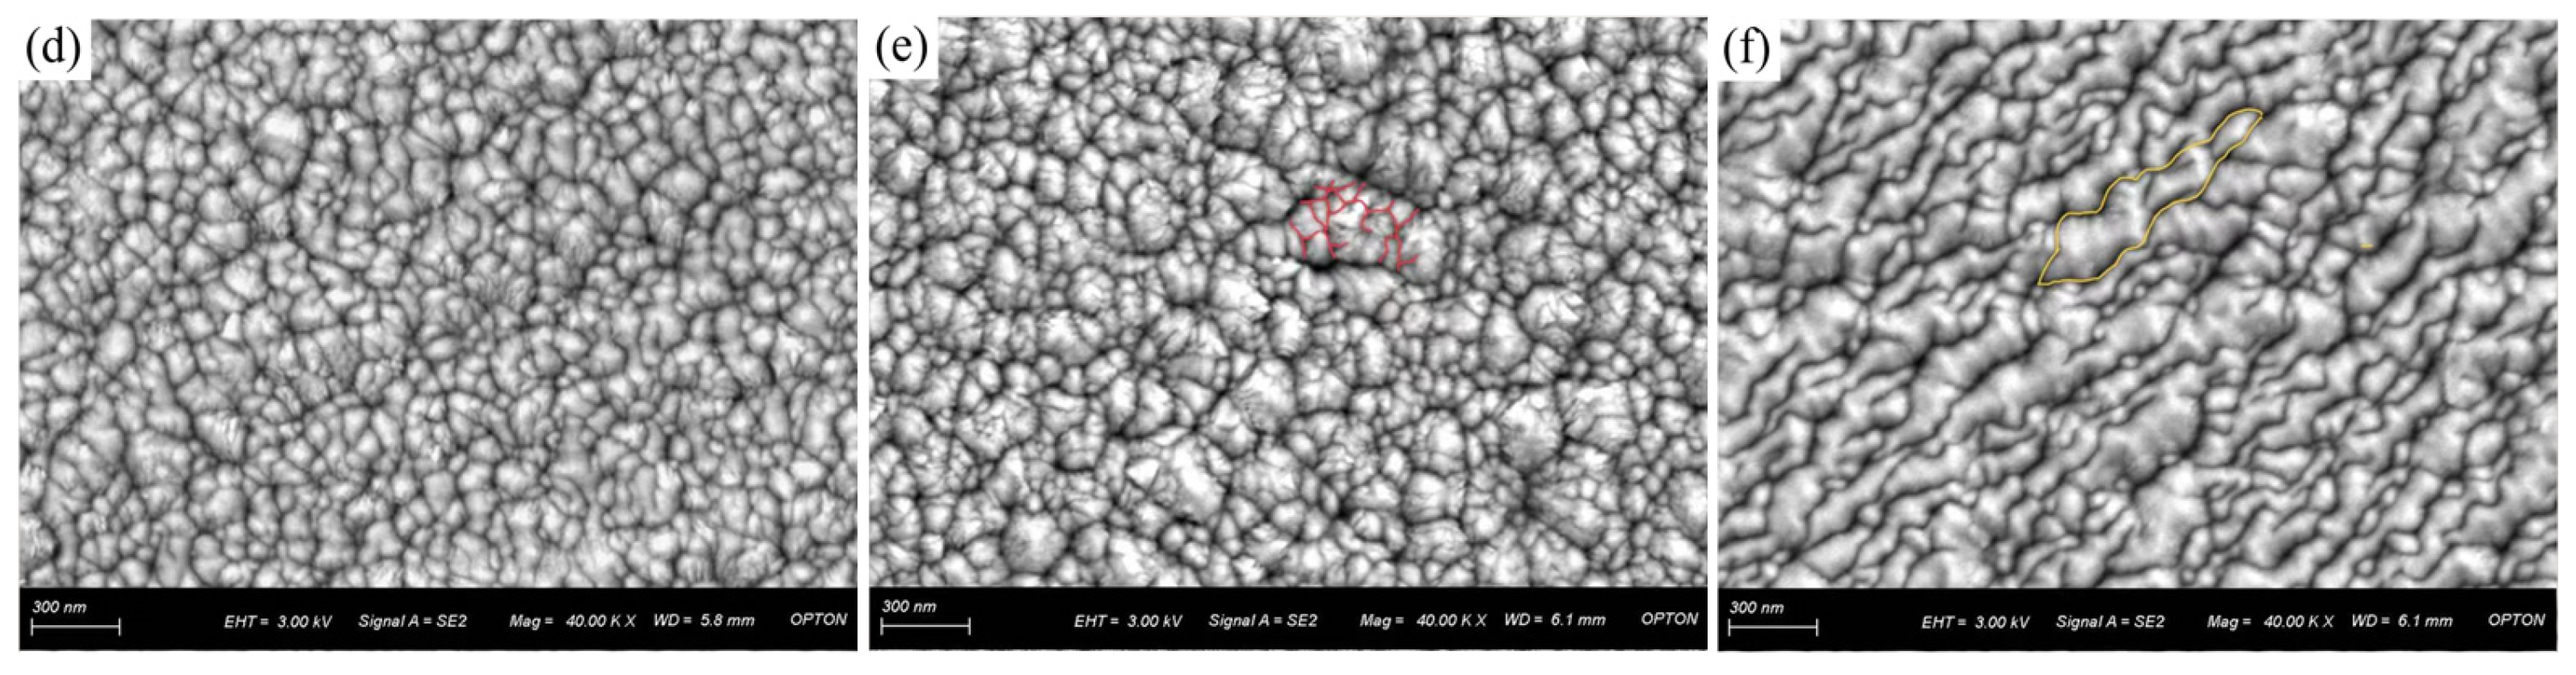
Figure 3.
(a) original image of surface morphology (b)(c) ImageJ processing images (d) average surface porosity of CrBN and CrNiBN coatings.
Figure 3.
(a) original image of surface morphology (b)(c) ImageJ processing images (d) average surface porosity of CrBN and CrNiBN coatings.
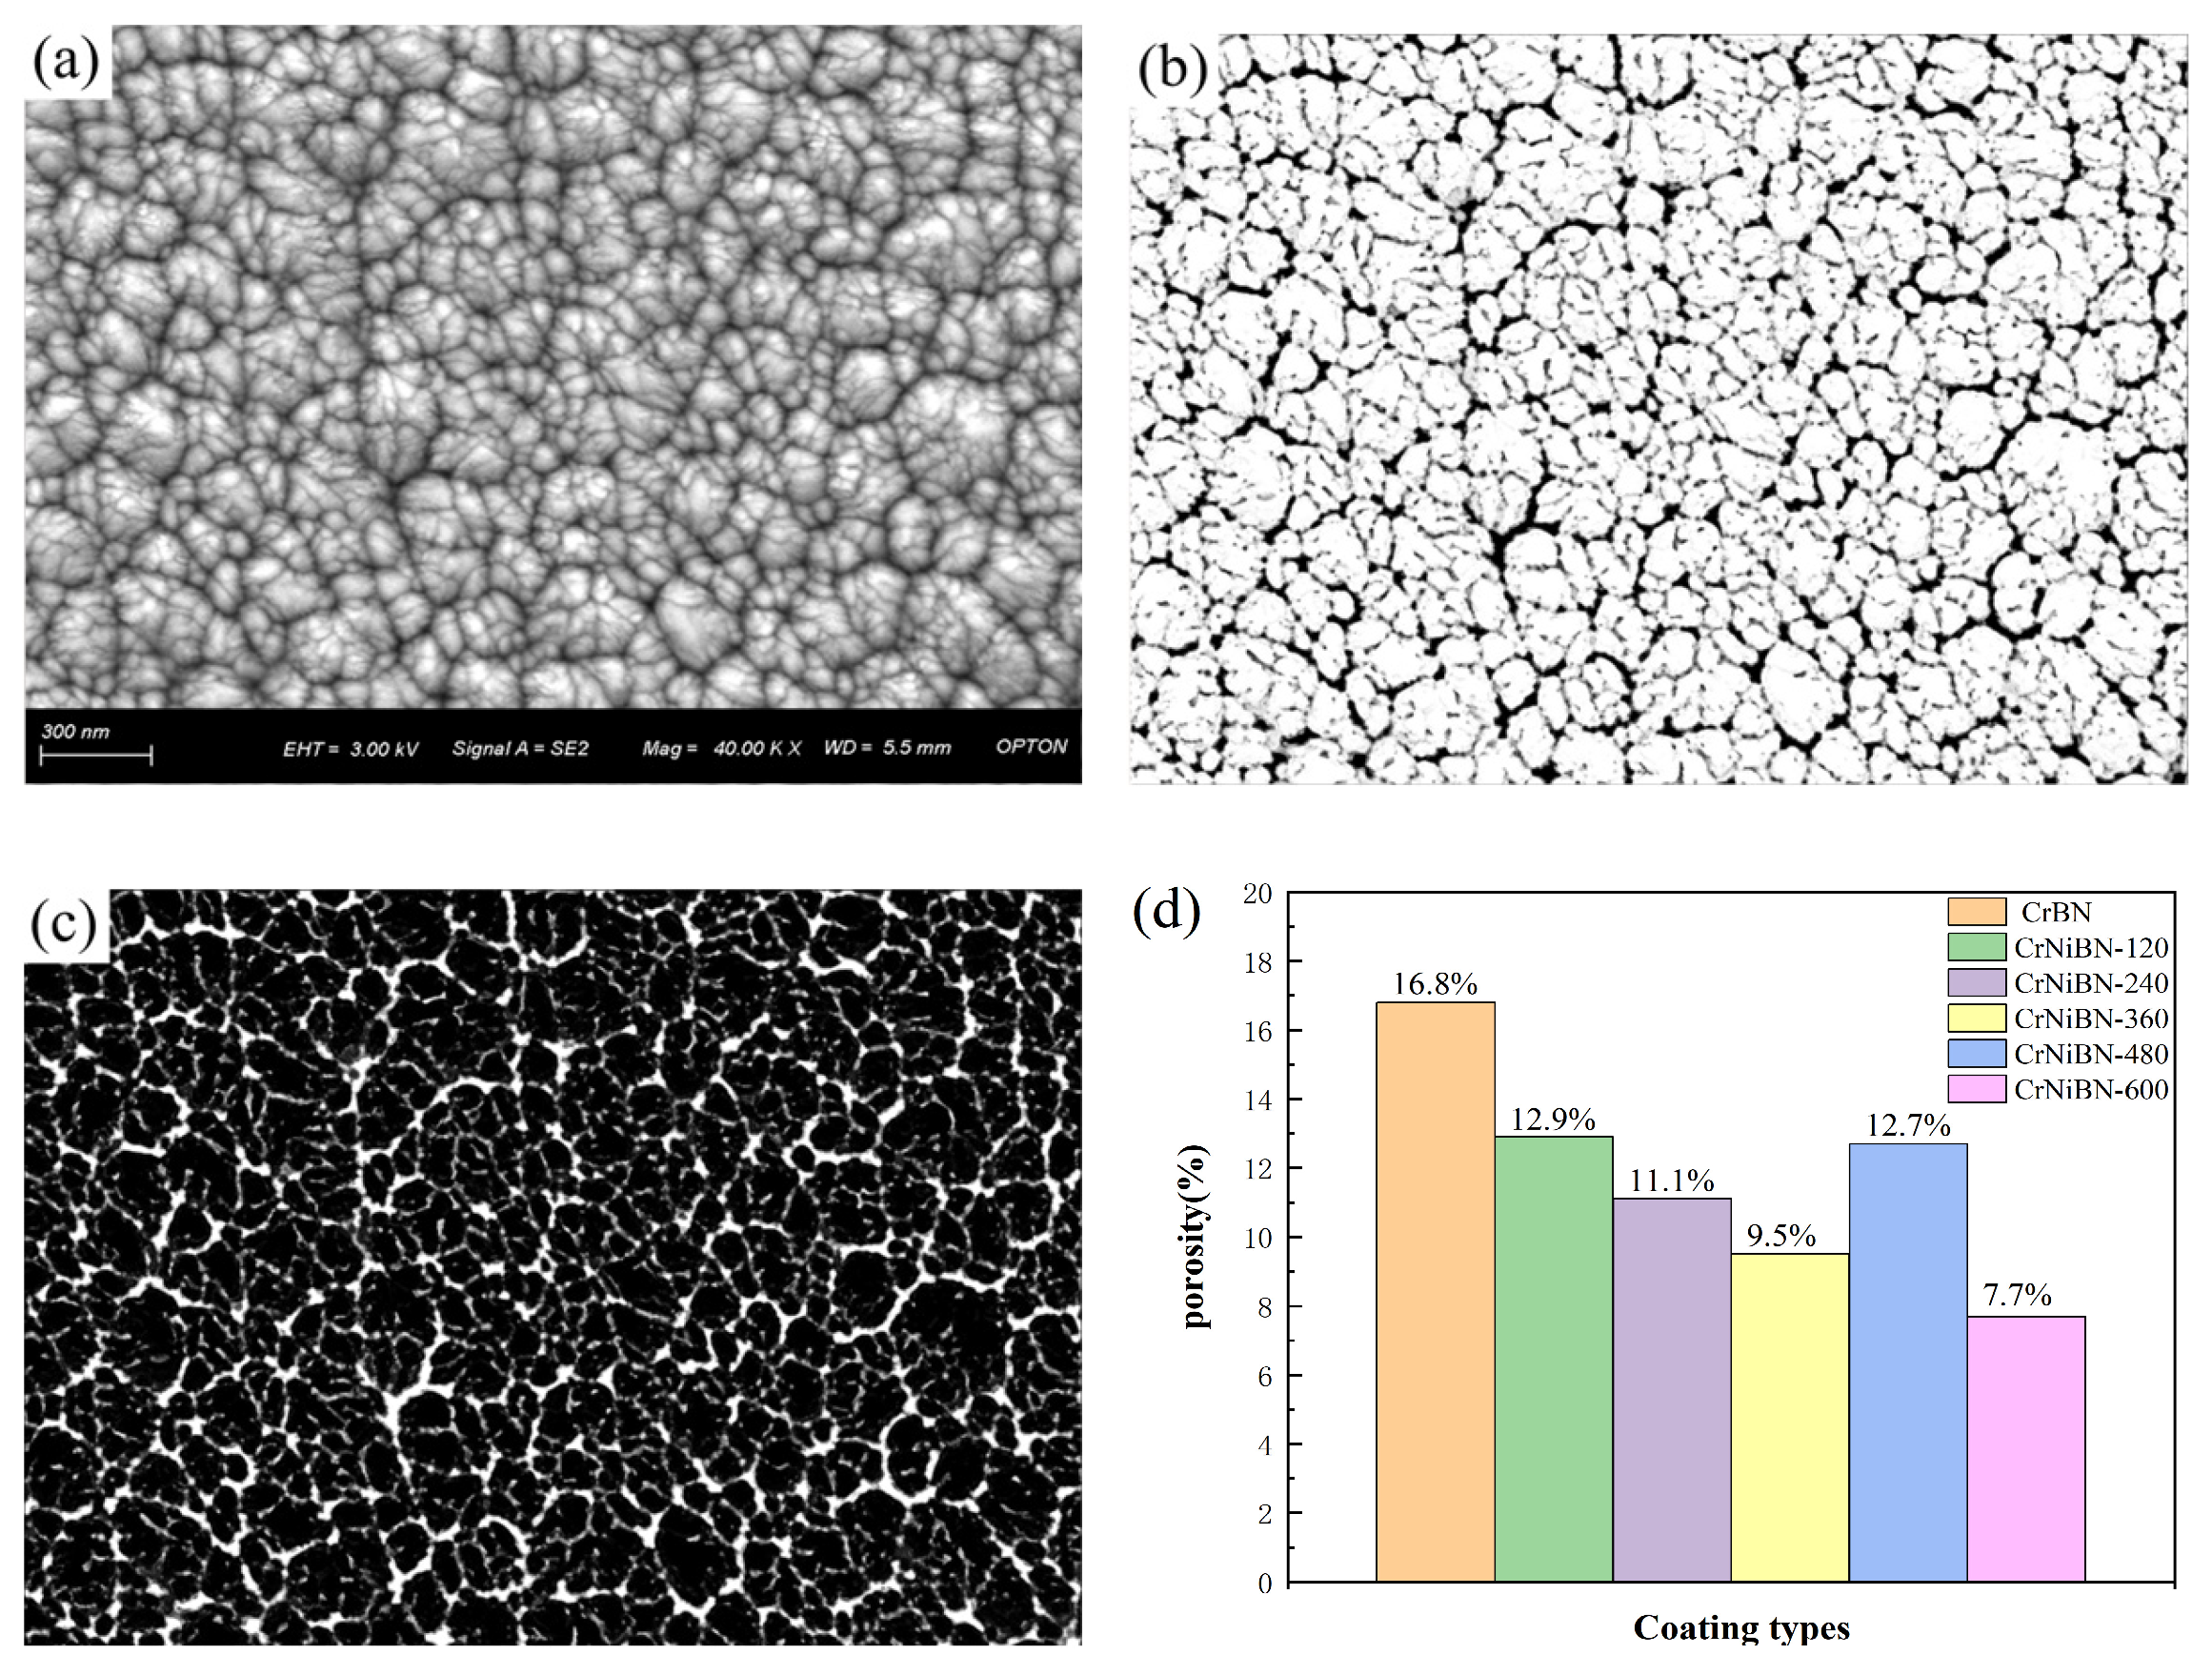
Figure 4.
The variation of OCP for CrBN and CrNiBN coatings in 3.5wt% NaCl solution.
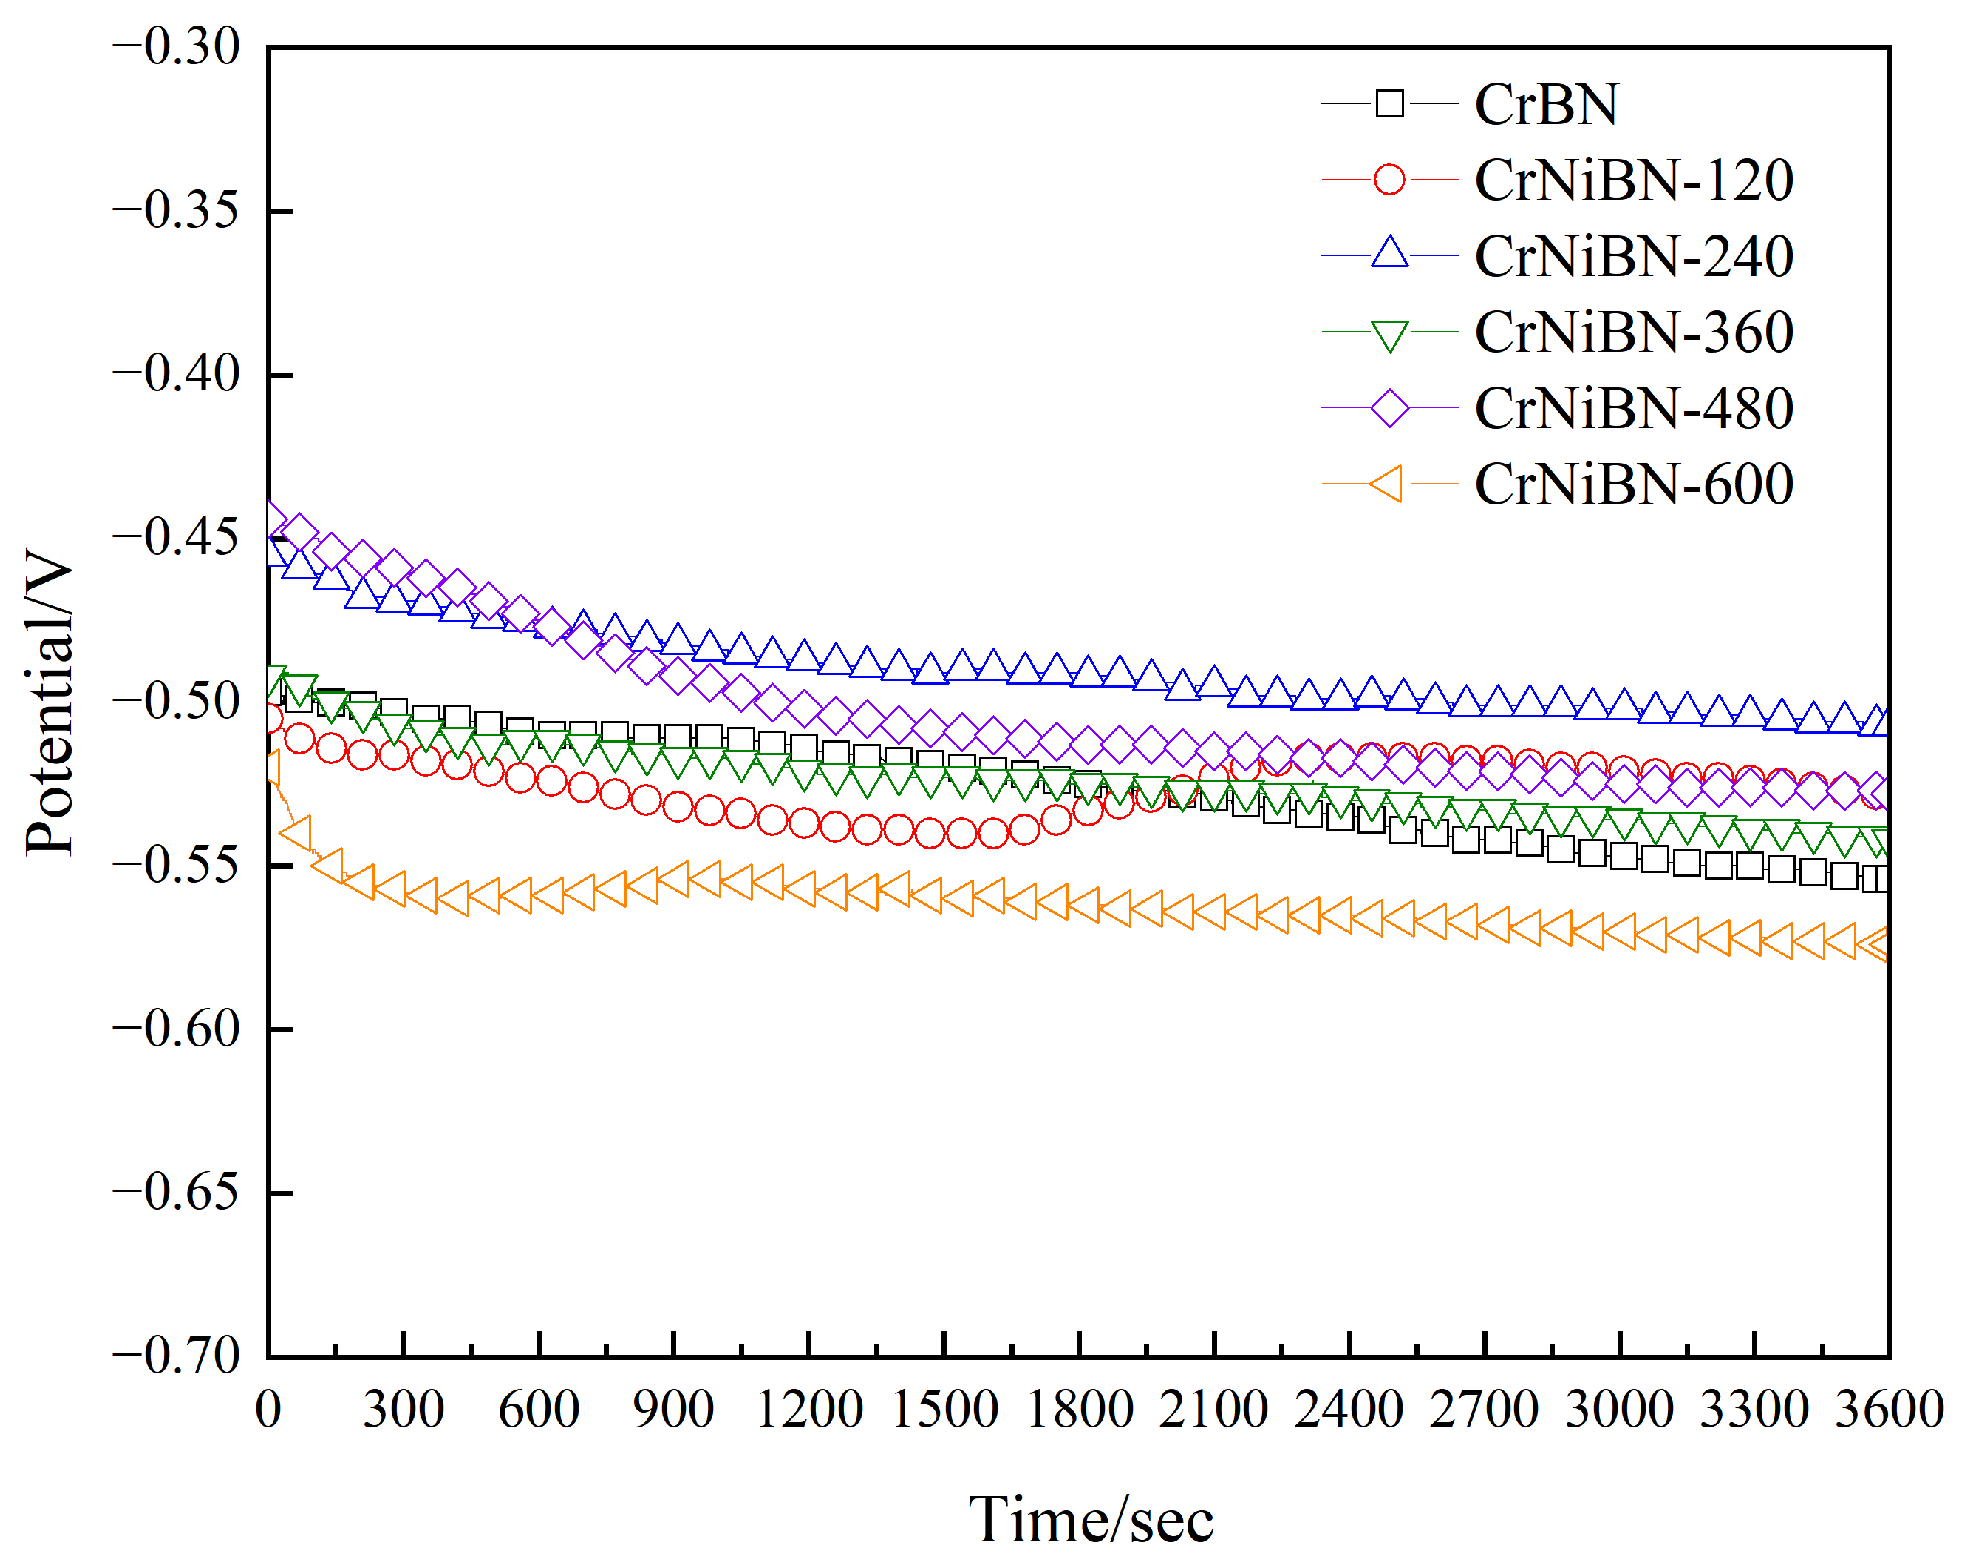
Figure 5.
(a) whole Nyquist plots (b) local Nyquist plots of CrBN and CrNiBN coatings.
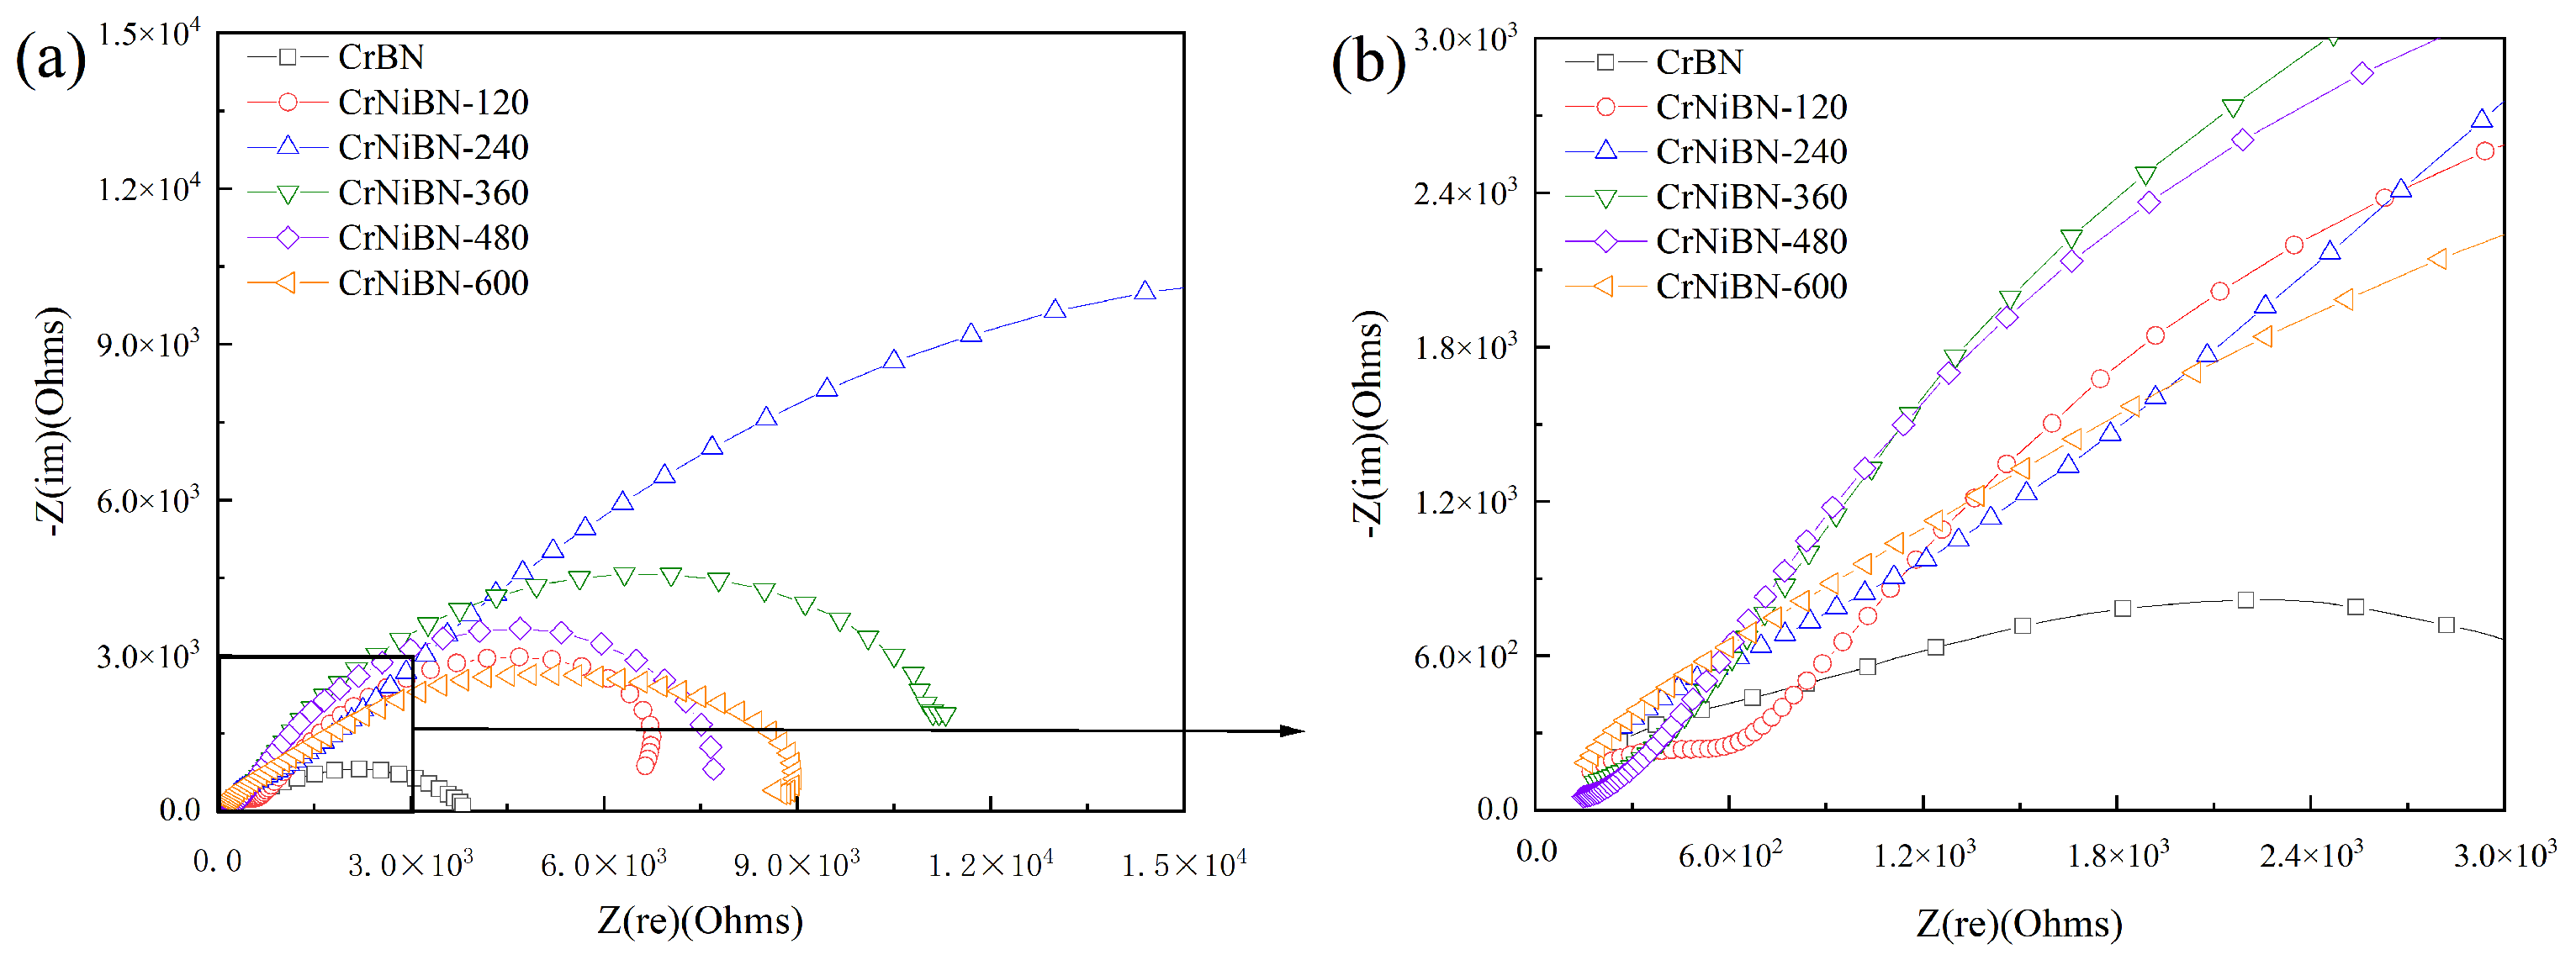
Figure 6.
(a) Variation of log|Z| (b) variation of phase as a function of logf for CrBN and CrNiBN coatings.
Figure 6.
(a) Variation of log|Z| (b) variation of phase as a function of logf for CrBN and CrNiBN coatings.
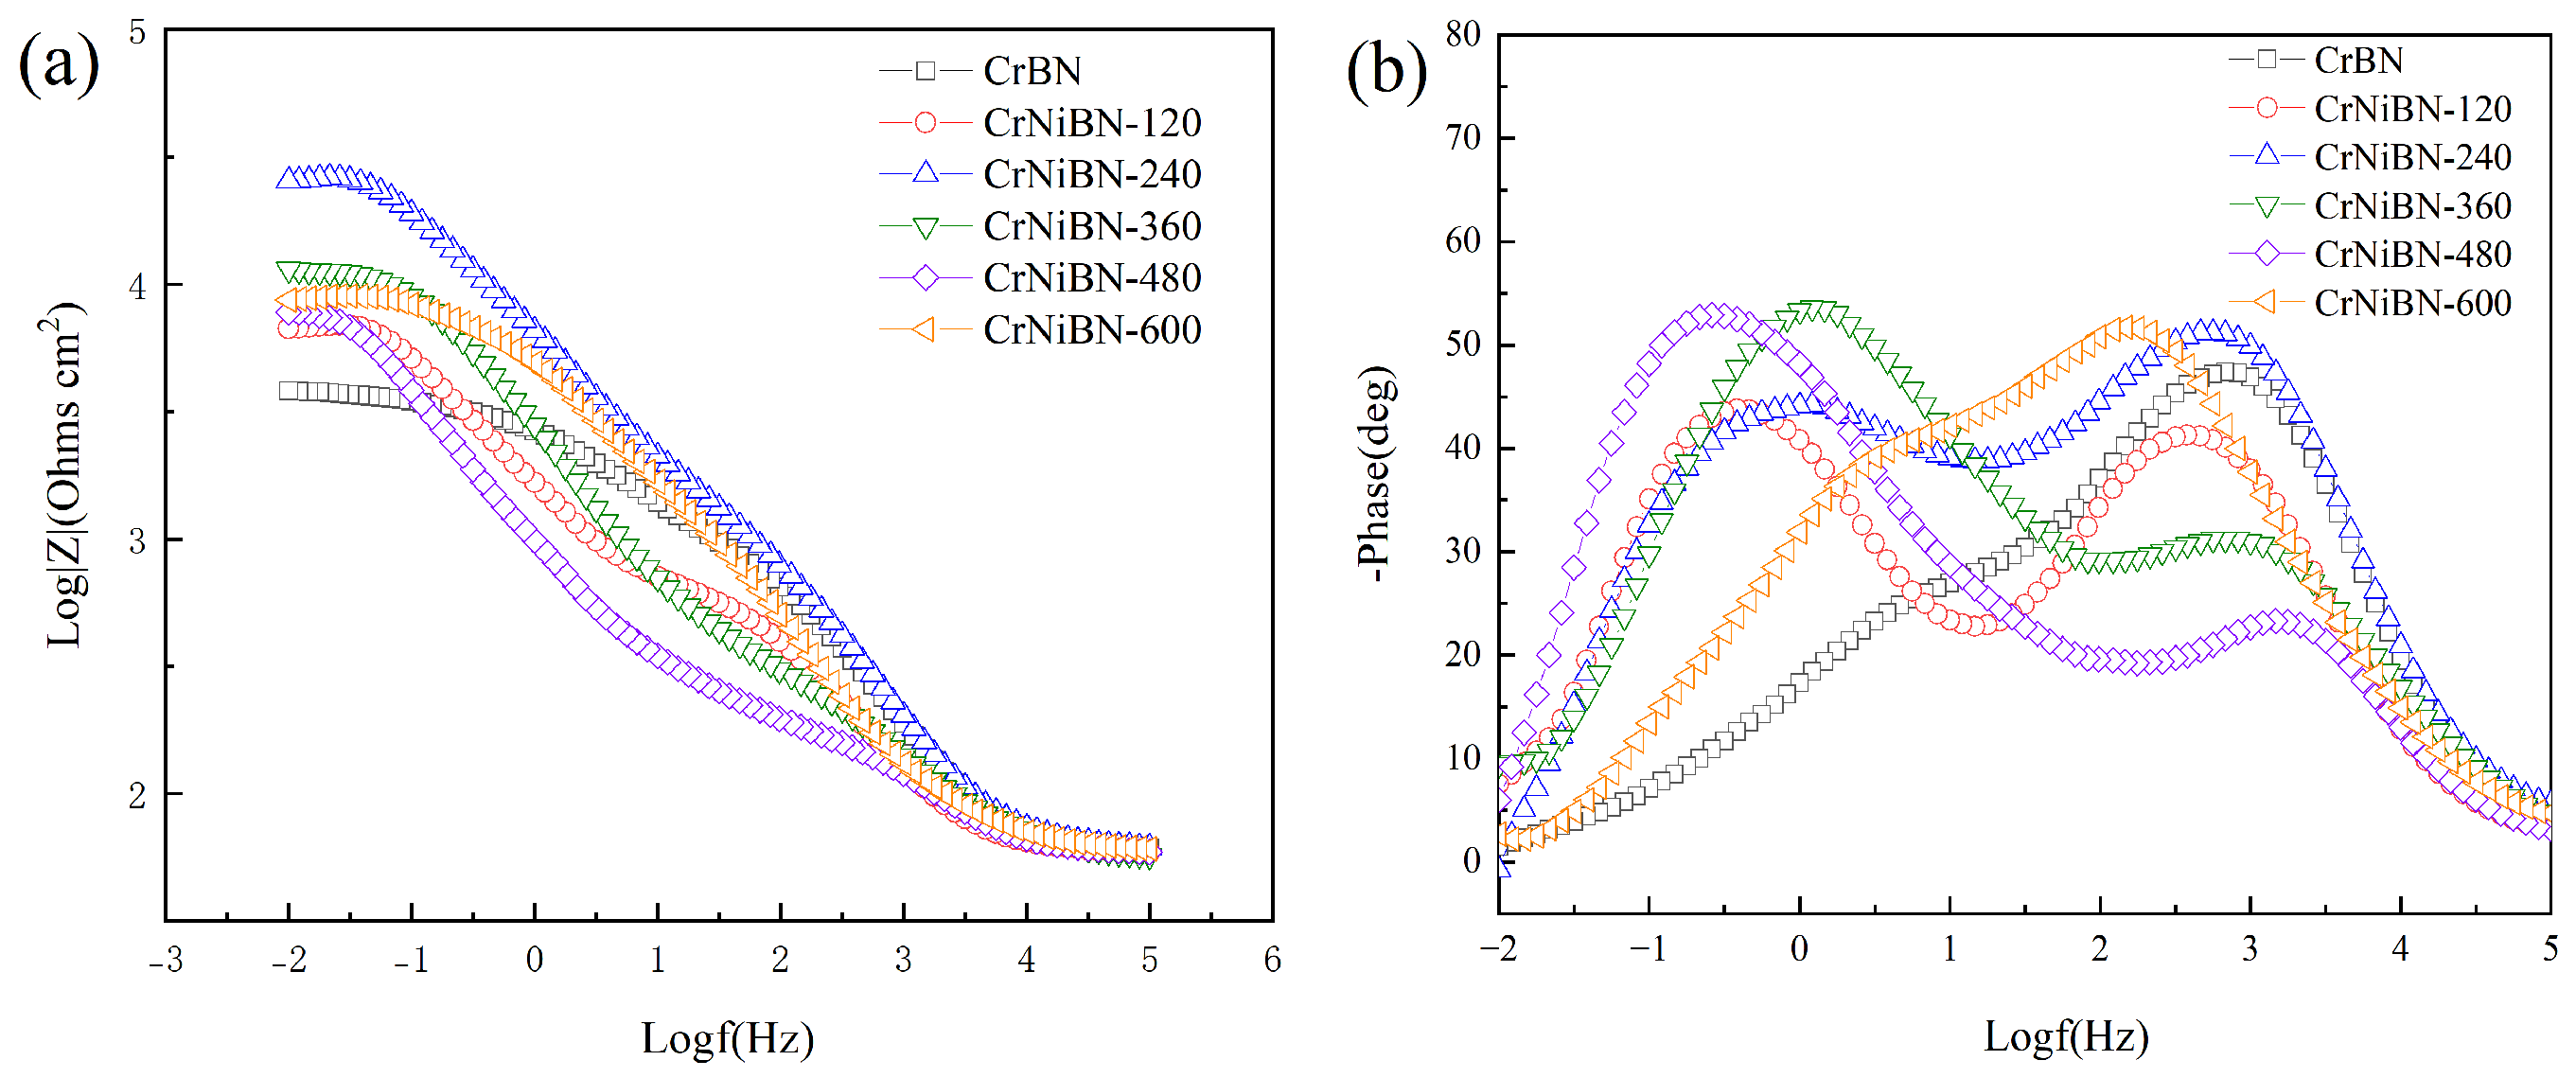
Figure 7.
Equivalent circuit for CrBN and CrNiBN coatings.
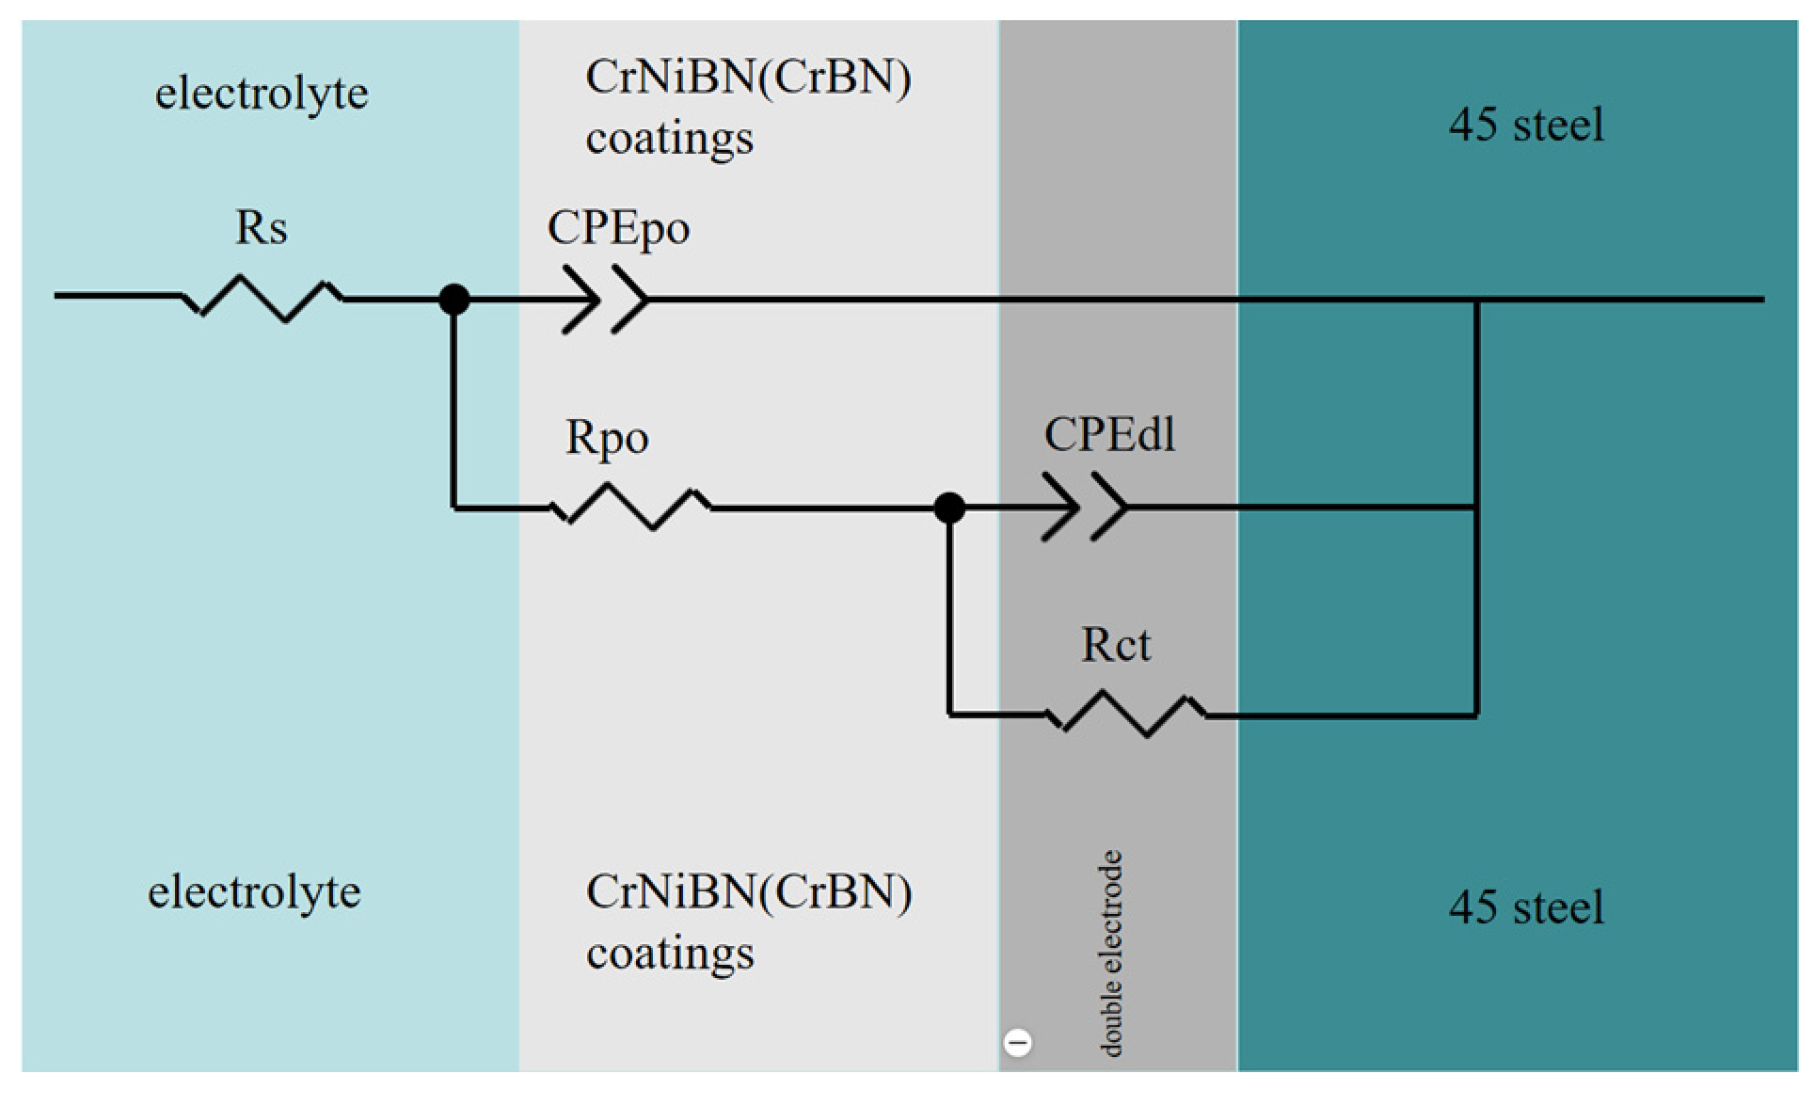
Figure 8.
(a) whole potential-dynamic polarization curves (b) local potential-dynamic polarization curves for CrBN and CrNiBN coatings.
Figure 8.
(a) whole potential-dynamic polarization curves (b) local potential-dynamic polarization curves for CrBN and CrNiBN coatings.
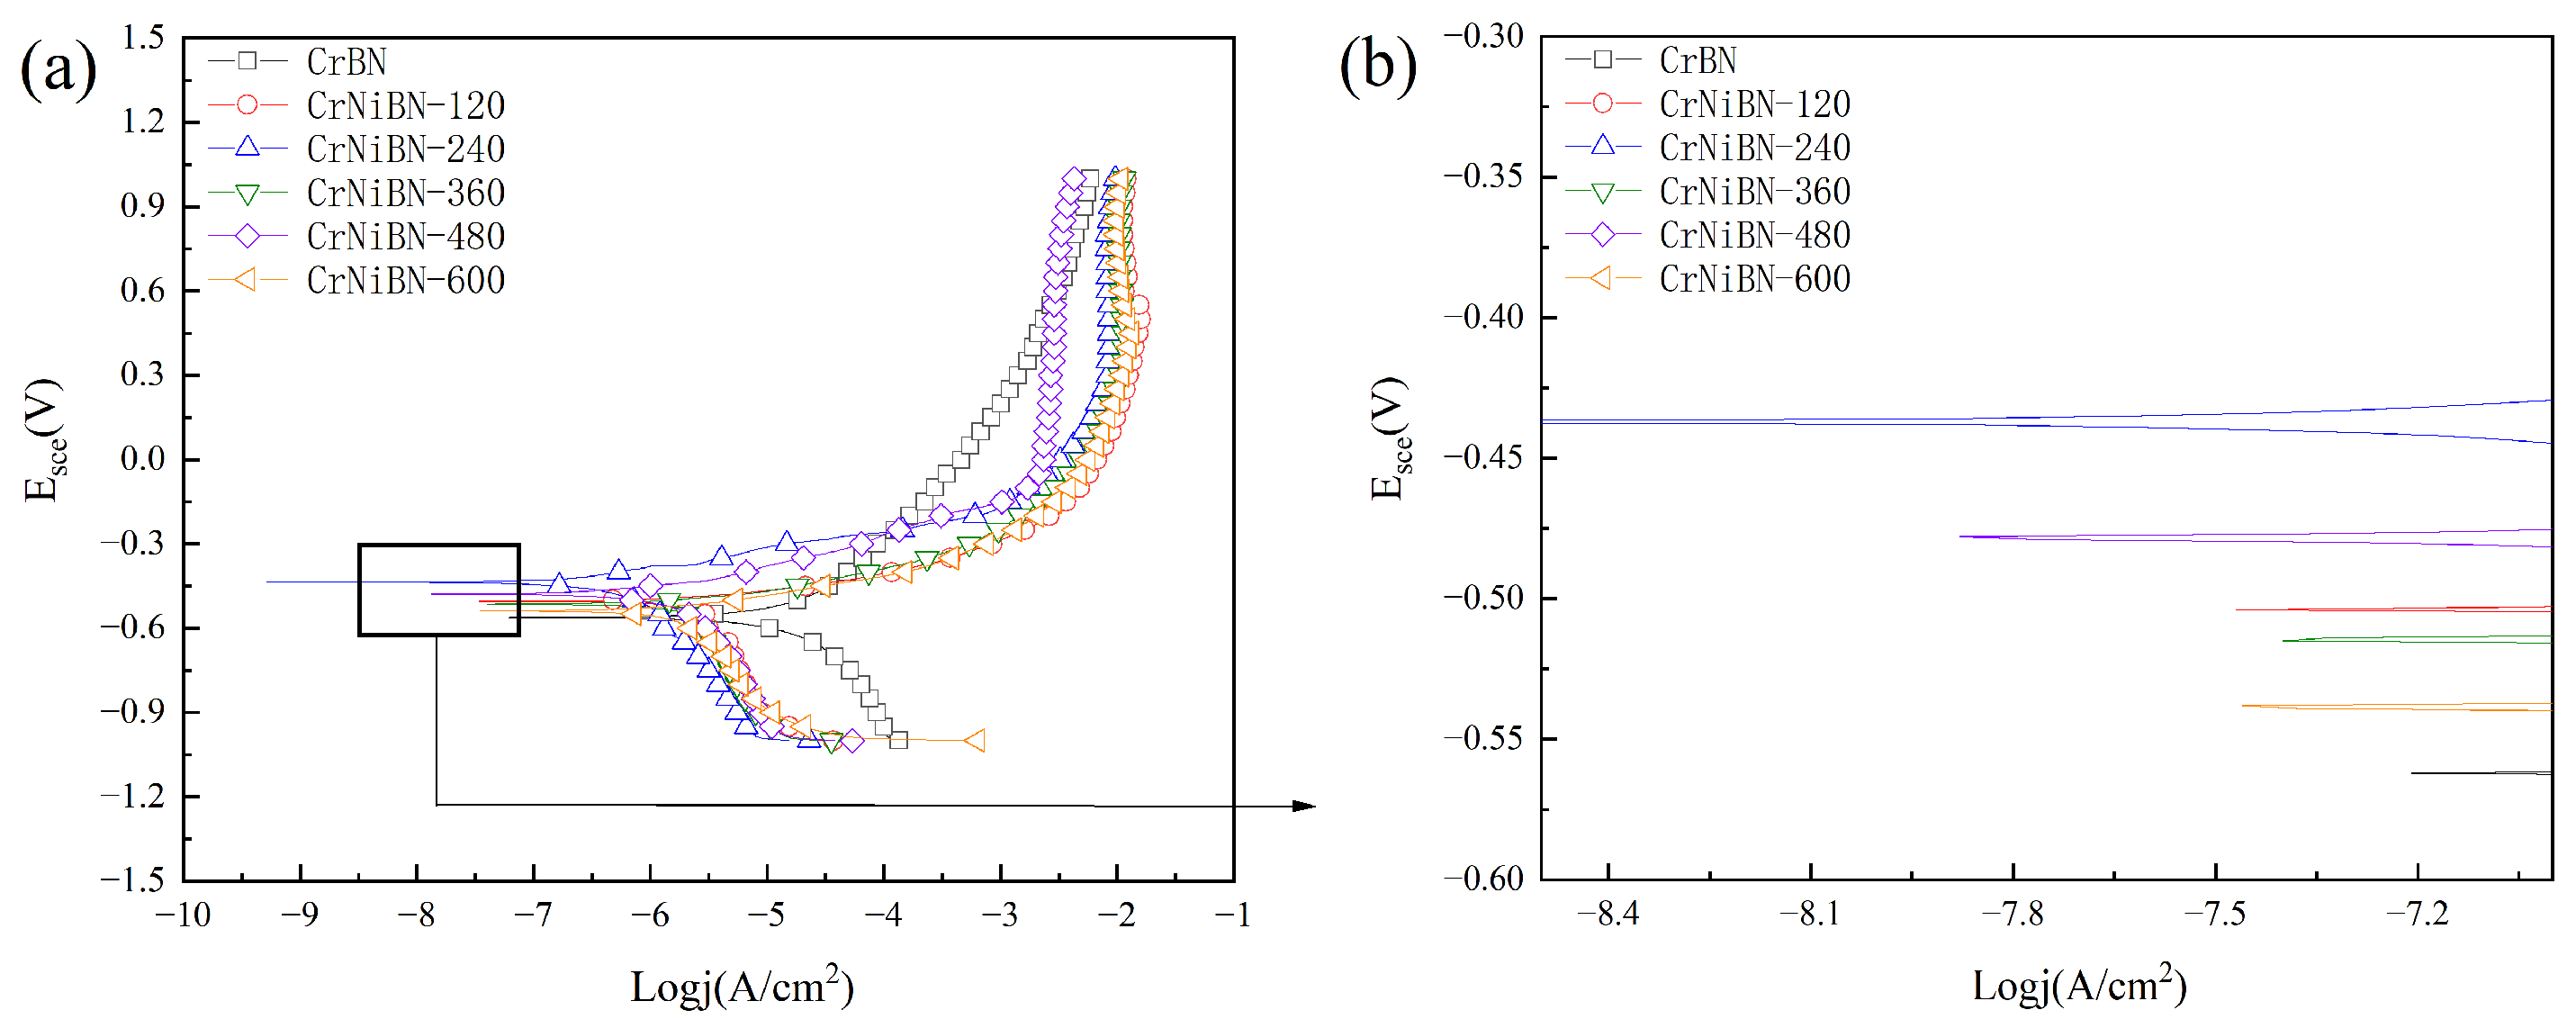
Figure 9.
The comparison of charge transfer resistance Rct and polarization resistance Rp for CrBN and CrNiBN coatings.
Figure 9.
The comparison of charge transfer resistance Rct and polarization resistance Rp for CrBN and CrNiBN coatings.
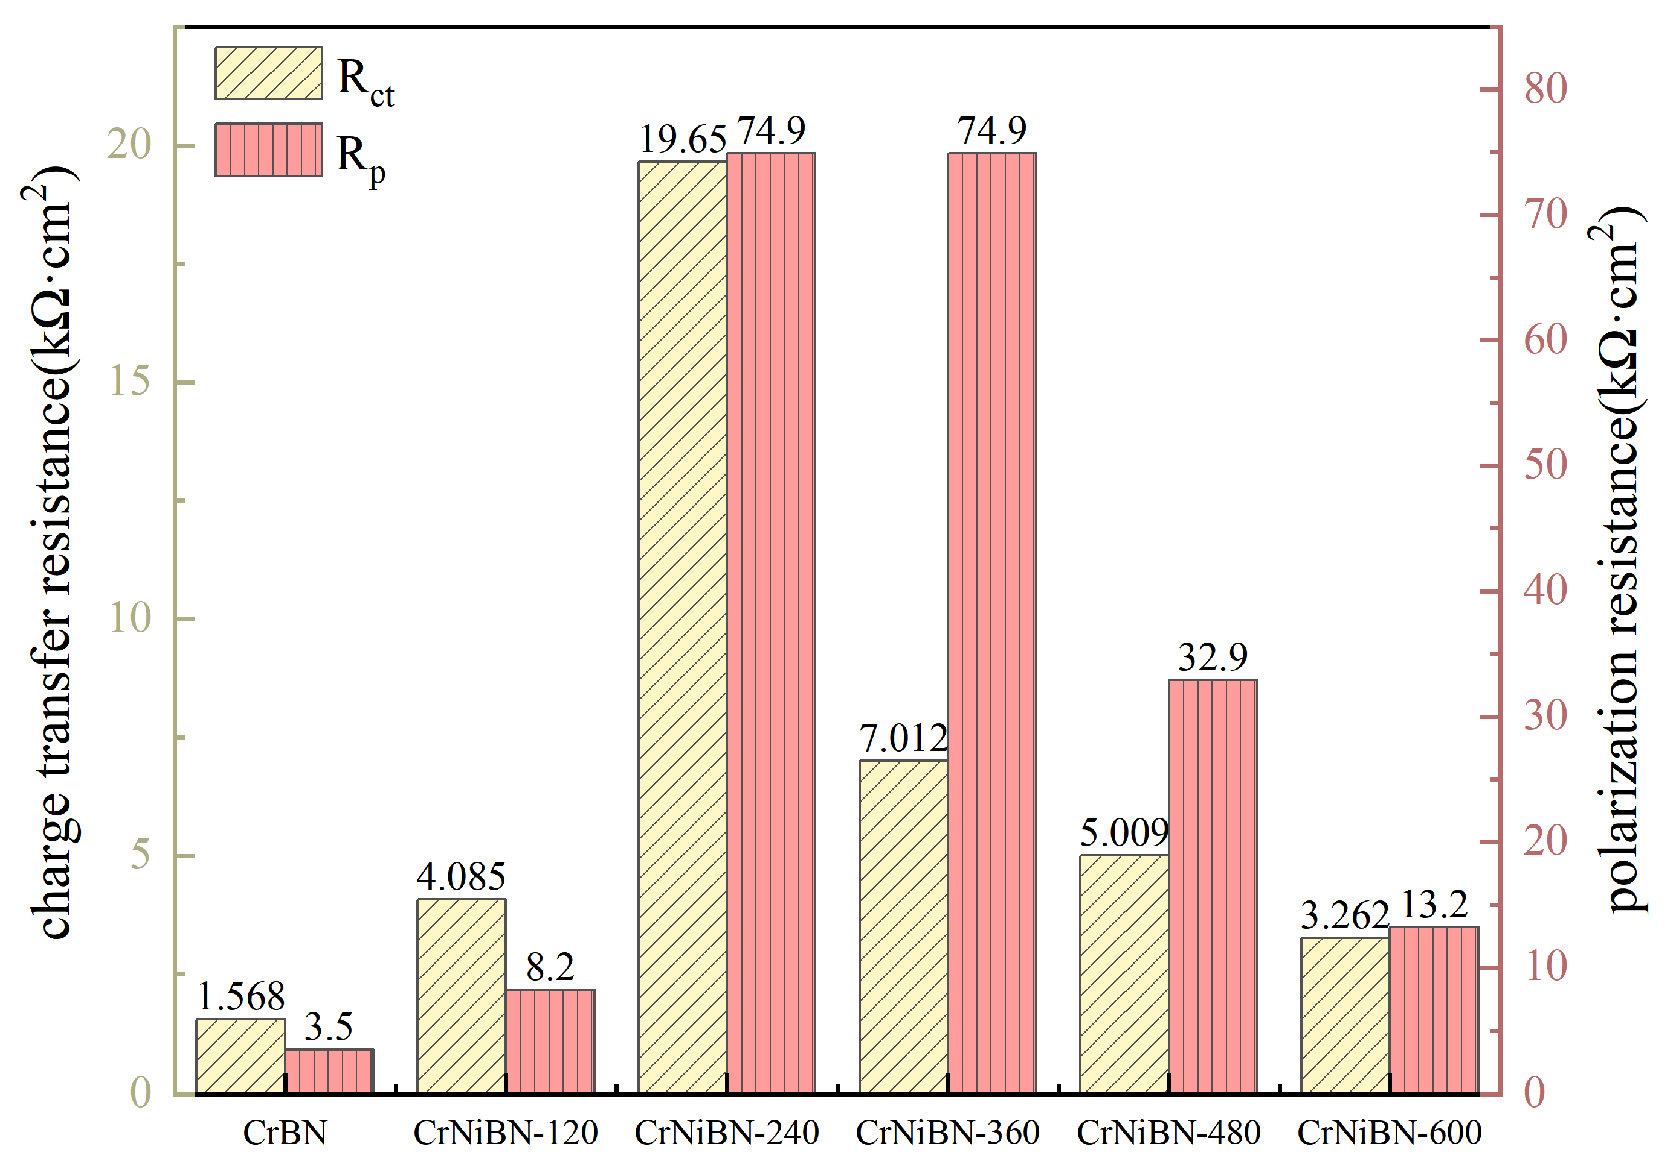
Figure 10.
The SEM images of surfaces for (a) CrBN (b) CrNiBN-120 (c) CrNiBN-240 (d) CrNiBN-360 (e) CrNiBN-480 (f) CrNiBN-600 coatings after potentio-dynamic polarization test.
Figure 10.
The SEM images of surfaces for (a) CrBN (b) CrNiBN-120 (c) CrNiBN-240 (d) CrNiBN-360 (e) CrNiBN-480 (f) CrNiBN-600 coatings after potentio-dynamic polarization test.
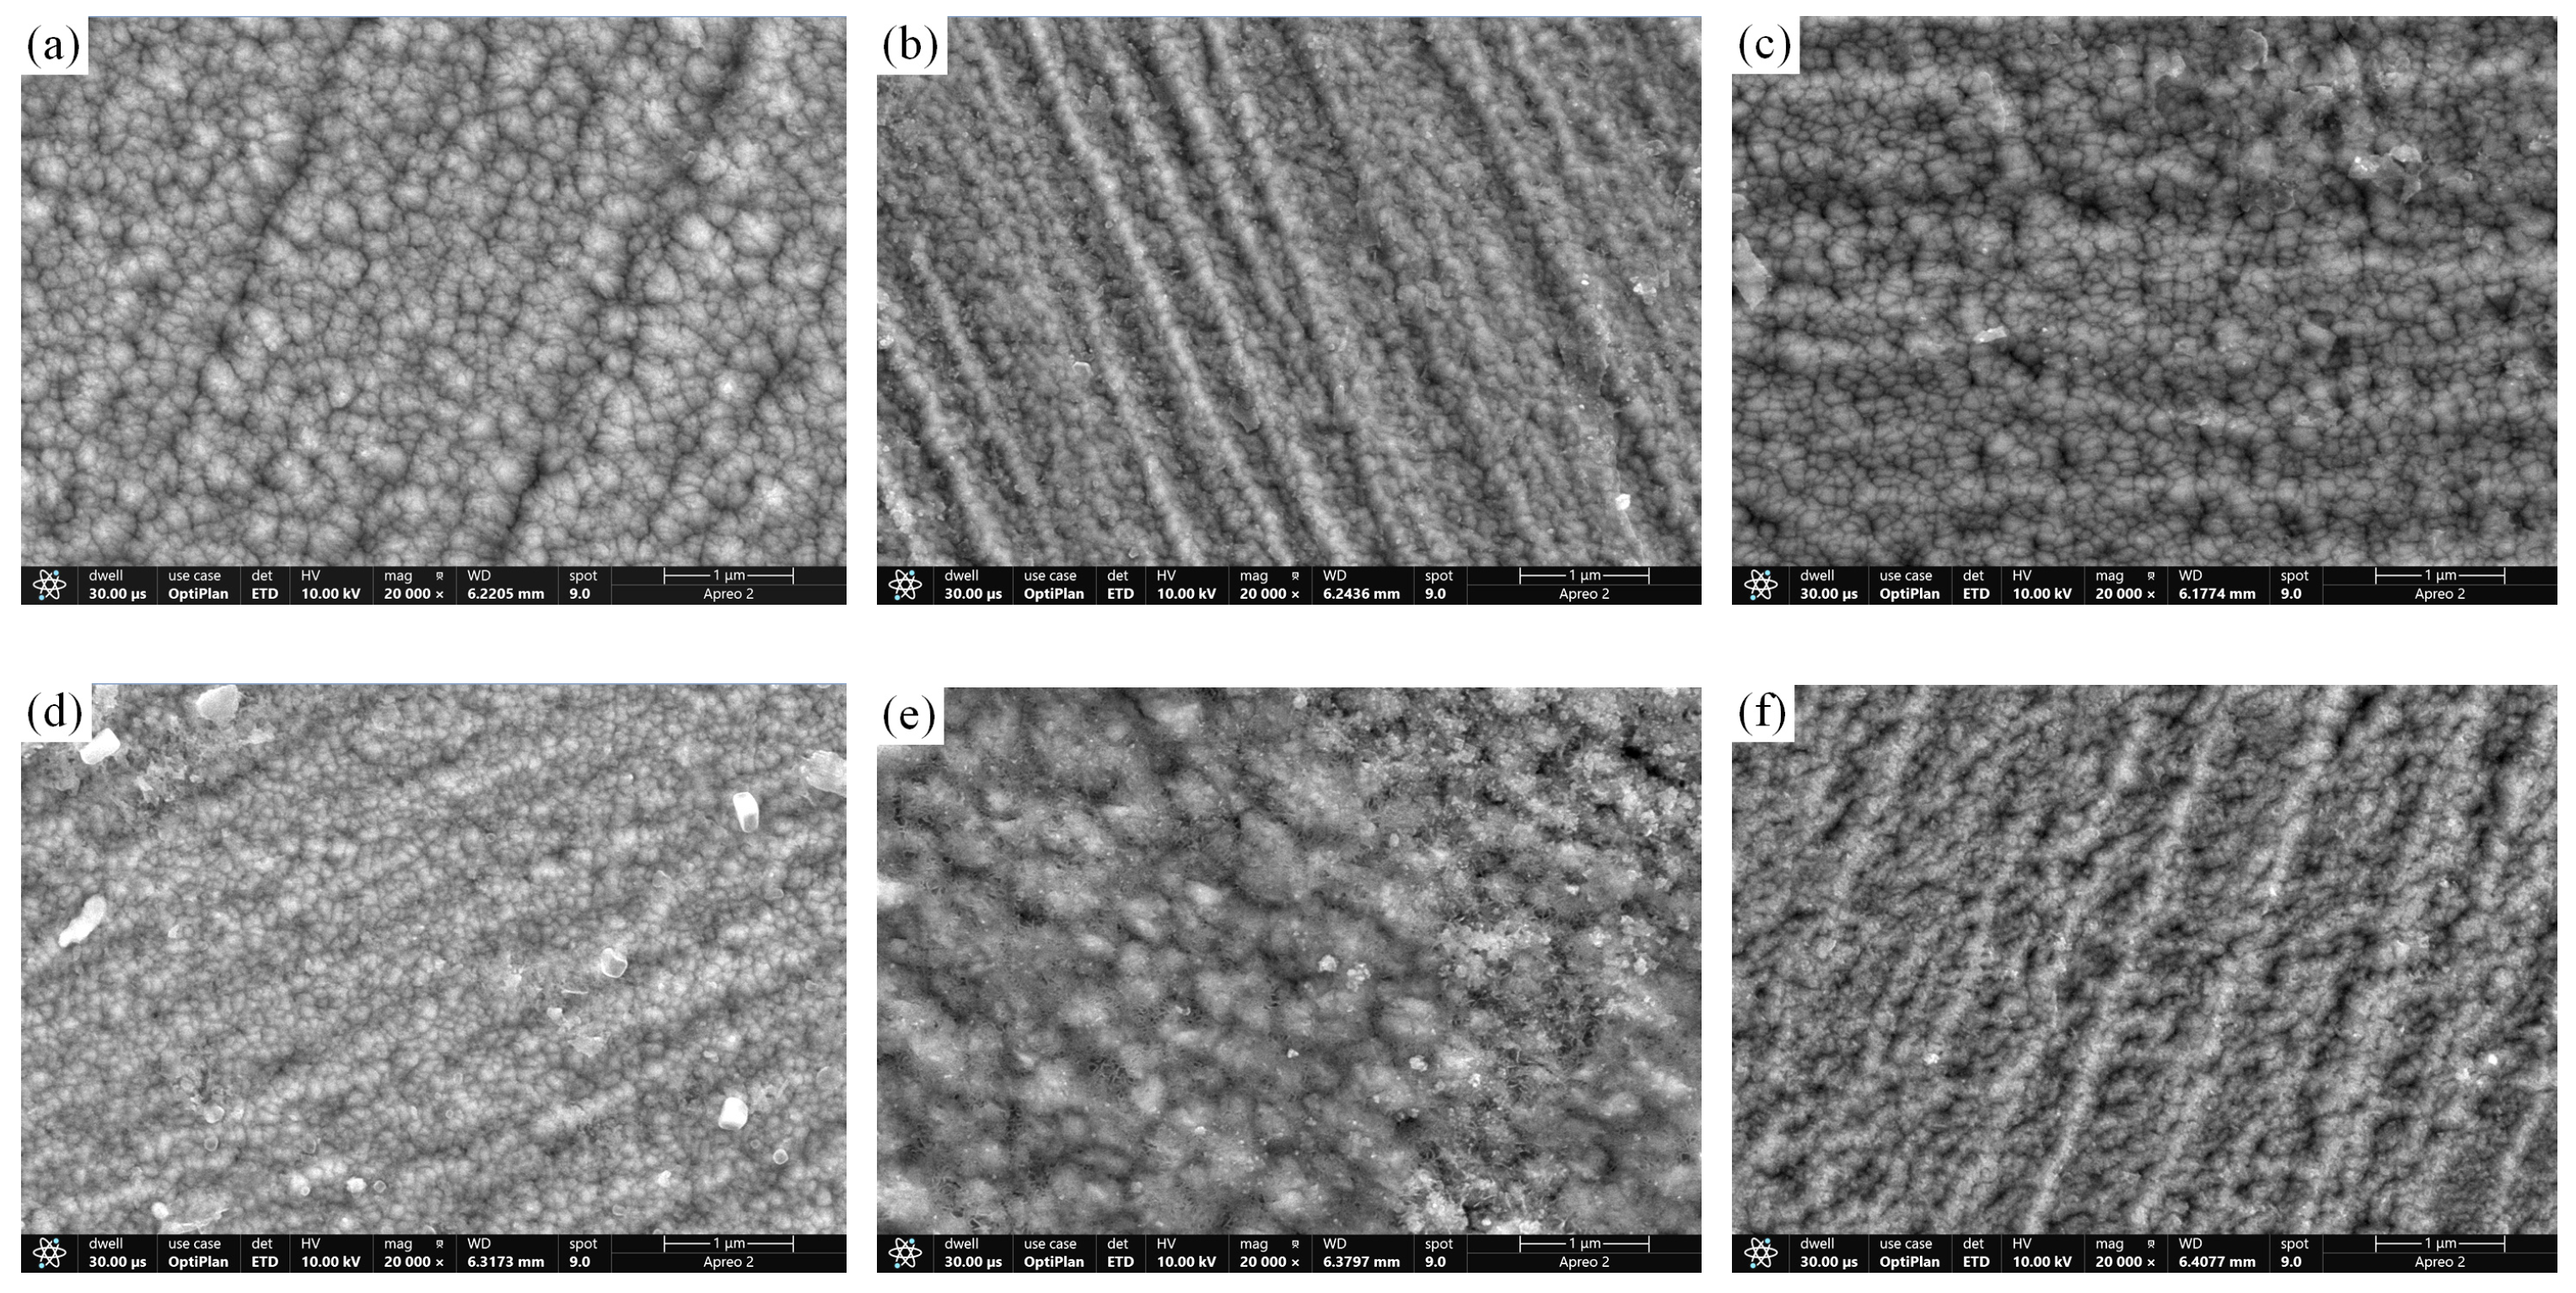
Figure 11.
The EDS results of two regions on the surface of CrNiBN-480 coatings after PP test.
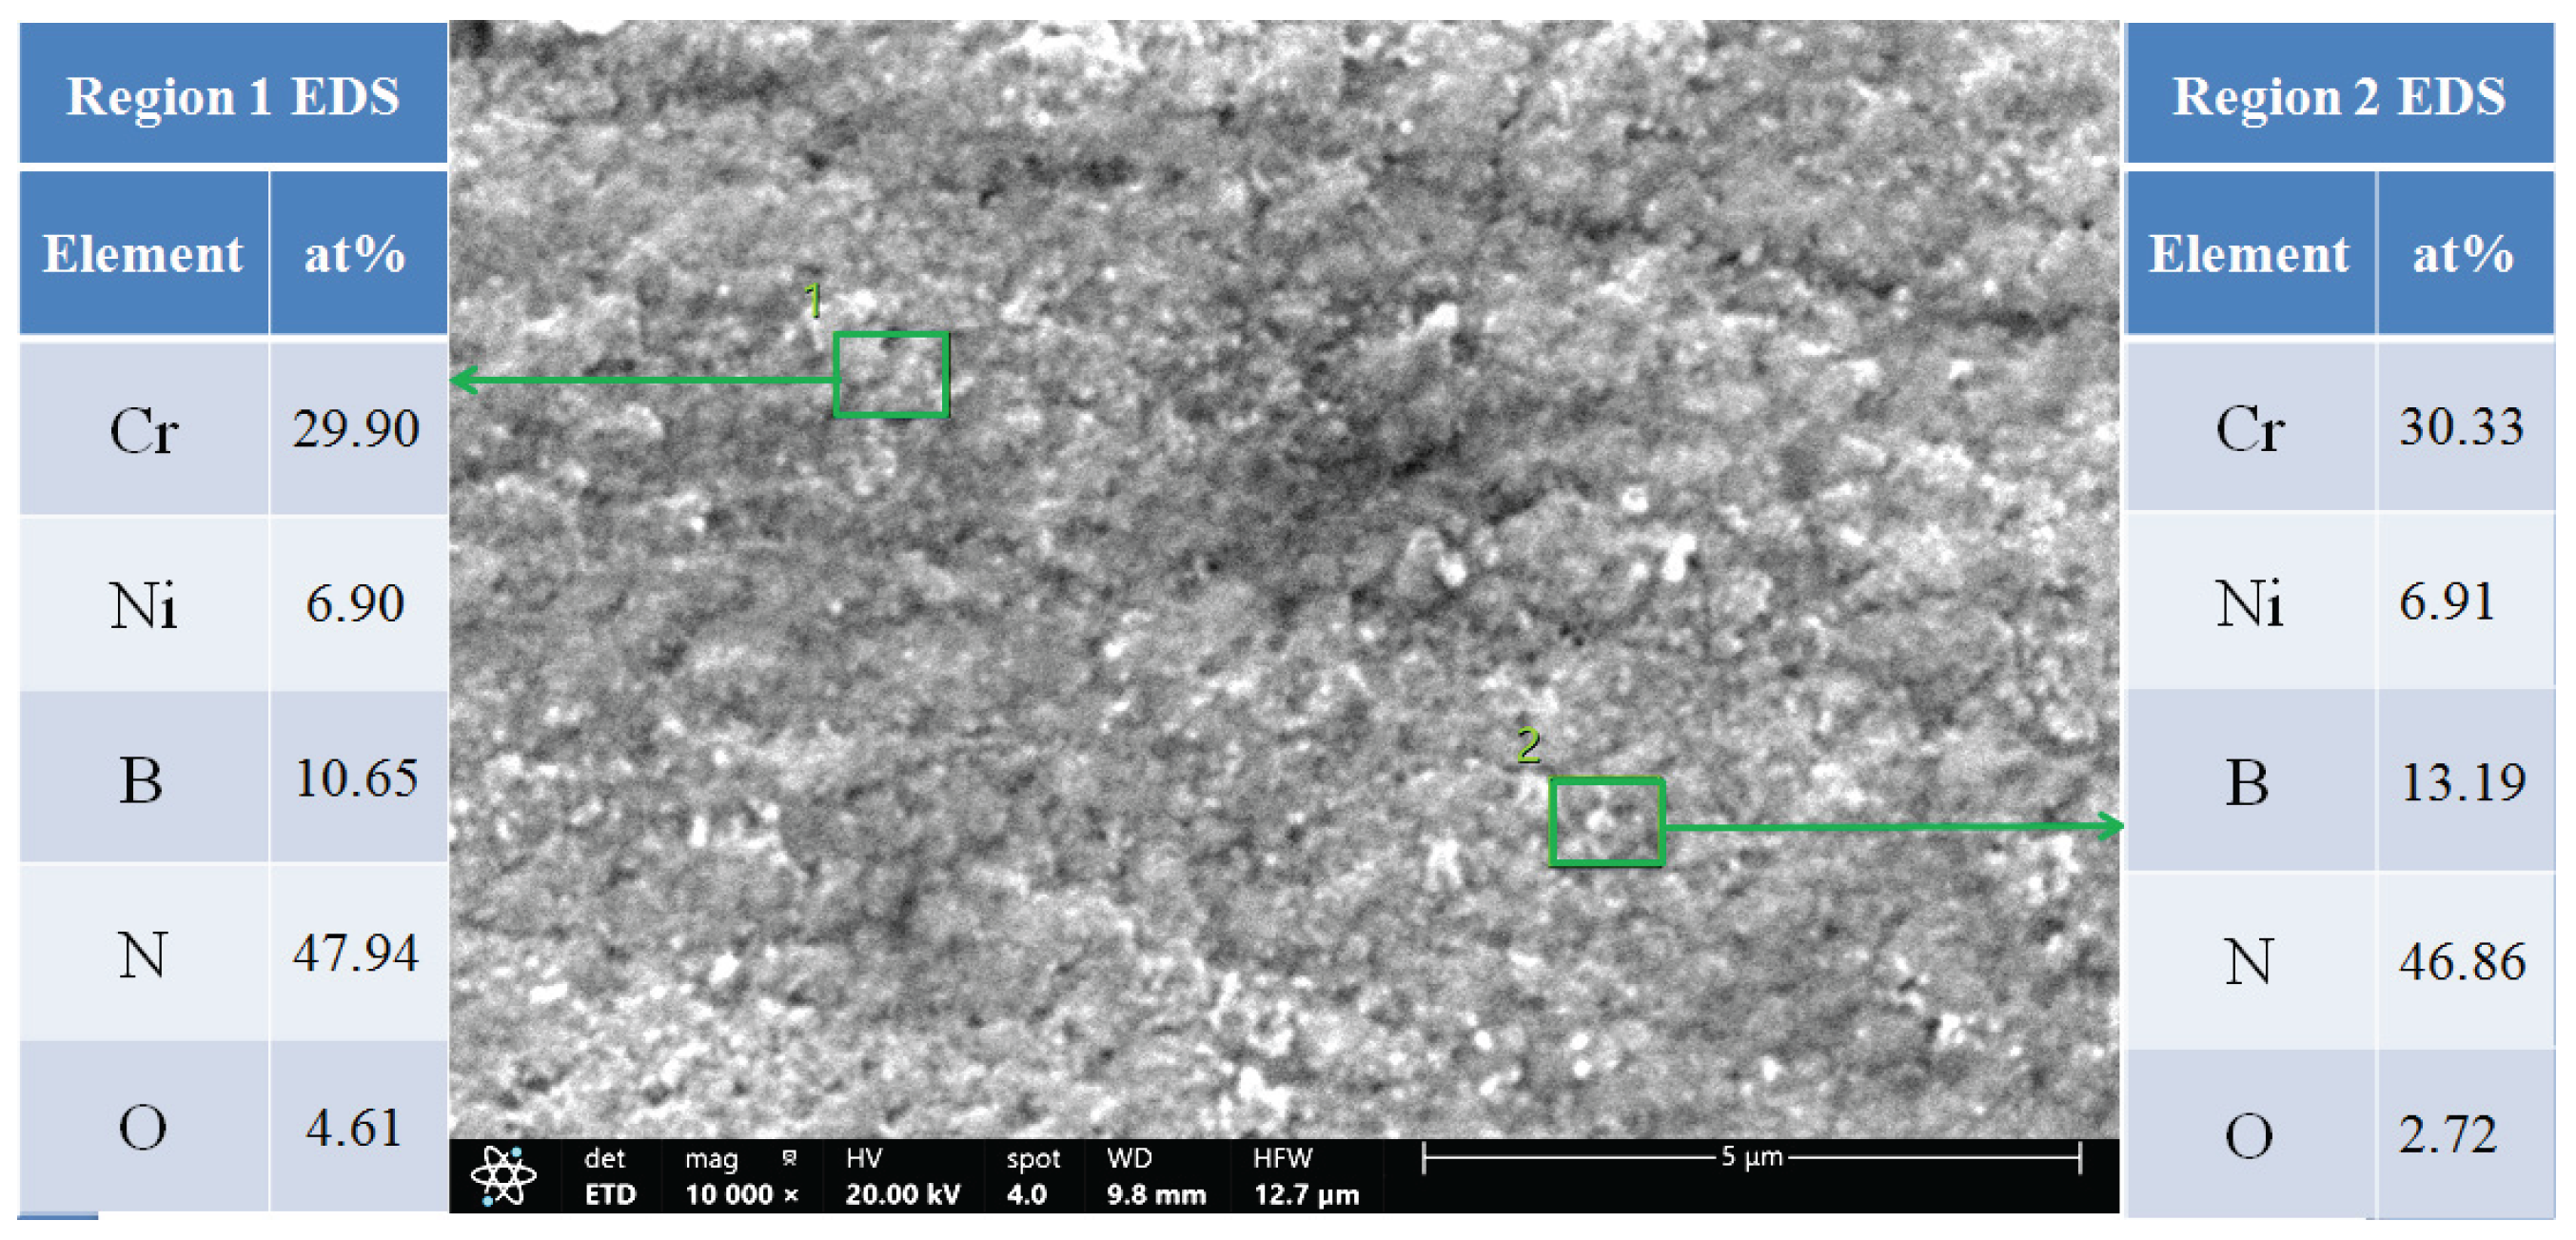

Table 1.
Characteristics of the equivalent circuit derived from the EIS spectra.
| Coatings |
Rs (Ω·cm2) |
(CPE-Y0)po (F/cm2) |
(CPE-n)po |
Rpo (Ω·cm2) |
(CPE-Y0)dl (F/cm2) |
(CPE-n)dl |
Rct (Ω·cm2) |
| CrBN | 29.75 | 8.691×10⁻⁶ | 0.8252 | 3.620×10² | 1.786×10⁻⁴ | 0.5544 | 1.568×10³ |
| CrNiBN-120 | 27.97 | 4.119×10⁻⁵ | 0.7213 | 2.844×10² | 4.647×10⁻⁴ | 0.7253 | 4.085×10³ |
| CrNiBN-240 | 29.79 | 1.074×10⁻⁵ | 0.7944 | 6.779×10² | 9.100×10⁻⁵ | 0.6128 | 1.965×10⁴ |
| CrNiBN-360 | 26.90 | 5.624×10⁻⁵ | 0.6564 | 2.064×10² | 1.292×10⁻⁴ | 0.7641 | 7.012×10³ |
| CrNiBN-480 | 27.62 | 8.501×10⁻⁵ | 0.6390 | 1.078×10² | 5.046×10⁻⁴ | 0.7396 | 5.009×10³ |
| CrNiBN-600 | 29.90 | 4.026×10⁻⁵ | 0.7127 | 1.390×10³ | 7.644×10⁻⁵ | 0.7149 | 3.262×10³ |
Table 2.
Results of potentio-dynamic polarization tests.
| Coatings | Ecorr(Evs.SCE) | Icorr(nA/cm2) | βa(V) | βc(V) | Rp(kΩ·cm2) |
| CrBN | -0.5627 | 12490 | 0.197 | 0.208 | 3.5 |
| CrNiBN-120 | -0.5047 | 2898 | 0.059 | 0.755 | 8.2 |
| CrNiBN-240 | -0.4379 | 410.5 | 0.101 | 0.237 | 74.9 |
| CrNiBN-360 | -0.4369 | 456.2 | 0.101 | 0.356 | 74.9 |
| CrNiBN-480 | -0.4760 | 1020 | 0.102 | 0.317 | 32.9 |
| CrNiBN-600 | -0.5411 | 1839 | 0.069 | 0.29 | 13.2 |
Disclaimer/Publisher’s Note: The statements, opinions and data contained in all publications are solely those of the individual author(s) and contributor(s) and not of MDPI and/or the editor(s). MDPI and/or the editor(s) disclaim responsibility for any injury to people or property resulting from any ideas, methods, instructions or products referred to in the content. |
© 2025 by the authors. Licensee MDPI, Basel, Switzerland. This article is an open access article distributed under the terms and conditions of the Creative Commons Attribution (CC BY) license (http://creativecommons.org/licenses/by/4.0/).
Copyright: This open access article is published under a Creative Commons CC BY 4.0 license, which permit the free download, distribution, and reuse, provided that the author and preprint are cited in any reuse.


