Submitted:
04 June 2025
Posted:
05 June 2025
You are already at the latest version
Abstract
Over the past decades, artificial intelligence, particularly Machine Learning and Deep Learning, has become increasingly important in remote sensing and satellite imaging. Machine Learning uses statistical data learning to create models for tasks like image classification and anomaly detection. Deep Learning, a subset of Machine Learning, employs deep neural networks to learn complex representations from unstructured data, supporting advanced tasks such as image segmentation and object recognition. This study aims to use various Deep Learning models to segment satellite images and detect different land use patterns in the Cergy-Pontoise agglomeration, utilizing a large number of samples representing diverse land use classes. The study specifically highlights the performance of the RESNET50 model, a well-known deep convolutional neural network architecture renowned for its depth and ability to capture intricate patterns in visual data. Trained using the fast.ai library (a popular deep learning framework) on high-resolution Sentinel satellite images, RESNET50 has shown exceptional capability in segmenting and identifying different land use patterns in the Cergy-Pontoise area. The results demonstrate that RESNET50 is particularly well-suited for this task, achieving high accuracy in distinguishing between complex and subtle differences in land use, thereby providing valuable insights into the urban planning and environmental management of the region.
Keywords:
segmentation
; convolutional neural networks (CNN)
; sentinel-2
; Pléiades
; U-net
; Keras
; Fast AI
; confusion matrix
1. Introduction
Urbanization and changes in land use patterns have significant implications for urban policies and local governments. This complex process is influenced by various factors, including economic, social, and environmental elements. Often, urbanization leads to social and economic inequalities, negatively impacting the overall well-being of city dwellers [1]. The integration of AI in remote sensing provides valuable insights to address these urban challenges, offering data-driven solutions for better policy-making and urban management. Understanding these changes is crucial for effective urban planning, sustainable development, and environmental management. In recent years, Deep Learning methods have shown promise in analyzing complex spatial data, image classification and land use patterns [2].
In the context of the Cergy-Pontoise agglomeration area, policymakers recognize the importance of sustainable urban development and have developed various policies to address urbanization challenges. The Grand Paris project, for example, seeks to promote sustainable urban development and reduce social and economic inequalities by improving access to transportation, housing, and public services [3]. Similarly, the Local Urban Plan (PLU) is a land-use planning document detailing policies and regulations for the agglomeration [4]. However, the effectiveness of these policies depends on the availability of accurate and up-to-date information on land use changes [5].
To understand these changes in the Cergy-Pontoise agglomeration, We carried out various investigations and tried many studies with various methods, including remote sensing, Geographic Information Systems (GIS), and statistical modeling [6]. However, these methods have limitations in analyzing complex spatial data, particularly high-resolution satellite images. Deep Learning methods, such as Convolutional Neural Networks (CNN), have proven effective in analyzing large sets of complex spatial data [2].
This paper aims to provide a step-by-step explanation of how this Deep Learning methods are applied to classify Sentinel-2 and Pleiade satellite images in our study area. The objectifs includes :
- Developing and training Deep Learning models for high-resolution image classification.
- Mapping land use patterns in the study area using satellite images (Sentinel-2 and Pléiade).
- Evaluating different Deep Learning methods to detect changes in land use patterns.
This document contains an introduction that provides an overview of the tools used and the specific use case of the study, details on the data used, including Pléiades and Sentinel imagery, as well as the dataset for training and validation and the segmentation process. It also includes a description of the deep learning models used and their performance evaluation, an analysis and discussion of the results obtained, and a conclusion. Finally, the document lists the references cited.
Literature Review :
The increasing use of remote sensing imagery has led to a growing interest in developing accurate and efficient classification methods for land use and land cover (LULC) analysis. Recent studies have shown the effectiveness of Deep Learning (DL) and Transfer Learning (TL) techniques for LULC classification using remote sensing data. Xu et al. [7] used a self-organizing network to classify Landsat Satellite images with high accuracy. Chen et al. [8] combined DL, logistic regression, and Principal Component Analysis (PCA) to classify hyperspectral data.
Moreover, Piramanayagam et al. [9] and Liu et al. [10] demonstrated the potential of Convolutional Neural Networks (CNNs) for LULC classification, where they actively selected training samples at each iteration for better performance. Data augmentation techniques were also employed to deal with the scarcity of labelled data [11]. Additionally, Yang et al. [12] improved the generalization capability and performance by combining deep CNN and multi-scale feature fusion against the limited data.
Fine-tuning strategies were proposed by Liang et al. [13] and Pires de Lima and Marfurt [14] for aerial image classification. Kwon et al. [15] proposed a robust classification score method for detecting adversarial examples in deep neural networks. Bahri et al. [16] experimented with a TL technique that outperformed all the existing baseline models using Neural Architecture Search Network Mobile (NASNet Mobile) as a feature descriptor and introduced a loss function that contributed to the performance.
Transfer learning has also been extensively explored in LULC classification. This involves using a pre-trained deep learning model, such as VGG, ResNet or EfficientNet, and fine-tuning it on EuroSAT dataset reaxhing an accuracy of 98.57 [17]. This approach has been shown to be effective in situations where the target dataset is small, and can help overcome the limitations of insufficient labeled data [18].
Hameed et al. [19] showed that using transfer learning with the EfficientNet-B3 model improved the accuracy of LULC classification on the EuroSAT dataset. Furthermore, they demonstrated that fine-tuning only the last few layers of the pre-trained model was sufficient to achieve good performance. In summary, deep learning methods have shown great promise in LULC classification tasks, and various techniques such as CNNs, GANs, and transfer learning have been explored to improve performance.
However, there are still challenges to be addressed, such as the lack of labeled data and the need for better generalization to unseen data.
2. Materials and Methods
2.1. The Used Data (Characteristics of Pléiades and Sentinel) and the Dataset (Training and Validation) (Segmentation Process)
2.1.1. The Used Data
Satelitte Images Sentinel-2
Sentinel-2 satellite images feature 13 spectral bands (see Table 1), covering visible, near-infrared (VNIR), and shortwave infrared (SWIR) regions, with spatial resolutions of 10 meters for visible and near-infrared bands, 20 meters for red edge and shortwave infrared bands, and 60 meters for atmospheric correction bands. The satellite revisits the same location every 5 days with both Sentinel-2A and Sentinel-2B, and has a swath width of 290 kilometers [20]. These images are widely used for applications in land cover classification, agricultural monitoring, forestry, environmental monitoring, and disaster management.
Satelitte Images Pléiade
The decision to use Pléiades images for this study is based on several important considerations. First, the high spatial resolution of these images, reaching up to 70 cm in panchromatic mode and 2.8 m in multispectral mode, provides detailed visualization and significant accuracy for identifying land features. This variety of spectral bands (see Table 2) is essential for classifying rapidly changing and overlapping land environments in the 13 communes of the Cergy-Pontoise agglomeration.
Pléiades data is resampled by Airbus DS with a resolution of 50 cm in panchromatic mode and 2 m in multispectral mode to ensure robustness for subsequent computer processing, adapting to software processing capabilities, and guaranteeing the precision and reliability of results obtained in environmental and geospatial analyses.
Local authorities, research laboratories, and universities have privileged access to Pléiades imagery, facilitated by the satellite owner’s intent to promote access to its data. This type of data is compatible with multiple applications such as mapping, environmental monitoring, and urban planning.
In conclusion, the choice of Pléiades images is based on their high spatial resolution, robustness in computer processing, accessibility to a wide range of users, and their potential to meet various needs in environmental monitoring and analysis.
The transition from low resolution to higher resolution is generally less problematic than the opposite. When classifying a high-resolution satellite image using training data from a lower resolution, it is more likely that the necessary information for classification will be preserved.
2.1.2. Dataset
The EuroSAT dataset was created to address the lack of labeled ground truth data for supervised machine learning with Sentinel-2 satellite images. It consists of 27 000 images. Figure 1 and Figure 2 demonstrates some sample images from the EuroSAT dataset, from 10 different land use and land cover classes, with 2 000 to 3 000 images per class (Figure 5 shows the class distribution). The patches measure 64x64 pixels and were chosen based on their visibility at a resolution of 10 meters per pixel and their coverage by the European Urban Atlas. The dataset includes classes for annual crop, permanent crop, pastures, highway, residential buildings, industrial buildings, rivers, lakes, sea, forest, and herbaceous vegetation. The ground truth data was manually checked and corrected, and the dataset has not received atmospheric correction. EuroSAT uses an open and free Earth observation program, a 10 times lower spatial resolution. The ground truth was manually checked multiple times, and mislabeled images as well as images full of snow or ice were sorted out, examples shown in Figure 3. Extreme cases were not filtered to advocate for the classifier to also learn these cases examples shown in Figure 4.
The RGB version of the EuroSAT dataset is used for training in this study. The labelled EuroSAT dataset is made publicly available [19]. The dataset is split into 75/25 ratios for training (20250 images) and validation (6750 images), respectively.
3. Deep Learning Model and Model Performance Analysis
3.1. The Used Deep Learning Models
3.1.1. Model 1 : Support Vector Machines (SVMs)
Are a type of supervised machine learning algorithm that is commonly used for classification and regression analysis, although machine learning algorithms are not recommended in the literature it was used just for testing purposes. In the context of land use pattern analysis, SVMs can be used for image classification and land use mapping.
The SVM algorithm works by creating a hyperplane that separates different classes in a feature space, where each data point corresponds to an image patch. The hyperplane is selected so that it maximizes the margin, which is the distance between the hyperplane and the closest data points of each class. This is done in a way that minimizes the classification error on a training dataset.
The SVM algorithm is suitable for high-dimensional feature spaces, making it a popular choice for image classification tasks. In order to use SVMs for image classification, a feature extractor is needed to extract a set of features from each image patch. Popular feature extractors include Histogram of Oriented Gradients (HOG) and Local Binary Patterns (LBP).
SVMs can be trained using either a linear kernel or a non-linear kernel, such as a polynomial or radial basis function (RBF) kernel. The choice of kernel depends on the complexity of the classification problem and the nature of the data. A linear kernel is suitable for linearly separable data, while a non-linear kernel can handle more complex data.
The images were converted to grayscale and Histogram of Oriented Gradients (HOG) features were extracted from them. The HOG features are commonly used for object detection and image classification tasks. Then, the extracted features were normalized and split into training and testing sets.
Next, the SVM model was trained using a linear and polynomial kernel. Finally, the accuracy of the model was evaluated using the testing set. Accuracy is a commonly used evaluation metric in computer vision because it provides a simple and intuitive measure of how well a model is performing on a given task. In computer vision, the goal is often to classify or recognize objects within images, and accuracy measures the proportion of correctly classified objects out of the total number of objects. Moreover, accuracy is easy to understand and interpret, which makes it a popular choice for reporting and comparing results across different models and datasets. It is also useful in scenarios where misclassification errors have similar costs, such as in some medical diagnosis tasks.
3.1.2. Model 2 Convolutional Neural Networks (CNNs)
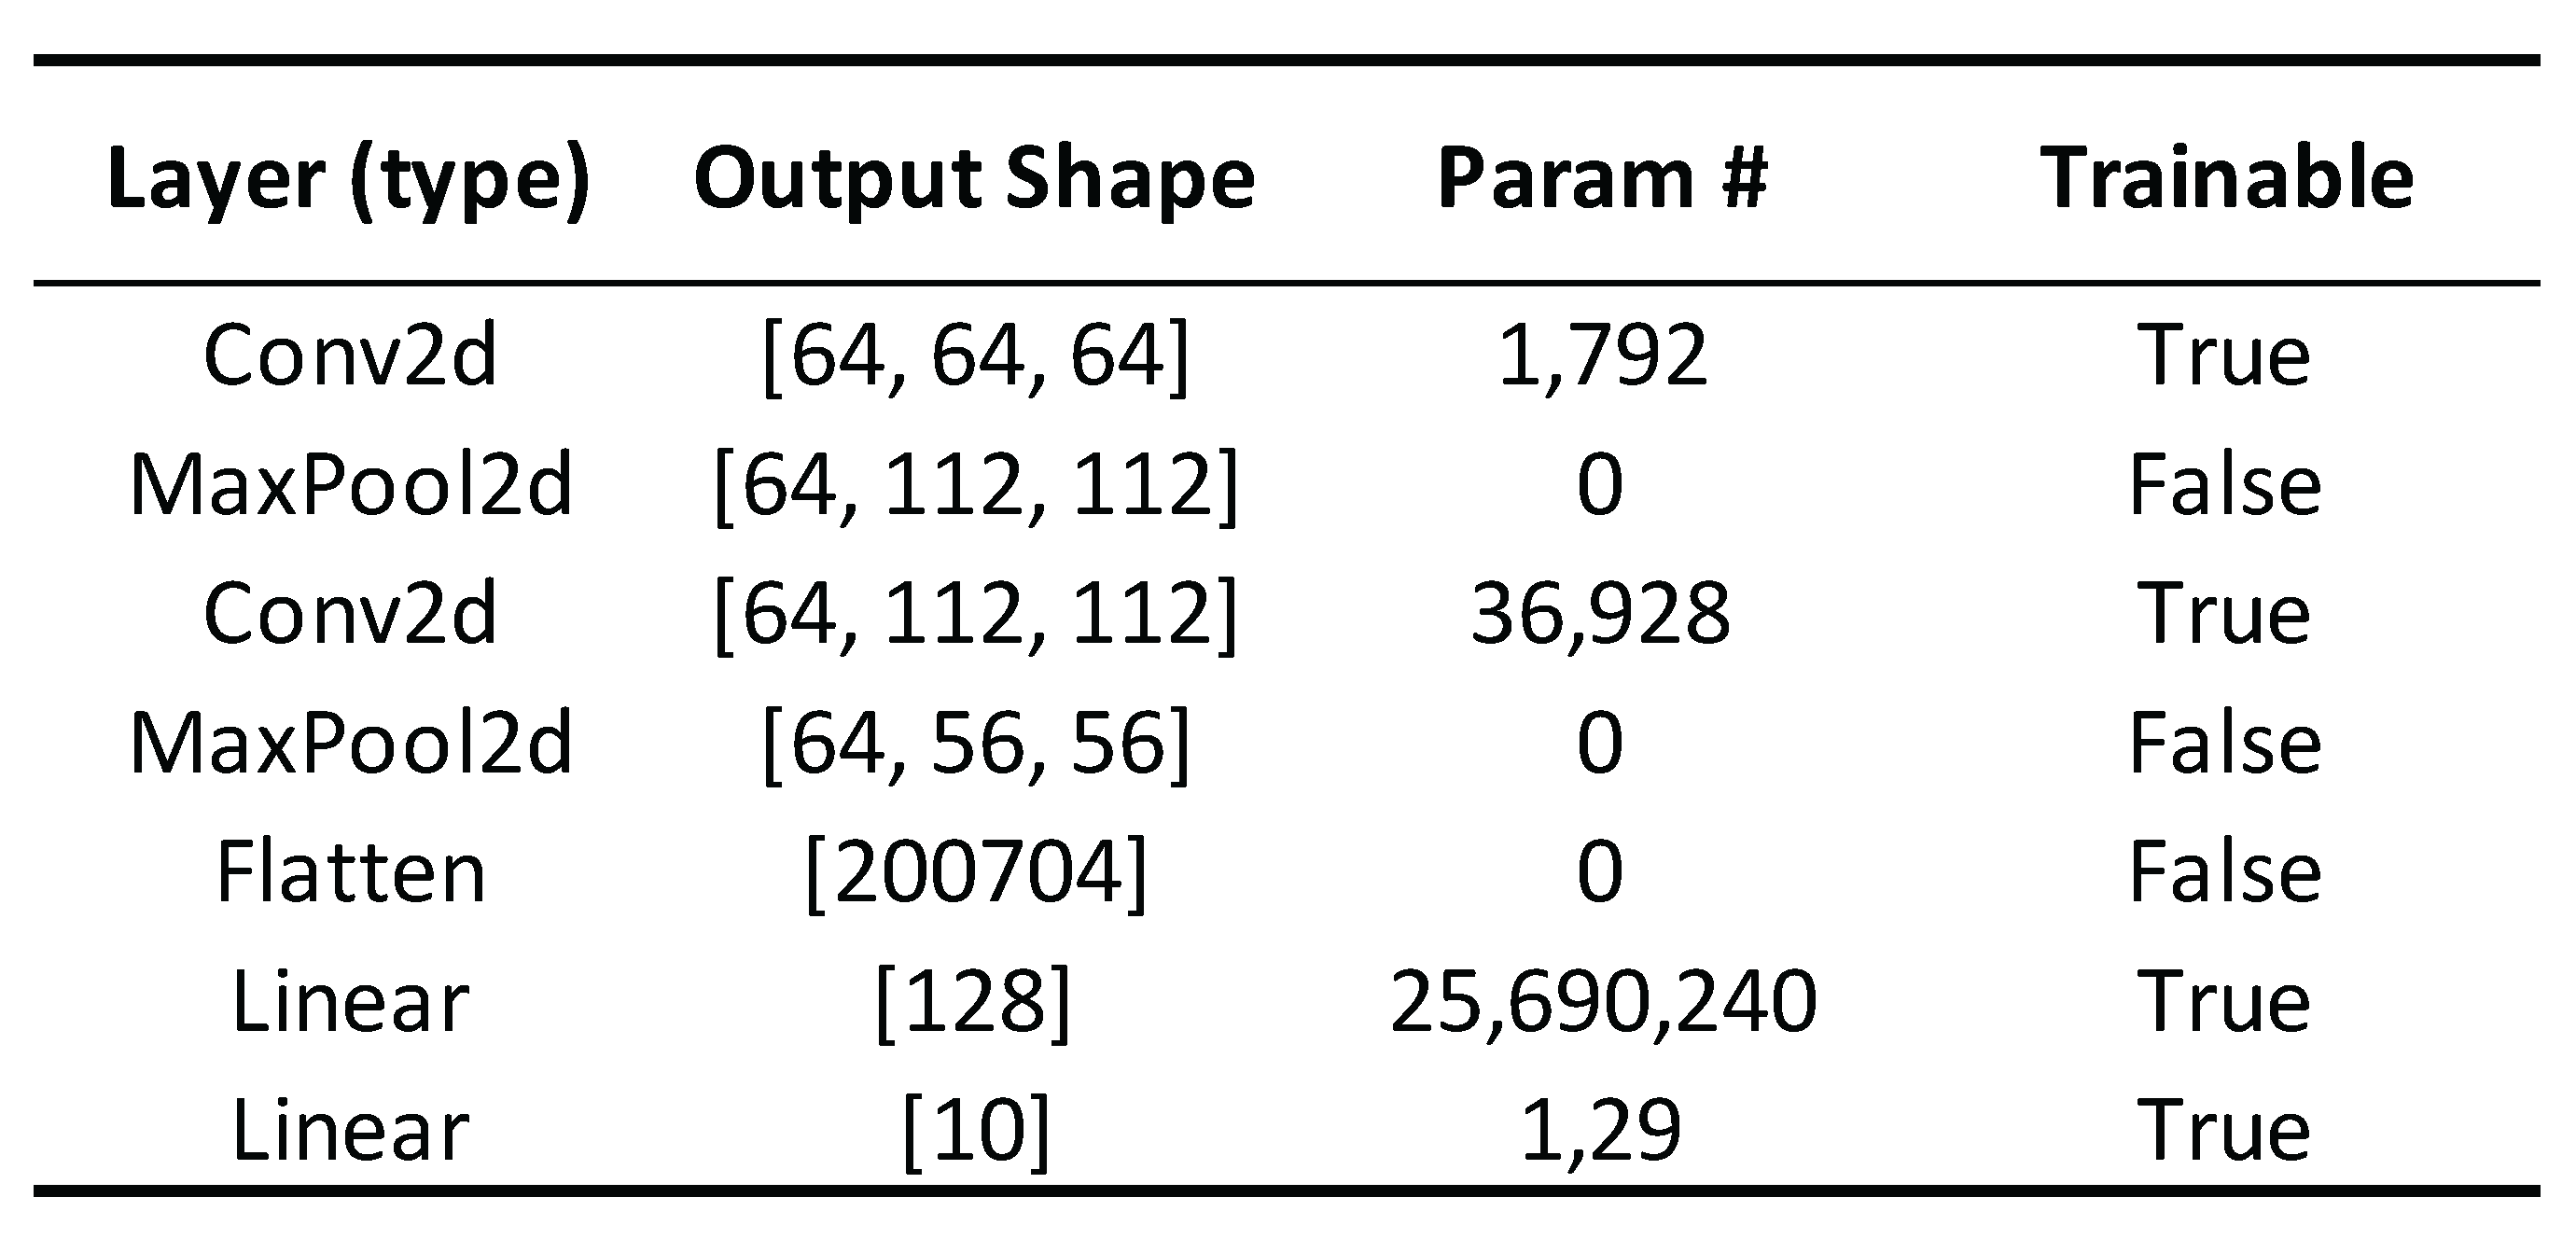
Are a type of deep learning model used for image classification tasks. CNNs are particularly suited for image classification due to their ability to automatically extract relevant features from images through convolutional layers. Unlike traditional neural networks, which are fully connected and do not consider the spatial structure of an image, CNNs apply filters or kernels to specific regions of the input image to extract features and learn representations. The use of pooling layers allows the model to reduce the spatial size of the input image while retaining important features. The model built consists of two convolutional layers, each with 64 filters and a kernel size of 3x3, followed by a max pooling layer with a pool size of 2x2 to reduce the spatial dimensions. The output of the convolutional layers was then flattened and passed to two fully connected layers, one with 128 neurons and the other with 10 neurons for the output classification. The ReLU activation function was used in all hidden layers, and softmax activation was used in the output layer to generate class probabilities. Model architecture shown in Figure 7.
The model was trained the 64x64x3 images and was compiled using the Adam optimizer and the sparse categorical cross-entropy loss function, which is appropriate for multi-class classification problems. During training, the model was fed with the training for 5 epochs, with a validation split of 0.1. The accuracy and loss metrics were used to evaluate the performance of the model during training.
The same model was also created and trained using the fit_one_cycle method from fast.ai library. The fit_one_cycle method uses a variant of the stochastic gradient descent (SGD) optimization algorithm called the one-cycle learning rate policy, which was introduced by Leslie Smith in a 2018 paper. This technique involves gradually increasing the learning rate during the first half of training and then gradually decreasing it during the second half (As shown in Figure 6), which has been shown to improve the speed and accuracy of trainings.
Learn.fit_one_cycle is a method that implements a cyclical learning rate policy during training. It gradually increases and decreases the learning rate over one cycle, which typically consists of several epochs of training, with the learning rate ranging from a low value to a high value and back to a low value again. This method helps to improve the performance of the model by allowing it to explore a wider range of learning rates during training, which can lead to better convergence and reduced overfitting.
The optimizer used in this model is Adam, Weight decay was used, a regularization technique that is used to prevent overfitting in deep learning models. It works by adding a penalty term to the loss function that encourages the weights of the network to be smaller. In this model, the optimizer is using “true weight decay”, which means that the regularization term is applied directly to the weight updates during optimization. And finally the loss function used in this model is FlattenedLoss.
Figure 6.
Learning Rate per iteration.
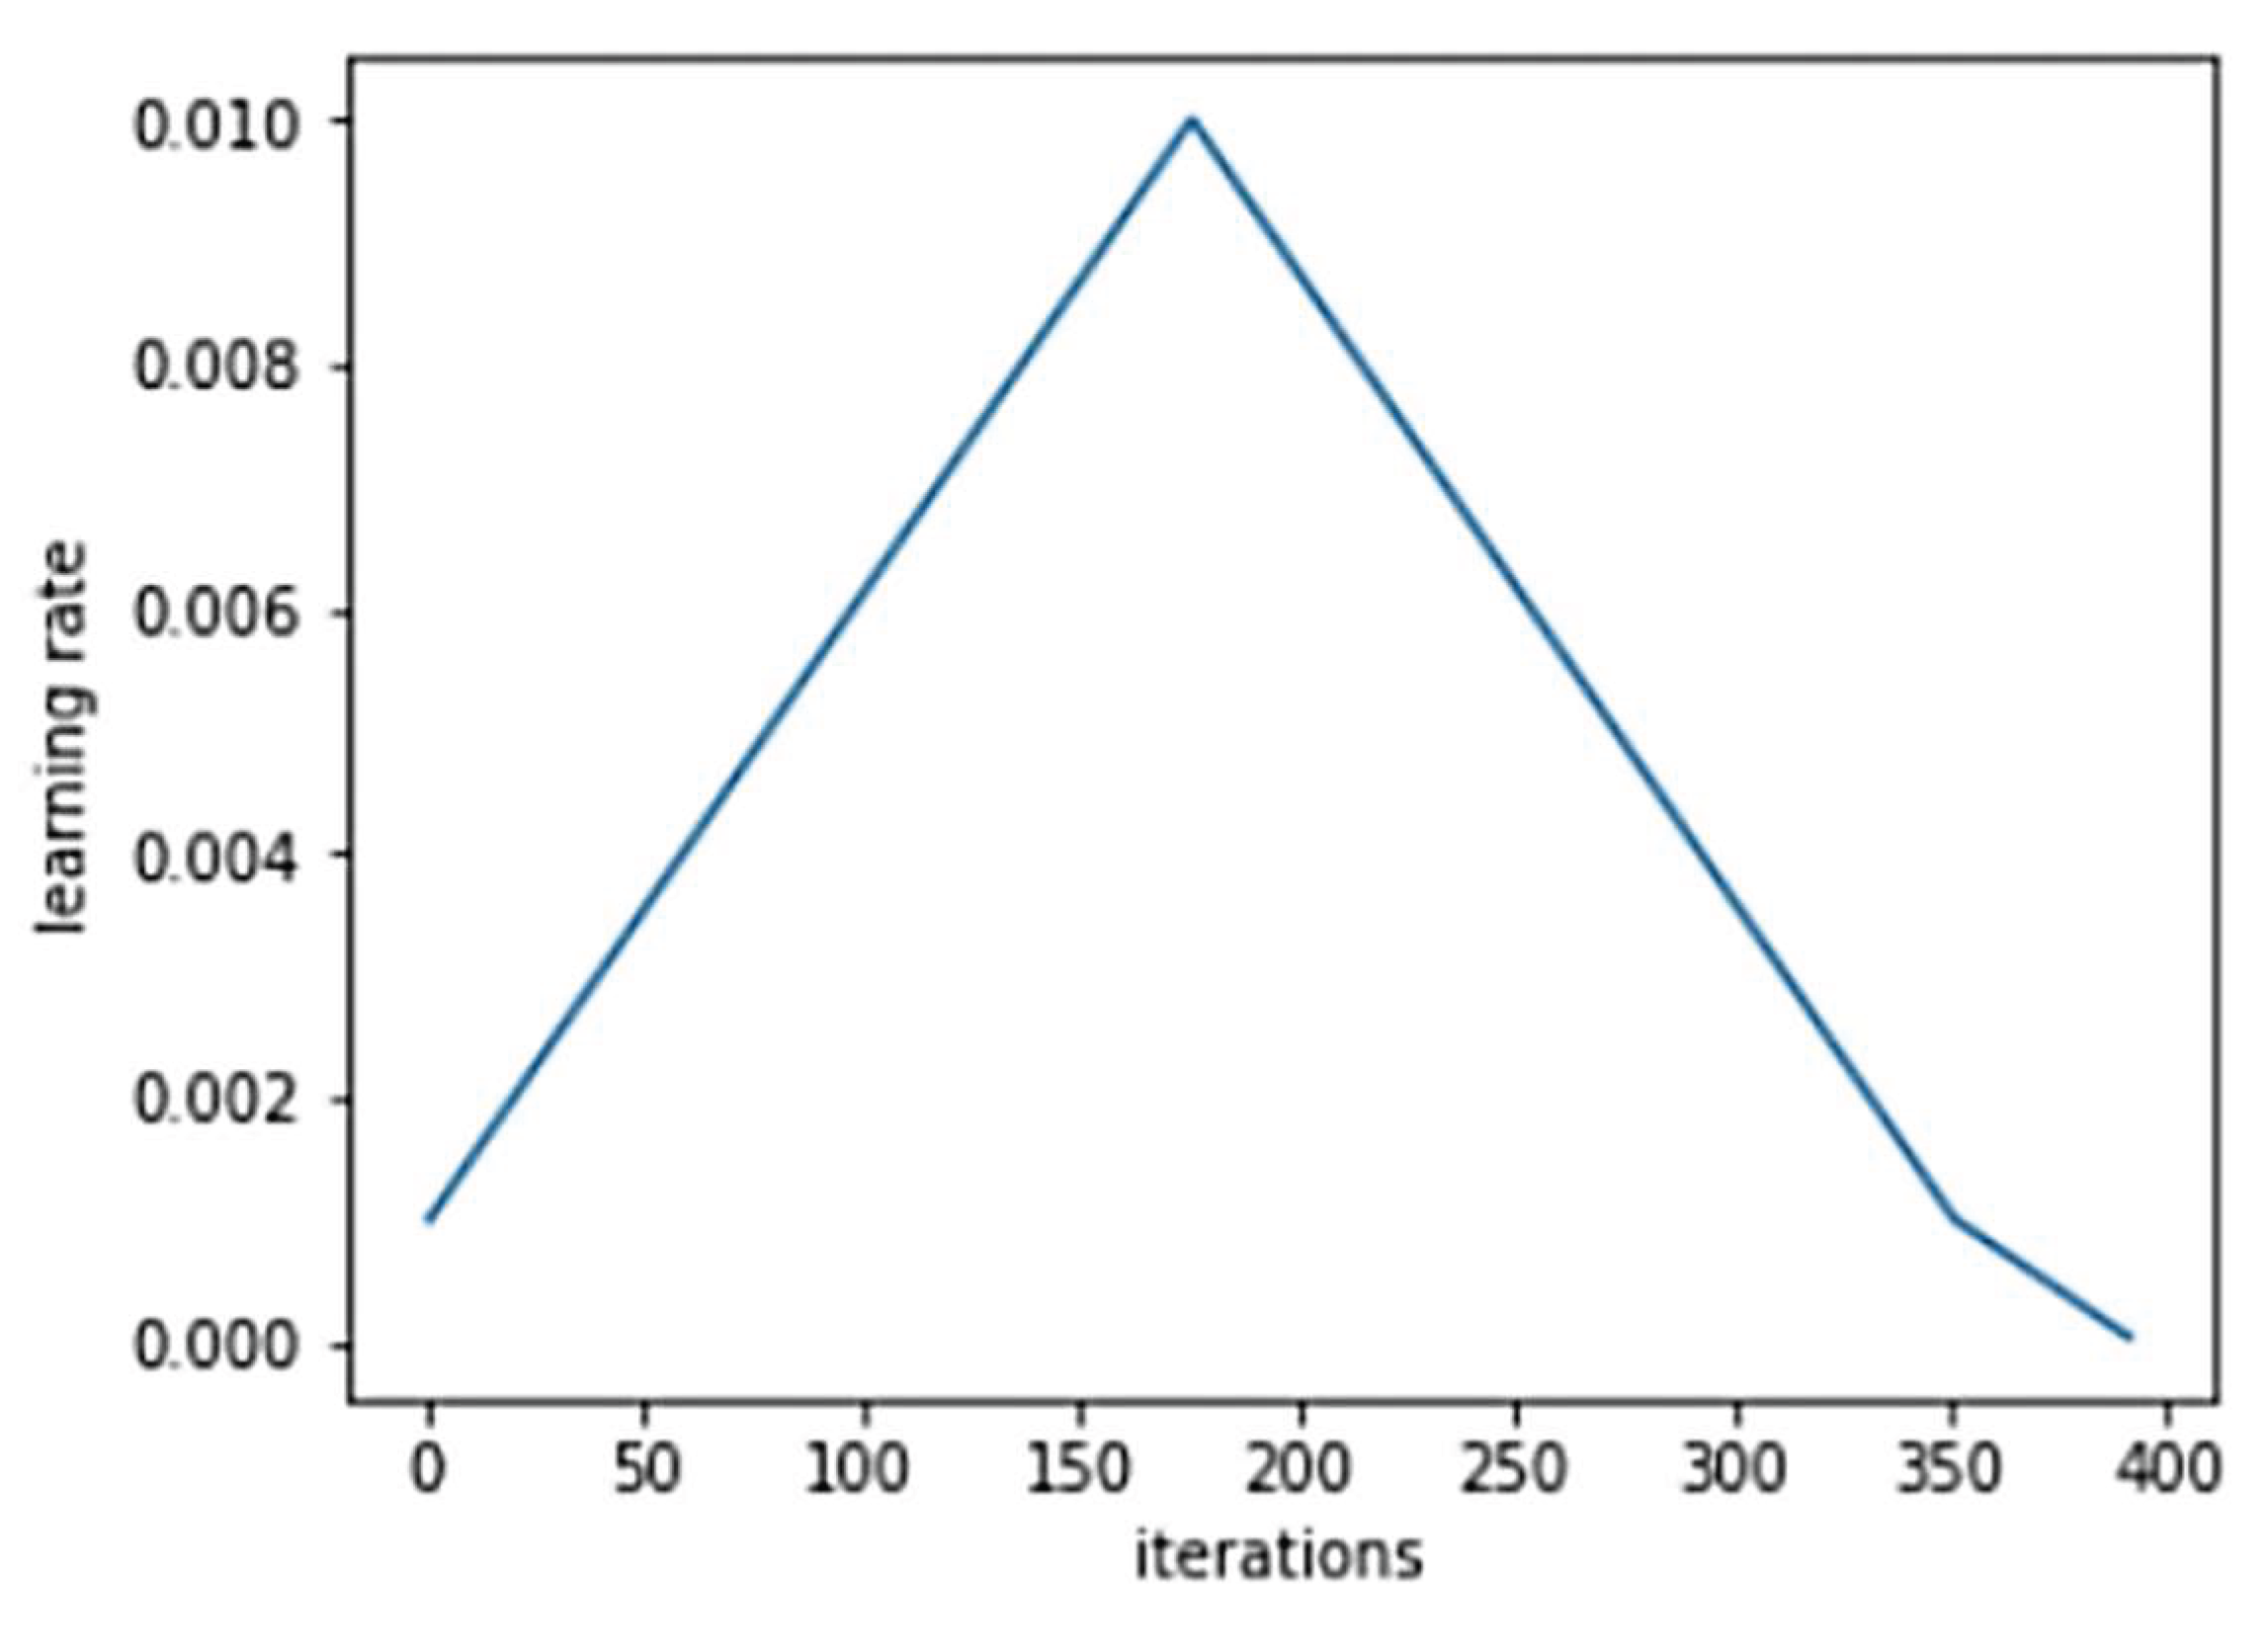
Figure 7.
Model architecture.
3.1.3. Model 3 ResNet50
Is a deep convolutional neural network architecture that was introduced in 2015 by Kaiming He et al. The network is composed of 50 layers and is known for its skip connections that allow for deeper architectures to be trained more effectively. The skip connections allow the gradient to flow more easily throughout the network, reducing the vanishing gradient problem that often occurs in deep networks. The ResNet50 model was pre-trained on the ImageNet dataset and fine-tuned on our dataset. We used the transfer learning approach to train the model, which involved using the pre-trained ResNet50 modelas a feature extractor and then training a new classifier on top of the extracted features.
The CNN is trained on a dataset of images with size 64x64 and 3 color channels. It adds new layers to the ResNet50 model and trains only those layers. The model is compiled with Adam optimizer, sparse_categorical_crossentropy loss function, and loss and accuracy evaluation metrics for 5 epochs. Another RESNET50 model was trained using fit_one_cycle method from fast.ai library and also by resizing the image into 224x224 which is the size that the RESNET50 model was trained on.
Data Generator
In deep learning, training a model often involves feeding it with a large amount of data to learn from. However, loading all of this data into memory at once can be impractical or even impossible due to memory constraints. One solution to this problem is to load the data in batches during the training process using a data generator. A data generator is a Python generator that yields batches of data to the model during training. It typically takes a dataset (such as a set of images or text data) and divides it into small, manageable 11 chunks that can be loaded into memory and fed to the model one batch at a time. This helps to reduce the memory requirements of the model and enables it to process large datasets efficiently.
In our case to train the RESNET50 and CNN in fast.ai library, the ImageDataBunch data generator was used to load the images data and labels from two folders (specified by the train and valid arguments) in batches of size bs (specified by the bs argument). It applies preprocessing operations such as resizing and normalization to the images as specified. During training, the data generator yields one batch of image data and labels at a time to the model, which then updates its weights based on the loss calculated for that batch.
In addition to reducing memory usage, data generators also help to prevent overfitting by introducing some randomness into the training process. Each time a batch of data is yielded by the generator, it is typically shuffled to ensure that the model does not learn to recognize patterns that are unique to a particular set of images or other data points.
3.2. Model Application to Our Study Area
To use the model on the Cergy-Pontoise agglomération area, a Sentinel satellite image was downloaded and divided into small patches of 64x64 pixels, then each patch was transformed and distribute across the model to classify and color it. The patches are then reassembled into a single 1km x 1km tile. (Schema Figure 8).
Application Results
The SVM model with a linear kernel achieved an accuracy of 0.50 (Figure 9 and Figure 10), while the SVM model with a polynomial kernel achieved a slightly higher accuracy of 0.54. These results suggest that the SVM model with a polynomial kernel may be a better choice for this particular task. The CNN achieved a higher accuracy, with an accuracy of 0.80. This indicates that the CNN was able to capture complex features and patterns in the images better than the other models. The results of the CNN model suggest that Deep Learning techniques can be effective in identifying changes in land use patterns.
The confusion matrix shown below (Figure 11) offers a comprehensive view of the classification model’s performance by displaying the accuracy for each class. These metrics are valuable for assessing the model’s strengths and weaknesses across various scenarios.
The results achieved by the RESNET50 model, trained using the fast.ai library on Sentinel images, demonstrate that this model is particularly well-suited for the task. With an impressive accuracy rate of 97.9% (Figure 12 and Figure 13), RESNET50 outperforms other models, making it the optimal choice for this specific image classification challenge. This high level of accuracy underscores the model’s ability to effectively capture and interpret the features within the Sentinel dataset.
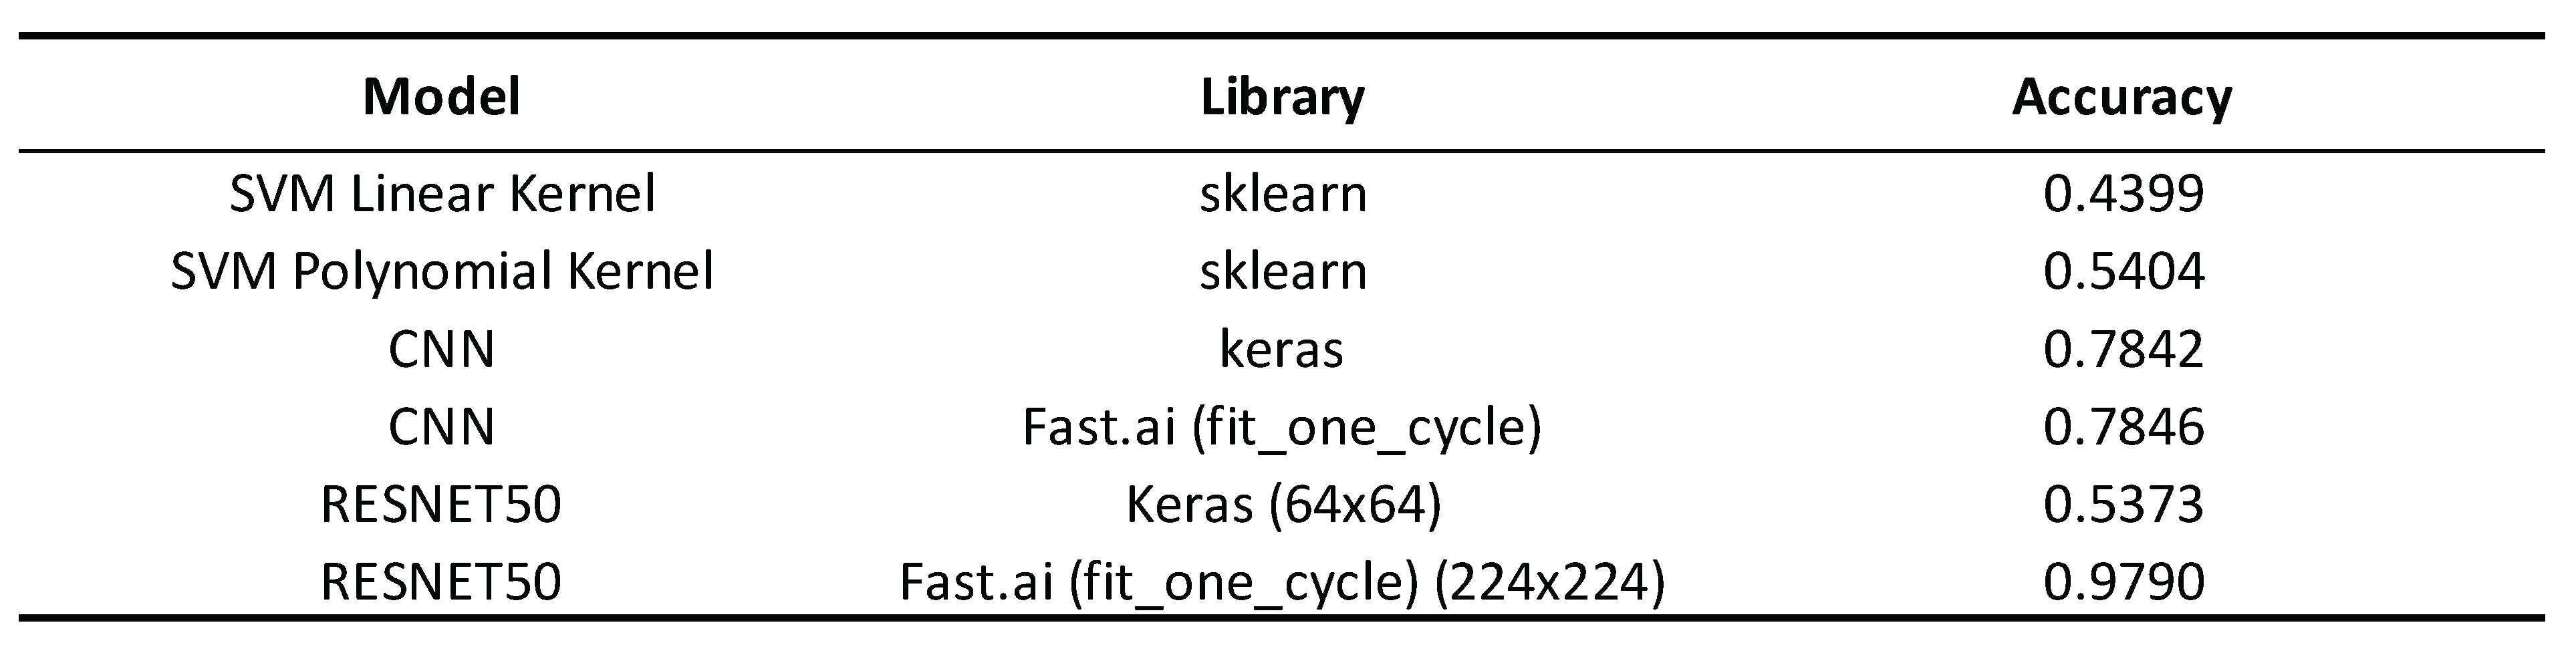
To conclude, this Table 3. presents a comparison of the results obtained from testing multiple models and libraries. It highlights which combination performs the best overall by evaluating each model’s accuracy, efficiency, and suitability for the task at hand. This comparison helps identify the most robust solution among the options tested, offering valuable insights into the relative strengths and weaknesses of each approach.
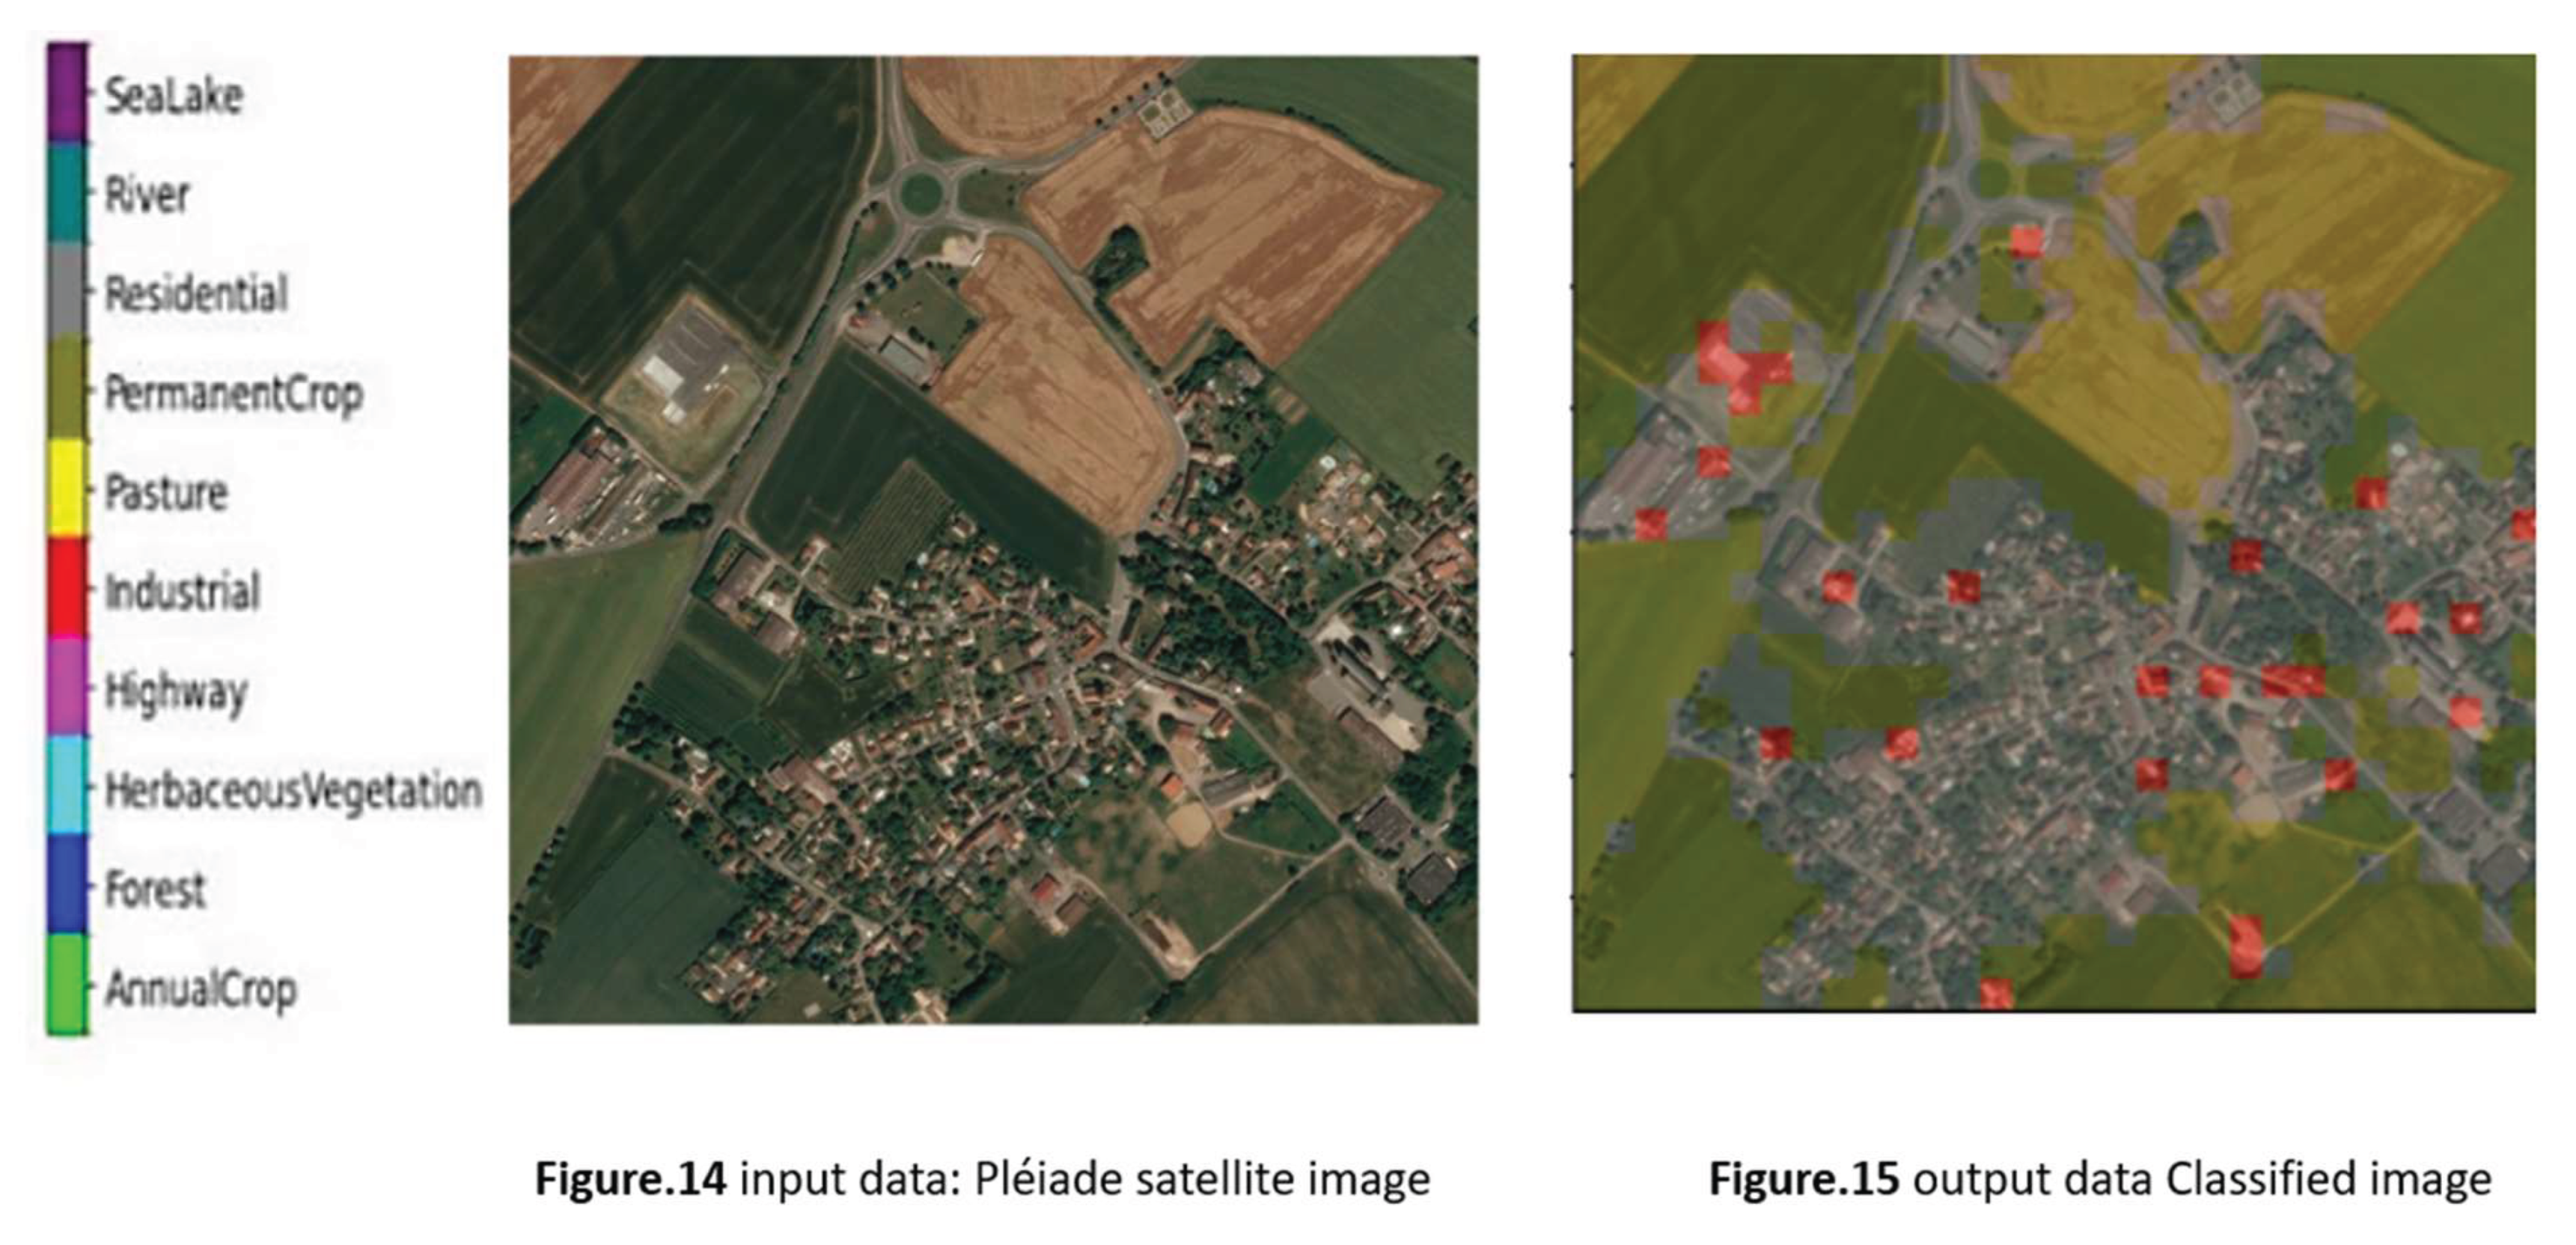
By applying this model to our Pléiades images of the study area, which have a high resolution of just a few centimeters and share similar spectral characteristics (such as the RGB bands), we achieved significant results. These images, due to their fine resolution and spectral similarity, provided an ideal dataset for the model, allowing it to accurately capture and analyze the key features of the area under study. The results obtained confirm the model’s effectiveness in handling high-resolution satellite imagery with these specific spectral properties. First using random colors for each class of the land use patterns (Figure 14 and 15).

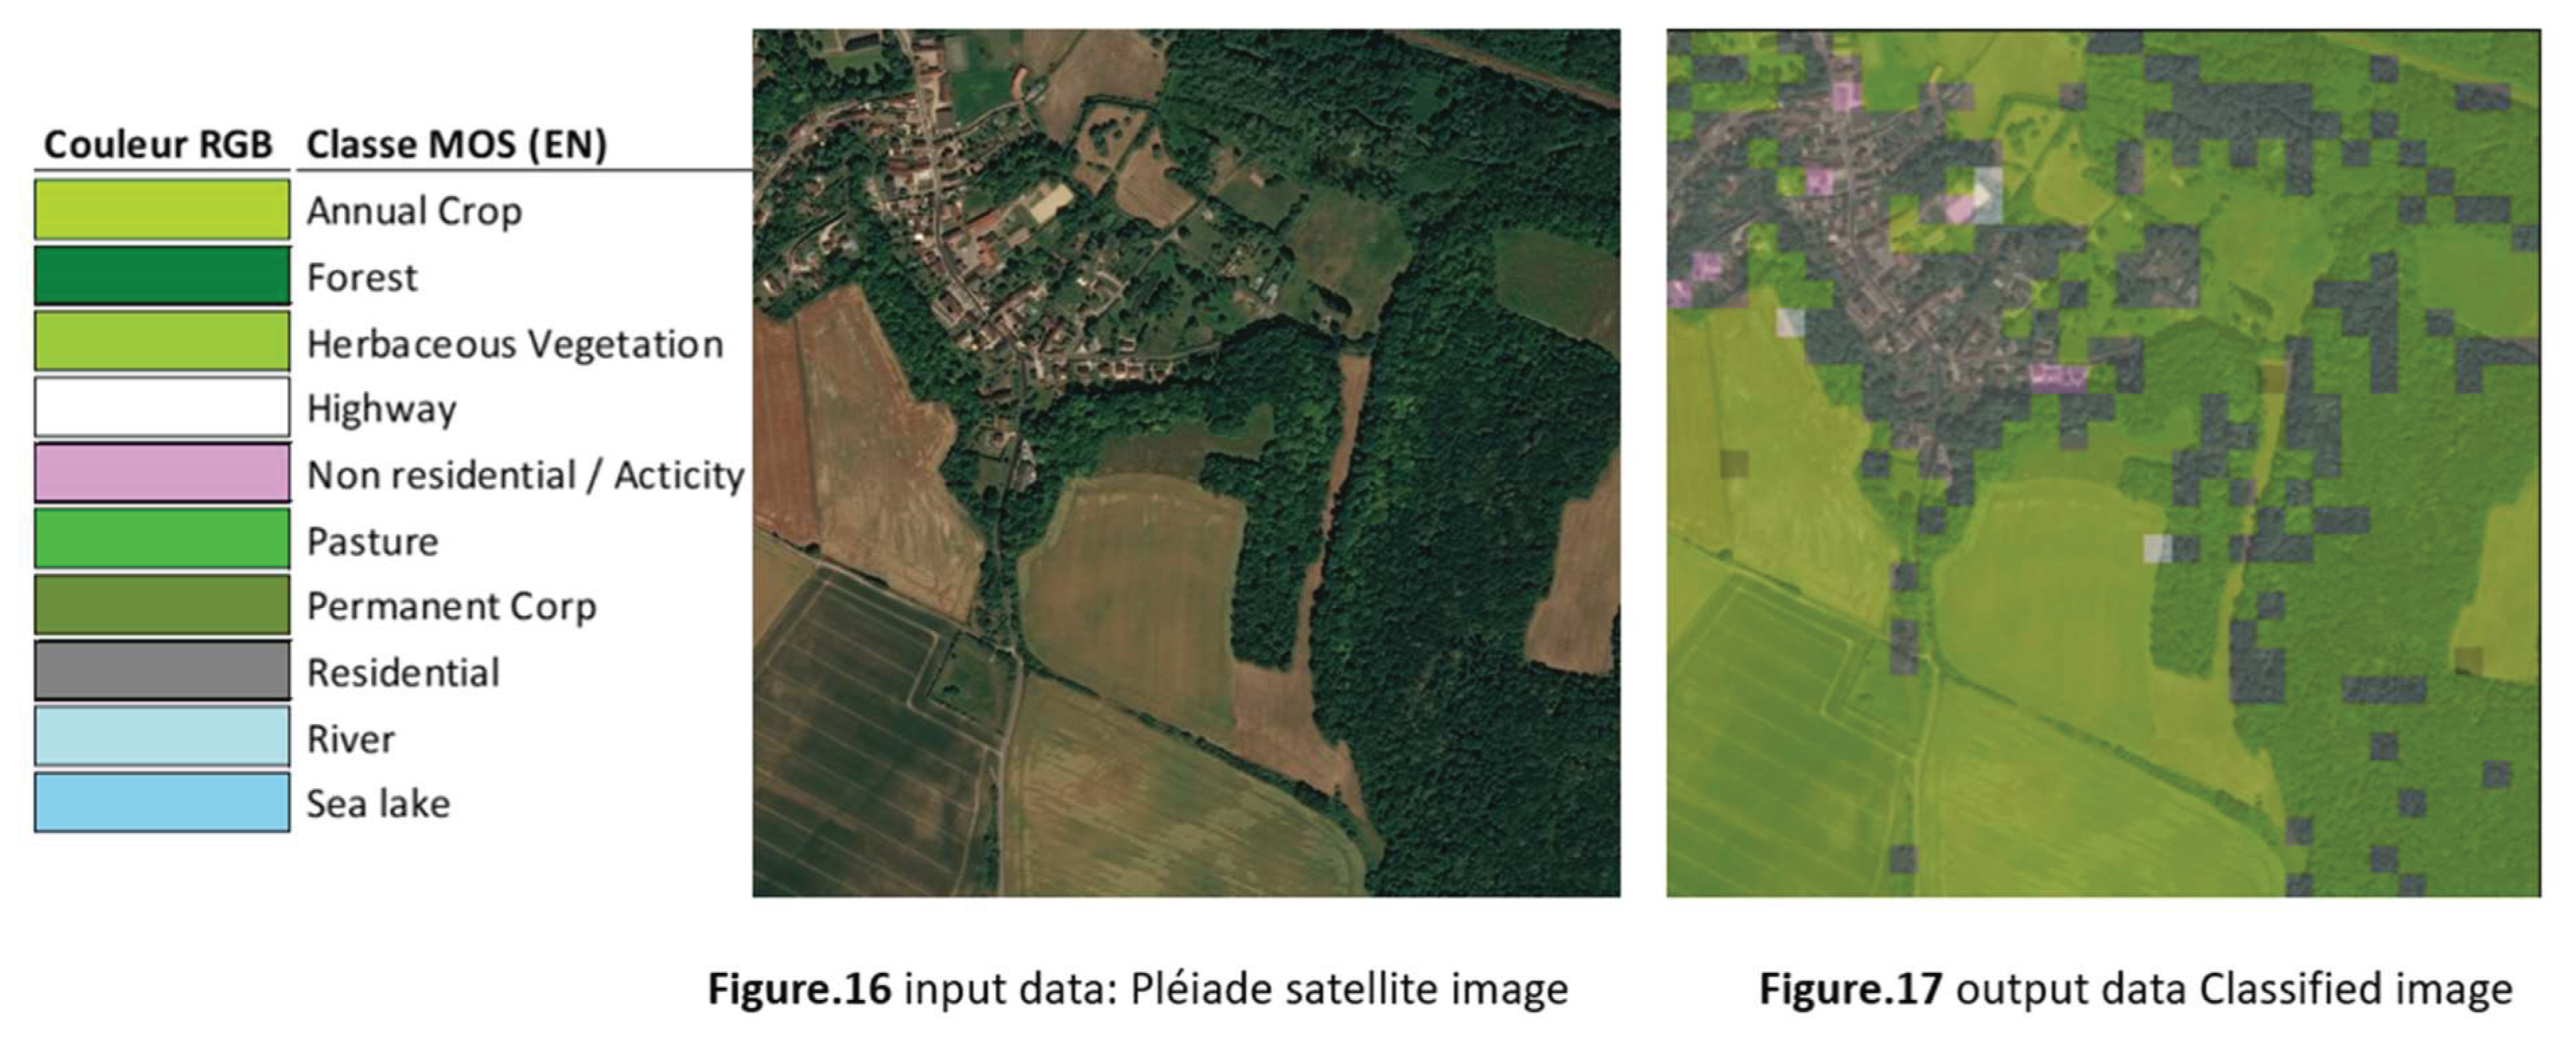
Secondly, we implemented a color scheme for our land use classification inspired by the Paris Region Institute (IPR) (Figure 16). The IPR is well-known for consistently producing detailed land use maps (MOS) for the entire Paris region. We adopted their approach to ensure that our classification scheme aligns with recognized standards and provides a clear and visually coherent representation of land use patterns in our study area (Figure 17). This choice not only enhances the accuracy of our maps but also facilitates easier comparison with existing regional data.

4. Disscusion (Analysis of Results)
The experiment’s results underscore the considerable variation in performance between different machine learning and deep learning models when applied to the task of land use classification in satellite imagery. Among the models tested, Support Vector Machines (SVMs) with different kernels demonstrated notable differences in accuracy. Specifically, the SVM with a polynomial kernel achieved an accuracy of 0.5404, which, although modest, represented a significant improvement over the linear kernel model’s accuracy of 0.4399.
However, when compared to Convolutional Neural Network (CNN) models, the SVMs were clearly outperformed. The CNN models, implemented using both Keras and the fit_one_cycle method by Fast.ai, achieved significantly higher accuracies of 0.7842 and 0.7846, respectively. This indicates that CNNs are inherently better suited for the complex task of land use classification from satellite images, likely due to their ability to effectively capture and learn spatial hierarchies in image data. Moreover, the slight variation in accuracy between the two CNN implementations suggests that different training methods had minimal impact on performance.
The study also explored the effectiveness of pre-trained ResNet50 models, revealing a marked difference in performance depending on the implementation and image input size. The ResNet50 model trained with Keras on 64x64 pixel patches yielded an accuracy of 0.5373. In contrast, the same model trained using Fast.ai on larger 224x224 pixel images achieved a far superior accuracy of 0.9790. This dramatic improvement highlights the importance of transfer learning, where leveraging a pre-trained model on a larger image size can significantly enhance performance.
The superior results from the Fast.ai implementation suggest that not only does the size of the input image play a critical role, but the fit_one_cycle learning approach also contributes to optimizing the model’s performance. The findings imply that deep learning models, particularly pre-trained CNNs like ResNet50, are highly effective for land use classification in satellite imagery when appropriately configured.
However, the study also identified limitations related to the size of image patches used for classification. When satellite images are divided into smaller 64x64 patches, there is a risk that each patch may contain multiple land use classes, complicating the model’s ability to accurately predict the correct class. This issue is exacerbated in scenarios where the model encounters new classes it was not trained on. The results suggest that using larger image patches, which can better isolate distinct land use features, may improve classification accuracy. Overall, the study demonstrates that while deep learning models are powerful tools for satellite image classification, careful consideration of image size and training methods is crucial for optimizing their performance.
5. Conclusions
The use of satellite images for land use classification has become increasingly important for urban planning, environmental monitoring, and natural resource management. In recent years, deep learning and machine learning models have shown great potential in achieving high accuracy in land use classification. Our study explored the performance of different deep learning and machine learning models for land use classification of satellite images in the Cergy Pontoise agglomeration. We found that convolutional neural network (CNN) models outperformed the SVM models, achieving much higher accuracy. While noting that different approaches for training CNN didn’t have different results. We also found that the ResNet50 architecture, a deep convolutional neural network architecture known for its skip connections, was the best in land use classification. The transfer learning approach was used to train the model, which involved using the pre-trained ResNet50 model as a feature extractor and then training a new classifier on top of the extracted features. Moreover, the performance of the RESNET50 models was significantly affected by the training method used and image input size, with Fast.ai implementation showing better results. Our results suggest that deep learning models, especially ResNet50, can be effective in land use classification of satellite images. Overall, the findings of our study have important implications for urban planners, environmental managers, and natural resource managers who rely on accurate land use classification information. The use of deep learning and machine learning models can provide an efficient and accurate way to analyze changes in land use patterns over time. The limitations of our study include the small sample size and limited study area, which suggests the need for further research in this field
Author Contributions
Conceptualization, H.A. and C.A. ; methodology, H.A. ; software, C.A. ; validation, C.R., D.D. and T.F. ; formal analysis, C.R. ; investigation, H.A. ; resources, C.A. ; data curation, T.F. ; writing—original draft preparation, H.A. and C.A. ; writing—review and editing, C.R. ; visualization, H.A. ; supervision, D.D. and C.R. ; project administration, H.A. ; funding acquisition, T.F.
Funding
This work aimes to study land use changes in the Cergy-Pontoise agglomeration community. It is conducted at CY Cergy Paris University, leveraging the expertise of the PLACES (Geography and Planning) and ETIS (Computer Science) laboratories. This thesis is funded by the CACP under an agreement. The thesis is supervised by two professors: Didier Desponds for the geography part and Rachid Chelouah for the computer science part. Additionally, Franck Touyaa, head of the GIS department of the CACP, has fully supported this project by hosting the doctoral student in his services.
Data Availability Statement
Local authorities have privileged access to Pléiades imagery, as do research laboratories and universities. This is due to the satellite owner’s intent to facilitate access to the data obtained by its satellites. These types of data are compatible with multiple applications such as mapping, environmental monitoring, and urban planning. Sentinel offers free data with regular and frequent coverage of the Earth’s surface, accessible through Sentinel Explorer. This data is invaluable for applications such as mapping, environmental monitoring, and urban planning.
Acknowledgments
We are grateful to the University of Cergy- Paris and Cergy- Pontoise agglomeration community for furnishing the essential resources and facilities that greatly supported the seamless advancement of our research. Furthermore, we are grateful to all students who directly or indirectly contributed to this work.
Conflicts of Interest
The authors declare no conflicts of interest.
References
- Acevedo,W.; Janis,L.; Dave, J.; Glavac,S et al. Rates, trends, causes, and consequences of urban land-use change in the United States. Professional Paper 1726 U.S. Geological Survey, Reston, Virginia 2006, 206 pages. https://pubs.usgs.gov/pp/pp1726/pp1726.pdf.
- Wang, C.; Zhou, X.; Huang, W. A Review of Deep Learning Methods for Urban Land Use and Land Cover Classification. Remote Sensing 2019, 11, 2254. [Google Scholar]
- Grand Paris Aménagement. Cergy-Pontoise. 2022, Retrieved from https://www.grandparisamenagement.fr/projets/cergy-pontoise.
- Agglomération de Cergy-Pontoise. Plan Local d’Urbanisme (PLU). 2022, Retrieved from https://www.cergypontoise.fr/plan-local-durbanisme-plu.
- Fadaei, H. ; Kheirkhah,Z.; M. M ; & Sadeghi-Niaraki, A. Land Use Change Detection using Deep Learning Techniques: A Review. Land Use Policy, 2019, 81, 653–662.
- Seto, K. C.; Güneralp, B.; & Hutyra, L.; R. Global forecasts of urban expansion to 2030 and direct impacts on biodiversity and carbon pools. Proceedings of the National Academy of Sciences, 2012, 109(40), 16083-16088. [CrossRef]
- Xu, H ; Wang, J.; Hu, Y. ; Chen, Y . ; & Li, H. Deep learning for remote sensing data: A technical tutorial on the state of the art. IEEE Geoscience and Remote Sensing Magazine, 2019, 7(2), 6- 24.
- Chen, Y; Lin, Z.; Zhao, X; Wang, G.; Gu, Y. Deep Learning-Based Classification of Hyperspectral Data. IEEE J. Sel. Topics Appl. Earth Observ. Remote Sens. 2014, 7, 2094–2107. [Google Scholar] [CrossRef]
- Piramanayagam, S.; Schwartzkopf, W.; Koehler, F.W.; Saber, E. Classification of remote sensed images using random forests and deep learning framework. Proc. SPIE 10004, Image and Signal Processing for Remote Sensing XXII, 100040L (18 October 2016). [CrossRef]
- Liu, P.; Zhang, H.; Eom, K.B. Active Deep Learning for Classification of Hyperspectral Images. IEEE J. Sel. Topics Appl. Earth Observ. Remote Sens. 2017, 10, 712–724. [Google Scholar] [CrossRef]
- Yu, X.; Wu, X.; Luo, C.; Ren, P. Deep learning in remote sensing scene classification: a data augmentation enhanced convolutional neural network framework. GIScience Remote Sens 2017, 54, 741–758. [Google Scholar] [CrossRef]
- Yang, Z.; Mu, X.; Zhao, F. Scene classification of remote sensing image based on deep network and multi-scale features fusion. Optik 2018, 171, 287–293. [Google Scholar] [CrossRef]
- Liang, Y.; Monteiro, S.; Saber, E. Transfer learning for high resolution aerial image classification, 2016 IEEE Applied Imagery Pattern Recognition Workshop (AIPR), 2016, pp. 1-8. [CrossRef]
- Pires de Lima, R.; Marfurt, K. Convolutional Neural Network for Remote-Sensing Scene Classification: Transfer Learning Analysis. Remote Sens. 2020, 12, 86. [Google Scholar] [CrossRef]
- Kwon, H.; Kim, Y.; Yoon, H.; Choi, D. Classification score approach for detecting adversarial example in deep neural network. Multimed Tools Appl 2021, 80, 10339–10360. [Google Scholar] [CrossRef]
- Bahri, A.; Majelan, S.G.; S Mohammadi, S.; Noori, M.; Mohammadi, K. Remote Sensing Image Classification via Improved CrossEntropy Loss and Transfer Learning Strategy Based on Deep Convolutional Neural Networks. IEEE Geosci. Remote. Sens. Lett. 2020, 17, 1087–1091. [Google Scholar] [CrossRef]
- Li, J.; Lin, D.; Wang, Y.; Xu, G.; Zhang, Y.; Ding, C.; Zhou, Y. Deep Discriminative Representation Learning with Attention Map for Scene Classification. Remote Sens. 2020, 12, 1366. [Google Scholar] [CrossRef]
- Yassine, H.; Tout, K.; Jaber, M. Improving LULC Classification from Satellite Imagery using Deep Learning - Eurosat Dataset. Int. Arch. Photogramm. Remote Sens. Spatial Inf. Sci., XLIII-B3- 2021, 2021, 369–376. [Google Scholar] [CrossRef]
- Helber, P. EuroSAT: Land Use and Land Cover Classification with Sentinel-2, 2019. Available online: https://github.com/phelber/ eurosat (accessed on 24 October 2021).
- SENTINEL-2 MISSION GUIDE. https://sentinel.esa.int/web/sentinel/missions/sentinel-2.
Figure 1.
Sample images from the EuroSAT dataset.
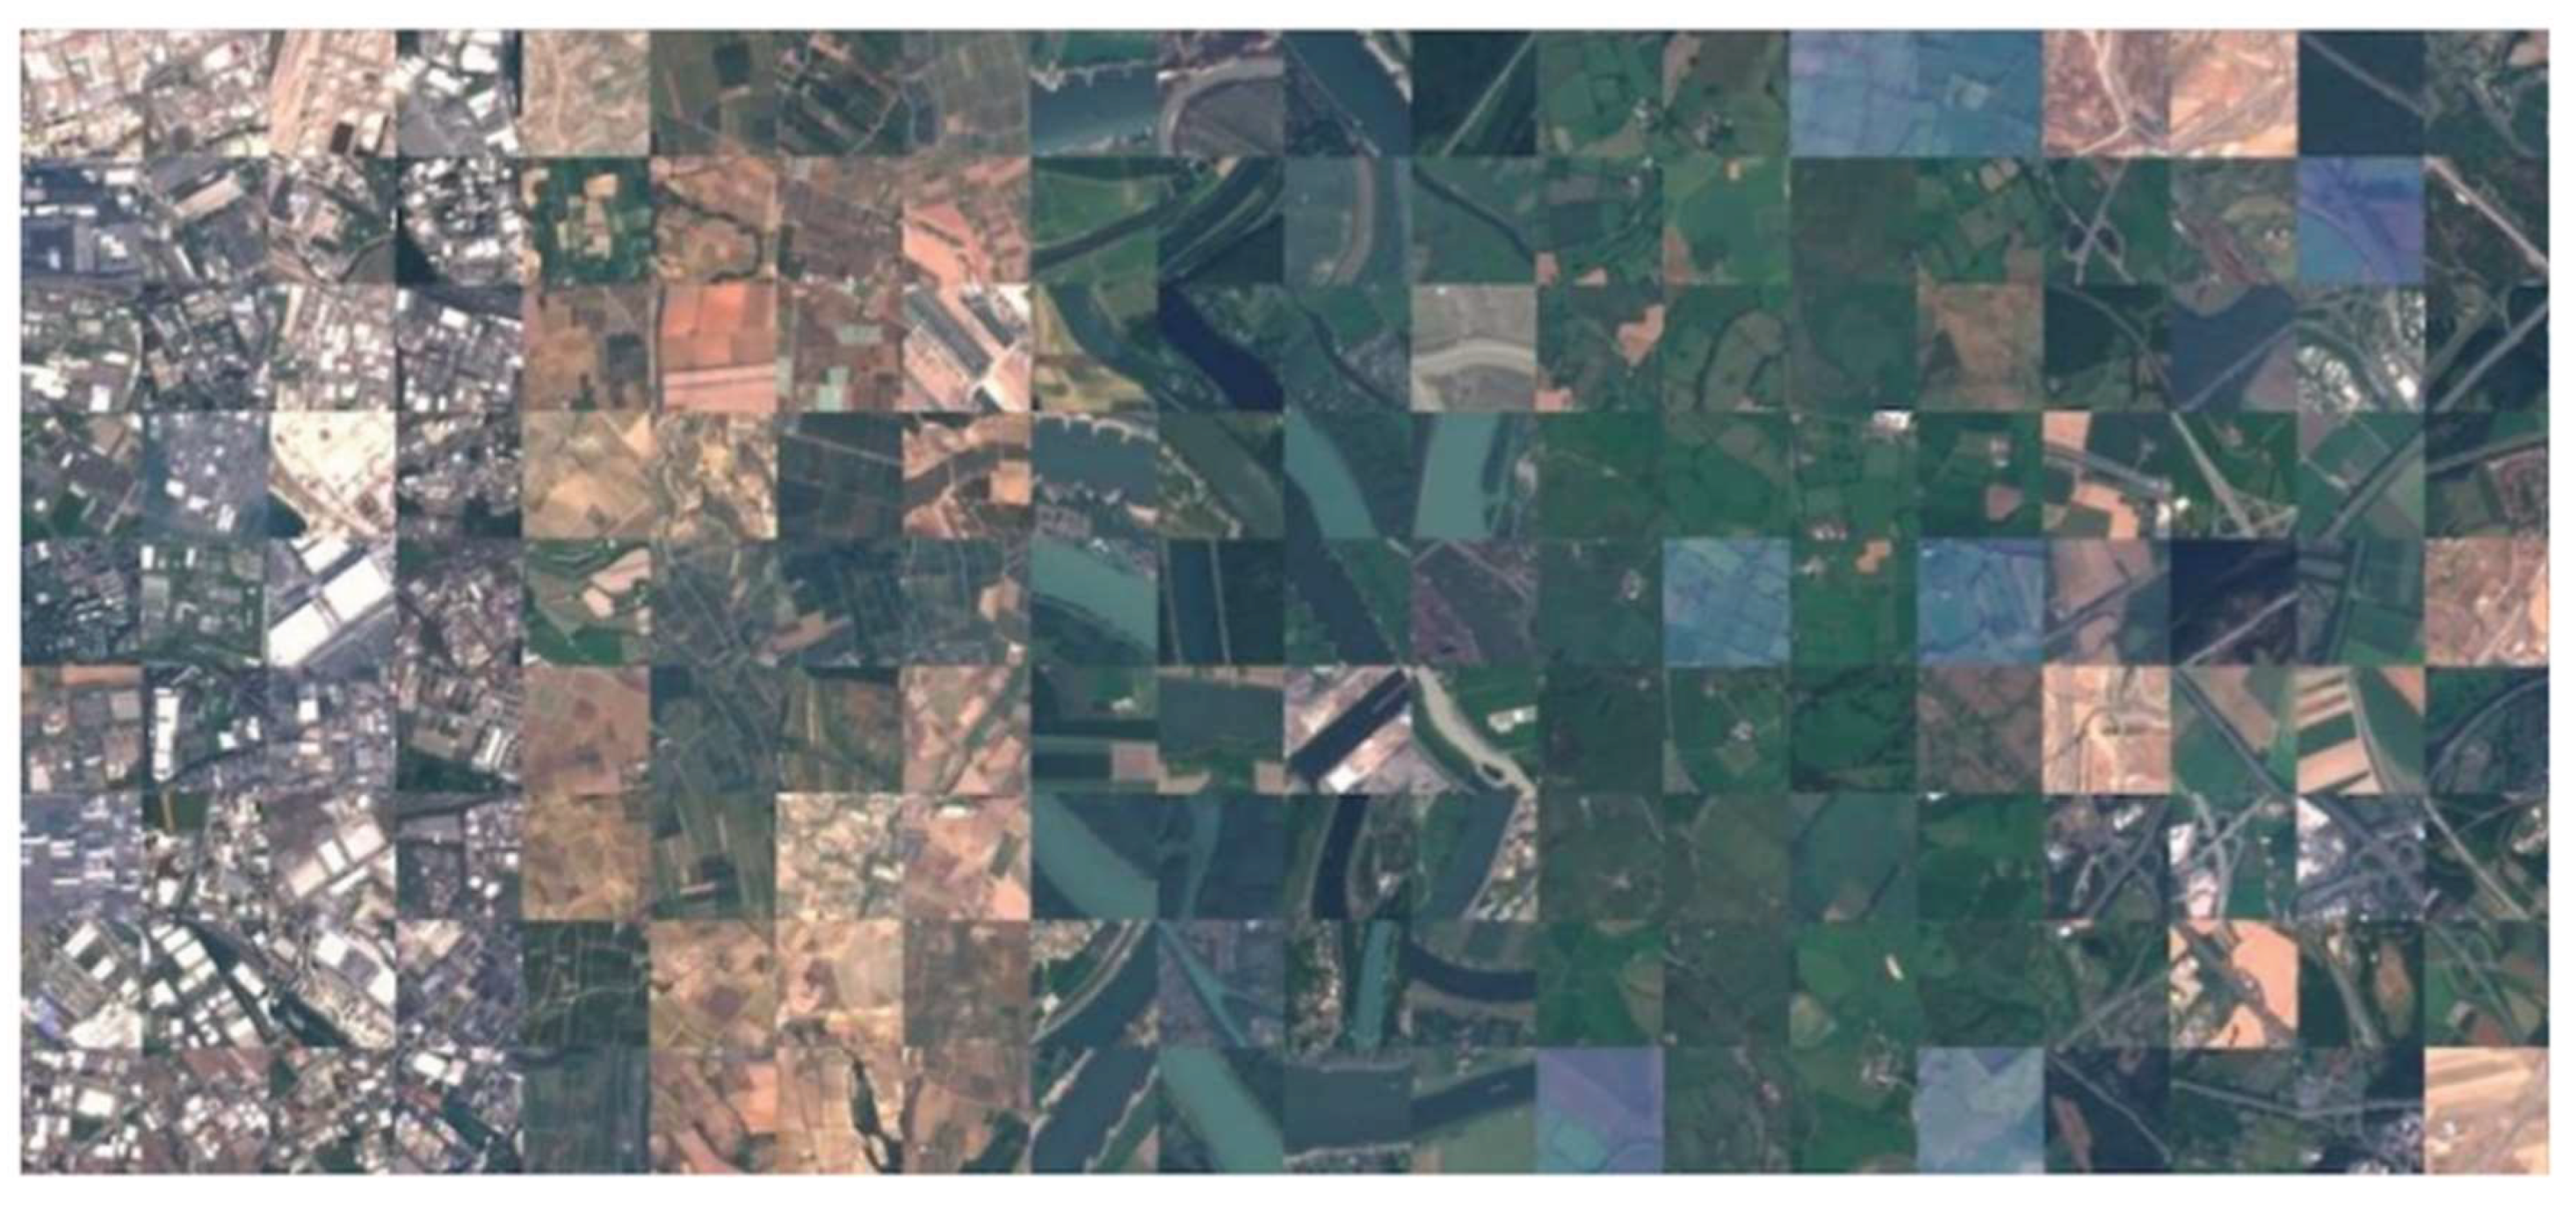
Figure 2.
Land use patterns samples.
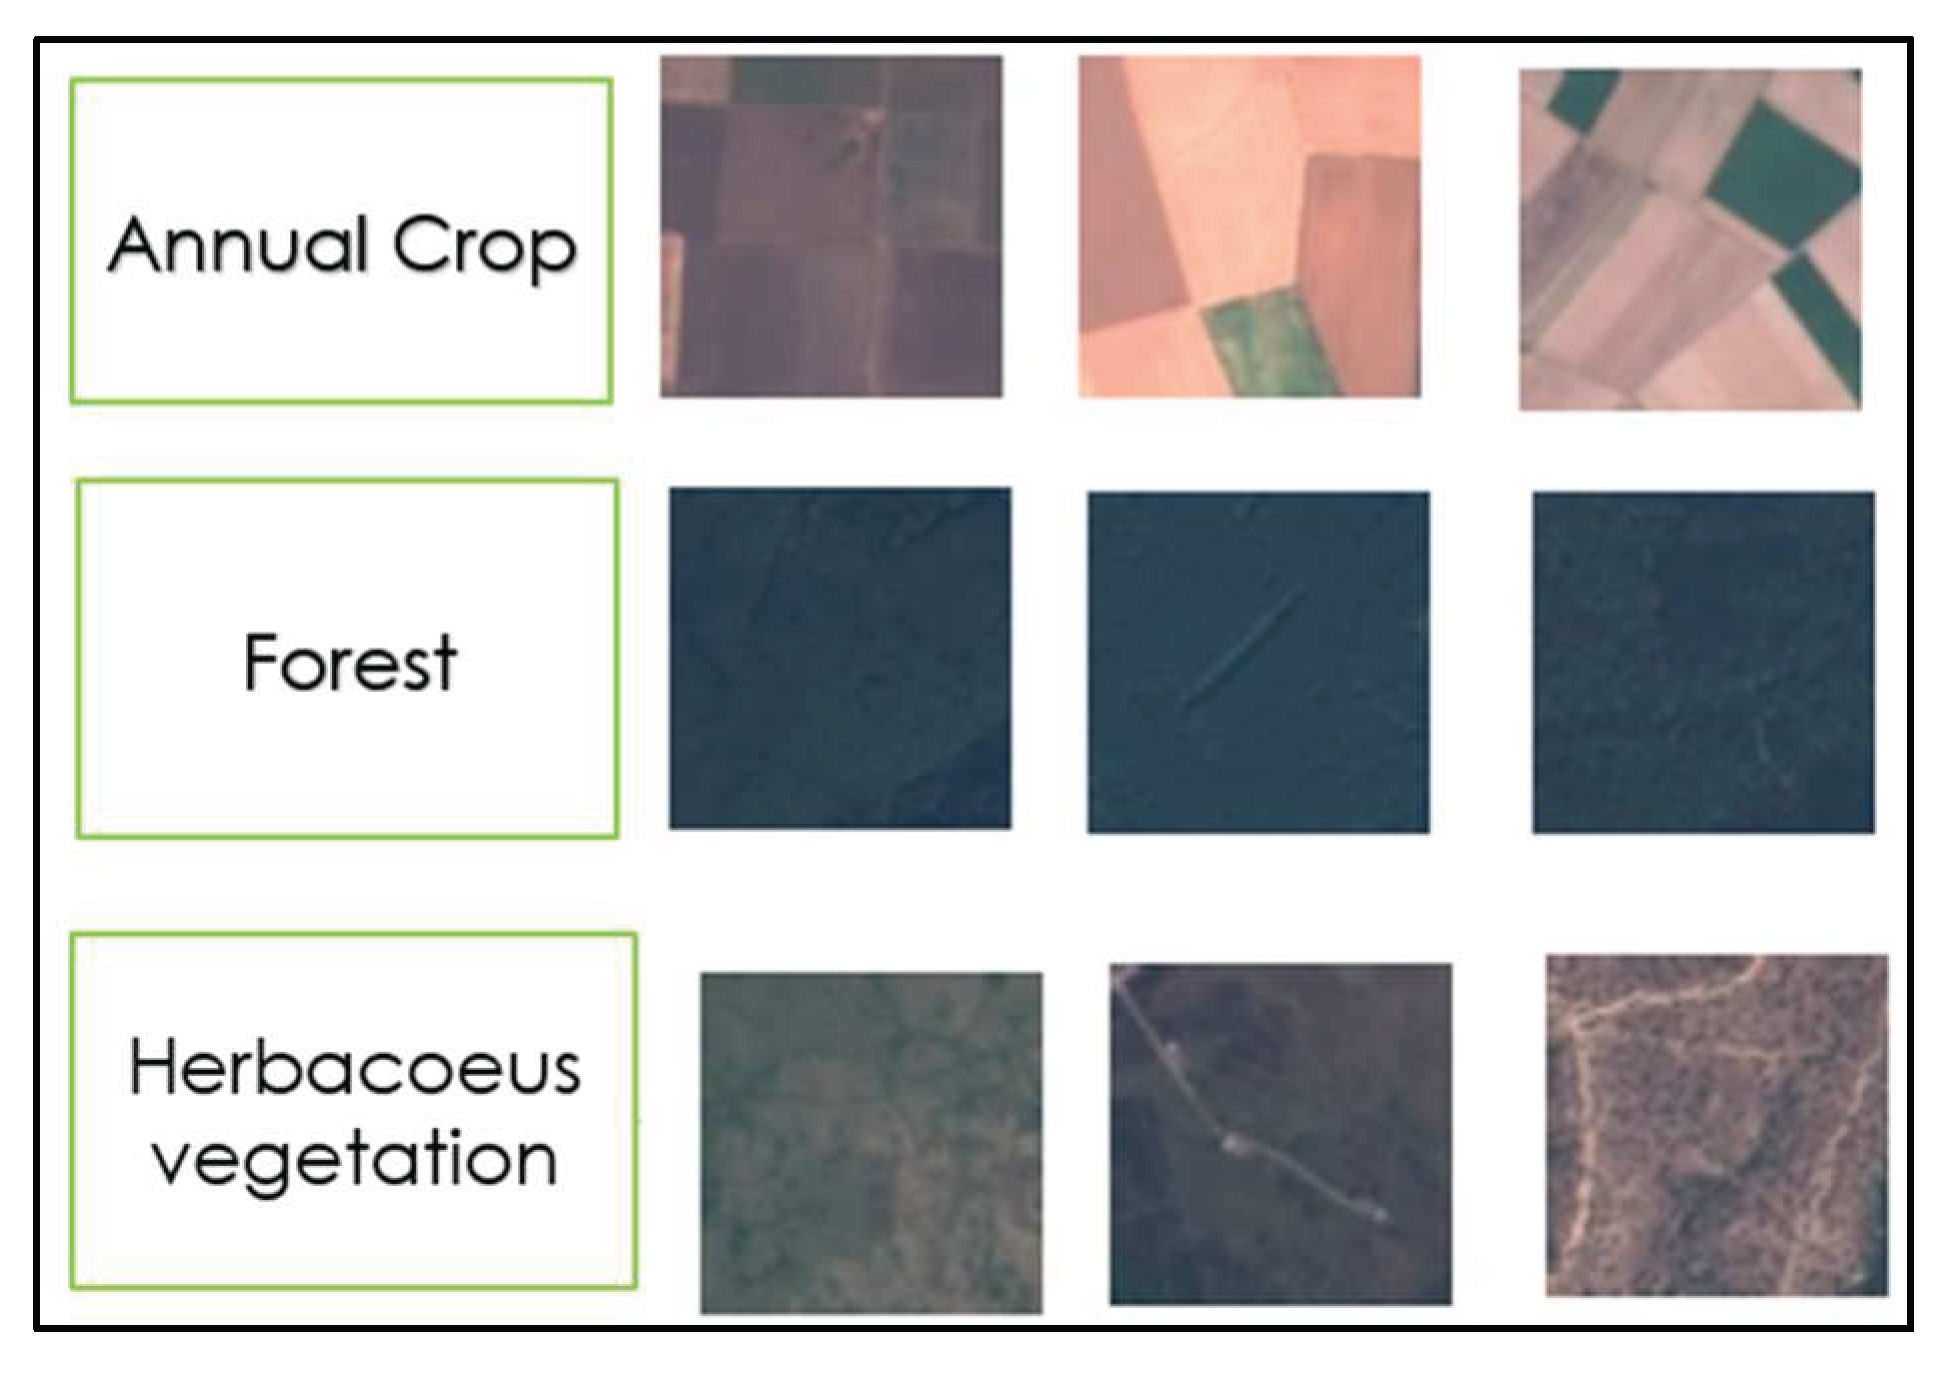
Figure 3.
Examples of bad image patches.
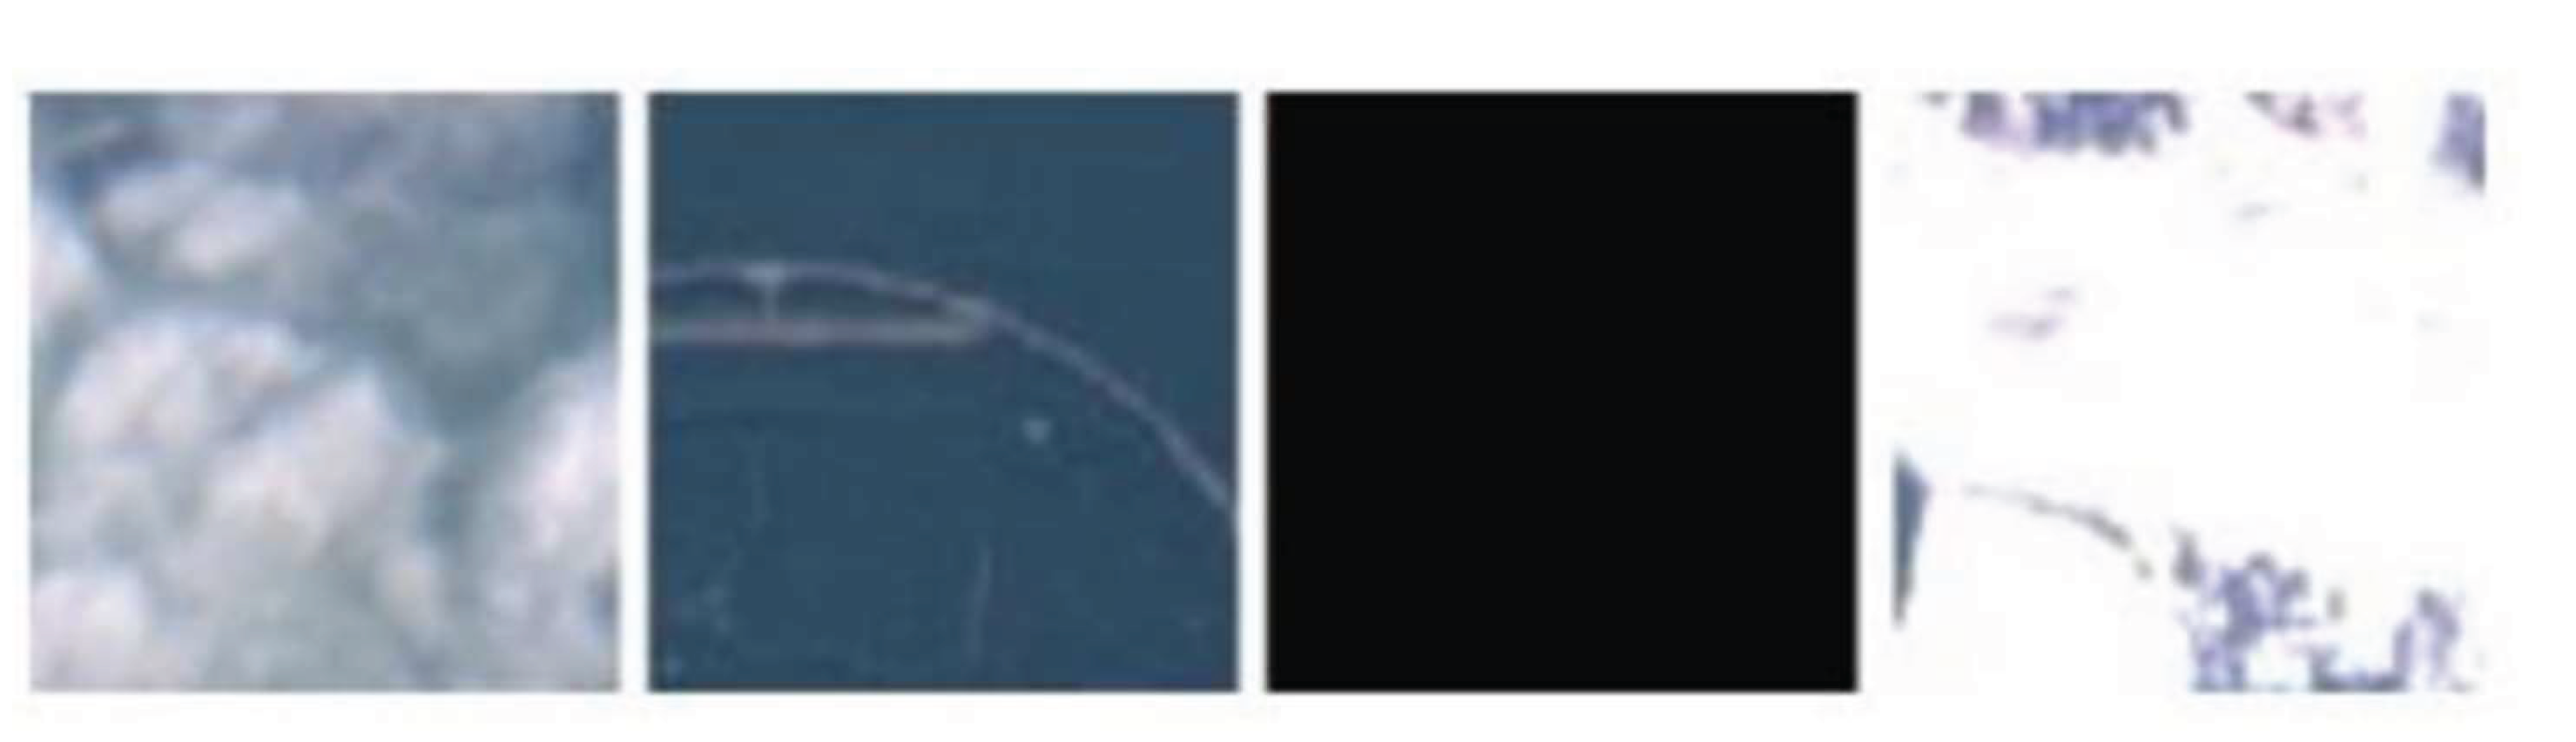
Figure 4.
Color cast due to atmospheric effects.
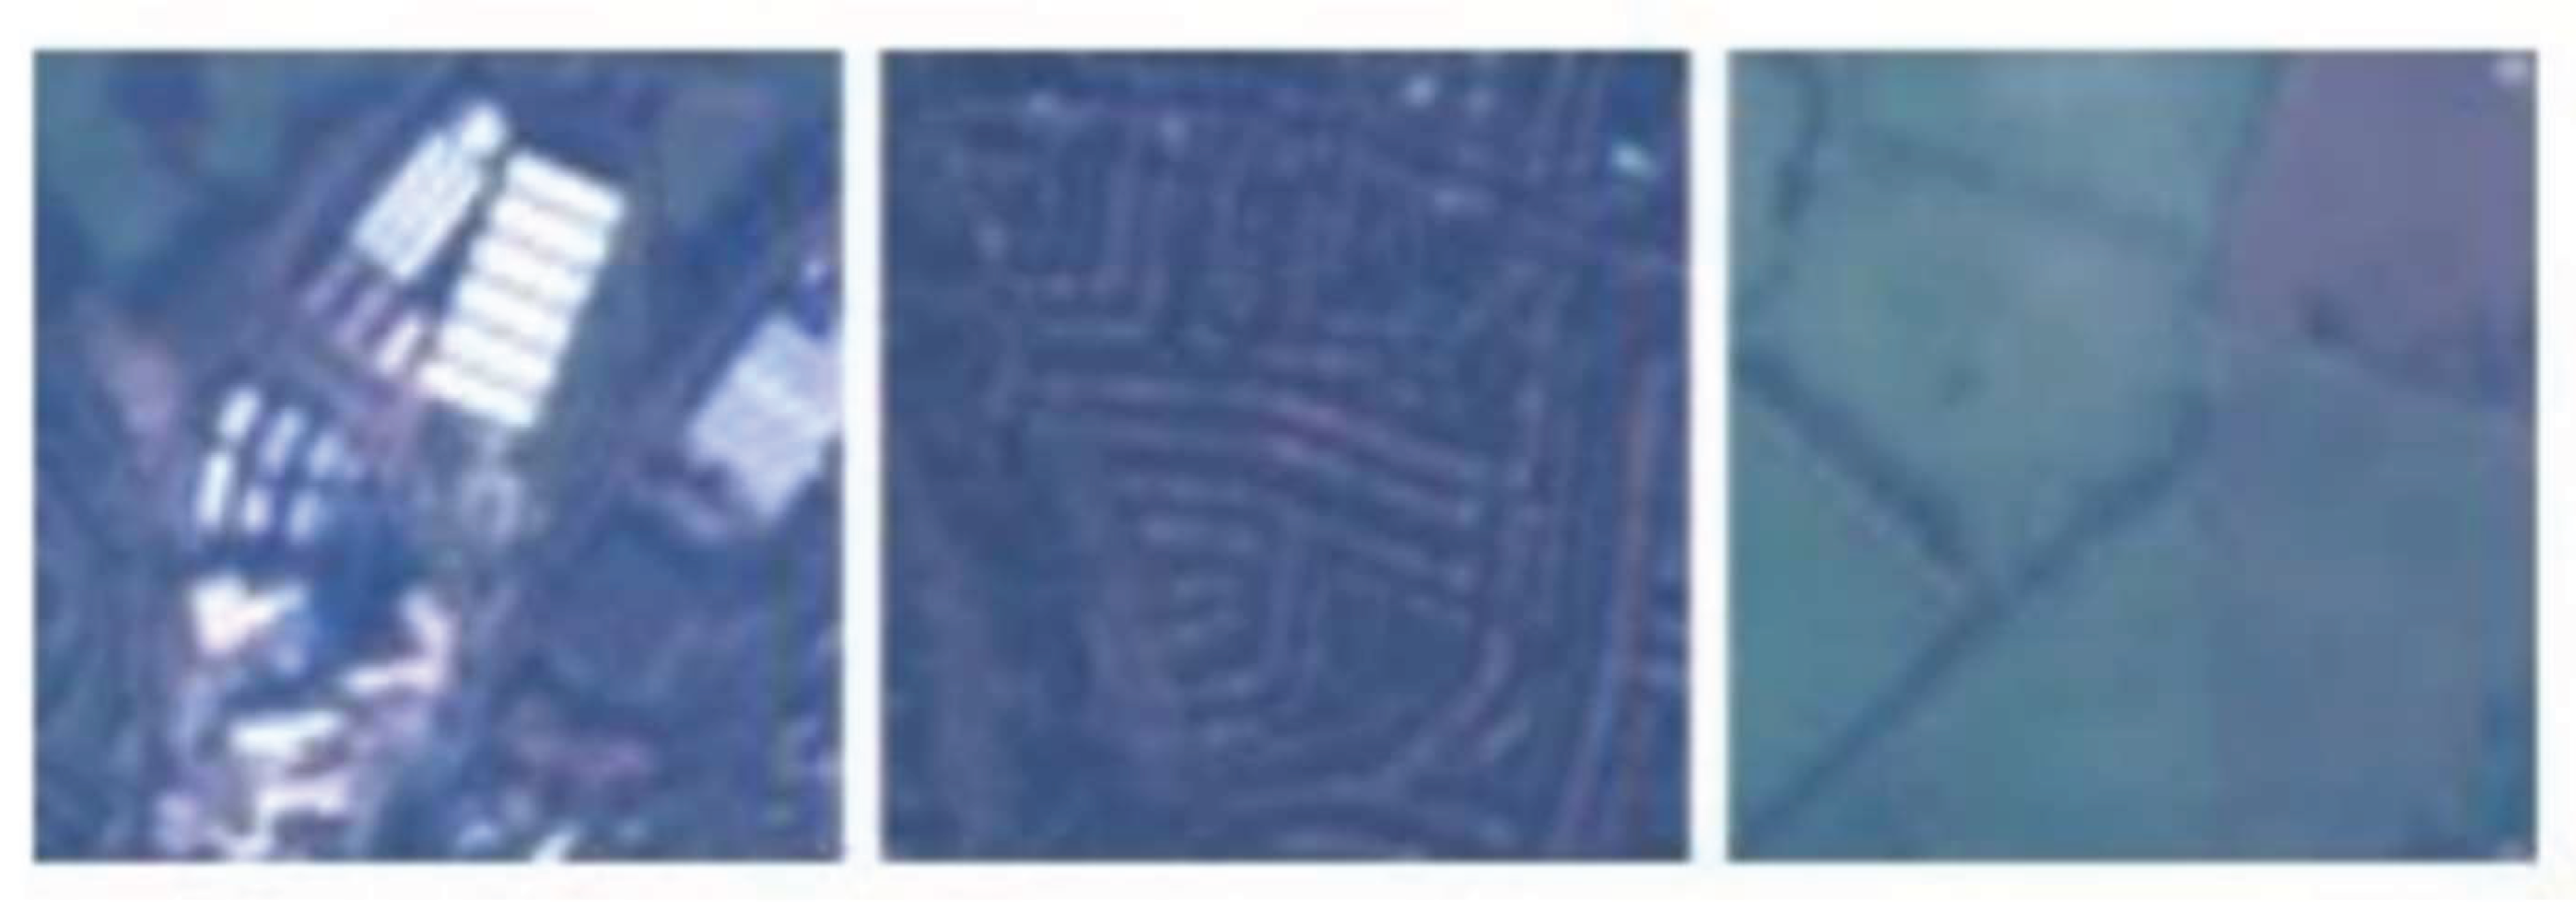
Figure 5.
EuroSAT class distribution.
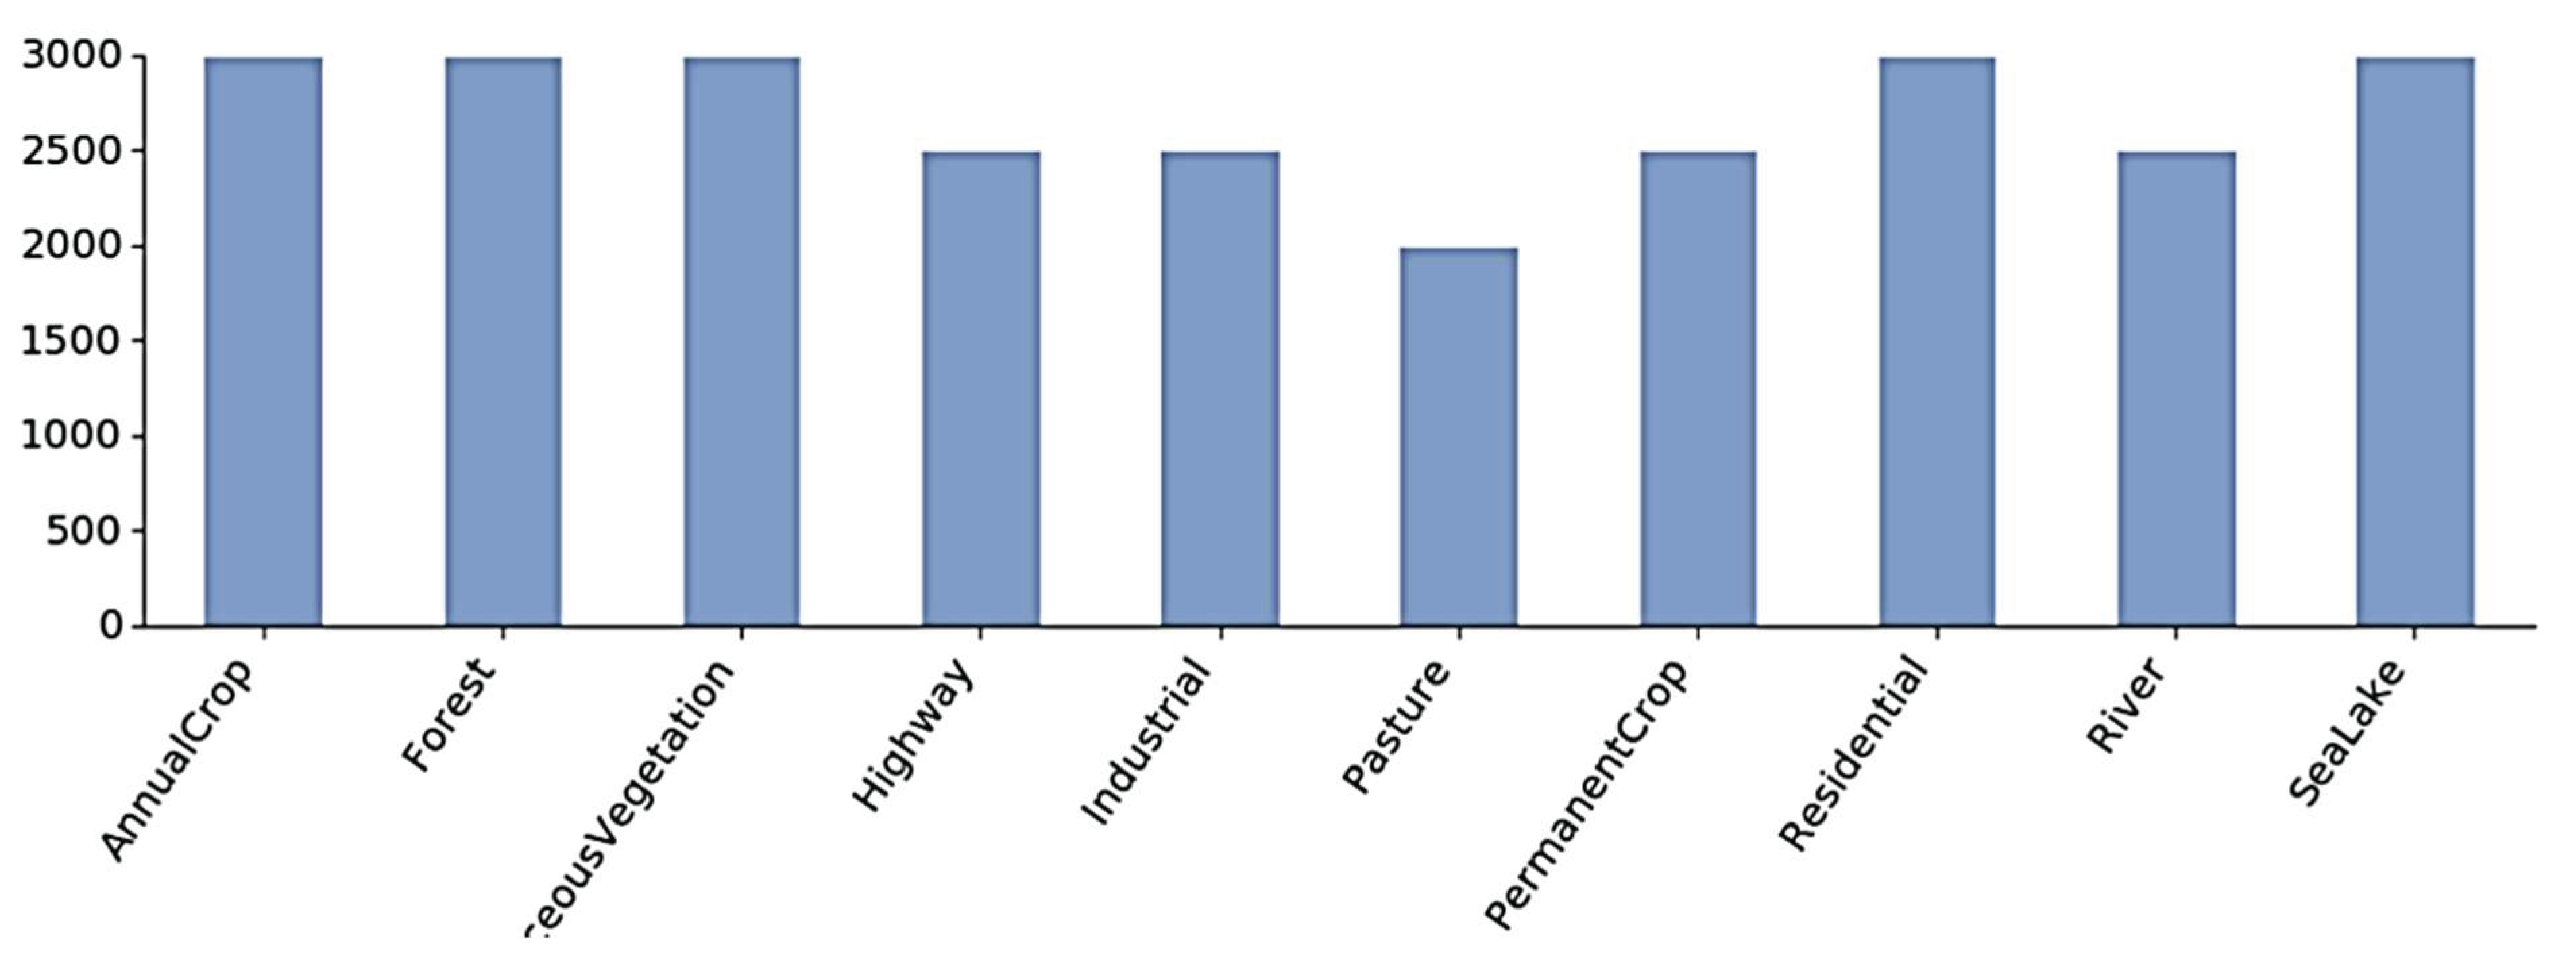
Figure 8.
Schema explaining the Deep Learning Model application.
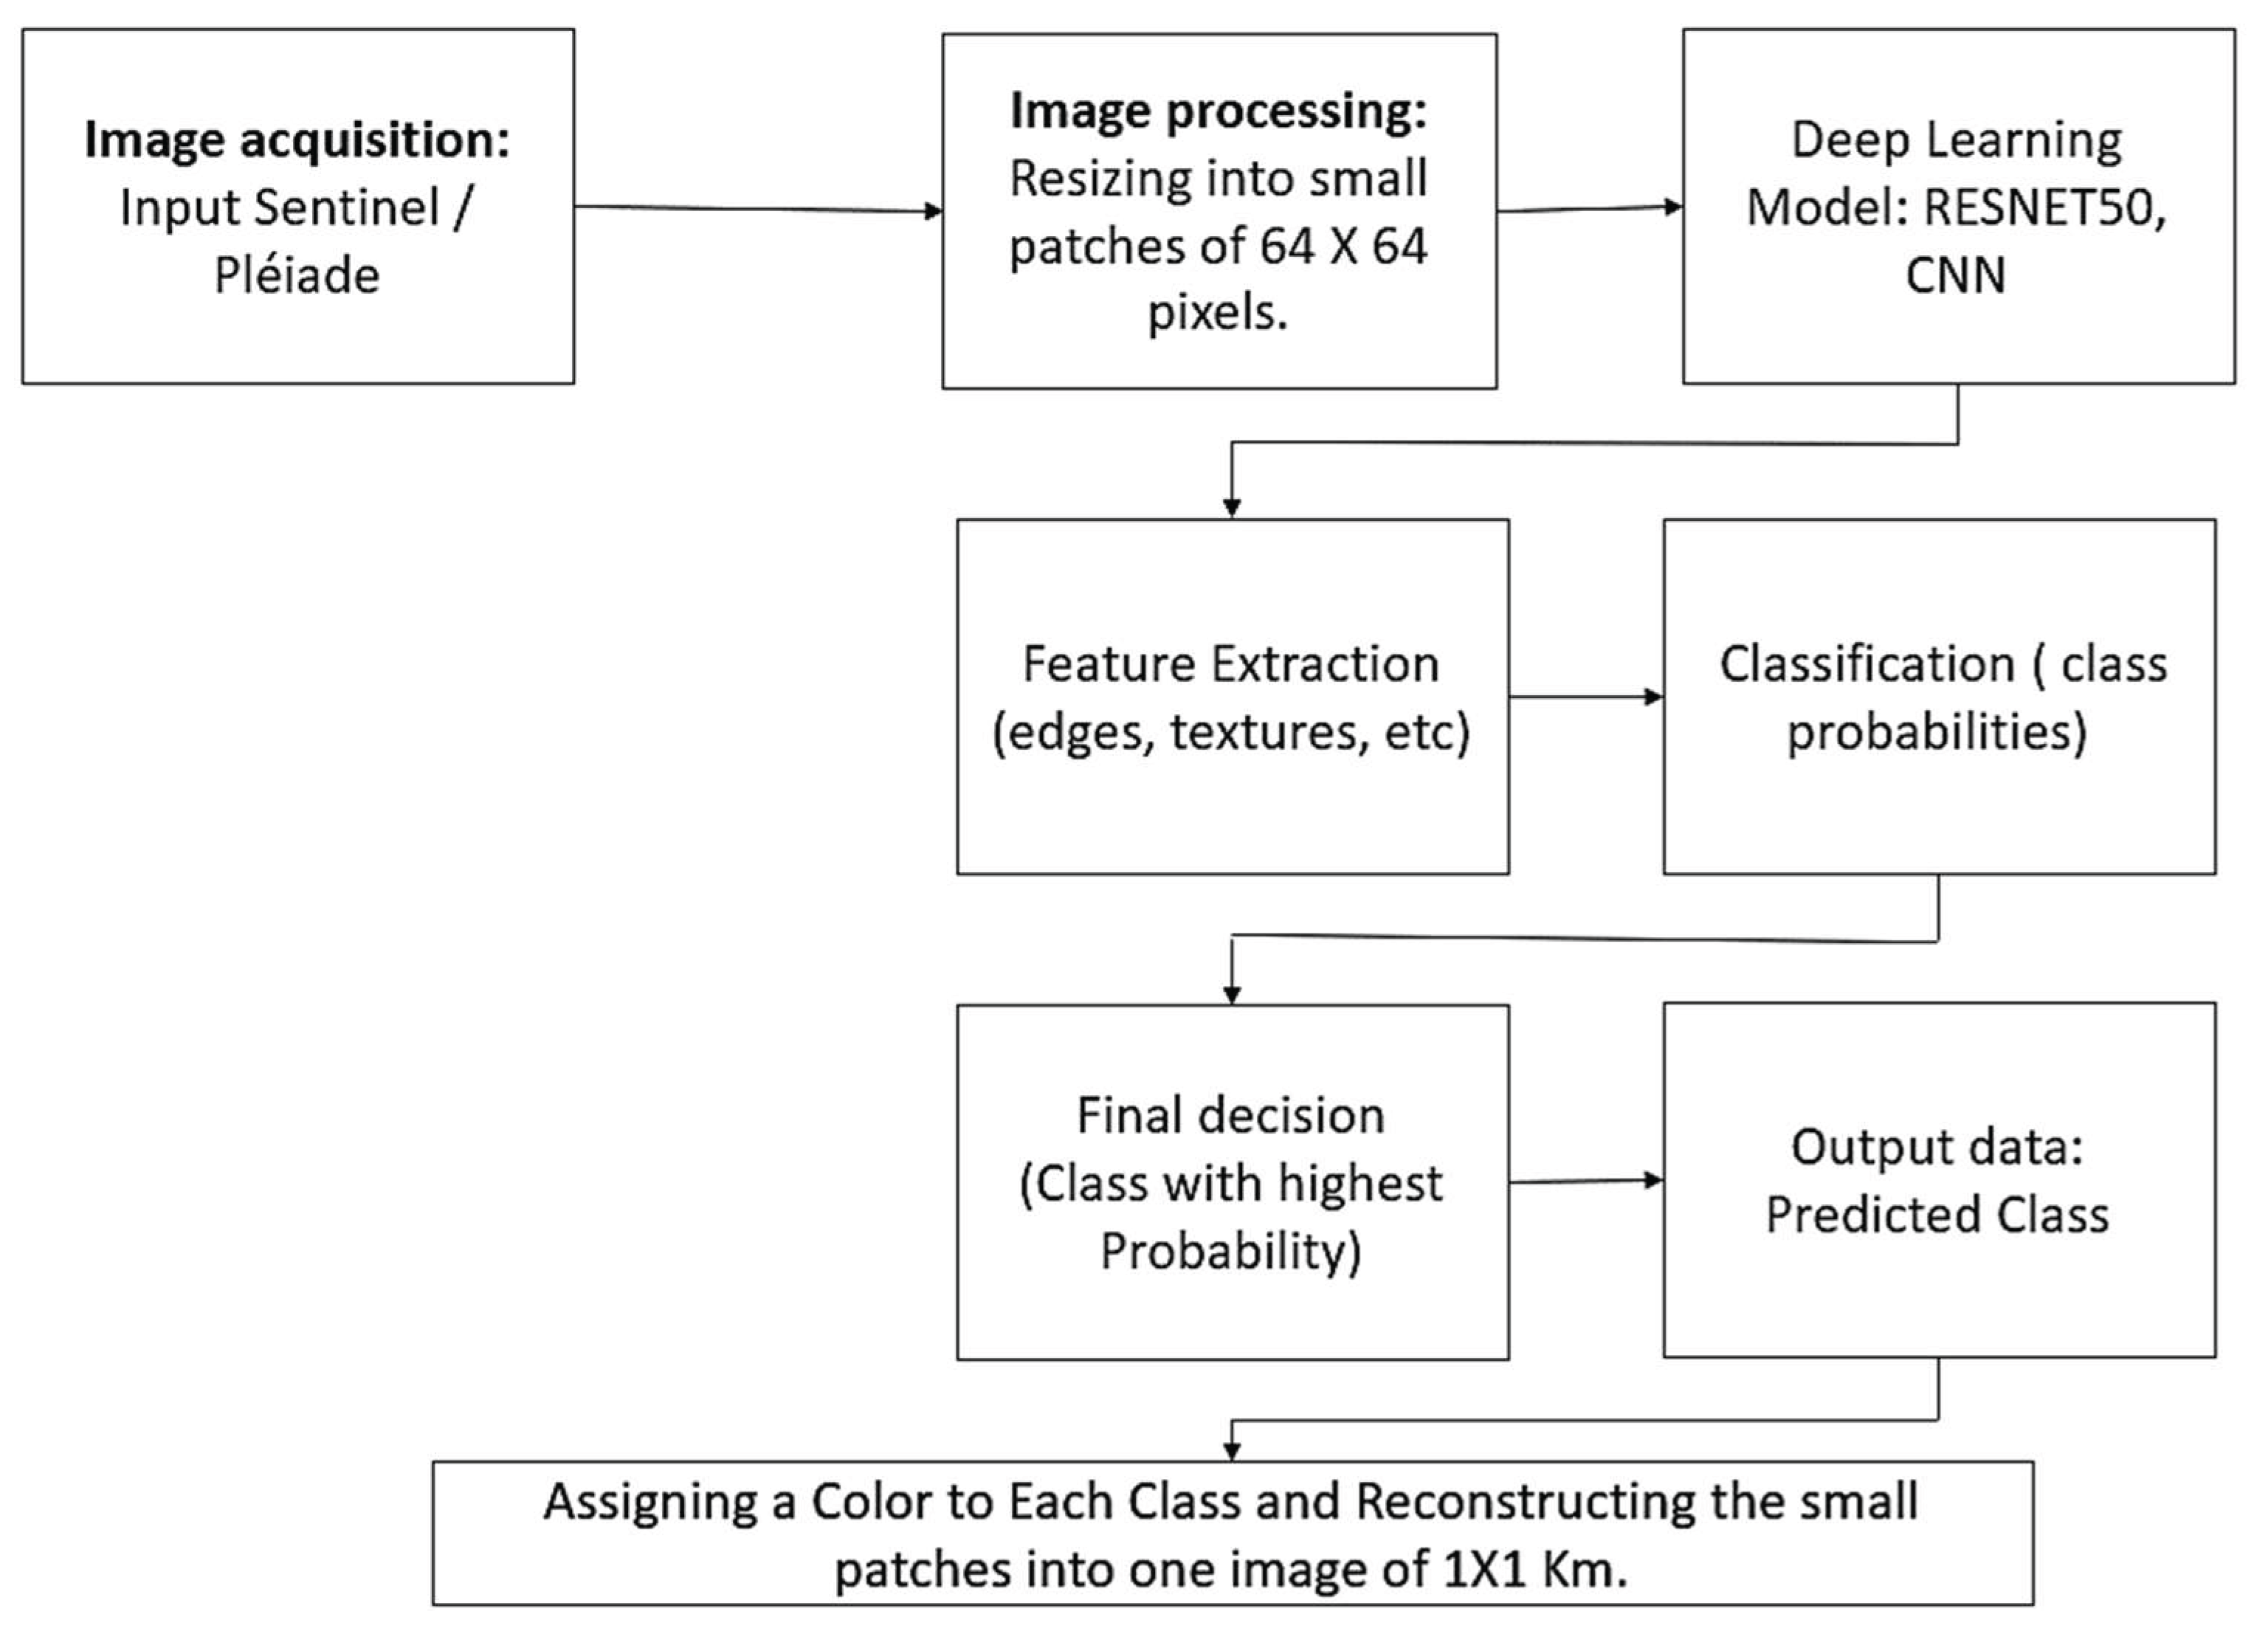
Figure 9.
Loss per epoch using CNN.
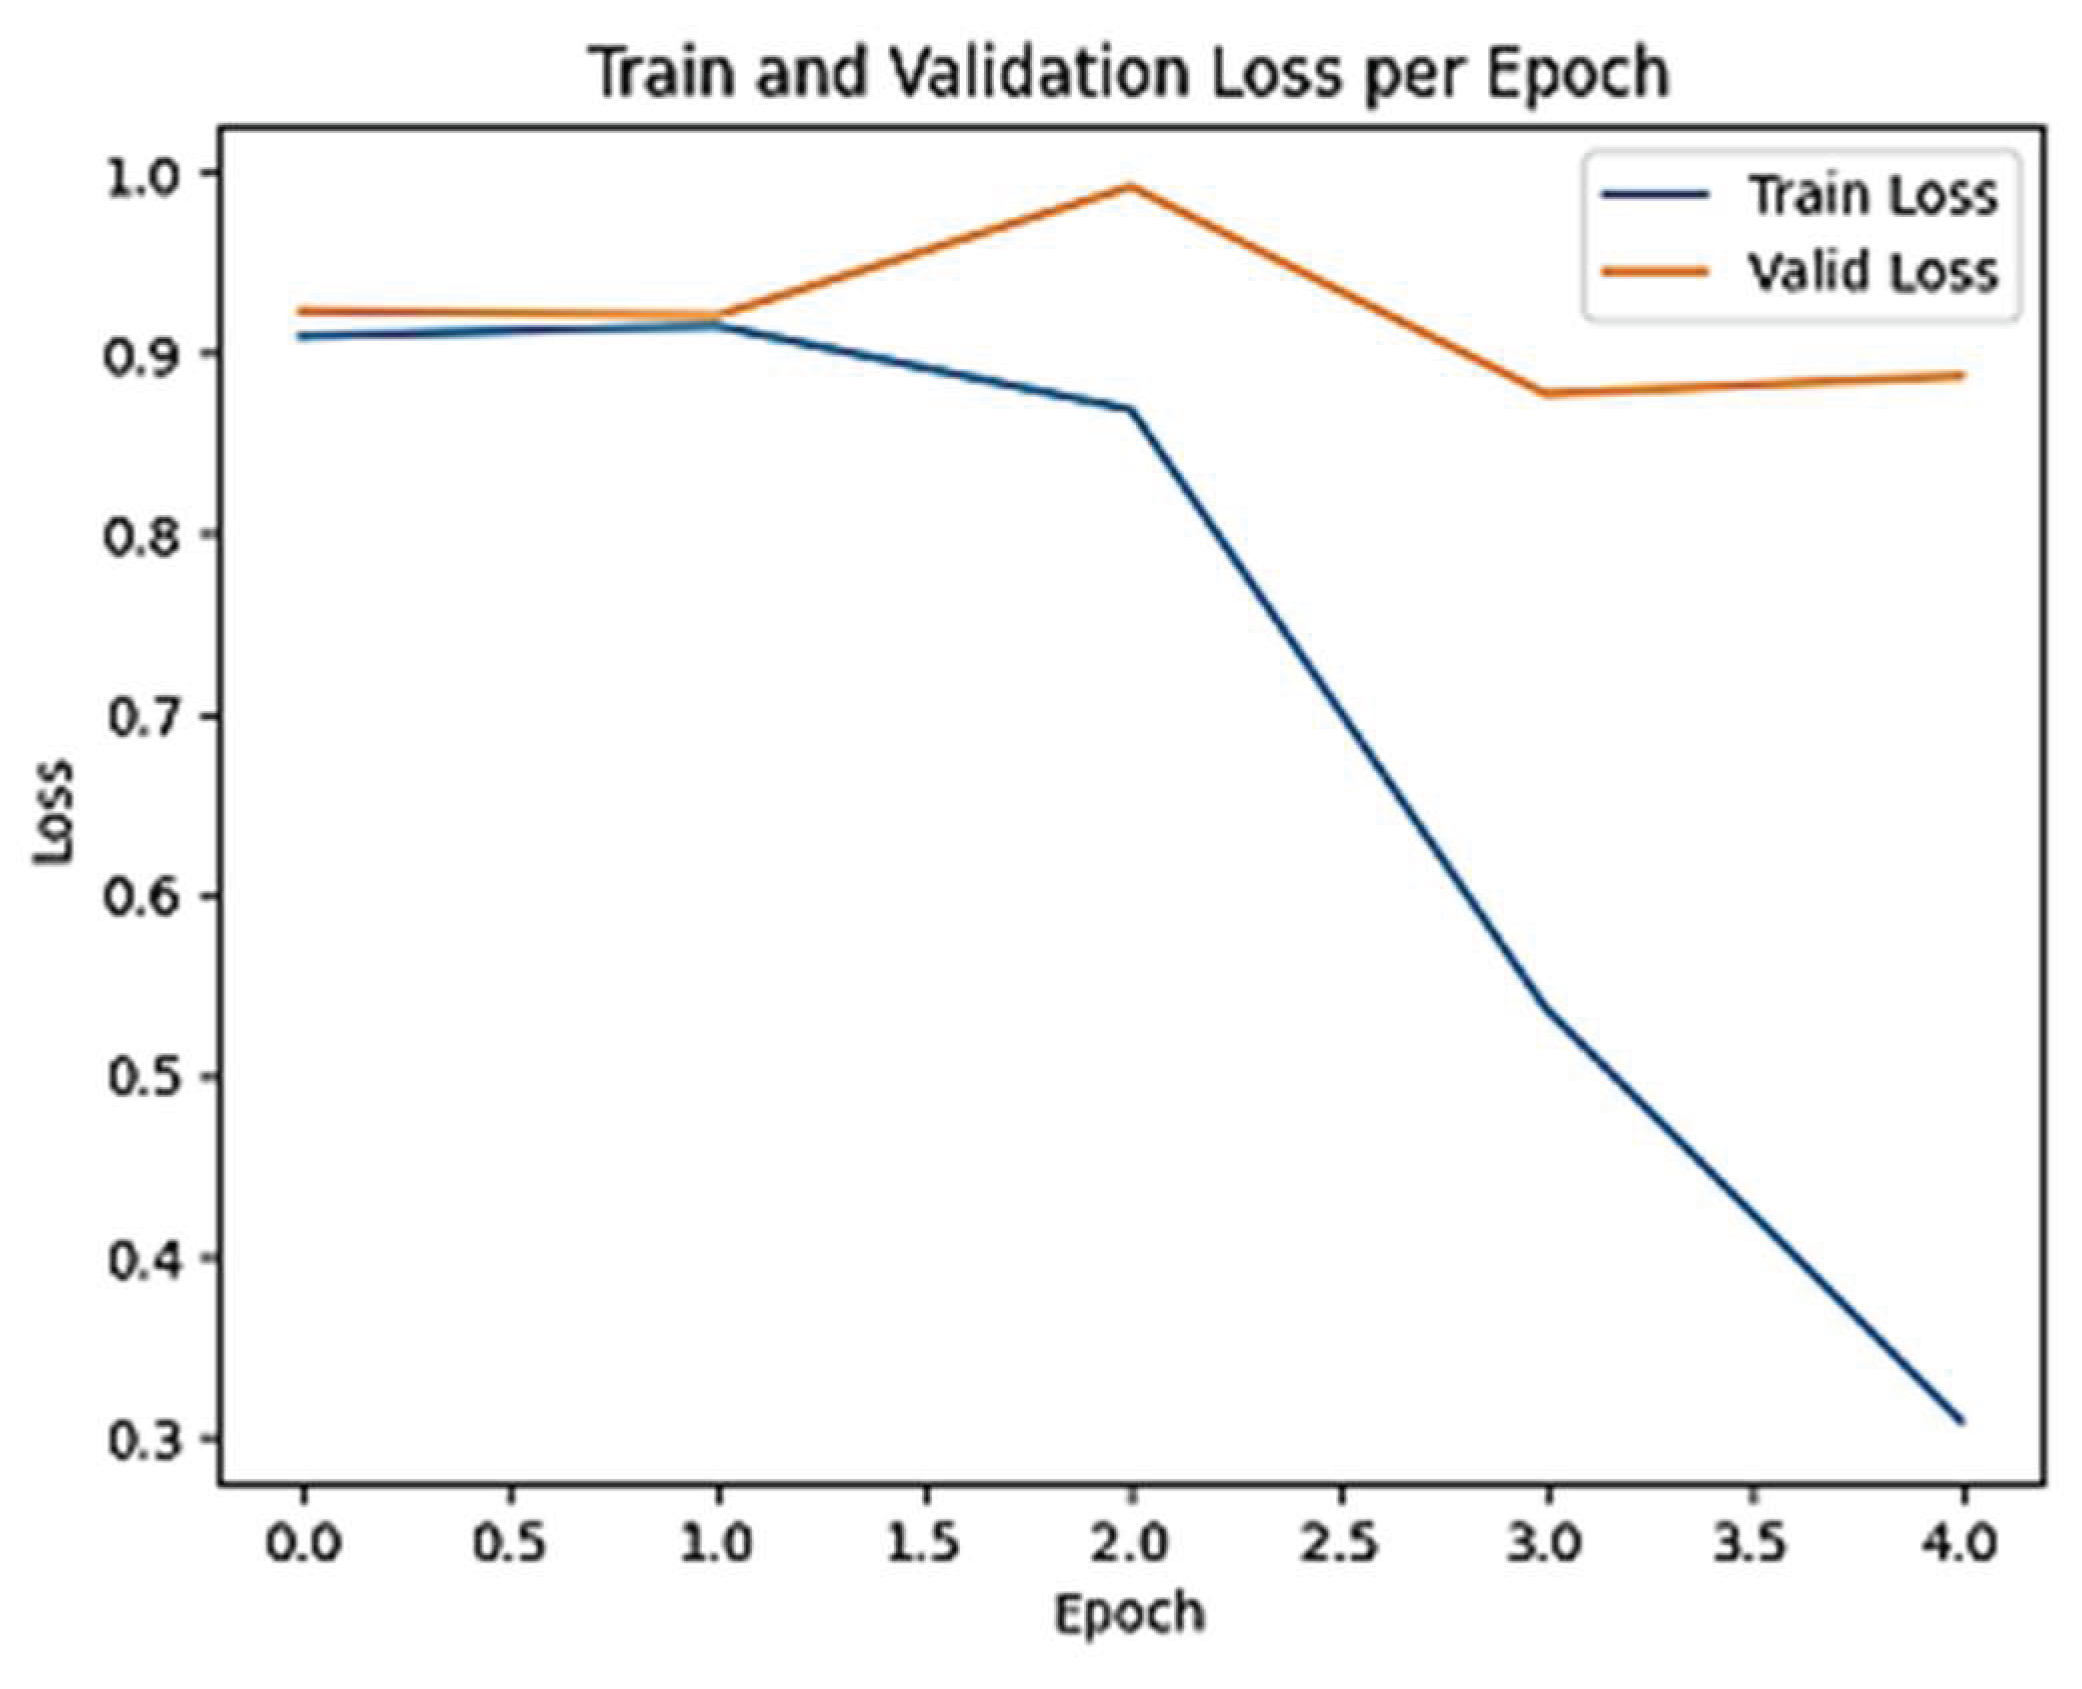
Figure 10.
Accuracy per Epoch using CNN.
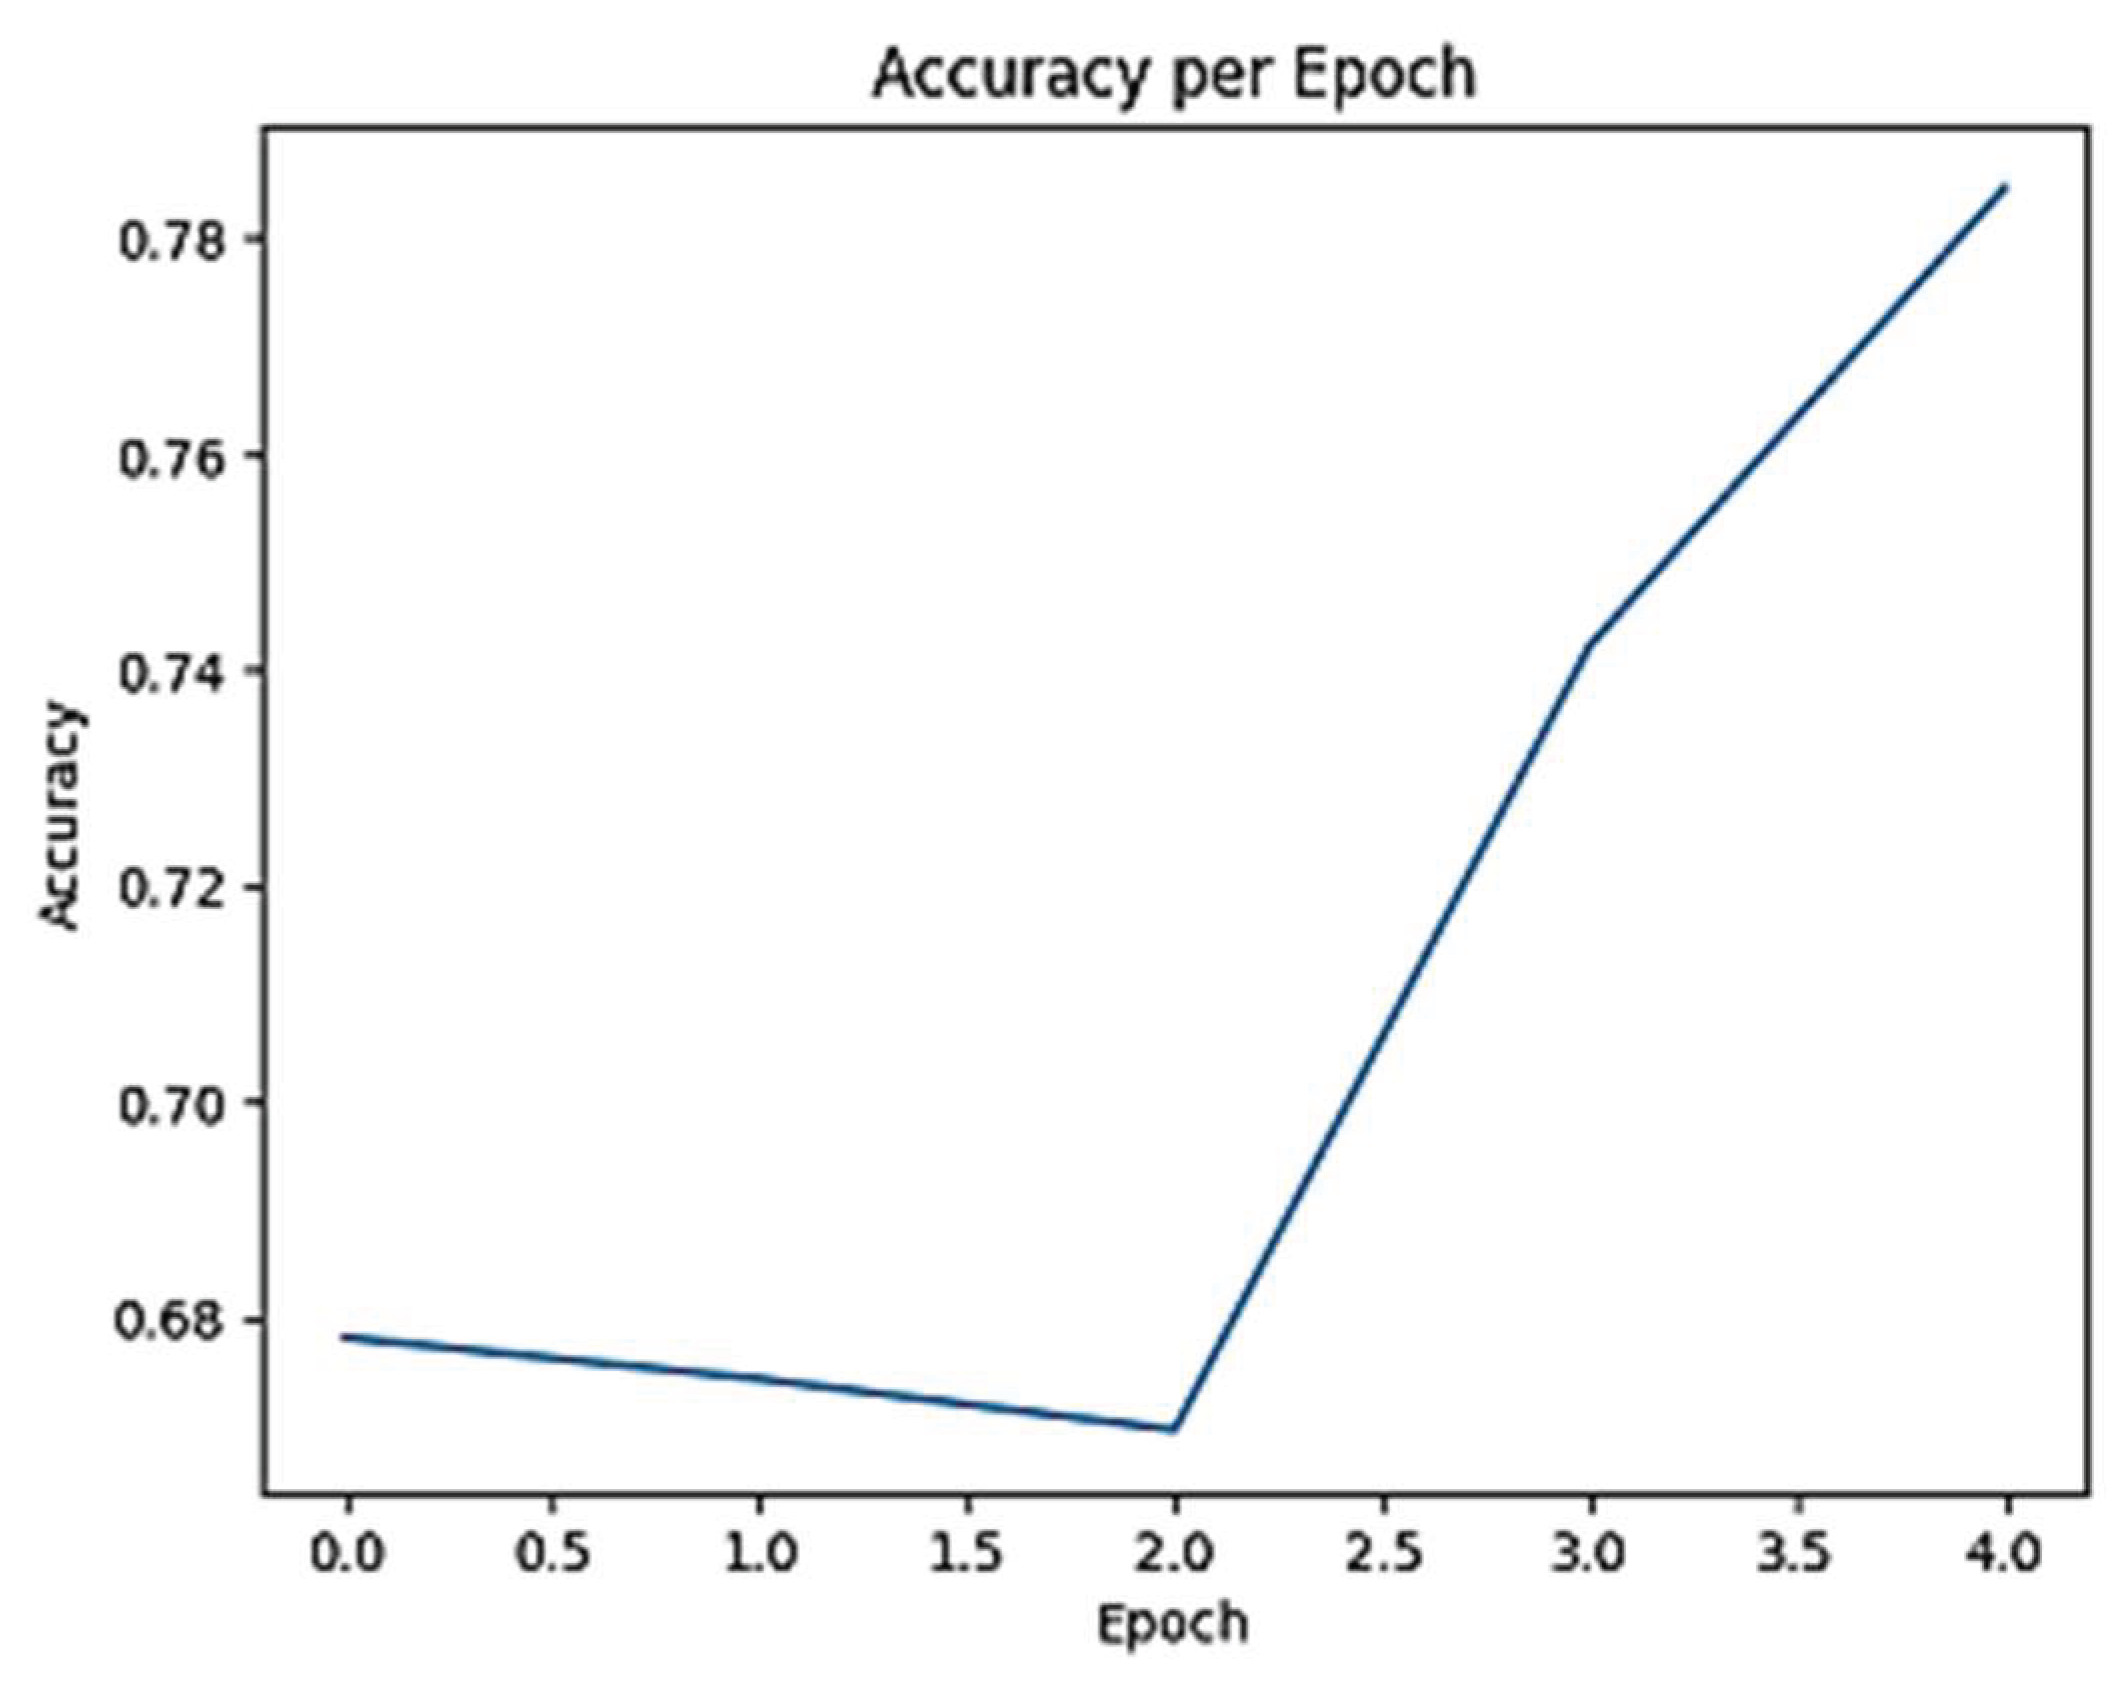
Figure 11.
Confusion matrix (CNN model performance).
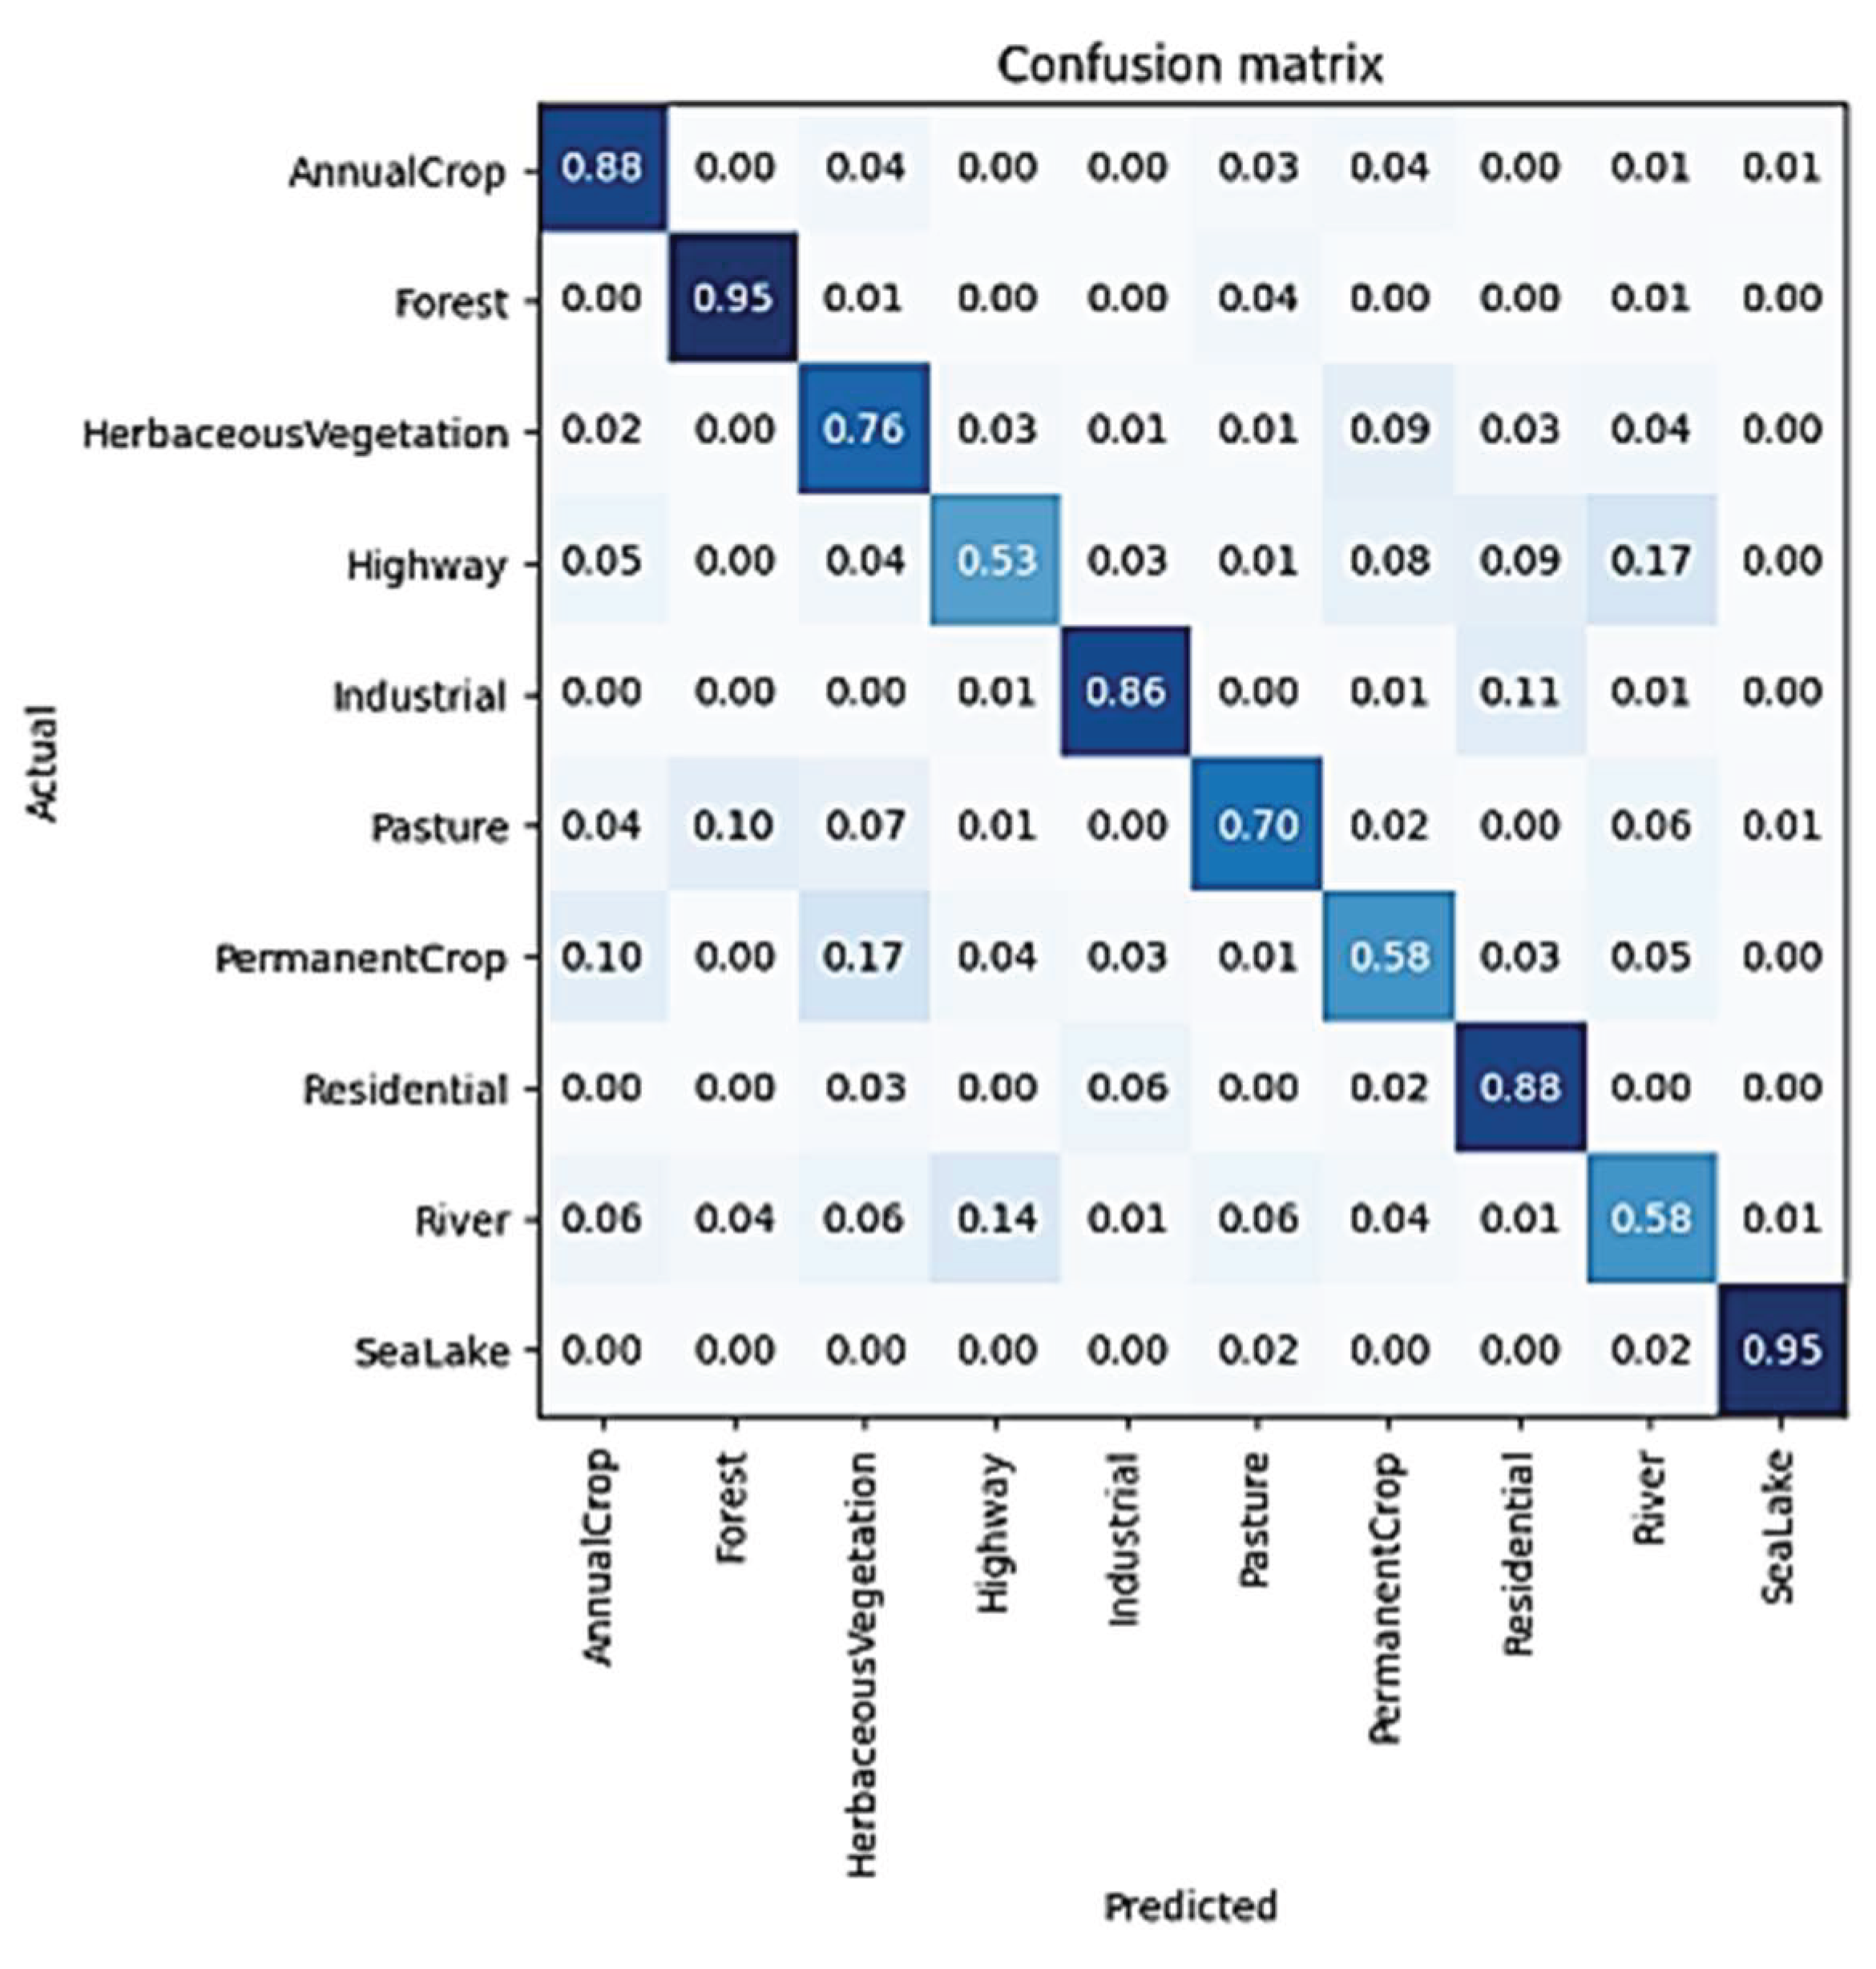
Figure 12.
Accuracy per Epoch using RESNET50 model.
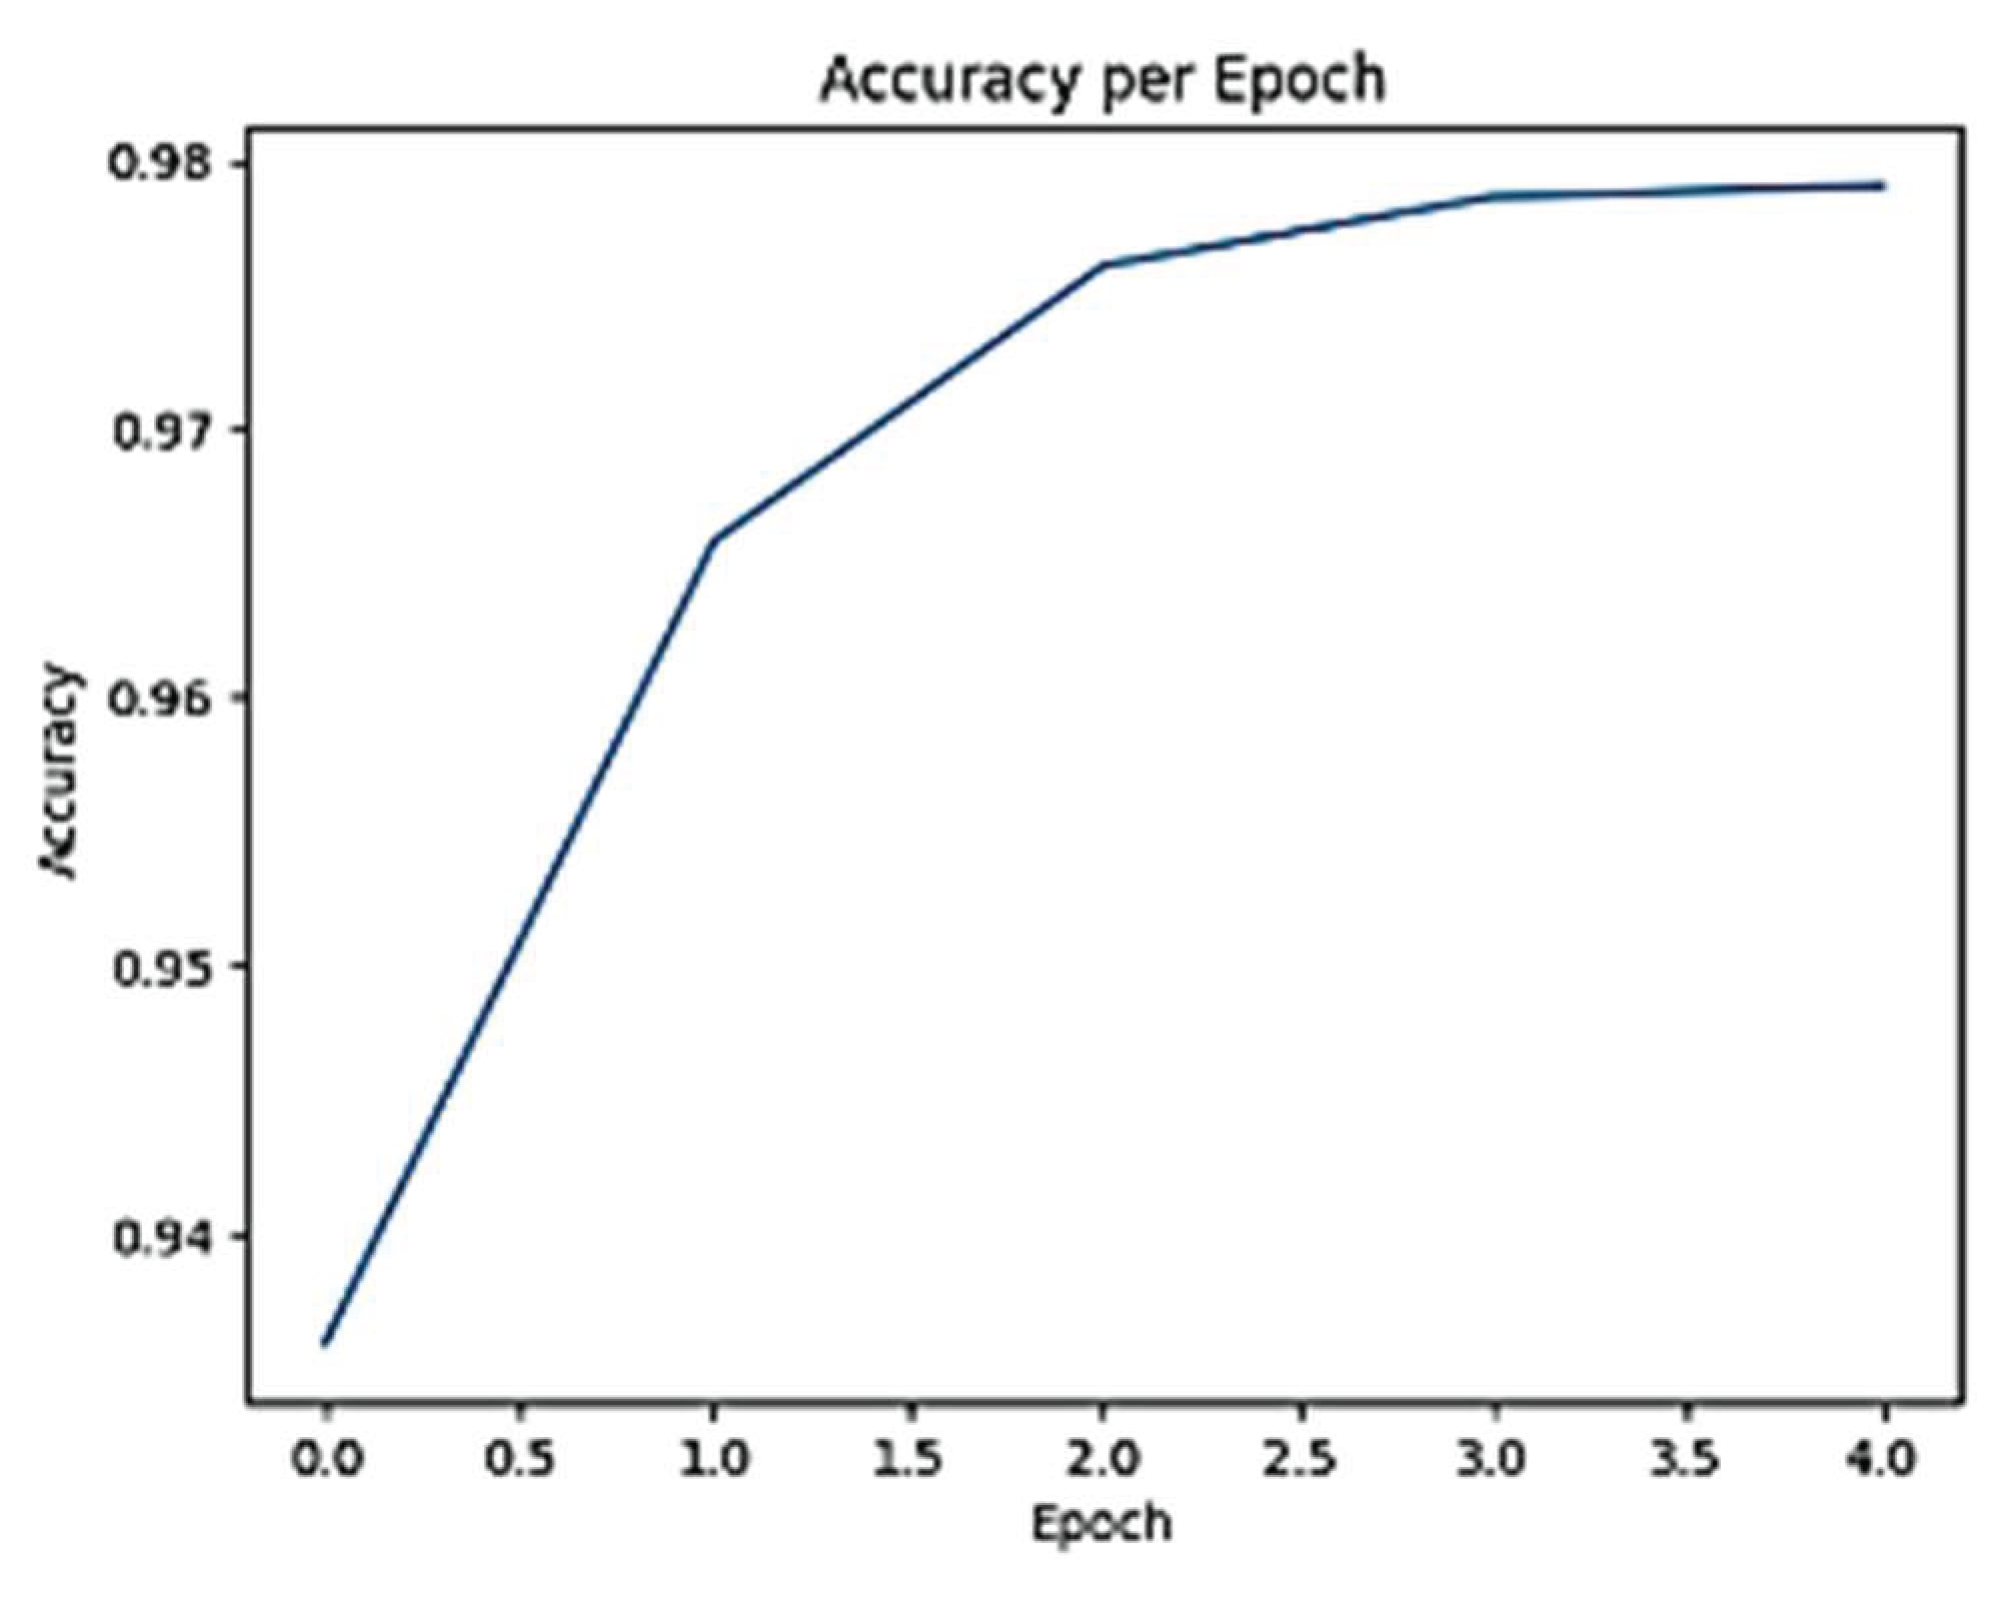
Figure 13.
Confusion matrix (RESNET50 model performance).
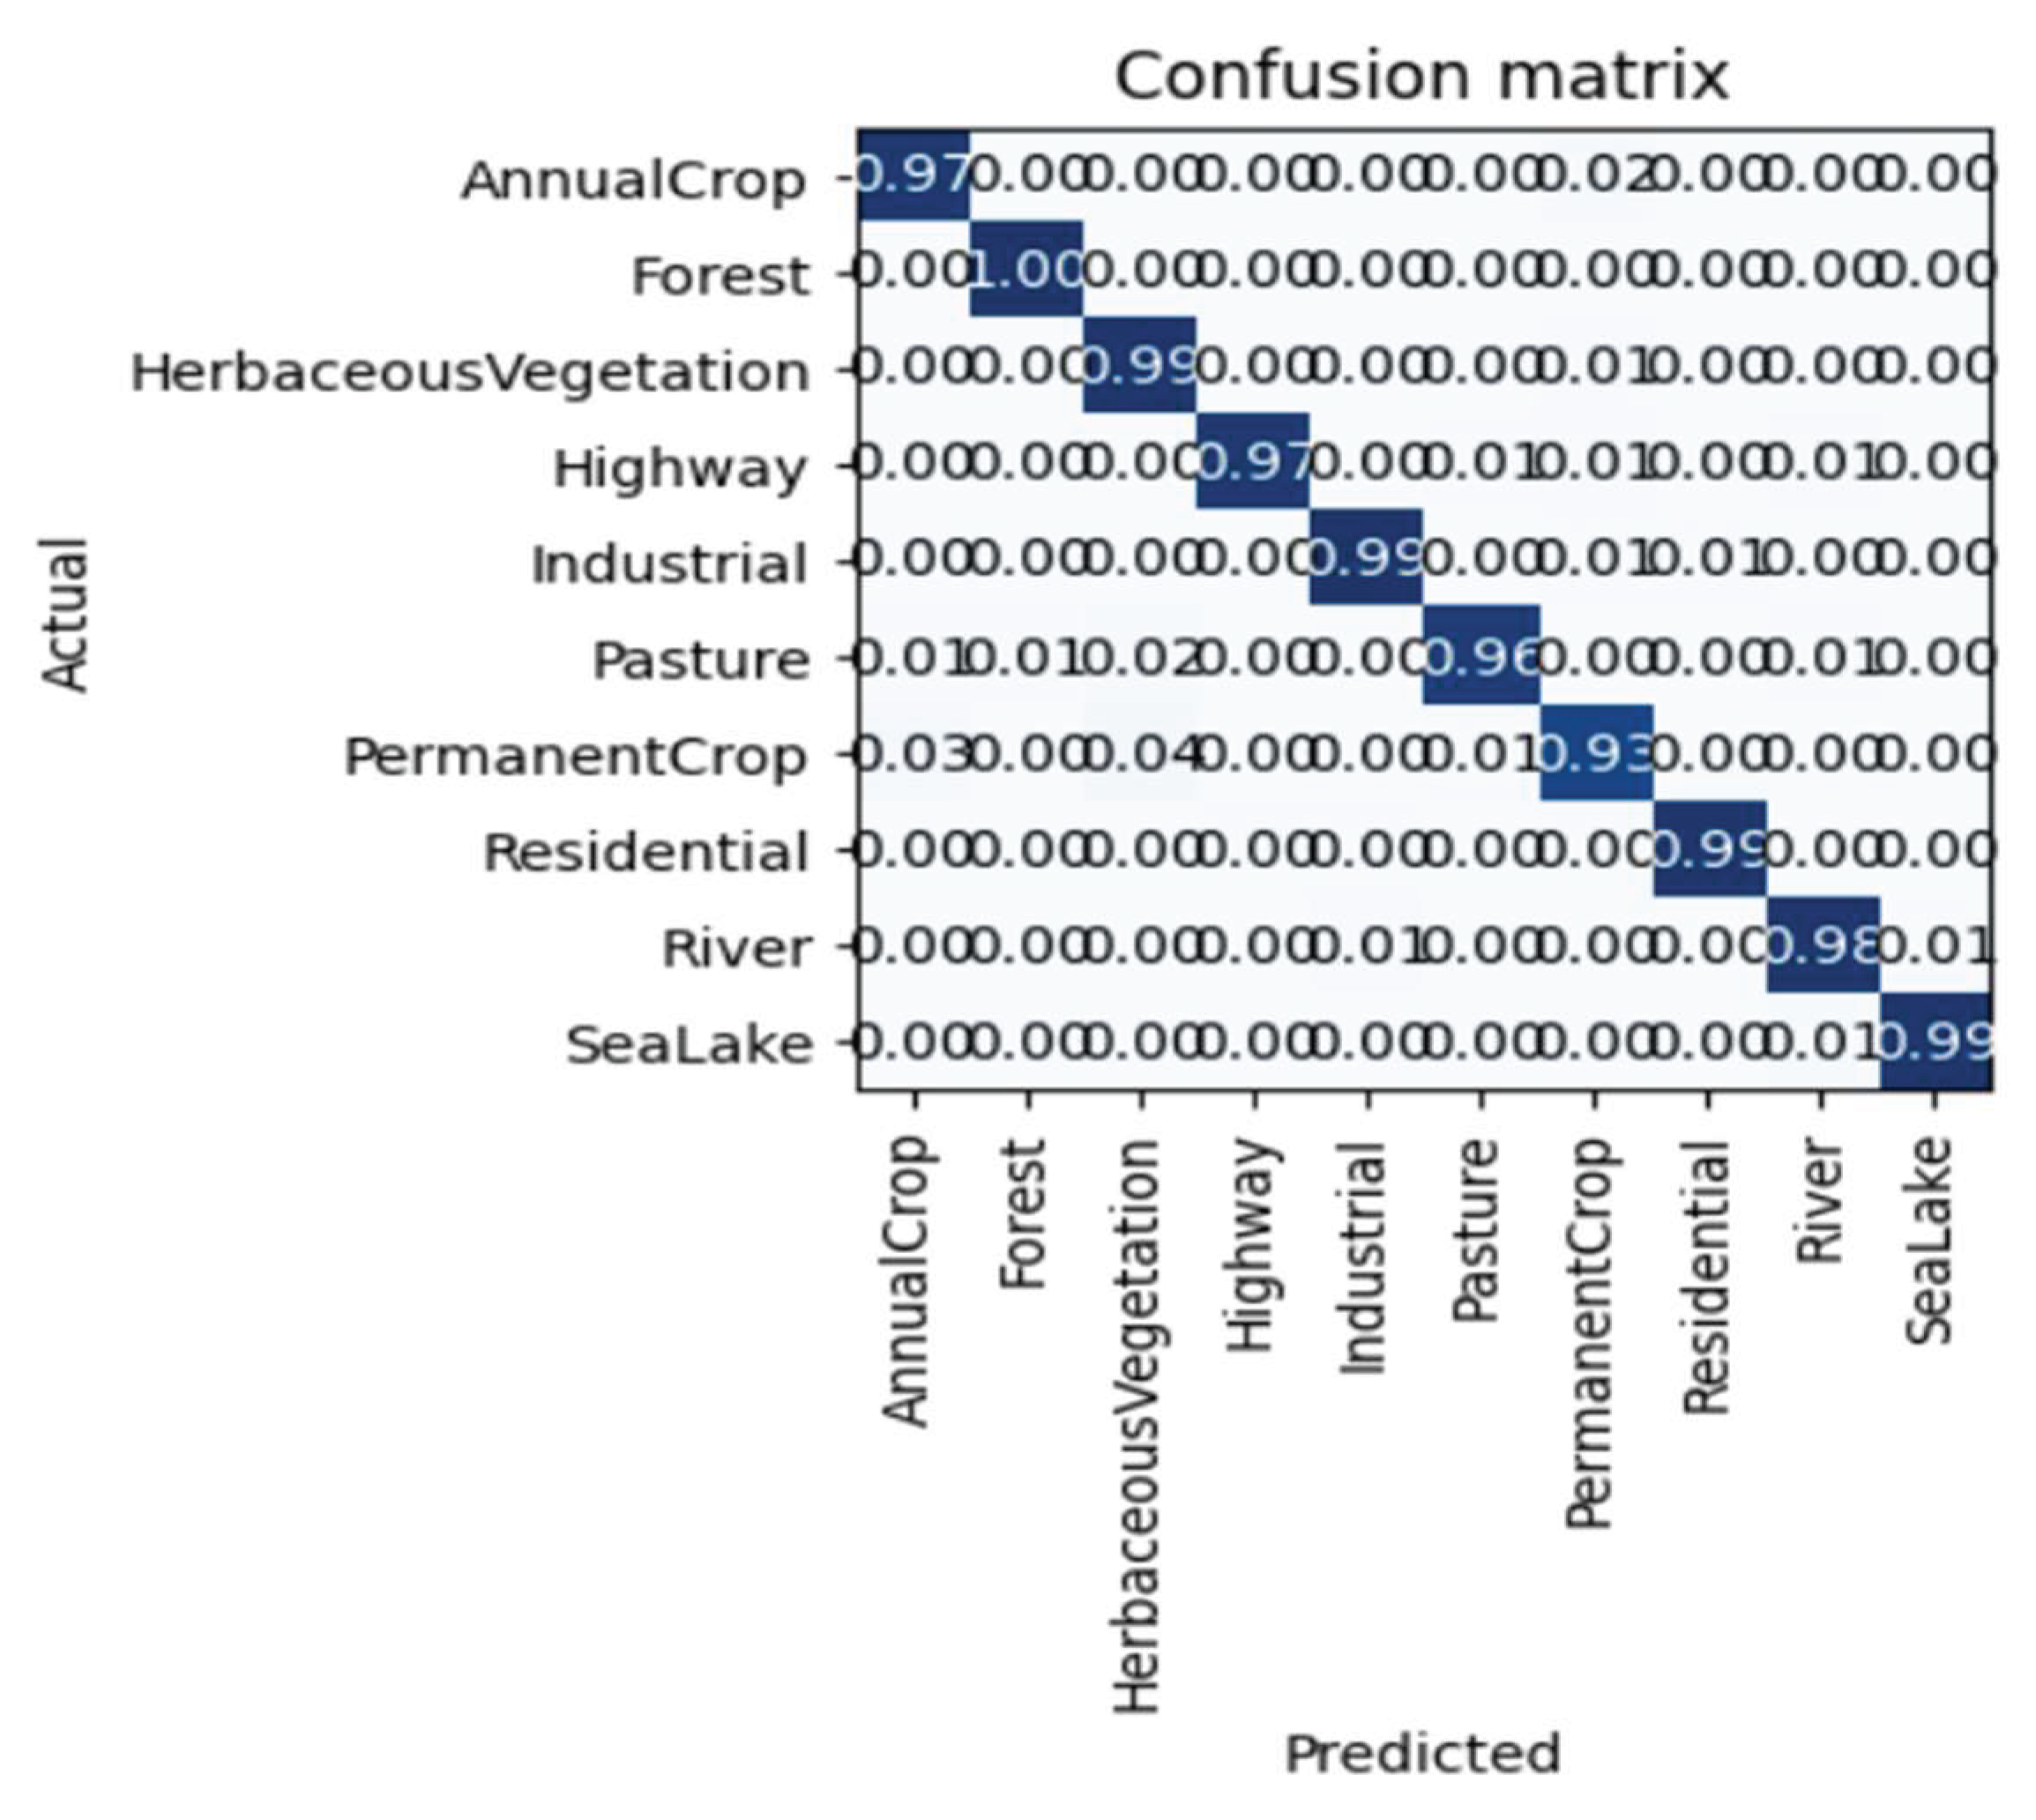

Table 1.
Sentinel satellite image characteristics.
|
Spatial resolution |
Bands number |
Wave lenght (nm) |
Electromagnetic spectrum |
|
10m |
2 | 496.6 | Blue |
| 3 | 560.0 | Green | |
| 4 | 664.5 | Red | |
| 8 | 835.1 | NIR | |
| 20m | 5 | 703.9 | Vegetation Red Edge |
| 6 | 740.2 | Vegetation Red Edge | |
| 7 | 782.5 | Vegetation Red Edge | |
| 8a | 864.8 | Vegetation Red Edge | |
| 11 | 1613.7 | SWIR | |
| 12 | 2202.4 | SWIR | |
| 60m | 1 | 443.9 | Coastal aerosol |
| 9 | 945.0 | Water vapour | |
| 10 | 1373.5 | SWIR-Cirrus |
Table 2.
Pléiade satellite images characteristics.
|
Panchromatique (PA) |
Multispectral (MS) |
Bundle (P+MS) |
Pansharpend (PMS) |
|
50cm 1canal (black et white) |
2m 4canals (B, G, R, NIR) |
50 cm et 2 m P 50 cm 1 canal MS : 2 m 4 canals |
Fusionned product 50 cm Pansharpened 3 canals natural colors or false colors or Pansharpened 4 canals |
Table 3.
results comparison.
 |
Disclaimer/Publisher’s Note: The statements, opinions and data contained in all publications are solely those of the individual author(s) and contributor(s) and not of MDPI and/or the editor(s). MDPI and/or the editor(s) disclaim responsibility for any injury to people or property resulting from any ideas, methods, instructions or products referred to in the content. |
© 2025 by the authors. Licensee MDPI, Basel, Switzerland. This article is an open access article distributed under the terms and conditions of the Creative Commons Attribution (CC BY) license (http://creativecommons.org/licenses/by/4.0/).
Copyright: This open access article is published under a Creative Commons CC BY 4.0 license, which permit the free download, distribution, and reuse, provided that the author and preprint are cited in any reuse.


