Submitted:
04 June 2025
Posted:
05 June 2025
You are already at the latest version
Abstract
Forest musk deer (Moschus berezovskii), one of the world's most endangered ruminants, faces extinction risks, with captive populations additionally threatened by prevalent diseases including digestive and immune disorders. This study employed comparative metagenomic sequencing to analyze intestinal microbiota structure and function between wild populations in Chongqing and Hunan and captive individuals. Wild musk deer exhibited a Pseudomonadota-dominated gut microbiota (significantly higher than captive), enriched in lignin-degrading genera Novosphingobium and Acinetobacter. In contrast, captive groups showed increased abundances of Firmicutes/Bacteroidota, with abnormal proliferation of Escherichia and Clostridium. Alpha and beta diversity analyses revealed significant differences in gut microbial community composition among the three groups, with wild cohorts exhibiting higher diversity than captive groups. Although substantial disparities in microbial abundance existed between the two wild populations due to differential vegetation in their habitats, convergence was observed in core microbial diversity and carbohydrate metabolic functions. Functional analyses have revealed significant divergences in metabolic pathways,Captive deer microbiota was enriched in translation and glycan metabolism pathways, while wild populations exhibited superior enrichment in immune regulation and environmental sensing pathways. This research provides a theoretical foundation for optimizing wild conservation strategies and developing scientifically informed feeding regimens for captive Moschus berezovskii.
Keywords:
forest musk deer (moschus berezovskii)
; gut microbiota
; metagenomic sequencing
; geographical divergence
; endangered species conservation
1. Introduction
Gut microbiota, often regarded as the host’s “second genome,” profoundly influence ecological adaptation and evolutionary trajectories through mechanisms such as nutrient metabolism regulation [1], immune homeostasis maintenance[2], and growth modulation[3]. Adaptive shifts in gut microbial communities may serve as critical indicators of population survival status[4]. In ruminants, the efficient decomposition of high-fiber plant material relies on a specialized digestive system driven by synergistic interactions between the rumen and gut microbiota[5]. Current research highlights that multidimensional ecological factors—including geographic isolation[6], dietary habits[7], and habitat vegetation types[8]—collectively shape the structural characteristics of wildlife gut microbiota, with dietary drivers often exerting dominant effects[9].
The intervention of captive domestication on gut microbiota has garnered significant attention in endangered species conservation. For instance, captive giant pandas (Ailuropoda melanoleuca) exhibit reduced gut microbial diversity and diminished abundance of cellulose-degrading bacteria compared to wild counterparts [10]. Similarly, captive Przewalski’s horses (Equus ferus) display lower gut microbial richness, reduced metabolic gene abundance, and heightened zoonotic disease risks relative to wild populations[11]. These findings suggest that artificial environments, constrained by dietary monotony and limited activity ranges, may lead to irreversible declines in core functional microbial taxa[12]. Geographic variation also plays a pivotal role in shaping wildlife gut microbiota. A systematic analysis of 29 African chimpanzee (Pan troglodytes) populations revealed that geographic divergence, mediated by host genetic backgrounds, vegetation composition, and tool-use-associated dietary differences, drives significant microbial community differentiation across regions [13]. Comparative studies of captive Asian black bears (Ursus thibetanus) in Sichuan, Yunnan, and Heilongjiang provinces further demonstrated geographic-driven divergence in gut microbial diversity, dominant taxa, and community structure, implicating latitude-associated climatic factors in host-microbe coevolution[14].
The forest musk deer (Moschus berezovskii), a small ungulate endemic to East Asia, is classified as a National Grade I Protected Species in China and listed as endangered under CITES Appendix II and the IUCN Red List[15,16]. Its unique musk secretion capability and alpine shrubland habitat have fostered gut microbiota with exceptional secondary metabolite conversion capacities, conferring high ecological, scientific, and economic value[17,18]. However, rampant poaching and habitat degradation have precipitated severe population declines, pushing this species toward extinction[19]. Existing research predominantly focuses on disease prevention, musk secretion mechanisms, and genetic diversity[20,21,22], while knowledge gaps persist regarding wild population geographic variability and microbial functional remodeling during captivity. This study employs metagenomic sequencing to compare gut microbiota between wild and captive Moschus berezovskii populations in Chongqing and Hunan. The findings will provide microbiome-level insights to guide habitat management for wild populations and refine captive breeding protocols, offering critical implications for conservation practices.
2. Materials and Methods
2.1. Sample Collection
This study adhered strictly to non-invasive sampling protocols, with all fecal samples collected from naturally excreted feces of Moschus berezovskii without animal trapping, sedation, or direct contact. Wild samples were obtained from the Jinfo Mountain National Nature Reserve in Chongqing (Wild Group W1: 107°03′–107°26′E, 28°46′–29°30′N, n=8) and the Huping Mountain National Nature Reserve in Hunan (Wild Group W2: 110°29′–110°59′E, 29°58′–30°08′N, n=8). Sampling protocols for wild populations included two criteria: (1) selection of fresh, large fecal pellets to ensure collection from adult individuals; and (2) spatial separation of samples by >500 m to minimize home-range overlap (2.8–7 hm² per individual), thereby guaranteeing distinct host origins[23]. Captive samples were collected from Yongshun Mingfa Musk Deer Farm in Xiangxi, Hunan (Captive Group C: 110°58′E, 29°01′N, n=8), where semi-open enclosures with individual resting pens were maintained. Fresh fecal samples from captive individuals were collected during morning cleaning routines. All samples were immediately transferred into sterile cryovials preloaded with 80% ethanol (pre-cooled to -20°C) using aseptic gloves within 30 minutes post-collection, transported under cold chain conditions (4°C), and stored at -80°C until analysis.
2.2. DNA Extraction and Quality Control
Total genomic DNA was extracted from fecal samples using the TIANamp Stool DNA Kit (TIANGEN, China) following manufacturer protocols. DNA integrity was assessed via 1% agarose gel electrophoresis to verify absence of degradation and contaminants. Purity was quantified using a NanoDrop 2000 spectrophotometer (IMPLEN, USA) for absorbance ratios, while concentrations were determined via Qubit® 2.0 Fluorometer with the Qubit® dsDNA HS Assay Kit (Thermo Fisher Scientific, USA).
2.3. Library Preparation and Sequencing
Genomic DNA (1 μg per sample) was fragmented into ~350 bp inserts using a Covaris ultrasonicator (Covaris, USA). Libraries were constructed with the NEB Next® Ultra™ DNA Library Prep Kit (NEB, USA) through end repair, adapter ligation, size selection, and PCR amplification. Library quality was verified by Agilent 2100 Bioanalyzer (Agilent, USA) for insert size distribution and quantified via qPCR (effective concentration >3 nM). Paired-end sequencing (2×150 bp) was performed on the Illumina NovaSeq 6000 platform at Novogene Bioinformatics Technology Co., Ltd. (Tianjin, China). Raw sequencing data were deposited in the NCBI Sequence Read Archive under accession PRJNA1242249.
2.4. Bioinformatic Analysis
2.4.1. Data Preprocessing
Raw reads were filtered using fastp (https://github.com/OpenGene/fastp ) with three criteria: (a) removal of read pairs with adapter contamination; (b) exclusion of sequences with >50% low-quality bases (Q≤5); and (c) elimination of reads containing ≥10% ambiguous N bases. Potential host DNA contamination was mitigated by aligning reads to the musk deer reference genome using Bowtie2 (http://bowtie-bio.sourceforge.net/bowtie2/index.shtml ; parameters: --end-to-end, --sensitive, -I 200, -X 400)[24,25]. Clean data were validated via FastQC for downstream analyses.
2.4.2. Metagenomic Assembly and Gene Catalog Construction
Clean data were assembled using MEGAHIT (--presets meta-large) to optimize microbial community reconstruction. Scaffolds were fragmented at N-base junctions into non-overlapping scaftigs (≥500 bp)[26]. Open reading frames (ORFs) were predicted via MetaGeneMark (http://topaz.gatech.edu/GeneMark/), with sequences <100 nt discarded[27]. Redundant genes were clustered at 95% similarity using CD-HIT (-c 0.95, -G 0, -aS 0.9, -g 1, -d 0) to generate a non-redundant gene catalog[28]. Gene abundance was calculated by mapping clean reads to the catalog using Bowtie2, retaining genes with ≥2 reads[29]. Core-pan gene analysis, inter-sample correlations, and Venn diagram generation were conducted based on gene abundance profiles.
2.4.3. Metagenomic Assembly and Gene Catalog Construction
Taxonomic annotation was performed using DIAMOND software (https://github.com/bbuchfink/diamond/ ; parameters: blastp, -e 1e-5) to align non-redundant gene sets (unigenes) against the Micro_NR database, which integrates bacterial, fungal, archaeal, and viral sequences from the NCBI NR database (https://www.ncbi.nlm.nih.gov/ ) to comprehensively capture environmental microbial diversity [30,31]. MEGAN’s LCA algorithm (https://en.wikipedia.org/wiki/Lowest_common_ancestor ) assigned taxonomic ranks from phylum to species, with abundances derived from annotated gene counts[31]. α-diversity indices (Shannon, Ace, Chao1, Simpson) were compared across groups via Kruskal-Wallis tests. β-diversity was assessed using unweighted/weighted UniFrac distances visualized via PCoA and heatmap clustering. Differentially abundant taxa and pathways were identified via MetaGenomeSeq and LEfSe (LDA≥2)[32]. Predictive biomarkers were selected using RandomForest (R packages pROC and randomForest, v2.15.3)[33]. Functional annotation employed DIAMOND against KEGG, with pathway abundances normalized to gene counts[34]. Metabolic pathway variations were evaluated using LEfSe and MetaGenomeSeq.
3. Results
3.1. Gut Microbial Community Composition
Metagenomic sequencing analysis of 24 fecal samples from forest musk deer (Moschus berezovskii) generated 201.03 Gb of raw data via the Illumina platform. After quality control, 198.49 Gb of high-quality sequences were retained (average Q20: 98.65%, Q30: 96.08%, GC content: 55.29%, effective sequence rate: 98.73%). Sequencing depth reached saturation (rarefaction curve shown in Figure S1), meeting the requirements for subsequent analyses (detailed sequencing quality control data are provided in Table S1). At the phylum level (Figure 1a), the dominant phyla in the gut microbiota of Chongqing wild forest musk deer were Pseudomonadota (50.78 ± 0.22%), Bacillota (15.69 ± 0.22%), Actinomycetota (10.29 ± 0.05%), Bacteroidota (5.93 ± 0.04%), and Myxococcota (1.07 ± 0.02%). In Hunan wild forest musk deer, the predominant phyla were Pseudomonadota (51.60 ± 0.22%), Bacillota (6.12 ± 0.13%), Bacteroidota (5.87 ± 0.03%), Myxococcota (5.36 ± 0.08%), and Acidobacteriota (2.86 ± 0.02%). For captive forest musk deer, the dominant phyla included Bacillota (32.12 ± 0.24%), Pseudomonadota (29.26 ± 0.29%), Actinomycetota (6.91 ± 0.07%), Bacteroidota (4.09 ± 0.03%), and Candidatus Saccharibacteria (1.03 ± 0.01%).
At the genus level (Figure 1b), the gut microbiota of Chongqing wild forest musk deer was dominated by Acinetobacter (11.37 ± 0.19%), Novosphingobium (3.88 ± 0.06%), Comamonas (1.71 ± 0.03%), Stenotrophomonas (1.51 ± 0.04%), and Sphingopyxis (1.37 ± 0.02%). In Hunan wild forest musk deer, the predominant genera were Novosphingobium (3.62 ± 0.04%), Mesorhizobium (3.58 ± 0.06%), Acinetobacter (2.75 ± 0.06%), Sphingomonas (2.38 ± 0.03%), and Luteimonas (1.41 ± 0.02%). Captive forest musk deer exhibited dominance by Acinetobacter (8.4 ± 0.12%), Escherichia (3.62 ± 0.05%), Clostridium (2.70 ± 0.02%), Enterococcus (1.87 ± 0.03%), and Stenotrophomonas (1.06 ± 0.03%). Venn diagram analysis (Figure 1c) revealed that wild forest musk deer (Chongqing and Hunan groups) harbored more unique microbial species than the captive group. The Hunan wild group had a greater number of unique species compared to the Chongqing wild group, and the shared species between Chongqing and Hunan wild groups far exceeded those shared between wild and captive groups.
3.2. Comparative Analysis of Gut Microbial Diversity and Differences
Systematic analysis of α-diversity (ACE, Chao1, Shannon, and Simpson indices) and β-diversity metrics was conducted to evaluate the diversity and community evenness of gut microbiota across the three groups (The statistical results of Alpha diversity analysis are provided in Table S2). The Goods-coverage index for all samples exceeded 0.99 (Table S2), confirming the representativeness of the sequencing data. Results (Figure 2a) demonstrated that wild groups (W1, W2) exhibited significantly higher ACE and Chao1 indices than the captive group (C), indicating superior species richness in wild individuals. While ACE indices differed significantly between Chongqing and Hunan wild groups, Shannon and Simpson indices showed no significant variation, suggesting divergent microbial community abundances but convergent species diversity between the two wild groups.
Principal Coordinate Analysis (PCoA) (Figure 2b) revealed significant β-diversity differences among the three groups. The captive group (C) was distinctly separated from both wild groups (W1, W2) along the PCoA1 axis, reflecting substantial divergence in gut microbiota between captive and wild individuals. Regional separation was also observed between Chongqing (W1) and Hunan (W2) wild groups, indicating geographical influences on microbial composition.
Cluster analysis of the top 12 relatively abundant taxa with significant intergroup differences was visualized via heatmap (Figure 2c). MetaGenomeSeq and Kruskal-Wallis rank-sum tests identified differentially abundant species. Boxplots (Figure 3) illustrated the distribution of the top 12 genera across groups. Wild groups (W1, W2) showed significantly higher abundances of Advenella, Brevundimonas, Chitinophaga, Oerskovia, Hydrogenophaga, Microbacterium, Mesorhizobium, Novosphingobium, and Sphingopyxis compared to the captive group (C) (P < 0.05). In contrast, Clostridium, Enterococcus, and Glutamicibacter were enriched in the captive group (P < 0.05). Microbacterium abundance differed significantly between Chongqing (W1) and Hunan (W2) wild groups (P < 0.05).
3.3. Functional Composition of Gut Microbiota
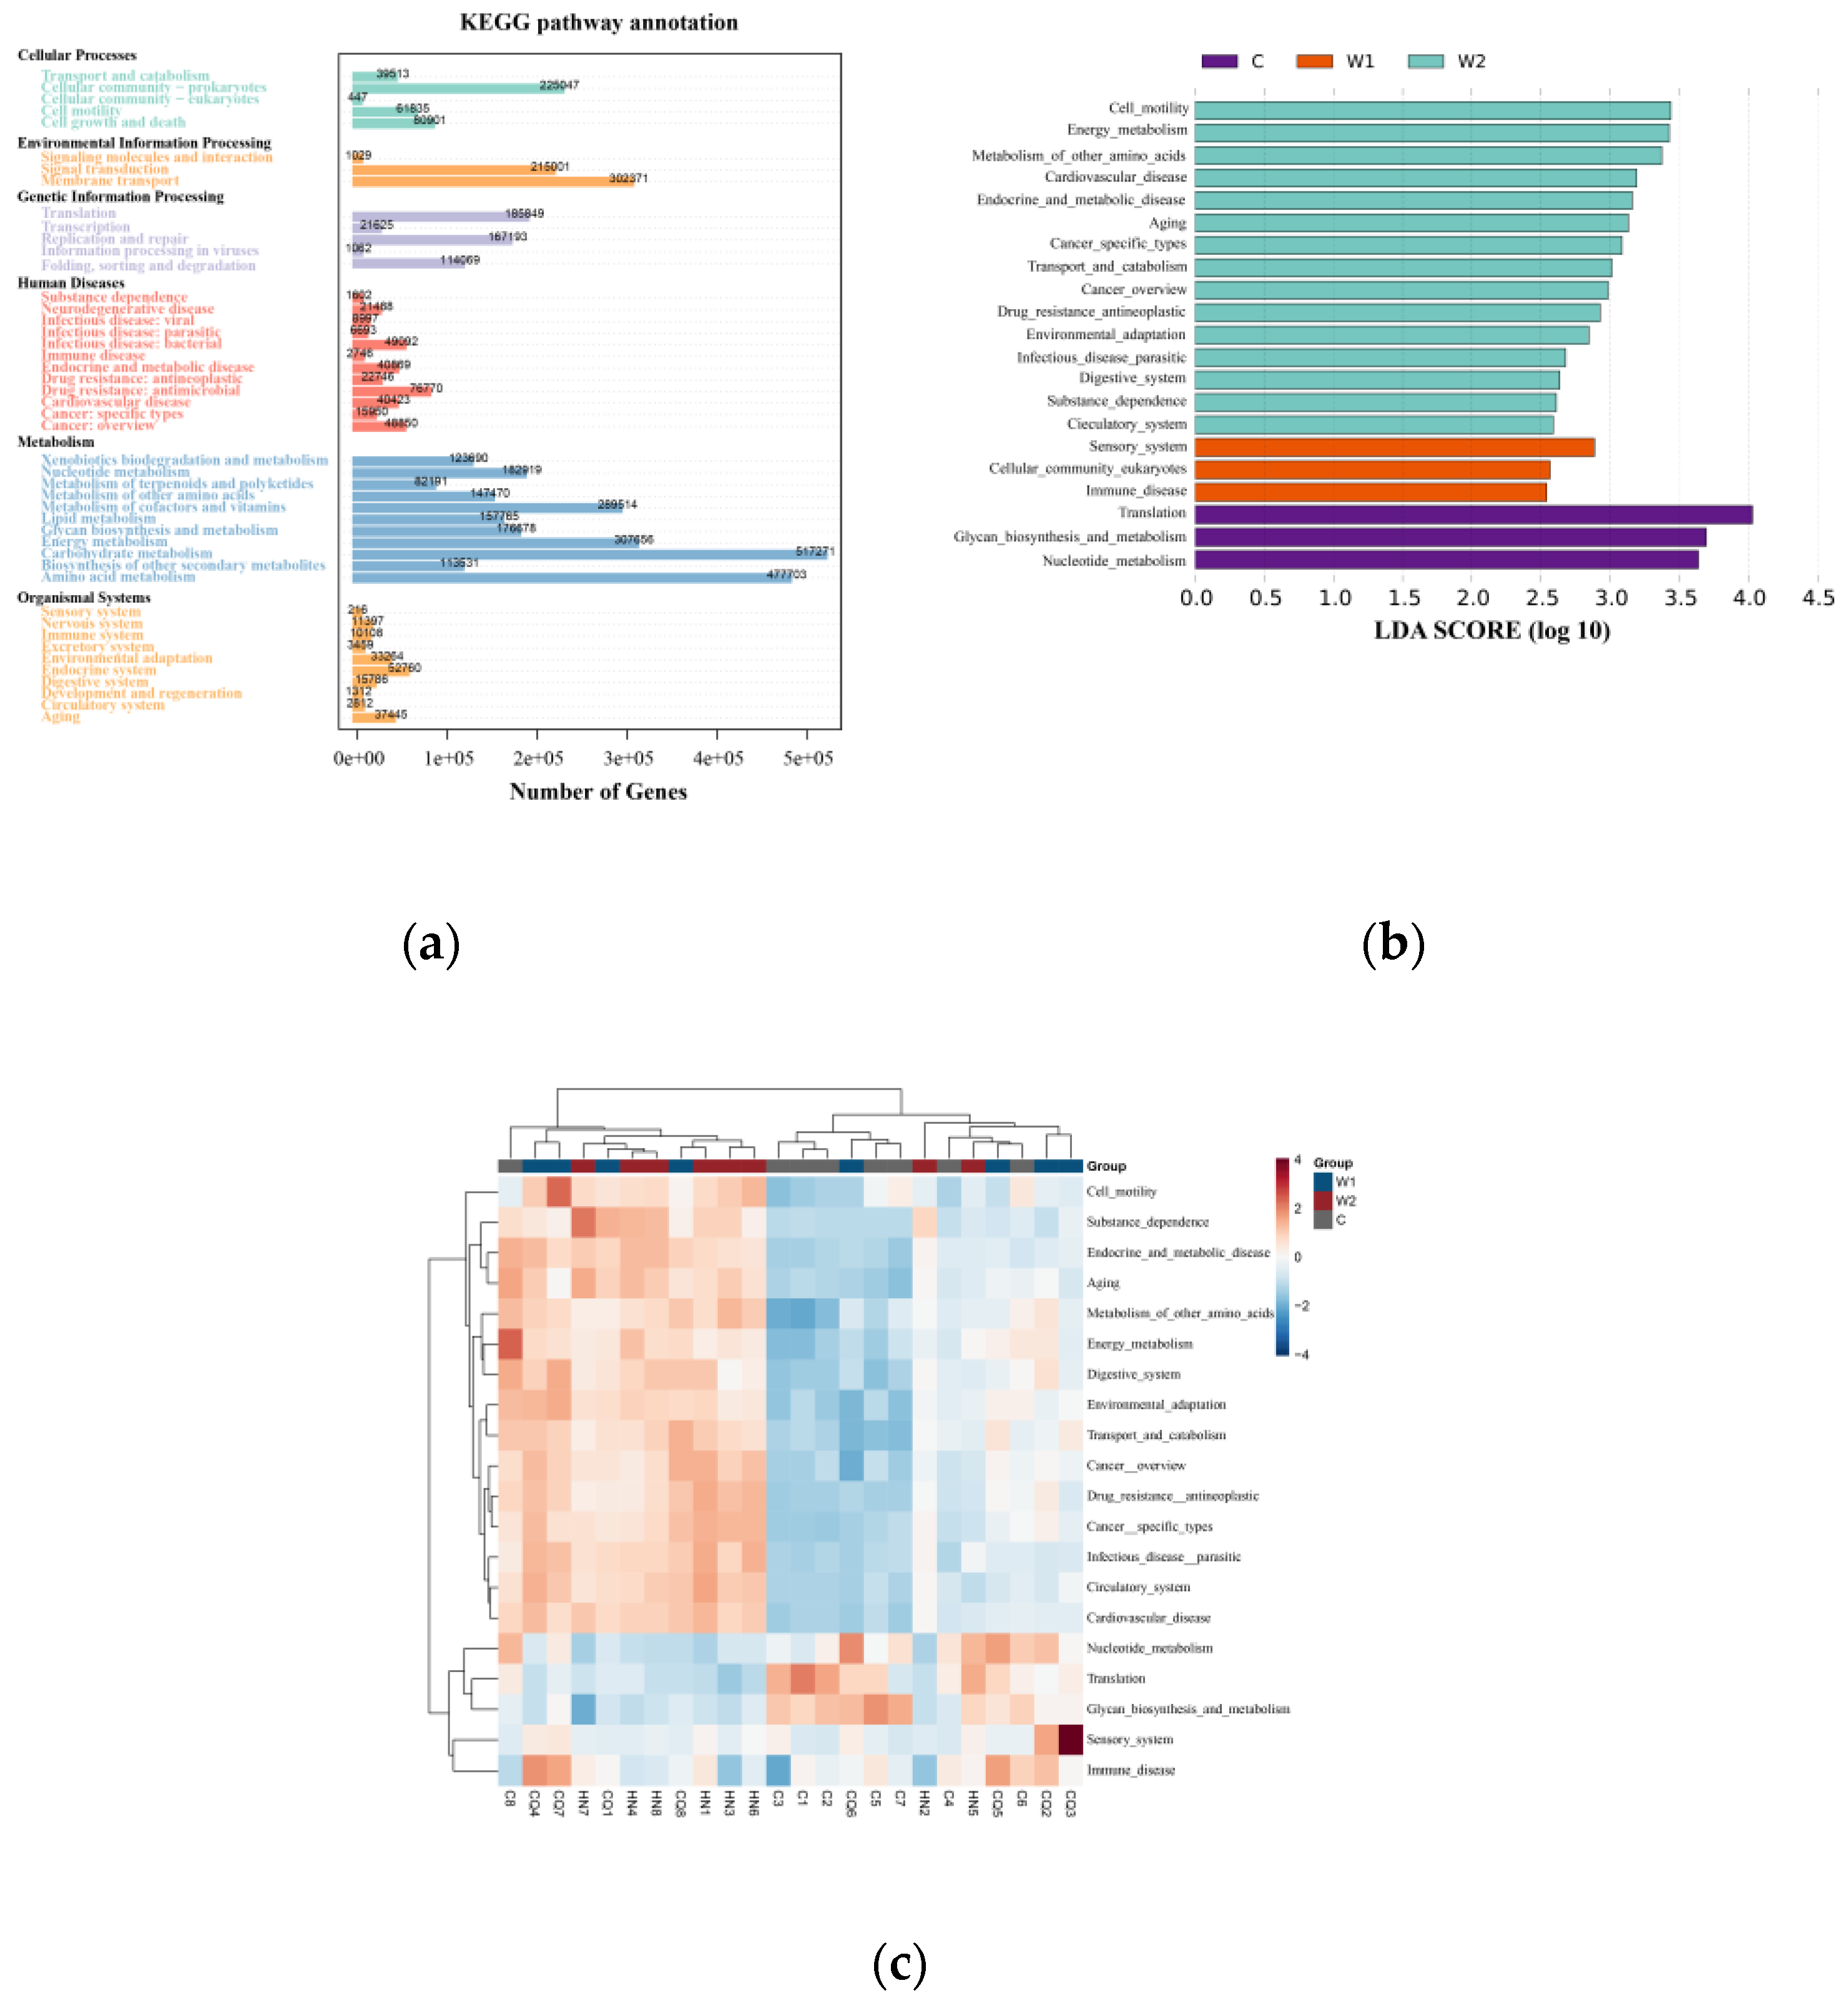
KEGG database annotation revealed that functional genes of the gut microbiota were primarily distributed across six core metabolic hierarchies. Metabolism (57.3%) constituted the dominant functional module, with carbohydrate metabolism and amino acid metabolism playing central roles. Auxiliary modules included Environmental Information Processing (11.5%), Genetic Information Processing (10.9%), Cellular Processes (9.1%), Human Diseases (7.5%), and Organismal Systems (3.7%). LEfSe analysis (LDA ≥ 2, Figure 4B-C) highlighted group-specific functional pathways: Captive Group (C): Enriched in translation, glycan biosynthesis and metabolism, and nucleotide metabolism; Chongqing Wild Group (W1): Dominated by sensory systems, eukaryotic cellular communities, and immune system pathways; Hunan Wild Group (W2): Associated with cell motility, energy metabolism, metabolism of other amino acids, cardiovascular diseases, endocrine/metabolic diseases, and aging. Clustered heatmaps (Figure 4C) further visualized the abundance patterns of differential metabolic pathways across samples.
4. Discussion
This study compared the gut microbiota composition of wild forest musk deer (Moschus berezovskii) from Chongqing and Hunan with that of captive individuals using metagenomic data, revealing significant impacts of geographical factors and living environments on intestinal microbial structure. At the phylum level, the dominant phyla shared among the three groups were Pseudomonadota, Bacillota, and Bacteroidota. Wild groups exhibited higher Pseudomonadota abundance compared to the captive group, whereas Bacillota was more prevalent in captive individuals, aligning with previous findings on wild-captive microbiota divergence in forest musk deer[35]. Pseudomonadota in ruminant gut microbiota modulates host immune function through symbiotic metabolism, particularly via short-chain fatty acids (SCFAs) produced during high-fiber degradation. These SCFAs enhance intestinal barrier integrity, suppress inflammation, and improve energy extraction from low-nutrient vegetation[36,37]. Notably, Bacillota abundance differed between the two wild populations (W1: 15.69% vs. W2: 6.12%). As a core cellulose-degrading phylum, Bacillota employs enzymatic systems to break down dietary fibers into SCFAs (e.g., acetate, propionate, butyrate), thereby elevating host nutrient absorption efficiency[38]. Its enrichment is often linked to diets rich in plant cellulose and hemicellulose, suggesting habitat-specific vegetation and climatic conditions drive these variations. However, excessive Bacillota abundance is associated with metabolic disorders, and its differential abundance across groups may reflect dietary modulation in distinct environments[39]. Wild musk deer’s higher Pseudomonadota levels correlate with their natural herbivorous diet[40]. Bacteroidota, possessing extensive carbohydrate-active enzyme genes, aids in converting carbohydrates and proteins into SCFAs for energy while maintaining gut homeostasis and immunity[23,41]. Conversely, a reduced Bacillota-Bacteroidota ratio may predispose hosts to diarrhea[42].
At the genus level, Novosphingobium and Acinetobacter were dominant shared taxa in wild groups (Chongqing and Hunan), both exhibiting robust lignin-degrading capabilities[43,44]. These genera assist in converting ingested wild vegetation into assimilable carbon sources[45,46], thereby facilitating degradation of plant secondary metabolites and environmental adaptation. Regional divergence was observed in Mesorhizobium abundance, a genus traditionally associated with nitrogen fixation in legume root symbiosis[47]. Its prominence in Hunan wild deer suggests a diet richer in legumes or root tissues, potentially influenced by local vegetation and soil microbial communities. Similar geographical drivers of gut microbiota variation have been reported in baboons[48]. In contrast, Escherichia, Clostridium, and Enterococcus dominated captive individuals. While Escherichia maintains gut microecological balance, its overgrowth under dysbiosis or immune dysfunction may trigger gastrointestinal diseases[49], consistent with its role as a primary pathogen in captive musk deer diarrhea[50]. Clostridium, a symbiotic genus with probiotic potential, mitigates inflammation, strengthens intestinal barriers, and supports immune homeostasis[51,52]. Its growth is promoted by arabinoxylan oligosaccharides but suppressed during intestinal inflammation[53,54]. Additionally, Clostridium contributes crucially to cellulose and hemicellulose digestion[55]. Enterococcus demonstrates antimicrobial activity and probiotic potential, reducing antibiotic-associated diarrhea and enhancing immunity in captive diets[56,57]. These intergroup differences likely stem from dietary disparities.
α- and β-diversity analyses indicated significantly higher gut microbiota richness in wild groups than in captive individuals, consistent with prior studies[10,23,58]. Wild deer consume diverse natural vegetation (herbs, woody plants, vines), whereas captive diets are homogenized, reducing microbial diversity[59]. Diet-driven microbiota restructuring is well-documented across species[7,8,60]. Between Chongqing and Hunan wild groups, microbiota abundance differed markedly, but α-diversity remained comparable. This suggests ecological factors (e.g., altitude, vegetation, climate) drive abundance variations, while core microbial communities conserved across the species maintain baseline diversity, regardless of habitat[61,62]. Such convergence may reflect genetic constraints on core metabolic pathways[63]. KEGG functional annotation revealed that gut microbiota genes were predominantly involved in six metabolic hierarchies, with “Metabolism” (57.3%) as the dominant module, underscoring the centrality of carbohydrate and amino acid metabolism in musk deer physiology[64]. Enrichment of pathways like translation, glycan biosynthesis, and nucleotide metabolism in captive individuals likely reflects high-carbohydrate, protein-rich artificial diets[65]. In contrast, wild groups’ functional distinctions in immunity, sensory systems, and cardiovascular pathways highlight geographical drivers of microbial functional divergence[66,67,68].
5. Conclusions
This study employed metagenomic sequencing to compare the gut microbiota of wild forest musk deer (Moschus berezovskii) from Chongqing and Hunan with captive populations, revealing the impacts of geographical divergence and captivity on intestinal microbial communities. At the phylum level, wild populations exhibited dominance of Pseudomonadota, with significantly higher abundance compared to captive individuals, while the enrichment of Bacillota and Bacteroidota in captive groups highlights the selective pressures exerted by monotonous artificial diets on fiber-metabolizing taxa. At the genus level, wild-specific Novosphingobium and Acinetobacter demonstrated ecological adaptation advantages in lignin degradation of natural vegetation, whereas the abnormal proliferation of Escherichia and Clostridium in captive groups may serve as risk indicators for intestinal dysbiosis under confined conditions. Despite significant divergence in microbial abundance between wild populations from Chongqing and Hunan due to habitat-specific vegetation types, their core microbiota diversity and carbohydrate metabolic functions exhibited convergence, potentially stemming from the stability of core microbial communities essential for maintaining intestinal physiology or conservative host genetic regulation of basal metabolic pathways. The specific enrichment of translation, glycan metabolism, and nucleotide metabolism pathways in captive individuals, alongside the dominance of immune regulation, environmental sensing, and disease-related pathways in wild populations, collectively underscores how dietary differences shaped by geographical environments and artificial rearing practices drive gut microbiota variation. These findings provide a theoretical foundation for optimizing wild musk deer conservation strategies and formulating scientifically informed feeding protocols for captive individuals. Limitations include the methodological constraints of metagenomic sequencing in comprehensively dissecting microbial functional traits, the cross-sectional design precluding causal inferences between geographical/environmental factors and microbiota changes, restricted sampling from Chongqing and Hunan without accounting for individual deer factors, and insufficient exploration of microbial functional mechanisms and their health implications. Future studies should integrate transcriptomics, expand geographical sampling, delve into microbial functional mechanisms, validate their impacts on musk deer health, and explore dietary and environmental interventions to optimize microbial communities, thereby advancing the conservation and sustainable development of this endangered species.
Supplementary Materials
The following supporting information can be downloaded at the website of this paper posted on Preprints.org. Figure S1: Core-pan gene analysis; Table S1: Statistical results of raw sequencing data processing; Table S2: Statistical results of Alpha diversity analysis at the genus level.
Author Contributions
Conceptualization, X.C. and J.P.; Methodology, H.L. and Z.L.; Software, L.X.; Validation, Z.L. and Y.D.; Formal Analysis, H.L. and J.Z.; Investigation, C.Y. and D.T.; Resources, Q.L. and X.C.; Writing – Original Draft Preparation, H.L.; Writing – Review & Editing, X.C., J.P., L.X.; Visualization, L.X. and J.Z.; Supervision, X.C.; Project Administration, J.P.; Funding Acquisition, X.C.. All authors have read and agreed to the published version of the manuscript.
Funding
This research was supported by the People’s Republic of China Wildlife Protection Program of the Central Forestry Reform and Development Fund of the State Forestry Administration, and the National Natural Science Foundation of China (No. 31470570).
Institutional Review Board Statement
Not applicable.
Informed Consent Statement
Not applicable.
Data Availability Statement
The original contributions presented in this study are included in this article. Further inquiries can be directed to the corresponding author(s).
Acknowledgments
We gratefully acknowledge the editors and anonymous reviewers for their insightful comments and constructive suggestions; we extend our special gratitude to the Chongqing Municipal Forestry Bureau and Hunan Provincial Forestry Bureau, along with their subordinate district/county-level forestry bureaus and government staff, for their indispensable administrative support, guidance, and valuable insights during the field investigations .We are particularly indebted to the professors, fellow researchers, and local villagers who provided critical assistance throughout the fieldwork.
Conflicts of Interest
The authors declare no conflicts of interest.
References
- D’Aquila, P.; Lynn Carelli, L.; De Rango, F.; Passarino, G.; Bellizzi, D. Gut Microbiota as Important Mediator Between Diet and DNA Methylation and Histone Modifications in the Host. Nutrients 2020, 12, 597. [Google Scholar] [CrossRef] [PubMed]
- Gilbert, J.A.; Blaser, M.J.; Caporaso, J.G.; Jansson, J.K.; Lynch, S.V.; Knight, R. Current Understanding of the Human Microbiome. Nat Med 2018, 24, 392–400. [Google Scholar] [CrossRef]
- Panigrahi, P. The Neonatal Gut Microbiome and Global Health. Gut Microbes 2024, 16, 2352175. [Google Scholar] [CrossRef] [PubMed]
- West, A.G.; Waite, D.W.; Deines, P.; Bourne, D.G.; Digby, A.; McKenzie, V.J.; Taylor, M.W. The Microbiome in Threatened Species Conservation. Biological Conservation 2019, 229, 85–98. [Google Scholar] [CrossRef]
- Dearing, M.D.; Weinstein, S.B. Metabolic Enabling and Detoxification by Mammalian Gut Microbes. Annu Rev Microbiol 2022, 76, 579–596. [Google Scholar] [CrossRef]
- Arroyo-Rodríguez, V.; Dias, P.A.D. Effects of Habitat Fragmentation and Disturbance on Howler Monkeys: A Review. Am J Primatol 2010, 72, 1–16. [Google Scholar] [CrossRef]
- Fogel, A.T. The Gut Microbiome of Wild Lemurs: A Comparison of Sympatric Lemur Catta and Propithecus Verreauxi. Folia Primatol (Basel) 2015, 86, 85–95. [Google Scholar] [CrossRef]
- Amato, K.R.; Yeoman, C.J.; Kent, A.; Righini, N.; Carbonero, F.; Estrada, A.; Rex Gaskins, H.; Stumpf, R.M.; Yildirim, S.; Torralba, M.; et al. Habitat Degradation Impacts Black Howler Monkey (Alouatta Pigra) Gastrointestinal Microbiomes. ISME J 2013, 7, 1344–1353. [Google Scholar] [CrossRef]
- Ley, R.E.; Hamady, M.; Lozupone, C.; Turnbaugh, P.J.; Ramey, R.R.; Bircher, J.S.; Schlegel, M.L.; Tucker, T.A.; Schrenzel, M.D.; Knight, R.; et al. Evolution of Mammals and Their Gut Microbes. Science 2008, 320, 1647–1651. [Google Scholar] [CrossRef]
- Guo, W.; Mishra, S.; Wang, C.; Zhang, H.; Ning, R.; Kong, F.; Zeng, B.; Zhao, J.; Li, Y. Comparative Study of Gut Microbiota in Wild and Captive Giant Pandas (Ailuropoda Melanoleuca). Genes (Basel) 2019, 10, 827. [Google Scholar] [CrossRef]
- Tang, L.; Li, Y.; Srivathsan, A.; Gao, Y.; Li, K.; Hu, D.; Zhang, D. Gut Microbiomes of Endangered Przewalski’s Horse Populations in Short- and Long-Term Captivity: Implication for Species Reintroduction Based on the Soft-Release Strategy. Front Microbiol 2020, 11, 363. [Google Scholar] [CrossRef] [PubMed]
- San Juan, P.A.; Castro, I.; Dhami, M.K. Captivity Reduces Diversity and Shifts Composition of the Brown Kiwi Microbiome. Animal Microbiome 2021, 3, 48. [Google Scholar] [CrossRef]
- Bueno de Mesquita, C.P.; Nichols, L.M.; Gebert, M.J.; Vanderburgh, C.; Bocksberger, G.; Lester, J.D.; Kalan, A.K.; Dieguez, P.; McCarthy, M.S.; Agbor, A.; et al. Structure of Chimpanzee Gut Microbiomes across Tropical Africa. mSystems 6 e01269-20. [CrossRef] [PubMed]
- Song, C.; Wang, B.; Tan, J.; Zhu, L.; Lou, D.; Cen, X. Comparative Analysis of the Gut Microbiota of Black Bears in China Using High-Throughput Sequencing. Mol Genet Genomics 2017, 292, 407–414. [Google Scholar] [CrossRef] [PubMed]
- Wang, X.; Yuan, X.; Zhou, H.; Zhang, C.; Peng, J.; Peng, J.; Deng, Y.; Huang, P.; Gao, H.; 孙念 N. Moschus berezovskii in Chongqing Jinfo Mountain National Nature Reserve:Population Size and Geographical Distribution. Chinese Agricultural Science Bulletin 2020, 36, 44–47. [Google Scholar]
- Zhao, J.; Wang, Q.; Zheng, C.; Hu, J.; Wang, R.; Jiang, G. Research on the suitable habitat for Moschus berezovskii based on maximum entropy model (MaxEnt)in climatic background. Hubei Agricultural Sciences 2023, 62, 218–223. [Google Scholar] [CrossRef]
- Wang, Y.; Sun, M.; Chang, F.; Wang, J.; Wang, Y.; Tang, J.; Zhang, K.; Gao, L.; Xue, X.; Wan, Y. The Essential Differences in Microbial and Chemical Components of Musk of Different Qualities Secreted by Captive Male Forest Musk Deer (Moschus Berezovskii). Microb Biotechnol 2022, 15, 1783–1794. [Google Scholar] [CrossRef]
- Liu, C.; Hong, T.; Yu, L.; Chen, Y.; Dong, X.; Ren, Z. Single-Nucleus Multiomics Unravels the Genetic Mechanisms Underlying Musk Secretion in Chinese Forest Musk Deer (Moschus Berezovskii). Int J Biol Macromol 2024, 279, 135050. [Google Scholar] [CrossRef]
- Xu, K.; pu, S.; Liang, Z.; Wang, H.; Luo, C.; Zhu, C. Research progress in forest musk deer. Heilongjiang Animal Science and Veterinary 2014, 147–150. [Google Scholar] [CrossRef]
- Yang, J.; Peng, G.; Shu, F.; Dong, D.; Zheng, X.; Zhu, C.; Li, X.; Ma, J.; Pan, C.; Yang, F.; et al. Characteristics of Steroidogenesis-Related Factors in the Musk Gland of Chinese Forest Musk Deer (Moschus Berezovskii). J Steroid Biochem Mol Biol 2021, 212, 105916. [Google Scholar] [CrossRef]
- Liu, G.; Zhang, B.-F.; Chang, J.; Hu, X.-L.; Li, C.; Xu, T.-T.; Liu, S.-Q.; Hu, D.-F. Population Genomics Reveals Moderate Genetic Differentiation between Populations of Endangered Forest Musk Deer Located in Shaanxi and Sichuan. BMC Genomics 2022, 23, 668. [Google Scholar] [CrossRef] [PubMed]
- Wu, X.; Yang, W.; Cheng, J.-G.; Luo, Y.; Fu, W.-L.; Zhou, L.; Wu, J.; Wang, Y.; Zhong, Z.-J.; Yang, Z.-X.; et al. Molecular Cloning, Prokaryotic Expression and Its Application Potential Evaluation of Interferon (IFN)-ω of Forest Musk Deer. Sci Rep 2023, 13, 10625. [Google Scholar] [CrossRef] [PubMed]
- Li, Y.; Hu, X.; Yang, S.; Zhou, J.; Zhang, T.; Qi, L.; Sun, X.; Fan, M.; Xu, S.; Cha, M.; et al. Comparative Analysis of the Gut Microbiota Composition between Captive and Wild Forest Musk Deer. Front Microbiol 2017, 8, 1705. [Google Scholar] [CrossRef]
- Karlsson, F.H.; Fåk, F.; Nookaew, I.; Tremaroli, V.; Fagerberg, B.; Petranovic, D.; Bäckhed, F.; Nielsen, J. Symptomatic Atherosclerosis Is Associated with an Altered Gut Metagenome. Nat Commun 2012, 3, 1245. [Google Scholar] [CrossRef]
- Scher, J.U.; Sczesnak, A.; Longman, R.S.; Segata, N.; Ubeda, C.; Bielski, C.; Rostron, T.; Cerundolo, V.; Pamer, E.G.; Abramson, S.B.; et al. Expansion of Intestinal Prevotella Copri Correlates with Enhanced Susceptibility to Arthritis. Elife 2013, 2, e01202. [Google Scholar] [CrossRef]
- Nielsen, H.B.; Almeida, M.; Juncker, A.S.; Rasmussen, S.; Li, J.; Sunagawa, S.; Plichta, D.R.; Gautier, L.; Pedersen, A.G.; Le Chatelier, E.; et al. Identification and Assembly of Genomes and Genetic Elements in Complex Metagenomic Samples without Using Reference Genomes. Nat Biotechnol 2014, 32, 822–828. [Google Scholar] [CrossRef]
- Qin, J.; Li, R.; Raes, J.; Arumugam, M.; Burgdorf, K.S.; Manichanh, C.; Nielsen, T.; Pons, N.; Levenez, F.; Yamada, T.; et al. A Human Gut Microbial Gene Catalogue Established by Metagenomic Sequencing. Nature 2010, 464, 59–65. [Google Scholar] [CrossRef]
- Fu, L.; Niu, B.; Zhu, Z.; Wu, S.; Li, W. CD-HIT: Accelerated for Clustering the next-Generation Sequencing Data. Bioinformatics 2012, 28, 3150–3152. [Google Scholar] [CrossRef] [PubMed]
- Cotillard, A.; Kennedy, S.P.; Kong, L.C.; Prifti, E.; Pons, N.; Le Chatelier, E.; Almeida, M.; Quinquis, B.; Levenez, F.; Galleron, N.; et al. Dietary Intervention Impact on Gut Microbial Gene Richness. Nature 2013, 500, 585–588. [Google Scholar] [CrossRef]
- Buchfink, B.; Xie, C.; Huson, D.H. Fast and Sensitive Protein Alignment Using DIAMOND. Nat Methods 2015, 12, 59–60. [Google Scholar] [CrossRef]
- Huson, D.H.; Mitra, S.; Ruscheweyh, H.-J.; Weber, N.; Schuster, S.C. Integrative Analysis of Environmental Sequences Using MEGAN4. Genome Res 2011, 21, 1552–1560. [Google Scholar] [CrossRef] [PubMed]
- Segata, N.; Izard, J.; Waldron, L.; Gevers, D.; Miropolsky, L.; Garrett, W.S.; Huttenhower, C. Metagenomic Biomarker Discovery and Explanation. Genome Biology 2011, 12, R60. [Google Scholar] [CrossRef]
- Breiman, L. Random Forests. Machine Learning 2001, 45, 5–32. [Google Scholar] [CrossRef]
- Li, J.; Jia, H.; Cai, X.; Zhong, H.; Feng, Q.; Sunagawa, S.; Arumugam, M.; Kultima, J.R.; Prifti, E.; Nielsen, T.; et al. An Integrated Catalog of Reference Genes in the Human Gut Microbiome. Nat Biotechnol 2014, 32, 834–841. [Google Scholar] [CrossRef] [PubMed]
- He, S.; Cao, X.; Zheng, X.; Wang, D.; Wang, H.; Jiang, B.; Bu, S. Composition of Microbiota and Antibiotic Resistance Genes in Rumen, Small Intestine and Large Intestine of Wild Forest Musk Deer Analyzed by Metagenomic Sequencing. Chinese Journal of Animal Nutrition 2021, 33, 484–493. [Google Scholar]
- Du, M.; Liang, Z.; Zhang, J.; Ding, X. Recent Advances on Interaction and Regulation between Intestinal Microflora and Host Mucosal Immune System of Ruminants. Chinese Journal of Animal Nutrition 2021, 33, 2483–2494. [Google Scholar]
- Xie, F.; Jin, W.; Si, H.; Yuan, Y.; Tao, Y.; Liu, J.; Wang, X.; Yang, C.; Li, Q.; Yan, X.; et al. An Integrated Gene Catalog and over 10,000 Metagenome-Assembled Genomes from the Gastrointestinal Microbiome of Ruminants. Microbiome 2021, 9, 137. [Google Scholar] [CrossRef]
- Li, Q.S.; Wang, R.; Ma, Z.Y.; Zhang, X.M.; Jiao, J.Z.; Zhang, Z.G.; Ungerfeld, E.M.; Yi, K.L.; Zhang, B.Z.; Long, L.; et al. Dietary Selection of Metabolically Distinct Microorganisms Drives Hydrogen Metabolism in Ruminants. ISME J 2022, 16, 2535–2546. [Google Scholar] [CrossRef]
- Chen, W.; Chen, X.; Zhang, Y.; Wu, H.; Zhao, D. Variation on Gut Microbiota Diversity of Endangered Red Pandas (Ailurus Fulgens) Living in Captivity Acrosss Geographical Latitudes. Front Microbiol 2024, 15, 1420305. [Google Scholar] [CrossRef]
- Zhou, M.; Wang, L.; Yan, T.; Yang, Y.; Xu, Q.; Wang, J.; Guo, W. Exploring the diversity of musk deer fecal bacterial community. Journal of China Agricultural University 2016, 21, 100–106. [Google Scholar]
- Bolam, D.N.; Sonnenburg, J.L. Mechanistic Insight into Polysaccharide Use within the Intestinal Microbiota. Gut Microbes 2011, 2, 86–90. [Google Scholar] [CrossRef] [PubMed]
- Carding, S.; Verbeke, K.; Vipond, D.T.; Corfe, B.M.; Owen, L.J. Dysbiosis of the Gut Microbiota in Disease. Microb Ecol Health Dis 2015, 26, 26191. [Google Scholar] [CrossRef] [PubMed]
- Jiang, L.; Liu, Y.; Zhao, L.; Lin, S.; Luan, Q. Screening and Identification of Lignin-Degrading Bacterium DJ02. Heilongjiang Animal Science and Veterinary Medicine 2017, 183–186. [Google Scholar] [CrossRef]
- Cao, S.; Chen, M.; Hou, X.; Sun, J. Effect of Novosphingobium sp. Pretreatment on the Structure and Enzymolysis of Two Kinds of Wood. China Forest Products Industry 2022, 59, 9–13. [Google Scholar] [CrossRef]
- Zhao, C.; Xie, S.; Pu, Y.; Zhang, R.; Huang, F.; Ragauskas, A.J.; Yuan, J.S. Synergistic Enzymatic and Microbial Lignin Conversion. Green Chem. 2016, 18, 1306–1312. [Google Scholar] [CrossRef]
- Wu, D.; Wei, Z.; Mohamed, T.A.; Zheng, G.; Qu, F.; Wang, F.; Zhao, Y.; Song, C. Lignocellulose Biomass Bioconversion during Composting: Mechanism of Action of Lignocellulase, Pretreatment Methods and Future Perspectives. Chemosphere 2022, 286, 131635. [Google Scholar] [CrossRef]
- Laranjo, M.; Alexandre, A.; Oliveira, S. Legume Growth-Promoting Rhizobia: An Overview on the Mesorhizobium Genus. Microbiol Res 2014, 169, 2–17. [Google Scholar] [CrossRef]
- Grieneisen, L.E.; Charpentier, M.J.E.; Alberts, S.C.; Blekhman, R.; Bradburd, G.; Tung, J.; Archie, E.A. Genes, Geology and Germs: Gut Microbiota across a Primate Hybrid Zone Are Explained by Site Soil Properties, Not Host Species. Proceedings of the Royal Society B: Biological Sciences 2019, 286, 20190431. [Google Scholar] [CrossRef]
- Shao, Z.; Chen, X.; He, B.; Wu, L.; Jin, E.; Chen, J.; Wang, S.; Yang, W. Research Progress on Escherichia coli Infections. Animals Breeding and Feed 2021, 20, 5–7. [Google Scholar] [CrossRef]
- Yan, M. The Mass Diseases of Captive Musk Deer. Journal of Economic Animal 2016, 20, 112–117. [Google Scholar] [CrossRef]
- Nagano, Y.; Itoh, K.; Honda, K. The Induction of Treg Cells by Gut-Indigenous Clostridium. Curr Opin Immunol 2012, 24, 392–397. [Google Scholar] [CrossRef] [PubMed]
- Atarashi, K.; Tanoue, T.; Oshima, K.; Suda, W.; Nagano, Y.; Nishikawa, H.; Fukuda, S.; Saito, T.; Narushima, S.; Hase, K.; et al. Treg Induction by a Rationally Selected Mixture of Clostridia Strains from the Human Microbiota. Nature 2013, 500, 232–236. [Google Scholar] [CrossRef]
- Pires, P.S.; Santos, R.L.; da Paixão, T.A.; de Oliveira Bernardes, L.C.; de Macêdo, A.A.; Gonçalves, L.A.; de Oliveira Júnior, C.A.; Silva, R.O.S.; Lobato, F.C.F. Intracellular Survival of Clostridium Chauvoei in Bovine Macrophages. Veterinary Microbiology 2017, 199, 1–7. [Google Scholar] [CrossRef] [PubMed]
- Gillis, C.C.; Hughes, E.R.; Spiga, L.; Winter, M.G.; Zhu, W.; Furtado de Carvalho, T.; Chanin, R.B.; Behrendt, C.L.; Hooper, L.V.; Santos, R.L.; et al. Dysbiosis-Associated Change in Host Metabolism Generates Lactate to Support Salmonella Growth. Cell Host Microbe 2018, 23, 54–64.e6. [Google Scholar] [CrossRef]
- Guo, P.; Zhang, K.; Ma, X.; He, P. Clostridium Species as Probiotics: Potentials and Challenges. J Anim Sci Biotechnol 2020, 11, 24. [Google Scholar] [CrossRef] [PubMed]
- Avram-Hananel, L.; Stock, J.; Parlesak, A.; Bode, C.; Schwartz, B. E Durans Strain M4-5 Isolated from Human Colonic Flora Attenuates Intestinal Inflammation. Dis Colon Rectum 2010, 53, 1676–1686. [Google Scholar] [CrossRef]
- Hanchi, H.; Mottawea, W.; Sebei, K.; Hammami, R. The Genus Enterococcus: Between Probiotic Potential and Safety Concerns—An Update. Front. Microbiol. 2018, 9. [Google Scholar] [CrossRef]
- Guan, Y.; Yang, H.; Han, S.; Feng, L.; Wang, T.; Ge, J. Comparison of the Gut Microbiota Composition between Wild and Captive Sika Deer (Cervus Nippon Hortulorum) from Feces by High-Throughput Sequencing. AMB Express 2017, 7, 212. [Google Scholar] [CrossRef]
- Deng, Y.; Peng, J.; Peng, J.; Gao, H.; Huang, P.; Sun, N.; Wang, X.; Yuan, X.; Zhou, H.; Zhang, C. Preliminary Investigation on Feeding Habits of Moschus berezovskii in Jinfo Mountain National Nature Reserve in Chongqing. Journal of Chongqing Normal University(Natural Science) 2020, 37, 27–34, 146. [Google Scholar]
- Mj, C.; Ib, J.; S, C.; Se, P.; Em, O.; S, C.; Hm, H.; M, C.; B, L.; O, O.; et al. Gut Microbiota Composition Correlates with Diet and Health in the Elderly. Nature 2012, 488. [Google Scholar] [CrossRef]
- Muegge, B.D.; Kuczynski, J.; Knights, D.; Clemente, J.C.; González, A.; Fontana, L.; Henrissat, B.; Knight, R.; Gordon, J.I. Diet Drives Convergence in Gut Microbiome Functions across Mammalian Phylogeny and within Humans. Science 2011, 332, 970–974. [Google Scholar] [CrossRef] [PubMed]
- Yao, X.-Q.; Bao, H.; La, N.-T.; Jiang, G.-S.; Zhai, P.-H.; Liu, C.-B.; Yu, L. Gut Microbiota Contribute to Cold Adaptation in Mammals—Primates and Ungulates. iScience 2025, 28, 112245. [Google Scholar] [CrossRef]
- Bordenstein, S.R.; Theis, K.R. Host Biology in Light of the Microbiome: Ten Principles of Holobionts and Hologenomes. PLoS Biol 2015, 13, e1002226. [Google Scholar] [CrossRef] [PubMed]
- Jiang, F.; Gao, H.; Qin, W.; Song, P.; Wang, H.; Zhang, J.; Liu, D.; Wang, D.; Zhang, T. Marked Seasonal Variation in Structure and Function of Gut Microbiota in Forest and Alpine Musk Deer. Front. Microbiol. 2021, 12. [Google Scholar] [CrossRef]
- Zhang, K.; Wang, X.; Gong, X.; Sui, J. Gut Microbiome Differences in Rescued Common Kestrels (Falco Tinnunculus) Before and After Captivity. Front Microbiol 2022, 13, 858592. [Google Scholar] [CrossRef]
- Franz, M.; Whyte, L.; Atwood, T.C.; Laidre, K.L.; Roy, D.; Watson, S.E.; Góngora, E.; McKinney, M.A. Distinct Gut Microbiomes in Two Polar Bear Subpopulations Inhabiting Different Sea Ice Ecoregions. Sci Rep 2022, 12, 522. [Google Scholar] [CrossRef] [PubMed]
- Tang, S.; Li, Y.; Huang, C.; Yan, S.; Li, Y.; Chen, Z.; Wu, Z. Comparison of Gut Microbiota Diversity Between Captive and Wild Tokay Gecko (Gekko Gecko). Front Microbiol 2022, 13, 897923. [Google Scholar] [CrossRef]
- Wang, H.; Ali, M.; Zhu, Y.; Chen, X.; Lu, D.; Liu, Y.; Li, K.; Zhang, C. Comparative Analysis of Gut Microbiota in Free Range and House Fed Yaks from Linzhou County. Sci Rep 2025, 15, 14317. [Google Scholar] [CrossRef]
Figure 1.
Compositional characteristics of fecal microbiota in forest musk deer (Moschus berezovskii).(a) Phylum-level abundance distribution: Stacked bar charts display the relative abundances of the top 20 bacterial phyla; (b) Genus-level abundance distribution: Stacked bar charts illustrate the relative abundances of the top 20 bacterial genera; (c) Intergroup species distribution: Venn diagram quantifies shared/unique species among the three groups, where overlapping regions represent shared taxa and non-overlapping areas indicate group-specific taxa (W1: Chongqing wild group; W2: Hunan wild group; C: Captive group).
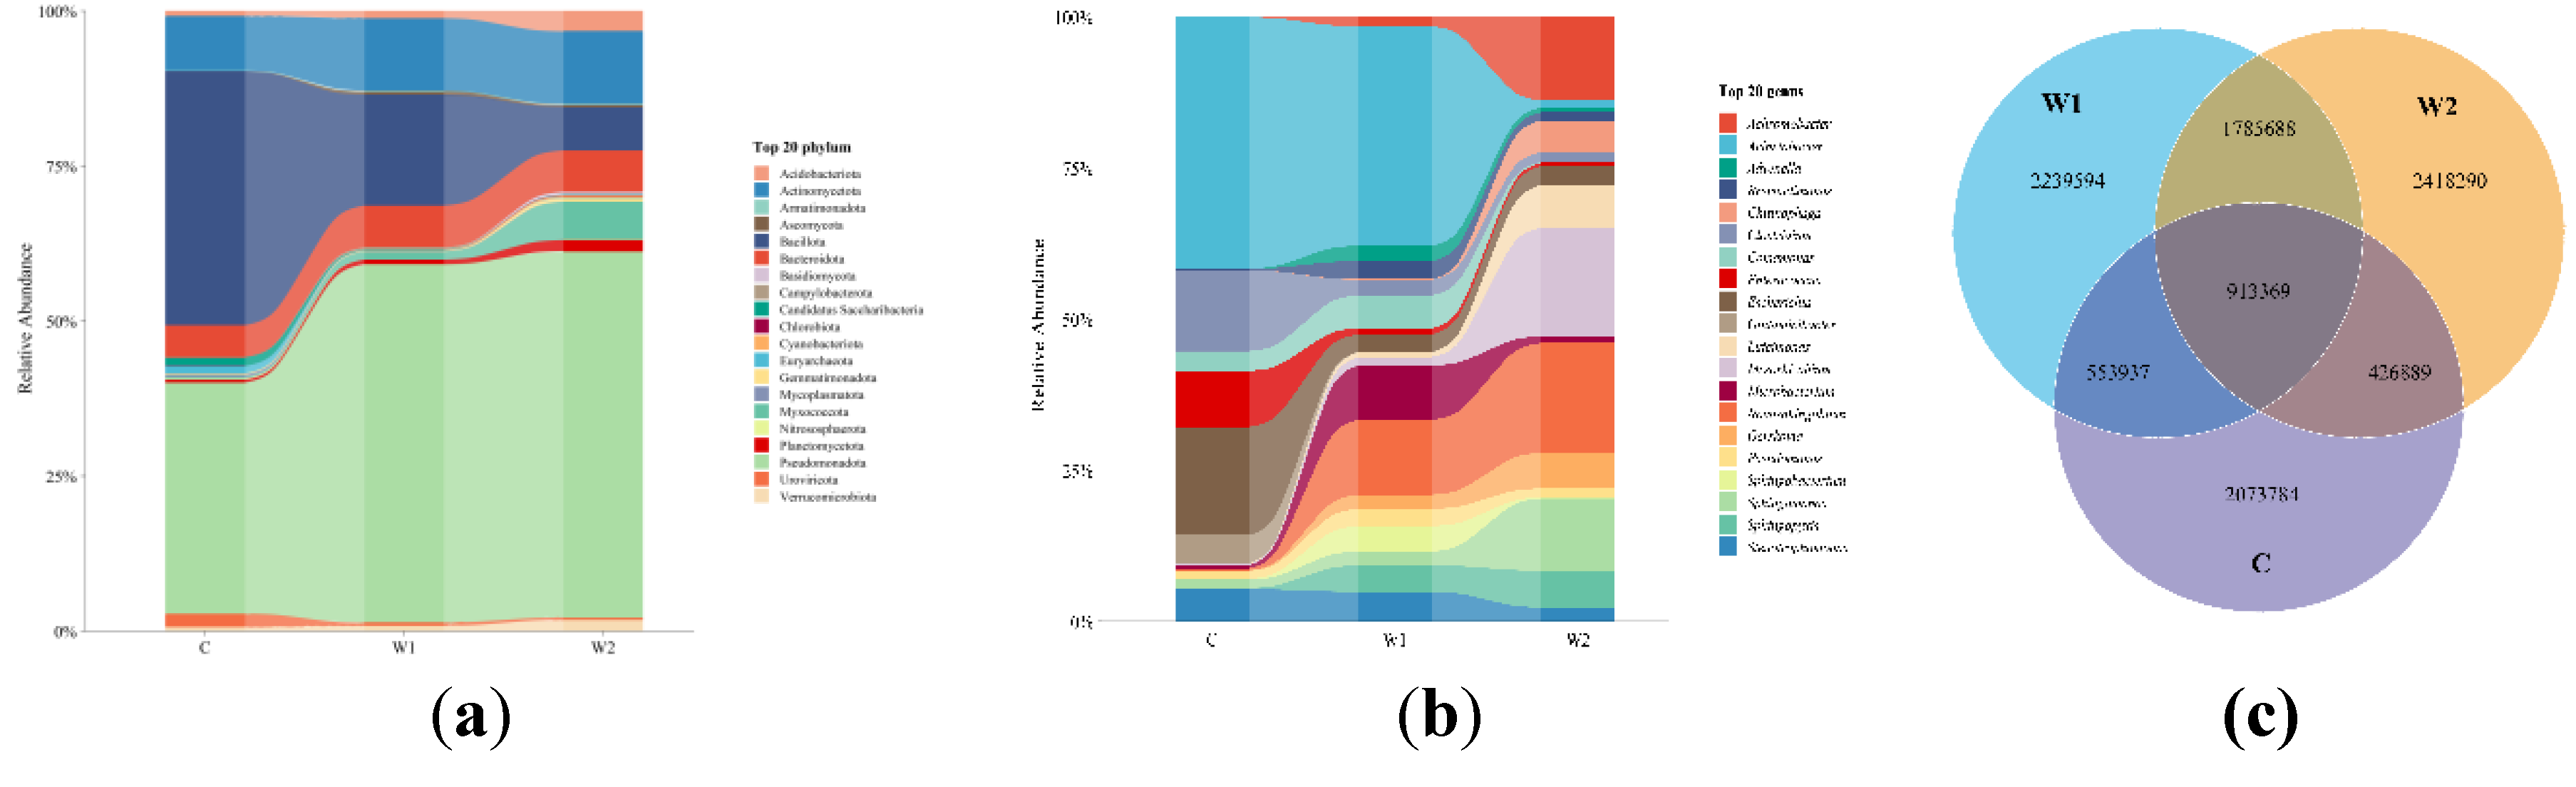
Figure 2.
Analysis of diversity and structural characteristics of gut microbiota in different groups of forest musk deer (Moschus berezovskii). (a) Comparison of α-diversity indices of gut microbiota among the three groups. Significance levels are denoted as: “*” P < 0.05, “**” P < 0.01, “***” P < 0.001 (Kruskal-Wallis rank-sum test), and “ns” indicates no significant difference; (b) Principal Coordinate Analysis (PCoA) of β-diversity in fecal microbiota; (c) Clustered heatmap of the top 12 most significantly differentially abundant genera at the genus level(W1: Chongqing wild group; W2: Hunan wild group; C: Captive group).
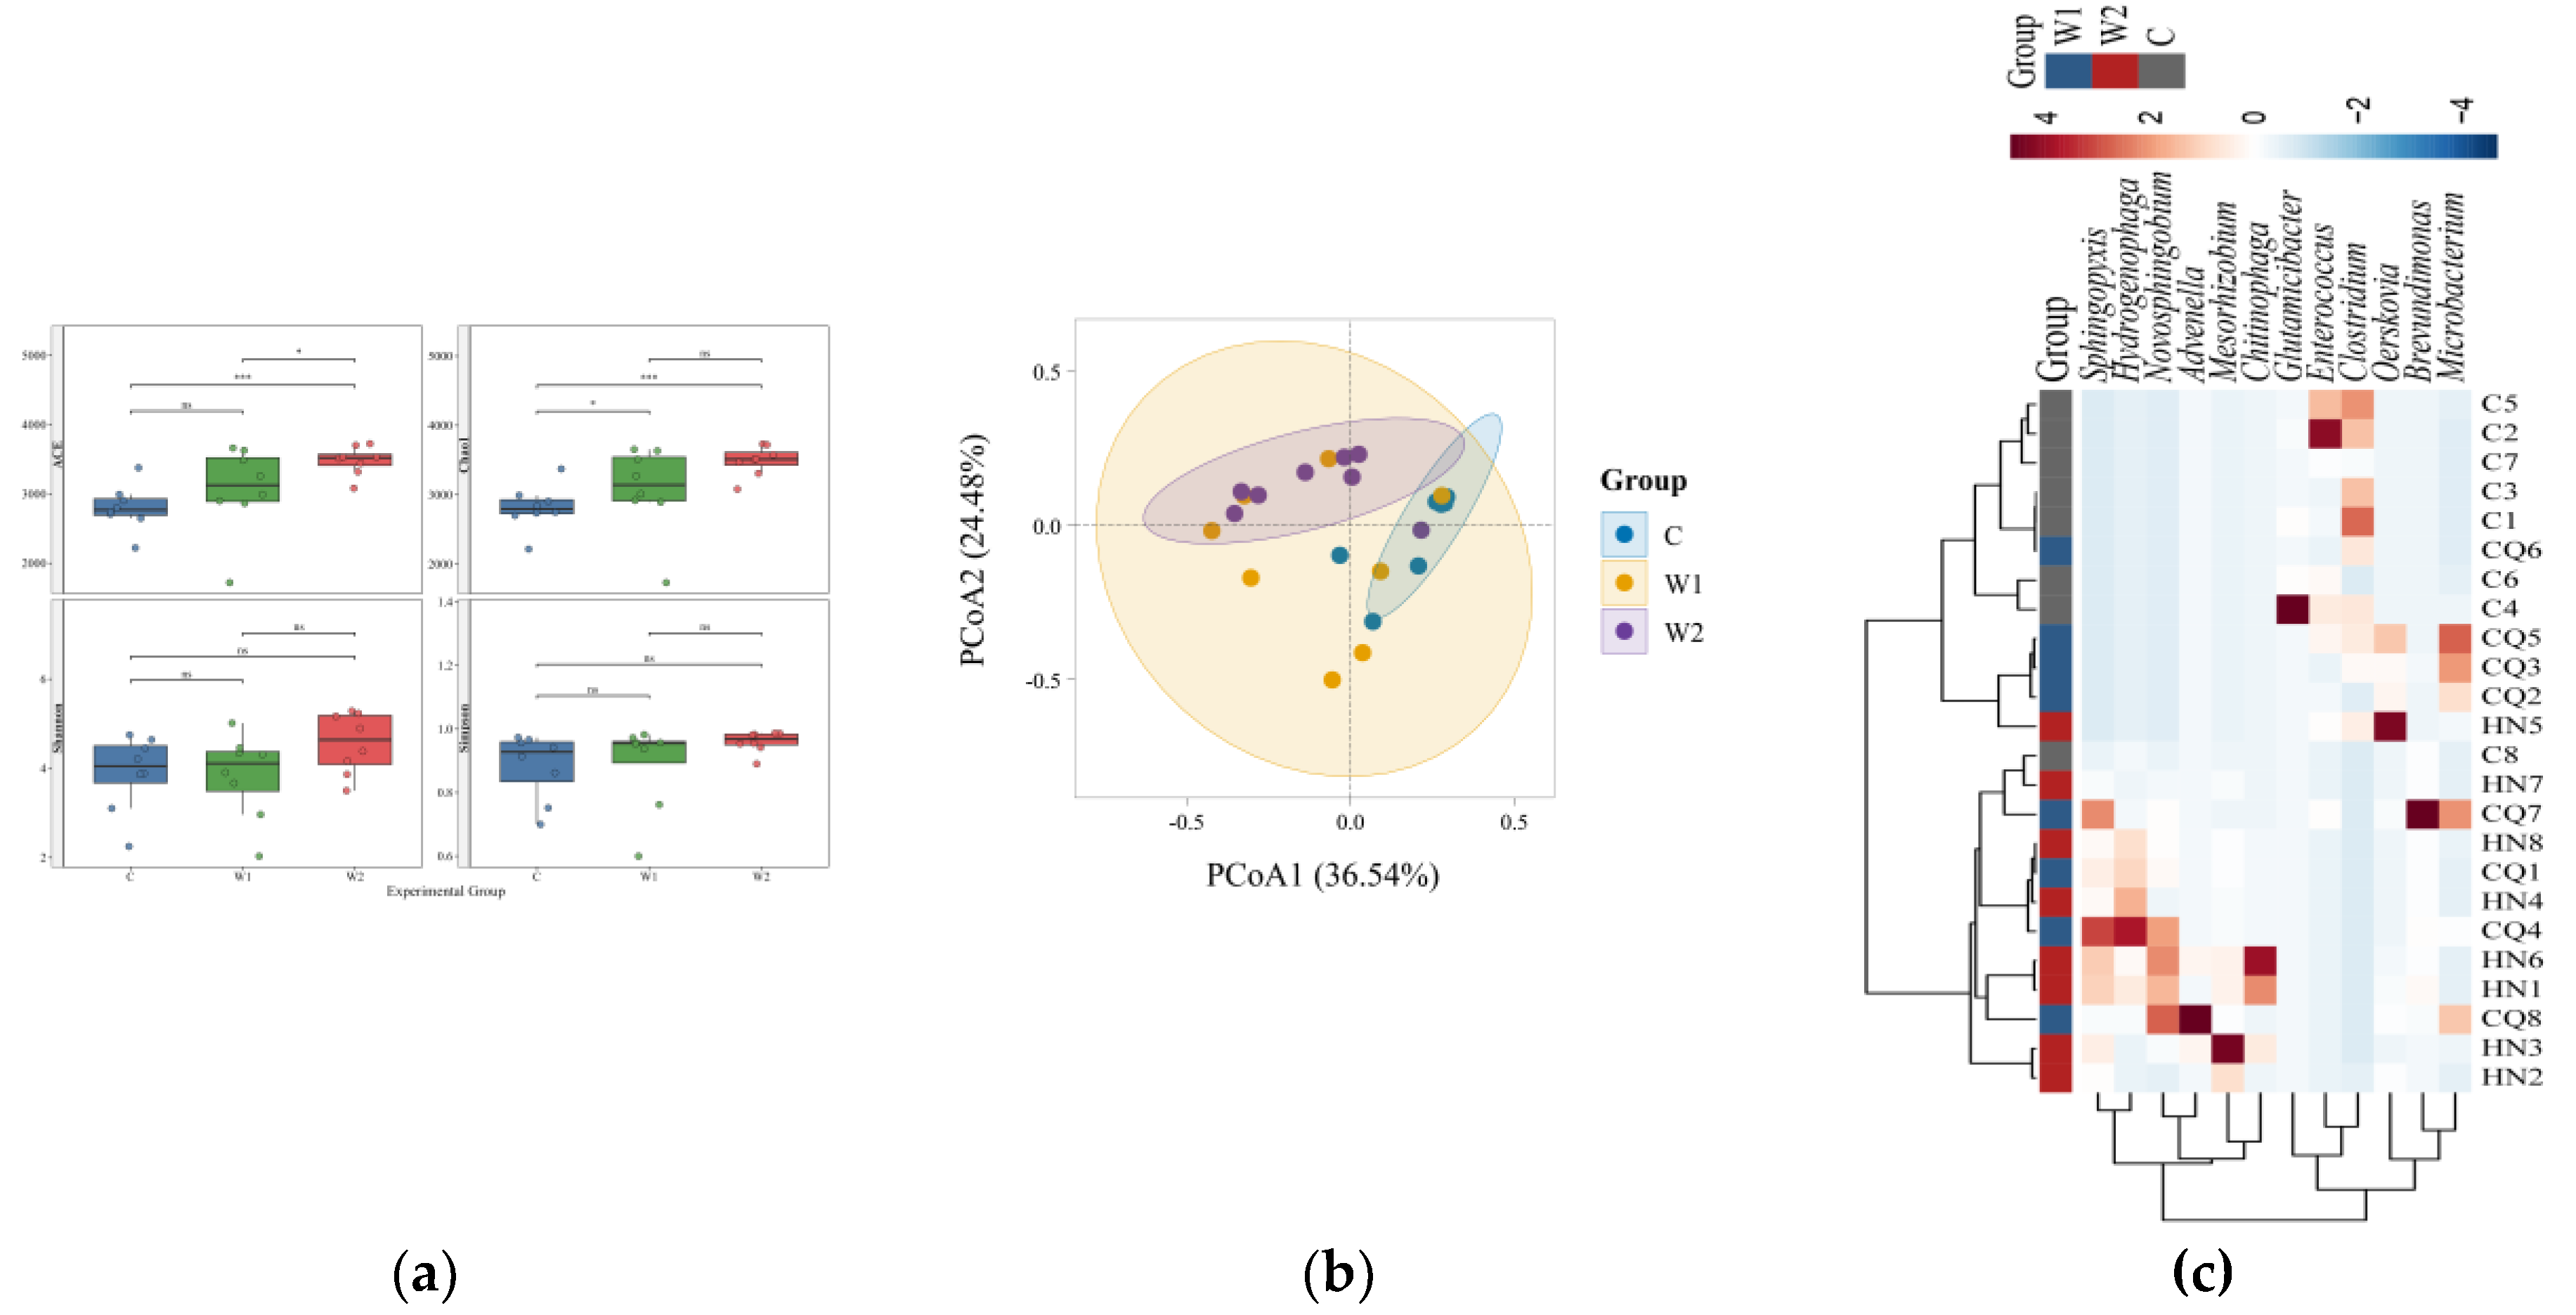
Figure 3.
MetaGenomeSeq analysis of gut microbiota at the genus level in three groups of forest musk deer (Moschus berezovskii). The horizontal axis represents sample groups, while the vertical axis indicates the relative abundance of corresponding microbial taxa. Horizontal bars denote significant differences between two groups; absence of a bar implies no significant difference for that taxon. Significance levels are marked as “*” (P < 0.05) and “**” (P < 0.01) based on the Kruskal-Wallis rank-sum test (W1: Chongqing wild group; W2: Hunan wild group; C: Captive group).
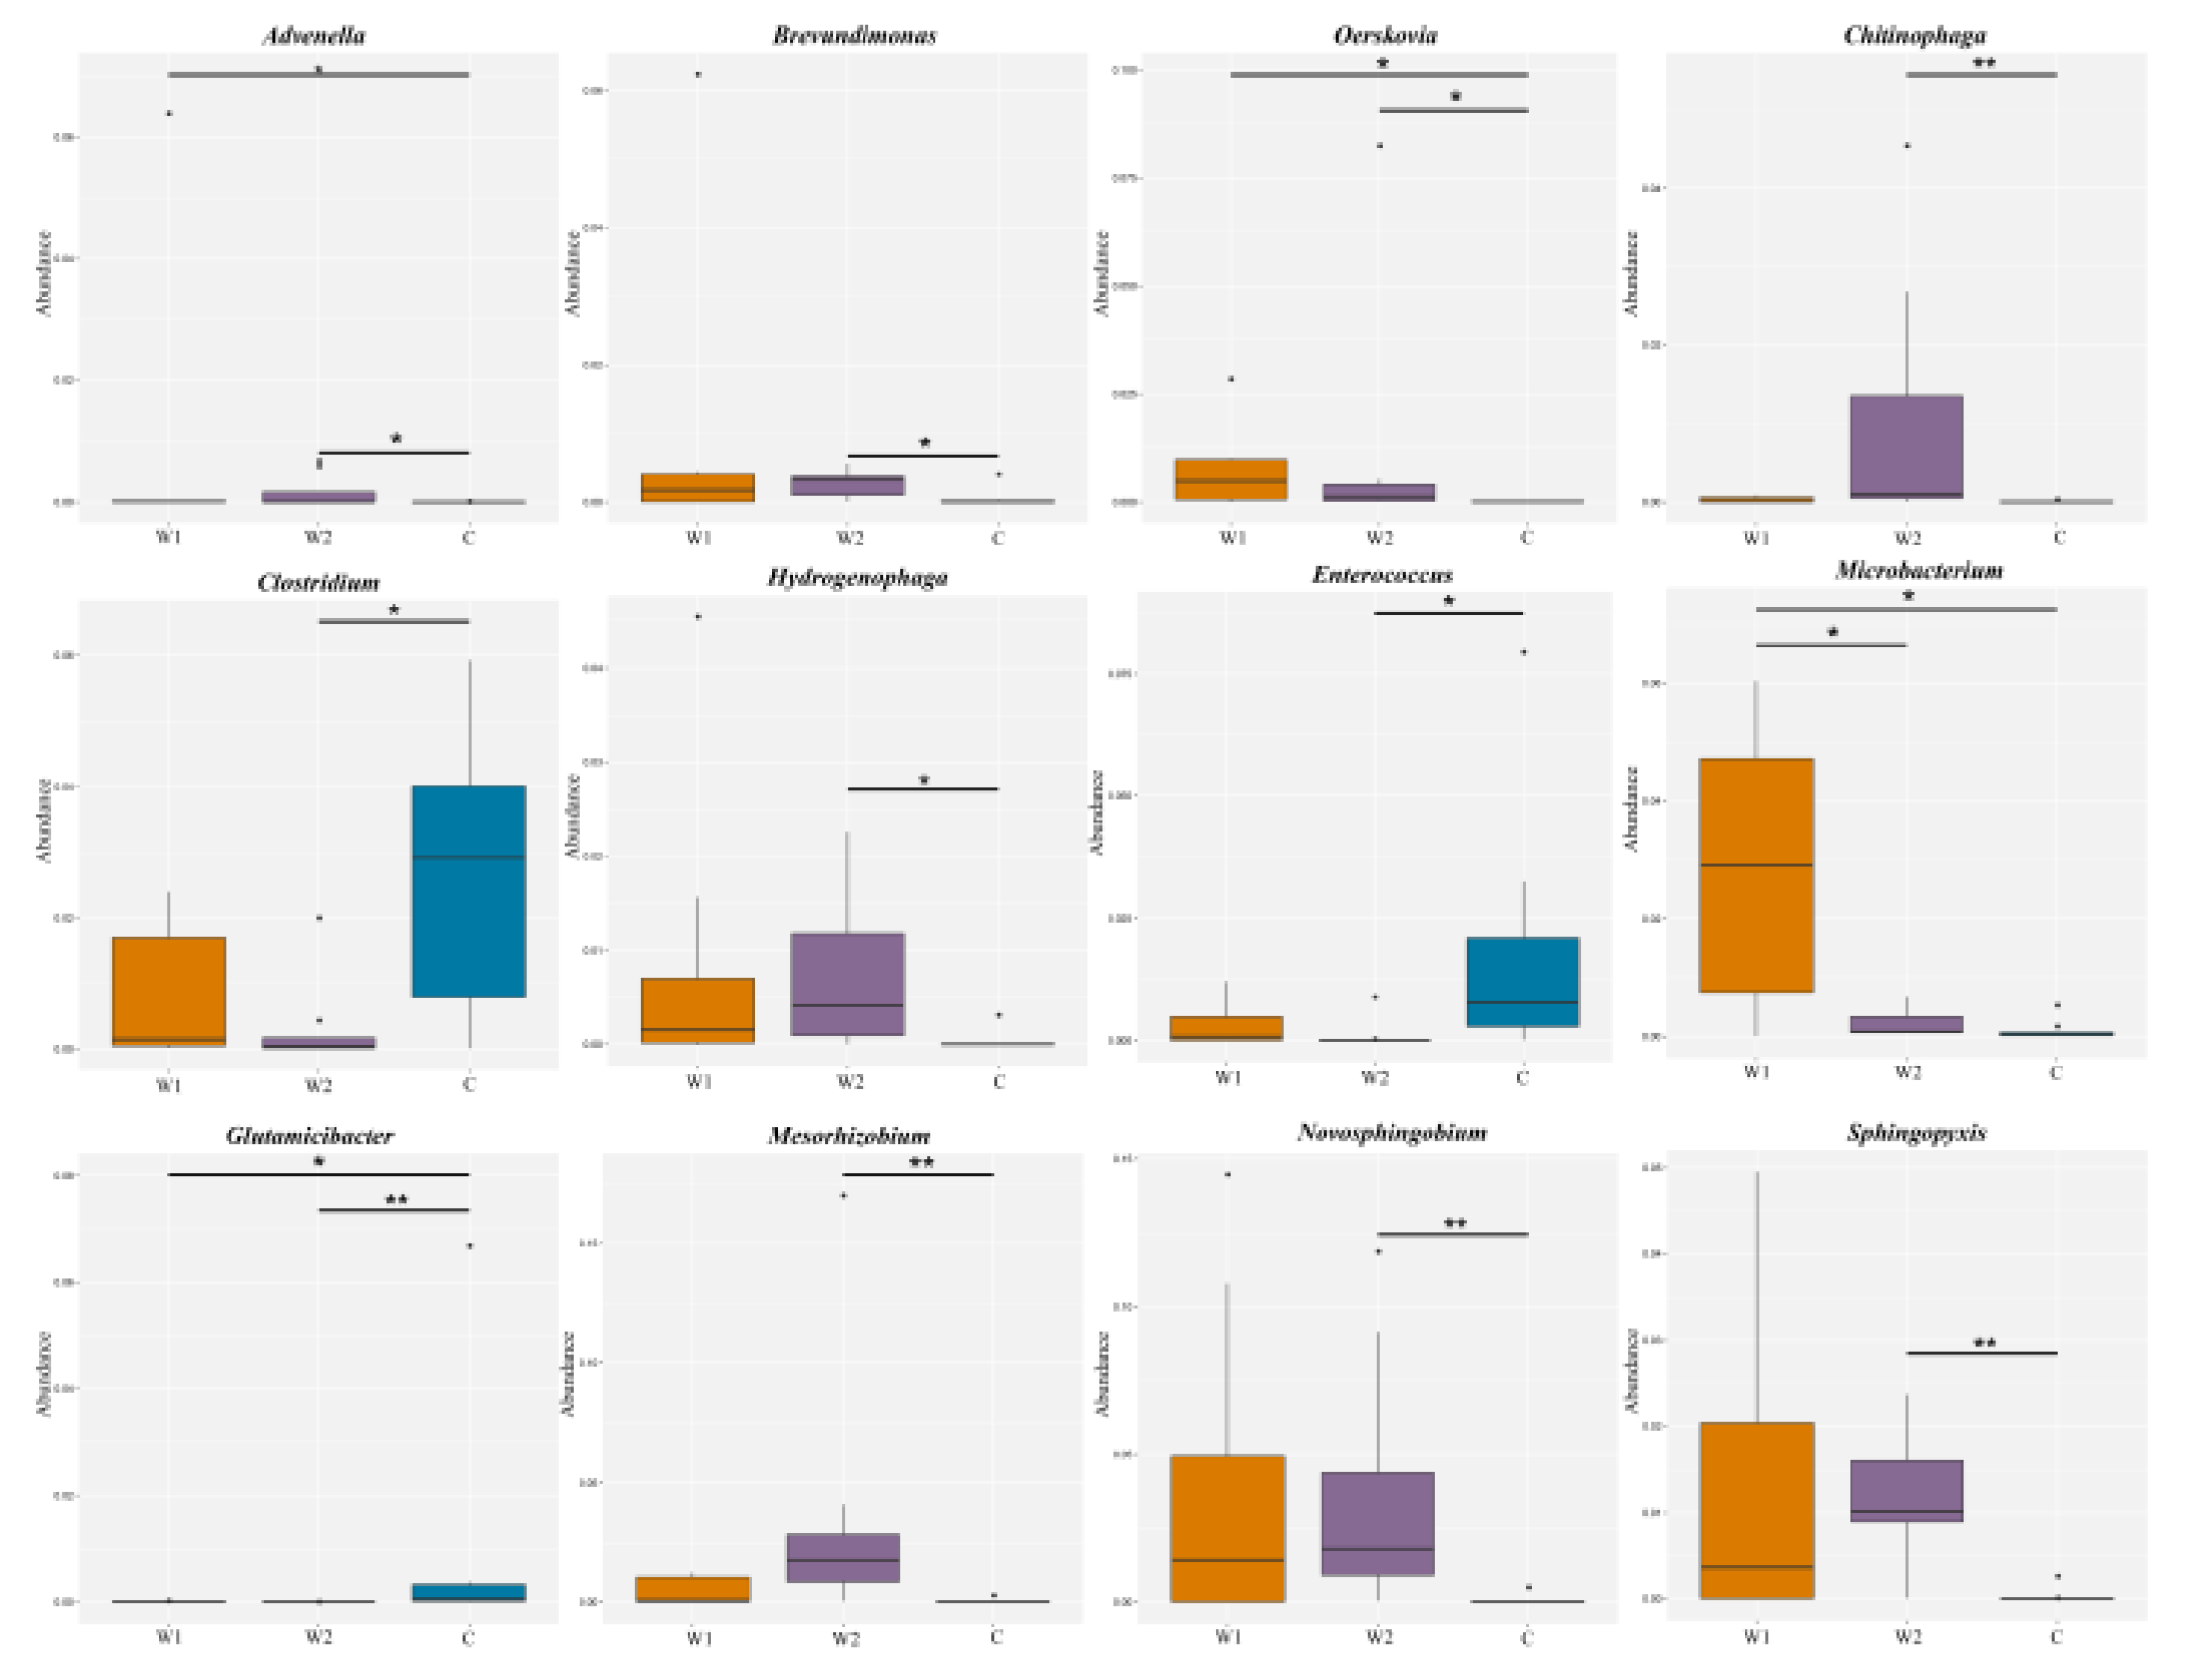
Figure 4.
KEGG Annotation and LEfSe Analysis. (a) Statistical distribution of annotated gene counts in the KEGG database. (a)The bar plot illustrates the number of annotated genes at the Level 1 hierarchy of the KEGG database based on unigene annotation results; (b) LDA score distribution of differential functions (Level 2, LDA=2). The histogram highlights pathways with significant functional divergence (linear discriminant analysis [LDA] score threshold≥2), emphasizing group-specific metabolic specialization; (c) Clustered heatmap of differentially enriched functional abundances in KEGG pathways (Level 2). The heatmap visualizes the relative abundance patterns of functionally distinct pathways across experimental groups(W1: Chongqing wild group; W2: Hunan wild group; C: Captive group).
Disclaimer/Publisher’s Note: The statements, opinions and data contained in all publications are solely those of the individual author(s) and contributor(s) and not of MDPI and/or the editor(s). MDPI and/or the editor(s) disclaim responsibility for any injury to people or property resulting from any ideas, methods, instructions or products referred to in the content. |
© 2025 by the authors. Licensee MDPI, Basel, Switzerland. This article is an open access article distributed under the terms and conditions of the Creative Commons Attribution (CC BY) license (http://creativecommons.org/licenses/by/4.0/).
Copyright: This open access article is published under a Creative Commons CC BY 4.0 license, which permit the free download, distribution, and reuse, provided that the author and preprint are cited in any reuse.


