Submitted:
03 June 2025
Posted:
04 June 2025
You are already at the latest version
Abstract
Gut microbiota research has gained momentum in recent years broadening knowledge of microbial components and their potential effects on health and well-being. Strong association between explicit microbes and metabolic diseases associated with obesity and type 2 diabetes mellitus, gastrointestinal disorders, neurodegenerative diseases and even cancers have been established. Akkermansia muciniphila is a budding next-generation probiotic that plays an important role in the systemic metabolism, intestinal health, and immune regulation establishing strong implications of its use as a potent therapeutic intervention in diverse diseases. This project aimed at evaluating whether bacterial cell extracts of VH Akkermansia muciniphila (Vidya Strain, VS) can stimulate insulin secretion in INS-1 pancreatic beta cells and GLP-1 secretion in NCI-H716 human L-cells, both established in vitro models for studying metabolic regulation. Our study demonstrated that VH Akkermansia muciniphila extracts modestly increase insulin secretion from INS-1 beta cells and, more notably, induce a robust, dose-dependent rise in GLP-1 secretion from NCI-H716 L-cells, with the highest dose achieving over a 2,000% increase comparable to glutamine. These findings suggest that VH A. muciniphila extracts may offer metabolic benefits by enhancing GLP-1 release, highlighting their potential for managing type 2 diabetes and obesity.
Keywords:
Akkermansia muciniphila
; Diabetes
; Insulin secretion
; Probiotics
; GLP-1 secretion
1. Introduction
Diabetes mellitus is a chronic metabolic disease demarcated by elevated blood glucose levels due to impaired insulin secretion, insulin action, at times both. Persistent hyperglycemia often leads to serious complications that affect both small and large blood vessels. Diabetes is a complication that is globally rising, with the greatest increase observed in low- and middle-income countries, especially as urbanization and lifestyle changes accelerate (Yadav et al., 2014). The International Diabetes Federation estimates that the number of adults affected by diabetes may rise to 589 million globally. About 11.1% of the population aged 20–79 is living with diabetes, and over 40% are still undiagnosed. Projections indicate that if current trends continue, the number of people with diabetes could reach 853 million by 2050. Rapid urbanization and shifts in dietary patterns have contributed to a particularly high and growing prevalence in these regions. These figures underscore the urgent need for effective prevention, early detection, and management strategies to address the increasing global burden of diabetes.
A critical angle of diabetes is the dysbiosis in the existence of insulin which is a peptide hormone produced by pancreatic β-cells that plays a central role in maintaining glucose homeostasis by promoting glucose uptake into skeletal muscle and adipose tissue, stimulating glycogen synthesis in the liver, and suppressing hepatic glucose production (Rahman et al., 2021). Beyond its effects on carbohydrate metabolism, insulin also facilitates lipid storage, inhibits lipolysis, and enhances protein synthesis, thereby supporting overall metabolic health. Disruption of insulin secretion-whether due to autoimmune destruction of β-cells in type 1 diabetes or insulin resistance in peripheral tissues as seen in type 2 diabetes, is fundamental to the pathogenesis of diabetes and its associated complications (Nakrani et al., 2023).
As the global prevalence of diabetes continues to rise, largely driven by increasing rates of obesity, sedentary lifestyles, and poor dietary habits, effective management of insulin secretion and sensitivity becomes imperative for a healthy life. Therefore, the development of therapies that enhance insulin action remains a major focus of research.
Yet another key player in diabetes dysbiosis is the gut hormone glucagon-like peptide-1 (GLP-1), which is secreted by intestinal L-cells. GLP-1 is a critical regulator of glucose homeostasis and appetite (Zheng et al., 2024). It stimulates glucose-dependent insulin secretion, suppresses glucagon release, and delays gastric emptying, making it a cornerstone in managing type 2 diabetes and obesity. GLP-1 secretion is modulated by nutrient sensing in L-cells, particularly through protein-rich foods, unsaturated fatty acids, and soluble fiber, which enhance its release. Furthermore, GLP-1 receptor agonists (GLP-1 RAs) have demonstrated significant clinical benefits, including sustained weight loss (10–20% body weight reduction) and cardiovascular risk reduction through mechanisms such as improved endothelial function, reduced inflammation, and attenuation of atherosclerotic plaque progression. Recent studies highlight their potential neuroprotective effects, with a 10–20% lower risk of Alzheimer’s disease and dementia, likely due to anti-inflammatory actions and modulation of brain reward pathways.
The gut is revered as the second brain. Scientific studies have established the significant influence of the gut microbiome on insulin secretion and sensitivity. Certain gut bacteria produce metabolites such as short-chain fatty acids (SCFAs) like butyrate and acetate, which have improved insulin sensitivity and promote insulin secretion, partly by modulating inflammatory pathways implicated in insulin resistance. This insinuates that targeting the gut microbiota with probiotics or postbiotic metabolites may offer promising, natural strategies for improving insulin function and managing diabetes and related metabolic disorders.
Akkermansia muciniphila, a keystone gut microbe, enhances host health through unique mucin degradation (Pellegrino et al., 2023) and metabolic activities. Its distinctive capability to break down intestinal mucin glycoproteins-via glycosyl hydrolases, sulfatases, and sialidases-generates short-chain fatty acids (SCFAs) like acetate and propionate (Li et al., 2021). These SCFAs serve as energy sources for colonocytes, promote regulatory T-cell differentiation, and suppress inflammation by inhibiting histone deacetylases (HDACs) (Li et al., 2023, Pellegrino et al., 2023).
In this regard, we endeavored to conduct clinical studies to evaluate whether the bacterial cell extracts of the probiotic Akkermansia muciniphila can stimulate insulin secretion in pancreatic beta-cells (using the INS-1 cell line) and GLP-1 secretion in human L-cells (using the NCI-H716 cell line). Both cell lines are well-established models for evaluating GLP-1 and insulin secretion, respectively, and for screening compounds that modulate these hormones. By surveying the effects of VH (Vidya Herbs) A. muciniphila extracts on hormone secretion in these cell lines, the feasibility of exploring their potential as metabolic interventions for improving glucose regulation and supporting diabetes and weight management increases exponentially.
2. Materials and Methods:
2.1. Bacterial Cell Preparation, Protein Quantification:
VH Akkermansia muciniphila cells were cultured under anaerobic conditions to obtain sufficient biomass at Vidya Herbs sterile facility. Bacterial cells were lysed via ultra-strength sonication, applying high-intensity sound waves to disrupt cell walls. The lysate was centrifuged into pellet insoluble debris, and the soluble protein-rich supernatant was collected. Protein quantification was performed using a bicinchoninic acid (BCA) assay.
2.1.1. Insulin Study
- Treatment Formulation
A dose-response experiment was designed with protein concentrations ranging from 0 μg/mL (negative control) to 500 μg/mL of total protein. INS-1 -cells were treated with these formulated doses, and glucose-stimulated insulin secretion (GSIS) was measured via ELISA at 0, 30, and 60 minutes to assess time-dependent effects. This protocol ensured precise evaluation of VH A. muciniphila-derived proteins on insulin secretion dynamics.
- Cell Line Prep, Culture Conditions and Insulin Measurement
INS-1 cells were cultured in RPMI-1640 medium supplemented with 10% fetal bovine serum (FBS) and maintained at 37°C in a humidified incubator with 5% CO₂. Cells were seeded into 12-well plates and allowed to reach confluency prior to treatment, with all assays performed in biological triplicates. The two controls included were a negative control consisting of untreated cells (0 µg/mL extract) and a positive control with cells exposed to 10 mM glucose, a known stimulator of insulin secretion in pancreatic beta-cells. Following treatment, cell culture supernatants were collected at 0, 30, and 60 minutes, and insulin concentrations were quantified using a commercially available enzyme-linked immunosorbent assay (ELISA). All insulin measurements were performed in triplicate to ensure accuracy and reproducibility of results.
2.1.2. GLP-1 Study:
- Treatment Formulation
A dose-response experiment was designed with protein concentrations ranging from 0 μg/mL (negative control) to 500 μg/mL of total protein. The treatment regimen involved exposing the NCI-H716 cells to these concentrations and measured GLP-1 secretion at three time points: 0, 30, and 60 minutes.
- Cell Line Prep, Culture Conditions and GLP-1 Measurement
Human L-cell lines (NCI-H716) were cultured in RPMI-1640 medium supplemented with 10% fetal bovine serum (FBS) and maintained under standard conditions (37°C, 5% CO2). Cells were seeded into 12-well plates at a density that allowed them to reach confluency before the treatment. Two controls were included in the experiment. A negative control: cells without any treatment (0 µg/mL extract) and a positive control: cells treated with 10 mM glutamine, known to stimulate GLP-1 secretion. After the treatment, cell culture supernatants were collected at 0, 30 and 60 min and analyzed for GLP-1 secretion using a commercially available enzyme-linked immunosorbent assay (ELISA). GLP-1 concentrations were measured in triplicates.
2.3. Data Analysis:
Data was analyzed using standard statistical software, including Excel and GraphPad Prism and expressed as means ± standard deviation (SD) and standard error of the mean (SEM). Statistical significance between groups was evaluated using one-way ANOVA followed by Tukey’s post-hoc test for multiple comparisons.
3. Results
Insulin concentrations were seen to improve with the treatment. The data in Table 1 and Table 2 shows the treatment of INS-1 beta cells with increasing concentrations of VH A. muciniphila cell extracts that affect insulin secretion over time, compared to negative (untreated) and positive (glucose-stimulated) controls. At baseline (0 min), insulin levels are low and similar across all groups, indicating no immediate effect from the extract (Figure 1). After 30 and 60 minutes of treatment, there is a clear, dose-dependent increase in insulin secretion. Higher concentrations of VH A. muciniphila extract result in significantly greater insulin release. This is visually summarized in the (Figure 1) heatmap (panel a), where the color shifts from red (low) to green (high) as both dose and time increase. After 30 and 60 minutes, insulin secretion increases in a dose-dependent manner with higher concentrations of VH A. muciniphila extract with an optimum at the extract dose of 250 µg/mL. The positive control (10 mM glucose) produces a much larger increase in insulin secretion (15.9 mU/L at 30 min, 27.7 mU/L at 60 min), consistent with the robust glucose-stimulated response expected in INS-1 cells. When focusing only on the treated groups (Table 2, Figure 2), the data reinforces that even at the lowest tested dose (31.2 µg/mL), insulin secretion is significantly higher than the negative control after 30 and 60 minutes. Overall, the results indicate that VH A. muciniphila cell extracts stimulate insulin secretion in a dose-dependent manner, though to a lesser extent than direct glucose stimulation, supporting their potential to modulate beta-cell function.
In the GLP study, all groups show low GLP-1 levels (2–5 pM), indicating similar starting points before treatment (Table 3). The negative control remains low (2.76 pM). All VH Akkermansia muciniphila extract-treated groups show a marked, dose-dependent increase in GLP-1 secretionFigure 3a (Heatmap) shows a clear transition from low (red) to high (green) GLP-1 levels with increasing extract dose and time. While the Figure 1b-d (Bar Graphs) illustrates the dose- and time-dependent increase in GLP-1 secretion, with the highest levels at 60 minutes and 500 µg/mL. Figure 4 illustrates the percent change in GLP-1 secretion from NCI-H716 cells after treatment with various doses of VH Akkermansia muciniphila cell extract, compared to a negative control and a positive control (glutamine), measured at 0, 30, and 60 minutes. The heatmap shows a clear progression from red, low GLP-1 secretion at baseline, to yellow and green, higher secretion, as both the extract dose and incubation time increase. Error bars (SD) are relatively small, indicating consistent results across replicates. VH Akkermansia muciniphila cell extract significantly increases GLP-1 secretion from NCI-H716 cells in a dose- and time-dependent manner, with effects that approach those of the positive control (glutamine) at higher doses and longer incubation. This supports the potential of VH Akkermansia muciniphila as a beneficial modulator of gut hormone secretion and metabolic health.
Discussion
Chronic inflammation in type 2 diabetes mellitus (T2DM) is closely linked to dysregulated insulin secretion including insulin resistance and disrupted immune responses. The lipopolysaccharide (LPS) also plays a key role in driving low-grade inflammation, likely due to impaired clearance mechanisms and gut-derived endotoxin absorption. Studies suggest a bidirectional relationship between metabolic dysfunction and innate immune activation (Creely et al., 2007). Hence, an ideal therapeutic candidate for diabetes treatment and management should aid in metabolic regulation, significantly impact insulin secretion and sensitivity, appetite regulation, and reduce immune system inflammation.
Gut bacteria influence diabetes through immune and metabolic pathways. High lipopolysaccharide (LPS) levels in type 2 diabetes mellitus (T2DM) patients activates the Toll-like receptor 4 (TLR4), which triggers macrophage recruitment and NF-κB signaling. These promote systemic inflammation and suppress insulin secretion by disrupting the β-cell function (Amyot et al., 2012, Li et al., 2023). This inflammatory cascade exacerbates insulin resistance and hyperglycemia. However, the beneficial gut microbes can counter these effects by metabolizing primary bile acids into secondary bile acids which activate the farnesoid X receptor (FXR), stimulating fibroblast growth factor 19/15 (FGF19/15) release. This enhances insulin sensitivity and glucose tolerance. Among the beneficial gut bacteria strains, Akkermansia muciniphila, a key probiotic has been established to strengthen intestinal barrier integrity, reduce LPS translocation and inflammation while promoting GLP-1 secretion to improve glycemic control (Li et al., 2023).
Our study demonstrates that VH Akkermansia muciniphila extracts, modestly stimulates insulin secretion from INS-1 pancreatic beta cells in a dose-dependent manner. While these increases are statistically significant, they remain substantially lower than those induced by classical insulin secretagogues such as glucose. However, the study promotes that VH Akkermansia muciniphila harbors bioactive molecules that are capable of enhancing insulin production.
In parallel, our study also reveals a robust, dose-dependent increase in GLP-1 secretion from NCI-H716 gut L-cells upon exposure to VH A. muciniphila cell extracts. At the highest tested concentration (500 μg/mL), GLP-1 secretion increased by over 2,000% compared to the negative control, reaching levels comparable to glutamine, a well-characterized GLP-1 secretagogue. GLP-1 is a pivotal incretin hormone that enhances insulin secretion, suppresses appetite, and slows gastric emptying, making it a key target in the management of type 2 diabetes and obesity (Drucker, 2018). The ability of A. muciniphila extracts to stimulate GLP-1 release suggests a novel mechanism by which this bacterium may exert metabolic benefits.
The therapeutic implications are noteworthy, particularly for metabolic disorders such as type 2 diabetes. Enhancing endogenous insulin secretion could contribute to improved glycemic control and potentially reduce the burden of exogenous insulin therapy. Several studies have highlighted the beneficial metabolic effects of A. muciniphila, including improved insulin sensitivity and glucose homeostasis in both animal models and human subjects (Zhang et al., 2019; Depommier et al., 2019). The ability of these extracts to enhance insulin release from INS-1 cells, although less potent than classical secretagogues such as glucose, suggests the presence of bioactive components that may support endogenous insulin production. This finding is particularly relevant for the development of novel interventions aimed at improving glycemic control in individuals with diabetes, a concept supported by recent studies demonstrating the metabolic benefits of A. muciniphila supplementation in both preclinical and clinical settings (Depommier et al., 2019; Plovier et al., 2017).
Furthermore, the robust stimulation of GLP-1 secretion observed in this study highlights an additional mechanism by which VH A. muciniphila may promote metabolic health. GLP-1 is a critical incretin hormone that not only potentiates insulin secretion but also regulates appetite and gastric motility, making it a valuable target for therapeutic strategies in diabetes and obesity management. Recent research has demonstrated that Akkermansia muciniphila produces bioactive components capable of stimulating GLP-1 secretion from intestinal L-cells, crucial for metabolic regulation, including insulin secretion, appetite control, and gastric motility. Enhancing GLP-1 levels through dietary or probiotic strategies may offer a promising approach for managing metabolic diseases such as type 2 diabetes, obesity, and cardiovascular conditions.
Specifically, the secreted protein P9 from A. muciniphila has been identified as a key factor that binds to intercellular adhesion molecule 2 (ICAM-2) on L-cells, directly triggering GLP-1 release and improving glucose homeostasis in animal models (Yoon et al., 2021). While this protein is a significant mediator, A. muciniphila also produces a variety of other metabolites, proteins, and cell wall components that may contribute to its effects on GLP-1 secretion, though the roles of these additional factors are still being investigated
Research also supports the role of A. muciniphila and its metabolites in modulating gut hormone secretion and metabolic health. Chelakkot et al. (2018) found that A. muciniphila-derived extracellular vesicles (AmEVs) enhance intestinal barrier integrity by upregulating tight junction proteins as occludin through AMPK activation, reducing gut permeability and improving glucose tolerance in murine models. Additionally, Plovier et al. (2017) showed that both pasteurized A. muciniphila and its outer membrane protein Amuc_1100 reduced adiposity and insulin resistance in mice to improve glucose tolerance and increase GLP-1 levels in animal models by strengthening gut barrier function and activating TLR2 signaling (Plovier et al., 2017). The bacterium produces various bioactive components-including outer membrane proteins, short-chain fatty acids, and extracellular vesicles-that may interact with intestinal L-cells to promote GLP-1 secretion (Cani & de Vos, 2017). A. muciniphila-derived short-chain fatty acids (SCFAs), such as propionate, enhance GLP-1 release through free fatty acid receptor (FFAR) activation, further supporting glycemic control (Li et al., 2023).
Metformin, an antidiabetic agent, was found to increase the abundance of A. muciniphila in high-fat diet-fed mice, correlating with improved glycemic control and reduced adipose inflammation through T-regulatory cell recruitment. In humans, metformin-responsive T2DM patients exhibit higher fecal A. muciniphila levels compared to non-responders.
In diabetic mouse models, A. muciniphila supplementation mitigated hepatic dysfunction, oxidative stress, and inflammation. Vancomycin-treated NOD mice with elevated A. muciniphila levels showed reduced T1DM incidence, underscoring its protective role. A 12-week clinical trial by Perraudeau et al. (2020) using the probiotic blend WBF-011 (containing A. muciniphila) significantly improved postprandial glucose and HbA1c in T2DM patients, likely via butyrate-induced GLP-1 release.
The increasing popularity of A. muciniphila as a metabolic therapeutic for diabetes can be gauged from the ongoing clinical trials NCT04797442, NCT05114018. By enhancing insulin secretion, A. muciniphila could help regulate blood glucose levels more effectively, offering a natural approach to diabetes and related disorders management.
It is important to note that the findings of our study are based on in vitro models, which may not fully recapitulate the complexity of human physiology. In vivo studies in animal models and clinical trials in humans are necessary to confirm the physiological relevance, safety, and efficacy of A. muciniphila extracts for metabolic health interventions. Such studies should also investigate the long-term effects of modulating GLP-1 and insulin secretion, including impacts on weight management, glucose homeostasis, and cardiovascular risk.
With the global burden of metabolic diseases surpassing an estimated 537 million people living with diabetes in 2021 based on the International Diabetes Federation estimate, safe, cost-effective and a multi-targeted therapeutic approach is imperative for overall health management.
Conclusion:
This investigation provides compelling evidence that the cell extracts of VH Akkermansia muciniphila strain exert beneficial effects on key metabolic pathways by stimulating both insulin secretion from pancreatic beta-cells and GLP-1 secretion from human L-cells in a dose-dependent manner. As a probiotic strain that regulates gut homeostasis, undeniably, VH A. muciniphila represents a promising avenue for metabolic health interventions, with dual actions on insulin and GLP-1 secretion. To completely comprehend their true therapeutic potential and long-term usage safety, further studies on isolating and characterizing the active components, elucidating their mechanisms of action, and evaluating their clinical utility for the prevention and management of metabolic diseases such as type 2 diabetes and obesity is warranted.
Author Contributions
All authors have developed the concept, revised the literature,and wrote the manuscript. All investigators participated in data interpretation and contributed to the revision of the final version of the manuscript. All authors have read and agreed to the published version of the manuscript.
Funding
This research received no external funding.
Institutional Review Board Statement
Not applicable.
Informed Consent Statement
Not applicable.
Data Availability Statement
Not applicable.
Conflicts of Interest
The authors declare no conflict of interest.
References
- Rahman MS, Hossain KS, Das S, Kundu S, Adegoke EO, Rahman MA, Hannan MA, Uddin MJ, Pang MG. Role of Insulin in Health and Disease: An Update. Int J Mol Sci. 2021 Jun 15;22(12):6403. PMID: 34203830; PMCID: PMC8232639. [CrossRef]
- Stephen L. Aronoff, Kathy Berkowitz, Barb Shreiner, Laura Want; Glucose Metabolism and Regulation: Beyond Insulin and Glucagon. Diabetes Spectr 1 July 2004; 17 (3): 183–190. [CrossRef]
- Nakrani MN, Wineland RH, Anjum F. Physiology, Glucose Metabolism. [Updated 2023 July 17]. In: StatPearls [Internet]. Treasure Island (FL): StatPearls Publishing; 2025 Jan-. Available from: https://www.ncbi.nlm.nih.gov/books/NBK560599/.
- Dhananjay Yadav, Meerambika Mishra, Arvind Tiwari, Prakash Singh Bisen, Hari Mohan Goswamy, G.B.K.S. Prasad, Prevalence of Dyslipidemia and Hypertension in Indian Type 2 Diabetic Patients with Metabolic Syndrome and its Clinical Significance, Osong Public Health and Research Perspectives, Volume 5, Issue 3, 2014, Pages 169-175, ISSN 2210-9099, (https://www.sciencedirect.com/science/article/pii/S2210909914000472). [CrossRef]
- Zheng, Z., Zong, Y., Ma, Y. et al. Glucagon-like peptide-1 receptor: mechanisms and advances in therapy. Sig Transduct Target Ther 9, 234 (2024). [CrossRef]
- Depommier, C., Everard, A., Druart, C., et al. (2019). Supplementation with Akkermansia muciniphila in overweight and obese human volunteers: a proof-of-concept exploratory study. Nature Medicine, 25(7), 1096–1103.
- Zhang, T., Li, Q., Cheng, L., et al. (2019). Akkermansia muciniphila is a promising probiotic. Microbial Biotechnology, 12(6), 1109–1125.
- Plovier, H., Everard, A., Druart, C., et al. (2017). A purified membrane protein from Akkermansia muciniphila or the pasteurized bacterium improves metabolism in obese and diabetic mice. Nature Medicine, 23(1), 107–113.
- Cani, P.D., & de Vos, W.M. (2017). Next-generation beneficial microbes: the case of Akkermansia muciniphila. Nature Reviews Microbiology, 15(5), 354–364.
- Drucker, D.J. (2018). Mechanisms of Action and Therapeutic Application of Glucagon-like Peptide-1. Cell Metabolism, 27(4), 740–756.
- Kansakar, U., et al. (2024). Exogenous Ketones in Cardiovascular Disease and Diabetes: From Bench to Bedside. J Clin Med, 13(23):7391.
- Mone, P., Lombardi, A., Kansakar, U., et al. (2023). Empagliflozin Improves the MicroRNA Signature of Endothelial Dysfunction in Patients with Heart Failure with Preserved Ejection Fraction and Diabetes. J Pharmacol Exp Ther, 384(1):116-122.
- S. J. Creely,P. G. McTernan,C. M. Kusminski,ff. M. Fisher,N. F. Da Silva,M. Khanolkar,M. Evans,A. L. Harte, andS. Kumar. 2007. Lipopolysaccharide activates an innate immune system response in human adipose tissue in obesity and type 2 diabetes. American Journal of Physiology-Endocrinology and Metabolism 2007 292:3, E740-E747.
- Khondkaryan L, Margaryan S, Poghosyan D, Manukyan G. Impaired Inflammatory Response to LPS in Type 2 Diabetes Mellitus. Int J Inflam. 2018 Jan 14;2018:2157434. PMID: 29568481; PMCID: PMC5820544. [CrossRef]
- Fu, Yj., Xu, B., Huang, Sw. et al. Baicalin prevents LPS-induced activation of TLR4/NF-κB p65 pathway and inflammation in mice via inhibiting the expression of CD14. Acta Pharmacol Sin 42, 88–96 (2021). [CrossRef]
- Chelakkot, C., Choi, Y., Kim, D. K., Park, H. T., Ghim, J., Kwon, Y., et al. (2018). Akkermansia muciniphila-derived extracellular vesicles influence gut permeability through the regulation of tight junctions. Exp. Mol. Med. 50:e450. [CrossRef]
- Li Jinjie , Yang Ge , Zhang Qihe , Liu Zhuo , Jiang Xin , Xin Ying. 2023. Function of Akkermansia muciniphila in type 2 diabetes and related diseases. Frontiers in Microbiology. Volume 14. DOI=10.3389/fmicb.2023.1172400.
- Pellegrino A, Coppola G, Santopaolo F, Gasbarrini A, Ponziani FR. Role of Akkermansia in Human Diseases: From Causation to Therapeutic Properties. Nutrients. 2023 Apr 8;15(8):1815. PMID: 37111034; PMCID: PMC10142179. [CrossRef]
- Li Z, Hu G, Zhu L, Sun Z, Jiang Y, Gao MJ, Zhan X. Study of growth, metabolism, and morphology of Akkermansia muciniphila with an in vitro advanced bionic intestinal reactor. BMC Microbiol. 2021 Feb 23;21(1):61. PMID: 33622254; PMCID: PMC7901181. [CrossRef]
- Yoon HS, Cho CH, Yun MS, Jang SJ, You HJ, Kim JH, Han D, Cha KH, Moon SH, Lee K, Kim YJ, Lee SJ, Nam TW, Ko G. Akkermansia muciniphila secretes a glucagon-like peptide-1-inducing protein that improves glucose homeostasis and ameliorates metabolic disease in mice. Nat Microbiol. 2021 May;6(5):563-573. Epub 2021 Apr 5. PMID: 33820962. [CrossRef]
Figure 1.
Insulin levels (mU/L) in INS1 cells treated with VH Akkermansia muciniphila cell extract at various doses (0 [negative control], 31.2, 52.5, 125, 250, and 500 µg/mL total protein) at 0 min (baseline), and after 30 and 60 minutes of treatment. a) Heatmap depicting insulin levels (red indicates low, yellow indicates medium, and green indicates high levels) secretion. b,d,f) Insulin levels following different doses of VH Akkermansia muciniphila treatment at both 30 and 60 minutes (b), and 30-minute (d) and 60-minute (f) time points. c,e,g) Insulin levels in only treated groups with 31.2, 52.5, 125, 250, and 500 µg/mL total protein after 30 and 60 minutes of treatments. All assays were performed in three biological replicates. Values presented in bars are means, and error bars indicate SD. P-Values indicated with ***<0.001 are statistically significantly different compared to negative control.
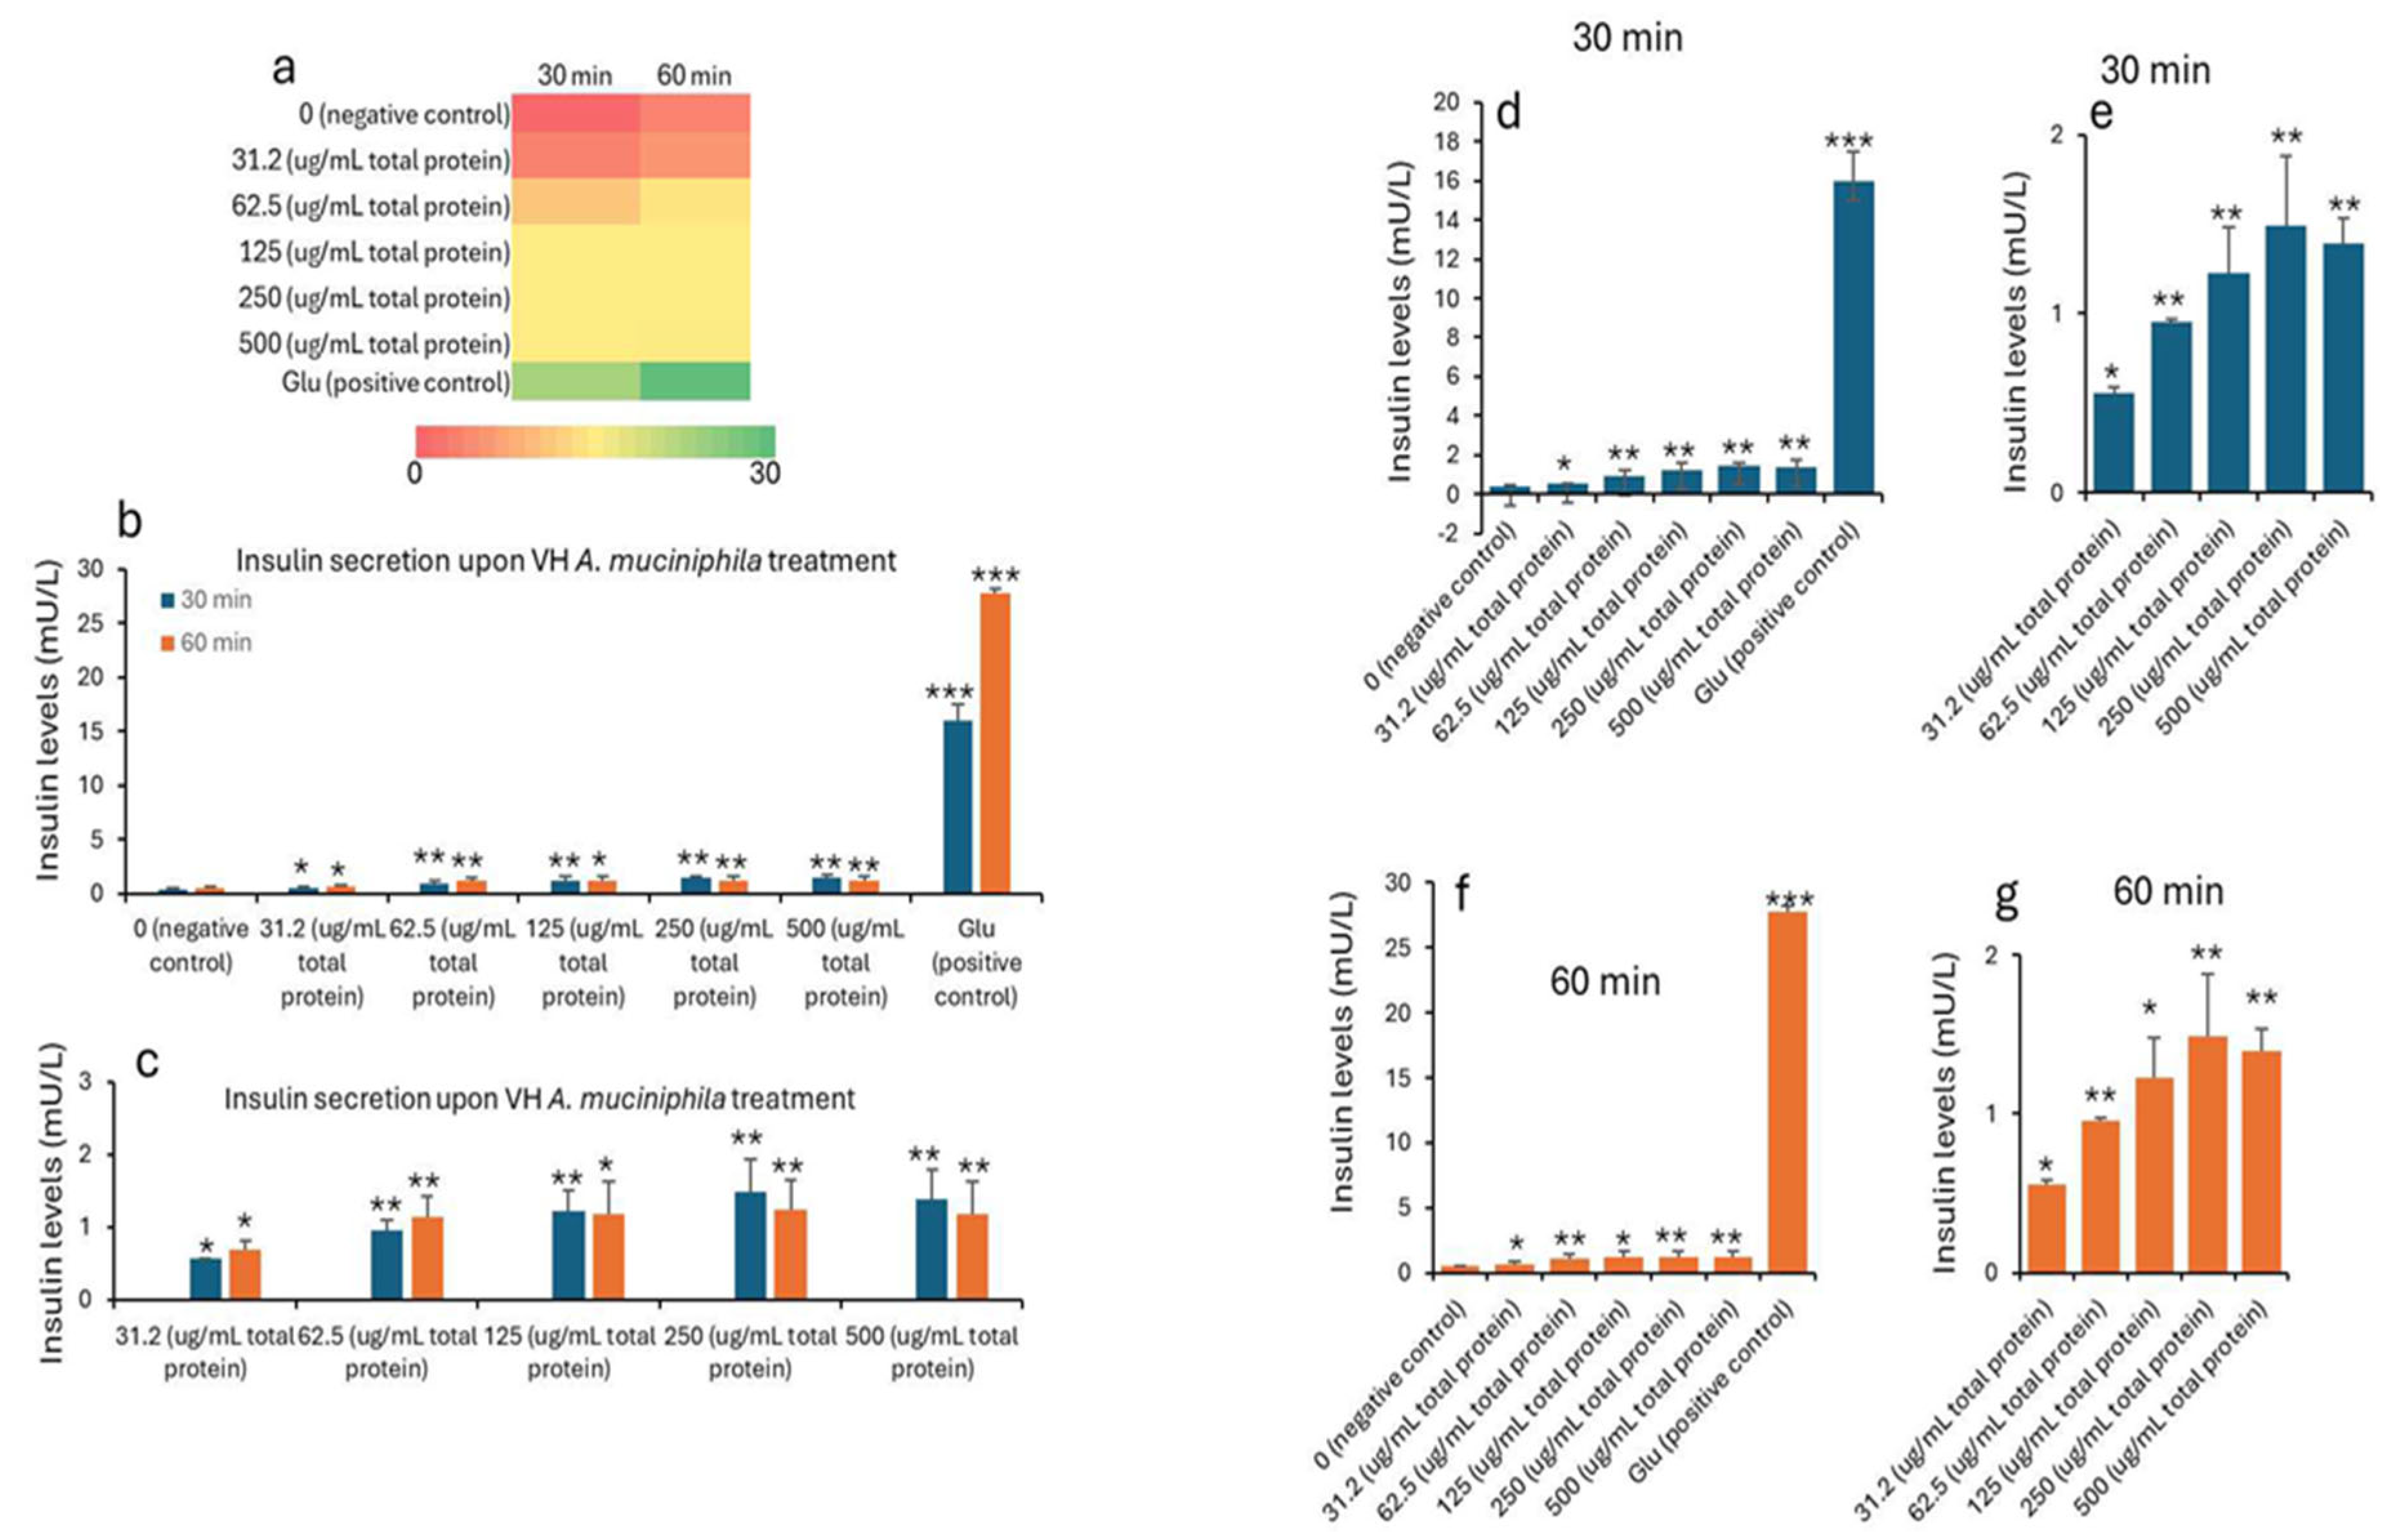
Figure 2.
Percent change in insulin levels (mU/L) in INS1 cells treated with VH Akkermansia muciniphila cell extract at various doses (0 [negative control], 31.2, 52.5, 125, 250, and 500 µg/mL total protein) at 0 min (baseline), and after 30 and 60 minutes of treatment. a) Heatmap depicting insulin levels (red indicates low, yellow indicates medium, and green indicates high change) secretion. b,d,f) Percent of changes in insulin levels following different doses of VH Akkermansia muciniphila treatment at both 30 and 60 minutes (b), and 30-minute (d) and 60-minute (f) time points. c,e,g) Insulin levels in only treated groups with 31.2, 52.5, 125, 250, and 500 µg/mL total protein after 30 and 60 minutes of treatments. All assays were performed in three biological replicates. Values presented in bars are means, and error bars indicate SD. P-Values indicated with ***<0.001 are statistically significantly different compared to negative control.
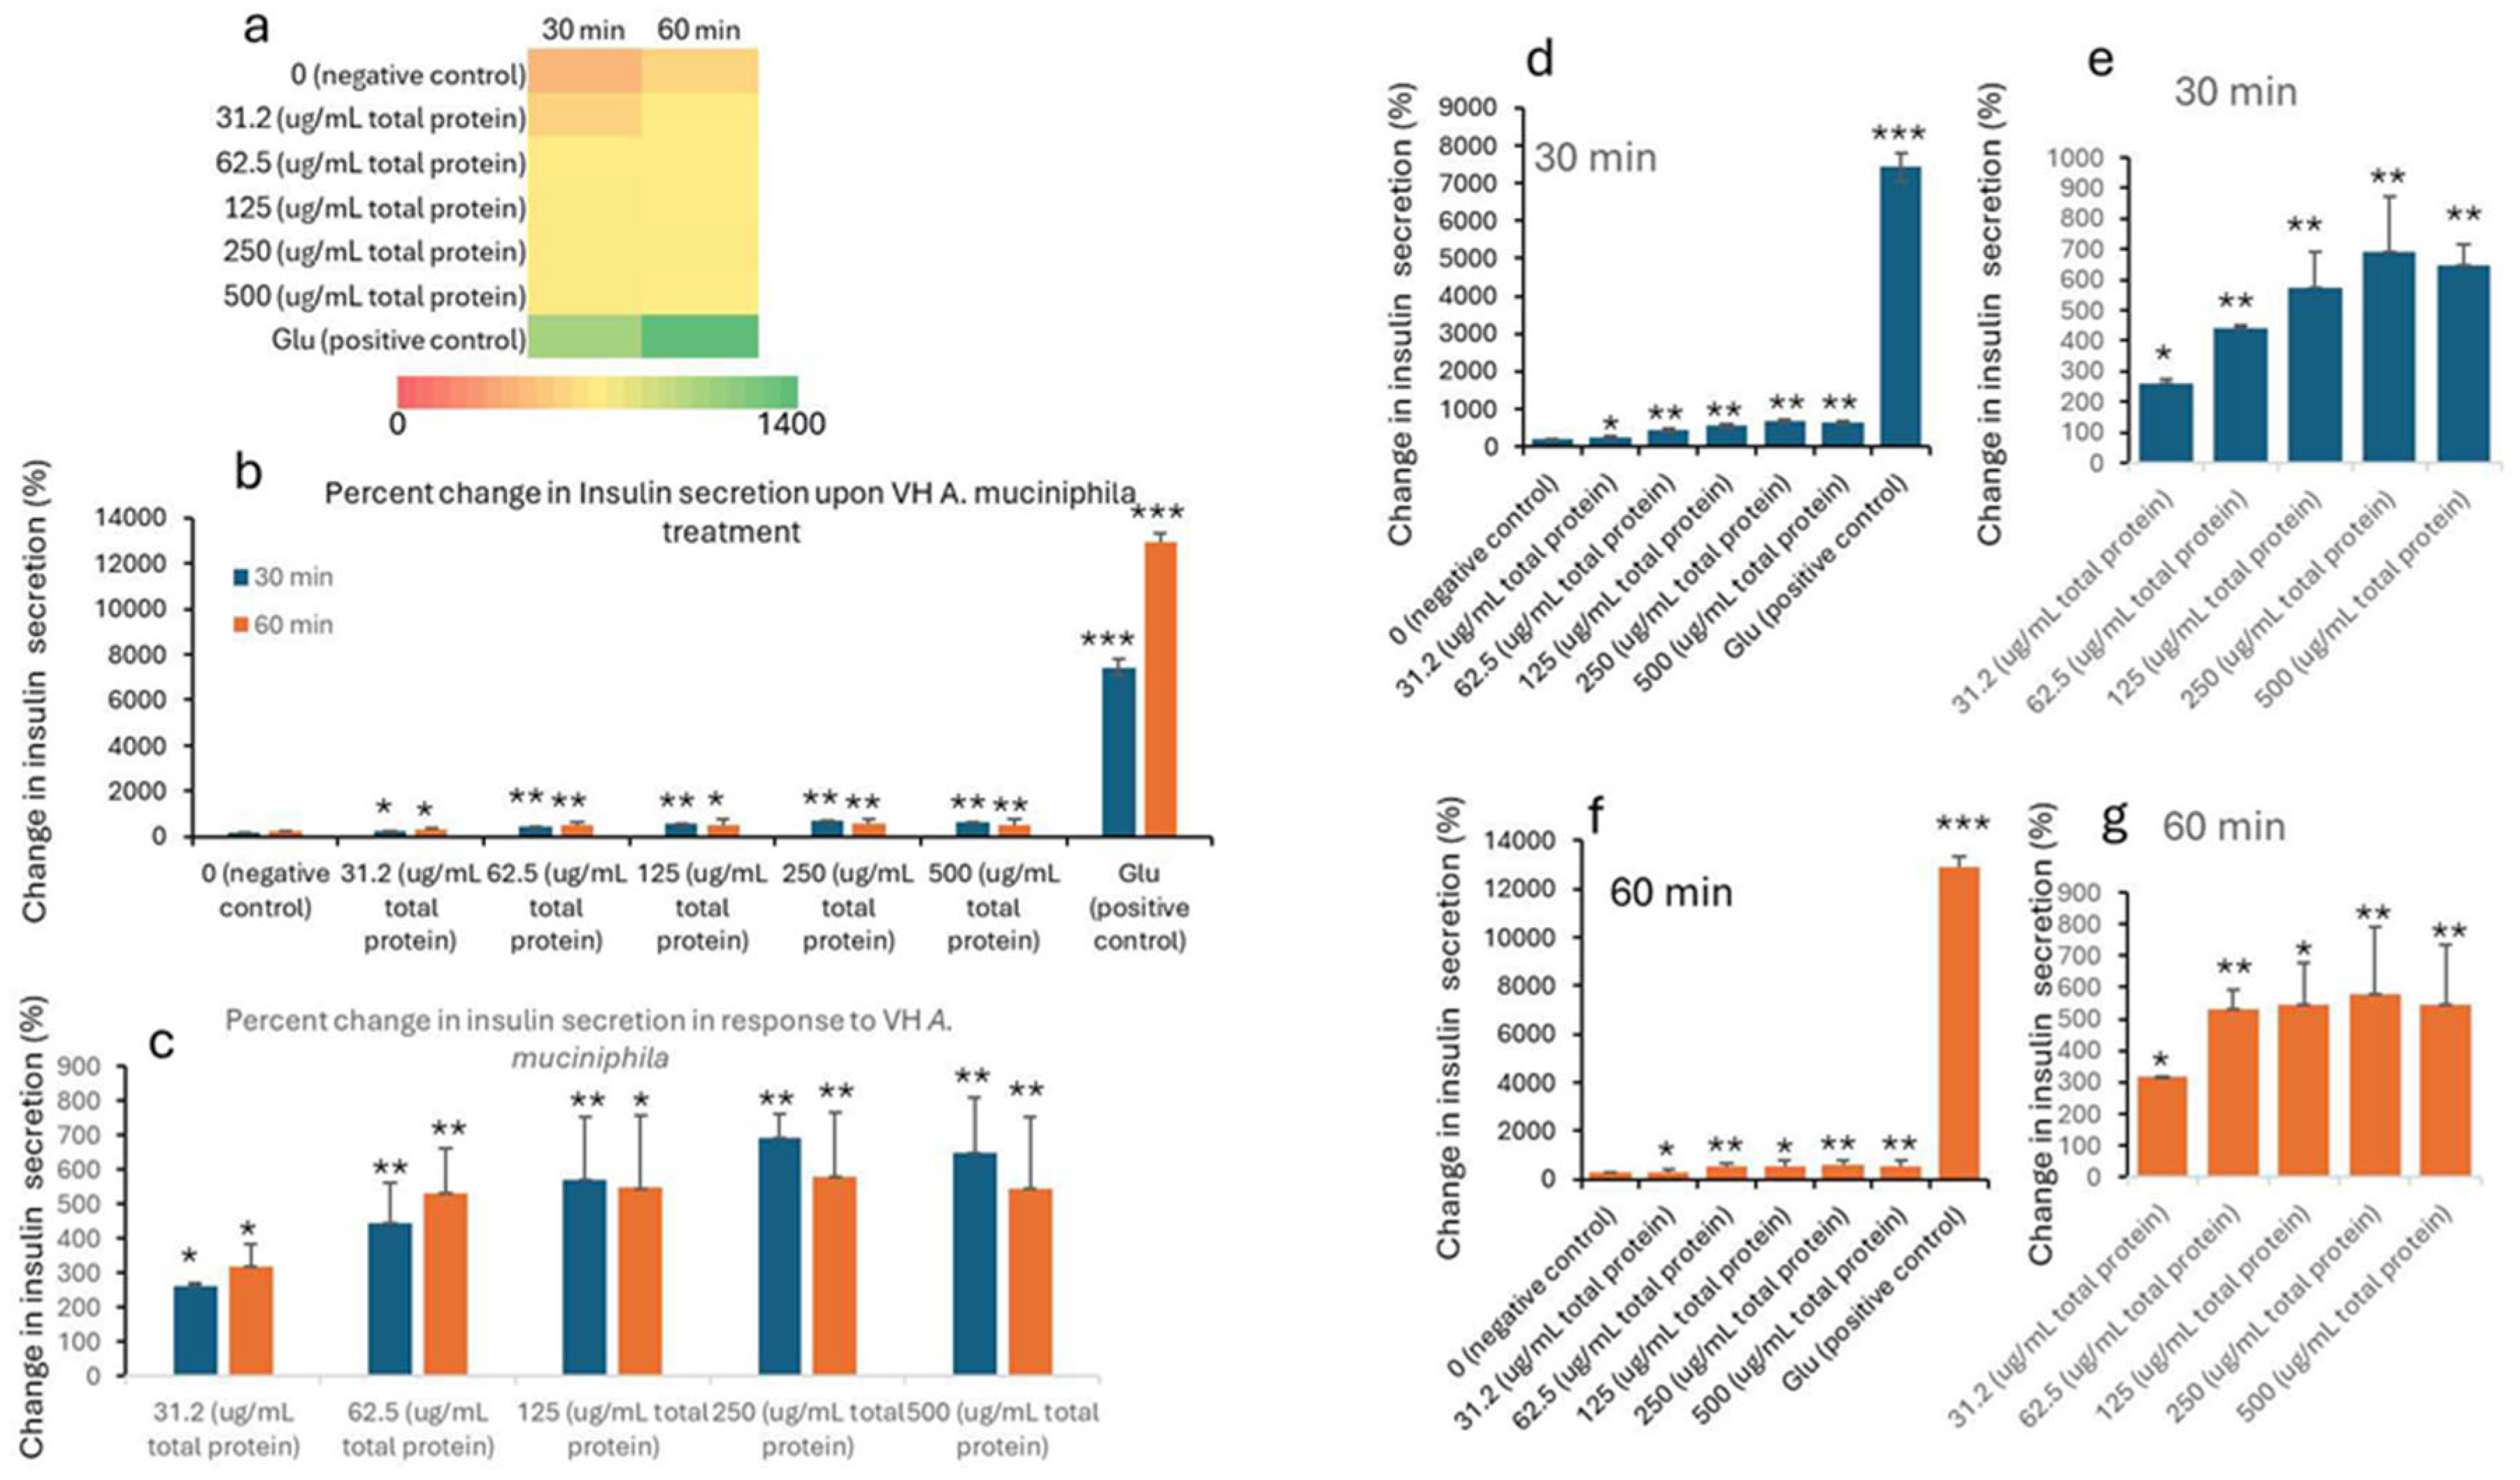
Figure 3.
GLP-1 levels (pM) in NCI-H716 cells treated with VH Akkermansia muciniphila cell extract at various doses (0 [negative control], 31.2, 52.5, 125, 250, and 500 µg/mL total protein) at 0 min (baseline), and after 30 and 60 minutes of treatment. a) Heatmap depicting GLP-1 levels (red indicates low, yellow indicates medium, and green indicates high levels) secretion. b-d) GLP-1 levels following different doses of VH Akkermansia muciniphila treatment at both 30 and 60 minutes (b), and 30-minute (c) and 60-minute (d) time points. All assays were performed in triplicates. Values presented in bars are means, and error bars indicate SD.
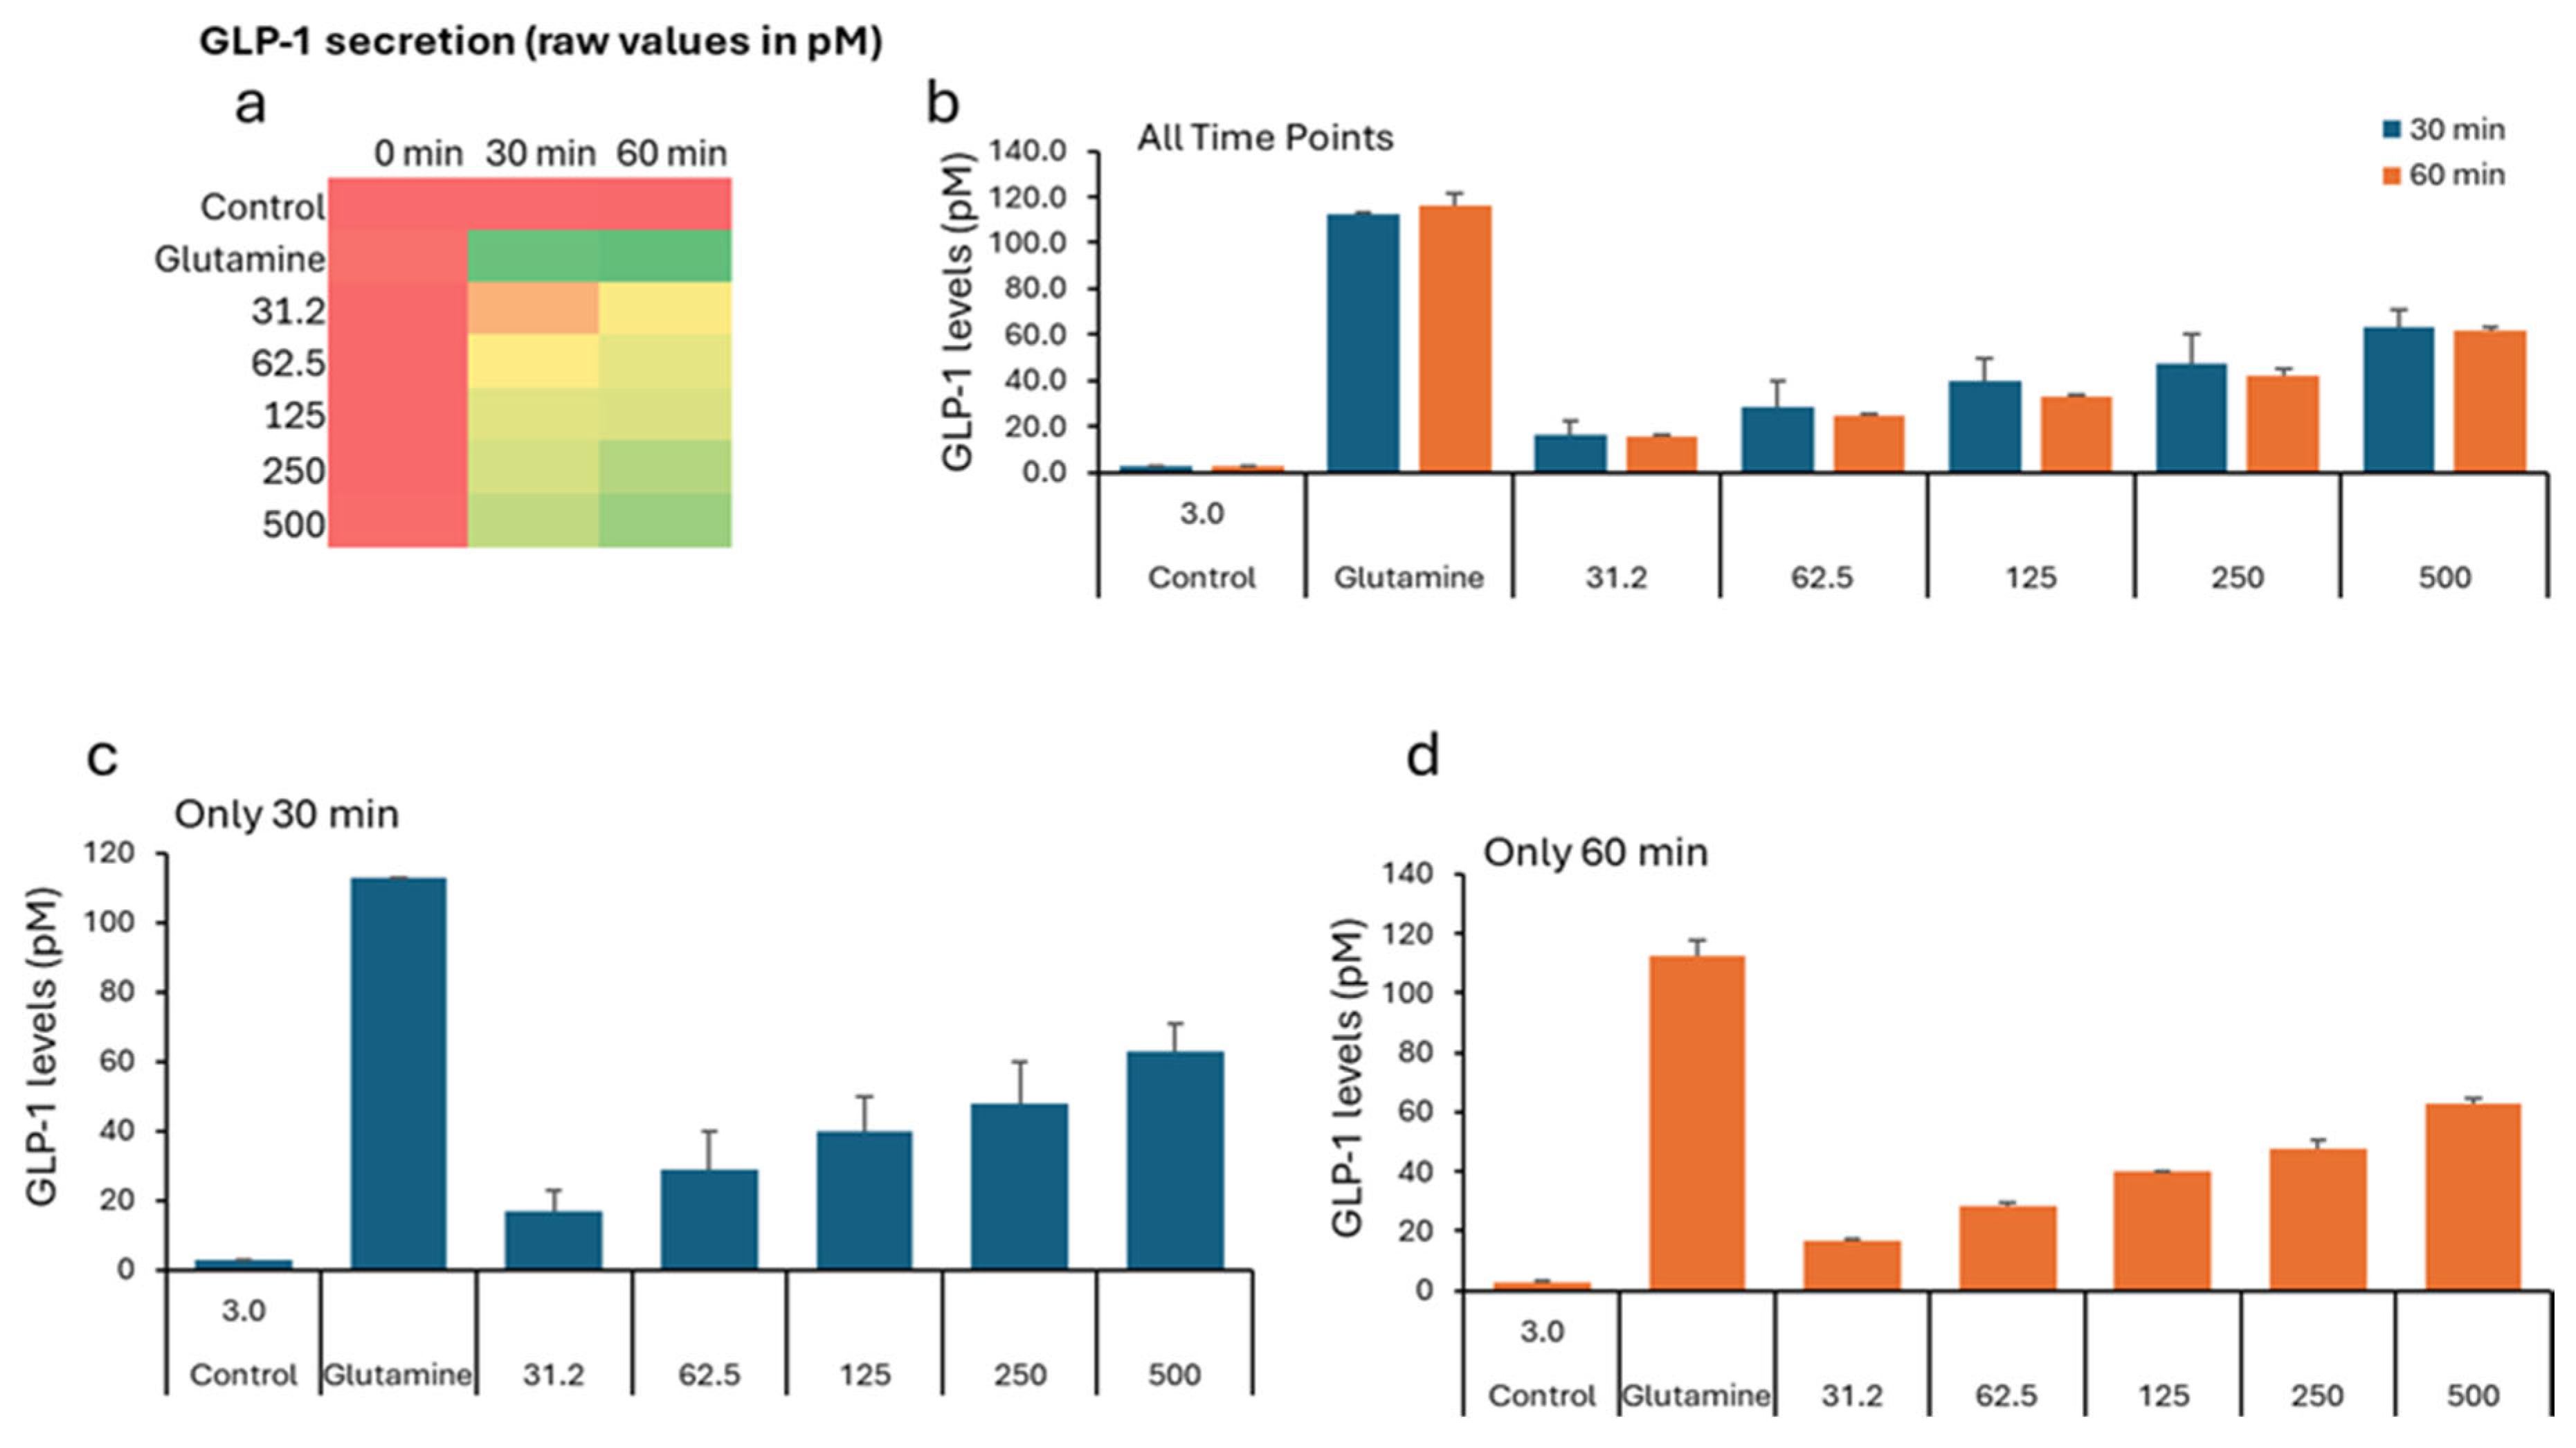
Figure 4.
Percent change in GLP-1 secretion relative to the negative control, in NCI-H716 cells treated with VH Akkermansia muciniphila cell extract at various doses (0 [negative control], 31.2, 52.5, 125, 250, and 500 µg/mL total protein) at 0 min (baseline), and after 30 and 60 minutes of treatment. a) Heatmap depicting change in GLP-1 levels (red indicates low, yellow indicates medium, and green indicates high levels) secretion. b-d) Change in GLP-1 levels following different doses of VH Akkermansia muciniphila treatment at both 30 and 60 minutes (b), and 30-minute (c) and 60-minute (d) time points. All assays were performed in triplicates. Values presented in bars are means, and error bars indicate SD.
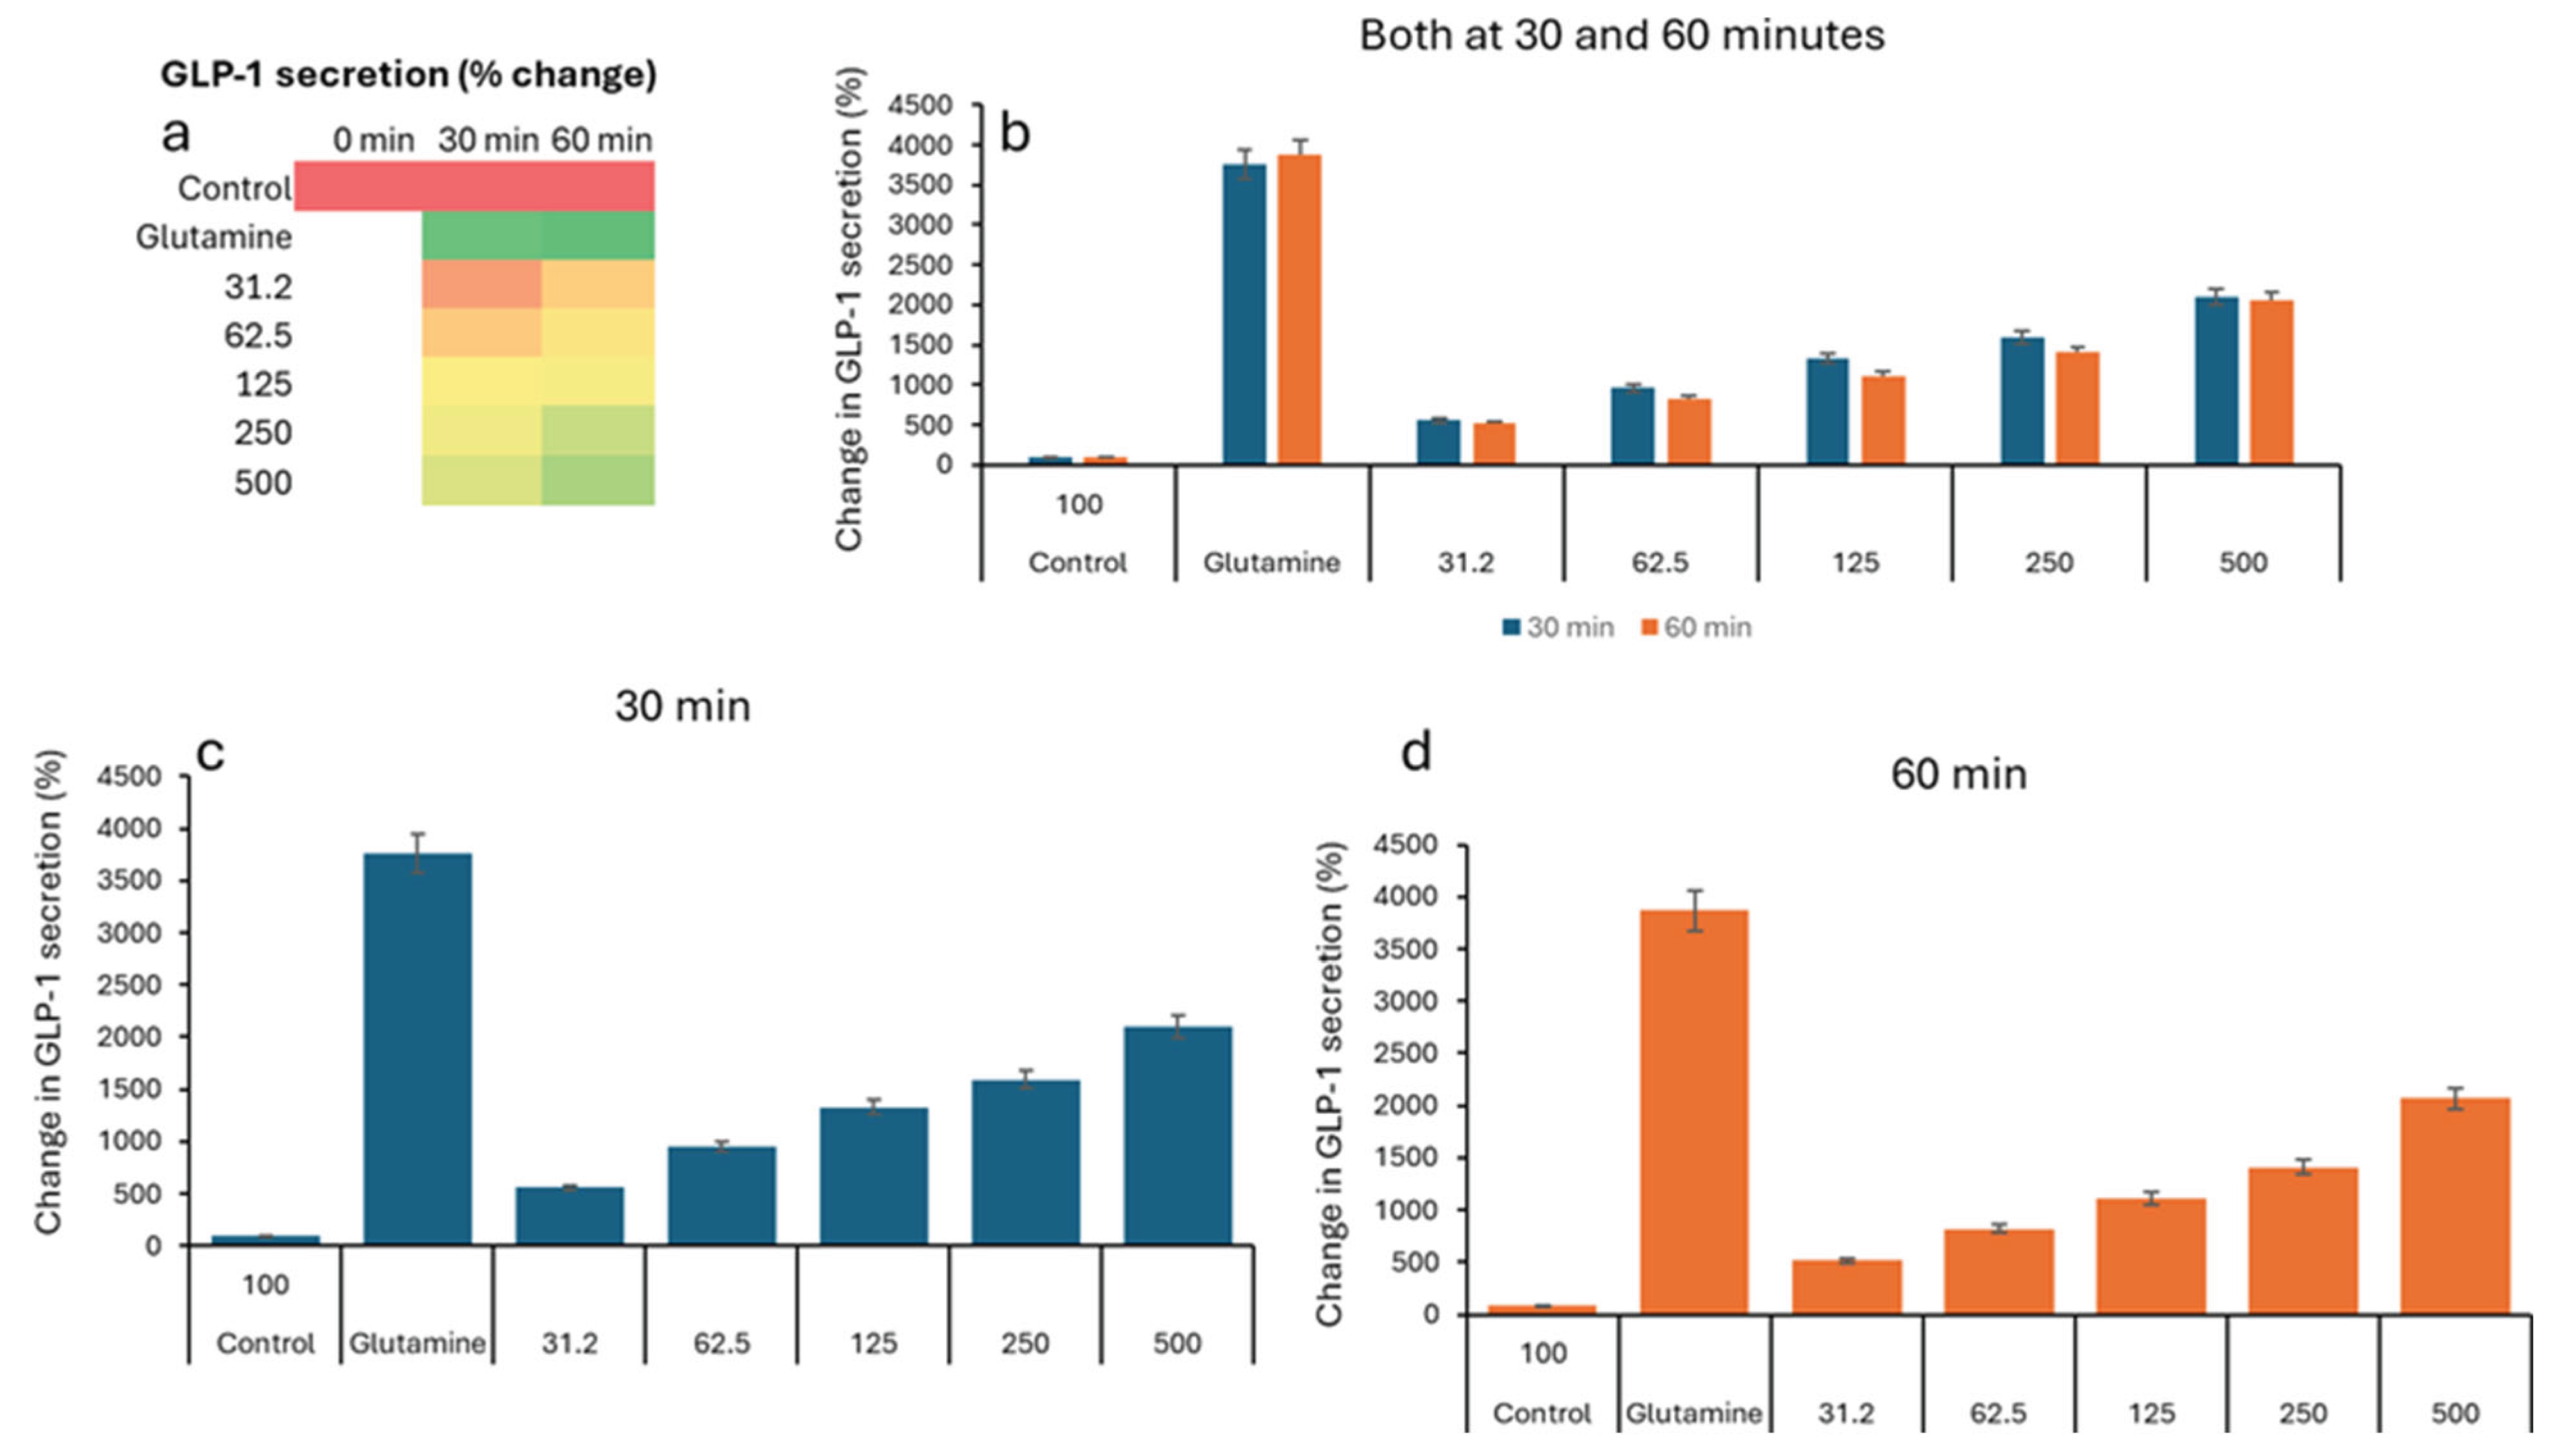

Table 1.
Insulin Concentration (mU/L) Levels in Media Supernatant Before and After Treatment of INS-1 Cells with VH A. muciniphila Cell Extracts.
Table 1.
Insulin Concentration (mU/L) Levels in Media Supernatant Before and After Treatment of INS-1 Cells with VH A. muciniphila Cell Extracts.
|
Treatment (µg/mL)* |
0 min (baseline) | 30 min | 60 min | ||||||||
| Mean | SD | SEM | Mean | SD | SEM | P Values | Mean | SD | SEM | P Values | |
| 0 (negative control) | 0.25 | 0.20 | 0.07 | 0.41 | 0.03 | 0.01 | 0.57 | 0.01 | 0.00 | ||
| 31.2 (ug/mL total protein) | 0.18 | 0.06 | 0.02 | 0.56 | 0.02 | 0.01 | 0.027 | 0.68 | 0.14 | 0.05 | 0.0182 |
| 62.5 (ug/mL total protein) | 0.95 | 0.25 | 0.08 | 0.009 | 1.14 | 0.29 | 0.10 | 0.0057 | |||
| 125 (ug/mL total protein) | 1.23 | 0.39 | 0.13 | 0.008 | 1.18 | 0.45 | 0.15 | 0.0158 | |||
|
250 (ug/mL total protein) |
1.49 | 0.14 | 0.05 | 0.0004 | 1.25 | 0.40 | 0.13 | 0.0092 | |||
| 500 (ug/mL total protein) | 1.39 | 0.35 | 0.12 | 0.0039 | 1.17 | 0.45 | 0.15 | 0.0153 | |||
| Glu (positive control) | 15.9 | 1.51 | 0.50 | 2.8E-05 | 27.7 | 0.45 | 0.15 | 4.08E-07 | |||
| *The total protein concentration of 31.2, 62.5, 125, 250, 500 ug/mL are equivalent to 0.625, 1.25, 2.5, 5 and 10 billion CFUs per well, respectively. All the assays were performed in three biological replicates. | |||||||||||
Table 2.
Percent change in insulin secretion in INS-1 Cells after A. muciniphila Cell Extracts.
|
Treatment (µg/mL)* |
0 min (baseline) | 30 min | 60 min | ||||||||
| Mean | SD | SEM | Mean | SD | SEM | P Values | Mean | SD | SEM | P Values | |
| 0 (negative control) | 117.42 | 91.57 | 30.52 | 191.34 | 13.52 | 4.51 | 263.71 | 2.48 | 0.83 | ||
| 31.2 (ug/mL total protein) | 82.58 | 27.84 | 9.28 | 260.39 | 8.51 | 2.84 | 0.027 | 317.28 | 64.06 | 21.35 | 0.0182 |
| 62.5 (ug/mL total protein) | 443.78 | 116.81 | 38.94 | 0.009 | 530.95 | 132.97 | 44.32 | 0.0057 | |||
| 125 (ug/mL total protein) | 572.27 | 180.74 | 60.25 | 0.008 | 546.95 | 210.22 | 70.07 | 0.0158 | |||
| 250 (ug/mL total protein) | 693.30 | 67.18 | 22.39 | 0.0004 | 579.84 | 187.53 | 62.51 | 0.0092 | |||
| 500 (ug/mL total protein) | 647.64 | 162.44 | 54.15 | 0.0039 | 546.33 | 207.60 | 69.20 | 0.0153 | |||
| Glu (positive control) | 7434.4 | 701.2 | 233.7 | 2.8E-05 | 12898.6 | 415.49 | 138.5 | 4.08E-07 | |||
| *The total protein concentration of 31.2, 62.5, 125, 250, 500 ug/mL are equivalent to 0.625, 1.25, 2.5, 5 and 10 billion CFUs per well, respectively. All the assays were performed in three biological replicates. | |||||||||||
Table 3.
Concentration of GLP-1 (pM) levels in media supernatant before and after treatment of VH A. muciniphila cell extracts and glutamine as a positive control.
Table 3.
Concentration of GLP-1 (pM) levels in media supernatant before and after treatment of VH A. muciniphila cell extracts and glutamine as a positive control.
|
Treatment (µg/mL)* |
0 min (baseline) |
30 min |
60 min |
||||||
|
Mean |
SD |
SEM |
Mean | SD | SEM | Mean | SD | SEM | |
| 0 (Negative Control) |
2.82 | 0.89 | 0.30 | 2.76 | 0.25 | 0.08 | 2.59 | 0.46 | 0.15 |
| 31.2 | 2.42 | 0.35 | 0.12 | 25.78 | 3.45 | 1.15 | 45.66 | 4.74 | 1.58 |
| 62.5 | 2.32 | 0.20 | 0.07 | 43.79 | 6.85 | 2.28 | 54.93 | 10.85 | 3.62 |
| 125 | 2.49 | 0.46 | 0.15 | 58.03 | 11.26 | 3.75 | 60.53 | 9.22 | 3.07 |
| 250 | 2.40 | 0.17 | 0.06 | 62.92 | 2.79 | 0.93 | 78.46 | 11.77 | 3.92 |
| 500 | 3.45 | 0.35 | 0.12 | 72.10 | 7.74 | 2.58 | 89.57 | 8.58 | 2.86 |
| Positive Control (Glutamine- 10mM) | 5.07 | 2.21 | 0.74 | 112.63 | 0.48 | 0.16 | 115.93 | 5.23 | 1.74 |
| *The total protein concentration of 31.2, 62.5, 125, 250, 500 ug/mL are equivalent of 0.625, 1.25, 2.5, 5 and billion/ mL CFUs, respectively. | |||||||||
Disclaimer/Publisher’s Note: The statements, opinions and data contained in all publications are solely those of the individual author(s) and contributor(s) and not of MDPI and/or the editor(s). MDPI and/or the editor(s) disclaim responsibility for any injury to people or property resulting from any ideas, methods, instructions or products referred to in the content. |
© 2025 by the authors. Licensee MDPI, Basel, Switzerland. This article is an open access article distributed under the terms and conditions of the Creative Commons Attribution (CC BY) license (https://creativecommons.org/licenses/by/4.0/).
Copyright: This open access article is published under a Creative Commons CC BY 4.0 license, which permit the free download, distribution, and reuse, provided that the author and preprint are cited in any reuse.


