Submitted:
03 June 2025
Posted:
03 June 2025
You are already at the latest version
Abstract
With the rapid advancement of industrial intelligence, ensuring worker safety has become increasingly important. Wearing safety helmets is one of the key protective measures. The demand for detecting the wearing status of helmet chinstraps during production processes is growing. Existing detection methods often suffer from discomfort to the wearer or privacy invasion issues. To address these challenges, this paper proposes a non-intrusive helmet chinstrap wearing detection approach based on a bionic system inspired by the mechanosensory hair arrays on spider legs. This method employs multiple MEMS inertial sensors to simulate the sensory function of spider leg hair, enabling efficient data acquisition of helmet wearing states. Unlike traditional vibration-based detection, posture signals can reflect spatial structural features, but their fusion from multiple sensors increases signal complexity and background noise. Therefore, an improved adaptive convolutional neural network (ICNN) combined with a long short-term memory network (LSTM) is utilized to classify and recognize the tightness of the helmet chinstrap based on single-sensor and multi-sensor data. Experimental validation was performed using data collected from 20 subjects engaged in wall-climbing robot operation tasks. Results demonstrate that the proposed method achieves a high recognition accuracy of 96%. This study provides a user-friendly, privacy-preserving, and efficient solution for helmet-wearing detection in industrial environments.
Keywords:
Helmet-wearing detection
; Bionic spidersense system
; MEMS inertial sensors
; Improved CNN-LSTM
; Helmet chinstrap
1. Introduction
Smart manufacturing, as a crucial component of Industry 4.0, is profoundly transforming human work and daily life[1]. As the pace of industrial automation accelerates, safety management on industrial sites faces unprecedented challenges. Safety incidents can result in severe injuries or fatalities and can significantly impact production schedules and enterprise economics[2]. As a common form of personal protective equipment, safety helmets are vital for protecting workers’ heads at construction sites. While most industrial workers adhere to helmet-wearing regulations, assessing the standardization of helmet usage, especially evaluating whether the chinstrap is properly fastened[3,4], remains a highly challenging task.
Traditional safety compliance monitoring methods mainly rely on visual inspection via video surveillance[5,6], which can identify whether a worker is wearing a helmet but struggles to accurately assess whether it is worn correctly—particularly in complex working environments where the accuracy and real-time performance of such systems often fall short of safety management requirements. Furthermore, image-based detection demanding stable lighting conditions and fixed head and facial orientations[7,8]does not align well with real-world operational scenarios. Notably, facial data constitutes personal identifiable information[9], raising privacy concerns. Hence, developing an efficient, privacy-preserving detection method for helmet compliance remains a critical challenge.
Spiders possess highly developed mechanosensory systems, with their leg-based sensory organs serving as influential models in mechanical vibration perception research[10]. In further studies, the anterior legs of spiders contain diverse hair-like sensory structures that enhance stimulus perception[11,12]. Inspired by the sensing mechanisms of spider leg joints, researchers have developed ultra-sensitive mechanical crack sensors[13], capable of capturing strain and vibration signals with high mechanical sensitivity. Similarly, a tunable, highly sensitive epidermal sensor was developed[14], inspired by the natural ability of spider leg posture adjustments to actively modulate sensory sensitivity. These examples highlight the significant role of spider leg sensory systems—particularly the hair arrays—in mechanical perception. Although current bioinspired applications based on spider sensing primarily focus on sensor development, there is a lack of exploration at the sensory strategy level, indicating a need for further research into biomimetic sensing strategies.
In recent years, with the advancement of sensing technologies, MEMS (Micro-Electro-Mechanical Systems) sensors have emerged as a prominent research focus in the field of industrial safety monitoring due to their low power consumption, high accuracy, and strong anti-interference capabilities. Particularly in dynamic detection applications[15], MEMS sensors enable real-time capture of helmet posture and posture changes, providing more precise recognition of wearing states compared to traditional methods. Real-time monitoring of workers’ wearing conditions can effectively identify and alert for loosening or improper fastening of chinstraps, thereby reducing safety risks caused by non-standard wearing.
MEMS attitude sensors play a crucial role in various domains such as robot balance control, human motion analysis, and aircraft attitude measurement. As a subset of inertial measurement units (IMUs), these sensors are widely used in mobile robotics[16], human-robot collaboration[17] and other fields to detect real-time movement and attitude variations[18,19,20]. MEMS attitude sensors collect data signals including angular velocity, acceleration, and magnetic field intensity, which are essential for monitoring the operational state of humans or mechanical equipment[21]. However, in long-term state detection scenarios, MEMS attitude sensors often suffer from drift and low accuracy, making effective data preprocessing and appropriate model selection critical and necessary[22].
Traditional machine learning approaches have achieved some success in robot fault diagnosis but are limited by lengthy computation times, lower accuracy, and reliance on manual feature selection[23,24]. have become powerful tools for classification of sequential signals owing to their strong feature extraction and temporal modeling capabilities. Nonetheless, CNN architectures tend to be highly complex with numerous hyperparameters[25], Consequently, designing adaptive CNN models is considered an optimal strategy[26,27].
This study proposes a biomimetic helmet chinstrap tension detection system inspired by the sensory hairs on spider legs. By simulating the sensing process of spider leg hair arrays, a hierarchical perception strategy is designed using multiple attitude sensors to collect helmet posture data for identifying the tightness of helmet chinstraps. The specific contributions include: (1) Developing a helmet-wearing detection system based on bioinspired multi-layered attitude sensor configurations inspired by spider tactile sensing, utilizing three MEMS attitude sensors to acquire workers’ head posture features; (2) Designing an efficient data processing algorithm to classify and recognize helmet wearing states; (3) Validating system performance through laboratory experiments. Compared to existing methods, the proposed system can detect helmet-wearing status continuously and in real-time while effectively preserving user privacy and overcoming the limitations of conventional approaches. Figure 1 illustrates the overall research framework.
The paper is organized as follows: Section 2 introduces the bioinspired helmet chinstrap tension detection strategy based on spider leg hair arrays; Section 3 describes the implementation scheme of the helmet chinstrap tension recognition system and proposes an improved CNN-LSTM model for classification of helmet-wearing states; Section 4 details the experimental data collection and testing conditions; Section 5 presents the experimental setup and results analysis; finally, Section 6 concludes the paper and discusses future research directions.
2. Detection Strategy for Helmet Chin Strap Tightness Inspired by Spiny Leg Bristle Sensory Mechanisms
This chapter explores the feasibility of utilizing biomimetic design, inspired by the sensory characteristics of spider leg bristles, to develop a method for detecting the tightness of helmet chin straps. The process involves analyzing the fundamental principles and constraints associated with the tension of the chin strap.
2.1. Biomimetic Design of the Sensory Strategy Based on Spider Leg Bristles
Spider legs are covered with highly sensitive tactile organs capable of perceiving minute vibrations and touches. These sensory structures are particularly responsive to subtle force variations. Spiders utilize these tactile signals to determine prey position, size, and movement, enabling rapid responses during hunting. The tactile organs on spider legs are extremely sensitive, capable of detecting extremely small forces and vibrations. Each leg is equipped with multiple sensory setae known as trichobothria. Each sensory seta consists of a long or short, thin hair embedded in a cup-shaped base with a membrane. Each seta can provide unique information regarding the prey’s position and movement relative to the spider[28]. This sensitivity arises due to the different lengths of the setae, which confer varied sensitivities to different force intensities and vibrational stimuli. Similarly, for safety helmets, the relative dynamics and motion between the helmet and the head vary under different wearing conditions, especially when the chin strap tightness differs. Detecting these differences could enable the identification of the helmet’s fit status.
Drawing inspiration from this biological mechanism, we designed a sensor system comprising three types of sensors that mimic the vibration characteristics of different setae lengths. These sensors are mounted externally on the helmet shell to achieve high-sensitivity monitoring of vibration responses. As illustrated in Figure 2, Sensor 1 is fixed directly on the helmet surface, simulating a short seta; Sensor 2 is connected via a relatively short fiber rod, mimicking a medium-length seta; and Sensor 3 employs a longer fiber rod to simulate the vibrational properties of a long seta. The installation parameters of these sensors are detailed in Table 1.

Table 1.
Sensor Installation Parameters
| Number | Installation Location | Fiber Rod Diameter (mm) | Fiber Rod Length (mm) |
|---|---|---|---|
| 1 | Front | 0 | 0 |
| 2 | Middle | 2 | 50 |
| 3 | Rear | 0 | 80 |
2.2. Principle of Chinstrap Tightness Recognition under Safety Helmet
To further investigate the feasibility of detecting chinstrap tightness in safety helmets, we analyze the posture, motion, or behavior of the human head during movement to identify the chinstrap tightness condition. Essentially, this involves using accelerometers to monitor the helmet’s attitude modes and thereby infer the relative slippage between the helmet and the human head. The detailed principle is as follows:
(1) Dynamics Coupling and Relative Motion Model between Helmet and Head
When the helmet is connected to the head via the chinstrap, forming either a rigid or flexible link, their motion state can be described by rigid body dynamics. Let the head motion trajectory be the reference frame; the helmet acceleration can be decomposed as:
where, is the true acceleration of the head, is the relative acceleration between helmet and head.
By applying the Newton-Euler equations, the dynamic relationship of the helmet-head system is established as:
where, represents the helmet mass, is the chinstrap tension, c is the system damping coefficient, represents helmet displacement related to potential energy.
It can be observed that when the tightness k decreases, increases, alongside a marked rise in high-frequency attitude components.
(2) Attitude Response and Damping Characteristic Analysis
Modeling the helmet-head system as a mass-spring-damper system, its equation of motion is expressed as:
where, is the effective damping coefficient correlated with chinstrap tightness, is the system stiffness, and is the external excitation force.
By conducting frequency domain response analysis, the transfer function can be derived as:
Assuming constants , and varying k from 0 to 1 in increments of 0.25, the corresponding transfer functions are plotted in Figure 3.
From the results, it is evident that when chinstrap tightness is insufficient (i.e., k decreases), the system damping diminishes, causing a reduction in the transfer function gain across the frequency spectrum, particularly within the low-frequency range. This implies that smaller k values weaken the system’s response to low-frequency signals.
3. Implementation Scheme of Helmet Chin Strap Tightness Recognition System
This section analyzes the data acquisition of MEMS sensors for recognizing the tightness of the helmet chin strap. It provides a detailed description of the mathematical processing of the data and the proposed ICNN-LSTM model, discussing the extraction of discriminative features related to chin strap tightness from the attitude data.
3.1. Definition and Analogy of Helmet Chin Strap Tightness
The objective of this study is to enable helmets to accurately identify different tightness levels of the chin strap during wearing. Traditional standards for chin strap tightness in safety helmets are relatively vague, and quantification standards and measurement methods are challenging to establish. Therefore, this section defines three categories of chin strap tightness by equivalently measuring the tensile force when a 1.5 cm gap is created between the helmet’s chin strap and the wearer’s chin. These categories are then compared with actual wearing conditions, as illustrated in Figure 4.
Accordingly, based on the chin strap tightness, the wearing status of a safety helmet can be classified into the following three types:
(1) Not fastened properly: The helmet is worn, but the chin strap buckle remains disengaged and does not contact the wearer’s chin, resulting in a loose fit. When the chin strap is pulled vertically downward with a force gauge to create a 1.5 cm gap between the strap and the chin, the tensile force is less than 1 N.
(2) Loose: After manual adjustment of the chin strap while the helmet is worn, when the chin strap is pulled vertically downward to create a 1.5 cm gap, the tensile force ranges between 1 N and 3 N.
(3) Sandard: Similarly, after manual adjustment under worn conditions, the tensile force measured by pulling the chin strap vertically downward to create a 1.5 cm gap exceeds 5 N.
3.2. Hardware Composition of the Helmet Chin Strap Tightness Sensing System
The proposed wearing-aware helmet system comprises MEMS attitude sensors integrated with an ordinary helmet, as shown in Figure 5, which illustrates the physical setup and the sensor’s coordinate system. The MEMS attitude sensor includes a three-axis accelerometer, three-axis gyroscope, and three-axis magnetometer, capable of real-time detection of workers’movement amplitude and frequency on the helmet. The sensor is securely fixed to the helmet, and communicates with the data processing module via 5G Bluetooth.
Key sensor specifications are as follows:
Measurement Range:
Sampling Frequency Range: 0.2 kHz to 100 kHz (configured at 100 Hz for this study)
Resolution: 0.061 (/ s)per LSB
Static Bias Drift: to
Temperature Drift: to
Sensitivity Noise:
3.3. Data Acquisition from Helmet MEMS Attitude Sensors
The low-cost WT9011DCL-BT50 series attitude sensors used in this study exhibit a 1 g gravitational acceleration reading even after calibration to zero. Additionally, the initial orientation of the sensor may not be consistent each time, which increases the variability in the training data and subsequently reduces the generalization performance of the model. To mitigate the impact of variations in sensor installation direction and gravity orientation on model training and prediction performance, this study scalarizes the three-axis acceleration vector output from the sensor, Let , , denote the acceleration values along the x, y, z axes, respectively. he sensor’s output acceleration vector is denoted as .
The vector magnitude is computed and transformed into a scalar value, which is then used as an input feature to avoid data errors caused by inconsistent installation directions. The calculation process can be represented as follows:
The input signal for the model is then represented by:
In this study, a Butterworth filter is employed, which has a maximally flat frequency response and is ideal for applications that require smooth frequency characteristics. The filter design is based on the following mathematical model:
where represents the transfer function of the filter, and is the cutoff frequency, n is the order of the filter.
After filtering, we use the MinMaxScaler to normalize the data, mapping it to the range . The normalization formula is given by:
where x s the original data, and are the minimum and maximum values of the data, is the normalized data.
3.4. Feature Generation
After data preprocessing, it is essential to represent and extract the features of the data. Choosing an appropriate representation mode for subsequent computations is crucial. The MEMS sensor unit used in this study operates at a frequency of 100 Hz. To facilitate data processing, the collected attitude data is segmented, with each segment containing 64 attitude data points from the experimental platform. Time-domain and frequency-domain features are computed for each segment, resulting in the generation of 17 features. Table 2 presents the names and categories of the generated features. The features are then normalized to obtain the feature vectors used for training.
3.5. Helmet Chinstrap Tightness Recognition Framework Based on ICNN-LSTM Network
To utilize the signals from the MEMS attitude sensors in the helmet for chinstrap tightness recognition, this study proposes a classification process for helmet chinstrap tightness, as shown in Figure 6. The process begins with preprocessing the input attitude signals. Next, 30% of the data is designated as the test set, while 70% is used for training. Subsequently, the proposed ICNN-LSTM model is trained using the training set for classification.
(1) Feature Extraction: Adaptive Convolutional Neural Network (ICNN)
Table 2.
Class Names and Categories for All Feature Dimensions
| Feature Dimension | Feature Type | Category |
|---|---|---|
| 1 | Mean | Time Domain |
| 2 | Standard Deviation | Time Domain |
| 3 | Maximum Value | Time Domain |
| 4 | Minimum Value | Time Domain |
| 5 | Norm | Time Domain |
| 6 | Energy | Time Domain |
| 7 | Kurtosis | Time Domain |
| 8 | Skewness | Time Domain |
| 9 | Simple Mean Absolute Value | Time Domain |
| 10 | Autocorrelation | Time Domain |
| 11 | Autocorrelation Lag 2 | Time Domain |
| 12 | Autocorrelation Lag 3 | Time Domain |
| 13 | Mean Power Frequency | Frequency Domain |
| 14 | Median Frequency | Frequency Domain |
| 15 | Total Power | Frequency Domain |
| 16 | Maximum Power Spectral Density | Frequency Domain |
| 17 | Zero Crossing Rate | Frequency Domain |
In the model construction, the Adaptive Convolutional Neural Network (ICNN) architecture combines classical convolutional operations with an adaptive ReLU activation function to enhance the network’s expressive power and classification performance. The structure consists of multiple convolutional blocks, each containing a 1D convolutional layer, an adaptive activation layer, a max-pooling layer, and a dropout layer. This provides rich information for further discriminative feature extraction. In the convolutional layers, we use a classic fixed kernel size and filter count, with a kernel size of 3 and 64 filters to extract local features from the input data, capturing short-term dependencies in the sequential data. After each convolutional block, an adaptive ReLU activation layer is added to further enhance the network’s non-linear expressive capability, which is defined as follows::
Let represent the output of the i -th neuron in the I -th layer after applying the adaptive ReLU activation function, denote the input feature values to the batch normalization (BN) layer, and be the adaptive parameter to be learned by the layer. The design of adaptive ReLU aims to enhance the network’s ability to handle negative values. By utilizing an adaptive negative slope, it maintains non-linearity while increasing the model’s ability to adjust feature distributions.
Moreover, to prevent feature redundancy and overfitting, each convolutional block also includes a max pooling layer and a dropout layer. The max pooling layer employs a pooling window of size 1 to reduce feature dimensions and enhance local feature selectivity, while the dropout layer discards 20% of the neurons in each convolutional block to further mitigate the risk of overfitting.
(2) Dangerous State Classification: Long Short-Term Memory (LSTM) Layer
The LSTM layer used in the convolutional and LSTM integrated neural network (ICNN-LSTM) is designed to extract temporal features and further model the temporal dependencies of local features encoded in the convolutional feature maps. The LSTM layer consists of multiple memory units, which regulate information updates at each time step through input gates, forget gates, and output gates. First, the output of the convolutional block is fed into the LSTM layer, where the LSTM units process the information at each time step sequentially to form a comprehensive temporal feature representation.
The output of each LSTM unit is produced by the combination of the internal memory unit and the output gate . The update process of the memory unit is as follows:
where , and represent the forget gate, input gate, and candidate memory cell state, respectively. The forget gate determines which past information to retain or discard, the input gate controls the degree of current information storage, and the candidate memory cell state holds the new information temporarily. Finally, the output of the LSTM unit is generated through the output gate , calculated as:
Through this gating mechanism, the LSTM can dynamically update its state at each time step, capturing long-range dependencies in the temporal data.
Lastly, all outputs from the LSTM layer are passed to the fully connected layer via a flattening operation, generating a final discriminative feature map . This feature map can further be input into a classifier composed of fully connected layers and a Softmax layer to obtain the classification probability outputs of the time-series data. Additionally, this feature map can be used for cross-domain feature extraction in transfer learning frameworks, enhancing the model’s generalization ability under varying data conditions.
The integration of the ICNN network with the LSTM network forms the ICNN-LSTM network, as shown in Figure 7.
Algorithm 1 describes the implementation process of the ICNN-LSTM classification algorithm.
| Algorithm 1: ICNN-LSTM Model Training and Evaluation |
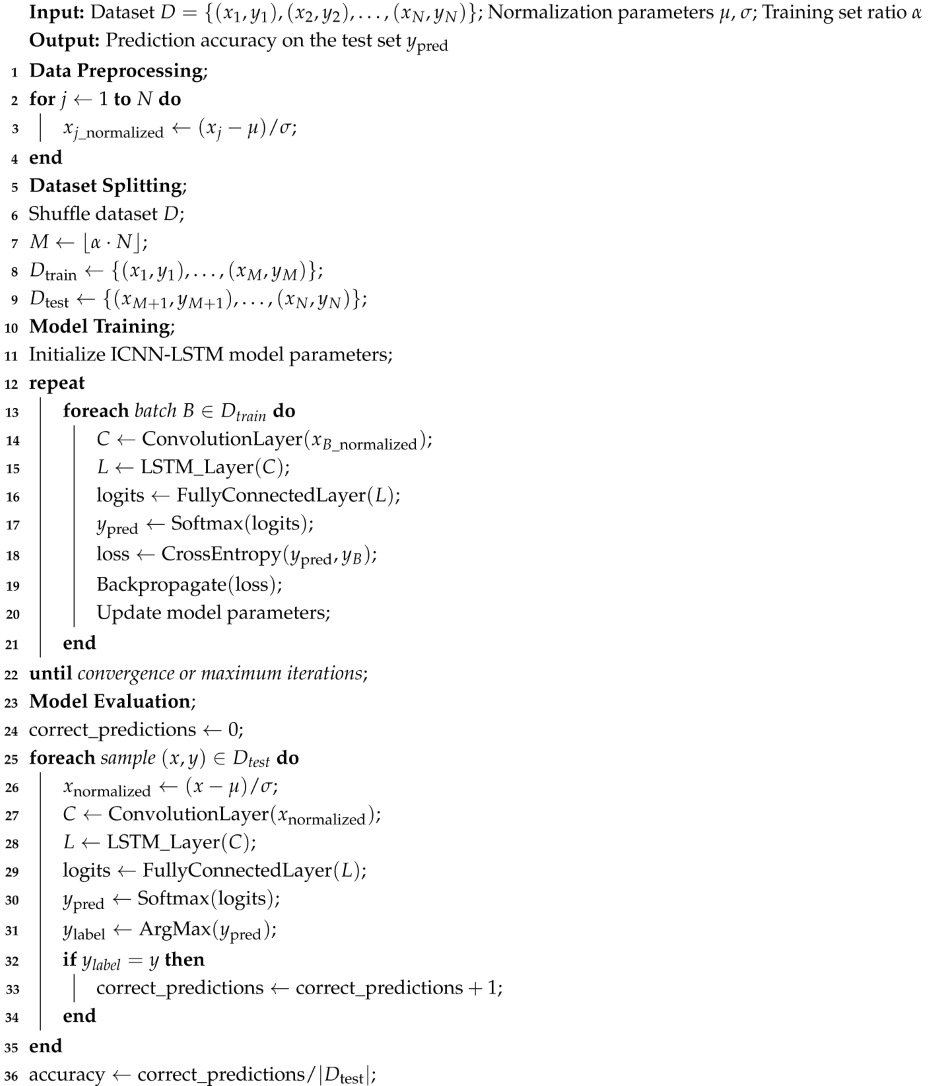 |
4. Experimental Data Preparation
4.1. Experimental Setup
In this section, to evaluate the effectiveness of the proposed method for sensing and classifying the chinstrap tightness state of the safety helmet, we use a shipboard wall-climbing robot control test system to simulate the daily tasks of workers. As shown in Figure 8, this system consists of the operator, an intelligent safety helmet, a wheeled wall-climbing robot, helmet and posture sensors, an arcuate steel plate wall, and a load module.
The task simulation experiment is conducted in a controlled laboratory environment, where the steel plate and frame are securely fixed. The operators, who have received training, are proficient and stable in operation. The experiment requires the operator to use a wireless controller to direct the robot along a specified path. The operator is required to sit in a fixed position and maintain continuous visual attention on the robot and its surrounding environment until the robot reaches the designated position, at which point the task is considered complete.
4.2. Experimental Participants
The experiment was conducted in an indoor laboratory at Harbin Engineering University, where data collection was performed with a total of 10 participants. All participants were graduate students, consisting of 9 males and 1 female. Due to the male-to-female ratio in the laboratory, it was not possible to achieve gender balance in this experiment. All participants were in good physical condition on the day of the test. Before the test began, personal information such as age, gender, height, weight, and body fat percentage for each participant was recorded, as shown in Table 3.
Table 3.
Personal Information of Participants
| Number | Age | Gender | Height (cm) | Weight (kg) | BMI | BMI |
|---|---|---|---|---|---|---|
| 1 | 24 | Female | 168 | 52 | 19.8 | 22 |
| 2 | 24 | Male | 175 | 75 | 24.4 | 18 |
| 3 | 25 | Male | 176 | 70 | 22.6 | 16 |
| 4 | 26 | Male | 180 | 78 | 24.1 | 19 |
| 5 | 24 | Male | 182 | 78 | 23.5 | 20 |
| 6 | 25 | Male | 177 | 82 | 26.2 | 22 |
| 7 | 24 | Male | 175 | 75 | 24.4 | 18 |
| 8 | 26 | Male | 180 | 75 | 23.1 | 17 |
| 9 | 27 | Male | 180 | 82 | 25.3 | 23 |
| 10 | 25 | Male | 178 | 78 | 24.6 | 21 |
Each participant’s experiment consisted of three steps:
Step 1: Collection of Basic Information and Pre-training
Participants first report their basic information. The researchers introduce the purpose, procedure, equipment, and task requirements of the experiment to the eligible participants. All subjects undergo pre-training before the main experiment, learning how to use the control joystick to complete the robot transportation task. After the pre-training, each participant takes a 10-minute break to remain alert and awake.
Step 2: Execution of Wall-climbing Robot Transport Task and Data Collection
Participants wear a safety helmet secured by a standard chinstrap. In the experimental setting, they follow the operational guidelines (such as remaining at the designated workstation and continuously monitoring the robot) and use the control joystick to direct the mobile robot along the prescribed path to complete the wall-climbing task. The robot’s climbing speed is set at 0.05 m/s, 0.1 m/s, and 0.2 m/s, with three cycles of experiments conducted. The safety helmet continuously collects data from the MEMS sensors, which are transmitted to the host computer for storage.
Step 3: Variation of Chinstrap Tightness and Repeated Experiments
The participant adjusts the tightness of the chinstrap to a looser setting and repeats the operations from Step 2, saving the data. Subsequently, the chinstrap is loosened entirely (unfastened), and Step 2 is repeated again, with data saved. Each participant is required to complete the collection of data for three sets of experimental conditions.
5. Results and Discussion
5.1. Hyperparameter Settings
Next, a CNN-LSTM network was used to classify participants’ helmet wear. The dataset was split into training, validation, and testing sets in a 7:1:2 ratio. Six-fold cross-validation was employed to assess the classification performance of the dual model. The results indicated that our fine-tuning process, with the parameters for the number of epochs, dropout rate, batch size, and learning rate set to 30, 0.2, 32, and 0.001, respectively, yielded the best accuracy.
(1) Learning Rate
The learning rate controls whether and under what conditions the objective function converges. An appropriate learning rate helps the objective function reach a local minimum at the right time. Based on prior training experience, this study selected a decreasing learning rate starting at 0.1, reducing by a factor of 10 each time. The training results were recorded, and loss and accuracy curves were plotted, as shown in Figure 9. The results revealed that after 30 iterations, when the learning rate was set to 0.001, the accuracy had surpassed 90%, which was higher than the accuracies at 0.1 and 0.01. Additionally, the accuracy and loss curves were smoother. Therefore, considering both convergence speed and accuracy, a learning rate of 0.001 was chosen as the initial learning rate for training.
(2) Training Batch Size
Figure 10.
Accuracy rates corresponding to different training batch values for the three labels
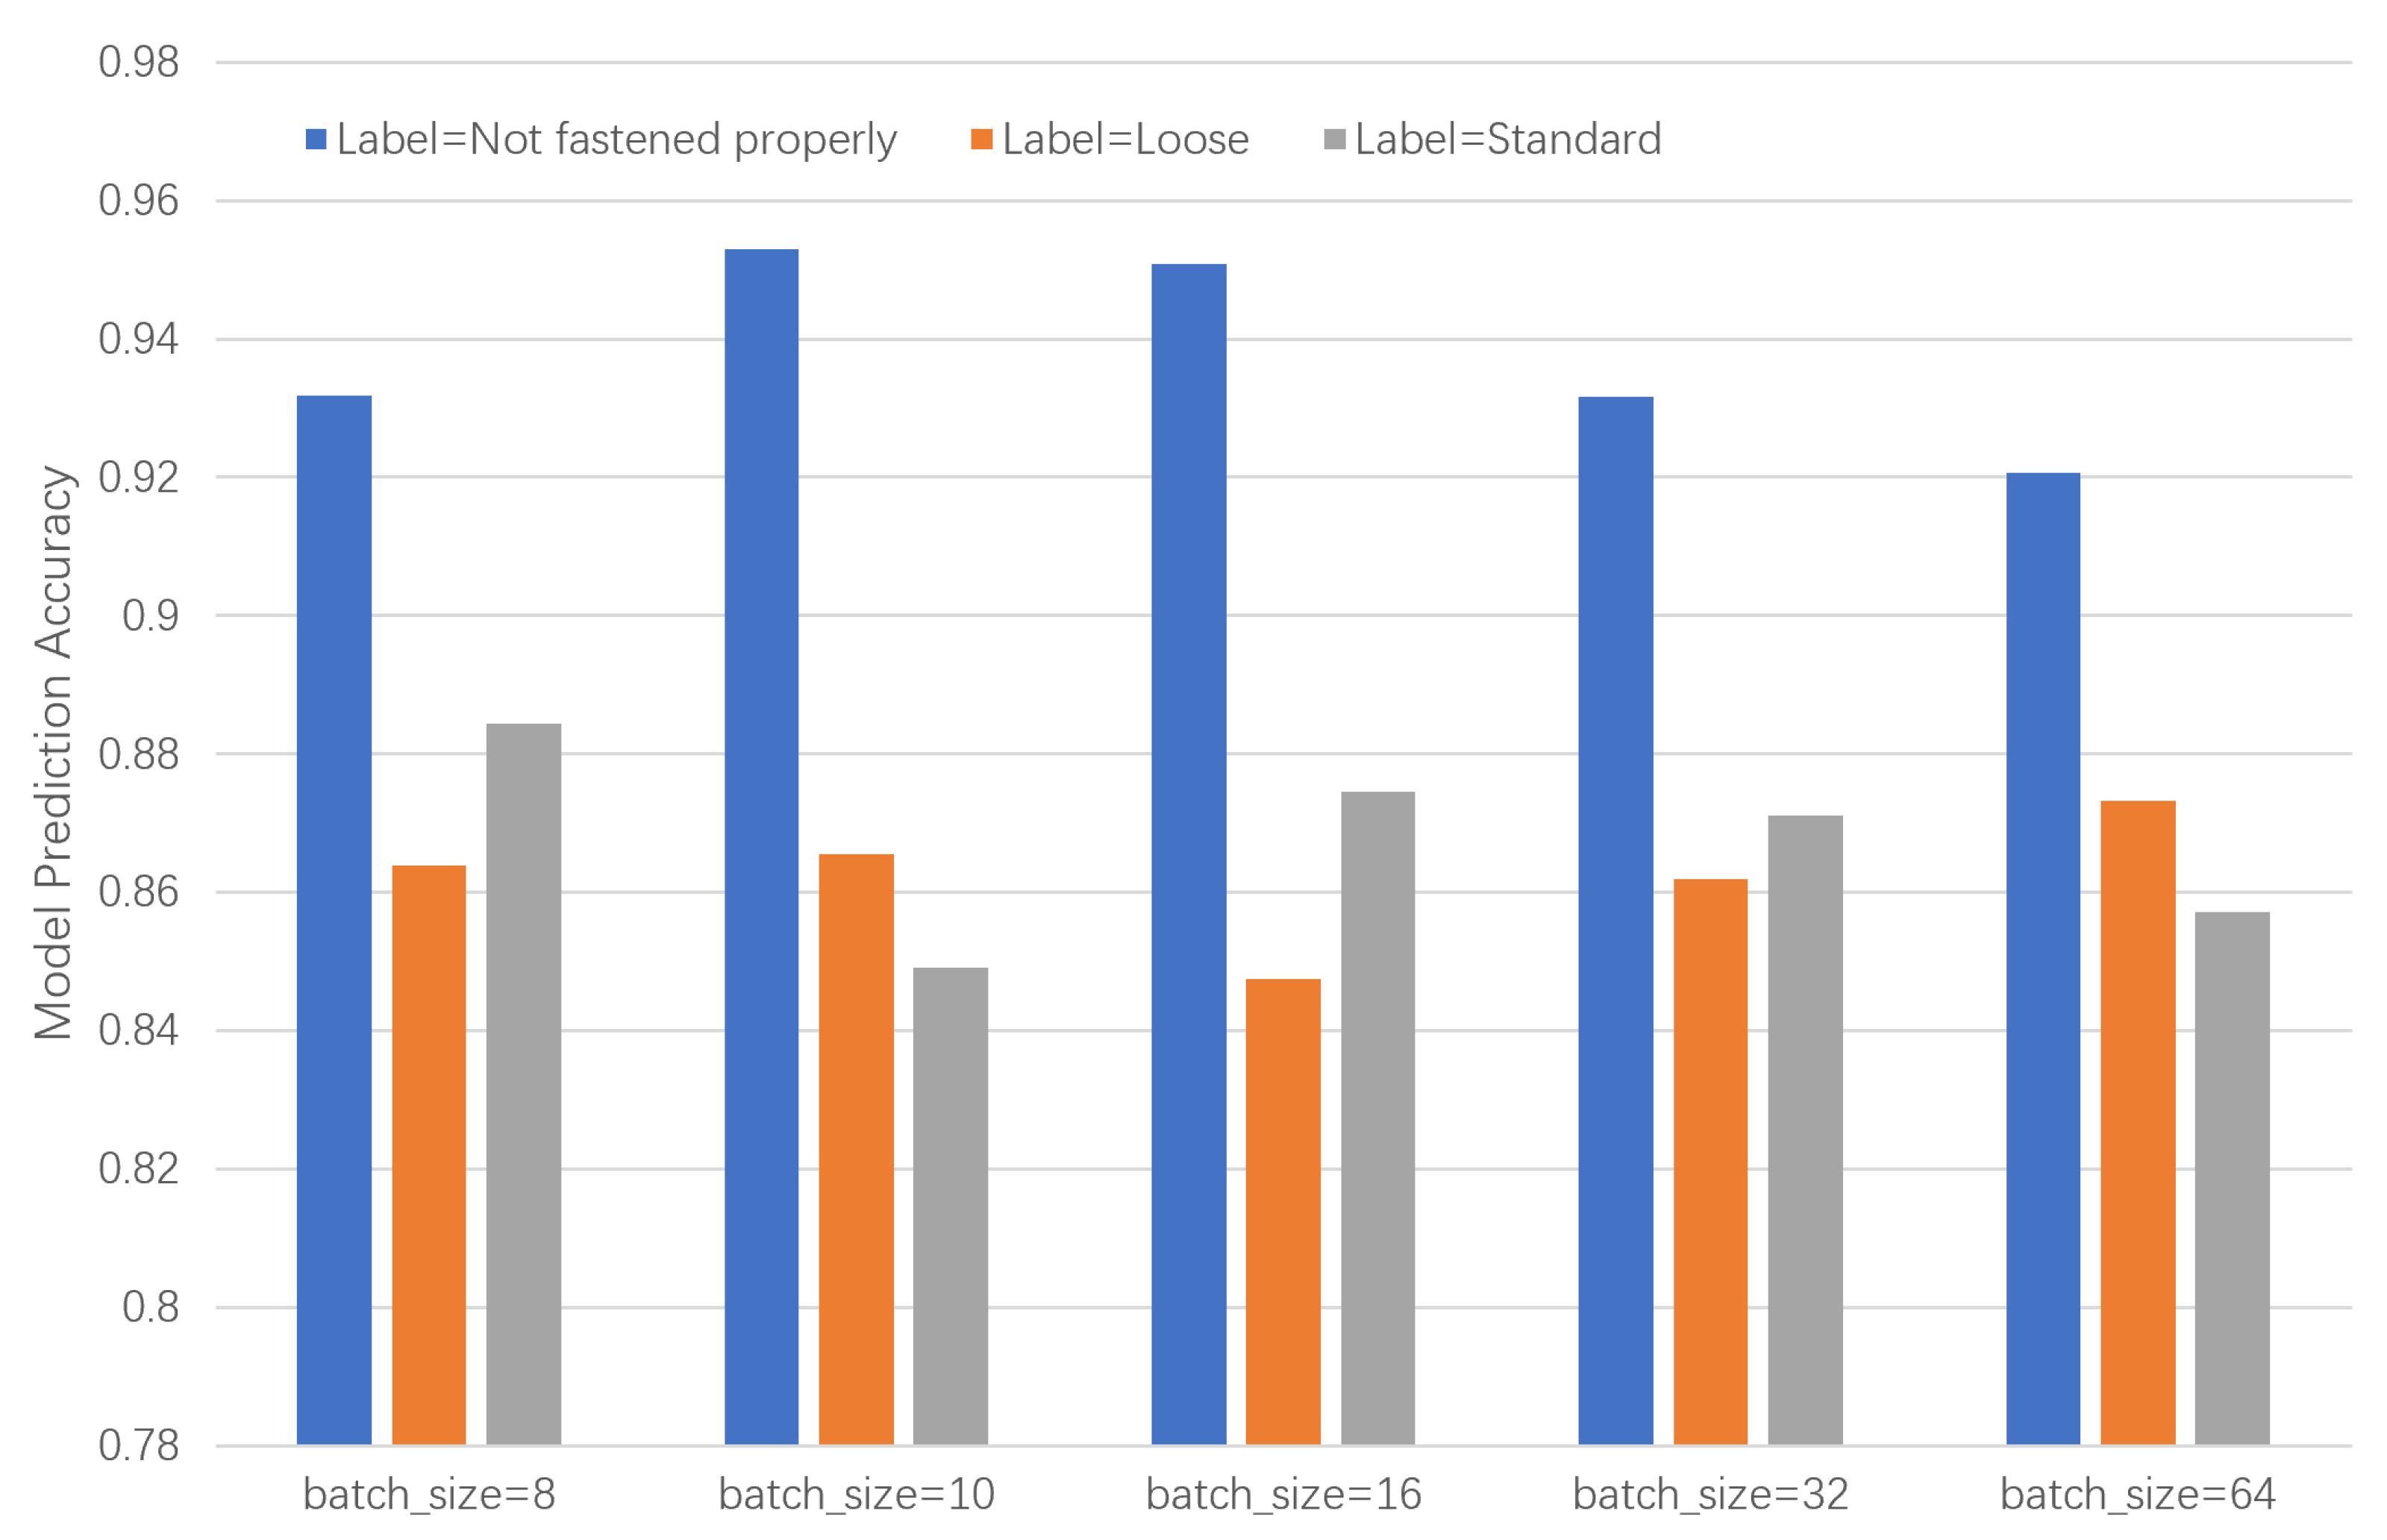
The training batch size refers to the division of the entire training dataset into smaller batches, where each batch contains a specific amount of data for each training step. If the training data is not divided or is divided too sparsely, it will result in excessively long training times. Conversely, if the data is divided into too many batches, the model may experience underfitting, which can lead to reduced accuracy. To determine the optimal training batch size, this study selected 8 as the starting point and progressively increased the batch size for iterative training. The results of each training run were recorded, and the average and variance of the results from five repetitions were calculated. Accuracy and loss rate comparison plots were generated, as shown in Figure 9. The results indicated that when the training batch size was 16, the prediction accuracy for all three labels was the most balanced. Based on this, 16 was selected as the initial training batch size.
5.2. Comparison Between Different Sensors
To demonstrate the superiority of the proposed ICNN-LSTM classification model, data were collected using three sensors installed on the helmet under three different robot operation speeds. Additionally, five advanced models were employed to compare classification accuracy, namely LSTM, RNN, BP, RF, and KNN. All five models are well-established, and further details are not provided in this paper.
(1) Data Collected with Single Sensor Installation under Different Conditions
In the application scenario under a single working condition, the data from each participant’s three sensors were stored in three separate files, named Sensor1, Sensor2, and Sensor3. The tasks were performed at three specified robot operation speeds, and data were collected. These data were then classified using the ICNN-LSTM model and the five comparison models. All models achieved an accuracy greater than 64%. The results, as shown in Figure 11, indicate that there is a correlation between the helmet posture sensor data and the tightness state of the chinstrap, and that deep learning models are able to extract more discriminative features than shallow learning models.
(2) Fusion of Sensor Wear Data
In the application scenario with fused sensor wear data, the data from the three sensors of each participant were concatenated into a single dataset for classification training to obtain the fusion effect for each wear state classification. For all tasks, classification comparisons were performed using the ICNN-LSTM model and the five comparison models. The results, shown in Figure 12, demonstrate that the proposed ICNN-LSTM model still achieves very good performance.
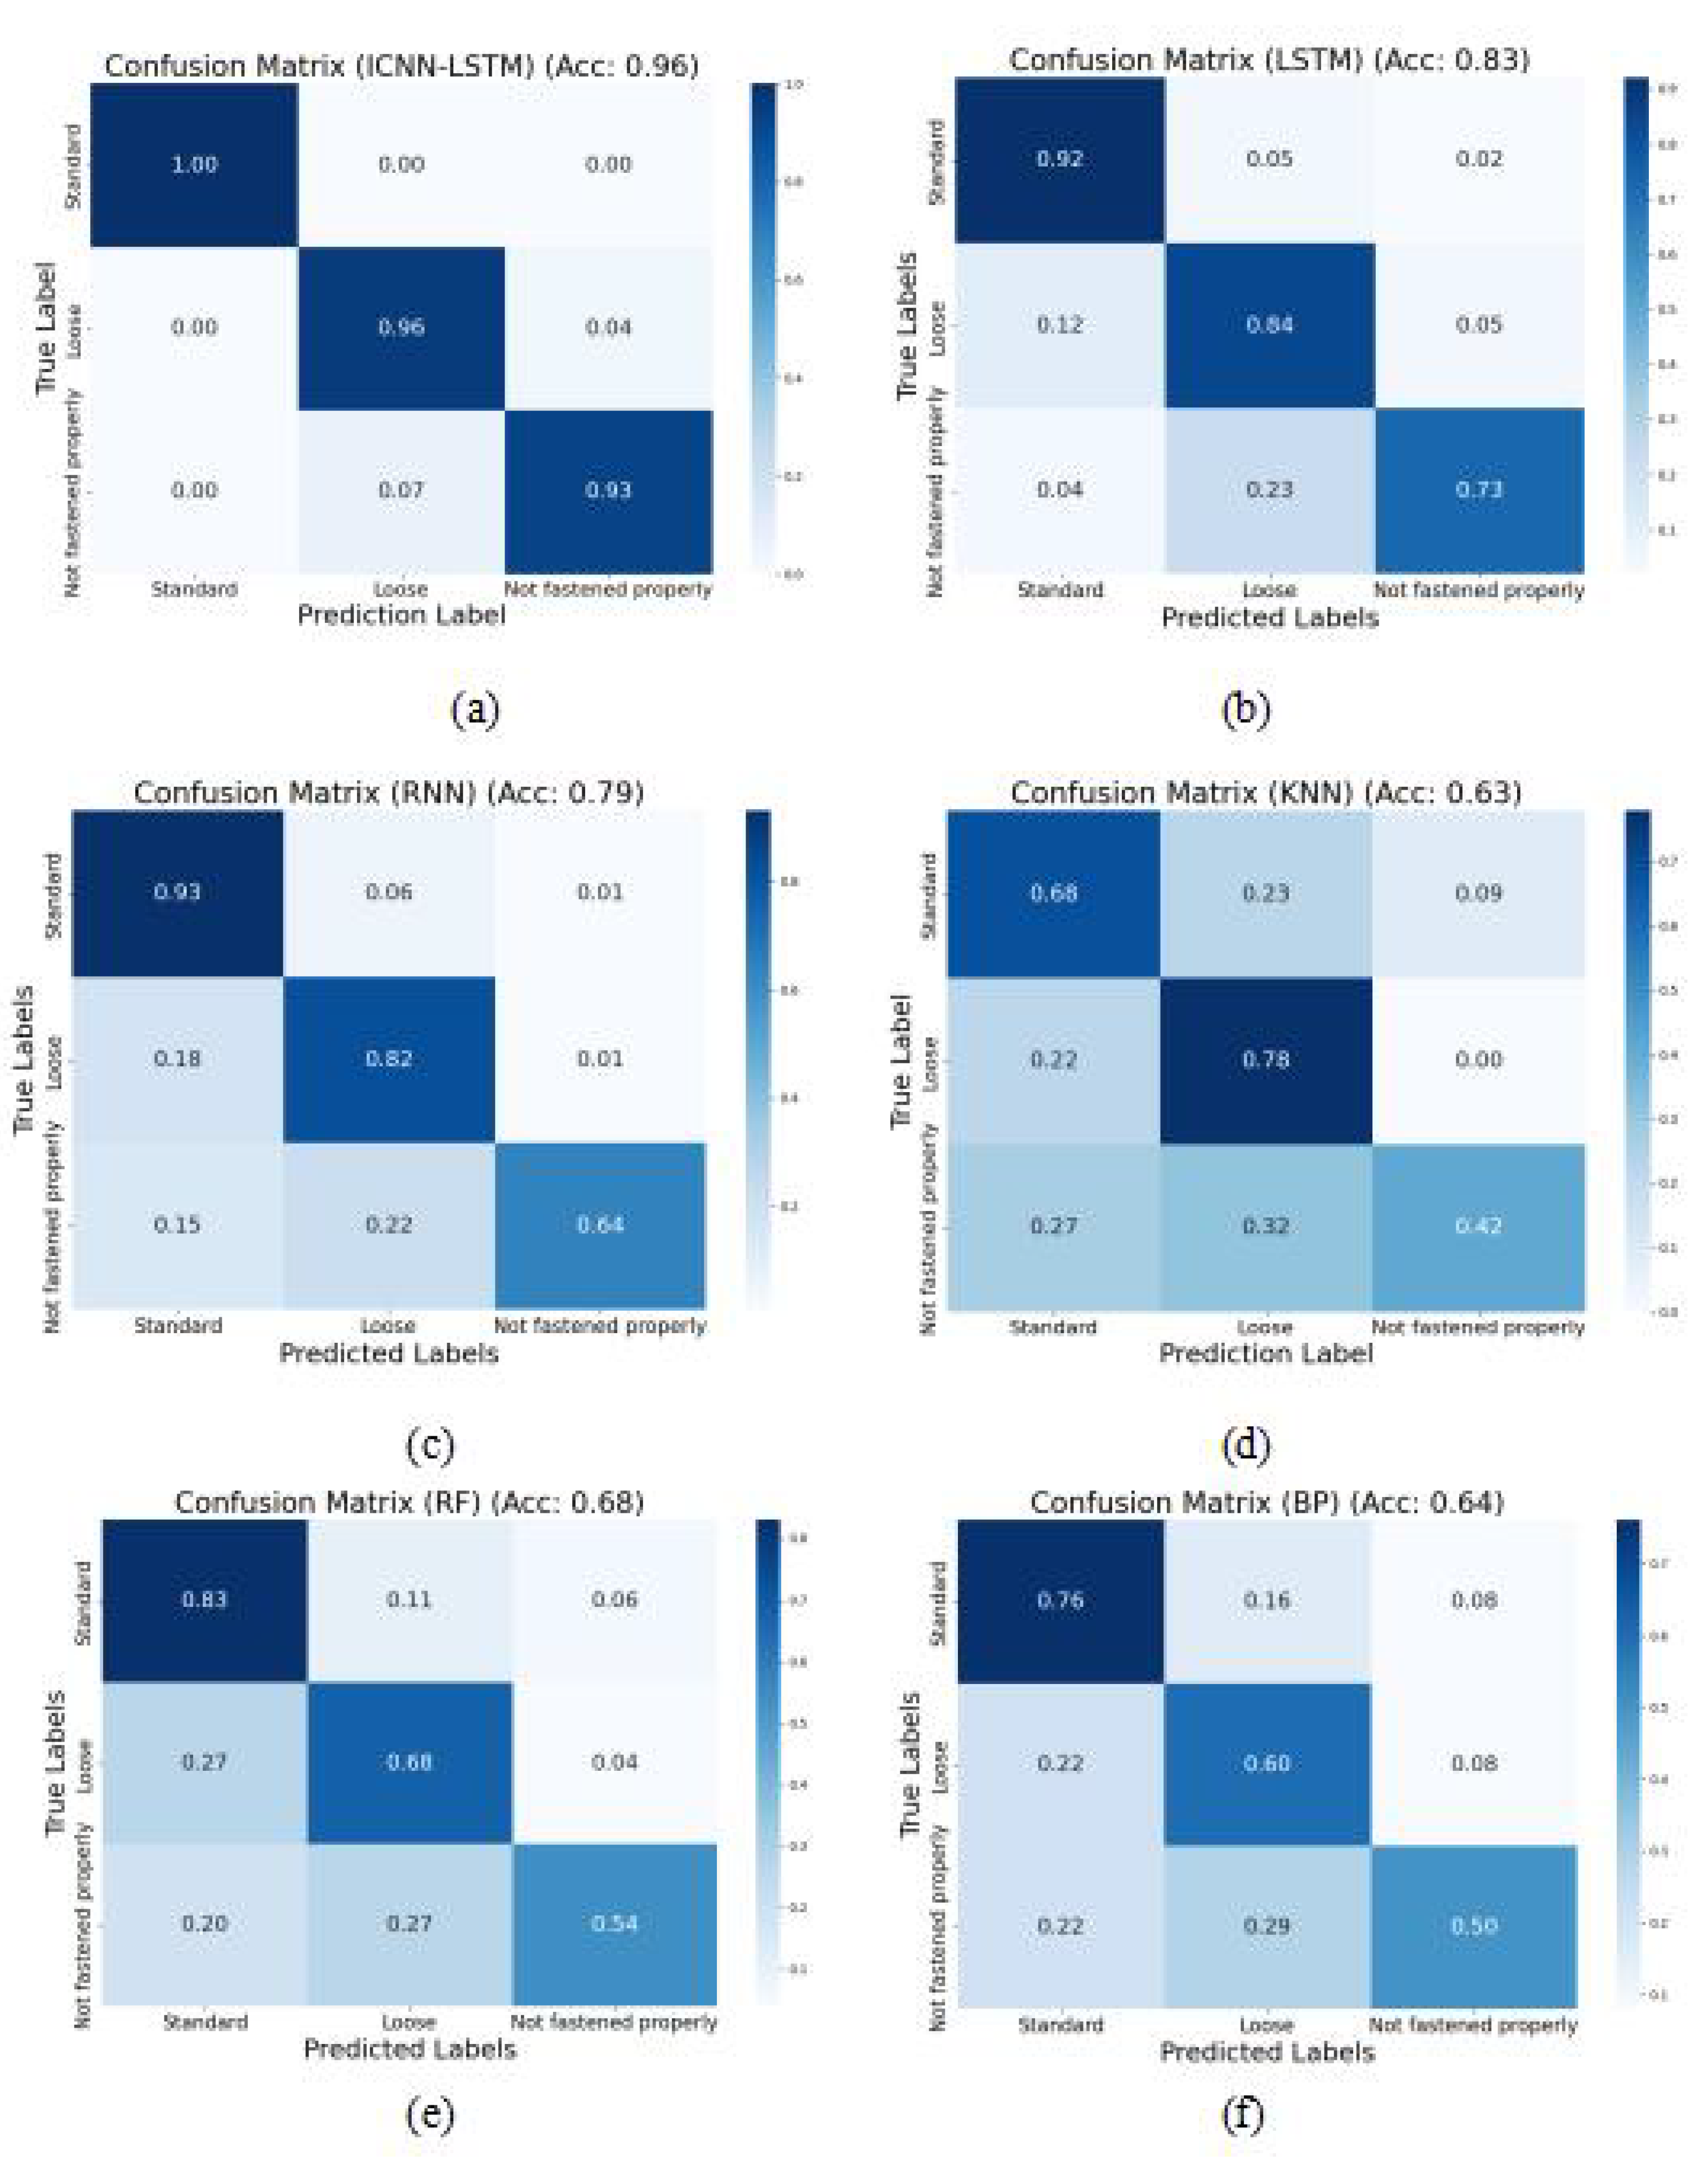
5.3. Confusion Matrix
We selected classification results for robot speed at 0.1 m/s (the most commonly used speed) to plot the confusion matrix and observe the diagnostic accuracy of different models under the three chinstrap states. The results, shown in Figure 13, have the x-axis and y-axis representing the predicted labels and true labels, respectively. From the confusion matrix and accuracy values, it can be seen that RF, KNN, and BP neural networks (BPNN) perform poorly in diagnosing the "Not fastened properly" state, with KNN being the least effective. This is because when the chinstrap is unfastened, the connection between the head and the helmet lining is less rigid, causing the helmet’s oscillation features to be significantly interfered with, which makes it more difficult to extract vibration features. In RNN and LSTM, the overall recognition accuracy significantly improved, but the accuracy for the "Not fastened properly" state was still suboptimal. However, in the improved ICNN-LSTM model proposed in this study, all three states showed good classification performance, with both individual and overall accuracy clearly outperforming other models.
6. Conclusions
This study focuses on identifying the chinstrap tightness of safety helmets based on biomimetic-inspired methods and designs an effective and easy-to-implement data collection strategy and state classification model. Through the analysis of the safety helmet wearing mechanism, we introduced a MEMS posture data collection strategy inspired by the spider’s leg bristles, which utilizes multiple MEMS posture sensors installed on the top of the safety helmet to monitor the posture vibration data of the helmet. To extract discriminative features from the MEMS posture sensor data, we also proposed an ICNN-LSTM feature extraction and classification model, which combines adaptive convolutional neural networks (CNN) and long short-term memory networks (LSTM) for chinstrap tightness classification. We established a wall-climbing robot control platform to simulate the operational tasks of workers wearing safety helmets.
In the application scenario of single sensor data classification, the proposed ICNN-LSTM model achieved excellent performance, with recognition accuracy for Sensor 3 exceeding 92% in all three conditions, and demonstrated better robustness to noise compared to other popular fault diagnosis models. In the multi-sensor data classification scenario, experimental results also showed that the proposed ICNN-LSTM model reached an accuracy of 96%, indicating its strong generalization ability. This model is particularly suitable for the multi-sensor acquisition strategy based on the biomimetic spider leg bristles.
However, the limitation of this method is that if we intend to train the model to classify helmet wear, we need to pre-collect posture signals labeled with the chinstrap tightness in a specific work environment. Therefore, future research will focus on extending the proposed method to enable the recognition of unknown working environments. In addition, we plan to embed the sensor components into the helmet to ensure seamless integration with existing helmet designs.
Acknowledgments
This work was supported by the National Key Research and Development Program of China 2023YFB470460403, Natural Science Foundation of China under Grant 51875113, Opening Project of the Key Laboratory of Bionic Engineering (Jilin University, Ministry of Education).
Conflicts of Interest
The authors declare that they have no known competing financial interests or personal relationships that could have appeared to influence the work reported in this paper.
References
- Ghobakhloo, M. Industry 4.0, digitization, and opportunities for sustainability. Journal of Cleaner Production 2020, 252. [Google Scholar] [CrossRef]
- Sandaruwan, A.; Hettige, e.a. A Comparative Study on Smart Helmet Systems for Mining Tracking and Worker Safety in the Mining Industry: A Review. In Proceedings of the Proceedings of the the 4th Student Symposium; 2024. [Google Scholar]
- Weaver, Albert, I. ; et al.. From Hard Hats to Helmets: The History & Future of Head Protection. Professional Safety 2024, 69, 34–43. [Google Scholar]
- Arai, K.; Beppu, e.a. Method for Detecting the Appropriateness of Wearing a Helmet Chin Strap at Construction Sites. International Journal of Advanced Computer Science & Applications 2024, 15. [Google Scholar]
- Lin, B. Safety Helmet Detection Based on Improved YOLOv8. IEEE Access 2024, 12, 28260–28272. [Google Scholar] [CrossRef]
- Song, X.; Zhang, T.; Yi, W. An improved YOLOv8 safety helmet wearing detection network. Scientific Reports 2024, 14, 17550. [Google Scholar] [CrossRef]
- Ansari, S.; Du, e.a. Automatic driver cognitive fatigue detection based on upper body posture variations. Expert Systems with Applications 2022, 203. [Google Scholar] [CrossRef]
- Jiao, X.; Li, C.; Zhang, X.; et al. . Detection Method for Safety Helmet Wearing on Construction Sites Based on UAV Images and YOLOv8. Buildings 2025, 15, 354. [Google Scholar] [CrossRef]
- Meden, B.; Rot, e.a. Privacy–enhancing face biometrics: A comprehensive survey. IEEE Transactions on Information Forensics and Security 2021, 16, 4147–4183. [Google Scholar] [CrossRef]
- Barth, F. Spider mechanoreceptors. Current Opinion in Neurobiology 2004, 14, 415–422. [Google Scholar] [CrossRef]
- Albert, J.; Friedrich, e.a. Arthropod touch reception: spider hair sensilla as rapid touch detectors. Journal of Comparative Physiology A 2001, 187, 303–312. [Google Scholar]
- Ganske, A.S.; Uhl, G. The sensory equipment of a spider – A morphological survey of different types of sensillum in both sexes of Argiope bruennichi (Araneae, Araneidae). Arthropod Structure & Development 2018, 47, 144–161. [Google Scholar]
- Kang, D.; Pikhitsa, P.V.; Choi, Y.W.; et al. . Ultrasensitive mechanical crack-based sensor inspired by the spider sensory system. Nature 2014, 516, 222–226. [Google Scholar] [CrossRef] [PubMed]
- Kim, T.; Hong, I.; Roh, Y.; et al. . Spider-inspired tunable mechanosensor for biomedical applications. NPJ Flexible Electronics 2023, 7, 12. [Google Scholar] [CrossRef]
- Iqbal, S.; Malik, A. A review on MEMS based micro displacement amplification mechanisms. Sensors and Actuators A: Physical 2019, 300, 111666. [Google Scholar] [CrossRef]
- Righettini, P.; Legnani, e.a. Real Time MEMS-Based Joint Friction Identification for Enhanced Dynamic Performance in Robotic Applications. Robotics 2025, 14. [Google Scholar] [CrossRef]
- Han, Y.; Zhou, e.a. Intelligent wheelchair human–robot interactive system based on human posture recognition. Journal of Mechanical Science and Technology 2024, 38, 4353–4363. [Google Scholar] [CrossRef]
- D’Amato, E.; Nardi, e.a. A particle filtering approach for fault detection and isolation of UAV IMU sensors: Design, implementation and sensitivity analysis. Sensors 2021, 21. [Google Scholar] [CrossRef]
- Xiong, L.; Xia, e.a. IMU-based automated vehicle body sideslip angle and attitude estimation aided by GNSS using parallel adaptive Kalman filters. IEEE Transactions on Vehicular Technology 2020, 69, 10668–10680. [Google Scholar] [CrossRef]
- Elhashash, M.; Albanwan, e.a. A review of mobile mapping systems: From sensors to applications. Sensors 2022, 22. [Google Scholar] [CrossRef]
- Alatise, M.B.; Hancke, G.P. A Review on Challenges of Autonomous Mobile Robot and Sensor Fusion Methods. IEEE Access 2020, 8, 39830–39846. [Google Scholar] [CrossRef]
- Iqbal, S.; Shakoor, e.a. Performance analysis of microelectromechanical system based displacement amplification mechanism. Iranian Journal of Science and Technology, Transactions of Mechanical Engineering 2019, 43, 507–528. [Google Scholar] [CrossRef]
- Rida, I. Feature extraction for temporal signal recognition: An overview. arXiv Preprint arXiv:1812.01780 2018, arXiv:1812.01780 2018. [Google Scholar]
- Huang, G. Visual-inertial navigation: A concise review. In Proceedings of the 2019 International Conference on Robotics and Automation (ICRA); 2019; pp. 9572–9582. [Google Scholar]
- Srinivasan, S.; Francis, D.; Mathivanan, S.K.; et al. . A hybrid deep CNN model for brain tumor image multi-classification. BMC Medical Imaging 2024, 24, 21. [Google Scholar] [CrossRef] [PubMed]
- Wang, W.; Chen, e.a. Transferring CNN with adaptive learning for remote sensing scene classification. IEEE Transactions on Geoscience and Remote Sensing 2022, 60, 1–18. [Google Scholar] [CrossRef]
- Ma, Z.; Xu, e.a. Improved ICNN-LSTM Model Classification Based on Attitude Sensor Data for Hazardous State Assessment of Magnetic Adhesion Climbing Wall Robots. arXiv Preprint arXiv:2412.20675 2024, arXiv:2412.20675 2024. [Google Scholar]
- Bathellier, B.; Steinmann, e.a. Air motion sensing hairs of arthropods detect high frequencies at near-maximal mechanical efficiency. Journal of the Royal Society Interface 2011. [Google Scholar] [CrossRef]
- Sabir, R.; Rosato, D.; Hartmann, S.; et al. . LSTM Based Bearing Fault Diagnosis of Electrical Machines using Motor Current Signal. In Proceedings of the 2019 18th IEEE International Conference on Machine Learning and Applications (ICMLA); 2019; pp. 613–618. [Google Scholar]
- Smagulova, K.; James, e.a. A survey on LSTM memristive neural network architectures and applications. The European Physical Journal Special Topics 2019, 228, 2313–2324. [Google Scholar] [CrossRef]
- An, Y.; Zhang, K.; Liu, Q.; et al. . Rolling Bearing Fault Diagnosis Method Base on Periodic Sparse Attention and LSTM. IEEE Sensors Journal 2022, 22, 12044–12053. [Google Scholar] [CrossRef]
Figure 1.
Overall framework of this research
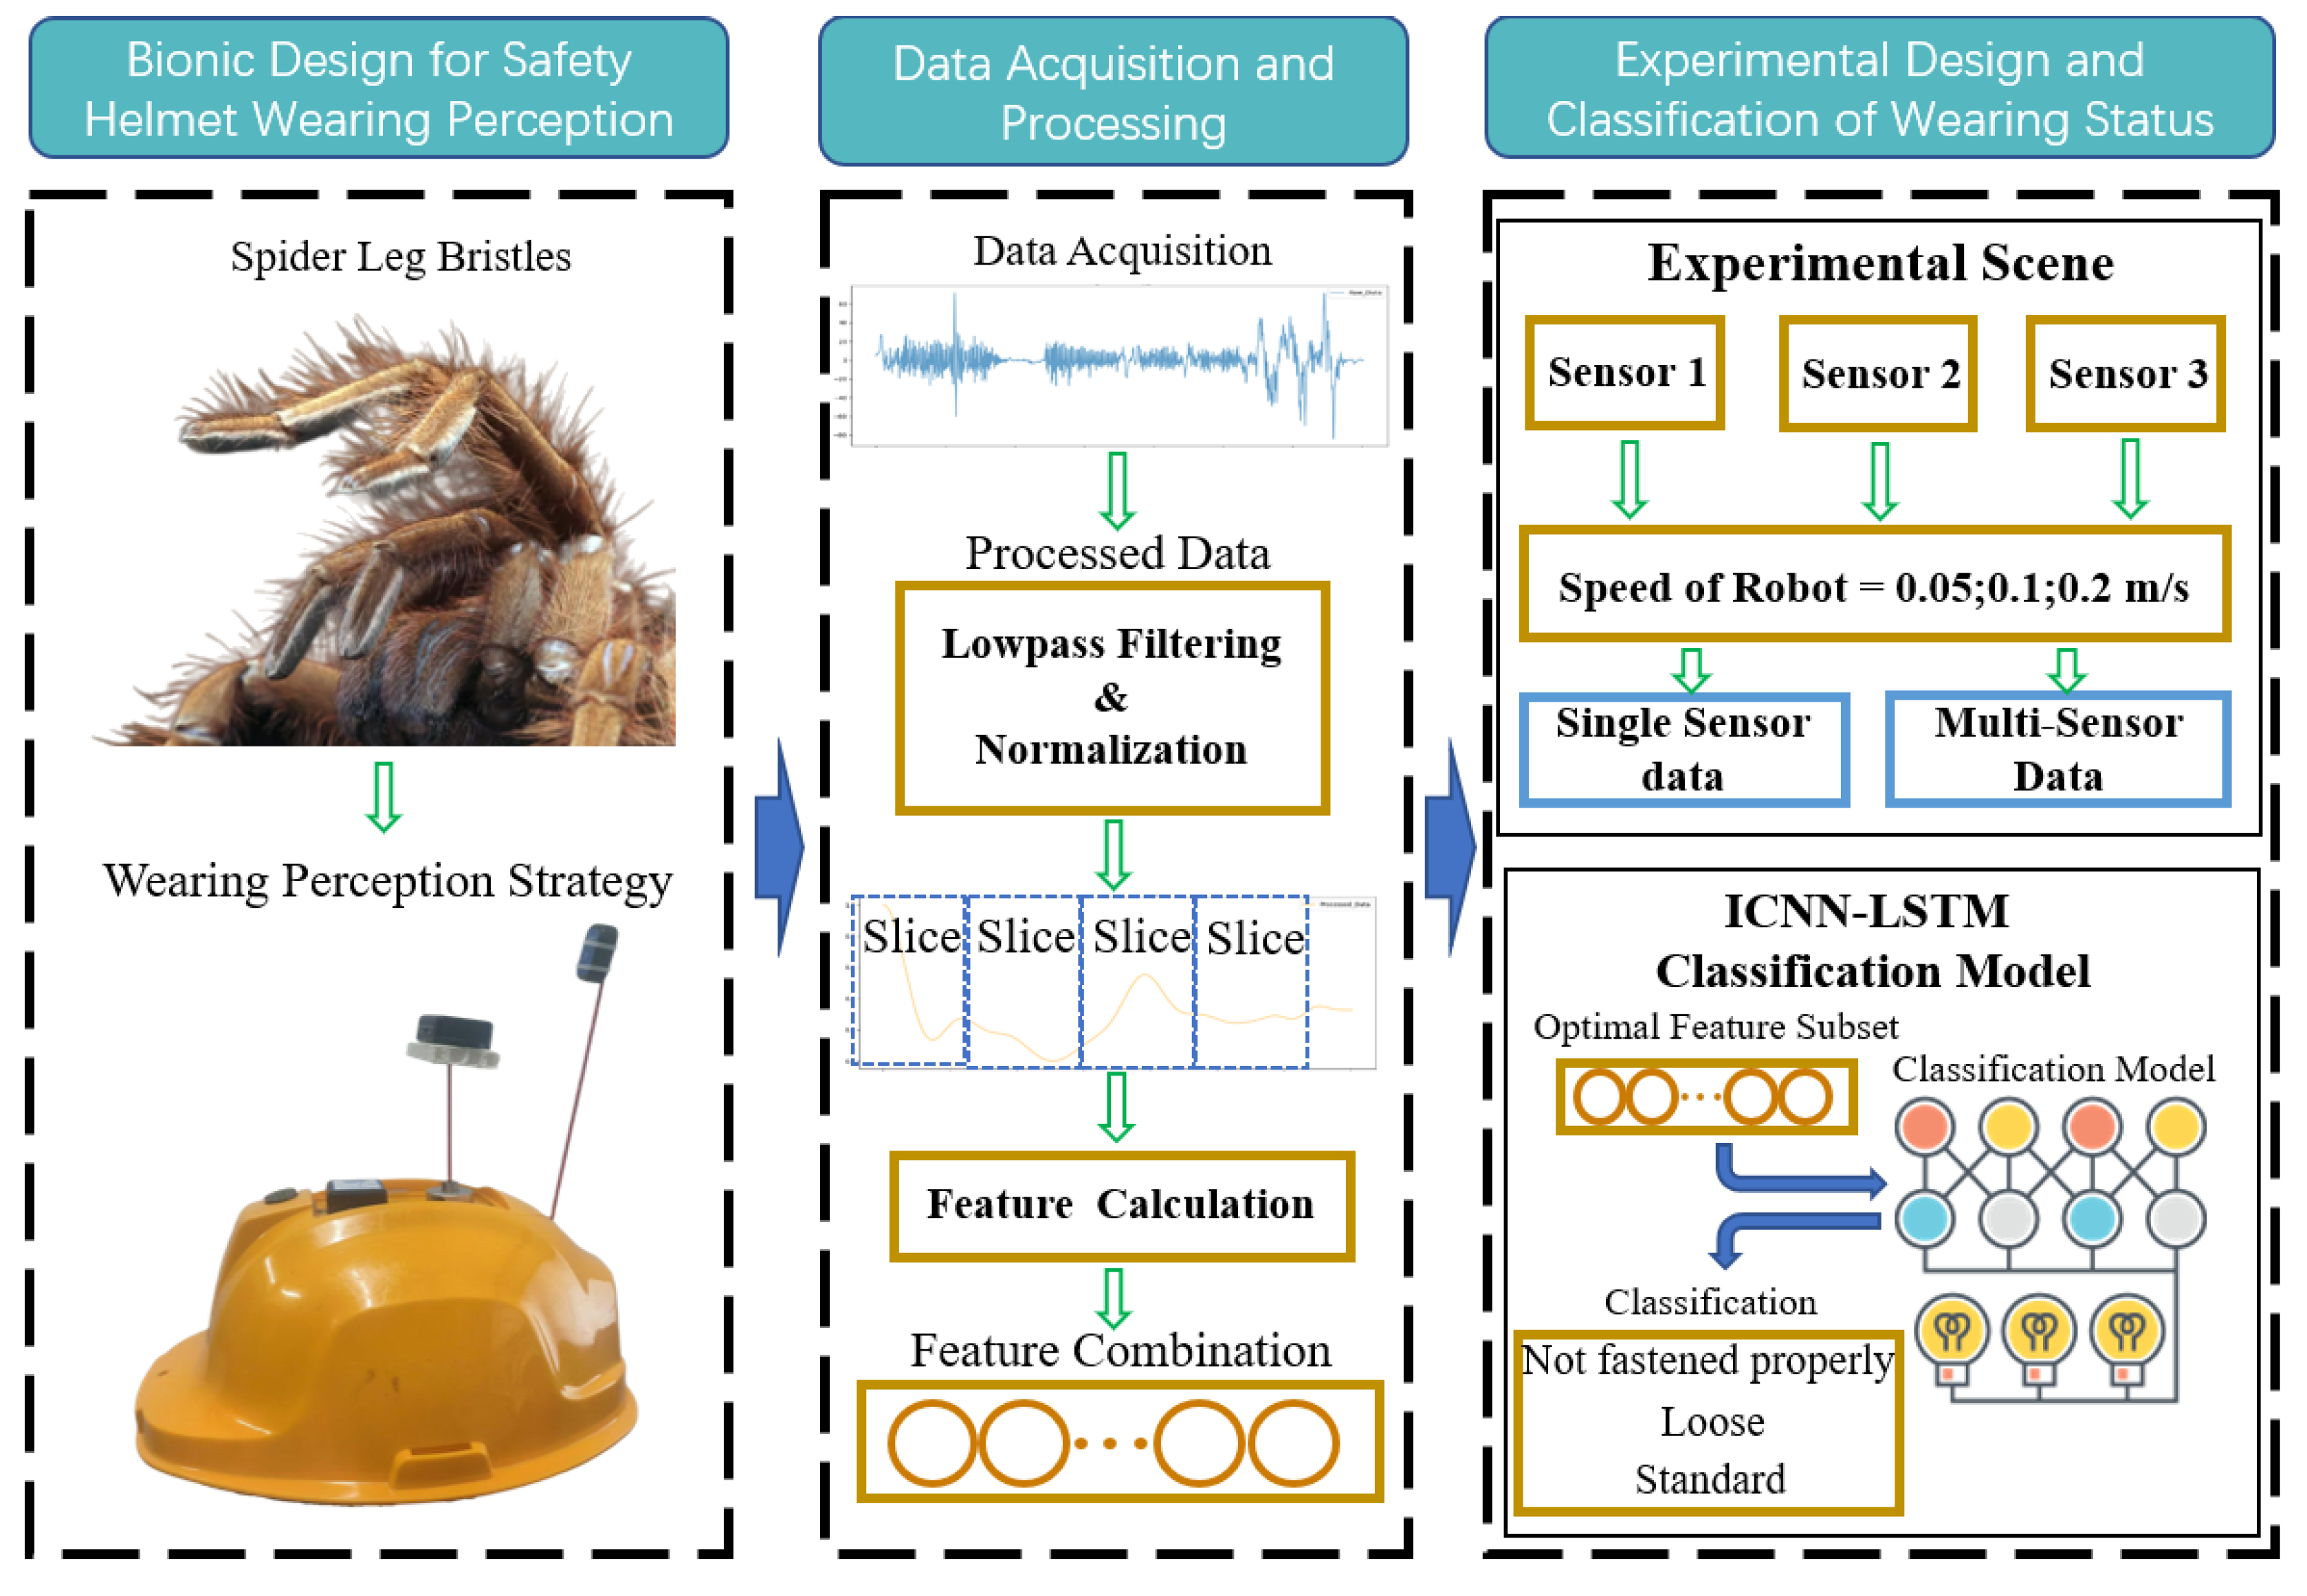
Figure 2.
Bionic Design and Perception Mechanism for Helmet Wearing Detection; (a) Micrograph of spider leg setae; (b) Simplified model of leg setae; (c) Equivalent damping model for helmet wearing; (d) Bionic design of helmet setae.
Figure 2.
Bionic Design and Perception Mechanism for Helmet Wearing Detection; (a) Micrograph of spider leg setae; (b) Simplified model of leg setae; (c) Equivalent damping model for helmet wearing; (d) Bionic design of helmet setae.
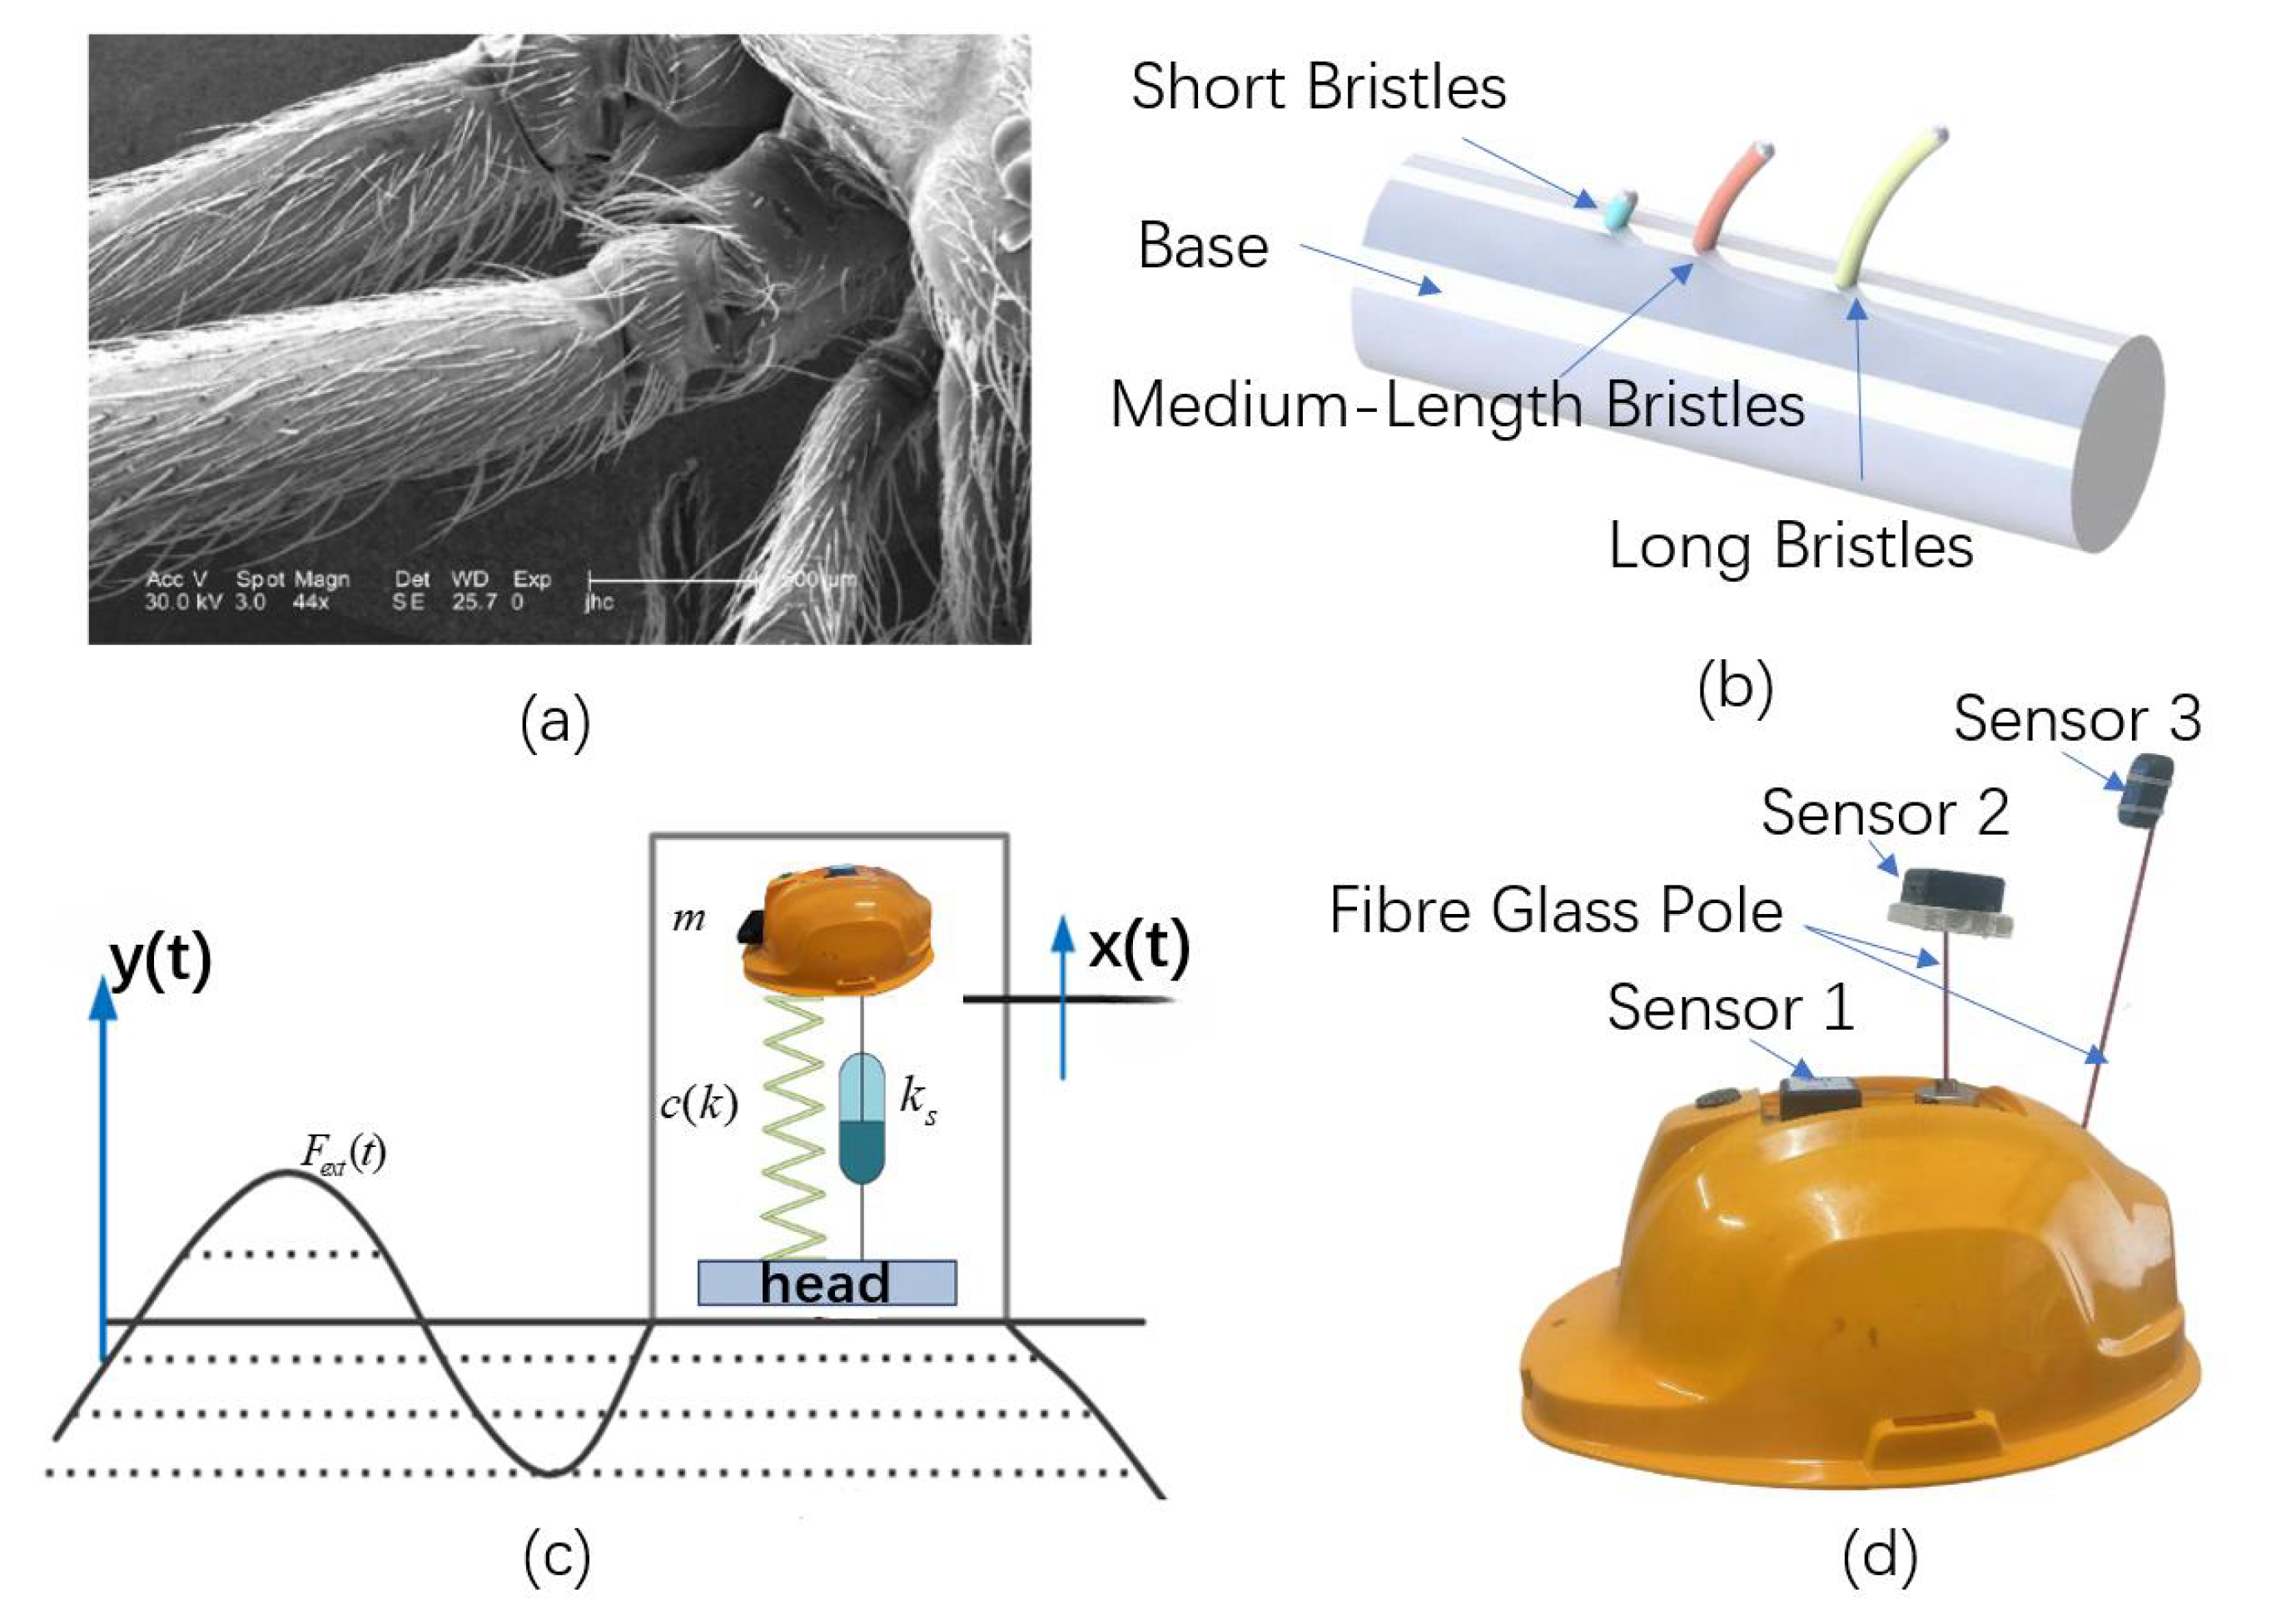
Figure 3.
Transfer functions under different chinstrap tightness coefficients k
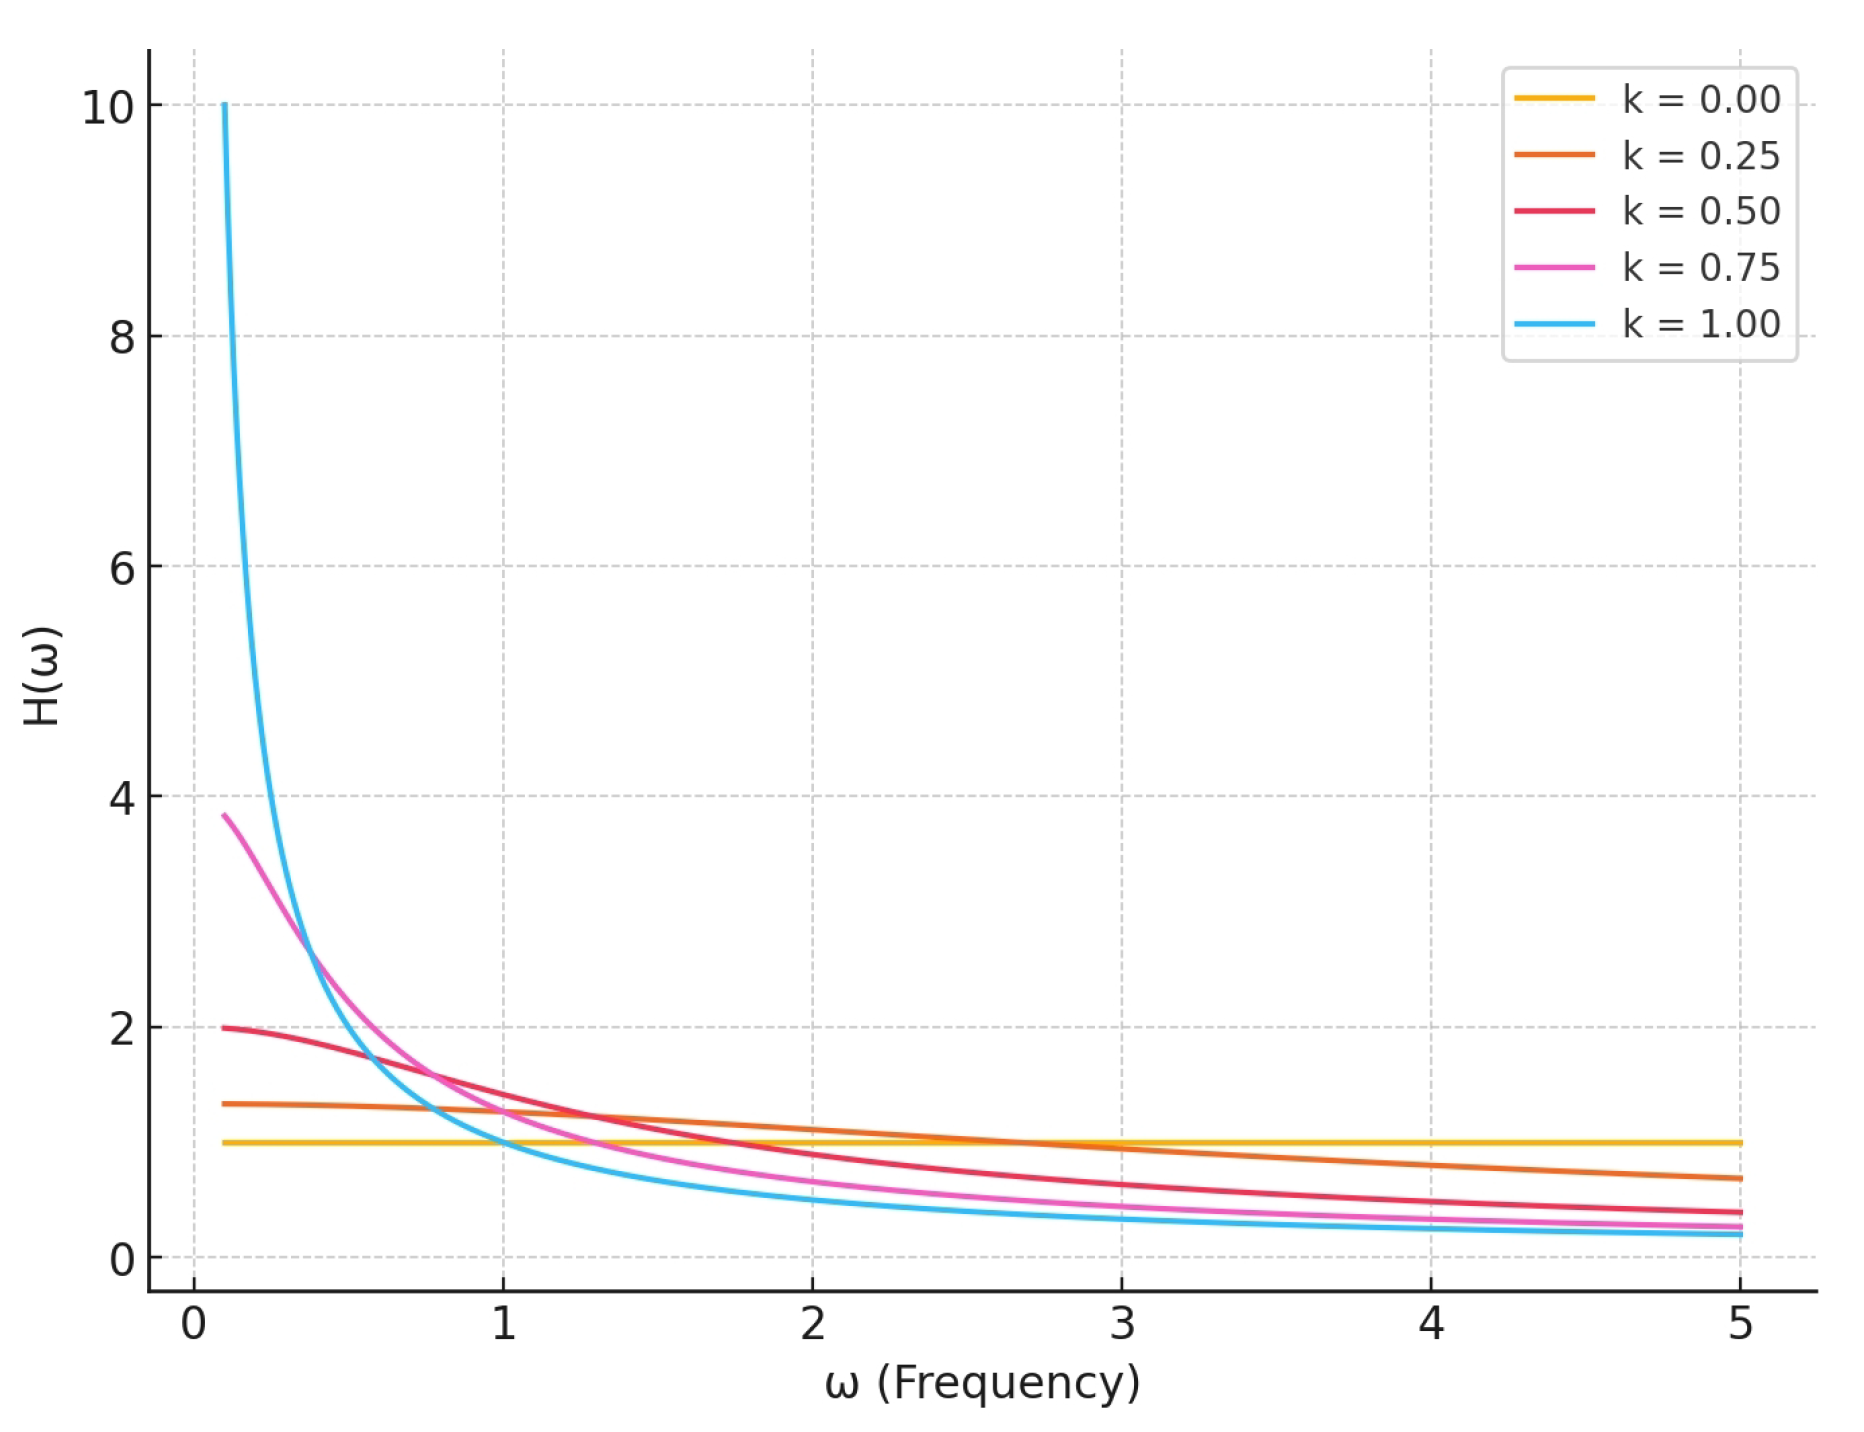
Figure 4.
Three Wearing States and Their Analogous Effects
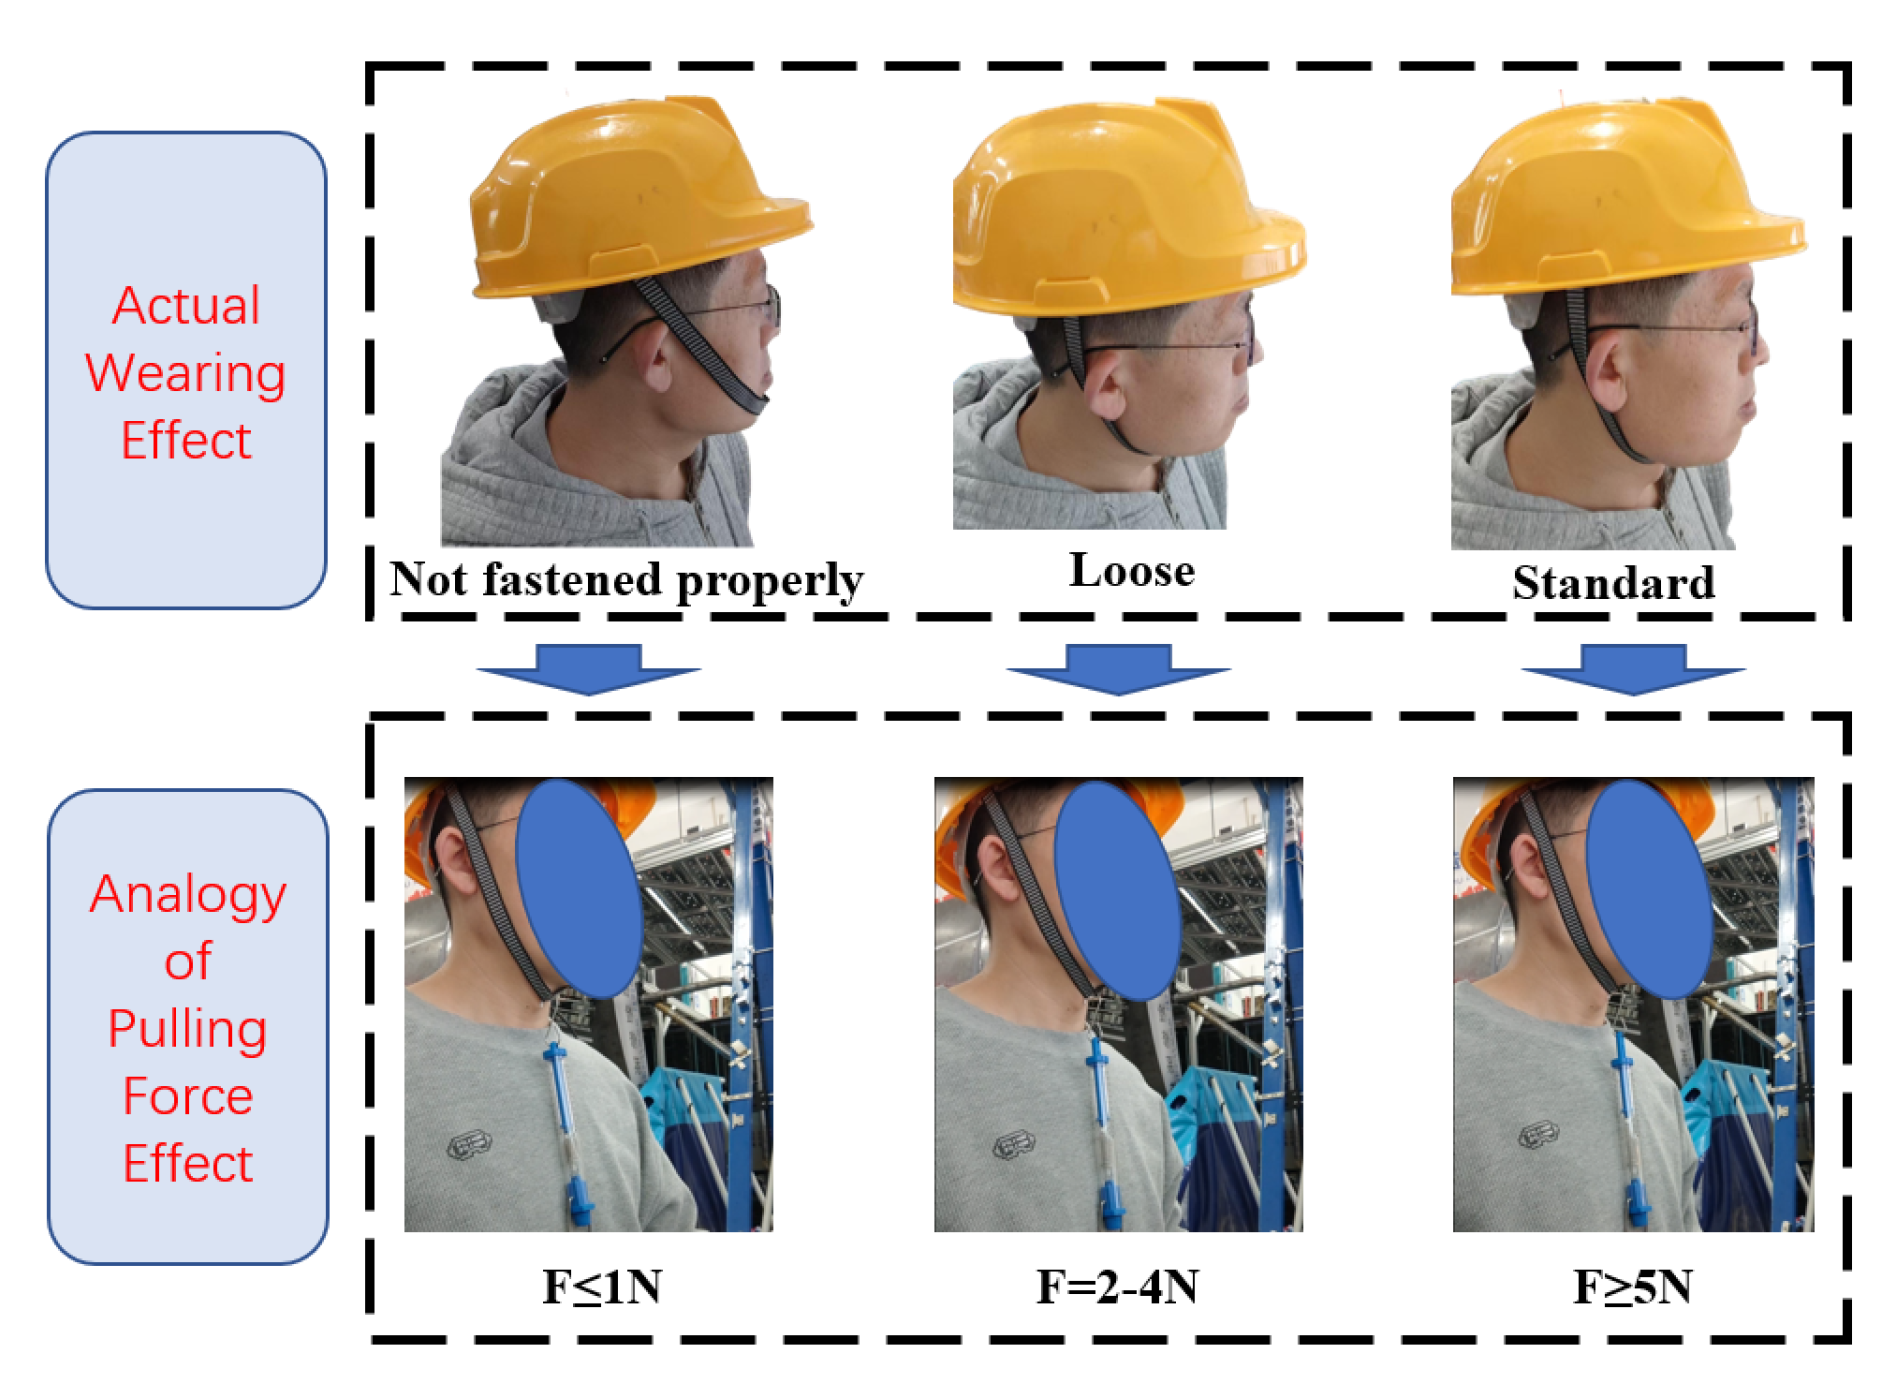
Figure 5.
MEMS Attitude Sensor Layout and Sensor Coordinate System
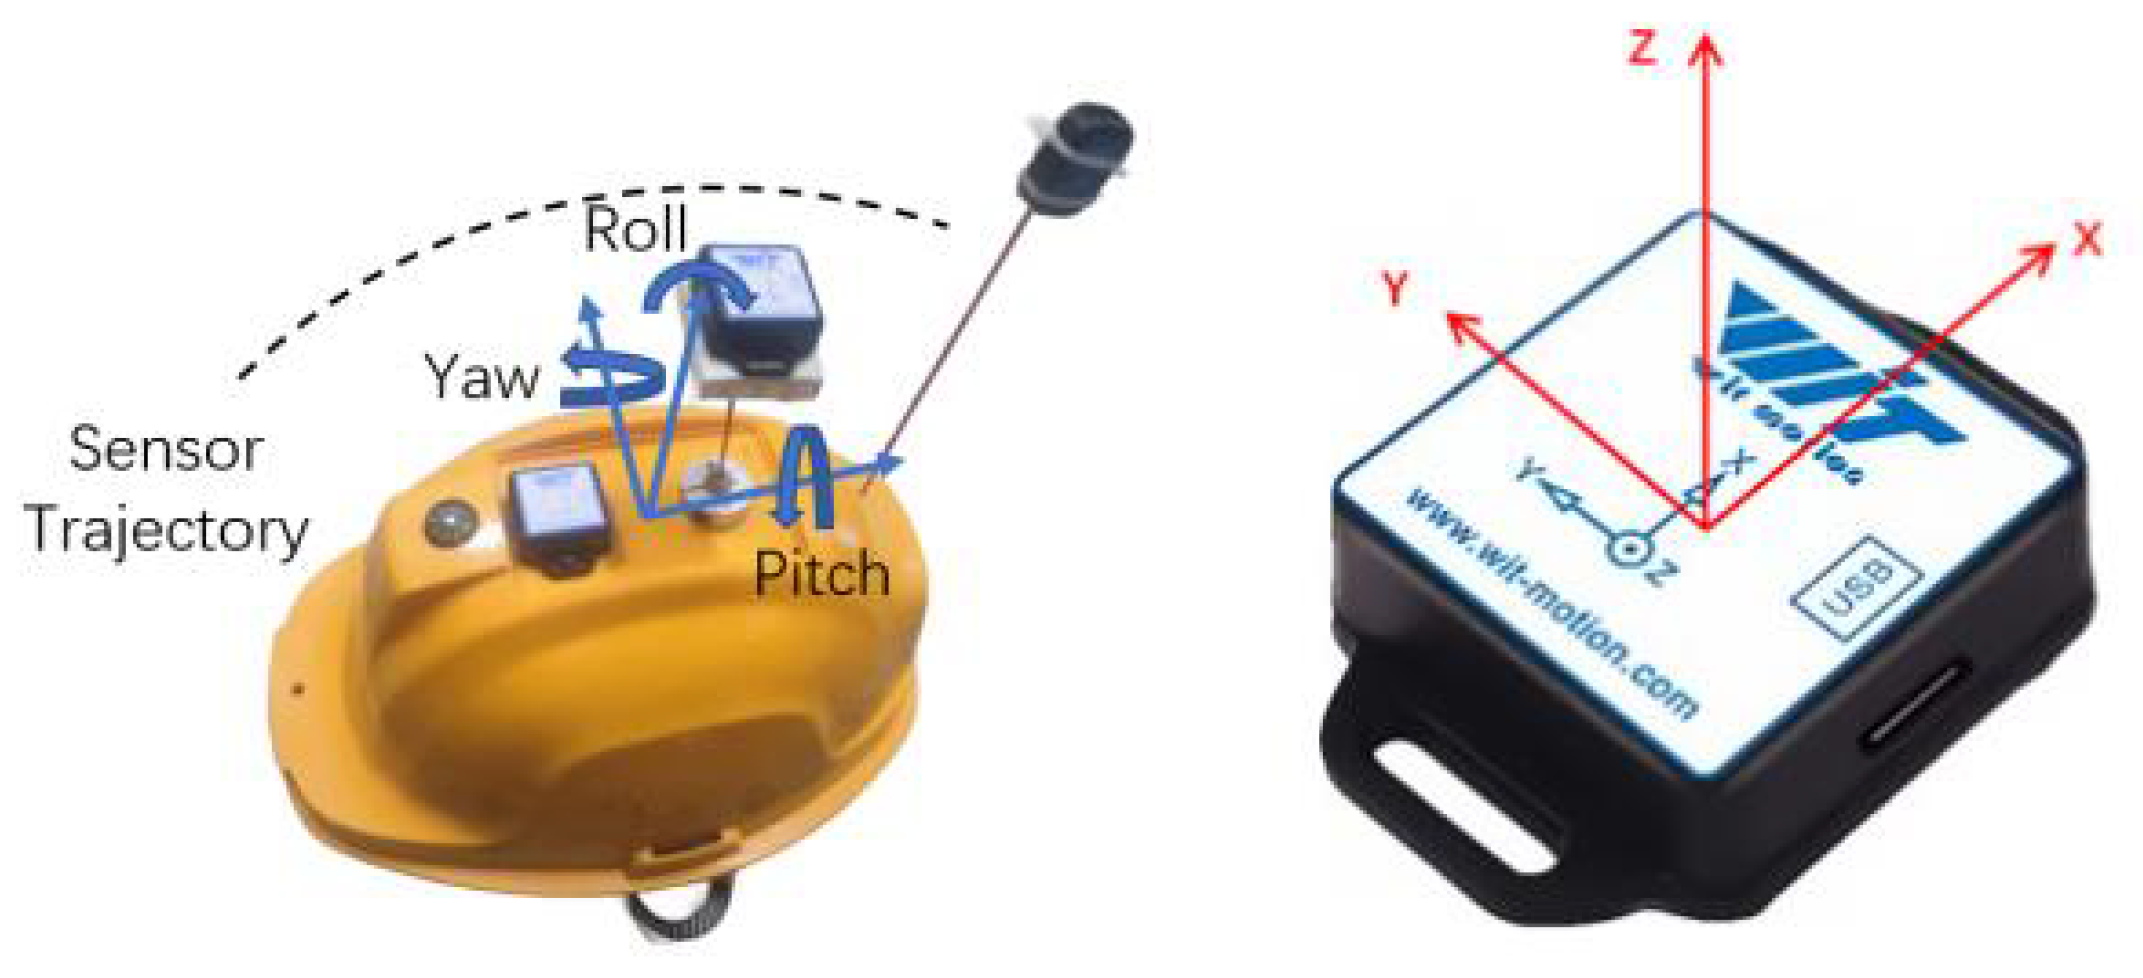
Figure 6.
Flowchart of Classification for Chin Strap Tightness of Helmets
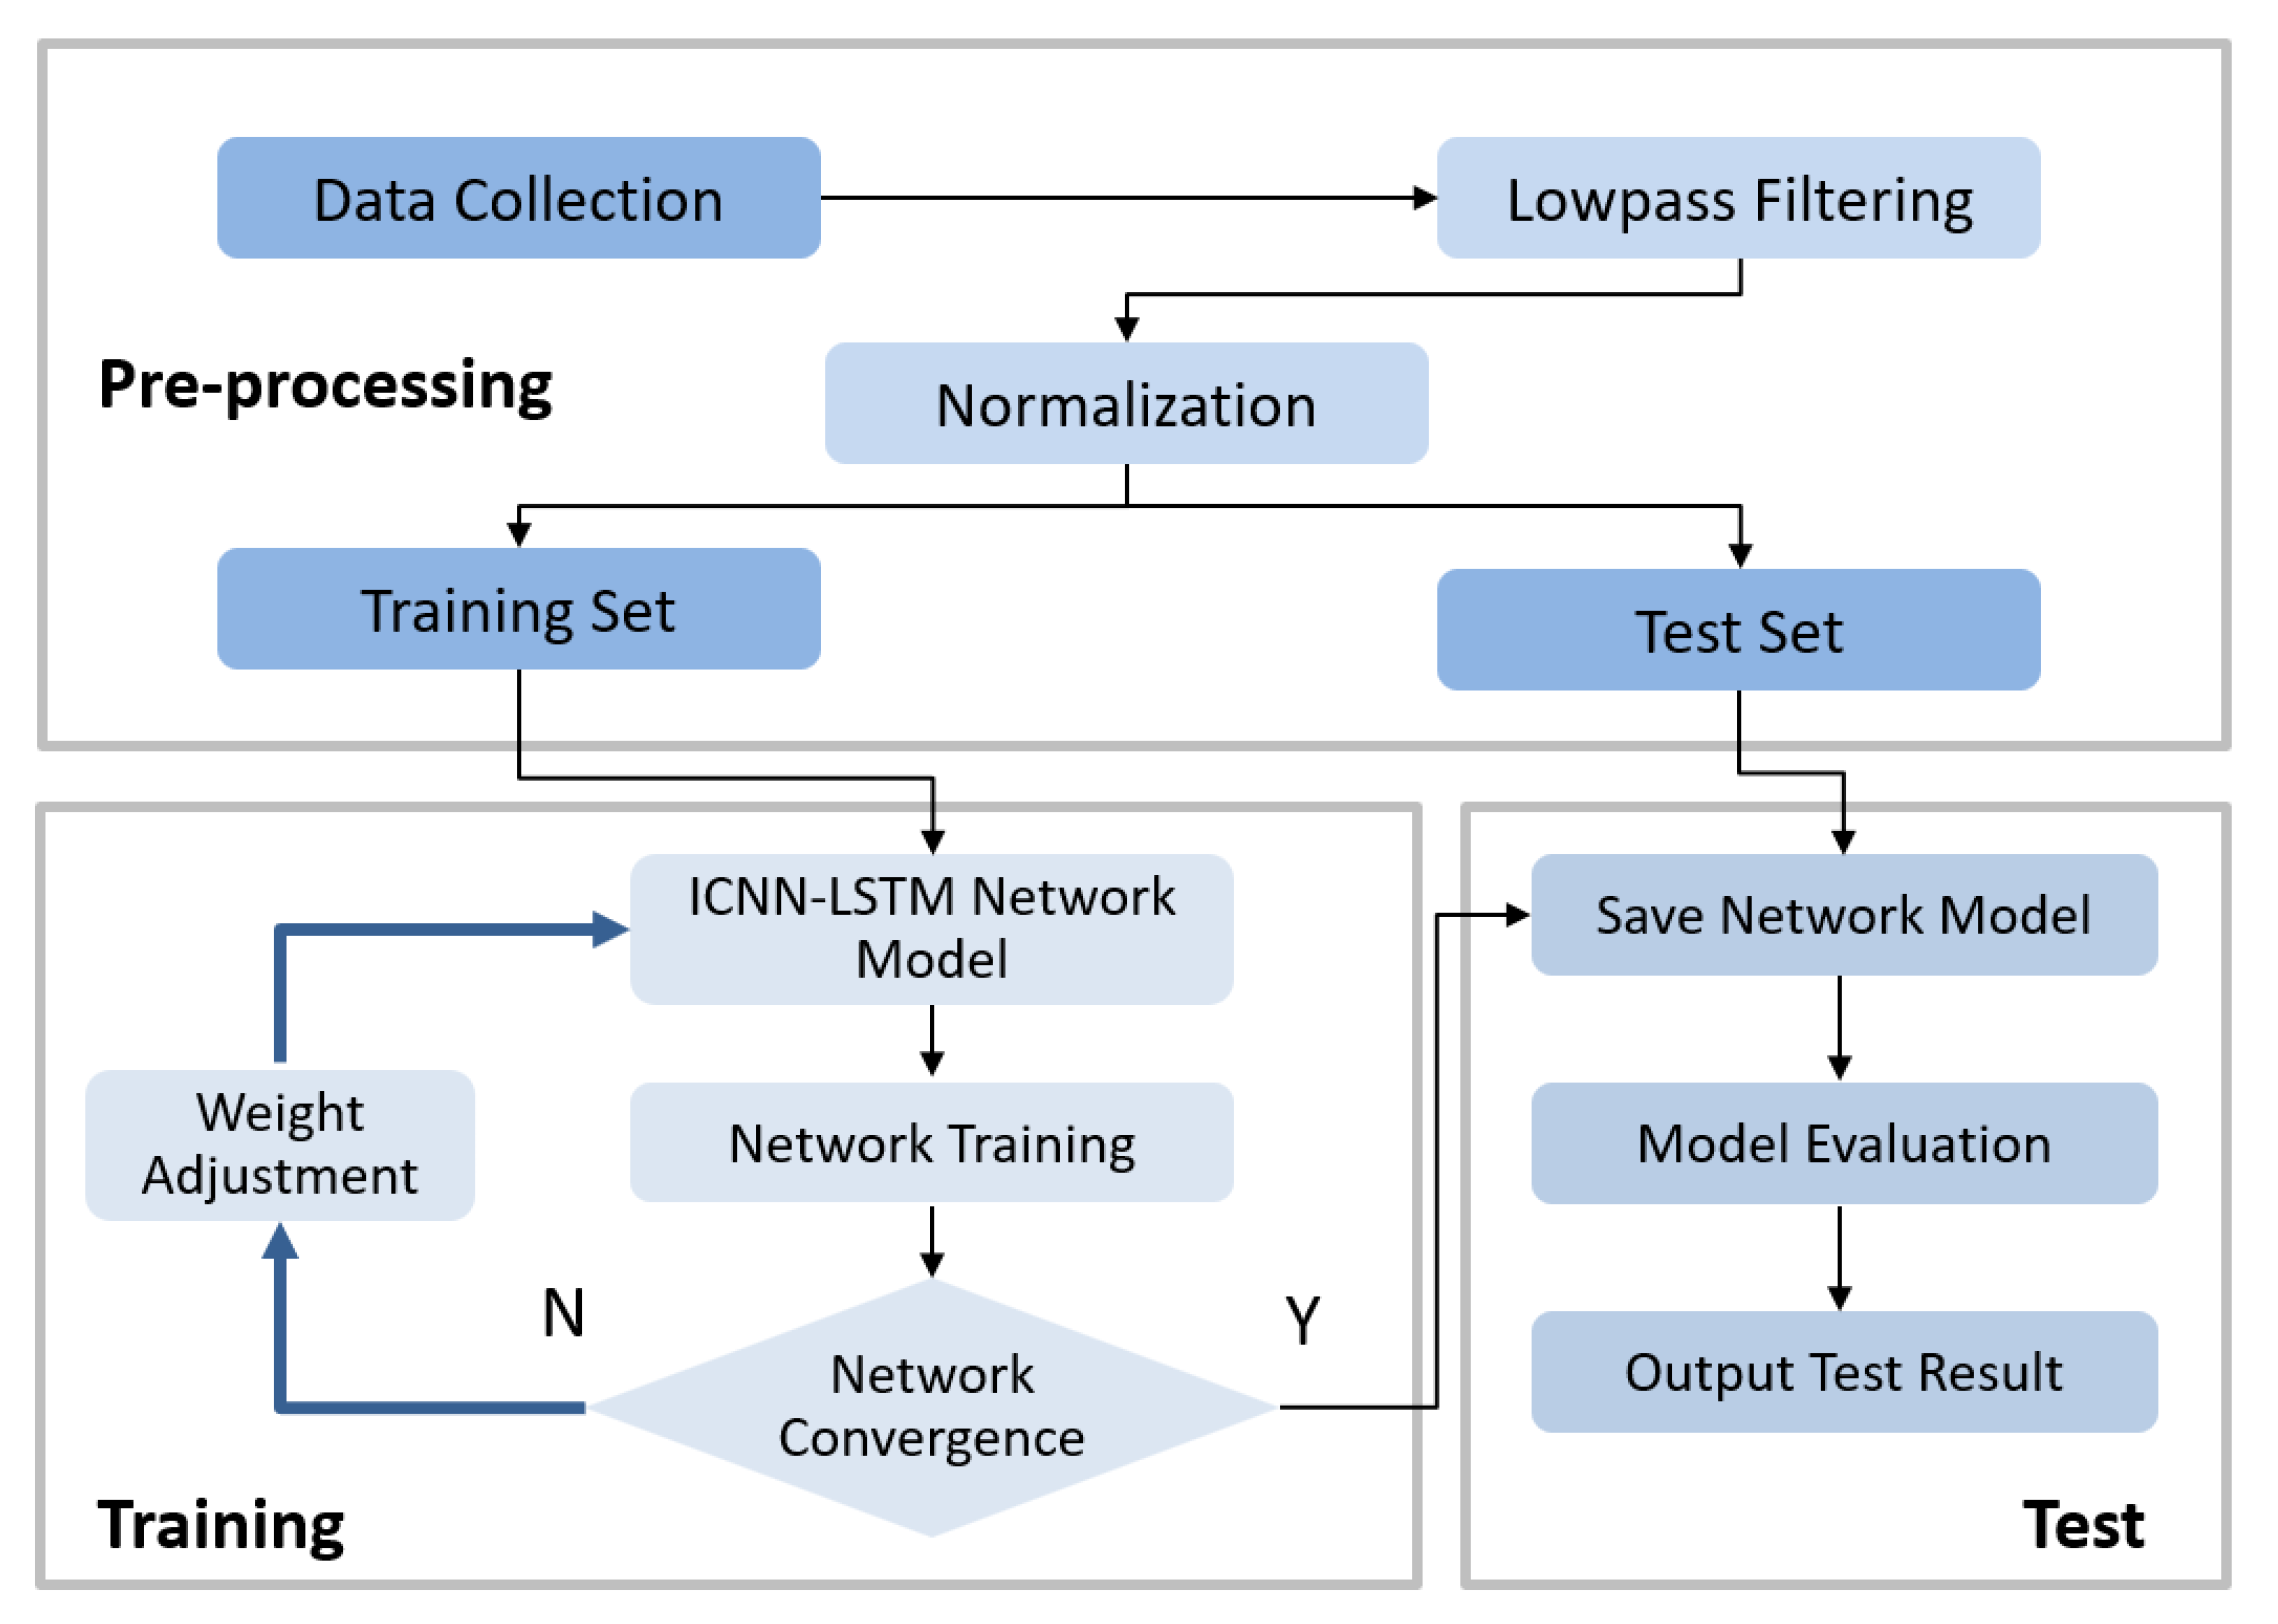
Figure 7.
ICNN-LSTM Network Architecture
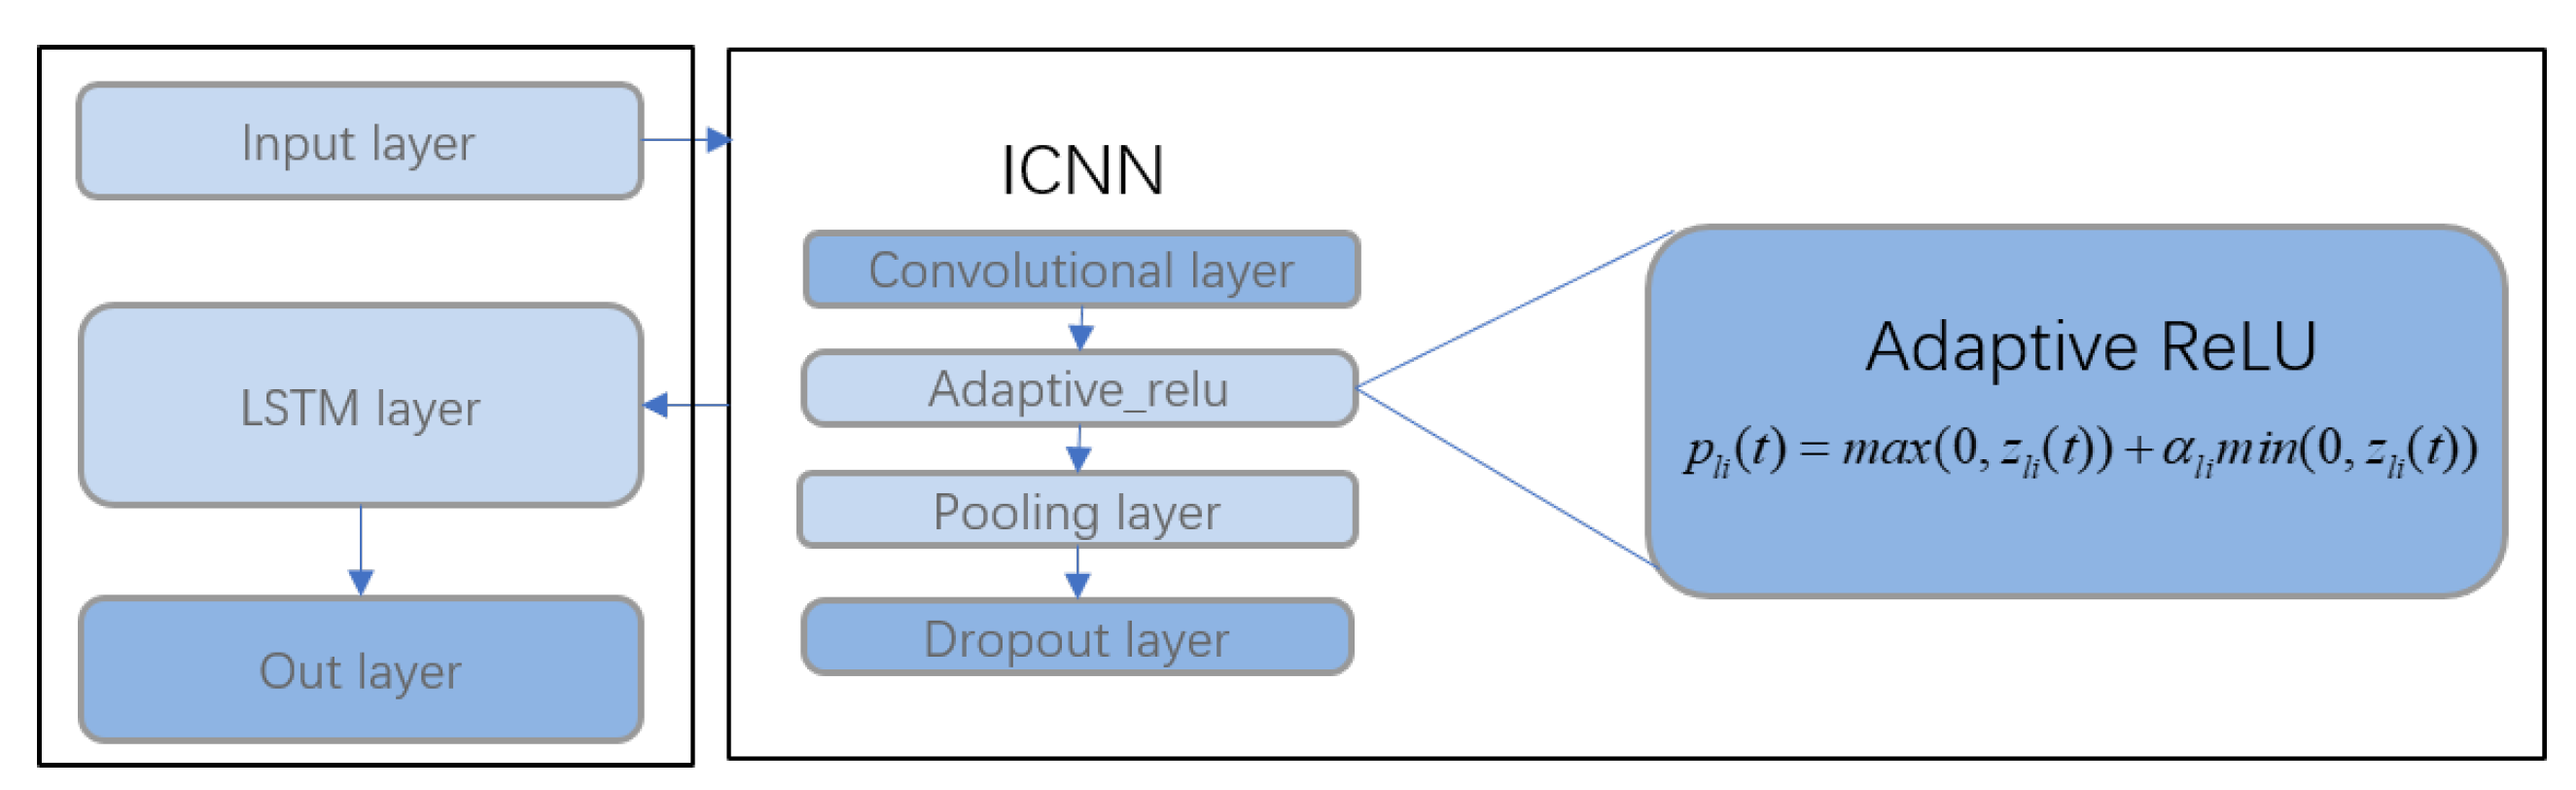
Figure 8.
Wall-Climbing Robot Control System
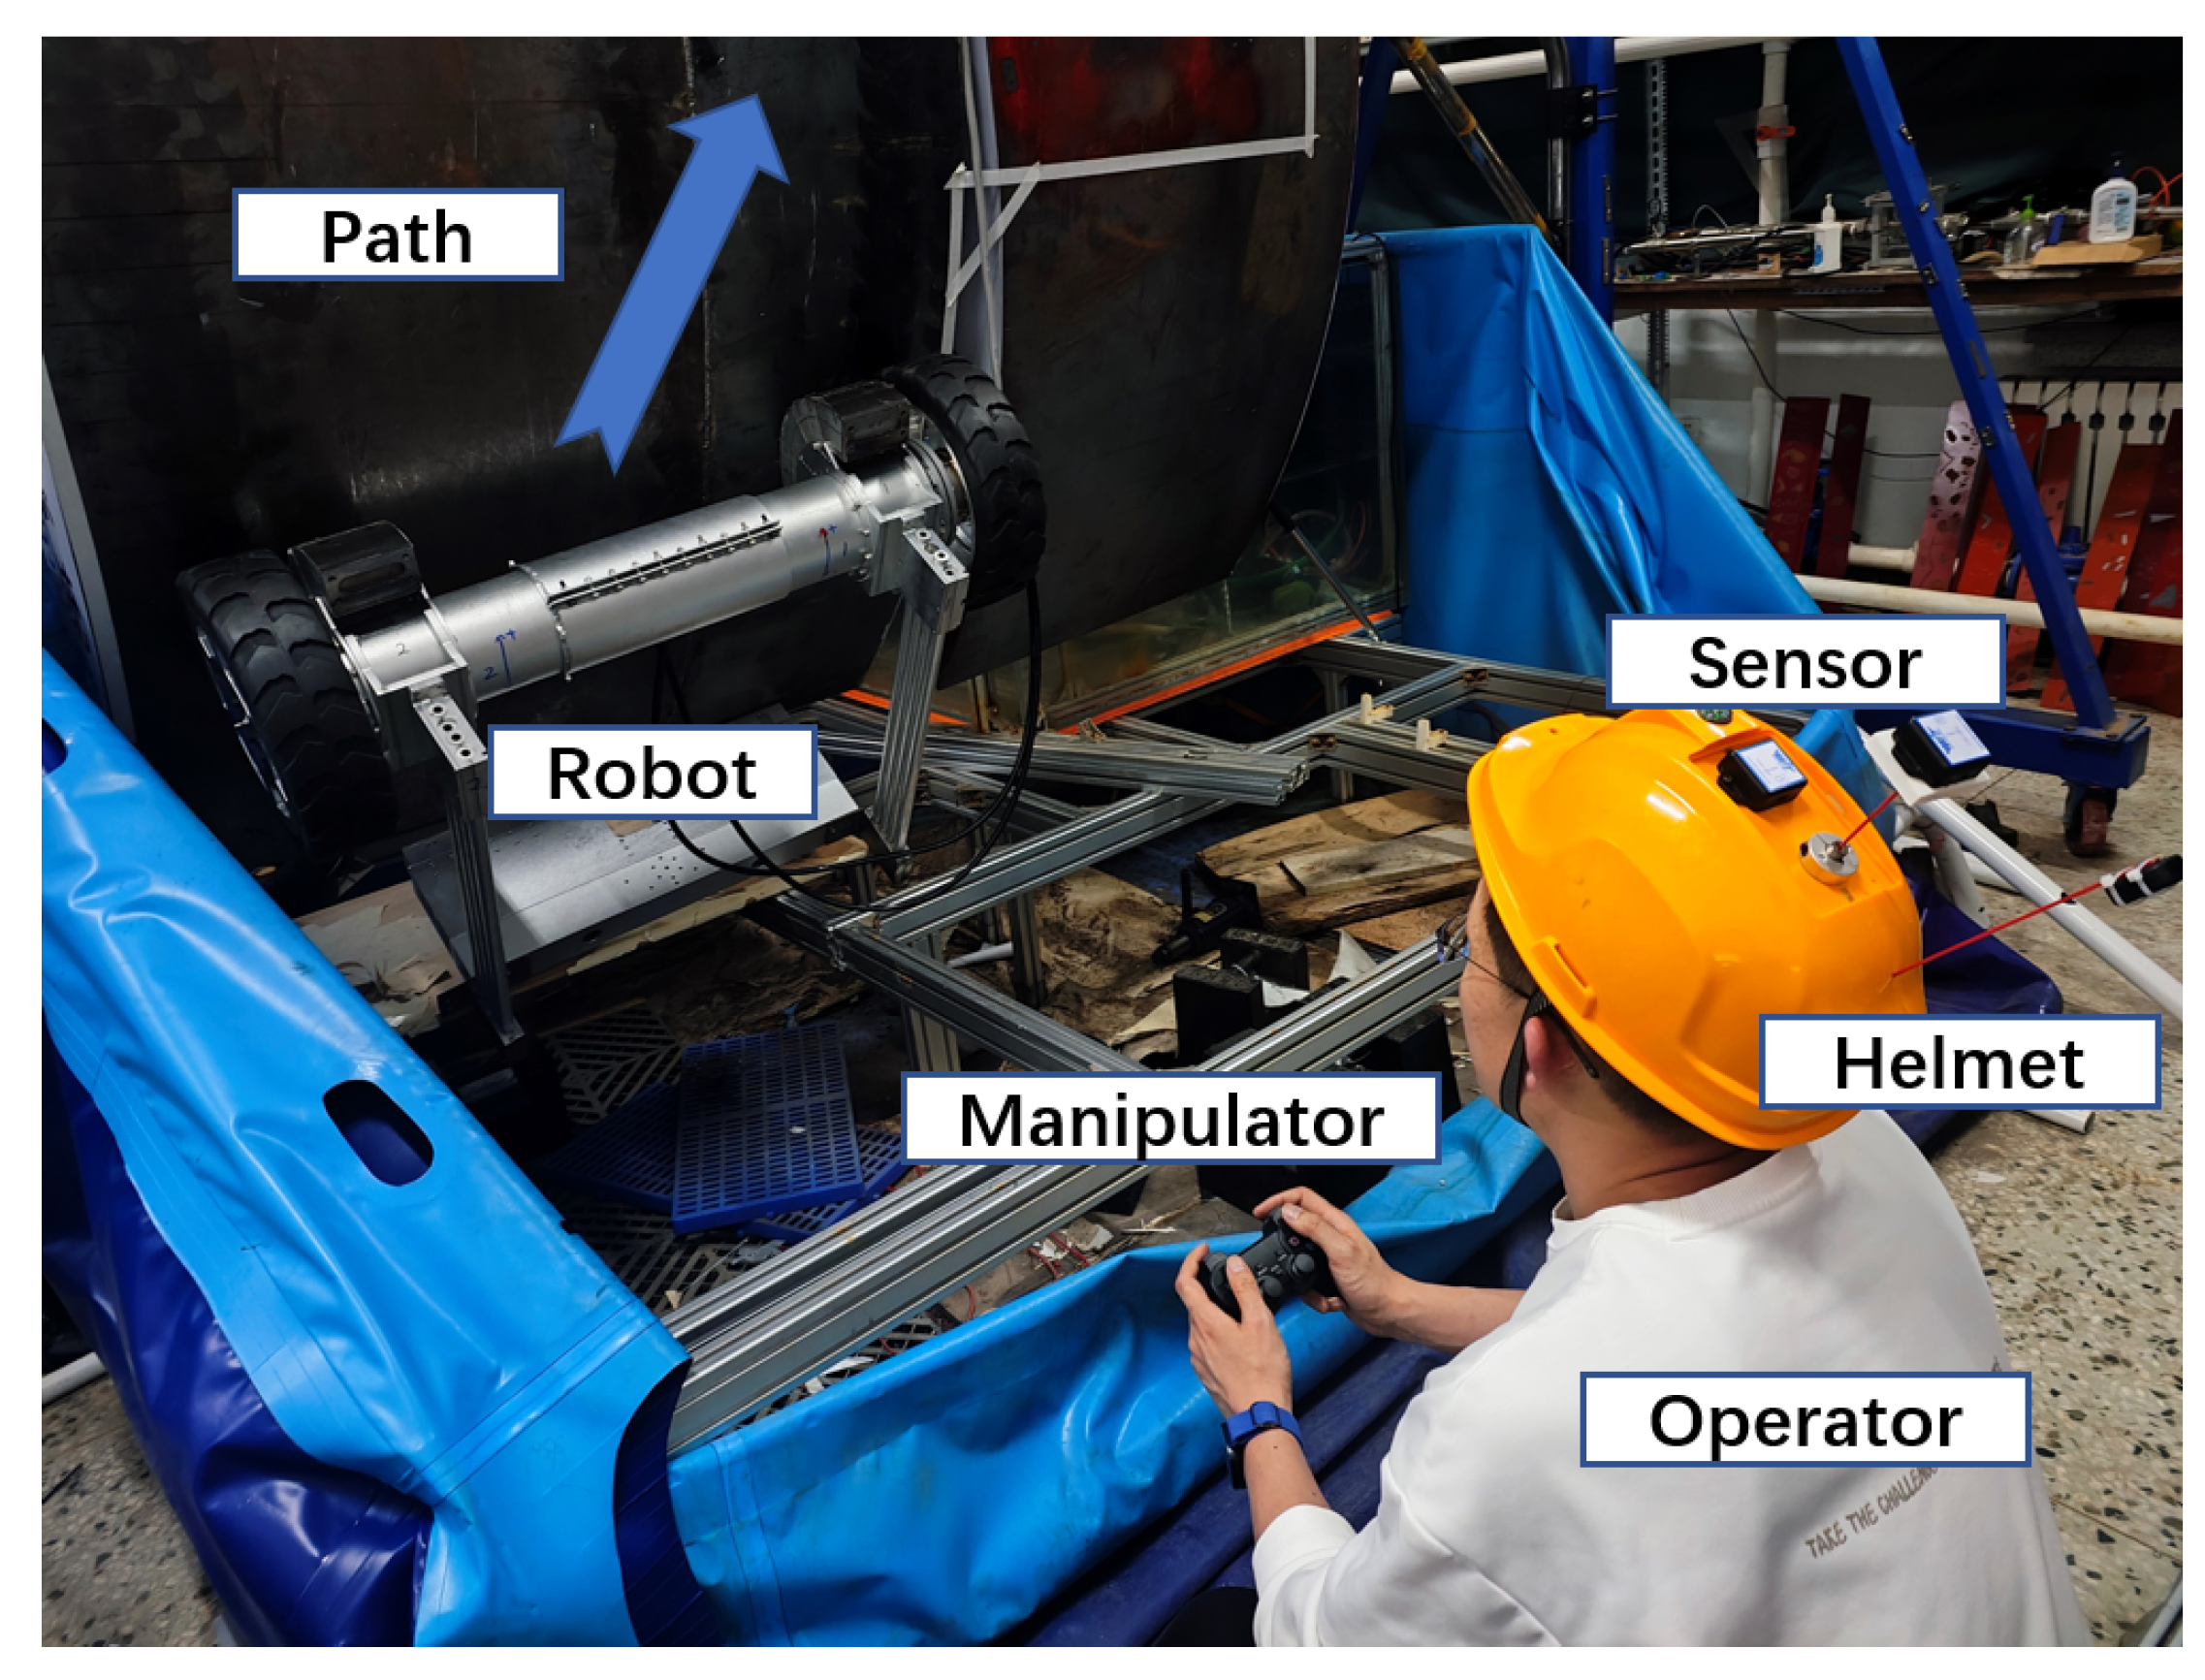
Figure 9.
Comparison of Accuracy and Loss during Training with Different Learning Rates; (a)Accuracy and loss rate with a learning rate of 0.1; (b) Accuracy and loss rate with a learning rate of 0.01; (c) Accuracy and loss rate with a learning rate of 0.001
Figure 9.
Comparison of Accuracy and Loss during Training with Different Learning Rates; (a)Accuracy and loss rate with a learning rate of 0.1; (b) Accuracy and loss rate with a learning rate of 0.01; (c) Accuracy and loss rate with a learning rate of 0.001
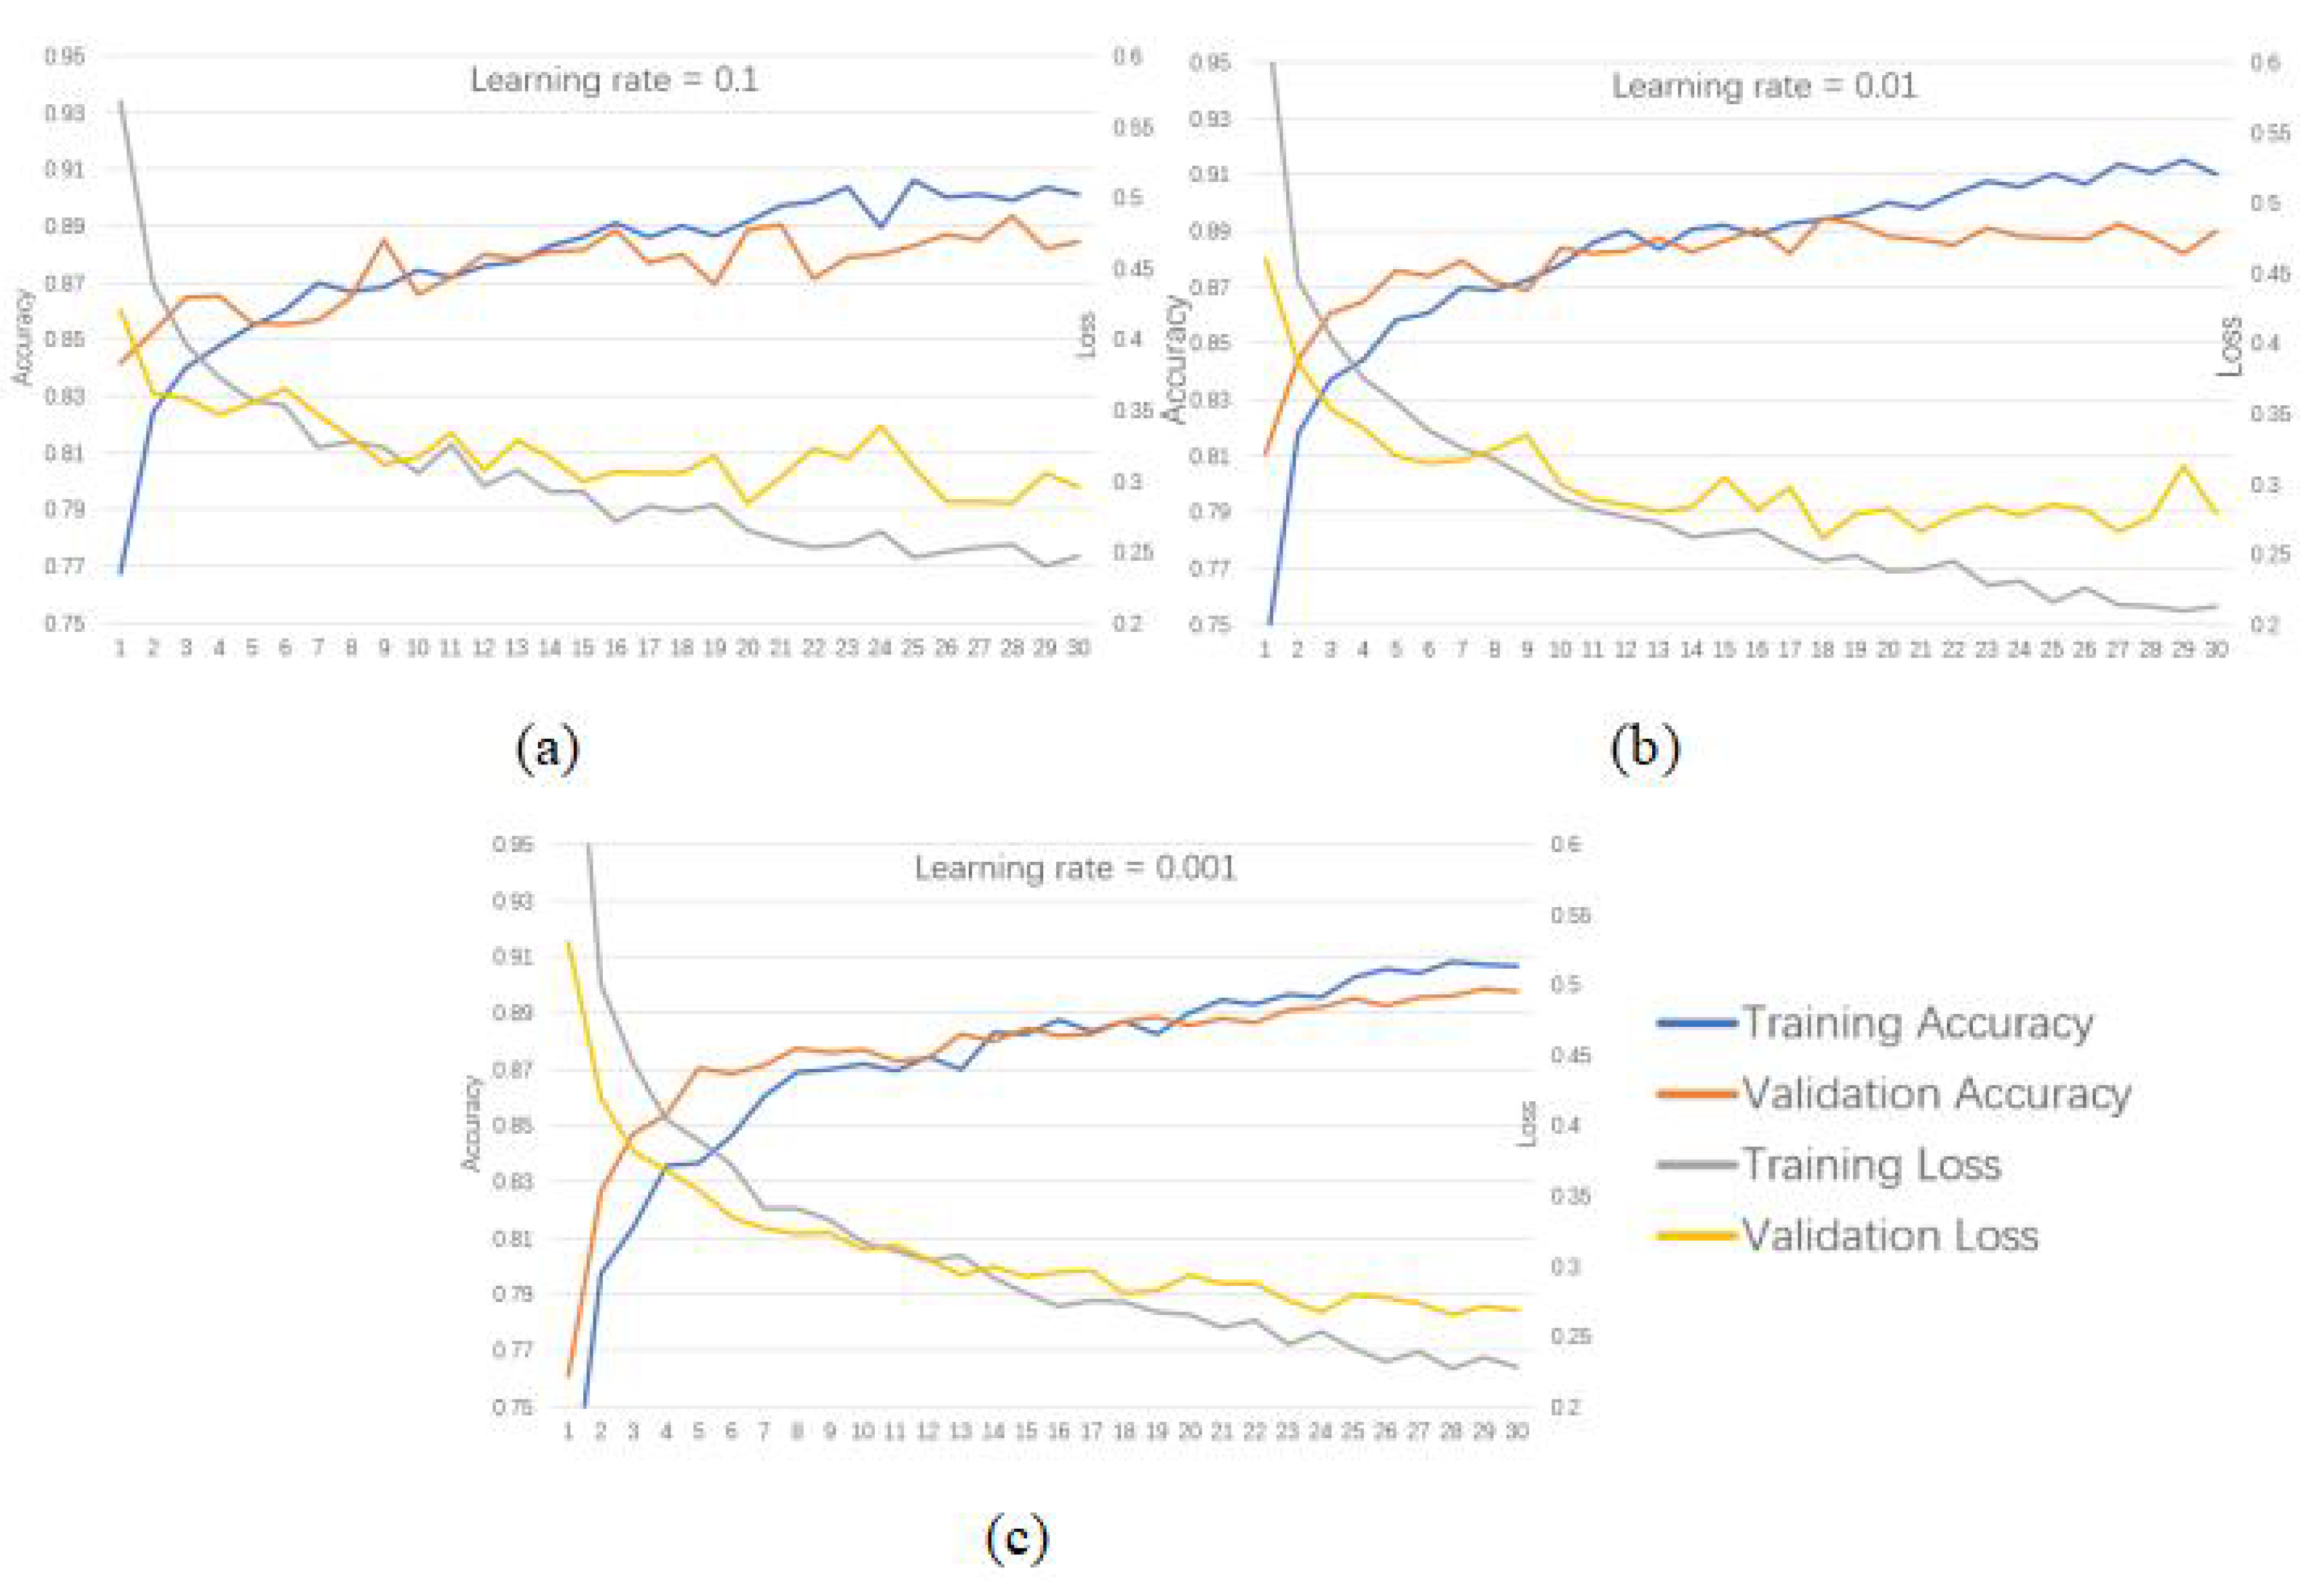
Figure 11.
Comparison of Classification Accuracy for Each Model Using Single Sensor at Different Speeds; (a) ICNN-LSTM model; (b) LSTM model; (c) RNN model; (d) BP model;(e) RF model; (f) KNN model
Figure 11.
Comparison of Classification Accuracy for Each Model Using Single Sensor at Different Speeds; (a) ICNN-LSTM model; (b) LSTM model; (c) RNN model; (d) BP model;(e) RF model; (f) KNN model
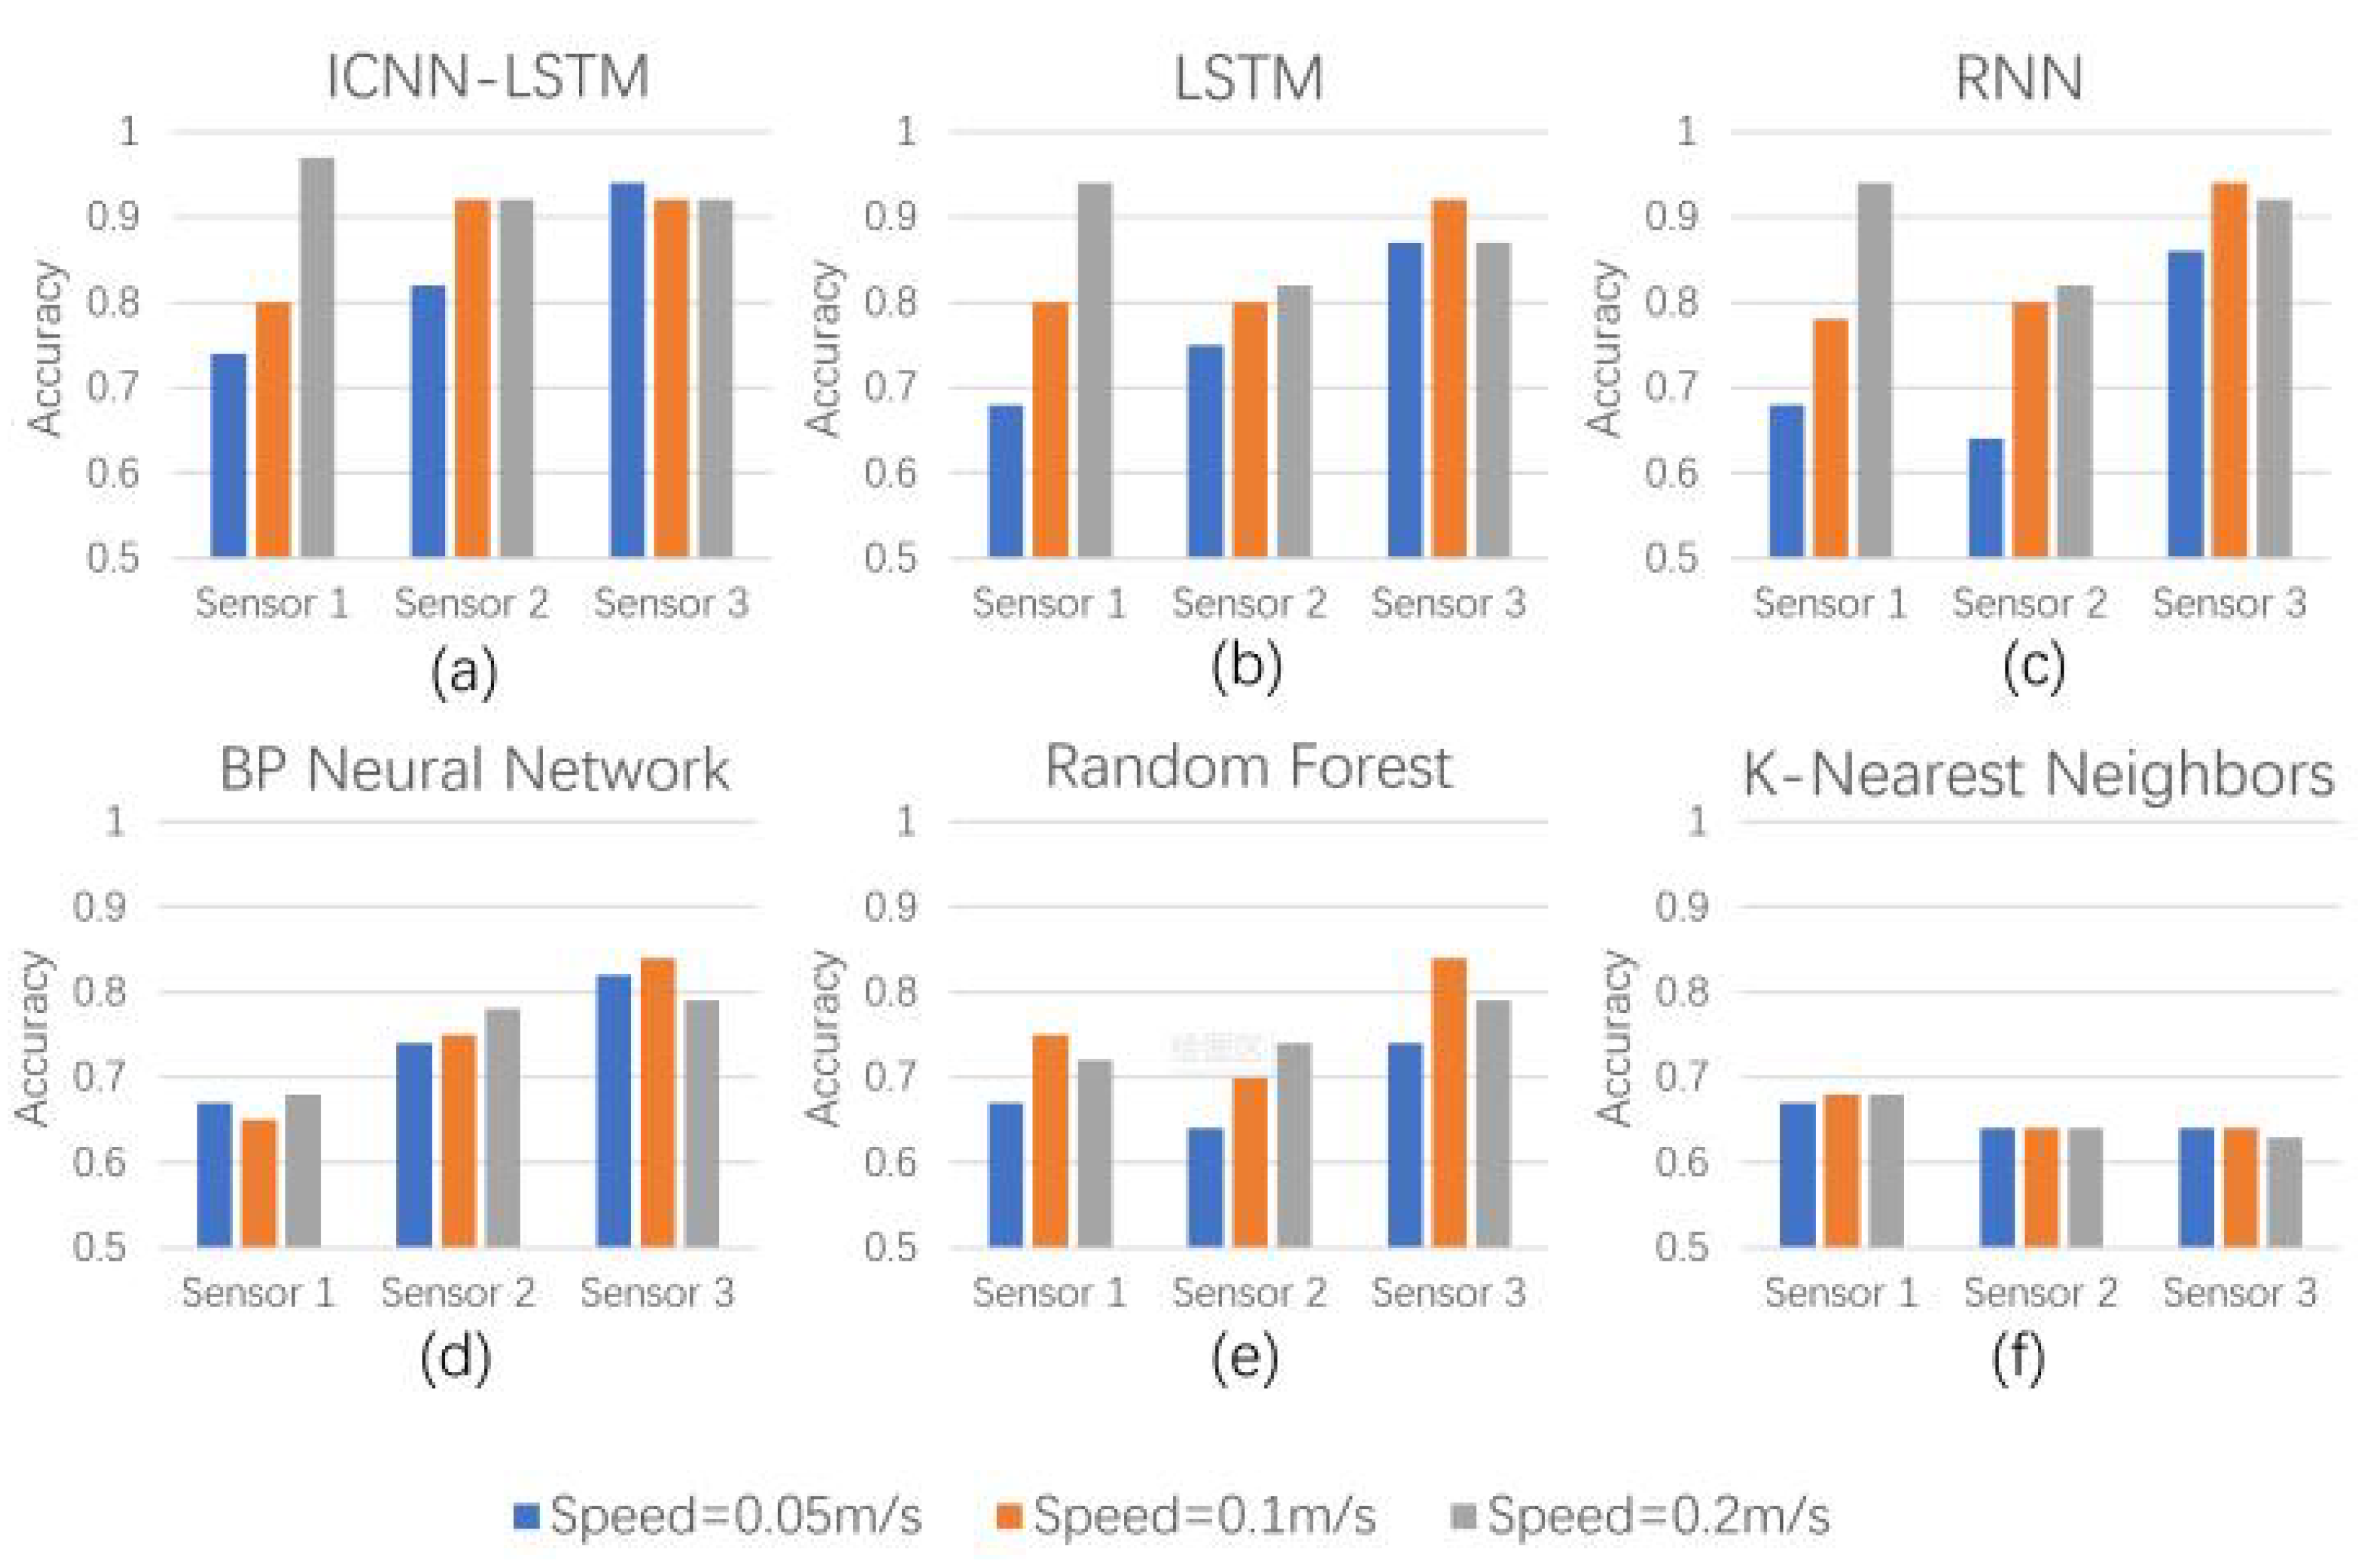
Figure 12.
Comparison of Classification Accuracy for Fused Sensor Data at Different Speeds
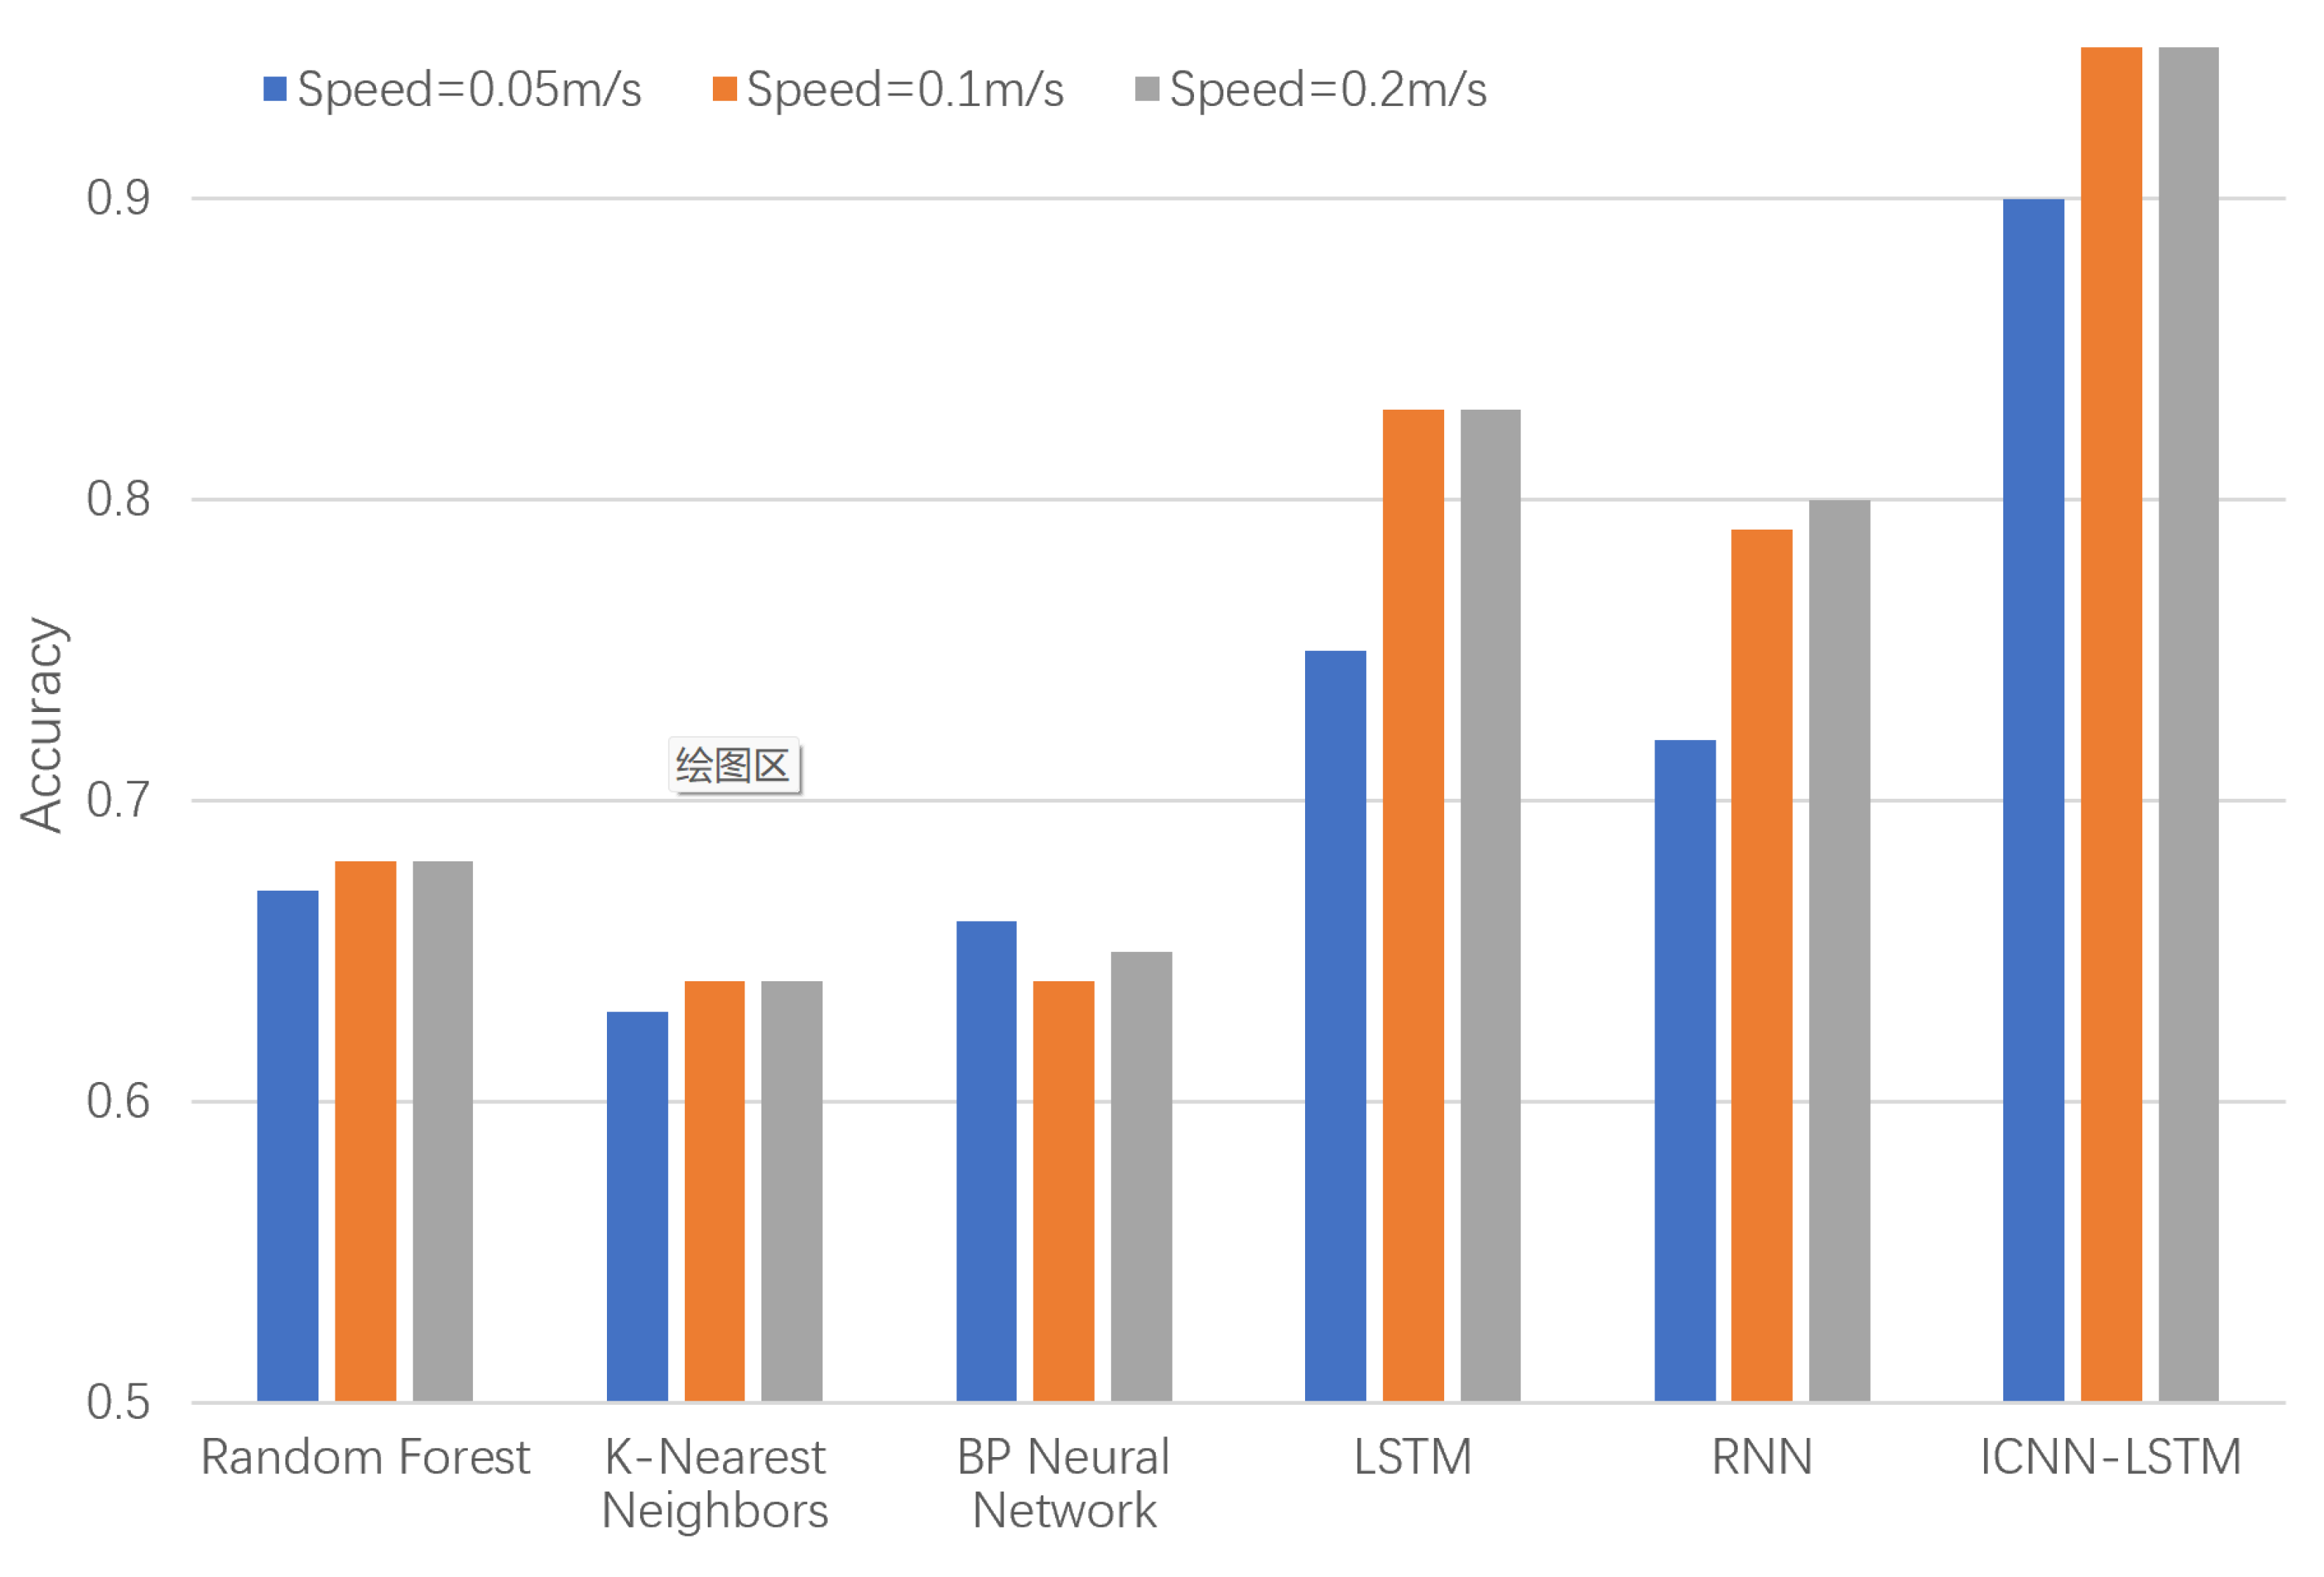
Figure 13.
Comparison of Confusion Matrices for Different Models (a) ICNN-LSTM model; (b) LSTM model; (c) RNN model; (d) KNN model; (e) RF model; (f) BP model
Figure 13.
Comparison of Confusion Matrices for Different Models (a) ICNN-LSTM model; (b) LSTM model; (c) RNN model; (d) KNN model; (e) RF model; (f) BP model
Disclaimer/Publisher’s Note: The statements, opinions and data contained in all publications are solely those of the individual author(s) and contributor(s) and not of MDPI and/or the editor(s). MDPI and/or the editor(s) disclaim responsibility for any injury to people or property resulting from any ideas, methods, instructions or products referred to in the content. |
© 2025 by the authors. Licensee MDPI, Basel, Switzerland. This article is an open access article distributed under the terms and conditions of the Creative Commons Attribution (CC BY) license (http://creativecommons.org/licenses/by/4.0/).
Copyright: This open access article is published under a Creative Commons CC BY 4.0 license, which permit the free download, distribution, and reuse, provided that the author and preprint are cited in any reuse.


