Submitted:
03 June 2025
Posted:
03 June 2025
You are already at the latest version
Abstract
Dragonfly classification are crucial for biodiversity conservation. Traditional taxonomic approaches require extensive training and experience, limiting their efficiency. Computer vision offers promising solutions for dragonfly taxonomy.In this study, we adapt the face recognition algorithms for the classification of dragonfly species, achieving efficient recognition of categories with extremely small differences between classes. Meanwhile, this method can also reclassify data that was incorrectly labeled. The model is mainly built based on the classic face recognition algorithm (ResNet50+ArcFace), and ResNet50 is used as the comparison algorithm for model performance. Three datasets with different inter-class data distributions were constructed based on two dragonfly image data sources.: Data1, Data2 and Data3. Ultimately, our model achieved Top1 accuracy rates of 94.3%, 85.7%, and 90.2% on the three datasets, surpassing ResNet50 by 0.6, 1.5, and 1.6 percentage points, respectively. Under the confidence thresholds of 0.7, 0.8, 0.9, and 0.95, the Top1 accuracy rates on the three datasets were 96.0%, 97.4%, 98.7%, and 99.2%, respectively. In conclusion, our research provides a novel approach for species classification. Furthermore, it can calculate the similarity between classes while predicting categories, thereby offering the potential to provide technical support for biological research on the similarity between species.
Keywords:
Odonate
; Classification
; Face recognition
; ArcFace
; ResNet50
1. Introduction
Dragonflies (order Odonata) represent one of the most ancient lineages of flying insects, exhibiting a nearly cosmopolitan distribution with the notable exception of Antarctica. Currently, over 6000 extant species have been documented, with the highest biodiversity occurring in tropical and subtropical ecosystems. Their exceptional sensitivity to environmental perturbations makes dragonflies valuable bioindicators for assessing ecosystem health. Investigations into dragonfly systematics not only elucidate evolutionary relationships but also contribute significantly to biodiversity conservation, environmental monitoring, and invasive species management [1]. Conventional taxonomic approaches relying on morphological diagnostics are not only labor-intensive but also prone to subjective interpretation [2]. Recent advances in computer vision and deep learning have revolutionized taxonomic methodologies, enabling automated image-based classification systems [3]. The integration of artificial intelligence into odonate taxonomy now represents a transformative paradigm in entomological research [4].
Modern computer vision architectures, such as AlexNet, ResNet, DenseNet, EfficientNet, Vision Transformer (ViT), Swin Transformer, and T2T-ViT [5,6,7,8,9,10,11], have achieved remarkable performance in object classification tasks.. These algorithms have been successfully adapted for taxonomic classification across various animal and plant taxa [12,13,14,15,16], including preliminary applications in odonate systematics [17,18]. However, conventional classification models typically generate categorical predictions without accompanying confidence metrics, limiting their interpretability in taxonomic applications. While recent improvements incorporate prediction confidence outputs [19], these metrics alone remain insufficient for distinguishing between morphologically similar species, particularly among closely related taxa or conspecifics [20]. A more robust solution would require algorithms capable of quantifying interspecific similarity beyond simple confidence estimates.
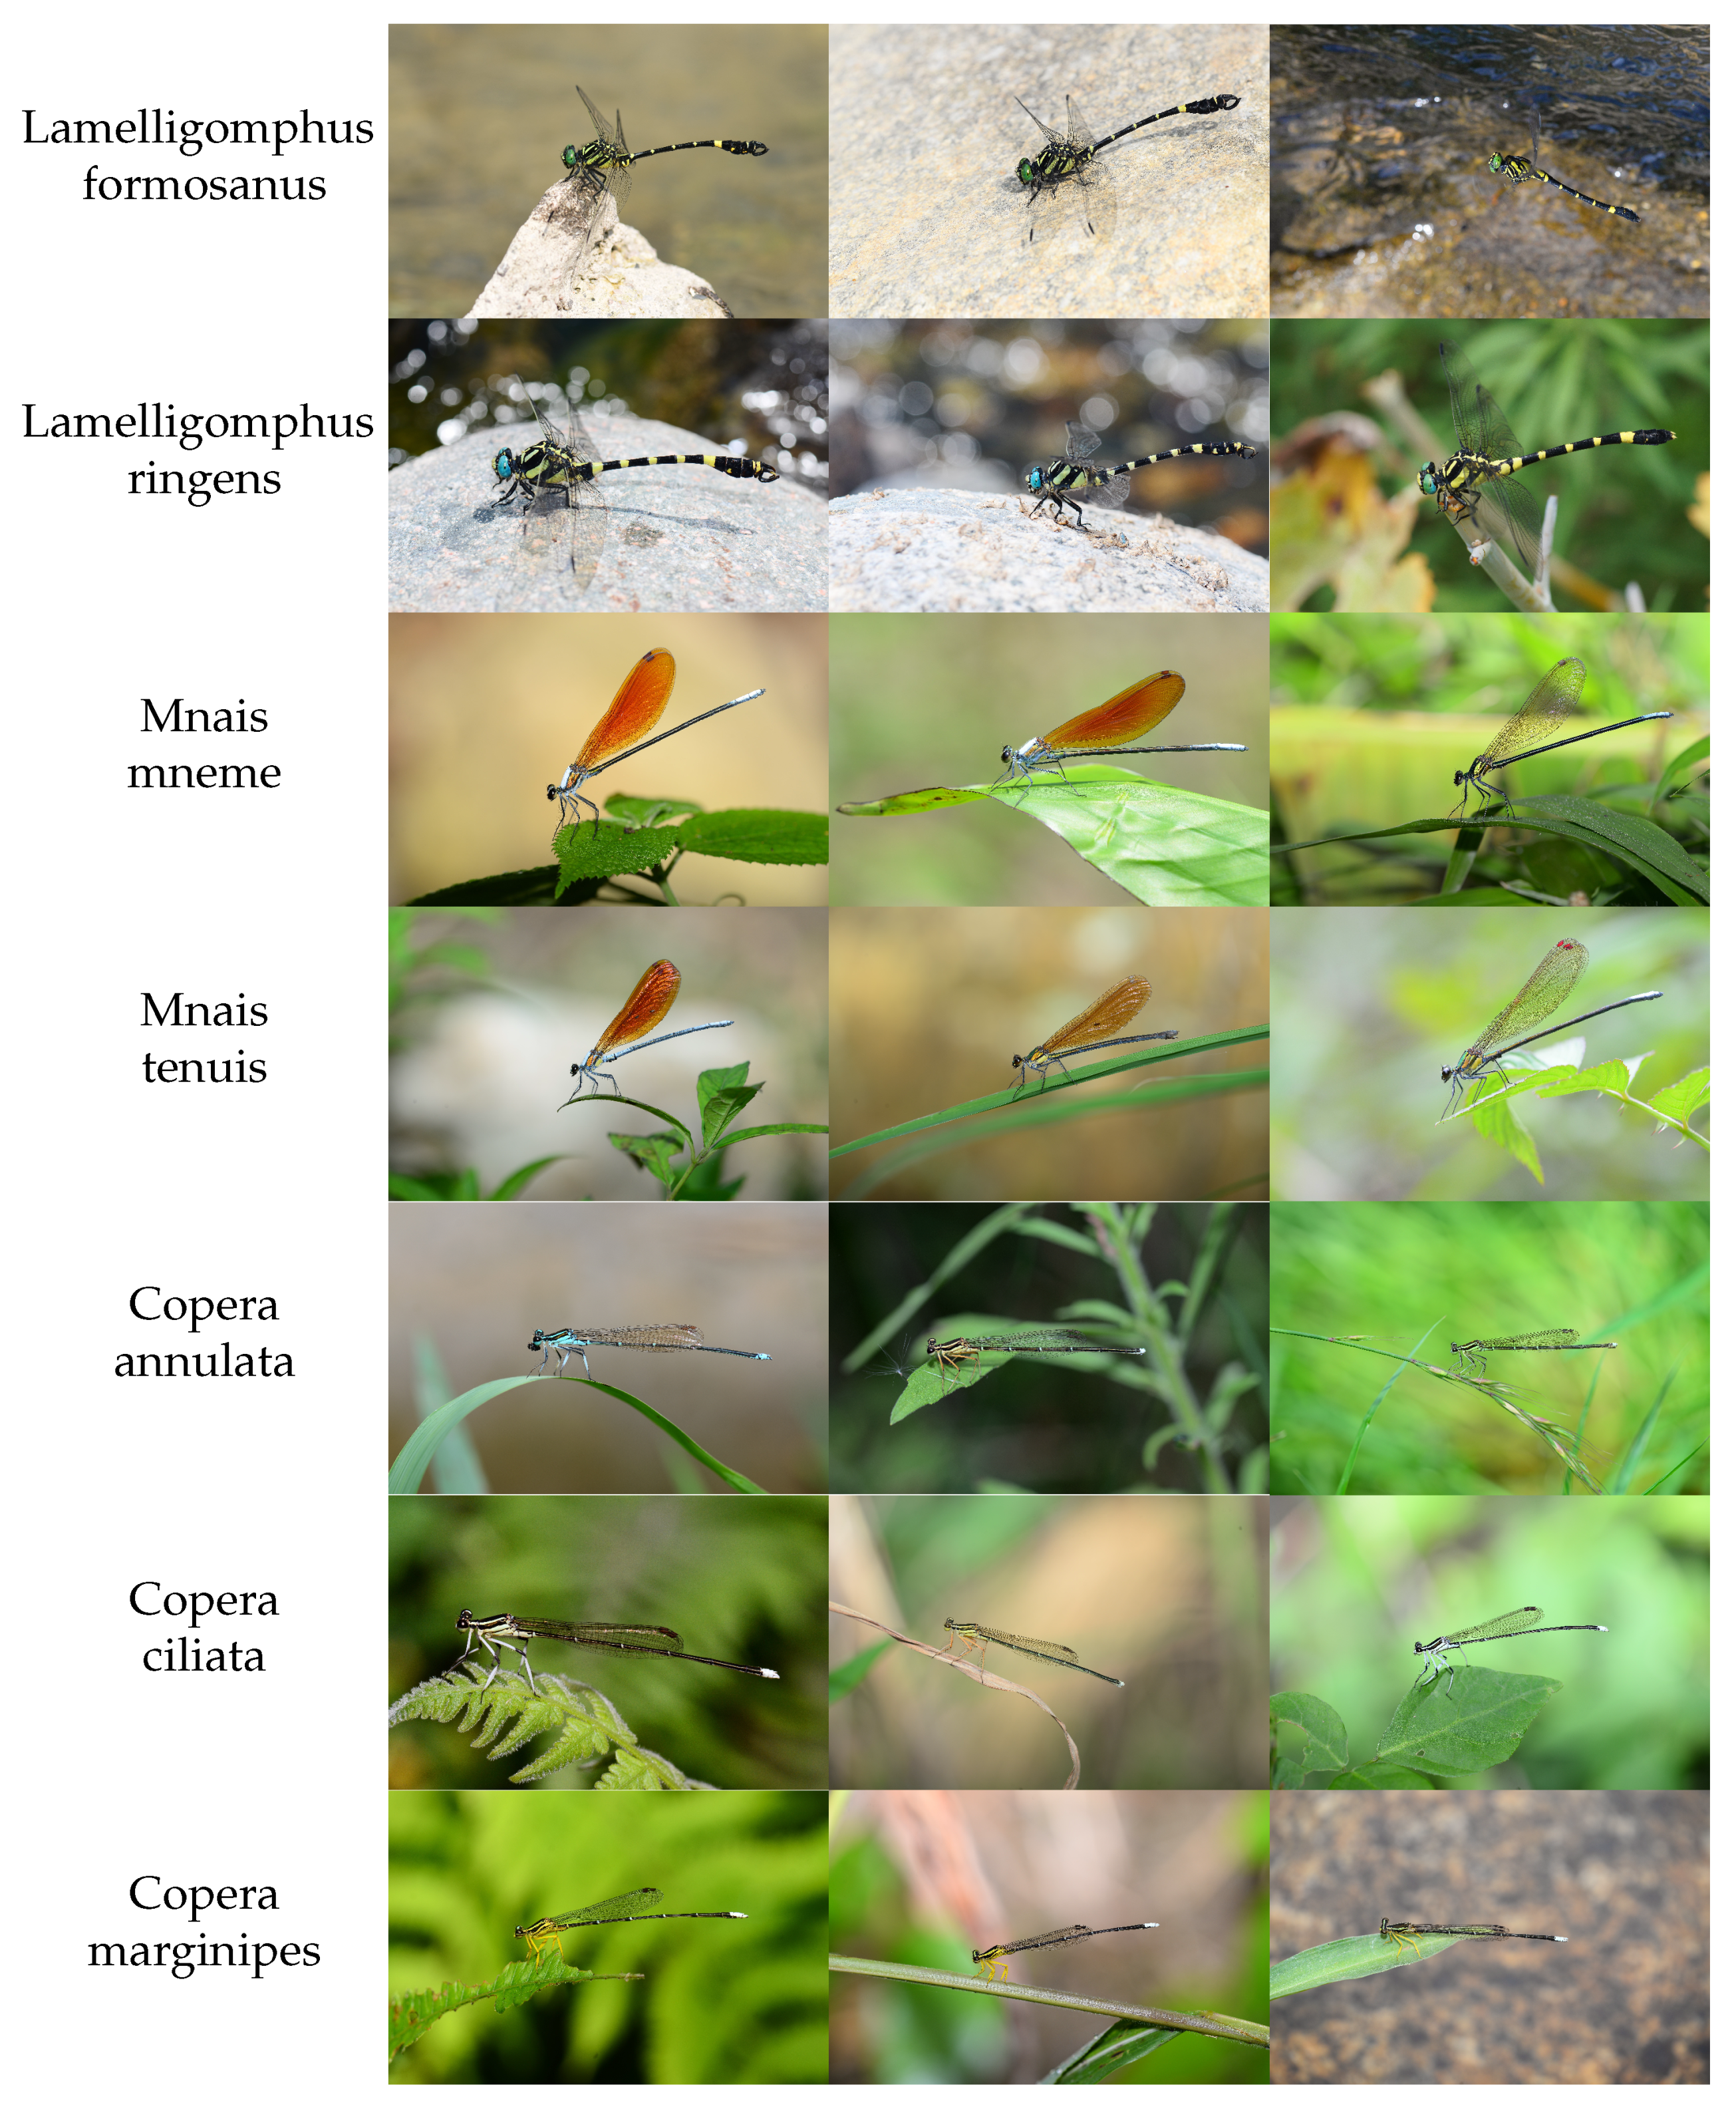
The morphological characteristics of dragonflies exhibit considerable variation across different species [21]. Significant interspecific differences can be observed even within the same genus, as demonstrated by Lamelligomphus ringens and Mnais mneme in Figure 1. Conversely, some closely related species show minimal morphological variation, such as Lamelligomphus formosanus and Lamelligomphus ringens, or Mnais mneme and Mnais tenuis. Certain species groups exhibit only subtle distinguishing features. In some cases, sexual dimorphism is limited to coloration differences between males and females of the same species [22,23,24].Nevertheless, all Odonata share fundamental synapomorphies including flight membranes, elongated abdomens, and compound eyes. This pattern of variation—where distinct species share common anatomical features while maintaining unique characteristics—parallels the morphological relationships observed in human facial recognition. We therefore hypothesize that facial recognition algorithms, particularly those generating similarity metrics between categories, may offer superior performance for dragonfly classification compared to conventional approaches.
To test this hypothesis, we implemented a comparative framework evaluating face recognition algorithms against standard classification models. Among available architectures, We employed the ArcFace loss function, a classic approach in facial recognition, for dragonfly species discrimination.
2. Data Process
The study utilized two primary sources of dragonfly data: iNaturalist dragonfly image data and dragonfly images collected by Dr. Haomiao Zhang’s team at the Kunming Institute of Zoology, Chinese Academy of Sciences. The iNaturalist dataset encompasses over 2000 dragonfly species, demonstrating remarkable species diversity. However, this dataset exhibits significant imbalances in image distribution, ranging from nearly 6000 images for the most abundant species to merely 5 images for the rarest. Furthermore, the iNaturalist data contains several quality issues, including misclassifications, images without dragonflies, blurred photographs, and images featuring multiple dragonflies. In contrast, Dr. Zhang’s dataset comprises 218 common Chinese dragonfly species with exceptionally high-quality images, each meticulously classified by experts. Nevertheless, this dataset is relatively small in scale, with only 1-10 images available per species.
In summary, these datasets present the following challenges: (1) class imbalance; (2) incorrect labeling; (3) excessive background pixels relative to dragonfly pixels in many images; (4) images completely lacking dragonflies; (5) blurred images; (6) images containing multiple dragonflies of potentially different species.
To address these issues, the authors employed an object detection algorithm, which can identify dragonflies in images while simultaneously determining their positions. This approach facilitates the removal of images without dragonflies or with poor quality. Additionally, by cropping detected dragonfly regions, the algorithm helps mitigate problems related to low dragonfly pixel ratios and multiple dragonflies in single images. Specifically, the authors implemented the YOLOv10 object detection algorithm [25]. The methodology involved randomly selecting 5000 dragonfly images for bounding box annotation of dragonflies, followed by training the YOLOv10 model using these annotated images. The results on the test set after training are shown in Table 1:
The dataset processed by YOLOv10 object detection excluded images without dragonflies, blurred images, and those with minimal dragonfly presence. For images containing small dragonflies, the detected regions were cropped to isolate the dragonflies, as illustrated in Figure 2, thereby removing most irrelevant background. In images with multiple dragonflies, each detected bounding box was cropped and saved as an individual image. Notably, when cropping the predicted bounding boxes generated by YOLOv10, the authors slightly expanded the boxes. Additionally, if the predicted bounding box had unequal height and width, the shorter dimension was adjusted to match the longer one, as the subsequent classification algorithm requires square input images (Figure 2). This cropping strategy effectively reduces background pixels, eliminates most interference for classification, and ensures the dragonfly is centered in the image, thereby enhancing the accuracy of the subsequent classification algorithm [26].
3. Proposed Methodology
For dragonfly species classification, we adapted face recognition algorithms. To evaluate their performance, we conducted comparative experiments using standard computer vision classification algorithms.
Many computer vision classification algorithms employ the Softmax loss function [5,6,7,8,9,10,11]. This function transforms network-extracted features into class probability distributions through a fully connected layer, enabling effective category discrimination. The Softmax function is defined in equation 1:
where is the input for class i, and C is the total number of classes.
Although the face recognition algorithm model we adopted directly generates feature vectors of recognized objects without employing the Softmax loss function for category probability distribution output, it utilizes various loss functions during the training phase to enhance learning capability. These loss functions play a pivotal role in improving model performance for face recognition tasks. Representative examples include Softmax, Center Loss [27], CosFace [28], SphereFace [29], ArcFace [30], and X2-Softmax [31]. Among these, the ArcFace loss function has become a classic approach in this field, with its mathematical formulation in equation 2:
where:
- N is the batch size;
- s is the scale factor;
- is the angle for the true class ;
- m is the angular margin;
- is the cosine similarity for class j.
The softmax loss function was initially employed in early face recognition algorithms. To improve the discriminative capability of these systems, researchers have developed several enhanced loss functions derived from the original softmax formulation [32,33]. Among these improvements, ArcFace is a classical solution. This approach projects feature vectors onto a hyperspherical manifold, optimizing intra-class compactness and inter-class separation, which significantly enhances face recognition accuracy [30].
We have adapted a face recognition algorithm for dragonfly species classification. The methodology differs between the training and inference phases compared to conventional face recognition, as illustrated in Figure 3, which presents our species classification workflow.
For image classification, our model first employs an object detection algorithm to localize the dragonfly within the input image. The detected rectangular bounding box is then adjusted to form a square region, which is subsequently cropped and resized to 128×128 pixels. This processed image serves as input to the ResNet50 architecture, generating a 512-dimensional feature vector. During training data preparation, we utilize the YOLOv10 object detection algorithm for dragonfly localization. To optimize inference speed during deployment, modified face detection algorithms such as BlazeFace [34], RetinaFace [35], and SCRFD [36] can be adapted for dragonfly detection.
In the training phase, the preprocessed dragonfly image is converted into a normalized 512-dimensional feature vector via ResNet50. This vector undergoes matrix multiplication with the normalized feature vectors of all candidate species to compute similarity scores. These scores are processed through the ArcFace loss function to generate predicted probabilities, which are compared with the ground truth labels to compute the loss value. The ResNet50 parameters are then optimized through backpropagation.
During inference, the input image similarly undergoes feature extraction to produce a normalized 512-dimensional vector. This vector is compared with stored species templates to determine similarity scores. The system selects the species with the highest similarity score, provided it exceeds a predefined threshold (e.g., 0.8). If no score surpasses this threshold, the specimen is classified as unknown; otherwise, it is assigned to the most similar known species.
4. Experiments
4.1. Experimental Setup
Our operating system is CentOS, and the graphics card used is the NVIDIA GeForce RTX 3090. The deep learning framework employed is PyTorch. The program used in this paper is derived from the InsightFace open-source face recognition program, available on GitHub at https://github.com/deepinsight/insightface. Our code is modified based on this program. Since the original program is quite robust, we did not alter its core code. For comparative experiments, the ResNet50 classification algorithm was also modified based on this program, with all network settings left at their default values. All neural network models trained and tested in this study are based on ResNet50, which is widely used in face recognition solutions and serves as the backbone for the ArcFace implementation in InsightFace. The same pre-trained weights were used throughout the training process. All models were trained using the Stochastic Gradient Descent (SGD) optimizer with an initial learning rate of 0.001, momentum of 0.9, and weight decay of 0.0005. The batch size was set to 256, and the training was conducted for 100 epochs. The validation set was tested every 100 iterations, and the remaining parameters were left at their default values. During training, data augmentation techniques such as random horizontal flip, random vertical flip, color jitter, and random affine transformations were applied. The images used for training and evaluation were resized to 128×128×3, and the extracted feature vectors had a dimensionality of 512. All pixel values of the images used for training and evaluation were normalized to the range of -1 to 1.
4.2. Experimental Data
The model was trained on a dataset of dragonfly images processed using YOLOv10. We constructed three distinct datasets: Data1, Data2, and Data3, each containing 272 dragonfly species. Data1 consists of categories with over 1000 images per species, totaling 841050 images. Data2 comprises exactly 1000 images per category, yielding 272000 images in total. Data3 was created by randomly selecting 272 species from over 2000 available categories, resulting in an uneven distribution of images per species (ranging from 5 to 5790 images) and a total of 121535 images. The image distribution across categories is illustrated in Figure 4. Each dataset was split into training, validation, and test sets at a ratio of 6:2:2.
4.3. Experimental Results
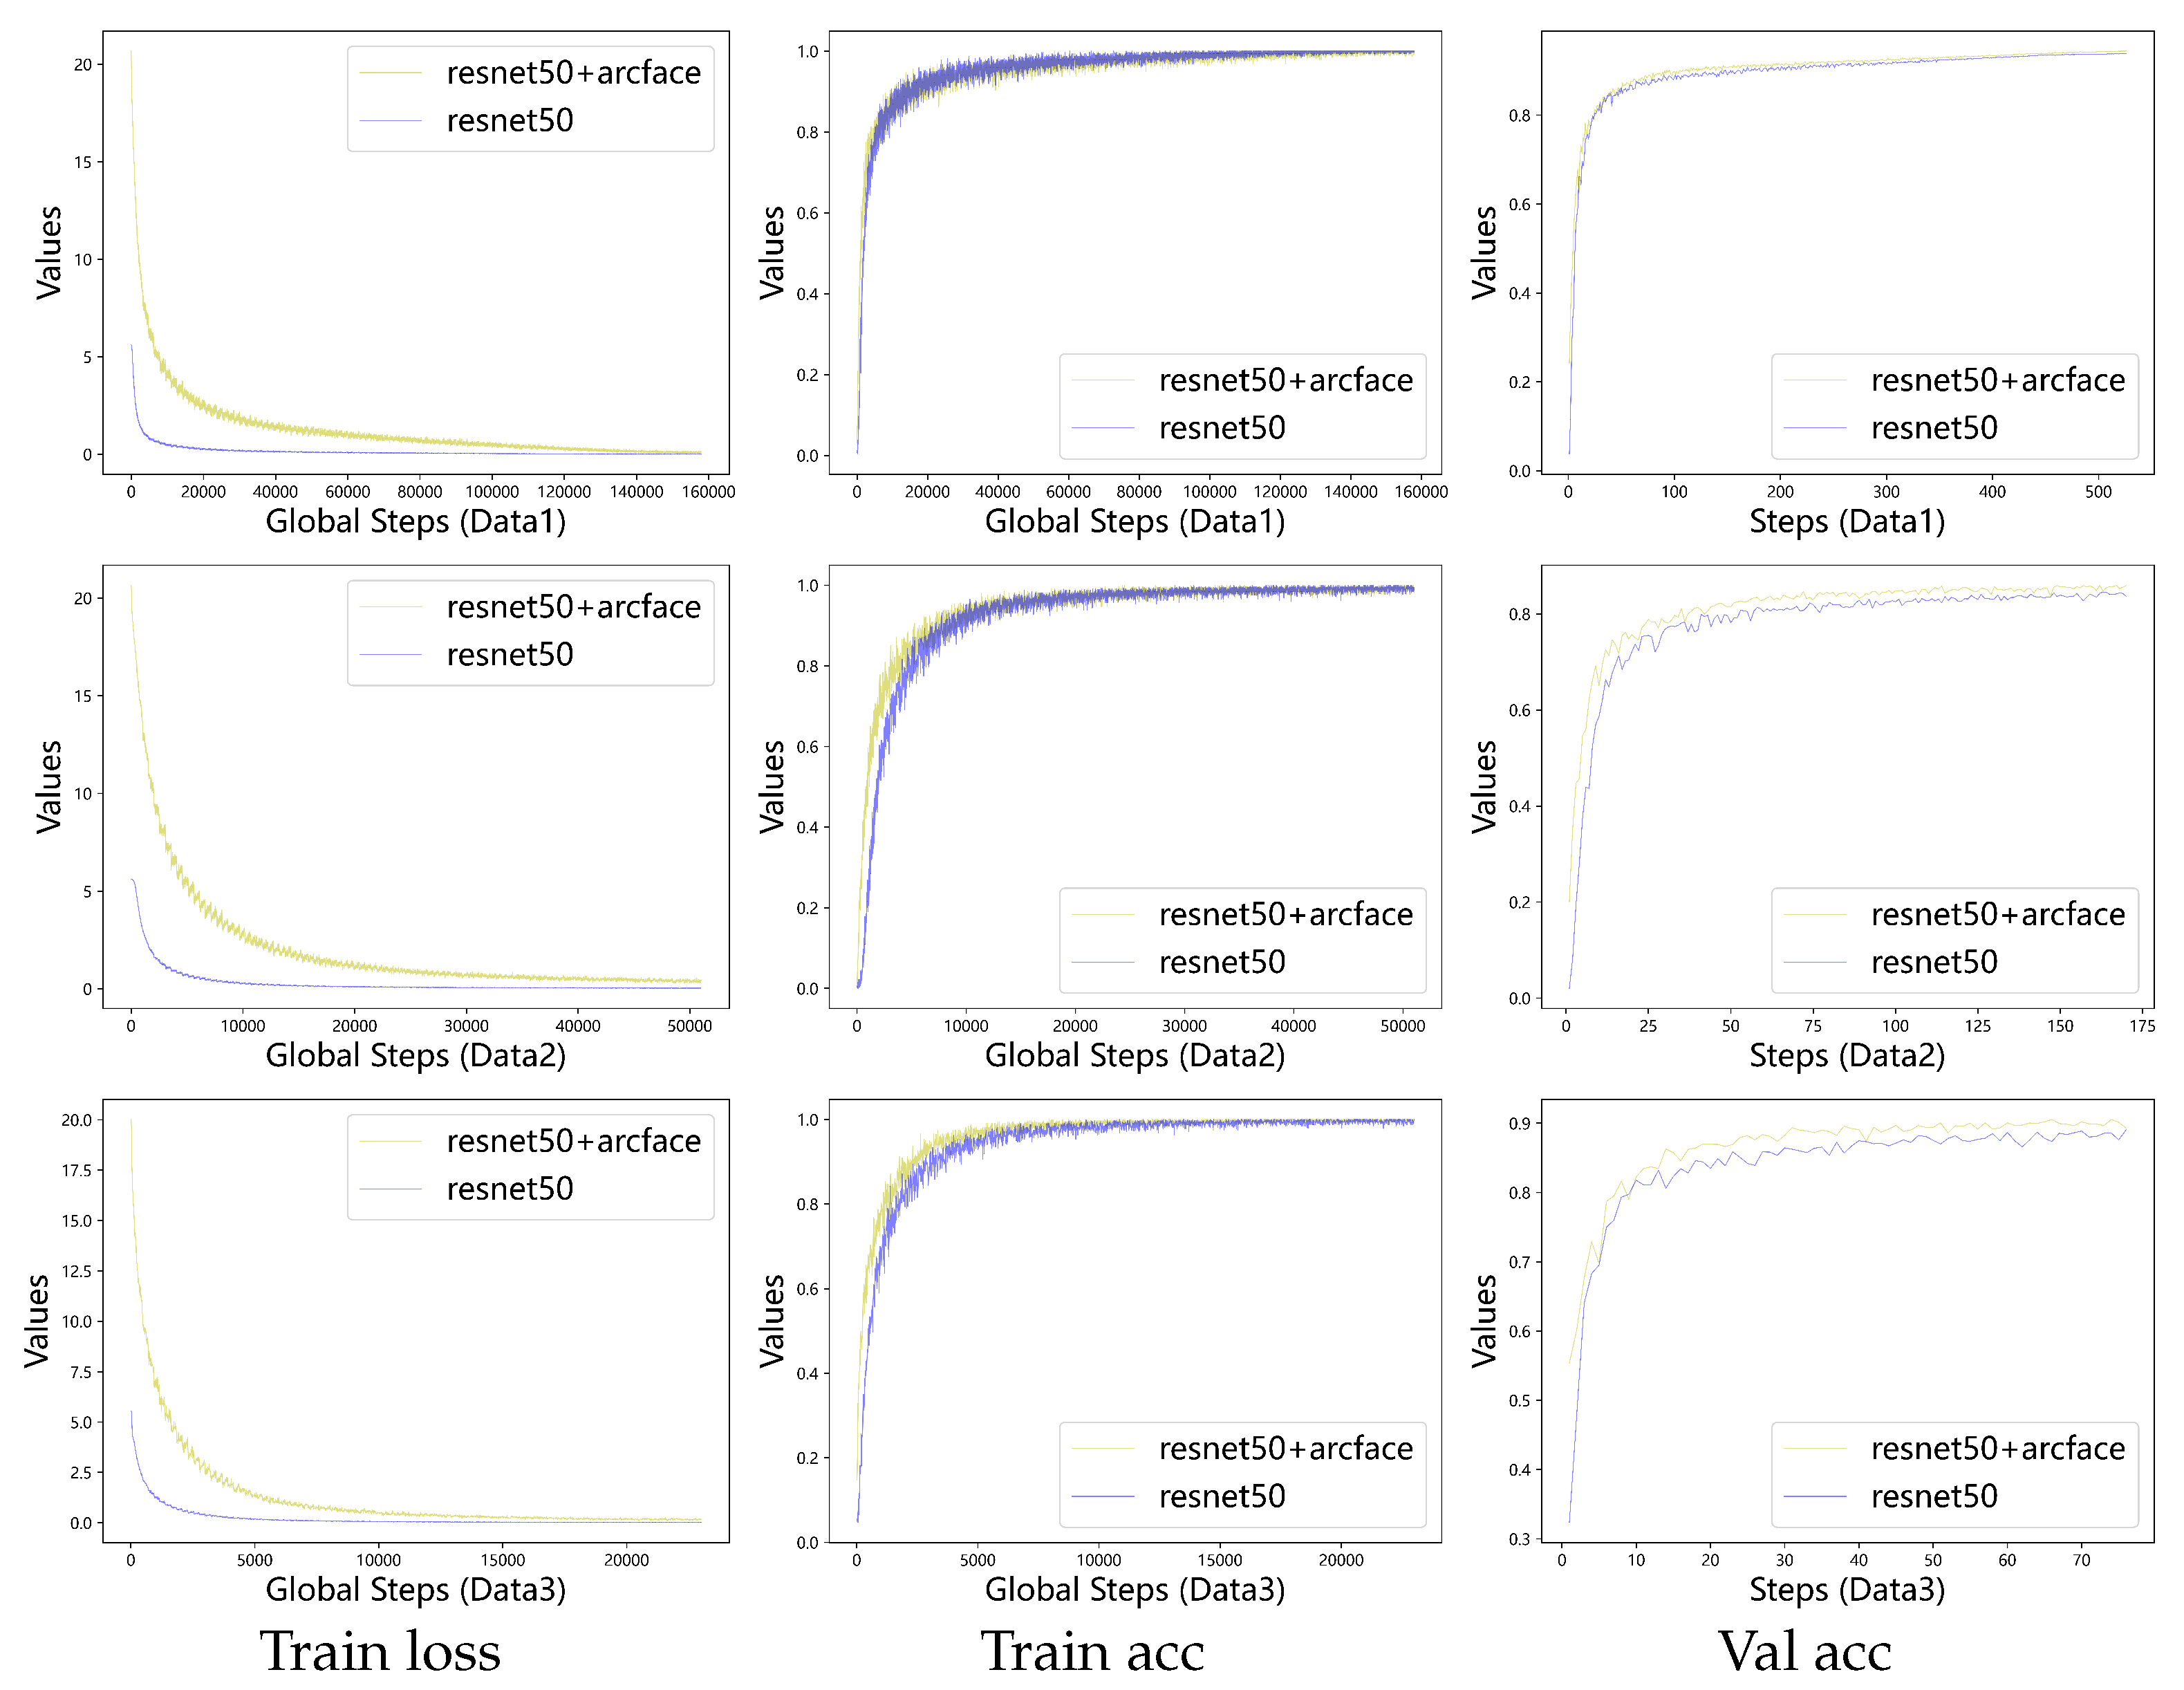
The ResNet50+ArcFace and ResNet50 models were trained on three datasets (Data1, Data2, and Data3), with sampling of training loss and accuracy during the process. Validation was performed every 100 iterations. As illustrated in Figure 5, the ResNet50+ArcFace model exhibited slower loss convergence compared to ResNet50 across all datasets. However, it consistently achieved higher training accuracy and superior validation accuracy than the baseline ResNet50 model.
After both models were trained, their performance on the test set is presented in Table 2. For the ResNet50 model, Top1 accuracy refers to the proportion of samples where the class with the highest predicted probability matches the ground truth label. For the ResNet50+ArcFace model, Top1 accuracy represents the proportion of samples where the class with the highest predicted similarity score matches the ground truth label.
Regarding Top5 accuracy, in the ResNet50 model, it indicates the proportion of samples where the ground truth label is contained within the top 5 classes with the highest predicted probabilities. Similarly, in the ResNet50+ArcFace model, Top5 accuracy denotes the proportion of samples where the ground truth label appears among the top 5 classes with the highest predicted similarity scores.
The Top1-t metric is specific to the ResNet50+ArcFace model, representing the proportion of samples where: (1) the class with the highest predicted similarity score matches the ground truth label, and (2) this similarity score is no less than threshold t. The calculation formula is shown in 3 of equation. The threshold t can be any value between [0,1]. In our study, we selected four threshold values: 0.7, 0.8, 0.90, and 0.95, corresponding to Top1-0.7, Top1-0.8, Top1-0.9, and Top1-0.95, respectively.
The Top1-t Accuracy is defined as:
where:
- t is the similarity threshold;
- denotes the size of a set
As shown in Table 2, the ResNet50+ArcFace model demonstrates consistent improvements over the baseline ResNet50 across all datasets. Specifically, it achieves accuracy gains of 0.6%, 1.5%, and 1.6% in Top-1 accuracy on Data1, Data2, and Data3, respectively. Both models maintain high performance in Top-5 accuracy across all three datasets. Notably, ResNet50+ArcFace shows superior accuracy at various confidence thresholds (0.7, 0.8, 0.9, and 0.95) for Top-1 classification on all datasets. These results are further supported by Table 3, which confirms that ResNet50+ArcFace consistently outperforms ResNet50 on Data1, Data2, and Data3.
The ResNet50+ArcFace model evaluates the Top1-t accuracy on the test data, where varying the threshold t yields different accuracy rates and simultaneously affects the proportion of samples satisfying the threshold condition. To investigate the relationship between these two metrics, we selected 101 discrete thresholds from the interval [0, 1] with a step size of 0.01. For each threshold t, we recorded the corresponding Top1-t accuracy and the proportion of samples exceeding the threshold relative to the total sample size, as illustrated in Figure 6. Additionally, Table 3 presents the proportions of samples surpassing the thresholds of 0.7, 0.8, 0.85, 0.9, and 0.95.
As shown in Figure 6, as the threshold t increases, the proportion of samples meeting or exceeding the threshold gradually decreases, with a more pronounced decline at higher thresholds. Table 3 further demonstrates that for thresholds of 0.7, 0.8, 0.85, 0.9, and 0.95, the proportion of samples above the threshold diminishes across different datasets. While higher thresholds correlate with increased Top1-t accuracy, the accuracy may drop to zero when the threshold approaches 1. This occurs because fewer samples exhibit maximum similarity scores close to 1, potentially resulting in no qualifying samples and thus zero accuracy. In summary, although higher thresholds improve accuracy, they simultaneously reduce the proportion of samples satisfying the threshold condition.
The practical implications of threshold selection are evident in applications such as dragonfly species identification. Higher thresholds enhance identification accuracy but impose stricter requirements on photographers, necessitating optimal shooting angles, higher-quality images, and potentially more time investment.
4.4. Ablation Study:Mislabeled Data Correction
Our algorithm employs a similarity-based approach to determine species categories. Consequently, we propose using similarity measures to identify and eliminate mislabeled data. To validate this approach, we conducted the following experiment: We selected 271 species categories, each containing over 1000 images. The dataset for each category was divided into training and validation sets at an 8:2 ratio. From each training set, we randomly selected 10 images and inserted them into other categories while keeping records of these modifications. During model training, we collected five types of metrics every 300 iterations: training accuracy, validation accuracy, prediction accuracy for misclassified data, classification accuracy with a threshold of 0.8, and the proportion of misclassified data with similarity scores exceeding 0.8. The training process terminated after 69 epochs, and the collected data were visualized in a line chart (Figure 7).
Figure 7 reveals several key findings: (1) Both training and validation accuracy improve with increasing training iterations; (2) The prediction accuracy for misclassified data and the proportion of misclassified data with similarity scores >0.8 initially increase before decreasing. We attribute this phenomenon to observed instances where the training accuracy reached 100% with a batch size of 420, suggesting potential overfitting within individual batches. In such cases, the algorithm appears to forcibly learn mislabeled data as correct, which subsequently impacts validation performance. As the frequency of these 100% accuracy batches increases, the validation accuracy stabilizes; (3) The proportion of misclassified data with similarity >0.8 consistently remains lower than the prediction accuracy for misclassified data because the validation process does not apply the 0.8 threshold - some predictions with similarity below 0.8 are still counted as correct; (4) When applying the 0.8 threshold, the prediction accuracy for misclassified data remains relatively high throughout training, peaking during initial stages. This suggests the algorithm’s initial lower degree of fitting to mislabeled data.
In summary, after randomly selecting 2710 images and reassigning them to incorrect categories in the training set, our algorithm demonstrates the capability to correctly reclassify a significant proportion of these mislabeled samples after training completion.
4.5. Discussion and Relevance
4.5.1. Classification Performance of the Two Models on Three Dataset
In this study, we constructed three distinct datasets (Data1, Data2, and Data3) and trained both ResNet50+ArcFace and ResNet50 models on each dataset. As shown in Table 3, the ResNet50+ArcFace model consistently achieved higher Top-1 accuracy than the standard ResNet50 across all test datasets, with performance improvements of 0.6%, 1.5%, and 1.6% respectively. These results demonstrate the superior performance of the ResNet50+ArcFace algorithm on all three datasets. We attribute this enhancement primarily to the more effective ArcFace loss function.
4.5.2. Prediction Methods of the Two Models
The primary distinction between ResNet50+ArcFace and ResNet50 lies in their prediction mechanisms. The ResNet50+ArcFace model extracts dragonfly images as 512-dimensional feature vectors and computes their similarity scores by multiplying them with the species-specific feature vectors learned during training. The class with the highest similarity score is assigned as the predicted category if the score exceeds a predefined threshold. In contrast, ResNet50 employs a Softmax function to convert network outputs into a probability distribution across classes, where the category with the highest probability is selected as the prediction. However, this approach only predicts the class label without providing a measure of prediction confidence.
Compared to ResNet50, our method not only predicts the class label but also quantifies the similarity between the input and predicted class. While ResNet50 could be modified to output class probabilities or confidence scores, these values merely indicate the likelihood of belonging to a particular class. In contrast, similarity scores offer a more intuitive representation of how closely the input resembles the predicted class. Additionally, similarity metrics enable the reclassification of mislabeled data based on their feature vector alignments.
4.5.3. Model Improvements
Our ResNet50+ArcFace model adapts face recognition algorithms to dragonfly species classification. Both the backbone (ResNet50) and loss function (ArcFace) are well-established and implemented in the open-source InsightFace library. As our study primarily focuses on benchmarking against computer vision classification algorithms, we intentionally retained these standard components without exploring alternative architectures. While we hypothesize that employing more advanced backbones or loss functions might further improve accuracy, such investigations fall outside the scope of the current work.
5. Conclusions
In this study, we adapted face recognition algorithms for dragonfly species classification. First, we trained a dragonfly object detection model to preprocess our dataset by: (1) removing images without dragonflies or with blurred specimens; (2) eliminating excessive background pixels; (3) detecting and cropping multiple dragonflies from individual images. The preprocessed data was then used to train a ResNet50 model with ArcFace loss for 512-dimensional feature extraction. During training, species feature vectors were simultaneously learned. The similarity scores between extracted features and species vectors were computed through dot product operations, which were subsequently used for species classification. This approach achieved higher Top-1 accuracy compared to conventional ResNet50 classification on our dataset, with faster training convergence. Furthermore, ablation studies demonstrated that our similarity-based method could effectively correct labeling errors. Our results confirm that the ResNet50+ArcFace framework outperforms standard ResNet50 classification for dragonfly species identification.
References
- Kalkman, V.J.; Clausnitzer, V.; Dijkstra, K.D.B.; et al. Global diversity of dragonflies (Odonata) in freshwater. Hydrobiologia 2008, 595, 351–363. [Google Scholar] [CrossRef]
- Bybee, S.M.; Kalkman, V.J.; Erickson, R.J.; Frandsen, P.B.; Breinholt, J.W.; Suvorov, A.; Dijkstra, K.D.B.; Cordero-Rivera, A.; Skevington, J.H.; Abbott, J.C.; et al. Phylogeny and classification of Odonata using targeted genomics. Molecular Phylogenetics and Evolution 2021, 160, 107115. [Google Scholar] [CrossRef] [PubMed]
- Schneider, S.; Taylor, G.W.; Kremer, S. Deep Learning Object Detection Methods for Ecological Camera Trap Data. In Proceedings of the 2018 15th Conference on Computer and Robot Vision (CRV); 2018; pp. 321–328. [Google Scholar] [CrossRef]
- Wäldchen, J.; Mäder, P. Machine learning for image based species identification. Methods in Ecology and Evolution 2018, 9, 2216–2225. [Google Scholar] [CrossRef]
- Krizhevsky, A.; Sutskever, I.; Hinton, G.E. ImageNet classification with deep convolutional neural networks. Commun. ACM 2017, 60, 84–90. [Google Scholar] [CrossRef]
- He, K.; Zhang, X.; Ren, S.; Sun, J. Deep Residual Learning for Image Recognition. In Proceedings of the 2016 IEEE Conference on Computer Vision and Pattern Recognition (CVPR); 2016; pp. 770–778. [Google Scholar] [CrossRef]
- Huang, G.; Liu, Z.; Van Der Maaten, L.; Weinberger, K.Q. Densely Connected Convolutional Networks. In Proceedings of the 2017 IEEE Conference on Computer Vision and Pattern Recognition (CVPR); 2017; pp. 2261–2269. [Google Scholar] [CrossRef]
- Tan, M.; Le, Q. EfficientNet: Rethinking Model Scaling for Convolutional Neural Networks. In Proceedings of the Proceedings of the 36th International Conference on Machine Learning; Chaudhuri, K.; Salakhutdinov, R., Eds., 09–15 Jun 2019, Vol. 97, Proceedings of Machine Learning Research, pp. 6105–6114.
- Dosovitskiy, A.; Beyer, L.; Kolesnikov, A.; Weissenborn, D.; Zhai, X.; Unterthiner, T.; Dehghani, M.; Minderer, M.; Heigold, G.; Gelly, S.; et al. An Image is Worth 16x16 Words: Transformers for Image Recognition at Scale. In Proceedings of the International Conference on Learning Representations; 2021. [Google Scholar]
- Liu, Z.; Lin, Y.; Cao, Y.; Hu, H.; Wei, Y.; Zhang, Z.; Lin, S.; Guo, B. Swin Transformer: Hierarchical Vision Transformer using Shifted Windows. In Proceedings of the 2021 IEEE/CVF International Conference on Computer Vision (ICCV); 2021; pp. 9992–10002. [Google Scholar] [CrossRef]
- Yuan, L.; Chen, Y.; Wang, T.; Yu, W.; Shi, Y.; Jiang, Z.; Tay, F.E.H.; Feng, J.; Yan, S. Tokens-to-Token ViT: Training Vision Transformers from Scratch on ImageNet. In Proceedings of the 2021 IEEE/CVF International Conference on Computer Vision (ICCV); 2021; pp. 538–547. [Google Scholar] [CrossRef]
- Zhou, C.L.; Ge, L.M.; Guo, Y.B.; Zhou, D.M.; Cun, Y.P. A comprehensive comparison on current deep learning approaches for plant image classification. Journal of Physics: Conference Series 2021, 1873, 012002. [Google Scholar] [CrossRef]
- Lin, C.; Huang, X.; Wang, J.; Xi, T.; Ji, L. Learning niche features to improve image-based species identification. Ecological Informatics 2021, 61, 101217. [Google Scholar] [CrossRef]
- Sourav, M.S.U.; Wang, H. Intelligent Identification of Jute Pests Based on Transfer Learning and Deep Convolutional Neural Networks. Neural Processing Letters 2023, 55, 2193–2210. [Google Scholar] [CrossRef] [PubMed]
- Qi, F.; Wang, Y.; Tang, Z. Lightweight Plant Disease Classification Combining GrabCut Algorithm, New Coordinate Attention, and Channel Pruning. Neural Processing Letters 2022, 54, 5317–5331. [Google Scholar] [CrossRef]
- Joshi, D.; Mishra, V.; Srivastav, H.; et al. Progressive Transfer Learning Approach for Identifying the Leaf Type by Optimizing Network Parameters. Neural Processing Letters 2021, 53, 3653–3676. [Google Scholar] [CrossRef]
- Theivaprakasham, H.; Darshana, S.; Ravi, V.; Sowmya, V.; Gopalakrishnan, E.; Soman, K. Odonata identification using Customized Convolutional Neural Networks. Expert Systems with Applications 2022, 206, 117688. [Google Scholar] [CrossRef]
- Sun, J.; Futahashi, R.; Yamanaka, T. Improving the Accuracy of Species Identification by Combining Deep Learning With Field Occurrence Records. In Proceedings of the Frontiers in Ecology and Evolution; 2021. [Google Scholar]
- Frank, L.; Wiegman, C.; Davis, J.; Shearer, S. Confidence-Driven Hierarchical Classification of Cultivated Plant Stresses. In Proceedings of the 2021 IEEE Winter Conference on Applications of Computer Vision (WACV); 2021; pp. 2502–2511. [Google Scholar] [CrossRef]
- Bickford, D.; Lohman, D.J.; Sodhi, N.S.; Ng, P.K.; Meier, R.; Winker, K.; Ingram, K.K.; Das, I. Cryptic species as a window on diversity and conservation. Trends in Ecology & Evolution 2007, 22, 148–155. [Google Scholar] [CrossRef]
- Paulson, D. Dragonflies and Damselflies of the East; Princeton Field Guides, Princeton University Press: Princeton, NJ, 2011. [Google Scholar]
- Dijkstra, K.; Schröter, A.; Lewington, R. Field Guide to the Dragonflies of Britain and Europe: 2nd edition; Bloomsbury Wildlife Guides, Bloomsbury Publishing: London, 2020. [Google Scholar]
- Barlow, A.; Golden, D.; Bangma, J.; of Fish, N.J.D. ; Wildlife. Field Guide to Dragonflies and Damselflies of New Jersey; New Jersey Department of Environmental Protection, Division of Fish and Wildlife: Trenton, NJ, 2009. [Google Scholar]
- Corbet, P. Dragonflies: Behavior and Ecology of Odonata; A Comstock Book Series; Comstock Pub. Associates: Ithaca, NY, 1999. [Google Scholar]
- Wang, A.; Chen, H.; Liu, L.; CHEN, K.; Lin, Z.; Han, J.; Ding, G. YOLOv10: Real-Time End-to-End Object Detection. In Proceedings of the The Thirty-eighth Annual Conference on Neural Information Processing Systems; 2024. [Google Scholar]
- Simonyan, K.; Zisserman, A. Very Deep Convolutional Networks for Large-Scale Image Recognition. In Proceedings of the 3rd International Conference on Learning Representations, ICLR 2015, San Diego, CA, USA, May 7-9, 2015, Conference Track Proceedings; Bengio, Y.; LeCun, Y., Eds., 2015.
- Wen, Y.; Zhang, K.; Li, Z.; Qiao, Y. A Discriminative Feature Learning Approach for Deep Face Recognition. In Proceedings of the Computer Vision – ECCV 2016; Leibe, B.; Matas, J.; Sebe, N.; Welling, M., Eds., Cham, 2016; pp. 499–515.
- Wang, H.; Wang, Y.; Zhou, Z.; Ji, X.; Gong, D.; Zhou, J.; Li, Z.; Liu, W. CosFace: Large Margin Cosine Loss for Deep Face Recognition. In Proceedings of the 2018 IEEE/CVF Conference on Computer Vision and Pattern Recognition; 2018; pp. 5265–5274. [Google Scholar] [CrossRef]
- Liu, W.; Wen, Y.; Yu, Z.; Li, M.; Raj, B.; Song, L. SphereFace: Deep Hypersphere Embedding for Face Recognition. In Proceedings of the 2017 IEEE Conference on Computer Vision and Pattern Recognition (CVPR); 2017; pp. 6738–6746. [Google Scholar] [CrossRef]
- Deng, J.; Guo, J.; Yang, J.; Xue, N.; Kotsia, I.; Zafeiriou, S. ArcFace: Additive Angular Margin Loss for Deep Face Recognition. IEEE Transactions on Pattern Analysis and Machine Intelligence 2022, 44, 5962–5979. [Google Scholar] [CrossRef] [PubMed]
- Xu, J.; Liu, X.; Zhang, X.; Si, Y.W.; Li, X.; Shi, Z.; Wang, K.; Gong, X. X2-Softmax: Margin adaptive loss function for face recognition. Expert Syst. Appl. 2024, 249. [Google Scholar] [CrossRef]
- Wen, Y.; Zhang, K.; Li, Z.; Qiao, Y. A Discriminative Feature Learning Approach for Deep Face Recognition. In Proceedings of the Computer Vision – ECCV 2016; Leibe, B.; Matas, J.; Sebe, N.; Welling, M., Eds., Cham, 2016; pp. 499–515. [CrossRef]
- Liu, W.; Wen, Y.; Yu, Z.; Li, M.; Raj, B.; Song, L. SphereFace: Deep Hypersphere Embedding for Face Recognition. In Proceedings of the 2017 IEEE Conference on Computer Vision and Pattern Recognition (CVPR); 2017; pp. 6738–6746. [Google Scholar] [CrossRef]
- Bazarevsky, V.; Kartynnik, Y.; Vakunov, A.; Raveendran, K.; Grundmann, M. BlazeFace: Sub-millisecond Neural Face Detection on Mobile GPUs 2019. [1907.05047].
- Deng, J.; Guo, J.; Ververas, E.; Kotsia, I.; Zafeiriou, S. RetinaFace: Single-Shot Multi-Level Face Localisation in the Wild. In Proceedings of the 2020 IEEE/CVF Conference on Computer Vision and Pattern Recognition (CVPR); 2020; pp. 5202–5211. [Google Scholar] [CrossRef]
- Guo, J.; Deng, J.; Lattas, A.; Zafeiriou, S. Sample and Computation Redistribution for Efficient Face Detection. In Proceedings of the International Conference on Learning Representations; 2022. [Google Scholar]
Figure 1.
Different Species of Dragonflies
| Lamelligomphus formosanus |
|||
| Lamelligomphus ringens |
|||
| Mnais mneme |
|||
| Mnais tenuis |
|||
| Copera annulata |
|||
| Copera ciliata |
|||
| Copera marginipes |
| Lamelligomphus |
| formosanus |
| Lamelligomphus |
| ringens |
| Mnais |
| mneme |
| Mnais |
| tenuis |
| Copera |
| annulata |
| Copera |
| ciliata |
| Copera |
| marginipes |
Figure 2.
Cropping of dragonfly images.
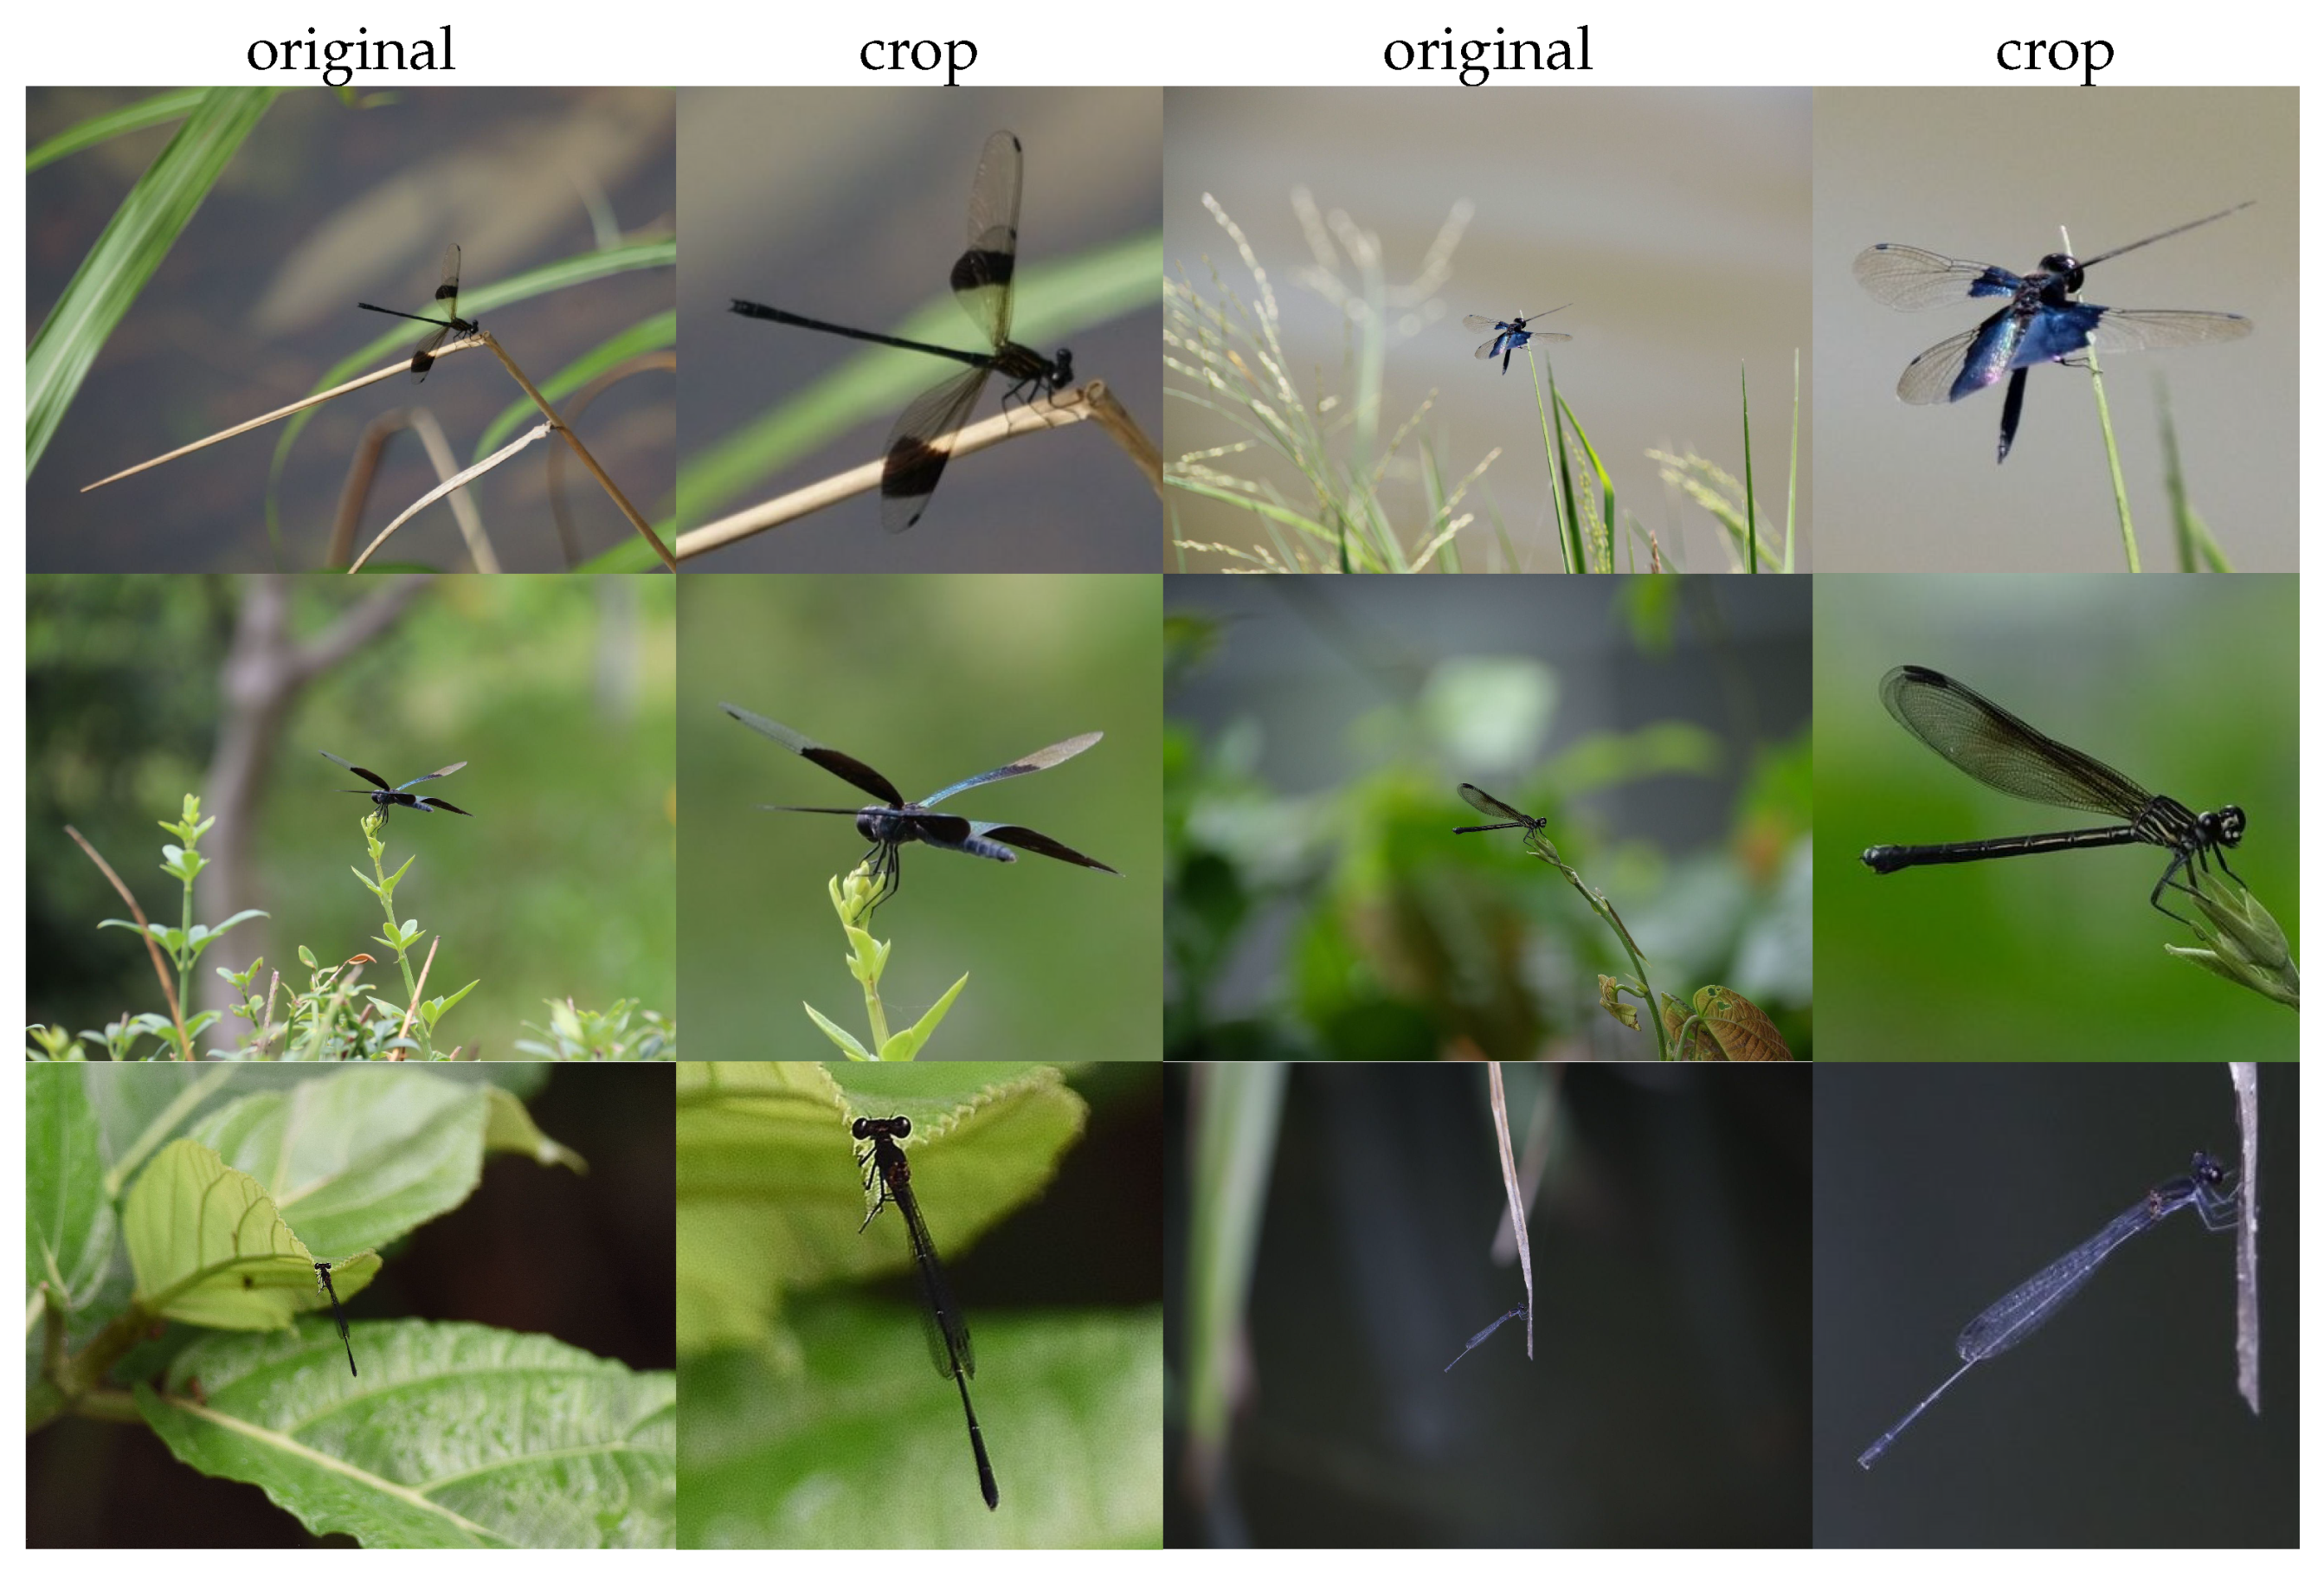
| original | crop | original | crop |
Figure 3.
Training and inference flowchart of applying the ArcFace loss function to dragonfly species recognition.
Figure 3.
Training and inference flowchart of applying the ArcFace loss function to dragonfly species recognition.
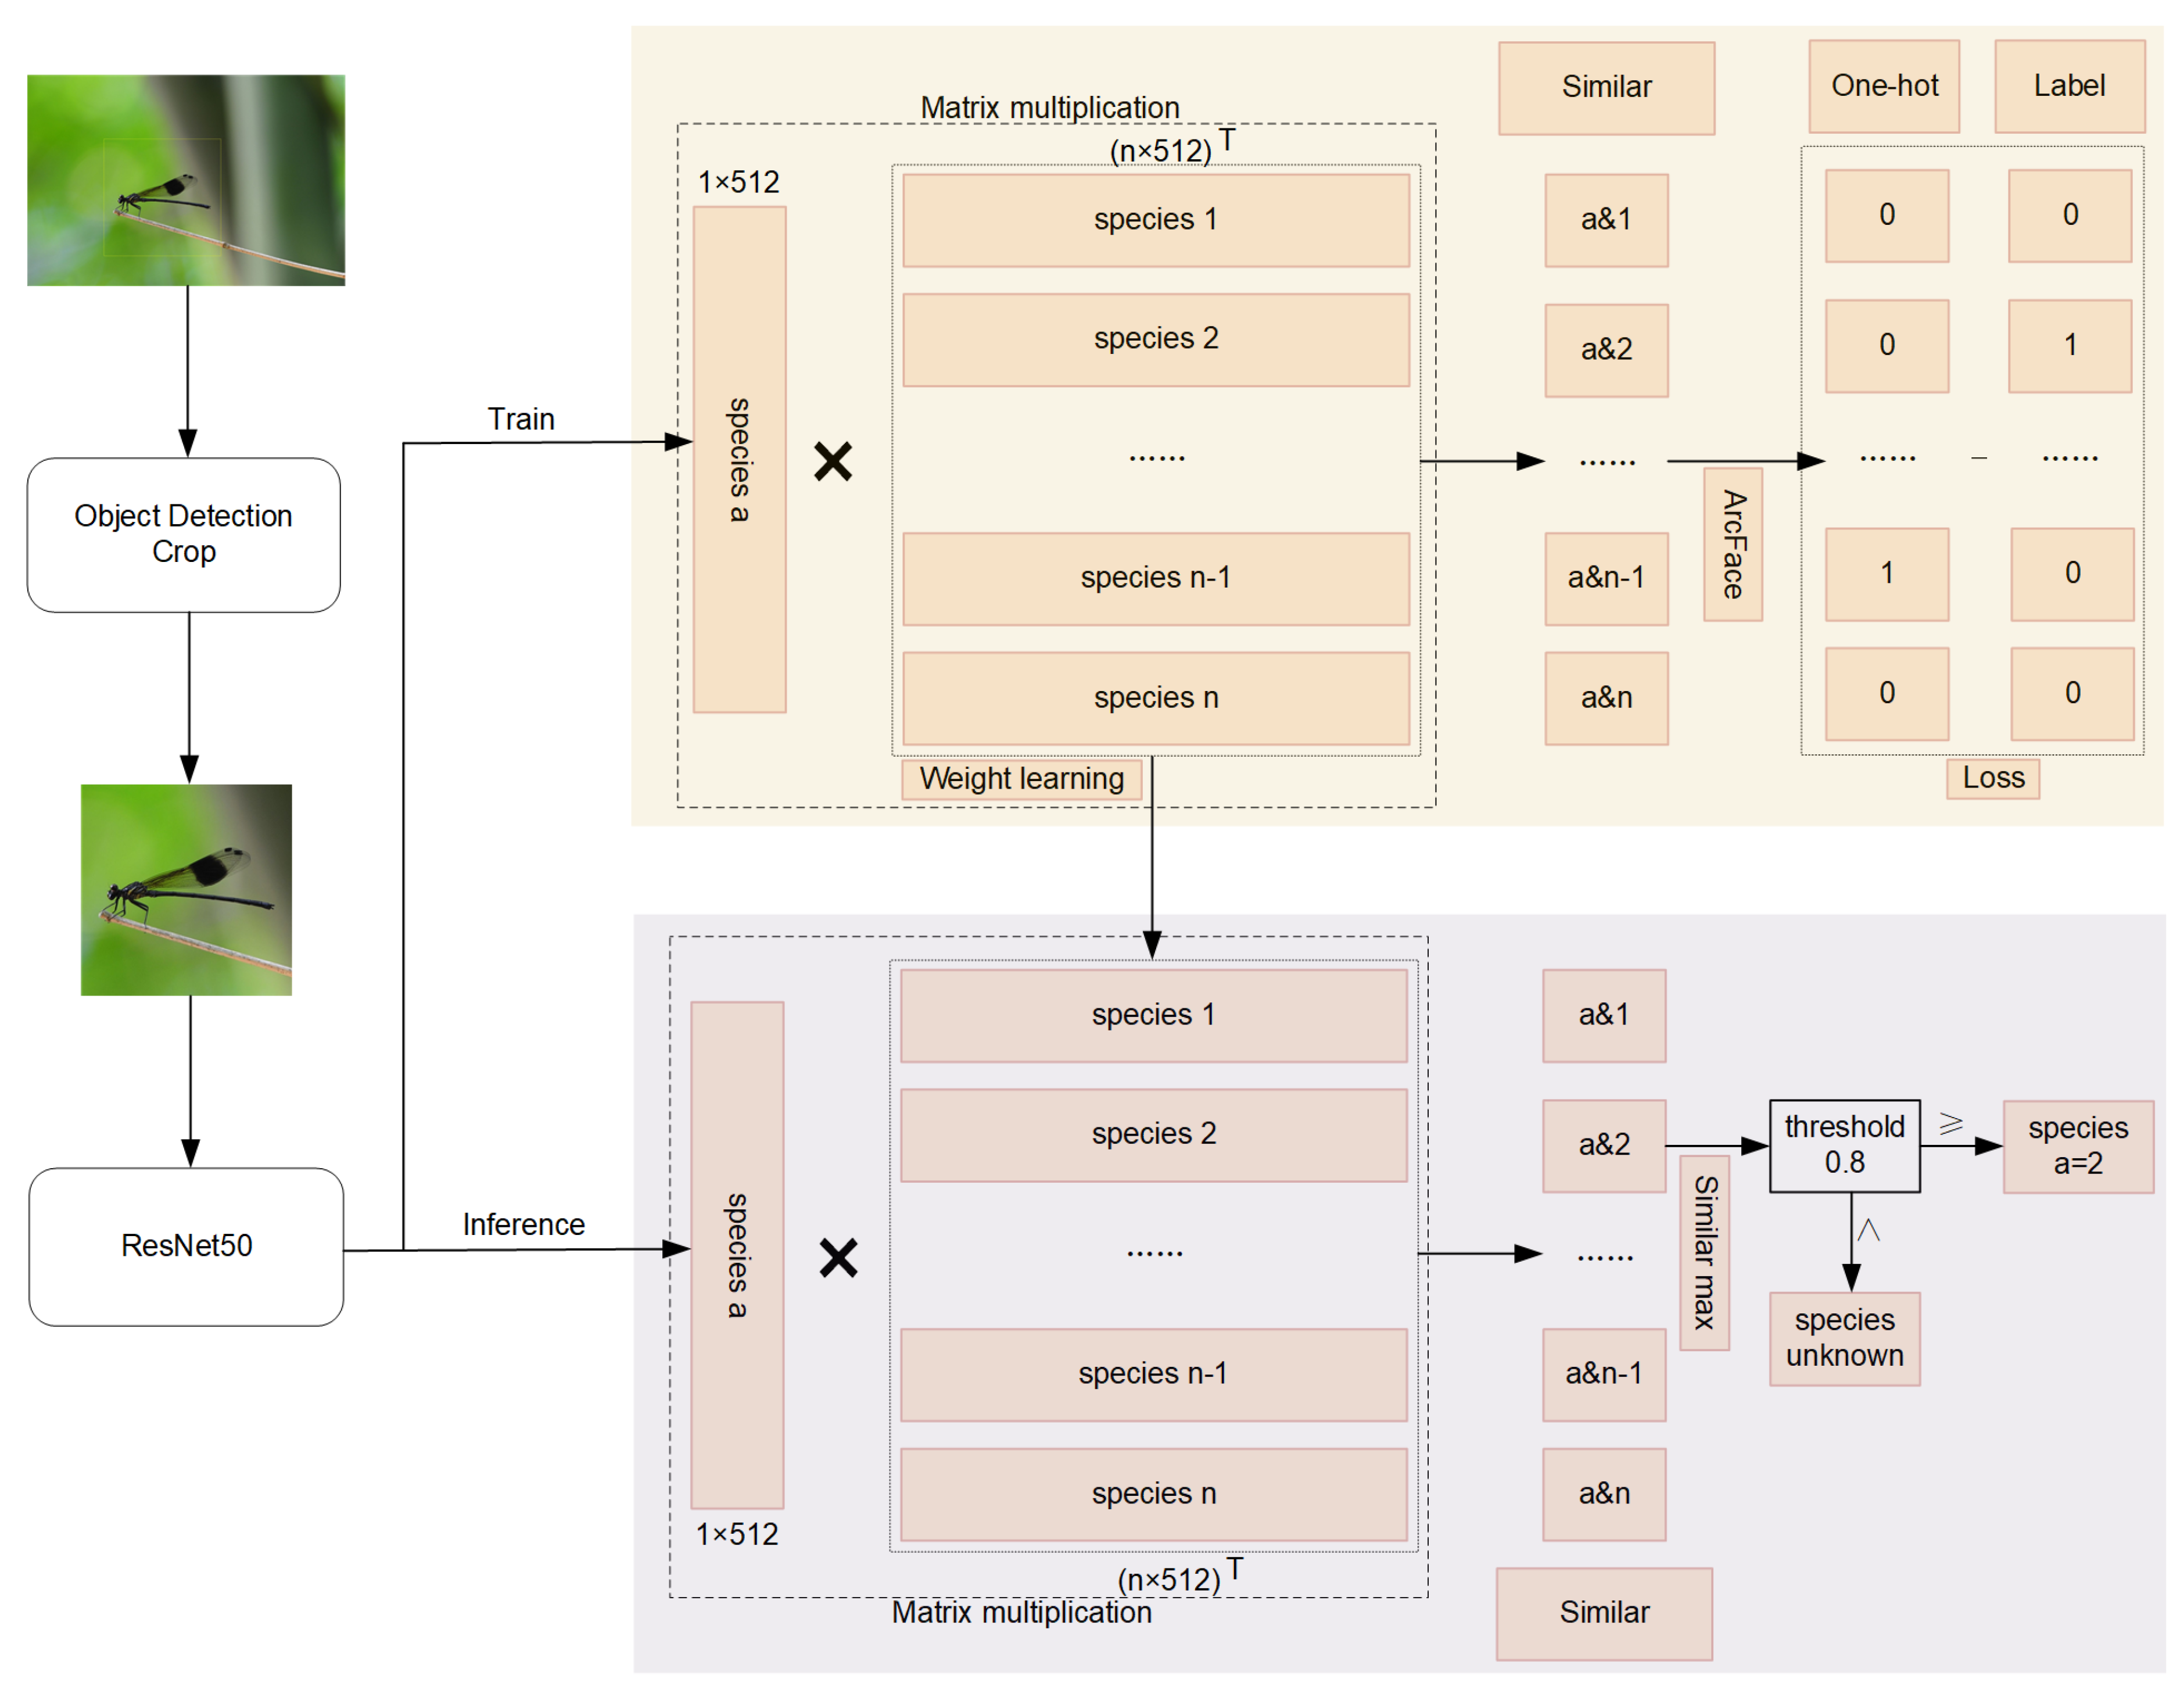
Figure 4.
Distribution graph of the number of species images across three datasets.
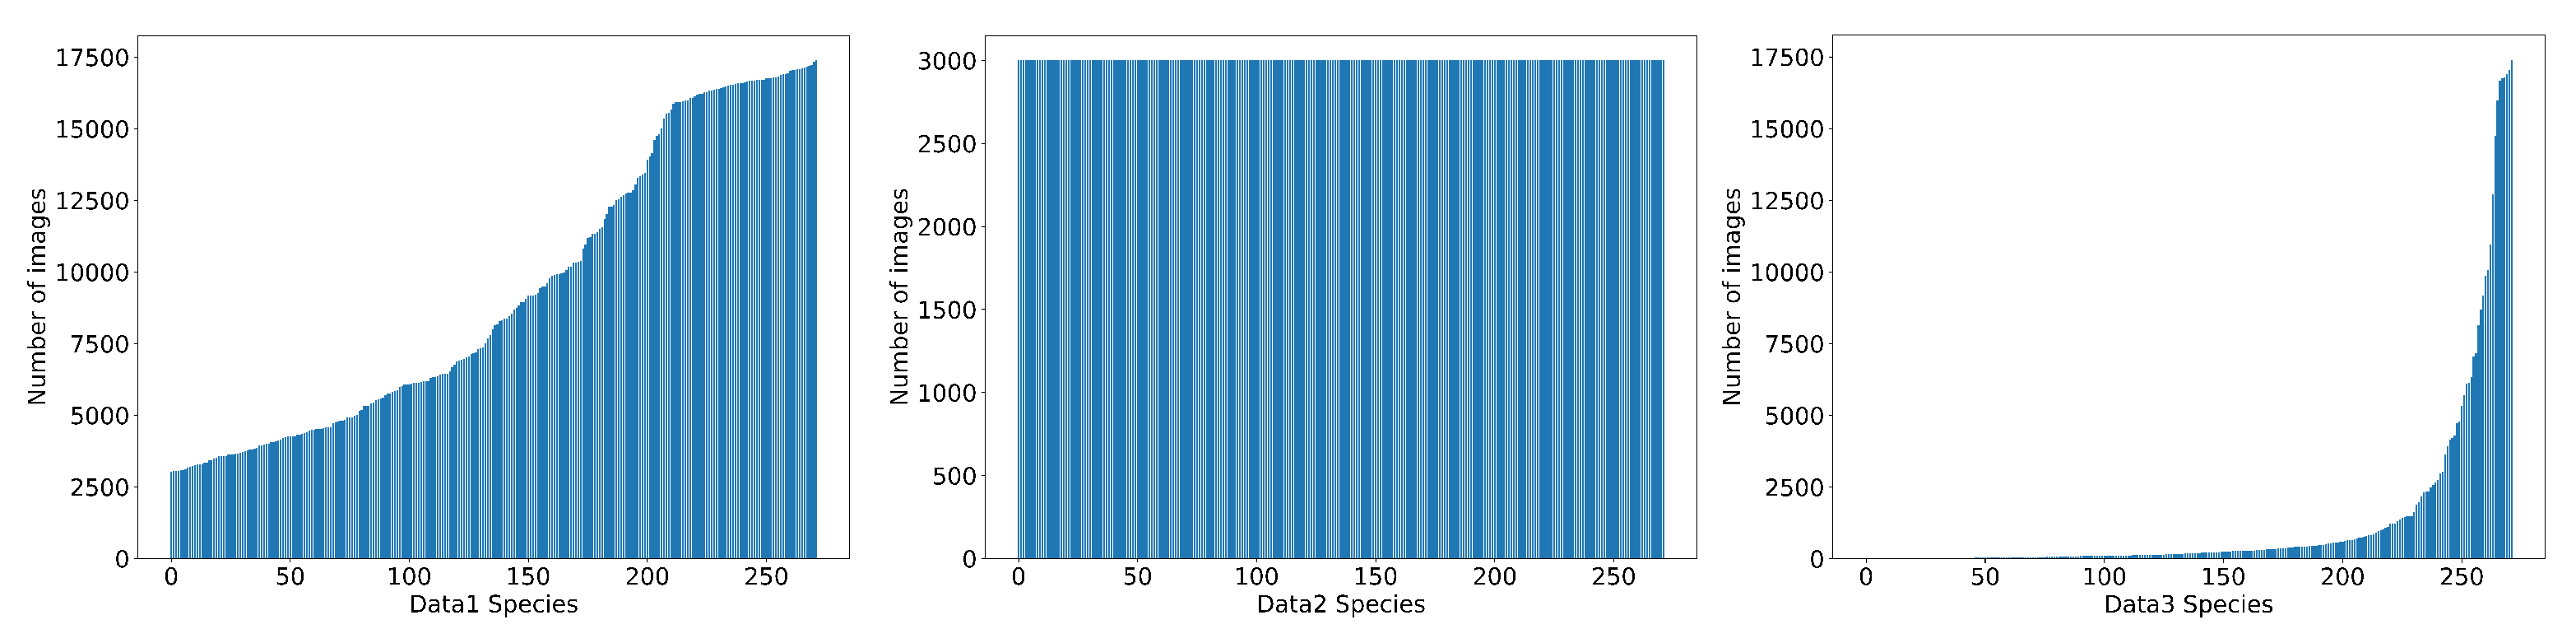
Figure 5.
Comparison graphs of train loss, train accuracy, and validation accuracy when training two algorithms on three datasets.
Figure 5.
Comparison graphs of train loss, train accuracy, and validation accuracy when training two algorithms on three datasets.
| Train loss | Train acc | Val acc |
Figure 6.
Accuracy and the proportion of samples satisfying the threshold condition t at different thresholds.
Figure 6.
Accuracy and the proportion of samples satisfying the threshold condition t at different thresholds.
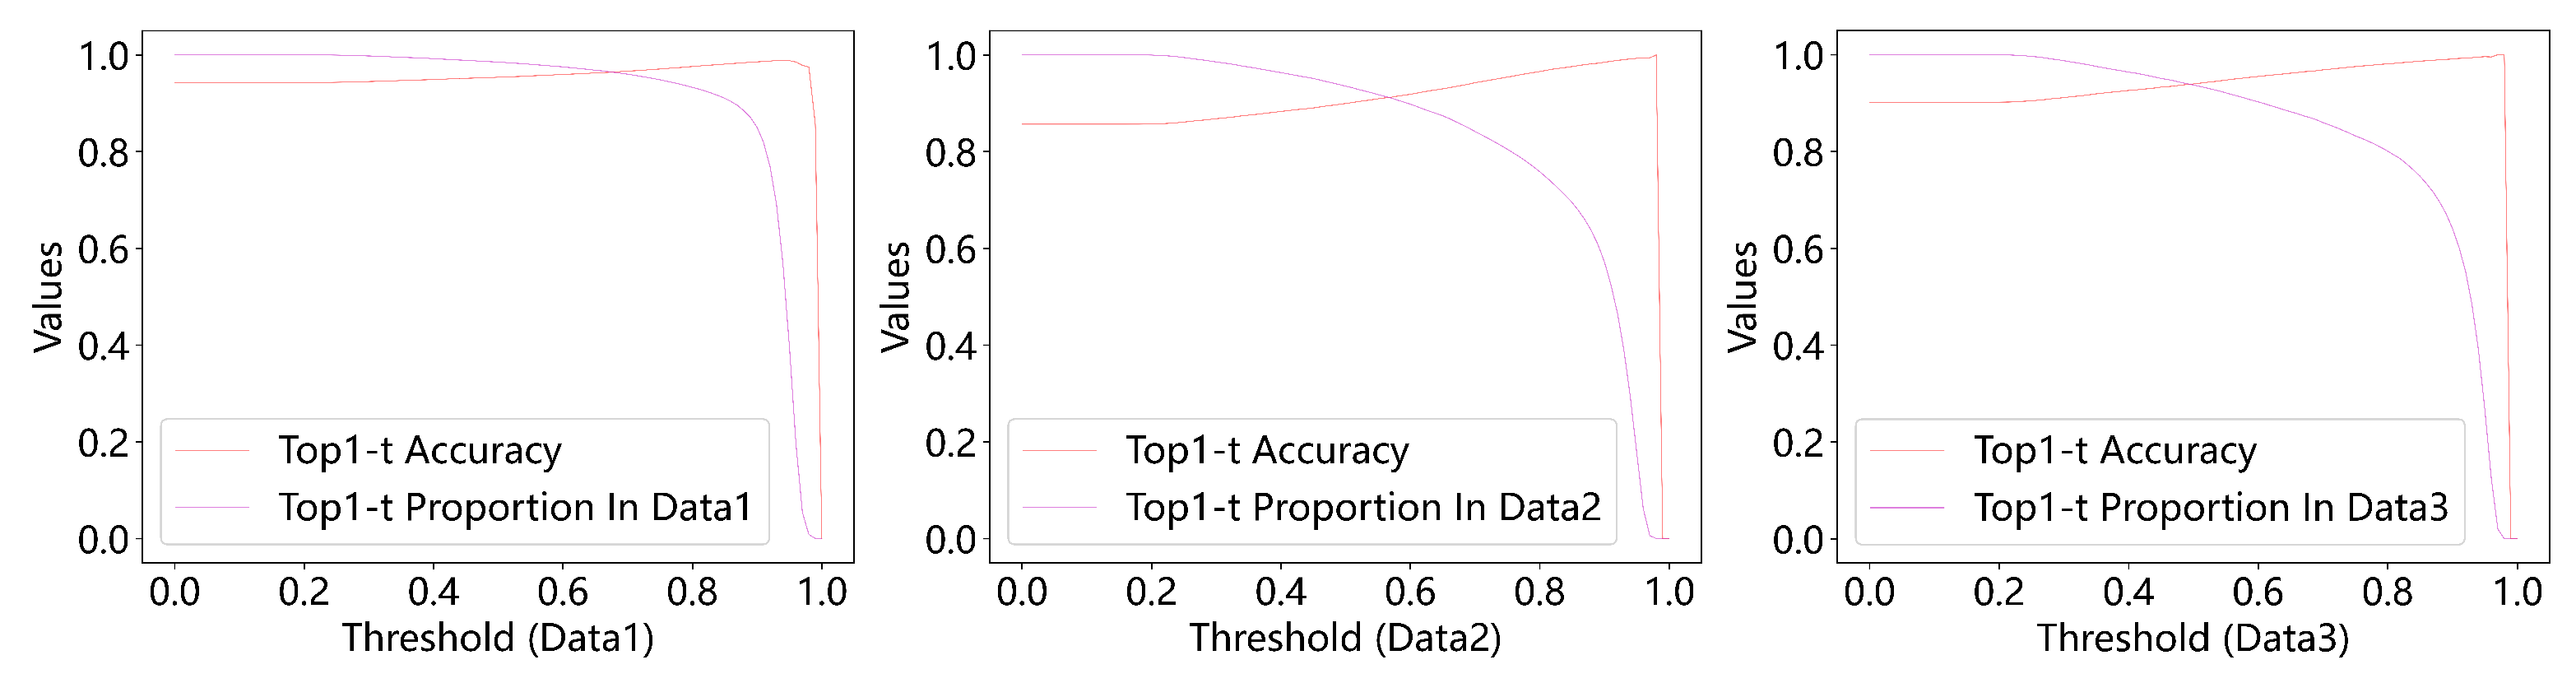
Figure 7.
During model training, the training accuracy, validation accuracy, Mislabeled Data Top1 Accuracy, Mislabeled Data Top1-0.8 Accuracy, and Top1-0.8 Proportion in Mislabeled Data at different global steps.
Figure 7.
During model training, the training accuracy, validation accuracy, Mislabeled Data Top1 Accuracy, Mislabeled Data Top1-0.8 Accuracy, and Top1-0.8 Proportion in Mislabeled Data at different global steps.
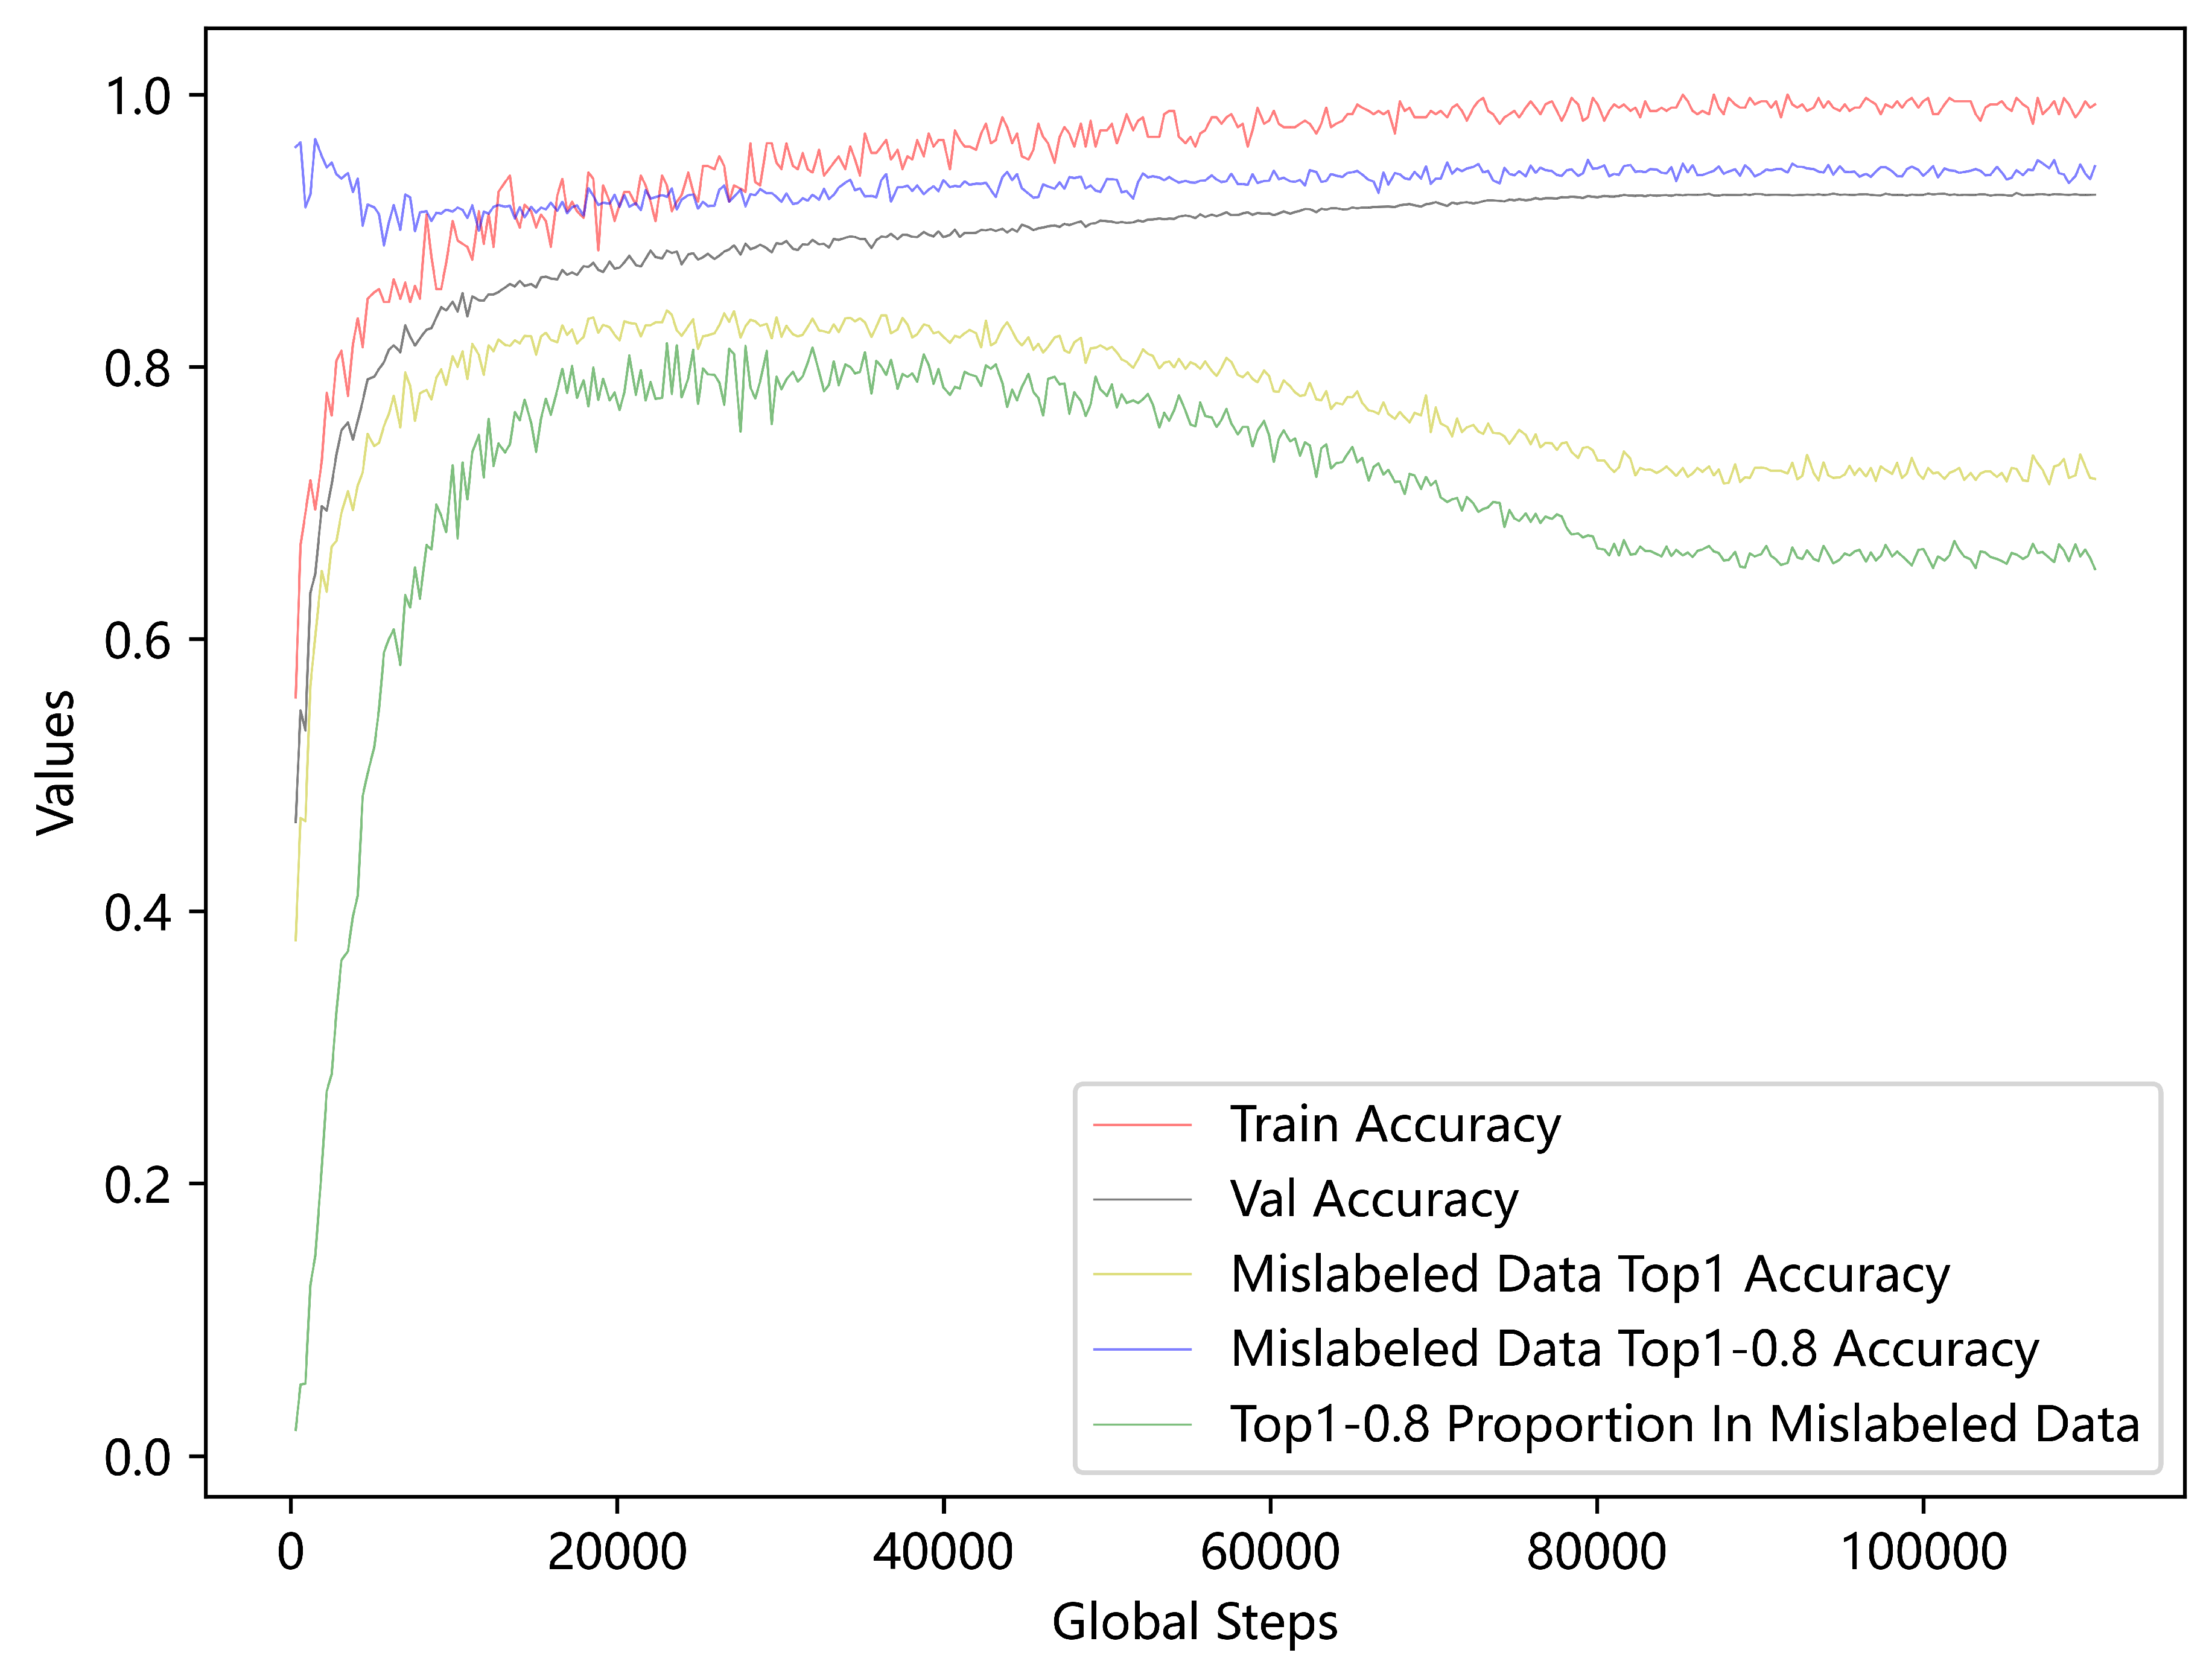

Table 1.
Detection results of YOLOv10 on the dragonfly test set.
| Class | Images | Instances | Box(P) | Box(R) | Box(mAP50) | Box(mAP50-95) |
|---|---|---|---|---|---|---|
| Odonate | 500 | 542 | 0.966 | 0.924 | 0.967 | 0.841 |
Table 2.
Compare with two methods on different test data.
| Data | Model | Top1 | Top5 | Top1-0.7 | Top1-0.8 | Top1-0.9 | Top1-0.95 |
|---|---|---|---|---|---|---|---|
| Data1 | ResNet50 | 0.937 | 0.986 | - | - | - | - |
| ResNet50+ArcFace | 0.943 | 0.978 | 0.967 | 0.976 | 0.986 | 0.988 | |
| Data2 | ResNet50 | 0.842 | 0.958 | - | - | - | - |
| ResNet50+ArcFace | 0.857 | 0.936 | 0.943 | 0.966 | 0.985 | 0.993 | |
| Data3 | ResNet50 | 0.886 | 0.969 | - | - | - | - |
| ResNet50+ArcFace | 0.902 | 0.960 | 0.969 | 0.981 | 0.991 | 0.996 |
Table 3.
The proportion of samples in which the model-predicted class with the highest similarity is not less than the threshold, across three test datasets.
Table 3.
The proportion of samples in which the model-predicted class with the highest similarity is not less than the threshold, across three test datasets.
| Data | Model | 0.7 | 0.80 | 0.85 | 0.90 | 0.95 |
|---|---|---|---|---|---|---|
| Data1 | ResNet50+ArcFace | 0.960 | 0.933 | 0.910 | 0.850 | 0.395 |
| Data2 | ResNet50+ArcFace | 0.842 | 0.759 | 0.695 | 0.572 | 0.176 |
| Data3 | ResNet50+ArcFace | 0.60 | 0.801 | 0.749 | 0.641 | 0.265 |
Disclaimer/Publisher’s Note: The statements, opinions and data contained in all publications are solely those of the individual author(s) and contributor(s) and not of MDPI and/or the editor(s). MDPI and/or the editor(s) disclaim responsibility for any injury to people or property resulting from any ideas, methods, instructions or products referred to in the content. |
© 2025 by the authors. Licensee MDPI, Basel, Switzerland. This article is an open access article distributed under the terms and conditions of the Creative Commons Attribution (CC BY) license (http://creativecommons.org/licenses/by/4.0/).
Copyright: This open access article is published under a Creative Commons CC BY 4.0 license, which permit the free download, distribution, and reuse, provided that the author and preprint are cited in any reuse.


