
Submitted:
31 May 2025
Posted:
02 June 2025
You are already at the latest version
Abstract
Objectives: Acute kidney injury (AKI) is a frequent complication in critically ill patients in the respiratory intensive care unit (RICU), significantly impacting prognosis. Early recognition of prerenal and early-stage AKI is vital for improving outcomes. This study aimed to evaluate the prognostic significance of AKI according to the KDIGO classification and assess the diagnostic utility of the Integrated Osmotic Response Index (IORI) in identifying early-stage and prerenal AKI. Methods: A retrospective cohort of 437 adult patients admitted to the RICU with respiratory failure was analyzed. Demographics, laboratory parameters, and clinical outcomes were recorded. AKI was defined and staged per KDIGO 2012 criteria. Prerenal AKI was identified using the BUN/creatinine ratio. IORI values were calculated and analyzed in relation to AKI stages and outcomes. ROC curves and DeLong tests were employed to compare IORI with serum creatinine. Results: AKI developed in 103 patients (23.6%): 91 had stage 1, 9 stage 2, and 3 stage 3 AKI. IORI values were significantly lower in patients with AKI, particularly in early stages (p < 0.001). Prerenal AKI patients had lower IORI than non-prerenal AKI (p = 0.007). The optimal IORI cut-off for AKI was 40.34 (sensitivity 62.1%, specificity 70.1%); for prerenal AKI, it was 43.30. No significant survival difference was found between patients without AKI and those with stage 1 AKI, but ad-vanced-stage AKI was associated with reduced survival. Conclusion: IORI appears to be a prom-ising marker for detecting early-stage and prerenal AKI in respiratory failure. Further prospective studies are needed to validate its diagnostic and prognostic value.
Keywords:
KeywordsAcute kidney injury
; Respiratory intensive care
; Prerenal AKI
; KDIGO
; Integrated osmotic response index
1. Introduction
Serum osmolality is a critical parameter of hemostasis in all individuals, including those admitted to intensive care units (ICUs). In critically ill patients requiring intensive care monitoring, maintaining serum osmolality within a narrow and optimal range is essential. A study conducted in ICU patients demonstrated that values below 285 mmol/L and above 300 mmol/L were associated with the development of acute kidney injury (AKI) in this population [1]. Similarly, a more recent study identified elevated serum osmolality as a risk factor for the development of chronic kidney disease (CKD) in otherwise healthy individuals [2]. Another investigation utilizing the Medical Information Mart for Intensive Care IV (MIMIC-IV) database examined patients with acute myocardial infarction and found that elevated serum osmolality was associated with impaired renal function. In that study, a serum osmolality threshold of 293.27 mmol/L was defined as the cutoff for high serum osmolality [3]. Collectively, these contemporary studies involving large sample sizes suggest that serum osmolality is closely linked to both acute and chronic kidney dysfunction in healthy individuals and critically ill patients alike. However, in a specific cohort of patients with respiratory failure, serum osmolality was assessed for its prognostic value in predicting mortality but was found to be an ineffective predictor [4].
In the medical literature, urine specific gravity (USG) is often used as an indicator of hydration status. Notably, in healthy athletes, USG has been shown to be a more reliable marker of dehydration than serum sodium levels [5]. In a study with a similar perspective, USG was evaluated for its ability to distinguish prerenal from intrarenal acute kidney injury. A USG above 1.020 demonstrated a specificity of 88.8% for predicting prerenal AKI, although its sensitivity was limited. Conversely, USG values below 1.012 showed a sensitivity of 69.5% in identifying intrarenal AKI [6].
AKI is a frequently encountered clinical condition in the ICU. It may present as a primary cause of admission or develop during the ICU stay due to various factors, most notably sepsis. A study from India reported an ICU AKI incidence of 16.1%, with sepsis present in 75.7% of the patients diagnosed with AKI [7]. Similarly, a multicenter study involving 84,528 patients found the incidence of sepsis associated-AKI (SA-AKI) to be 18%, and multivariate analysis identified SA-AKI as an independent risk factor for increased in-hospital mortality [8]. In studies examining the relationship between serum osmolality and AKI, patients admitted to the ICU for sepsis, cardiac, and cerebral conditions have been included [1]. In a subgroup of cardiac patients, a detailed cardiometabolic profile analysis in individuals with type 2 respiratory failure due to COPD demonstrated that heart failure was associated with impaired renal function [9].
In this study, we aimed to comprehensively analyze serum osmolality and urine specific gravity in a cohort of patients admitted to the intensive care unit due to respiratory conditions. We planned to assess the association between these two parameters and the development of acute kidney injury (AKI) based on the KDIGO classification [10], which is widely accepted and internationally recognized. Additionally, we sought to investigate the relationship of these biomarkers with the presence of sepsis and comorbidities such as heart failure. Furthermore, we aimed to evaluate whether a newly proposed parameter, the Integrated Osmotic Response Index (IORI), which combines serum osmolality and urine specific gravity into a single formulation, could serve as a meaningful biomarker for predicting AKI. We also aimed to explore whether this index could be used in identifying the underlying etiology of AKI once it has developed. Ultimately, we intended to test the interpretability of these two physiological parameters through a unified formulation and assess their potential for clinical applicability.
2. Materials and Methods
This study was designed in accordance with the ethical principles outlined in the Declaration of Helsinki. Prior to initiation, ethical approval was obtained from the Scientific Research Ethics Committee of the University of Health Sciences, Ankara Atatürk Training and Research Hospital (approval date: 26.03.2025, decision number: 2024-BÇEK/258).
Additionally, for retrospective studies, a written informed consent form regarding the use of anonymized clinical data was obtained in advance from all patients and/or their legal guardians admitted to the intensive care units. Patients who declined to sign the informed consent form were excluded from the study.
Between January 1, 2023, and December 31, 2024, a retrospective review was conducted in the second-level respiratory intensive care unit of Ankara Atatürk Sanatorium Training and Research Hospital. Patients admitted with respiratory failure and meeting the inclusion criteria were enrolled in the study.
Inclusion criteria:
- Age ≥ 18 years,
- Diagnosed with type 1 or type 2 respiratory failure,
- Provided signed informed consent for data usage.
Exclusion criteria:
- Patients who died or were discharged from the ICU within the first 24 hours,
- Patients with a known diagnosis of chronic kidney disease (CKD), as CKD may influence urine specific gravity and confound the analysis.
During the study period, medical records of 521 patients who met the initial time-based eligibility criteria were screened. Among them, 52 patients were excluded due to missing or declined informed consent or refusal to allow the use of anonymized clinical data. In addition, 32 patients were excluded due to a known diagnosis of CKD. Consequently, a total of 437 patients with respiratory failure were included in the final analysis (Figure 1).
A total of 24 parameters, including 16 numerical and 8 categorical variables, were recorded from the medical records of the patients included in the study for statistical analysis. Some of these variables consisted of calculated formulas and derived ratios. To evaluate patient demographics and baseline status, sex, age, and comorbidity burden were recorded using the Charlson Comorbidity Index (CCI). Disease severity was assessed using the APACHE II score, and infectious or septic status was evaluated through C-reactive protein (CRP) levels and the Sequential Organ Failure Assessment (SOFA) score.
Serum sodium, potassium, blood urea nitrogen (BUN), creatinine, albumin, and glucose levels were documented. Serum osmolality was then calculated using the following formula:
Serum osmolality = 2 × [Na⁺] + glucose / 18 + BUN / 2.8
Urine specific gravity values were obtained from complete urinalysis results.
In addition to the above, the following parameters were also recorded: Glasgow Coma Scale (GCS) scores, presence of chronic pulmonary disease, presence of congestive heart failure (CHF), and the degree of acute kidney injury (AKI) according to the KDIGO 2012 classification. Given its potential to reflect prerenal AKI, the BUN/creatinine ratio was also calculated. PaO₂/FiO₂ ratios, the presence of hypotension, and the requirement for inotropic support were also noted. Furthermore, ICU length of stay and final clinical outcomes (death, discharge to home, transfer to a higher-level ICU, or transfer to the pulmonary diseases ward) were documented.
Integrated osmotic response index (IORI)
In this section, we introduce a key parameter of our study—Integrated Osmotic Response Index (IORI)—a dynamic formulation that we propose as a novel contribution to the medical literature. We aim to present both the definition of this index and the theoretical rationale behind its development.
The index was calculated using the following formula:
This formulation was designed to provide a quantitative representation of the osmotic balance between urine and plasma and to evaluate whether this balance is associated with the development of acute kidney injury (AKI). The rationale for applying this formula can be summarized under three main headings:
- Physiological Basis:
Urine specific gravity reflects the kidney’s ability to concentrate or dilute urine in response to hydration status and tubular function, while serum osmolality represents systemic fluid and solute balance. The ratio between these two parameters reflects the extent to which the kidneys can maintain osmotic homeostasis.
- 2.
- Use of a Reference Point:
Based on preliminary analyses and physiological assumptions in the literature, it is hypothesized that the ratio of urine specific gravity to serum osmolality approximates 3 under normal physiological conditions. Therefore, subtracting the constant “3” in the formula aims to highlight deviations from this presumed normative value.
- 3.
- Statistical Normalization:
Multiplying the result by 100 was intended to enhance variability and improve the discriminatory power of the index in statistical analyses such as ROC curves and regression models. This approach allows subtle differences to be more readily observed and interpreted.
In this context, the IORI is theoretically expected to reflect alterations in renal osmotic response capacity due to conditions such as hydration disorders, tubular dysfunction, or systemic inflammation.
To support the clinical interpretation of the index, a pathophysiological framework for expected IORI values in certain clinical scenarios is proposed as follows:
- 1.
- High urine specific gravity + Low serum osmolality → High IORI
This scenario is characterized by excessive urine concentration by the kidneys despite low systemic osmolality.
Possible clinical conditions:
- Syndrome of inappropriate antidiuretic hormone secretion (SIADH)
- Inappropriate fluid administration
- Early-stage prerenal AKI (not yet reflected in serum osmolality)
- Low urine specific gravity + High serum osmolality → Low IORI
In this case, despite an increased systemic osmotic load, the kidneys fail to produce adequately concentrated urine.
Possible clinical conditions:
- Intrarenal AKI characterized by tubular damage
- Sepsis-associated renal dysfunction
- Late-stage prerenal AKI
- Chronic kidney disease (excluded from this study)
- Both elevated (↑ urine specific gravity, ↑ serum osmolality) → Moderately low IORI
This pattern is typically expected in hyperosmolar conditions with an appropriate renal response.
Possible clinical conditions:
- Compensated dehydration
- Severe hyperglycemia
- Both decreased (↓ urine specific gravity, ↓ serum osmolality) → Moderately high IORI
This condition may indicate volume overload or dilutional states, with insufficient systemic and renal osmotic response.
Possible clinical conditions:
- Excessive fluid administration
- Dilutional hyponatremia
2.1. Statistical Analysis
SPSS version 27 (IBM Corp., Armonk, NY, USA) and MedCalc version 23.2.1 (MedCalc Software Ltd., Ostend, Belgium) were used for statistical analyses. After collecting the data of the patients included in the study, the SPSS software was employed to determine whether the numerical variables conformed to a normal distribution. Skewness, kurtosis, and their standard deviations, histogram graphs, Kolmogorov–Smirnov and Shapiro–Wilk tests, as well as the evaluation of outlier values, were collectively used to assess normality. For variables that did not follow a normal distribution, the median and interquartile range (IQR) values were reported. For variables conforming to a normal distribution (which were not present in our study), the mean and standard deviation values would be used. Frequencies and percentages were provided for categorical variables.
To compare independent numerical variables that did not follow a normal distribution, the non-parametric Mann–Whitney U test was applied. In cases involving dependent variables with more than two groups, the Kruskal–Wallis H test was used. For correlation analyses, if at least one of the correlated variables did not follow a normal distribution, Spearman’s rank correlation analysis was performed. Based on the results, correlation coefficients along with minimum and maximum values within the 95% confidence interval were reported.
The MedCalc software (MedCalc Software Ltd., Ostend, Belgium) was used for ROC (Receiver Operating Characteristic) analyses. The area under the ROC curve (AUC), along with the 95% confidence interval, was graphically illustrated. Additionally, Youden’s J statistic was used to determine the optimal cut-off values. For each identified cut-off point, sensitivity, specificity, positive predictive value, and negative predictive value were calculated and presented. When necessary, the DeLong test was used to compare the areas under the ROC curves obtained from the analysis.
Kaplan–Meier survival analysis was used to compare survival durations. This analysis was performed using the MedCalc software and verified with SPSS. Log-rank test values were provided to assess statistical significance, along with hazard ratios and their corresponding confidence intervals. A 95% confidence interval and a p-value of <0.05 were considered statistically significant in all analyses conducted.
3. Results
A total of 437 patients who met the study criteria were included in the analysis. Of these, 282 (64.5%) were male and 155 (35.5%) were female. The overall median age of the patients was 71 years (IQR: 62–79). The median Charlson Comorbidity Index (CCI) score was 5, with an interquartile range (IQR) of 2. The cohort consisted of a relatively homogeneous population in terms of comorbidities. During the study period, the vast majority of patients (363, 83.1%) were discharged to home. Additionally, 103 patients (23.6%) were diagnosed with acute kidney injury (AKI) at varying stages according to the KDIGO classification, in addition to their primary diagnosis of respiratory failure at ICU admission (Table 1).
Regarding the clinical status of the patients, the Glasgow Coma Scale (GCS) score was 13 or higher in 88.8% of the patients, indicating preserved neurological function in the majority. Chronic pulmonary disease was present in a large proportion of the cohort (397 patients, 90.8%). Moreover, more than half of the patients (288, 65.9%) had a PaO₂/FiO₂ ratio below 200. A total of 151 patients (34.6%) had a diagnosis of congestive heart failure. Hypotension was absent in 94.7% of the patients (n = 414). Based on the blood urea nitrogen to creatinine (BUN/Cr) ratio, 35 patients (8.0% of the total) were classified as having prerenal acute kidney injury (Table 2).
In the correlation analyses, no statistically significant associations were found between IORI values and albumin, CRP, or ICU length of stay. However, significant correlations were observed between IORI and creatinine, age, SOFA score, Charlson Comorbidity Index (CCI), APACHE II score, and the BUN/creatinine ratio. Specifically, a moderate inverse correlation was identified with creatinine and the BUN/creatinine ratio, while weak inverse correlations were found with age, SOFA score, APACHE II, and CCI (Table 3).
According to the KDIGO 2012 classification for AKI, 103 out of 437 patients included in the study were diagnosed with AKI. Among these, 70 patients with a BUN/creatinine ratio greater than 20 were classified as having prerenal AKI, while the remaining 33 were considered to have non-prerenal AKI. Based on our classification, patients with prerenal AKI were found to be significantly older, had lower albumin levels, higher SOFA scores, more comorbidities, higher APACHE II scores, and higher urine specific gravity values, whereas their IORI values were significantly lower (Table 4).
In the ROC analysis performed to assess the diagnostic performance of IORI values in detecting both AKI and prerenal AKI, statistically significant results were obtained for both conditions. When a cut-off value of 40.25 was applied for AKI and 39.68 for prerenal AKI, the most balanced sensitivity and specificity values were observed (Table 5). The ROC curves for AKI and prerenal AKI are presented in Figure 2 and Figure 3, respectively.
In the comparison of IORI values between patients without AKI and those with different KDIGO stages of AKI, a significant difference was observed only between the non-AKI group and patients with early-stage AKI (stage 1). However, no significant difference was found between the non-AKI group and those with more advanced AKI stages (Table 6). These findings suggest that IORI values tend to decrease in the early stages of AKI, while gradually increasing as the severity of AKI progresses.
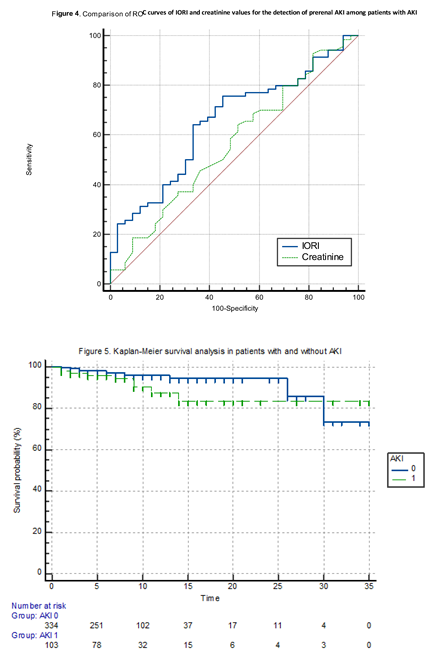
We compared the areas under the ROC curves (AUCs) of IORI and creatinine in predicting prerenal AKI using the DeLong’s test. DeLong’s test showed no statistically significant difference between the AUCs of IORI and creatinine for distinguishing prerenal AKI among AKI patients (p = 0.2954) (Table 7) (Figure 4).
When IORI values were compared according to patients' clinical outcomes (death, discharge to home, transfer to ward, or transfer to tertiary ICU) using the Kruskal-Wallis H test, no statistically significant difference was found (p: 0.40).
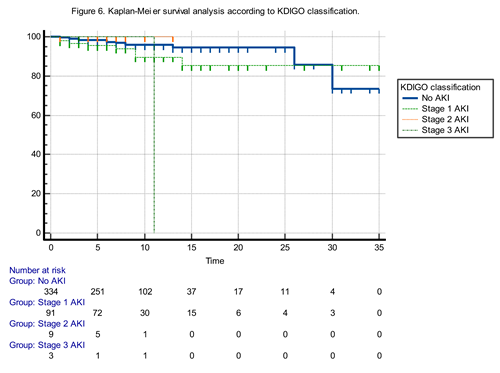
The Kaplan-Meier survival analysis comparing patients with and without acute kidney injury (AKI) revealed no statistically significant difference in survival curves (Log-rank test: χ² = 2.84, p: 0.0917). Although patients with AKI tended to have worse survival outcomes, the difference did not reach statistical significance. The hazard ratio for mortality in AKI patients compared to non-AKI patients was 2.2793 (95% CI: 0.8749–5.9384), indicating a trend toward increased risk that failed to achieve statistical significance. Conversely, the hazard ratio for non-AKI patients compared to AKI patients was 0.4387 (95% CI: 0.1684–1.1430), suggesting a potential survival advantage without statistical confirmation (Figure 5).
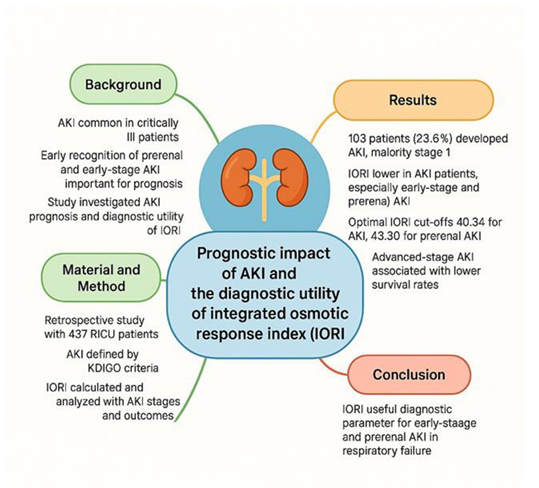
The Kaplan-Meier survival analysis according to KDIGO stages demonstrated a statistically significant difference in survival probabilities among the four groups (Chi-square: 10.1756, p: 0.0171) (Figure 6).
Pairwise hazard ratio comparisons indicated the following:
- Patients with Stage 3 AKI had significantly poorer survival compared to those without AKI (HR : 11.7765, 95% CI: 0.02 to 4957.57) and to those with Stage 1 AKI (HR: 6.04, 95% CI: 0.01 to 2659.53), although the wide confidence intervals reflect imprecision likely due to small subgroup sizes.
- Interestingly, Stage 3 vs. Stage 2 comparison yielded a hazard ratio of 0.16 (95% CI: 0.0003 to 72.72), again with a wide confidence range.
- Stage 1 AKI patients did not demonstrate a statistically significant difference in survival compared to the non-AKI group (HR: 1.9473, 95% CI: 0.72 to 5.21).
- Notably, Stage 2 AKI patients showed a reduced hazard relative to non-AKI patients (HR: 0.08, 95% CI: 0.0002 to 35.74), though the result lacks precision.
These findings suggest that while overall survival significantly differs among KDIGO stages, the mortality risk increases most notably in Stage 3 AKI, underscoring the severity and prognostic importance of advanced AKI stages.
4. Discussion
AKI is frequently observed in all intensive care units, including respiratory ICUs. Sepsis is one of the most common etiological factors, along with several other potential causes. Regardless of the underlying etiology, current literature indicates that the development of AKI in critically ill ICU patients is associated with a significantly poor prognosis [11,12]. In our study, there was no significant difference in survival between patients with early-stage AKI and those without AKI. However, although the number of patients diagnosed with advanced-stage AKI was limited, we observed that their survival rates were notably lower.
In our study, the similarity in survival rates between patients with early-stage AKI and those without AKI highlighted the need for a biomarker that could help identify patients at this early stage. This study originated from a series of preliminary analyses, which led to the formulation of a hypothesis based on theoretical physiological mechanisms. The core of this hypothesis is that the kidney’s ability to concentrate urine is among the first functions to be impaired in acute kidney injury. However, we believe that the ratio proposed in this study could also be useful not only in diagnosing AKI, but in other conditions that affect urine concentration, such as diabetes insipidus, SIADH, dehydration, and other disorders influencing urine density. Numerous studies in the literature have focused on the early detection of AKI and on preventing progression to renal replacement therapies or conventional dialysis. Some of these studies have aimed to identify AKI at an early stage, while others have investigated the prediction of progression from AKI to CKD (13, 14). Urinary neutrophil gelatinase-associated lipocalin (NGAL) levels have been shown to be earlier and more reliable than conventional parameters in the early diagnosis of AKI [13]. Another study found that adjusting and indexing biomarker levels based on urine osmolality and urine creatinine improved the prediction of progression from AKI to chronic kidney disease [14].
The IORI biomarker—based on the ratio of USG to serum osmolality—was found to be significantly lower in both early-stage AKI and prerenal AKI cases. In the early stages of AKI, the solute load that contributes to elevated serum osmolality cannot be adequately excreted and concentrated in the urine. As a result, while serum osmolality increases, urine specific gravity remains relatively low or unchanged, leading to a decreased ratio. Looking at the literature, a study by Wonji Jo et al. in 2020 demonstrated that patients with lower preoperative USG values had a higher risk of developing AKI in the postoperative period following cardiac surgery [15]. In a more recent study, it was shown that simple parameters could help distinguish between prerenal and intrarenal AKI. In that study, USG was reported to be highly specific for prerenal AKI and highly sensitive in the diagnosis of acute tubular necrosis (ATN) [16].
In our correlation analyses, we observed that IORI was weakly but negatively correlated with age, CCI, APACHE II, and SOFA scores. This finding aligns with well-established evidence that renal concentrating ability declines with age. A large-scale study conducted in 2019 on 15,055 American adults without kidney disease found that USG was significantly negatively correlated with age [17]. Another study attributed this decline to the age-related downregulation of renal vasopressin V2 receptors and a decrease in aquaporin-2 (AQP2) expression, both of which are crucial for water reabsorption and urine concentration [18]. Additionally, a more recent study reported that elderly individuals tend to produce less concentrated urine and have a higher prevalence of albuminuria, further supporting the age-related decline in renal function [19].
The weak negative correlation between IORI and SOFA score provides a statistical basis for the potential utility of IORI in sepsis-associated AKI. In the literature, studies have shown that serum osmolality increases in sepsis-associated AKI—a condition that would logically lead to a decrease in the IORI value [1,20].
Patients diagnosed with prerenal AKI in our study were characterized by being older, having more comorbidities, higher APACHE II and SOFA scores, lower IORI values, higher urine specific gravity, and lower serum albumin levels. This clinical profile points toward a frail, elderly population—often malnourished, dependent on care, and particularly susceptible to infections. The association between hypoalbuminemia and AKI has already been demonstrated in previous studies [21]. In a study by Thongprayoon et al., hypoalbuminemia and sepsis were identified as modifiable risk factors for AKI, while advanced age was considered a non-modifiable risk factor [22].
5. Limitations of the Study
5.1. Low Number of Patients with Stage 2 and Stage 3 AKI
Out of 437 patients, only 9 had Stage 2 and 3 had Stage 3 AKI, representing a very small proportion of the cohort. This limited sample size in advanced AKI stages reduces the statistical power and generalizability of the findings for these groups. It also likely contributes to the wide confidence intervals observed in the survival analyses for Stage 2 and Stage 3 AKI, weakening the strength of conclusions regarding prognosis in advanced AKI.
5.2. Use of a Single IORI Measurement Instead of a Temporal Trend:
The study calculated the Integrated Osmotic Response Index (IORI) at a single time point. However, since AKI is a dynamic condition, serial measurements of IORI in a prospective design would likely provide more clinically meaningful insights. Monitoring IORI trends over time could help better identify progression, response to treatment, or resolution of prerenal states, which cannot be captured with one-time values.
5.3. Retrospective Design and Single-Center Setting
As a retrospective study, the data rely on existing records and are subject to limitations in data completeness and control over variables. This design prevents real-time monitoring and may introduce unrecognized confounding factors. Additionally, the single-center nature of the study limits the generalizability of the results to broader ICU populations with different care practices or patient demographics.
5.4. Homogeneous Patient Population (Respiratory Failure Only):
While the study’s focus on patients with respiratory failure creates a relatively uniform cohort, which can reduce confounding factors and improve internal validity, it also limits external validity. The findings may not apply to patients in general medical, surgical, or cardiac ICUs where the etiology and pathophysiology of AKI might differ. However, this homogeneity is also a strength, as it minimizes the influence of unrelated systemic diseases, leading to more controlled analysis.
6. Conclusions
This study demonstrated that AKI is a frequent complication among patients with respiratory failure admitted to the intensive care unit, with the majority of cases classified as Stage 1 according to the KDIGO criteria. Notably, no statistically significant difference in survival was observed between patients with Stage 1 AKI and those without AKI, emphasizing the importance of early detection before progression to advanced stages, which are associated with worse outcomes.
The Integrated Osmotic Response Index (IORI), calculated from urine specific gravity and serum osmolality, was found to be significantly lower in patients with early-stage and prerenal AKI, suggesting its potential utility as an early diagnostic marker. These findings support the clinical relevance of identifying subtle renal dysfunction at an early stage, where conventional markers like serum creatinine may be insufficient.
IORI may serve as a practical, physiology-based index to aid in the timely identification of kidney injury, particularly in its early or prerenal forms, potentially contributing to better clinical decision-making and improved patient management in the intensive care setting.
A summary of the key findings and clinical implications of this study is presented in Figure 7.
Author Contributions
O.M, M.Y., D.Ç., M.B. : conceptualization, data curation, formal analysis, investigation, methodology, project administration, software, writing—original draft. M.A, A.K, M.B. : data curation, formal analysis, investigation, methodology, software. M.Ö.C., G.E.D., B.H. : conceptualization, project administration, resources, supervision, validation, visualization. F.C., O.M., M.B. : supervision, conceptualization, validation. M.Y. F.C., D.Ç., M.A. .: conceptualization, funding acquisition, resources, supervision, validation, writing—review and editing. All authors have read and agreed to the published version of the manuscript.
Funding
This study received no grant from any funding agency in the public, commercial, or not-for-profit sectors .
Institutional Review Board Statement
This research was approved by the Scientific Research Ethics Committee of the University of Health Sciences, Ankara Atatürk Training and Research Hospital (approval date: 26.03.2025, decision number: 2024-BÇEK/258).
Data Availability Statement
The datasets used and/or analyzed during the current study are available from the corresponding author on reasonable request.
Conflicts of Interest
The authors declare no conflicts of interest.
References
- Wang, R.; Cheng, Y.; Yang, J.; Wang, B. Association Between Serum Osmolality and Acute Kidney Injury in Critically Ill Patients: A Retrospective Cohort Study. Front. Med. 2021, 8. [Google Scholar] [CrossRef]
- Peng, Y.-S.; Yang, J.-T.; Tsai, Y.-H.; Tung, C.-W.; Wu, J.-J.; Lin, C.-W.; Huang, J.-C. Serum Osmolality as a Predictor of Renal Function Decline: A Retrospective Cohort Study. J. Clin. Med. 2024, 13, 6505. [Google Scholar] [CrossRef]
- Xu, B.; Luo, X.; Shu, Y.; Tang, Y.; Liu, J.; Lv, Z. Association between serum osmolality and deteriorating renal function in patients with acute myocardial infarction: analysis of the MIMIC- IV database. BMC Cardiovasc. Disord. 2024, 24, 1–9. [Google Scholar] [CrossRef]
- Yildiz, M.; Çelik, D.; Çifci, A. Serum osmolarity does not predict mortality in patients with respiratory failure. Medicine 2022, 101, e28840. [Google Scholar] [CrossRef]
- Rusnak, M.; Eskin, C.; Bickham, J.; VanderMeulen, M.; Hew-Butler, T.D. Dehydration is how you define it: comparison of 318 blood and urine athlete spot checks. BMJ Open Sport Exerc. Med. 2018, 4, e000297. [Google Scholar] [CrossRef]
- Buckenmayer, A.; Siebler, N.; Haas, C.S. Evaluation of simple diagnostic parameters in acute kidney injury in hospitalized patients—diagnostic recommendations for non-nephrologists. Intern. Emerg. Med. 2023, 18, 1769–1776. [Google Scholar] [CrossRef]
- Paul, V.; Balagopal, A.; Korula, S.; Sundar, S.; Balakrishnan, S. Acute kidney injury-incidence, prognostic factors, and outcome of patients in an Intensive Care Unit in a tertiary center: A prospective observational study. Indian J. Crit. Care Med. 2016, 20, 332–336. [Google Scholar] [CrossRef]
- Bellomo, R.; Shekar, K.; Tabah, A.; Garrett, P.; Clement, P.; White, H.; McCullough, J.; Senthuran, S.; Serpa-Neto, A.; Ramanan, M.; et al. Sepsis-associated acute kidney injury in the intensive care unit: incidence, patient characteristics, timing, trajectory, treatment, and associated outcomes. A multicenter, observational study. Intensiv. Care Med. 2023, 49, 1079–1089. [Google Scholar] [CrossRef]
- Peker, T.T.; Ensarioglu, K.; Kahraman, A.; Celik, D.; Mentes, O.; Cirik, M.O.; Doganay, G.E.; Canbay, F.; Yildiz, M. A Retrospective Evaluation of the Cardiometabolic Profile of Patients with COPD-Related Type 2 Respiratory Failure in the Intensive Care Unit. Medicina 2025, 61, 705. [Google Scholar] [CrossRef]
- KDIGO Group. ( 2, 1.
- Babore, G.O.; Heliso, A.Z.; Wolde, Y.D.; Ashine, T.M.; Mekonnen, M.S.; Bushen, Z.D.; Ereta, E.E.; Saliya, S.A.; Muluneh, B.B.; Jemal, S.A. Incidence and predictors of acute kidney injury among adults admitted to the medical intensive care unit of a Comprehensive Specialized Hospital in Central Ethiopia. PLOS ONE 2024, 19, e0304006. [Google Scholar] [CrossRef]
- Paul, V.; Balagopal, A.; Korula, S.; Sundar, S.; Balakrishnan, S. Acute kidney injury-incidence, prognostic factors, and outcome of patients in an Intensive Care Unit in a tertiary center: A prospective observational study. Indian J. Crit. Care Med. 2016, 20, 332–336. [Google Scholar] [CrossRef]
- Serdarević, N.; Omerika, L.; Rasić, S. Importance of determination of urine neutrophile gelatinase associated lipocalin in early detection of acute kidney injury. . 2014, 38, 161–6. [Google Scholar]
- Kimmel, P.L.; Liu, K.D.; Kaufman, J.S.; Ghahramani, N.; Ikizler, T.A.; Go, A.S.; Himmelfarb, J.; Hsu, C.-Y.; Siew, E.D.; Thiessen-Philbrook, H.; et al. Considerations in Controlling for Urine Concentration for Biomarkers of Kidney Disease Progression After Acute Kidney Injury. Kidney Int. Rep. 2022, 7, 1502–1513. [Google Scholar] [CrossRef]
- Wonji Jo, Chan-Young Jung, Jaeyoung Kim, Jihye Kim, Sangmi Lee, Jung Tak Park, P0618.
- Kim, J.; Park, J.T.; Kim, J.; Lee, S.; Jung, C.-Y.; Jo, W. P0618PREOPERATIVE LOW URINE SPECIFIC GRAVITY PREDICTS ACUTE KIDNEY INJURY AFTER CARDIAC SURGERY. Nephrol. Dial. Transplant. 2020, 35. [Google Scholar] [CrossRef]
- Buckenmayer, A.; Siebler, N.; Haas, C.S. Evaluation of simple diagnostic parameters in acute kidney injury in hospitalized patients—diagnostic recommendations for non-nephrologists. Intern. Emerg. Med. 2023, 18, 1769–1776. [Google Scholar] [CrossRef]
- Sands, J.M.; Raichlen, D.A.; Wood, B.M.; Pontzer, H.; Tanner, S.N.; Rosinger, A.Y. Age-related decline in urine concentration may not be universal: Comparative study from the U.S. and two small-scale societies. Am. J. Phys. Anthr. 2019, 168, 705–716. [Google Scholar] [CrossRef]
- Moritz, K.M.; Bertram, J.F.; Nørgaard, J.P.; Nielsen, S.; Bichet, D.G.; Singh, R.R.; Juul, K.V.; Denton, K.M.; Serino, R.; Verbalis, J.G.; et al. Downregulation of renal vasopressin V2 receptor and aquaporin-2 expression parallels age-associated defects in urine concentration. Am. J. Physiol. Physiol. 2004, 287, F797–F805. [Google Scholar] [CrossRef]
- Hahn, R.G. Urine concentration in elderly women and men. URINE 2022, 4, 27–31. [Google Scholar] [CrossRef]
- Mehran, R.; Baber, U.; Sorrentino, S.; Sweeny, J.; Chandrasekhar, J.; Rohla, M.; Kini, A.; Vogel, B.; Sharma, M.; Barman, N.; et al. Calculated Serum Osmolality, Acute Kidney Injury, and Relationship to Mortality after Percutaneous Coronary Intervention. Cardiorenal Med. 2019, 9, 160–167. [Google Scholar] [CrossRef]
- Joannidis, M.; Wiedermann, C.J.; Wiedermann, W. Causal relationship between hypoalbuminemia and acute kidney injury. World J. Nephrol. 2017, 6, 176–187. [Google Scholar] [CrossRef]
- Torres-Ortiz, A.; Hansrivijit, P.; Thongprayoon, C.; Acharya, P.; Kaewput, W.; Kovvuru, K.; Gonzalez-Suarez, M.L.; Cheungpasitporn, W.; Bathini, T.; Kanduri, S.R. Diagnostics, Risk Factors, Treatment and Outcomes of Acute Kidney Injury in a New Paradigm. J. Clin. Med. 2020, 9, 1104. [Google Scholar] [CrossRef]
Figure 1.
Flowchart of the study.
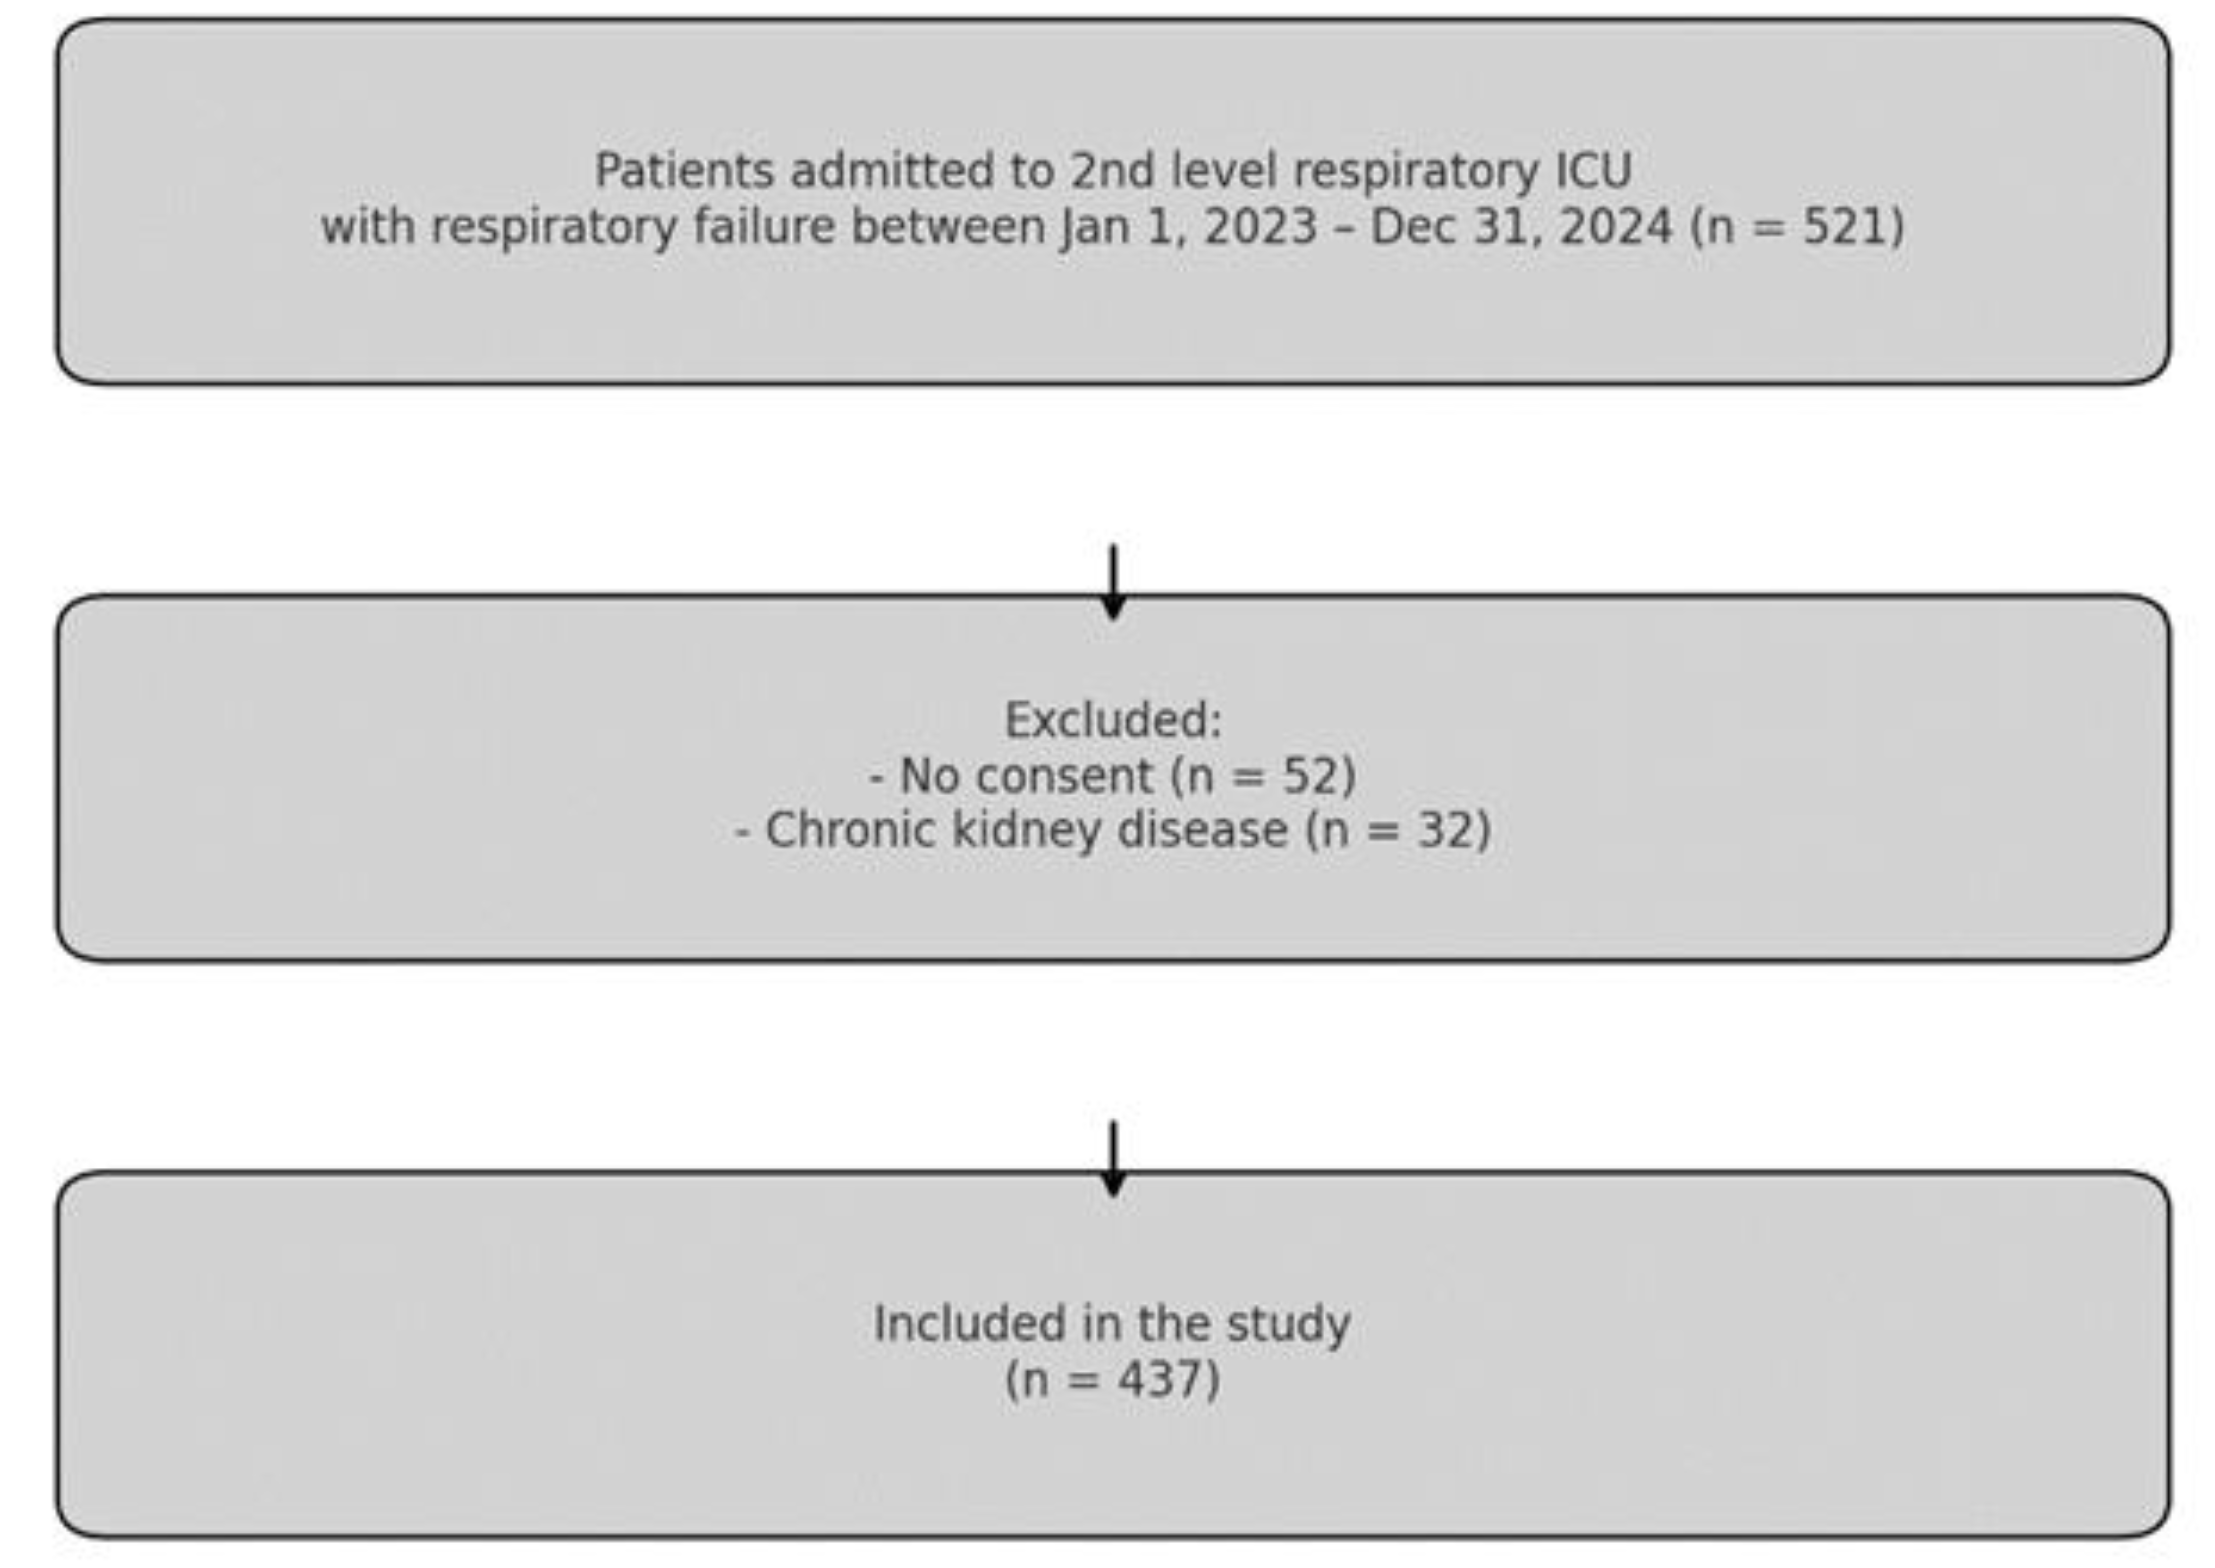

Table 1.
General and demographic characteristics of the patients.
| Parameter | Value |
|---|---|
| Age, median (IQR) | 71 (62–79) |
| APACHE II, median (IQR) | 16 (12–20) |
| Charlson Comorbidity Index, median (IQR) | 5 (4–6) |
| Gender - Male (n, %) | 282 (64.5%) |
| Gender - Female (n, %) | 155 (35.5%) |
| Outcome - Death (n, %) | 23 (5.3%) |
| Outcome - Discharged to home (n, %) | 363 (83.1%) |
| Outcome - Transferred to pulmonary ward (n, %) | 21 (4.8%) |
| Outcome - Transferred to tertiary ICU (n, %) | 30 (6.9%) |
| KDIGO Stage - No AKI (n, %) | 334 (76.4%) |
| KDIGO Stage - Stage 1 (n, %) | 91 (20.8%) |
| KDIGO Stage - Stage 2 (n, %) | 9 (2.1%) |
| KDIGO Stage - Stage 3 (n, %) | 3 (0.7%) |
AKI: Acute Kidney Injury, APACHE II: Acute Physiology and Chronic Health Evaluation II, KDIGO: Kidney Disease Improving Global Outcomes.
Table 2.
Clinical characteristics of the patients.
| Parameter | Value |
|---|---|
| GCS = 15 | 296 (67.7%) |
| GCS = 14–13 | 92 (21.1%) |
| GCS = 12–10 | 31 (7.1%) |
| GCS = 9–6 | 7 (1.6%) |
| GCS < 6 | 11 (2.5%) |
| PaO₂/FiO₂ ratio > 400 | 6 (1.4%) |
| PaO₂/FiO₂ ratio = 400–300 | 32 (7.3%) |
| PaO₂/FiO₂ ratio = 300–200 | 111 (25.4%) |
| PaO₂/FiO₂ ratio = 200–100 | 275 (62.9%) |
| PaO₂/FiO₂ ratio < 100 | 13 (3.0%) |
| SOFA score, median (IQR) | 3.0 (3.0–5.0) |
| Congestive heart failure (n, %) | 151 (34.6%) |
| Chronic pulmonary disease (n, %) | 397 (90.8%) |
| No hypotension | 414 (94.7%) |
| MAP < 70 mmHg (no inotropic support) | 17 (3.9%) |
| Inotropic support | 6 (1.4%) |
| Prerenal AKI (BUN/Cr > 20) (n, %) | 35 (8%) |
AKI: Acute Kidney Injury, BUN: Blood Urea Nitrogen, Cr: Creatinine, FiO₂: Fraction of Inspired Oxygen, GCS: Glasgow Coma Scale, IQR: Interquartile Range, MAP: Mean Arterial Pressure, PaO₂: Partial Pressure of Arterial Oxygen, SOFA: Sequential Organ Failure Assessment.
Table 3.
Correlation of IORI with key clinical parameters.
| Variable | Spearman’s ρ | 95% CI (Lower – Upper) | p-value |
|---|---|---|---|
| Cr | –0.302 | –0.387 to –0.211 | <0.001* |
| Age | –0.176 | –0.268 to –0.081 | <0.001* |
| SOFA score | –0.199 | –0.290 to –0.104 | <0.001* |
| CCI | –0.134 | –0.228 to –0.038 | 0.005* |
| APACHE II | –0.144 | –0.237 to –0.048 | 0.003* |
| BUN/Cr ratio | –0.363 | –0.444 to –0.276 | <0.001* |
| Albumin | 0.053 | –0.044 to 0.148 | 0.272 |
| CRP | 0.014 | –0.082 to 0.111 | 0.765 |
| ICU-LOS (day) | –0.055 | –0.150 to 0.042 | 0.254 |
IORI: Integrated Osmotic Response Index, BUN: Blood Urea Nitrogen, Cr: Creatinine, SOFA: Sequential Organ Failure Assessment, CCI: Charlson Comorbidity Index, APACHE II: Acute Physiology and Chronic Health Evaluation II, CRP: C reactive protein, ICU: Intensive care unit, LOS: Length of stay *significant p value.
Table 4.
Comparison of clinical parameters by prerenal AKI status.
| Parameter | Prerenal (-) Median [IQR](n:33) | Prerenal (+) Median [IQR](n:70) | p-value |
|---|---|---|---|
| USG | 1013 [1007–1016] | 1014 [1008–1019] | 0.024a* |
| IORI | 47.55 [41–53] | 41.37 [34–49] | <0.001a* |
| Sodium | 139 [136–141] | 139 [135–141] | 0.166a |
| Age | 67 [59–74] | 72 [64–80] | <0.001a* |
| ICU-LOS | 8 [5–10] | 8 [5–12] | 0.485a |
| Potassium | 4.5 [4.0–4.8] | 4.5 [4.0–4.9] | 0.942a |
| SOFA Score | 3 [2–3] | 4 [2–4] | 0.003a* |
| CRP | 23.5 [8–78] | 34 [13–92] | 0.072a |
| Albumin | 35.2 [32.0–38.4] | 32.3 [28.0–35.6] | <0.001a* |
| CCI | 4 [3–6] | 5 [4–6] | 0.002a* |
| APACHE II Score | 15 [11–19] | 17 [13–23] | 0.004a* |
IORI: Integrated osmotic response index, SOFA: Sequential organ failure assessment, USG: Urine specific gravity, CRP: C-reactive protein, CCI: Charlson comorbidity index, APACHE II: Acute physiology and chronic health evaluation II, ICU: Intensive care unit, LOS: Length of stay, aMan Whitney U test, *significant p value.
Table 5.
Diagnostic performance of IORI for predicting AKI and prerenal AKI.
| Outcome | Cut-off (IORI) | AUC (95% CI) | Sensitivity (%) | Specificity (%) | PPV (%) | NPV (%) | p value |
|---|---|---|---|---|---|---|---|
| AKI | ≤40.25 | 0.652 (0.606–0.692) | 62.14 | 70.06 | 39.0 | 85.7 | <0.001* |
| Prerenal AKI | ≤39.68 | 0.657 (0.551–0.743) | 64.29 | 66.67 | 80.4 | 46.8 | 0.007* |
AKI: Acute kidney injury, IORI: Integrated osmotic response index, AUC: Area under curve, PPV: Positive
predictive value, NPV: Negative predictive value, *significant p value.
Table 6.
Comparison of IORI values across KDIGO AKI stages.
| KDIGO AKI Stage | n | Median (IQR) | p value |
|---|---|---|---|
| No AKI | 334 | 45.04 (37.89–52.32) | <0.001b* |
| Stage 1 | 91 | 37.90 (33–45.68) | |
| Stage 2 | 9 | 47.26 (38.78–61.61) | |
| Stage 3 | 3 | 50.98 (47.19–51.20) | |
| 0 vs S1 | N/A | <0.001a* | |
| 0 vs S2 | N/A | 0.680a | |
| 0 vs S3 | N/A | 0.505a | |
| S1 vs S2 | N/A | 0.066a | |
| S1 vs S3 | N/A | 0.049a* | |
| S2 vs S3 | N/A | 0.782a | |
AKI: Acute kidney injury, IQR: Interquartile range, KDIGO: Kidney Disease Improving Global Outcomes, N/A: Not applicable, a Man Whitney U test, b Kruskal Wallis H test, * significant p value.
Table 7.
Comparison of diagnostic accuracy of IORI and creatinine for identifying prerenal AKI among patients with AKI.
Table 7.
Comparison of diagnostic accuracy of IORI and creatinine for identifying prerenal AKI among patients with AKI.
| Test Variable | AUC (95% CI) | Standard error | z-value (DeLong) | p-value |
|---|---|---|---|---|
| IORI | 0.652 (0.551–0.743) | 0.0566 | N/A | 0.007 |
| Creatinine | 0.563 (0.462–0.660) | 0.0614 | N/A | 0.303 |
| Difference | 0.0887 | 0.0848 | 1.046 | 0.2954 |
Disclaimer/Publisher’s Note: The statements, opinions and data contained in all publications are solely those of the individual author(s) and contributor(s) and not of MDPI and/or the editor(s). MDPI and/or the editor(s) disclaim responsibility for any injury to people or property resulting from any ideas, methods, instructions or products referred to in the content. |
© 2025 by the authors. Licensee MDPI, Basel, Switzerland. This article is an open access article distributed under the terms and conditions of the Creative Commons Attribution (CC BY) license (http://creativecommons.org/licenses/by/4.0/).
Copyright: This open access article is published under a Creative Commons CC BY 4.0 license, which permit the free download, distribution, and reuse, provided that the author and preprint are cited in any reuse.


