Submitted:
29 May 2025
Posted:
30 May 2025
You are already at the latest version
Abstract
Zingiber Officinale, commonly known as ginger, has a long-standing history as a natural remedy for ailments and disease. Adult rhizomes are used in medicine, food, and beverages. It has been shown that juvenile ginger harvested between nine and eleven weeks has strong anti-obesity properties, while mature ginger typically found on the shelves of food markets does not possess the same qualities. This project aims to explore the capabilities of young ginger rhizomes, with the intent of determining whether young ginger is more phytochemically potent than its adult form. Young ginger has the advantage of being easier to grow in a variety of conditions and easier to use in culinary applications. The ripening process of ginger has been studied with the support of phytochemical analysis, and it has been found that behind its tender flesh, young ginger is a host to many bioactive compounds such as gingerol, shogaol, and zingerone essential oils. Moreover, we have found that phenolics and flavonoids have much higher concentrations in young ginger as compared to mature rhizomes. Quantitative analysis of ginger extracts created from high-tunnel cultivars reported an increase of up to 60% (mg GAE/g) in total phenolics, 87% (mg QE/g) in flavonoid content, and 67% (mg TAE/g) in tannin content difference between ginger grown within the first nine weeks of maturity and ginger older than eleven weeks. A comparison of fresh-frozen and lyophilized ginger, the influence of breed on the phytochemical process, and the influence of thermal processing on antioxidant capacity will also be explored.
Keywords:
Zingiber officinale
; juvenile ginger
; phytochemicals
; tannins
; flavonoids
; polyphenols
; phytochemical screening
; essential oils
; terpenes
; obesity
1. Introduction
1.1. Ginger Species
Zingiber officinale, more commonly known as Ginger, is a member of the Zingiberaceae plant family, home to other familiar plants such as cardamon and turmeric. Ginger itself is a significant source of pungent ketones such as gingerol, giving ginger its characteristically strong aroma. The part of the plant that is generally consumed is the rhizome, commonly mistaken as “ginger root” (Figure 1). The rhizome is the horizontal extension of the plant stem that sends out the actual “adventitious” roots of the plant, similar to poison ivy, bamboo, and rhubarb. Ginger is primarily grown in Asian countries such as India, China, and Indonesia, and other tropical regions [1].
1.2. Mature Ginger vs Juvenile Ginger
Where juvenile ginger separates itself from mature species lies in its larger ratio of phytochemical activity; reportedly yielding twice the amount of phenolics, and up to three times the amount of antioxidant activity. Characteristically, premature rhizomes are of much smaller size, and have much softer outer skin, allowing for undemanding usage in culinary applications [2]. Juvenile ginger rhizomes have more flexible growing conditions as they take fewer months to grow and can be grown in tropical regions with shorter growing seasons than major producers.
1.3. Phytochemicals in Ginger
Notable phytochemicals in Zingiber Officinale derived from its powdered form include polyphenolic compounds such as gingerol, saponins (4.01mg/100g), cyanogenic glycoside, phytin (0.28mg/100g), oxalate (0.26mg/100g), terpenes and tannins (0.02mg/100g) among various other essential oils and amino [1]. The primary bioactive compounds are those of 6-Gingerol, 6-Shogaol, zingerone, phenolics, and flavonoids (Figure 2) [3].
Phytochemicals are biologically active compounds found in plants. The three major classes include terpenoids, phenolic metabolites, and alkaloids, but also include polysaccharides. This report analyzes and screens for only those that have recognized health benefits [4].
1.3.1. Polyphenols
Polyphenols are among the most important dietary phenolics. They protect plants from oxidative damage and have also been studied as antioxidant protectants for humans. They are still being studied extensively for their potential to reduce coronary heart disease, diabetes, hypertension, and some types of cancer. Long-term clinical trials have not been conducted, however, so there is not yet any concrete evidence to support these claims.
1.3.2. Flavonoids
Flavonoids are a subclass of phenols and have primarily been studied in grapes and wines, with current research being conducted in medicinal plants. They protect against free radicals, inflammation, allergies, ulcers, viruses, and tumors.
Flavonoids have also been shown to block angiotensin-converting enzymes that raise blood pressure and the enzyme that produces estrogen [5]. Flavonoids are secondary metabolite pigments responsible for the display of light-yellow color in plants. They are important bioactive compounds, which accomplish a variety of physiological functions in plants, including UV and light protection, metal chelation, pollinator and bird attraction, herbivore deterrence, and pathogen defense [6,7]. Flavonoids are classified as phenolics and further classified as polyphenols. The backbone of most flavonoids contains a carbonyl on C4 in the center ring. Measuring total flavonoid content is an estimation of the concentration of flavonoids as opposed to the specific quantification of flavonoid species present, as would be observed in analysis by HPLC (high-performance liquid chromatography).
1.3.3. Terpenes
Terpenes and more specifically, diterpenes, are a class of compounds that contribute to various biological activities such as anti-inflammation, anti-cancer, and anti-fungal processes [8].
1.3.4. Phytosterols
Phytosterols are naturally occurring triterpene compounds that share similarities in structure to cholesterol, but function to stabilize the phospholipid layers in cell membranes. Phytosterols also exhibit anti-inflammatory and immune-modulating activity in the body. Outside of this, phytosterols see use in the pharmaceutical industry in the production of therapeutic steroids, and in the nutrition industry as an anti-cholesterol additive, and for its anti-cancer properties.
1.3.5. Cholesterol
Cholesterol is the source of steroid hormones; and is a part of the steroid group known as sterols which have a polar hydroxyl group at carbon 3 and a saturated 8 carbon at carbon 17. Cholesterol can be synthesized naturally within the liver but can also be absorbed through food in the form of dietary cholesterol [9]. However, foods comprised of dietary cholesterol are also rich in saturated fats, which ultimately lead to the overproduction of cholesterol by the liver [10]. These Higher levels of cholesterol in the blood then translate into higher risks of cardiovascular diseases. An important distinction in cholesterol is that which consists of LDL (low density lipoproteins), or HDL (high density lipoproteins). Whereas LDLs are harmful in that they clog arteries, HDLs are beneficial in reversing this backup, allowing the LDLs to be broken down in the liver. In tandem with HDLs, plant sterols from plant consumption also work to lower the level of LDLs in the blood, further exercising the capabilities of the drink.
1.3.6. Saponins
Saponins are amphiphilic compounds that possess surface-active characteristics, allowing them to interact with both polar and nonpolar molecules. Studies of saponins have shown that, through various mechanisms, saponins can be shown to have anticarcinogenic properties. Studies of dietary consumption of saponins, from foods in abundance (such as soybeans) have shown that nondietary saponins are more effective in their anticarcinogenic properties [11]. Outside of this, the biological activity of saponin as an anticancer/anti-cholesterol has led to the commercial success of saponins with applications in food, cosmetics, and pharmaceuticals [12].
1.3.7. Alkaloids
Alkaloids, found primarily in plants, are a class of naturally occurring compounds with a distinct content of nitrogen. Natural alkaloids contribute to various biological activities with the ability to transform into active metabolites. Other commonly known alkaloids with various physiological effects include morphine, caffeine, and nicotine. Though wildly different in application, alkaloids remain extremely valuable in different industries, thanks to their versatility [13].
1.3.8. Anthraquinones
Anthraquinones are an exceptional class of compounds that range in biological activity from having anti-cancerous effects to antibacterial and antimalarial effects [14]. They are aromatic organic compounds that have uses as dyes, pigments, and medicinal applications. Outside of medicine, anthraquinones have applications in the synthesis of cellulose for varied uses. Studies of rhubarb, a long-standing traditional Chinese medicine, have shown the ability of its primary anthraquinone, emodin, to inhibit cellular proliferation, induce apoptosis, and prevent metastasis [15].
1.3.9. Essential Oils
Essential oils are a class of hydrophobic, volatile plant compounds that have been used for bactericidal, virucidal, fungicidal, antiparasitic, insecticidal, medicinal, and cosmetic applications. Derived from the distillation of aromatic plants, they are comprised of various volatile molecules such as terpenes and terpenoids [16]. Closer looks at the antimicrobial properties of essential oils have backed their ability to defend against various bacteria and fungi. Even outside of consumption, the use of essential oils as repellents for insects, opposed to synthetic chemicals, has been explored, as they could potentially become safer and more efficient for both humans and the environment [17].
1.3.10. Tannins
Tannins are a type of water soluble, polyphenolic compound that is attributed to the astringent taste found in various plant foods. They can precipitate alkaloids, gelatin, and other various proteins. As their nature varies from plant to plant, the use of tannin can vary depending on the source. From medicinal applications in the form of tonics, to or remedies for open wounds [18].
1.3.11. Amino Acids
Amino Acids, or proteins, are the fundamental building blocks of life. Coded by the coaction of DNA, and eventually various RNA, amino acids created in the ribosome serve to quite literally “build” all of the complex structures of prokaryotic and eukaryotic organisms. Similarly to how the body can naturally create and consume proteins with different tasks, proteins charged with specific tasks can be synthesized using protein folding prediction A.I.
1.3.12. Dietary Carbohydrates
Dietary carbohydrates serve an integral role in the resynthesis of glycogen in both the muscle and liver. Specifically accomplished through the activation of glycogen synthetase upon glycogen depletion and following intake of carbohydrates. Carbohydrate rich diets result in increased glycogen storage and endurance during exercise when consumed in advance. However, these diets also result in an increased rate of carbohydrate oxidation and utilization of muscle glycogen [19].
1.4. Applications of Mature and Juvenile Ginger and Products
Juvenile Zingiber Officinale, like its adult counterpart, has parallel applications in cooking, and shares the ability to be pickled, candied, or frozen for prolonged use.
1.5. Reported Health Benefits and Nutrition Properties of Ginger
Ginger, as well as many other spices and herbs have a long-standing history as a natural treatment of various ailments, and diseases [3]. Adult ginger rhizomes have an extensive history of use as medicine in addition to their advents in the food and beverage industries. Historically used as a natural remedy for headaches, nausea, colds, muscular pain, high cholesterol, and ulcers, the ginger rhizome has become a household name in traditional medication alternatives [20]. As a non-traditional medicine, ginger extracts and decoctions have also been used as antibacterial [21], diaphoretic, analgesic, anti-emetic, and anti-inflammatory drugs [22].
1.6. Ginger and Obesity
The compound 6-gingerol has been studied as a major contributor towards preventing obesity in the past, and since then, 6-shogaol has even been shown to inhibit lipid accumulation and inhibit adipogenesis, the accumulation of adipocytes as adipose tissue throughout the body. This adipose tissue is primarily used by the body for storing fat, which in excess leads to obesity. A study conducted by the National University of Seoul proposed that another bioactive component of ginger, gingernone A (Figure 3), had a greater inhibitory effect on adipogenesis, and was more effective at reducing dietary induced obesity with minimal downsides. The en-vitro study of mice fed high fat diets concluded that groups of mice receiving gingernone A supplements of 50mg/kg had overall lower body weights compared to the control group (30.82g compared to 33.87g). When put on these high fat diets, it was found that the adipocytes in the mice swelled in size, and that treatment with gingernone A inhibited this growth, stabilizing the adipocyte size. However, decrease in adipose tissue can result in lipodystrophy, an abnormal settling of lipids and free fatty acids. It was further found that groups treated with gingernone A had significantly lower levels of free fatty acids and concluded that supplementation with gingernone A was unlikely to trigger lipodystrophy.
Whereas in fresh ginger there is an abundance of gingerols that decrease in concentration as ginger is processed, shogaols and gingernone A have been found to increase. Despite this, it is believed that fresh ginger has just as potent of an effect in reducing obesity, and that the major contributors in reducing obesity in processed ginger are the enriched shogaols and gingernone A [23].
2. Materials and Methods
2.1. Materials and Instrumentation
Chemical reagents included: Thermo Fischer Scientific™ aluminum chloride (99% extra pure, anhydrous, granules), ethyl alcohol (99% ACS spectroscopic grade), and quercetin hydrate (95%). Potassium acetate (certified ACS Crystalline), Na2CO3 anhydrous (HPLC grade powder), FeCl3 (anhydrous), 37% HCl (certified ACS), chloroform (Reagent ACS), H2SO4 (certified ACS), tannic acid, tetrazolium blue chloride, and glacial acetic acid were all purchased from Fisher Scientific™. Folin and Ciocalteu’s Phenol reagent and gallic acid monohydrate (ACS reagent grade) were purchased from MP Biomedicals™ (Santa Ana, CA). Sodium acetate (Sigma Ultra minimum 99.0%) was purchased from Sigma-Aldrich. Double distilled water was used in all experiments. A Cary60 spectrophotometer was used for all UV/Vis analysis. Conductivity was measured on a Thermo Scientific™ Orion Star A212 benchtop conductometer. pH was measured with a Mettler Toledo™ FiveEasy benchtop pH meter.
2.2. Plant Materials
Five different samples of various juvenile rhizomes (blue ring, Chinese, Indian, yellow, red) harvested on a semi-weekly basis between August 2021 and December 2022 (345 samples) were supplied by project director Dr. Rafat Siddiqui at Virginia State University (VSU) and kept at -20℃ until needed. Fresh (FW) and pre-lyophilized (DW) samples provided by VSU were then extracted and analyzed accordingly. Notably, with the harvest of ginger samples between 2021 and 2022 there was a variation in both sample volume and also harvest time, illustrated in Figure 4.
Aside from the initial harvest date, cultural differences, including applied nutrient fertility variations between years may have had an effect on phytochemical production in ginger plants. It may also be possible that the harvest delay of one month at the end of the summer growing season in year two had a negative effect on phytochemical profiles in ginger rhizomes due to decreasing sunlight or temperature in the mid-Atlantic region. Another possibility is that ginger samples from year two, week one (09/20/2022) are actually representative of phytochemicals present in year one, week seven (09/28/2021), meaning that the data collected for said year two samples would be shifted forward to accommodate for the difference, in accordance with dates provided in Table 1 and Table 2.
2.3. Sample Preparation
Fresh and Dried Ginger samples were grinded using a common kitchen food processor and stored in vials at -20℃ until needed.
2.3.1. Freeze Drying of Fresh Ginger Samples
Chopped samples of fresh ginger were freeze-dried using a Harvest Right Scientific Freeze Dryer model 00514 SCI. Specifications for freeze drying are listed in Table 3.
2.3.2. Extractions in Methanol from Freeze Dried and Fresh Ginger
0.5 grams of fresh or dried ground ginger was measured in an analytical balance, then combined with 25ml of methanol in a round bottom flask. The mixture was then refluxed at a temperature of 60℃ for a period of two hours. Afterwards, the mixture was vacuum filtered, and the supernatant was stored in vials at -20℃ until analysis [24].
2.3.3. Extraction in Ethanol/Water from Freeze Dried and Fresh Ginger
Extraction of phenolic compounds is carried out according to methods described by Sridhar et al. [25] and Zhang et al. [26]. 0.625g of lyophilized ginger or 1.25g of fresh ginger was ground to fine particles and then combined with 25mL of solvent (80% methanol in water) in a round bottom flask. The flask is then attached to a reflux apparatus and stirred for 48 hours at room temperature (Figure 5) before vacuum filtration of the supernatant. The exact mass of ginger used, and the volume of extract obtained was recorded for later use in calculations.
2.4. GC/MS Analysis of Terpenes and Essential Oils
Essential oils and terpenoids were extracted via brief maceration in methanol and filtration of supernatant before analysis. A gas chromatography-mass spectrometer (GC/MS) (Shimadzu GCMS-QP2010 machine with helium as a carrier gas, equipped with standard VF-5 fused silica capillary column (30m × 0.25in. d. mm, film thickness 0.25 μm) configured with a Flow rate of 1mL/min at 8.2317psi, and temperature ramp of 3℃/min until reaching final temperature of 240℃ was utilized to generate chromatographs for freeze-dried extracts in the determination of present terpenes and essential oils.
GC/MS chromatograms were taken for lyophilized samples throughout maturity. Chromatograms were integrated such that identified compounds had more than 90% match in similarity based on m/z ratio, and the base area was no less than 400,000.
2.5. Conductivity and pH Measurements
Conductivity was measured via a Thermo Scientific™ Orion Star A212 benchtop conductometer.
pH experiments were conducted on a Mettler Toledo™ FiveEasy benchtop pH meter. Before measurement, the instrument underwent a three-point calibration at pH 7, 10, and 4.01.
2.6. Phtochemical Screening
The phytochemical screening of ginger samples was carried out according to methods described by Kela et al. [27].
2.6.1 Alkaloids
A few drops of Wagner’s reagent were added to 3ml of plant extract along the sides of test tube. Formation of reddish-brown precipitate confirmed the presence of Alkaloids.
2.6.2. Flavonoids
0.5g of ginger powder was mixed with water in a test tube and shaken, then combined with a few drops of NaOH. formation of intense yellow color which becomes colorless on further addition of diluted Hydrochloric acid indicated the presence of flavonoids.
2.6.3. Tannins
0.5g of ginger powder was mixed with 20ml of water in a test tube and heated. The mixture was filtered, and 0.1% ferric chloride was added. The appearance of brownish green coloration indicates the presence of tannins.
2.6.4. Saponins
0.5g of ginger powder was mixed with water in a test tube and heat. A few drops of olive oil were added and shaken. The formation of soluble emulsion indicated the presence of Saponins.
2.6.5. Glycosides
100mg ginger extract was combined with 1ml of glacial acetic acid containing one drop of ferric chloride solution. After the addition of 1ml of concentrated sulfuric acid, a brown ring on the surface indicated the presence of deoxy-sugars characteristic of cardenolides.
2.6.6 Steroids
0.5g of ginger powder was dissolved in 2ml of Chloroform and a few drops of sulfuric acid were added to form a lower layer. Formation of a reddish-brown color indicated the presence of steroids.
2.6.7. Anthraquinones
0.5g of ginger powder was combined with 5ml of chloroform and subsequently shaken for 5minutes. Following filtration, the solution was shaken with an equal volume of 100% ammonia solution. A pink-violet or red color in the ammonia lower layer indicated the presence of free anthraquinones.
2.6.8. Phenols
50mg of ginger powder was dissolved in 5 ml of distilled water and 2 ml of 1% solution of Gelatin containing 10% NaCl was added to it. White precipitate indicated the presence of phenol compounds.
2.6.9. Oxalates
5ml of ginger extract was combined with 1ml of concentrated sulfuric acid. After an hour, two drops of potassium permanganate.
2.7. Phytochemical Analysis of Ginger
2.7.1. Total Flavonoid Content
Quantitative measurements of flavonoids were done spectrophotometrically using quercetin as a standard. This procedure utilizes aluminum chloride (AlCl3) dissolved in ethanol to help develop the color. The AlCl3 is added to ethanol because it can fully dissolve while evading a violent reaction, as opposed to AlCl3 in water. In the reaction of the dissolved AlCl3 with a flavonoid, an ion complexing occurs with the formation of a 5-hydroxy-4-keto system. The aluminum ion gives the empty orbital (p, d, and f) and the flavonoid donates the electronic pair exemplifying a donor/acceptor bond. This complex exhibits a yellow color with a maximum absorbance (λ max) at 415 nm.
Flavonoids were determined by following standard procedures for colorimetric analysis of plant material outlined by Woisky et al. [28] and Chang et al. [29]. The standard calibration was created using quercetin solutions (20-400mg/L R2=0.9988), and is depicted in Figure 6. To a small vial, 200μL of liquid sample was combined with 600μL of 95% ethanol in water, 40μL of 1M potassium acetate, and 40μL of 10% w/v aluminum chloride. After a brief incubation period, 1120μL of distilled water is added to the vial, and the sample was left to incubate at room temperature for 30 minutes. The absorbance was then measured at 415nm, and the Total Flavonoid Concentration (TFC) in mg of Quercetin equivalent (QE)/g of Dry Weight (DW) or Fresh Weight (FW) was then determined using the following equation:
where A = average absorbance, V = collected volume pf extract, m = mass of sample used for extract, and DF = dilution factor.
TFC = (A ∙ V) / (4.9 ∙ 100 ∙ m) ∙ DF
2.7.2. Total Polyphenols Content
Polyphenols are a class of secondary metabolites that encompass most hydrophilic metabolites. The aforementioned measurement methods fall under the measurement of total polyphenols due to the presence of multiple phenol groups. “Phenols” are a chemical functional group containing a benzene ring with an –OH group attached and “poly” meaning more than one. The Folin–Ciocalteu (FC) assay employed is used to determine the reducing power of an antioxidant and equates that to the total polyphenolic content of the sample. Folin−Ciocalteu phenol reagent consists of a mixture of the heteropoly acids, phosphomolybdic and phosphotungstic acids, in which the molybdenum and tungsten are in the 6+ state. The reagent is yellow. On reduction with certain reducing agents, the so-called molybdenum blue and tungsten blue is formed, in which the mean oxidation state of the metals is between 5 and 6 [30,31].
The FC assay is based on the oxidation of phenol compounds in a carbonate solution with a molybdotungstophosphate heteropolyanion reagent (3H2O-P2O5-13WO3-5MoO3-10H2O), yielding a blue colored product. The working pH of the assay is around pH 10 or 11, therefore, most phenolic compounds are in dissociated forms as conjugate bases – mainly phenolate anions – and can be more easily oxidized with the FC reagent [32,33]. In alkaline solution, molybdates are reduced to molybdenum blues – mixed Mo (VI)-Mo(V) oxides. The molybdenum center in the complex reagent is reduced from Mo (VI) to Mo(V) with an electron donated by an antioxidant to produce a blue color [32]. Measuring a total phenolic content is an estimation of the concentration of phenolic compounds as opposed to the specific quantification of phenolic species present as would be observed in analysis by HPLC. Using gallic acid as the standard, the λ max is observed at 750 nm and results are expressed as gallic acid equivalents (GAE).
Polyphenols were determined by following standard procedures for colorimetric analysis of plant material [34,35,36,37,38,39]. The standard calibration was created using gallic acid solutions (50-500mg/L R2=0.9994) and is depicted in Figure 7. To a small vial, 20μL of liquid sample was combined with 1580μL of distilled water, then 100μL of Folin-Ciocalteu’s reagent was added and the mixture was left to incubate for five minutes at room temperature. Afterwards, 300μL of 20% w/v sodium carbonate solution was added, and the samples were place in an oven to develop for 30 minutes at 40℃. The absorbance was then measured at 765nm and the Total Polyphenol Concentration (TPC) in mg of gallic acid equivalent (GAE)/g of Dry Weight (DW) or Fresh Weight (FW) was then determined using the following equation:
Where A = average absorbance, V = collected volume of extract, m = mass of sample used for extract, and DF = dilution factor
TPC = (A ∙ V) / (4.9 ∙ 100 ∙ m) ∙ DF
2.7.3. Analysis of Tannins
Tannins were determined by following standard procedures for colorimetric analysis of plant material [40,41,42]. The standard calibration was created using tannic acid solutions (50-500mg/L R2=0.9987) and is depicted in Figure 8. To a small vial, 300μL of liquid sample was combined with 100μL of 0.01M tetrazolium blue chloride, and 100μL of 0.2M sodium hydroxide solution. Following a brief incubation period, the samples were then combined with 1500μL of 80% ethanol in water and the absorbance was measured at 527nm. The Total Tannin Concentration (TTC) in mg of tannic acid equivalent (TAE)/g of Dry Weight (DW) or Fresh Weight (FW) was then determined using the following equation:
Where A = average absorbance, V = collected volume of extract, m = mass of sample used for extract, and DF = dilution factor
TTC = (A ∙ V) / (4.9 ∙ 100 ∙ m) ∙ DF
2.8. Determination of Cations by ICP/MS
2.5 mg of desired samples were placed into Mars-6 microwave digestion tubes along with 10 mL of Nitric acid. The Mars-6 Digester was configured for plant material samples and set to run for 1 hour. Samples were then removed from the holster and transferred to 50 mL vials which were then diluted to 50mL total volume using DI water. Samples were finally transferred to 15 mL vials before analysis of calcium, potassium, iron, selenium, copper, sodium, cobalt, and manganese via ICP/MS.
2.9. Statistical Analysis and Limits of Detection
The limit of detection for flavonoids was measured using a guideline produced by the Clinical and Laboratory Standards Institute and examples provided by Ervin and Kariuki [43]. The quercetin stock solution in 95% ethanol was prepared in triplicate with a concentration of 1500mg/L measured against a blank of 95% ethanol. The sample was serially diluted by a factor of two until the absorbance measurements did not change. The final concentration was defined as the limit of detection for flavonoids. Absorbance was measured at 510 nm, as shown in Figure 9.
For the limit of detection for polyphenols, The Gallic Acid stock solution in 20% ethanol was prepared in triplicate with a concentration of 1000mg/L measured against a blank of distilled water. The sample was serially diluted by a factor of two until the absorbance measurements did not change. The final concentration was defined as the limit of detection for polyphenols. Absorbance was measured at 765 nm, as shown in Figure 10.
For the limit of detection for tannins, The Tannic Acid stock solution in 20% ethanol was prepared in triplicate with a concentration of 1500mg/L measured against a blank of distilled water. The sample was serially diluted by a factor of two until the absorbance measurements did not change. The final concentration was defined as the limit of detection for tannins. Absorbance was measured at 527 nm, as shown in Figure 11.
The standard deviations were calculated for all experiments using the three triplicate sets of results collected under each experimental condition. One way ANOVA was performed to verify statistical significance of results within the 95% confidence limit.
3. Results and Discussion
3.1. Phytochemical Screening Results
Overall, the ginger samples exhibited similar or even identical phytochemical compositions at first glance (Table 4). Observed differences between samples may be influenced by ginger type, as well as suitability of the extraction method for the screening assay.
3.2. Phytochemical Analysis Results
Due to the aforementioned differences in sample volume and harvest date between years, analysis of ginger was consolidated to the first 15 weeks.
3.2.1. Measured Phenolic Content
Figure 12 and Figure 13 exemplify how time in both the short term and long term can influence the concentration of vital antioxidants, including overall phenolic content across the 15-week cultivation period for Year one (Y1) and Year two (Y2) ginger samples.
With total phenolic content, there were two main trends that emerged: peak phenolics between weeks one and three, and peak phenolics between weeks five and nine. The former is characteristic of Y2 samples, and the latter of Y1. Peak phenolic content was observed by the seventh week for yellow ginger in the first year, and for the first week of Indian ginger in the second year. While overall concentrations in Y1 were substantially higher than in Y2, they share a similarity in that after nine weeks, the lowest phenolic contents were observed. This major inconsistency supports the distinction of harvest dates established in Figure 4, further suggesting that Y2 samples may be representative of later stages of Y1 ginger, as the downward trend of Y2 is reminiscent of the downward trend present in Y1 following week seven.
3.2.2. Measured Flavonoid Content
Figure 14 and Figure 15 show the relationship between time and flavonoid concentration across the 15-week cultivation period for Y1 and Y2 ginger samples.
Major disparities observed with total phenolic content between years became exacerbated with total flavonoid content. Individually, the trends for year one and two in flavonoid content match up well with trends observed in phenolic content for the same year respectively; peak flavonoids between weeks one and nine, and steady decline onwards. When directly comparing Y1 and Y2 however there is up to a five-fold increase in flavonoid content from Y2 ginger to Y1 ginger. This can once again be attributed to the difference in harvest dates, as previously mentioned in Figure 14.
3.2.3. Measured Tannin Content
Figure 16 and Figure 17 illustrate the changes in tannin content across the 15-week cultivation period for Y1 and Y2 ginger samples.
Finally, in total tannin content, the gap between Y1 and Y2 was significantly lowered. Major standouts of the Y1 harvest, like blue ring, Indian, and Chinese ginger, all showed great potential in the following year, while yellow ginger greatly diminished. Once again, emergent trends of previous assays for each respective year remained consistent.
3.3. Measured Conductivity and pH Content
3.3.1. Conductivity Results
Conductivity serves as a useful precursor to individual cation analysis. By analyzing the relative number of conductive components in our ginger samples, we can have a greater understanding of what to expect with further ICP/MS analysis. Changes in conductivity between the two years, 15 weeks, and differences between each variety of ginger can be observed in Figure 18 and Figure 19.
3.3.2. Measured pH Results
pH serves as yet another measurement of change and difference between our ginger samples. Changes in pH between the two years, 15 weeks, and differences between each variety of ginger can be observed in Figure 20 and Figure 21.
pH across all varieties and time periods remained relatively consistent in all analyzed ginger samples. Outside of small variations, ginger from week one to week 15 maintained a steady pH of roughly 7.0.
3.4. Effect of Maturity on Mineral Content
Following the analysis of conductivity, results for cation analysis via ICP/MS for DW Y2 ginger are presented in Table 5 and briefly illustrated in Figure 22 and Figure 23. Certain weeks of maturity were omitted due to a lack of sufficient sample volume for analysis. Additionally, FW samples were not selected for analysis, and Y1 sample data were excluded due to a change in analysis methodology.
It can be noted from Figure 22 and Figure 23 that young ginger samples did see substantially higher concentrations of various analytes, namely: calcium, copper, potassium, magnesium, and zinc. This increase in concentration was found to be up to 100% in the case of magnesium in blue ring ginger, and as low as 0% for sodium in the same blue ring samples. These differences in cation composition further reinforce the claim of greater potential in young ginger samples to their adult counterparts.
3.5. Effect of Maturity on Essential Oil and Terpene Content
Qualitative GC/MS analysis proved to be an effective means of determining relative abundance of various volatile components in our ginger samples, mostly terpenes, terpenoids, and essential oils, as shown in Figure 24. For illustrative purposes, Chinese ginger was selected to represent essential oil and terpene content for all ginger varieties. By comparing each week of maturity with one another, discrepancies in bioactive compounds became more apparent, as shown in Figure 25. For the scope of this project, FW samples were not selected for analysis, and Y1 sample data was excluded due to a change in analysis methodology. Additionally, data for blue ring and yellow ginger was omitted due to changes in analysis methodology.
Figure 25, Figure 26 and Figure 27 illustrate the observed changes in essential oils throughout maturity and across different varieties of ginger. Interestingly, primary compounds of interest, such as gingerol and shogaol, have varying concentrations based on variety, with Indian ginger showing greater potency in later stages of maturity, and an inverse of potency as seen in red ginger. Chinese ginger maintained relatively high levels of both compounds regardless of maturity, except for week 13, which was found to have the lowest concentration. Additional information regarding the various essential oils and terpenes can be found in Table 6, and isolated chromatograms for the presented samples can be found in the supplemental data.
The combination of the above chromatograms and information regarding the significance of the various compounds present in the ginger samples provides a strong foundation for future quantitative analysis of selected compounds with known standards.
4. Conclusions
In conclusion, young ginger did prove to be more potent in antioxidants than adult ginger, however, a conclusive peak of antioxidants and “best” variety are still to be determined. Until a conclusive redesign of the cultivation experiment is conducted, it can be assumed that Y2 samples of ginger advanced seven weeks when superimposed onto the Y1 data, in which case, the conclusive peak of antioxidants would be seven weeks, and both observed trends for Y1 and Y2 would be in accordance with one another. Non-antioxidant assays of pH, conductivity, GC/MS, and ICP/MS showed marginal to substantial differences between ginger as a result of variety or time, which may shift the focus of future analysis towards pure assessments of antioxidants and mass spectrometry.
Supplementary Materials
The following supporting information can be downloaded at the website of this paper posted on Preprints.org, Figure S1: Y1 blue ring ginger phenolics; Table S2: Y2 blue ring ginger phenolics; Table S3: Y1 yellow ginger phenolics; Table S4: Y2 yellow ginger phenolics; Table S5: Y1 Chinese ginger phenolics; Table S6: Y2 Chinese ginger phenolics; Table S7: Y1 Indian ginger phenolics; Table S8: Y2 Indian ginger phenolics; Table S9: Y2 red ginger phenolics; Table S10: Y1 blue ring ginger flavonoids; Table S11: Y2 blue ring ginger flavonoids; Table S12: Y1 yellow ginger flavonoids; Table S13: Y2 yellow ginger flavonoids; Table S14: Y1 Chinese ginger flavonoids; Table S15: Y2 Chinese ginger flavonoids; Table S16: Y1 Indian ginger flavonoids; Table S17: Y2 Indian ginger flavonoids; Table S18: Y2 red ginger flavonoids; Table S19: Y1 blue ring ginger tannins; Table S20: Y2 blue ring ginger tannins; Table S21: Y1 yellow ginger tannins; Table S22: Y2 yellow ginger tannins; Table S23: Y1 Chinese ginger tannins; Table S24: Y2 Chinese ginger tannins; Table S25: Y1 Indian ginger tannins; Table S26: Y2 Indian ginger tannins; Table S27: Y2 red ginger tannins; Table S28: Y1 ginger pH; Table S29: Y2 ginger pH; Table S30: Y1 ginger conductivity; Table S31: Y2 ginger conductivity; Table S32: Concentration of various cations/100g of respective ginger; Table S33: Polyphenol limit of detection; Table S34: Flavonoid limit of detection; Table S35: Tannin limit of detection; Figure S1: Chinese ginger chromatogram week 1; Figure S2: Chinese ginger chromatogram week 2; Figure S3: Chinese ginger chromatogram week 3; Figure S4: Chinese ginger chromatogram week 5; Figure S5: Chinese ginger chromatogram week 7; Figure S6: Chinese ginger chromatogram week 9; Figure S7. Chinese ginger chromatogram week 11; Figure S8. Chinese ginger chromatogram week 13; Figure S9. Chinese ginger chromatogram week 15.
Author Contributions
Conceptualization, V.V.V. and A.G.R.; methodology, B.S., V.V.V., and A.G.R.; validation, B.S.; formal analysis, B.S., K.S., and S.L.; resources, V.V.; data curation, V.V.V. and A.G.R.; writing—original draft preparation, B.S.; writing—review and editing, S.L.; visualization, B.S.; supervision, V.V.V.; project administration, V.V.; funding acquisition, V.V. All authors have read and agreed to the published version of the manuscript.
Funding
This research was funded by USDA-NIFA CBG grant number 2021-38821-34601 and USDA-NIFA CBG grant number 2024-38821-42106.
Acknowledgments
We would like to thank William Weaver for help in instrumental lab maintenance, the late Rafat Siddique of Virginia State University (VSU), the original PI of the grant at VSU, who suddenly left this world, Dr. Theresa Nartea for helping with the VSU part of the project, and collaboration
Conflicts of Interest
The authors declare no conflicts of interest
Abbreviations
The following abbreviations are used in this manuscript:
| ACS | American Chemical Society |
| AI | Artificial Intelligence |
| ℃ | Degrees Celsius |
| DF | Dilution Factor |
| DI | Deionized Water |
| DNA | Deoxyribonucleic Acid |
| DW | Dry (pre-lyophilized) Weight |
| FC | Folin-Ciocalteu’s |
| FW | Fresh Weight |
| g | Grams |
| GAE | Gallic Acid Equivalents |
| GC/MS | Gas Chromatography-Mass Spectrometer |
| HDL | High-Density Lipoproteins |
| HPLC | High Performance Liquid Chromatography |
| ICP/MS | Inductively Coupled Plasma Mass Spectrometry |
| kg | Kilograms |
| L | Liter |
| LDL | Low-Density Lipoproteins |
| mg | Milligrams |
| Min | Minutes |
| mL | Milliliter |
| mm | Millimeter |
| nm | Nanometer |
| psi | Pound per Square Inch |
| QE | Quercetin Equivalent |
| RNA | Ribonucleic Acid |
| TAE | Total Flavonoid Concentration |
| TTC | Total Tannin Concentration |
| TPC | Total Polyphenol Concentration |
| μL | Microliter |
| μm | Micrometer |
| VSU | Virginia State University |
| Y1 | Year 1 |
| Y2 | Year 2 |
References
- Ogbuewu, I.P.; Jiwuba, P.D.; Ezeokeke, C.T.; Uchegbu, M.C.; Okoli, I.C.; Iloeje, M.U. Evaluation of Phytochemical and Nutritional Composition of Ginger Rhizome Powder. Int’l Journal of Agric. and Rural Dev 2014, 17, 1663–1670. [Google Scholar]
- Rafie, R.; Nartea, T. Growing High Tunnel Ginger in High Tunnels: A Niche Crop with Market Potential. FSHS 2012, 125, 142–143. [Google Scholar]
- Ghasemzadeh, A.; Jaafar, H. Z. E.; Rahmat, A. Optimization Protocol for the Extraction of 6-Gingerol and 6-Shogaol from Zingiber Officinale Var. Rubrum Theilade and Improving Antioxidant and Anticancer Activity Using Response Surface Methodology. BMC Complement. Altern. Med. 2015, 15, 258. [Google Scholar] [CrossRef]
- Dillard, C.J.; German, J.B. Phytochemicals: nutraceuticals and human health. J. Sci. Food Agric. 2000, 80, 1744–1756. [Google Scholar] [CrossRef]
- Hossain, M.A.; Al-Raqmi, K.A.S.; Al-Mijizy, Z.H.; Weli, A.M.; Al-Riyami, Q. Study of total phenol, flavonoids contents and phytochemical screening of various leaves crude extracts of locally grown Thymus vulgaris. Asian Pac. J. Trop. Biomed. 2013, 3, 705–710. [Google Scholar] [CrossRef]
- Harborne, J.B. Introduction to Ecological Biochemistry, 4th ed.; Elsevier: London, UK, 1993. [Google Scholar]
- Gould, K.; Lister, C.; Andersen, Ø.M.; Markham, K.R. Flavonoid functions in plants. In Flavonoids Chemistry, Biochemistry and Applications, 1st ed.; Andersen, O. M., Kenneth, R.M., Eds.; Taylor & Francis Group: Boca Raton, US, 2005; pp. 397–441. [Google Scholar] [CrossRef]
- Perveen, S. Introductory Chapter: Terpenes and Terpenoids. In Terpenes and terpenoids, 1st ed.; Perveen, S., Al-Taweel, A., Eds.; IntechOpen: London, UK. [CrossRef]
- Steinberg, D.; Parthasarathy, S.; Carew, T.E.; Khoo, J.C.; Witztum, J.L. Beyond cholesterol. Modifications of low-density lipoprotein that increase its atherogenicity. N. Engl. J. Med. 1989, 320, 915–924. [Google Scholar] [CrossRef] [PubMed]
- Wilson, J.D.; Lindsey, C.A. Studies on the influence of dietary cholesterol on cholesterol metabolism in the isotopic steady state in man. J. Clin. Invest. 1965, 44, 1805–1814. [Google Scholar] [CrossRef] [PubMed]
- Rao, A.V.; Sung, M.K. Saponins as anticarcinogens. J. Nutr. 1995, 125, 717S–724S. [Google Scholar] [CrossRef] [PubMed]
- Güçlü-Üstündağ, Ö.; Mazza, G. Saponins: properties, applications and processing. Crit. Rev. Food Sci. Nutr. 2007, 47, 231–258. [Google Scholar] [CrossRef]
- Debnath, B.; Singh, S.; Das, M.; Goswari, S.; Singh, M.K.; Maiti, D.; Manna, K. Role of plant alkaloids on human health: A review of biological activities. Mater. Today Chem 2018, 9, 56–72. [Google Scholar] [CrossRef]
- Diaz-Munoz, G.; Miranda, I.L; Sarori, S.K; de Rezende, D.C.; Diaz, M.A.N. Anthraquinones: an overview. Stud. Nat. Prod. Chem. 2018, 58, 313–338. [Google Scholar] [CrossRef]
- Huang, Q.; Lu, G.; Shen, H.M.; Chung, M.C.M.; Ong, C.N. Anti-cancer properties of anthraquinones from rhubarb. Med. Res. Rev. 2007, 27, 609–630. [Google Scholar] [CrossRef] [PubMed]
- Bakkali, F.; Averbeck, S.; Averbeck, D.; Idaomar, M. Biological effects of essential oils–a review. Food Chem. Toxicol. 2008, 46, 446–475. [Google Scholar] [CrossRef] [PubMed]
- Nerio, L.S.; Olivero-Verbel, J.; Stashenko, E. Repellent activity of essential oils: a review. Bioresour Tech. 2010, 101, 372–378. [Google Scholar] [CrossRef]
- Khanbabaee, K.; van Ree, T. Tannins: classification and definition. Nat. Prod. Rep. 2001, 18, 641–649. [Google Scholar] [CrossRef]
- Costill, D. L. Carbohydrate nutrition before, during, and after exercise. Fed. Proc. 1985, 44, 364–8. [Google Scholar] [PubMed]
- Kalantari, K.; Moniri, M.; Boroumand Moghaddam, A.; Abdul Rahim, R.; Bin Ariff, A.; Izadiyan, Z.; Mohamad, R. A Review of the Biomedical Applications of Zerumbone and the Techniques for Its Extraction from Ginger Rhizomes. Molecules. 2017, 22, 1645. [Google Scholar] [CrossRef]
- Snuossi, M.; Trabelsi, N.; Ben Taleb, S.; Dehmeni, A.; Flamini, G.; De Feo, V. Laurus Nobilis, Zingiber Officinale and Anethum Graveolens Essential Oils: Composition, Antioxidant and Antibacterial Activities against Bacteria Isolated from Fish and Shellfish. Molecules. 2016, 21, 1414. [Google Scholar] [CrossRef]
- Eberle, L.; Kobernik, A.; Aleksandrova, A.; Kravchenko, I. Optimization of Extraction Methods for Total Polyphenolic Compounds Obtained from Rhizomes of Zingiber Officinale. Trends Phytochem. Res. 2018, 2, 37–42. [Google Scholar]
- Suk, S.; Kwon, G. T.; Lee, E.; Jang, W. J.; Yang, H.; Kim, J. H.; Thimmegowda, N. R.; Chung, M.-Y.; Kwon, J. Y.; Yang, S.; Kim, J. K.; Park, J. H. Y.; Lee, K. W. Gingerenone A, a Polyphenol Present in Ginger, Suppresses Obesity and Adipose Tissue Inflammation in High-Fat Diet-Fed Mice. Mol. Nutr. Food Res. 2017, 61, 1700139. [Google Scholar] [CrossRef]
- Akinola, A. A.; Ahmad, S.; Maziah, M. Total Anti-Oxidant Capacity, Flavonoid, Phenolic Acid and Polyphenol Content in Ten Selected Species of Zingiberaceae Rhizomes. Afr. J. Trad. Complement. Altern. Med. 2014, 11, 7. [Google Scholar] [CrossRef] [PubMed]
- Sridhar, A.; Ponnuchamy, M.; Kumar, P. S.; Kapoor, A.; Vo, D.-V. N.; Prabhakar, S. Techniques and Modeling of Polyphenol Extraction from Food: A Review. Environ. Chem. Lett. 2021, 19, 3409–3443. [Google Scholar] [CrossRef] [PubMed]
- Zhang, Q.W.; Lin, L.G.; Ye, W.C. Techniques for Extraction and Isolation of Natural Products: A Comprehensive Review. Chin. Med. 2018, 13, 20. [Google Scholar] [CrossRef]
- Kela, E.; Sogbesan, A. O.; Wakil, U. B. Evaluation of Phytochemical Composition of Ginger Extracts. Fish. Aqua. J. 2021, 12. [Google Scholar]
- Woisky, R. G.; Salatino, A. Analysis of Propolis: Some Parameters and Procedures for Chemical Quality Control. J. Apic. Res. 1998, 37, 99–105. [Google Scholar] [CrossRef]
- Chang; Yang; Wen; Chern. Estimation of Total Flavonoid Content in Propolis by Two Complementary Colorimetric Methods. J. Food Drug Anal. 2002, 10. [Google Scholar] [CrossRef]
- Cotton, F.A.; Wilkinson, G. Advanced inorganic chemistry: a comprehensive text, 4th ed.; Wiley: New York, USA, 1980. [Google Scholar]
- Ikawa, M.; Schaper, T.D.; Dollard, C.A.; Sasner, J.J. Utilization of Folin-Ciocalteu phenol reagent for the detection of certain nitrogen compounds. J. Agric. Food. Chem. 2003, 51, 1811–1815. [Google Scholar] [CrossRef]
- Huang, D.; Ou, B.; Prior, R.L. The chemistry behind antioxidant capacity assays. J. Agric. Food. Chem. 2005, 53, 1841–1856. [Google Scholar] [CrossRef]
- Apak, R.; Güçlü, K.; Demirata, B.; Ozyürek, M.; Celik, S.E.; Bektaşoğlu, B.; Berker, K.I.; Ozyurt, D. Comparative evaluation of various total antioxidant capacity assays applied to phenolic compounds with the CUPRAC assay. Molecules. 2007, 12, 1496–1547. [Google Scholar] [CrossRef]
- Jakobek, L.; Drenjančević, M.; Jukić, V.; Šeruga, M. Phenolic Acids, Flavonols, Anthocyanins and Antiradical Activity of “Nero”, “Viking”, “Galicianka” and Wild Chokeberries. Sci. Hortic. 2012, 147, 56–63. [Google Scholar] [CrossRef]
- Jakobek, L.; Seruga, M.; Medvidovic-Kosanovic, M.; Novak, I. Anthocyanin Content and Antioxidant Activity of Various Red Fruit Juices. Deutsche Lebensmittel-Rundschau 2007, 103, 58. [Google Scholar]
- Wojdyło, A.; Oszmiański, J.; Bober, I. The Effect of Addition of Chokeberry, Flowering Quince Fruits and Rhubarb Juice to Strawberry Jams on Their Polyphenol Content, Antioxidant Activity and Colour. Eur. Food Res. Technol. 2008, 227, 1043–1051. [Google Scholar] [CrossRef]
- Kobus, Z.; Nadulski, R.; Wilczyński, K.; Kozak, M.; Guz, T.; Rydzak, L. Effect of the Black Chokeberry (Aronia Melanocarpa (Michx.) Elliott) Juice Acquisition Method on the Content of Polyphenols and Antioxidant Activity. PLoS One. 2019, 14, e0219585. [Google Scholar] [CrossRef] [PubMed]
- Denev, P.; Kratchanova, M.; Petrova, I.; Klisurova, D.; Georgiev, Y.; Ognyanov, M.; Yanakieva, I. Black Chokeberry (Aronia Melanocarpa (Michx.) Elliot) Fruits and Functional Drinks Differ Significantly in Their Chemical Composition and Antioxidant Activity. J. Chem. 2018, 2018. [Google Scholar] [CrossRef]
- Nowak, D.; Gośliński, M.; Wojtowicz, E. Comparative Analysis of the Antioxidant Capacity of Selected Fruit Juices and Nectars: Chokeberry Juice as a Rich Source of Polyphenols. Int. J. Food Prop. 2016, 19, 1317–1324. [Google Scholar] [CrossRef]
- Amin, A. S. Utilization of Tetrazolium Blue for the Colorimetric Assay of Tannins in Tea. Mikrochim. Acta. 1997, 126, 105–108. [Google Scholar] [CrossRef]
- Antoine; Simon; Pizzi. UV Spectrophotometric Method for Polyphenolic Tannin Analysis. J. Appl. Polym. Sci. 2003, 91, 2729–2732. [Google Scholar] [CrossRef]
- Deshpande, S. S.; Cheryan, M.; Salunkhe, D. K. Tannin Analysis of Food Products. Crit. Rev. Food Sci. Nutr. 1986, 24, 401–449. [Google Scholar] [CrossRef]
- Ervin, E. M.; Kariuki, J. K. Effect of Extraction Method on Antioxidant Determination in Produce by Differential Pulse Voltammetry. Int. J. Electrochem. Sci. 2014, 9, 6235–6245. [Google Scholar] [CrossRef]
Figure 1.
Structure of ginger rhizome (1) Aerial Shoot (2) Internode (3) Adventitious Root (4) Node (5) Bud (6) Scale Leaf.
Figure 1.
Structure of ginger rhizome (1) Aerial Shoot (2) Internode (3) Adventitious Root (4) Node (5) Bud (6) Scale Leaf.
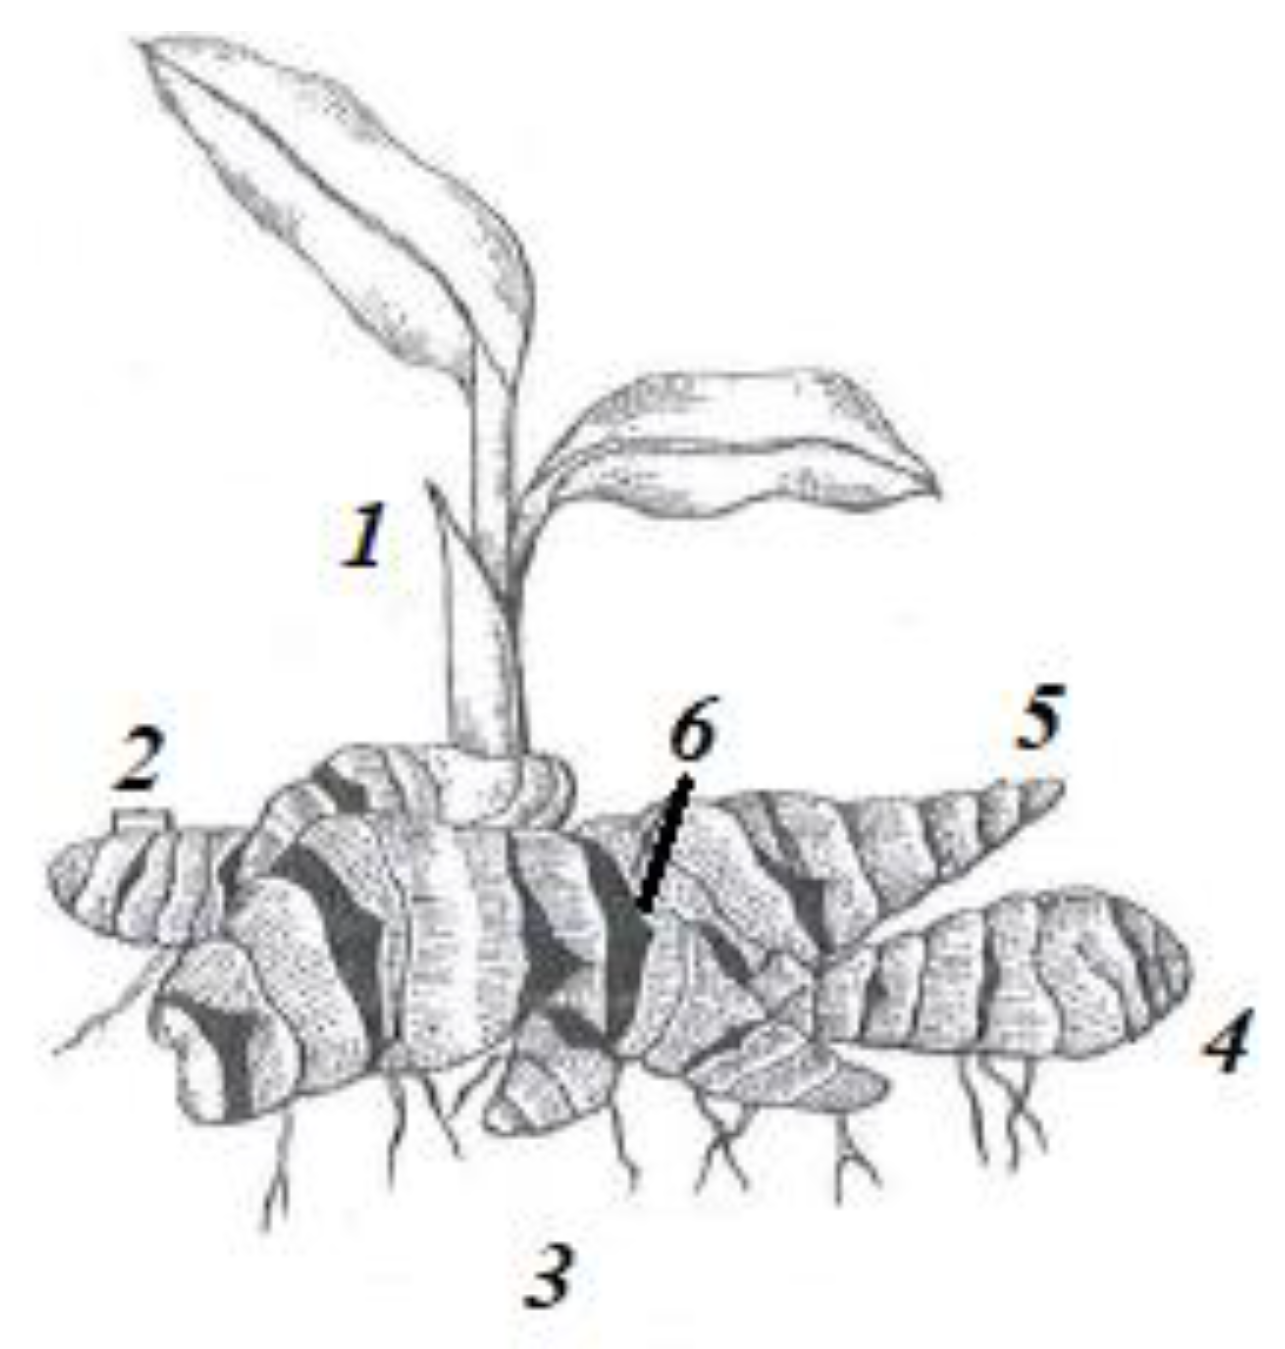
Figure 2.
Chemical structure of various forms of Gingerol, Shogaol, and Zingerone.
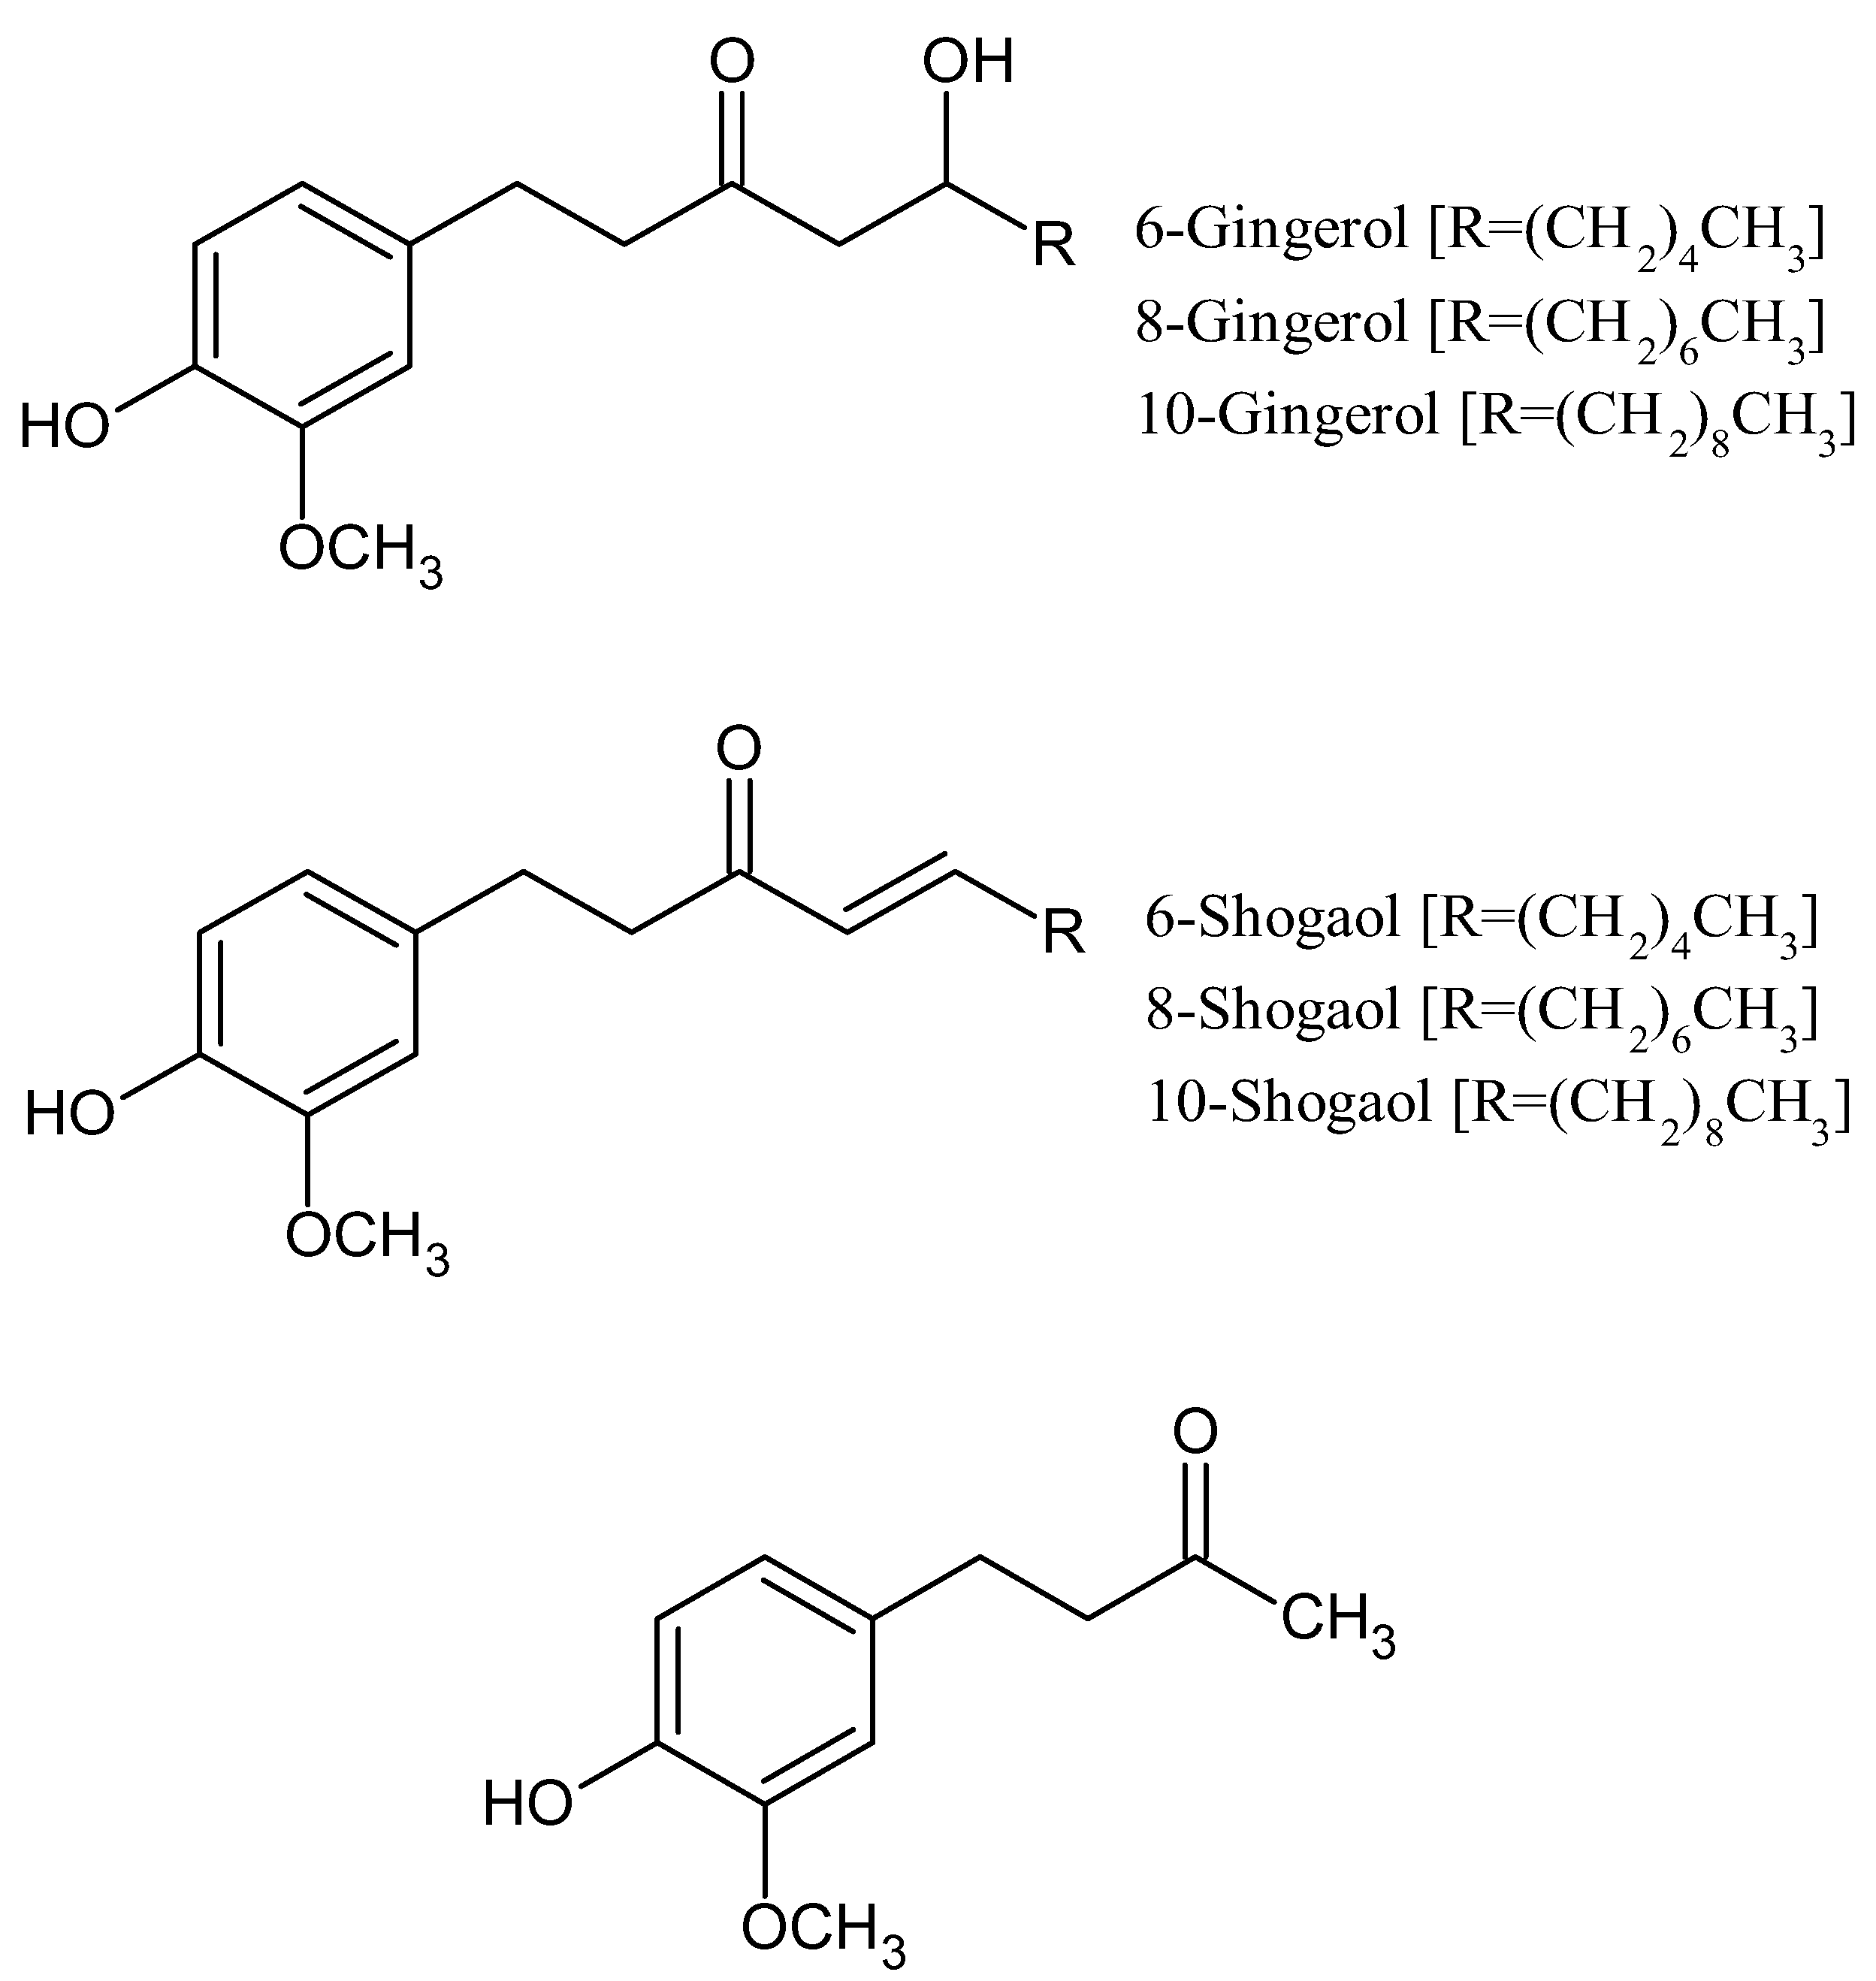
Figure 3.
Chemical structure of gingernone A.
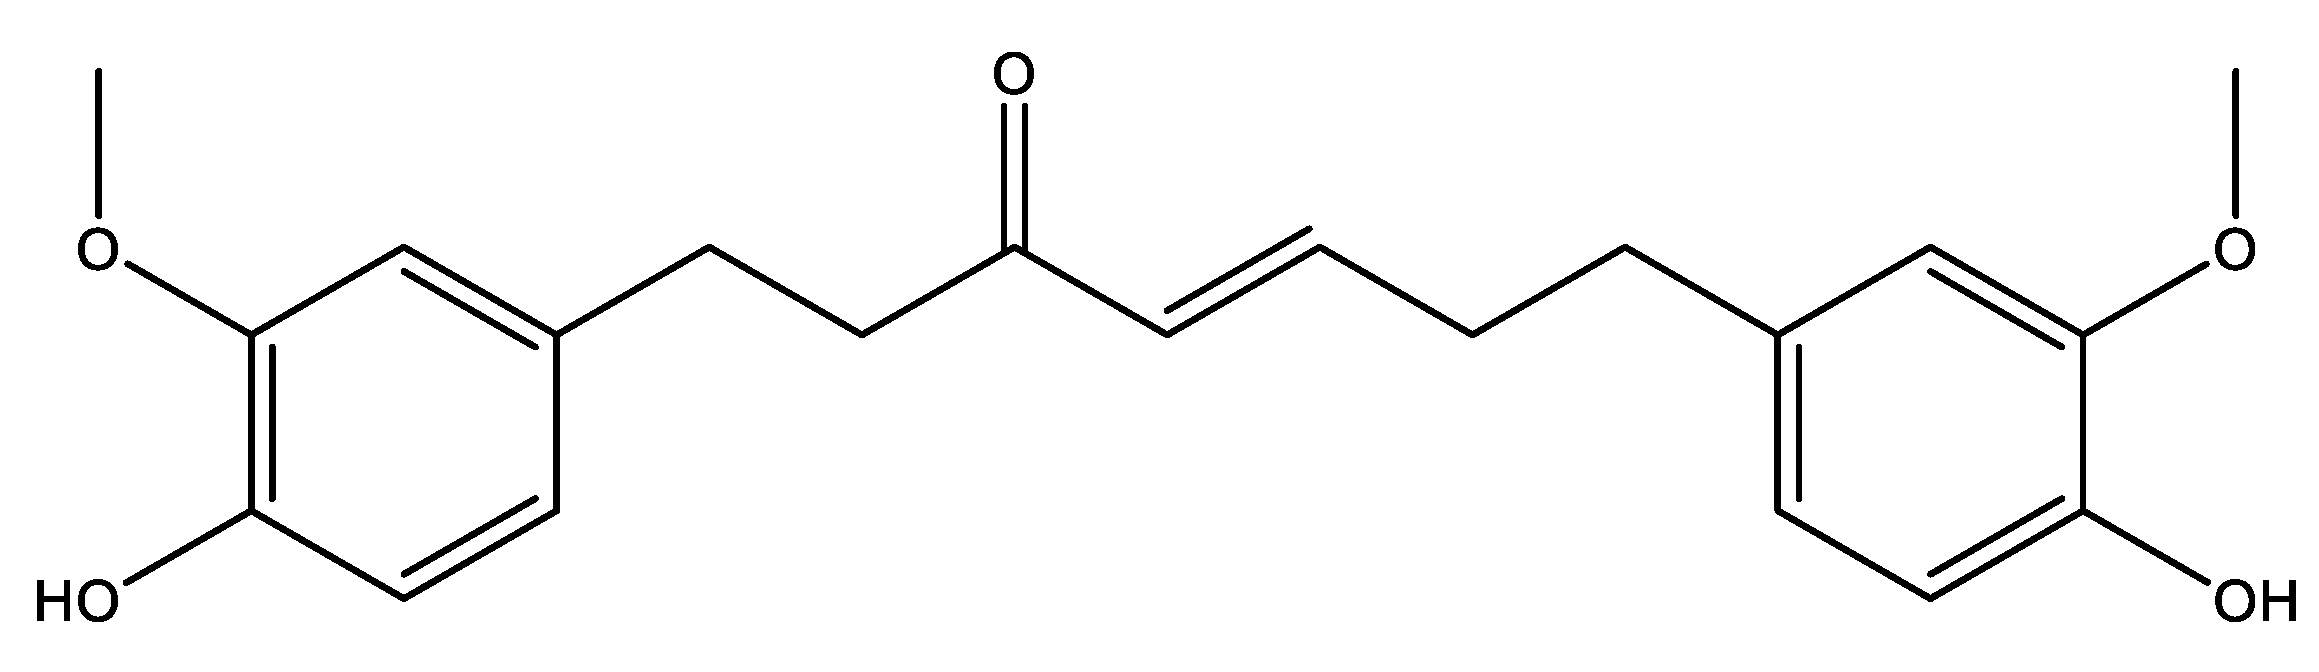
Figure 4.
Harvest delay between year 1 and year 2 ginger.
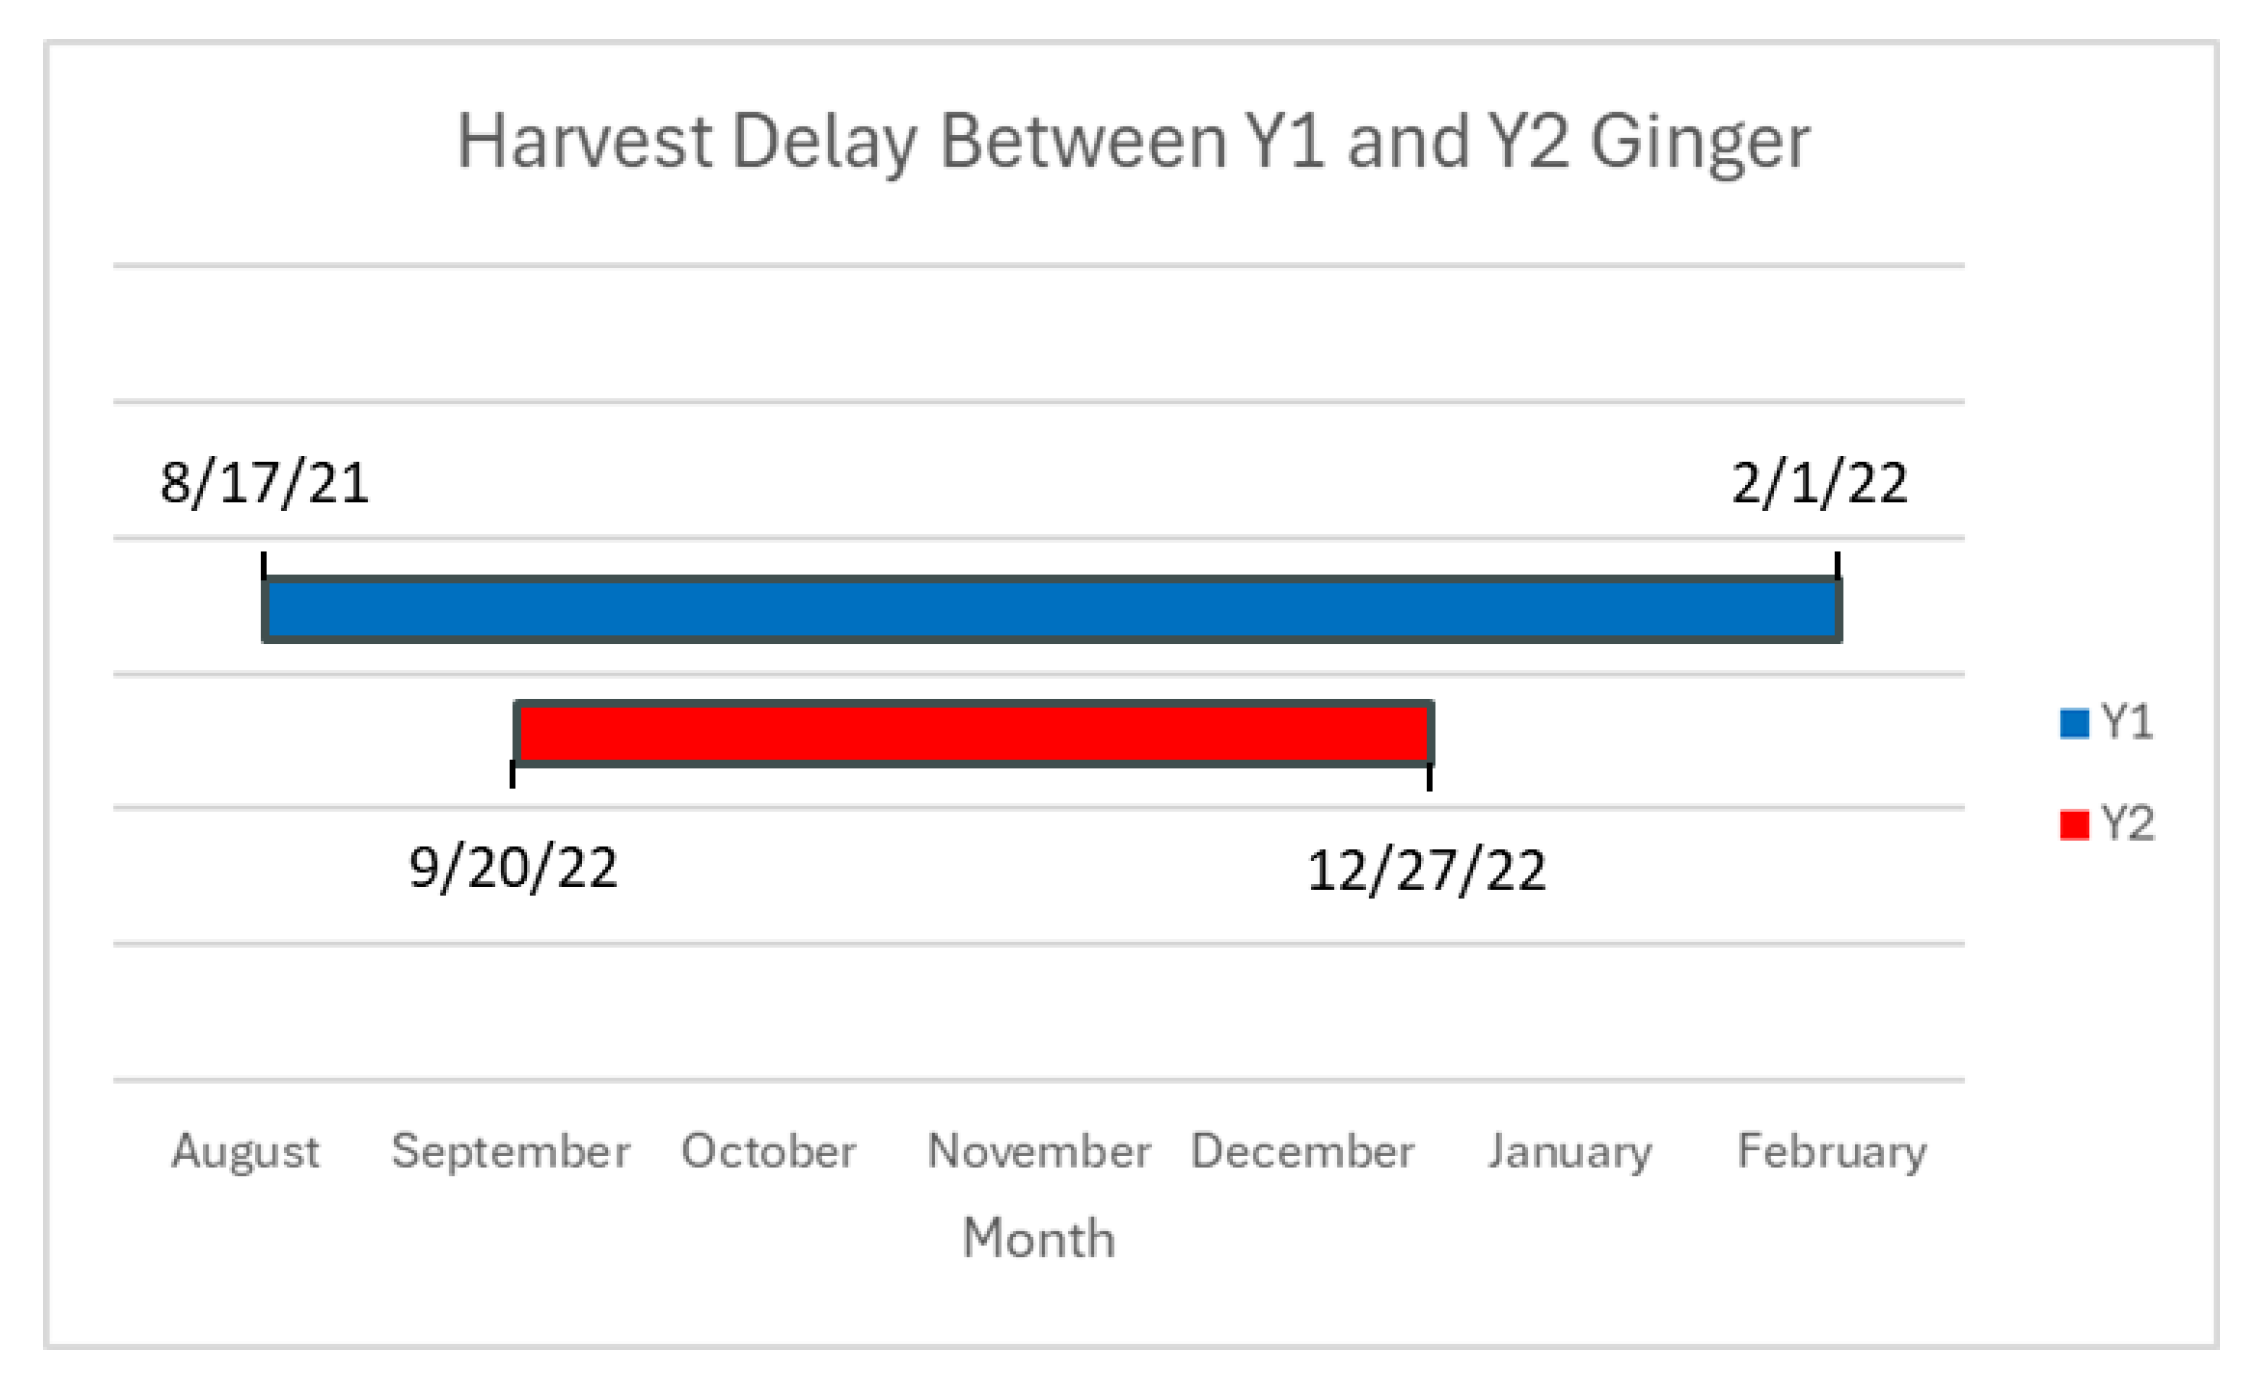
Figure 5.
Diagram of a reflux apparatus.
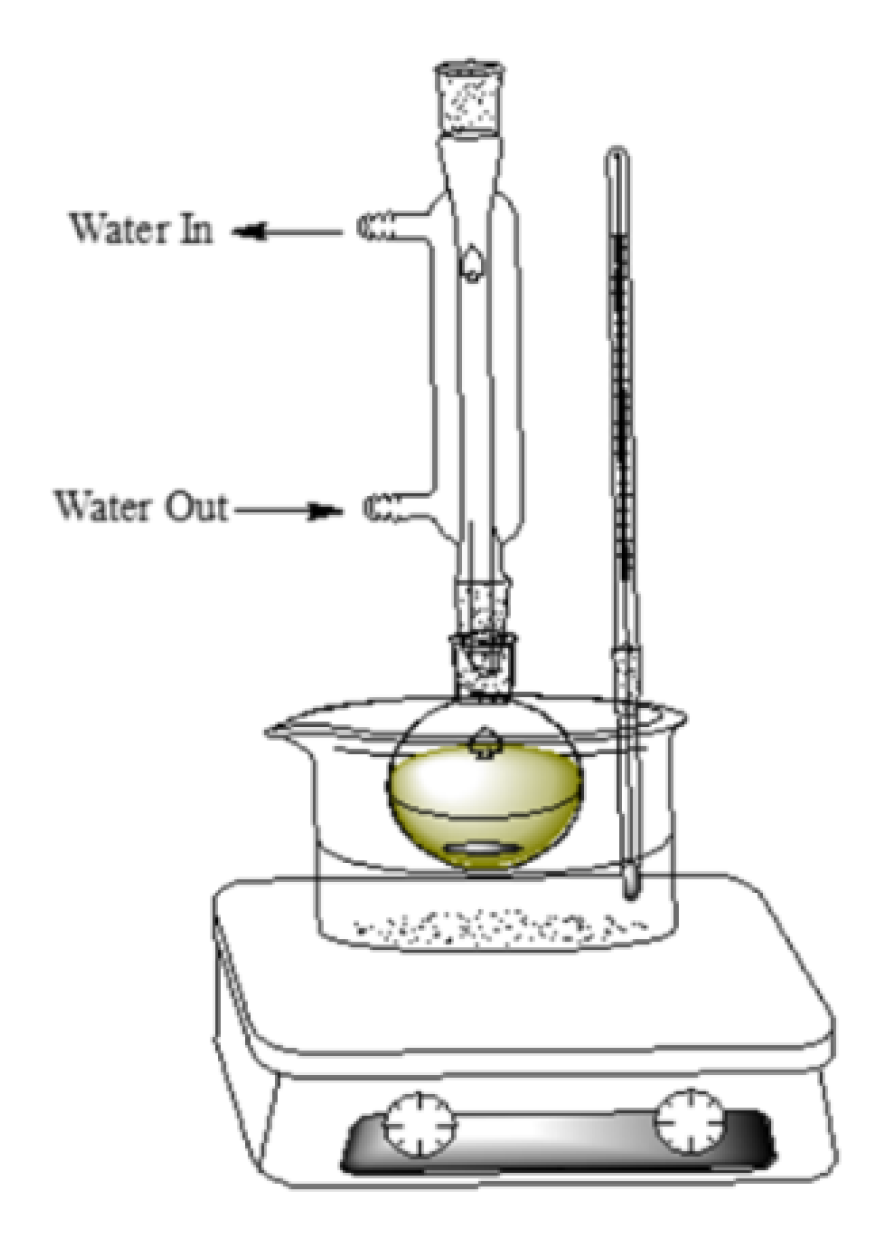
Figure 6.
Quercetin calibration curve.
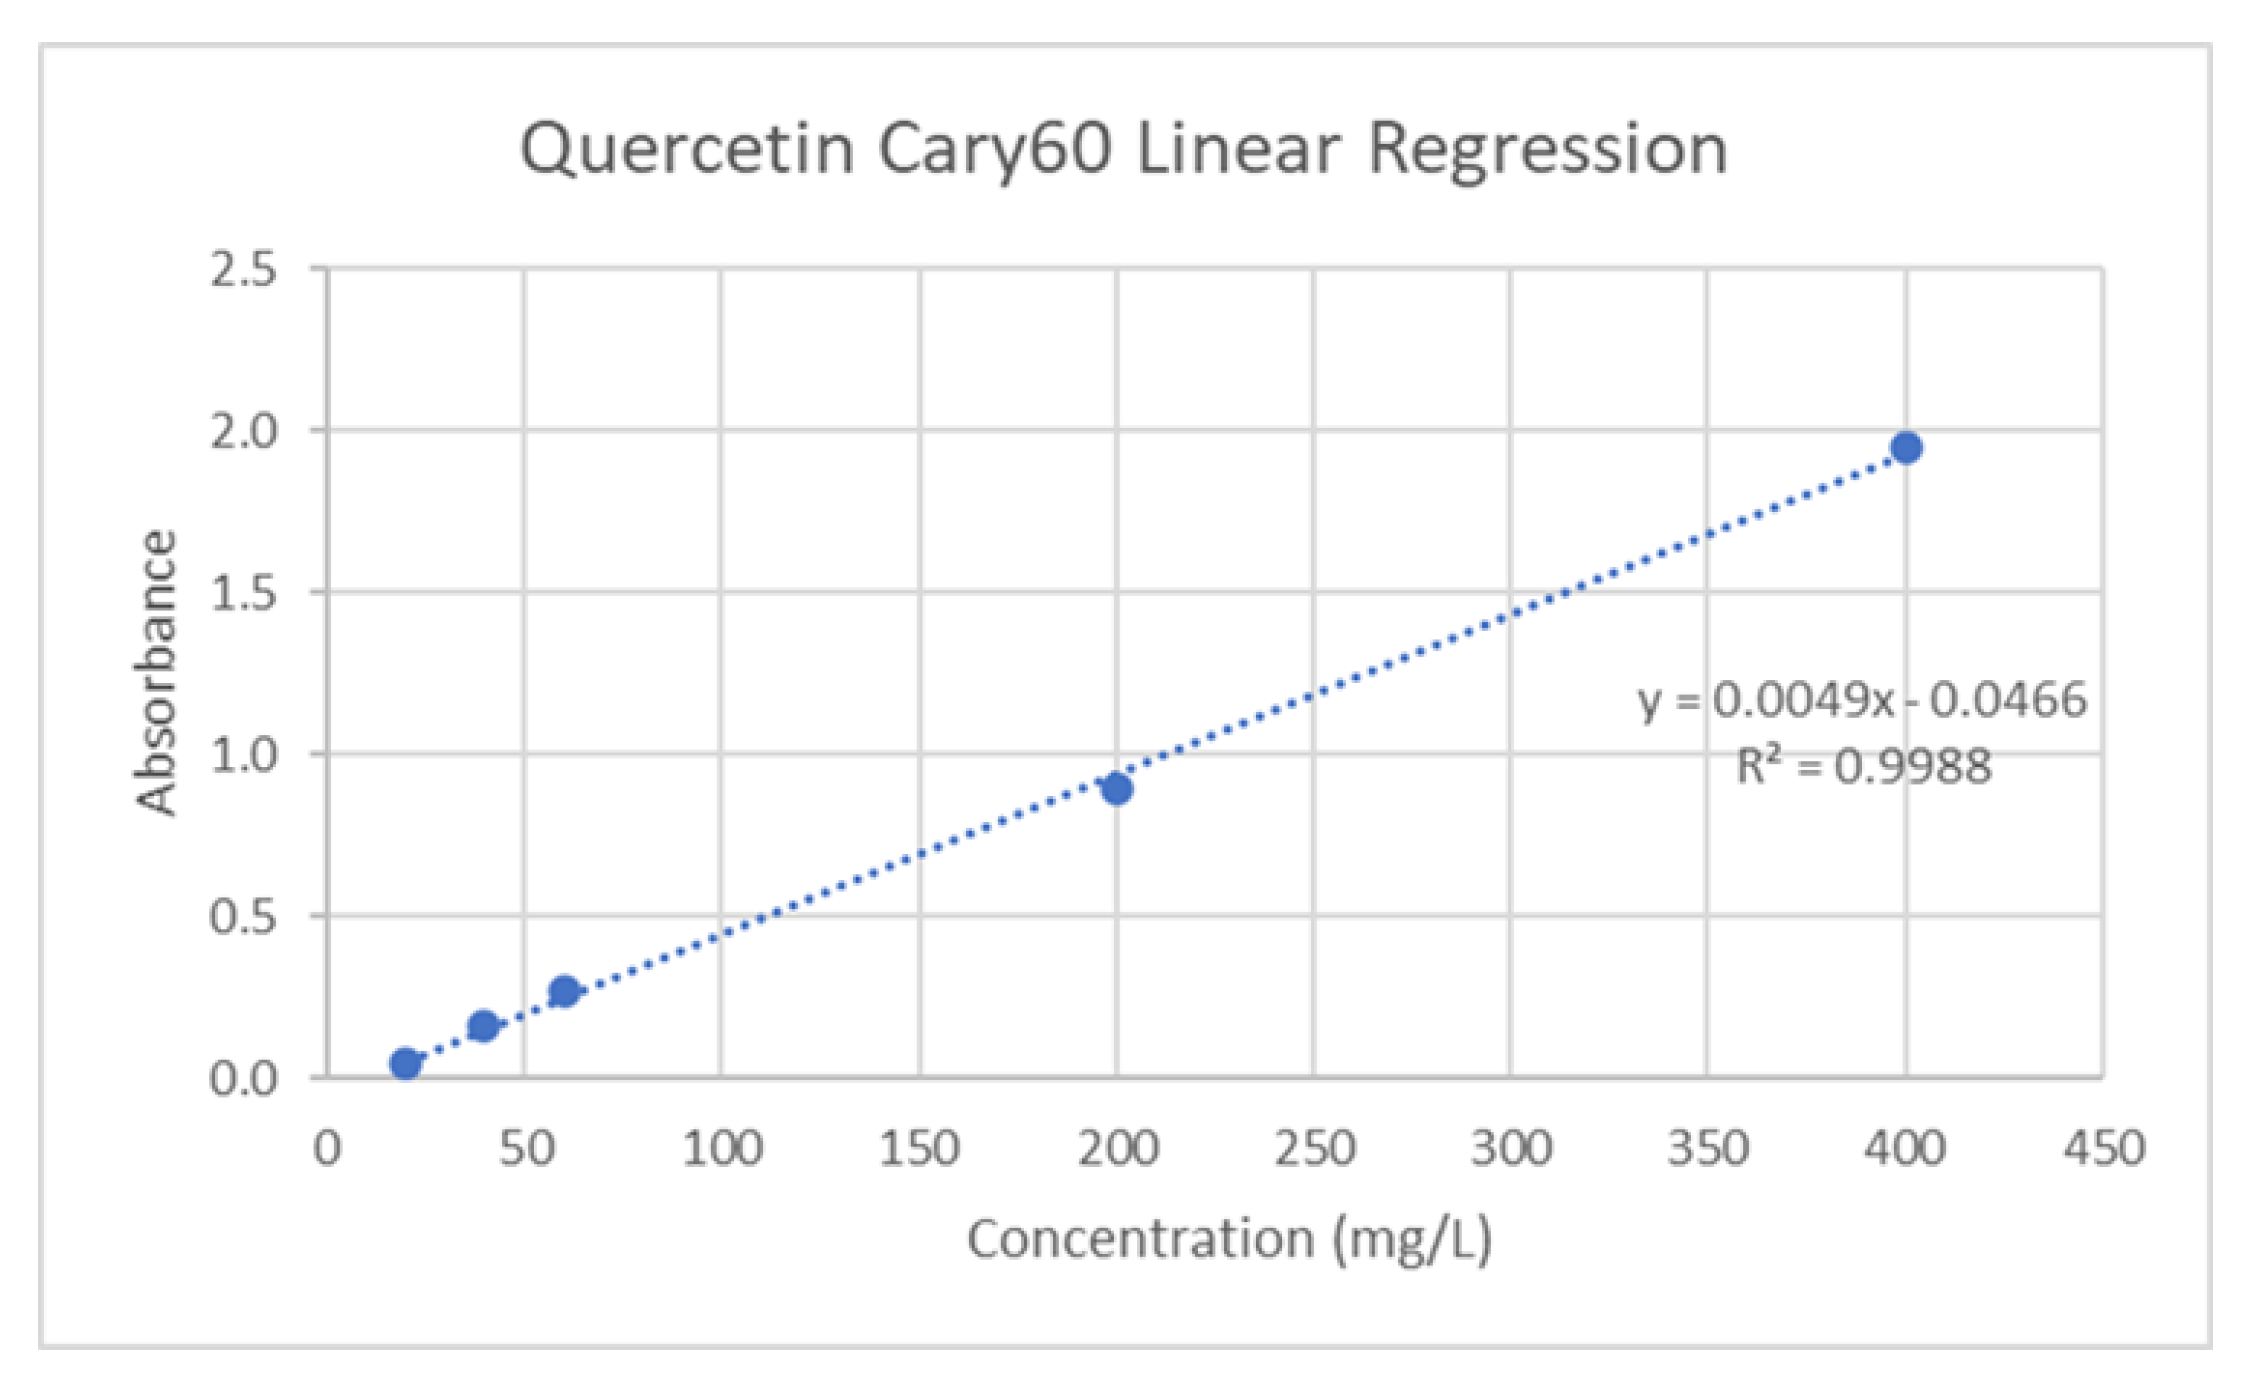
Figure 7.
Gallic Acid calibration curve.
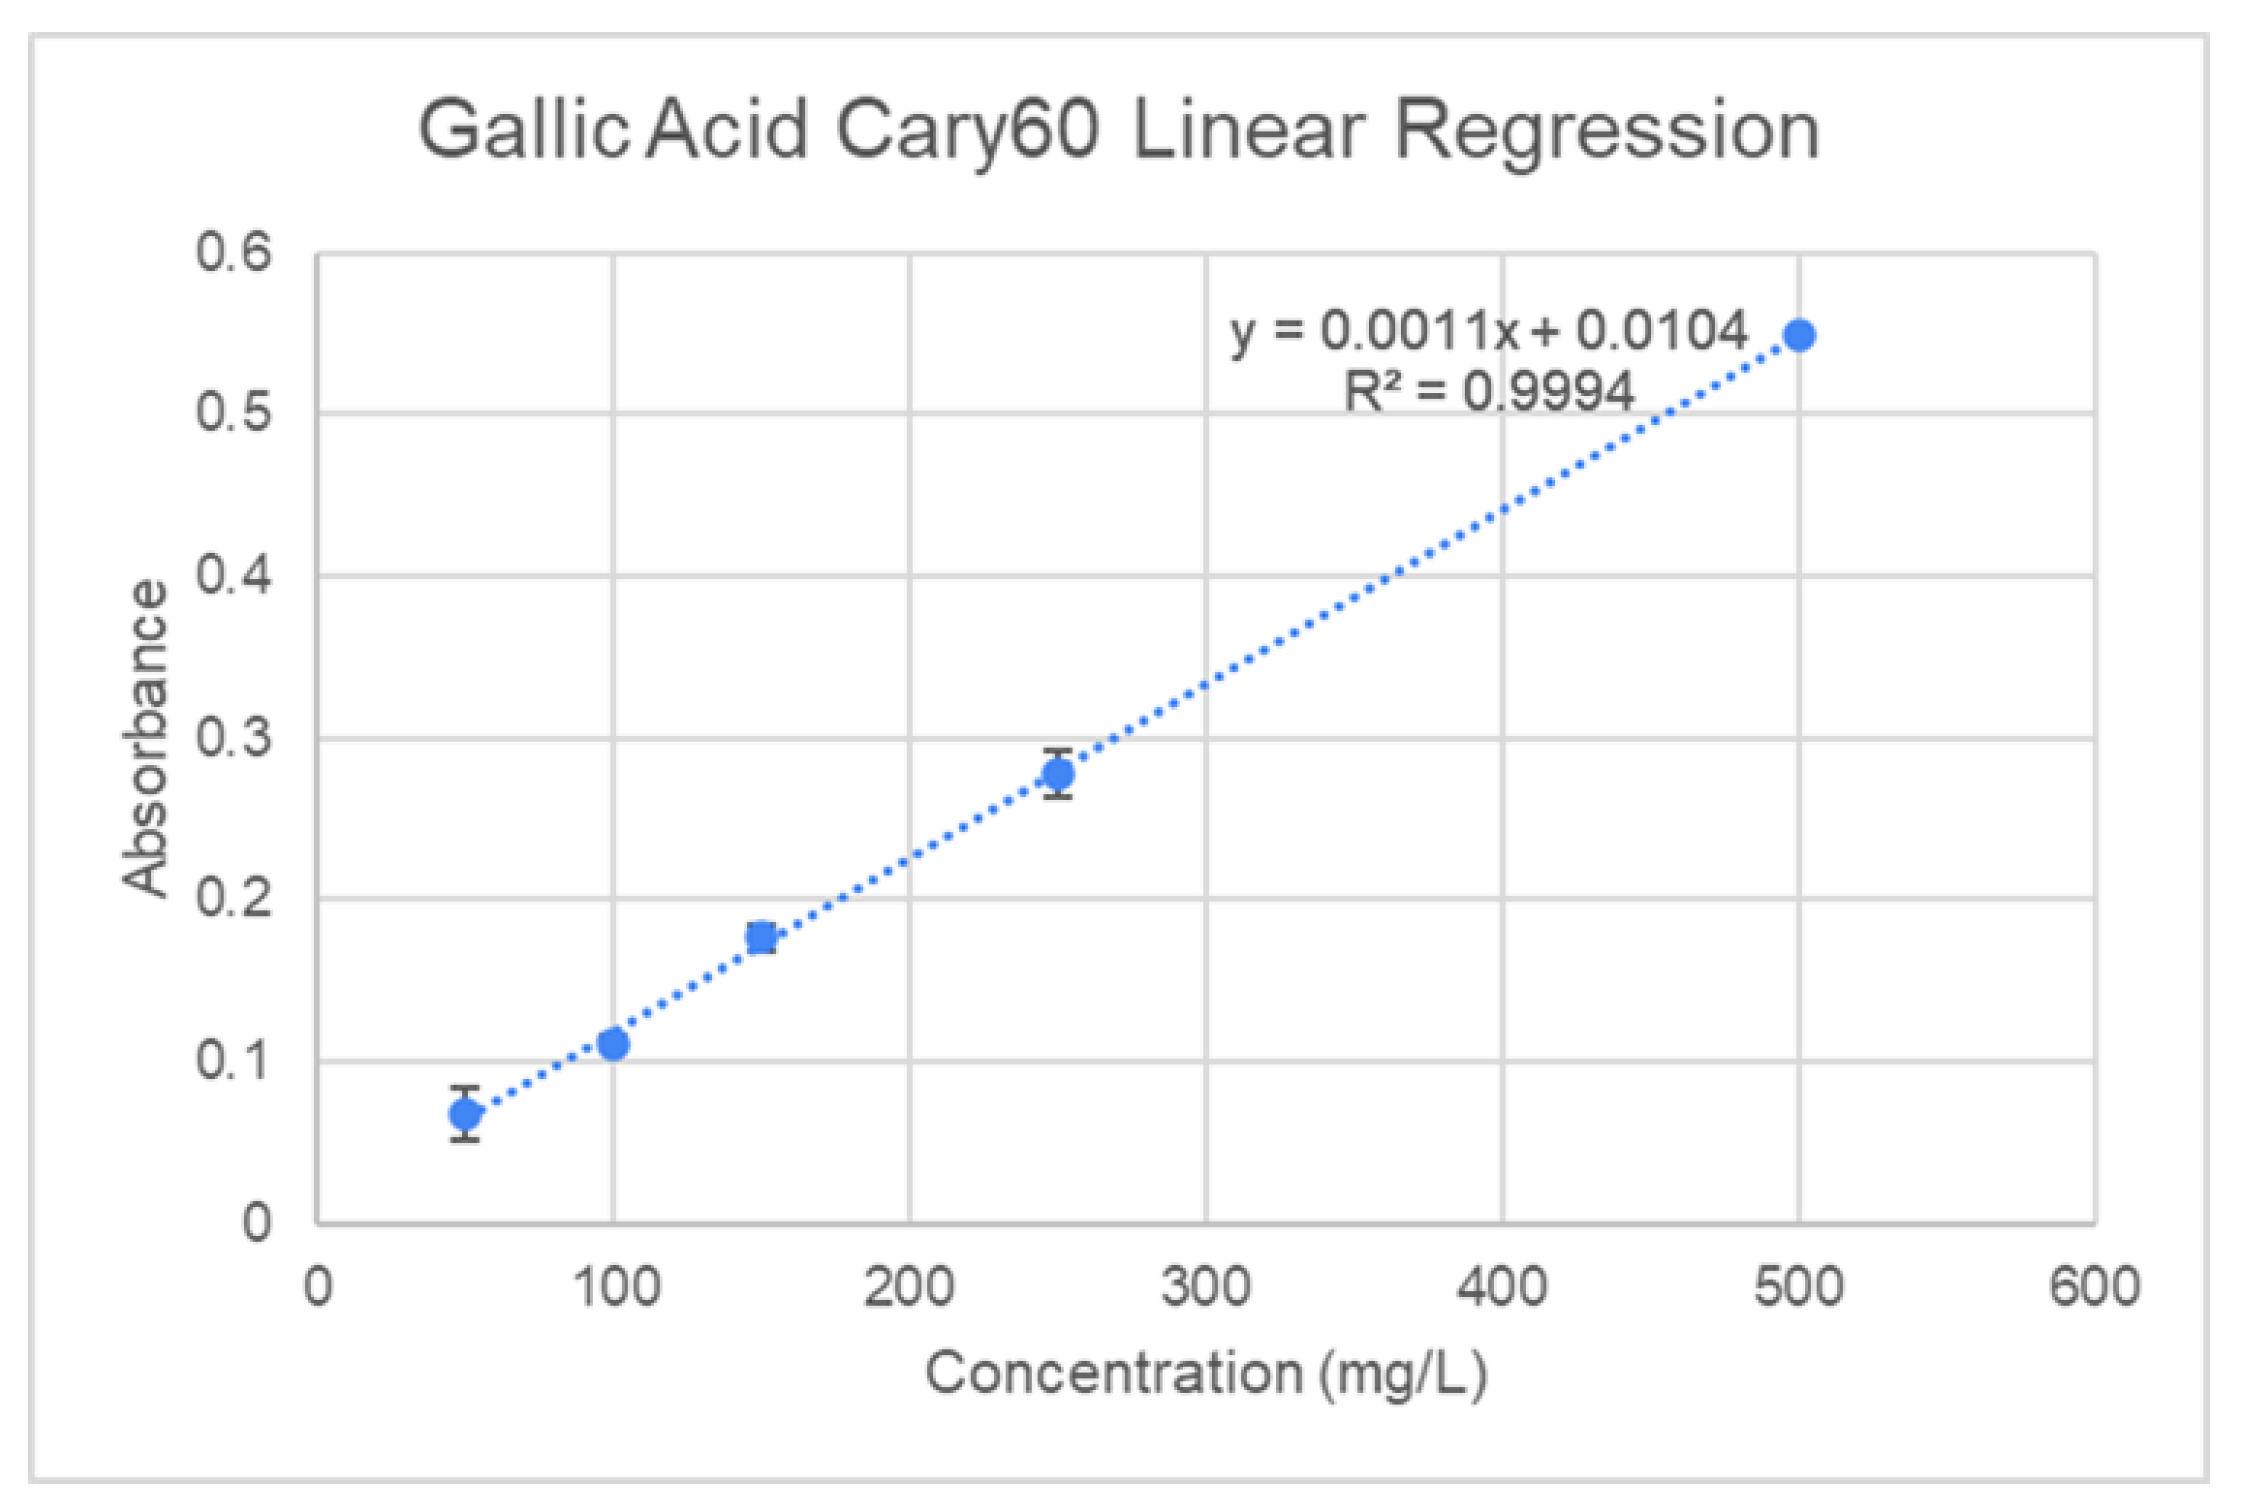
Figure 8.
Tannic Acid calibration curve.
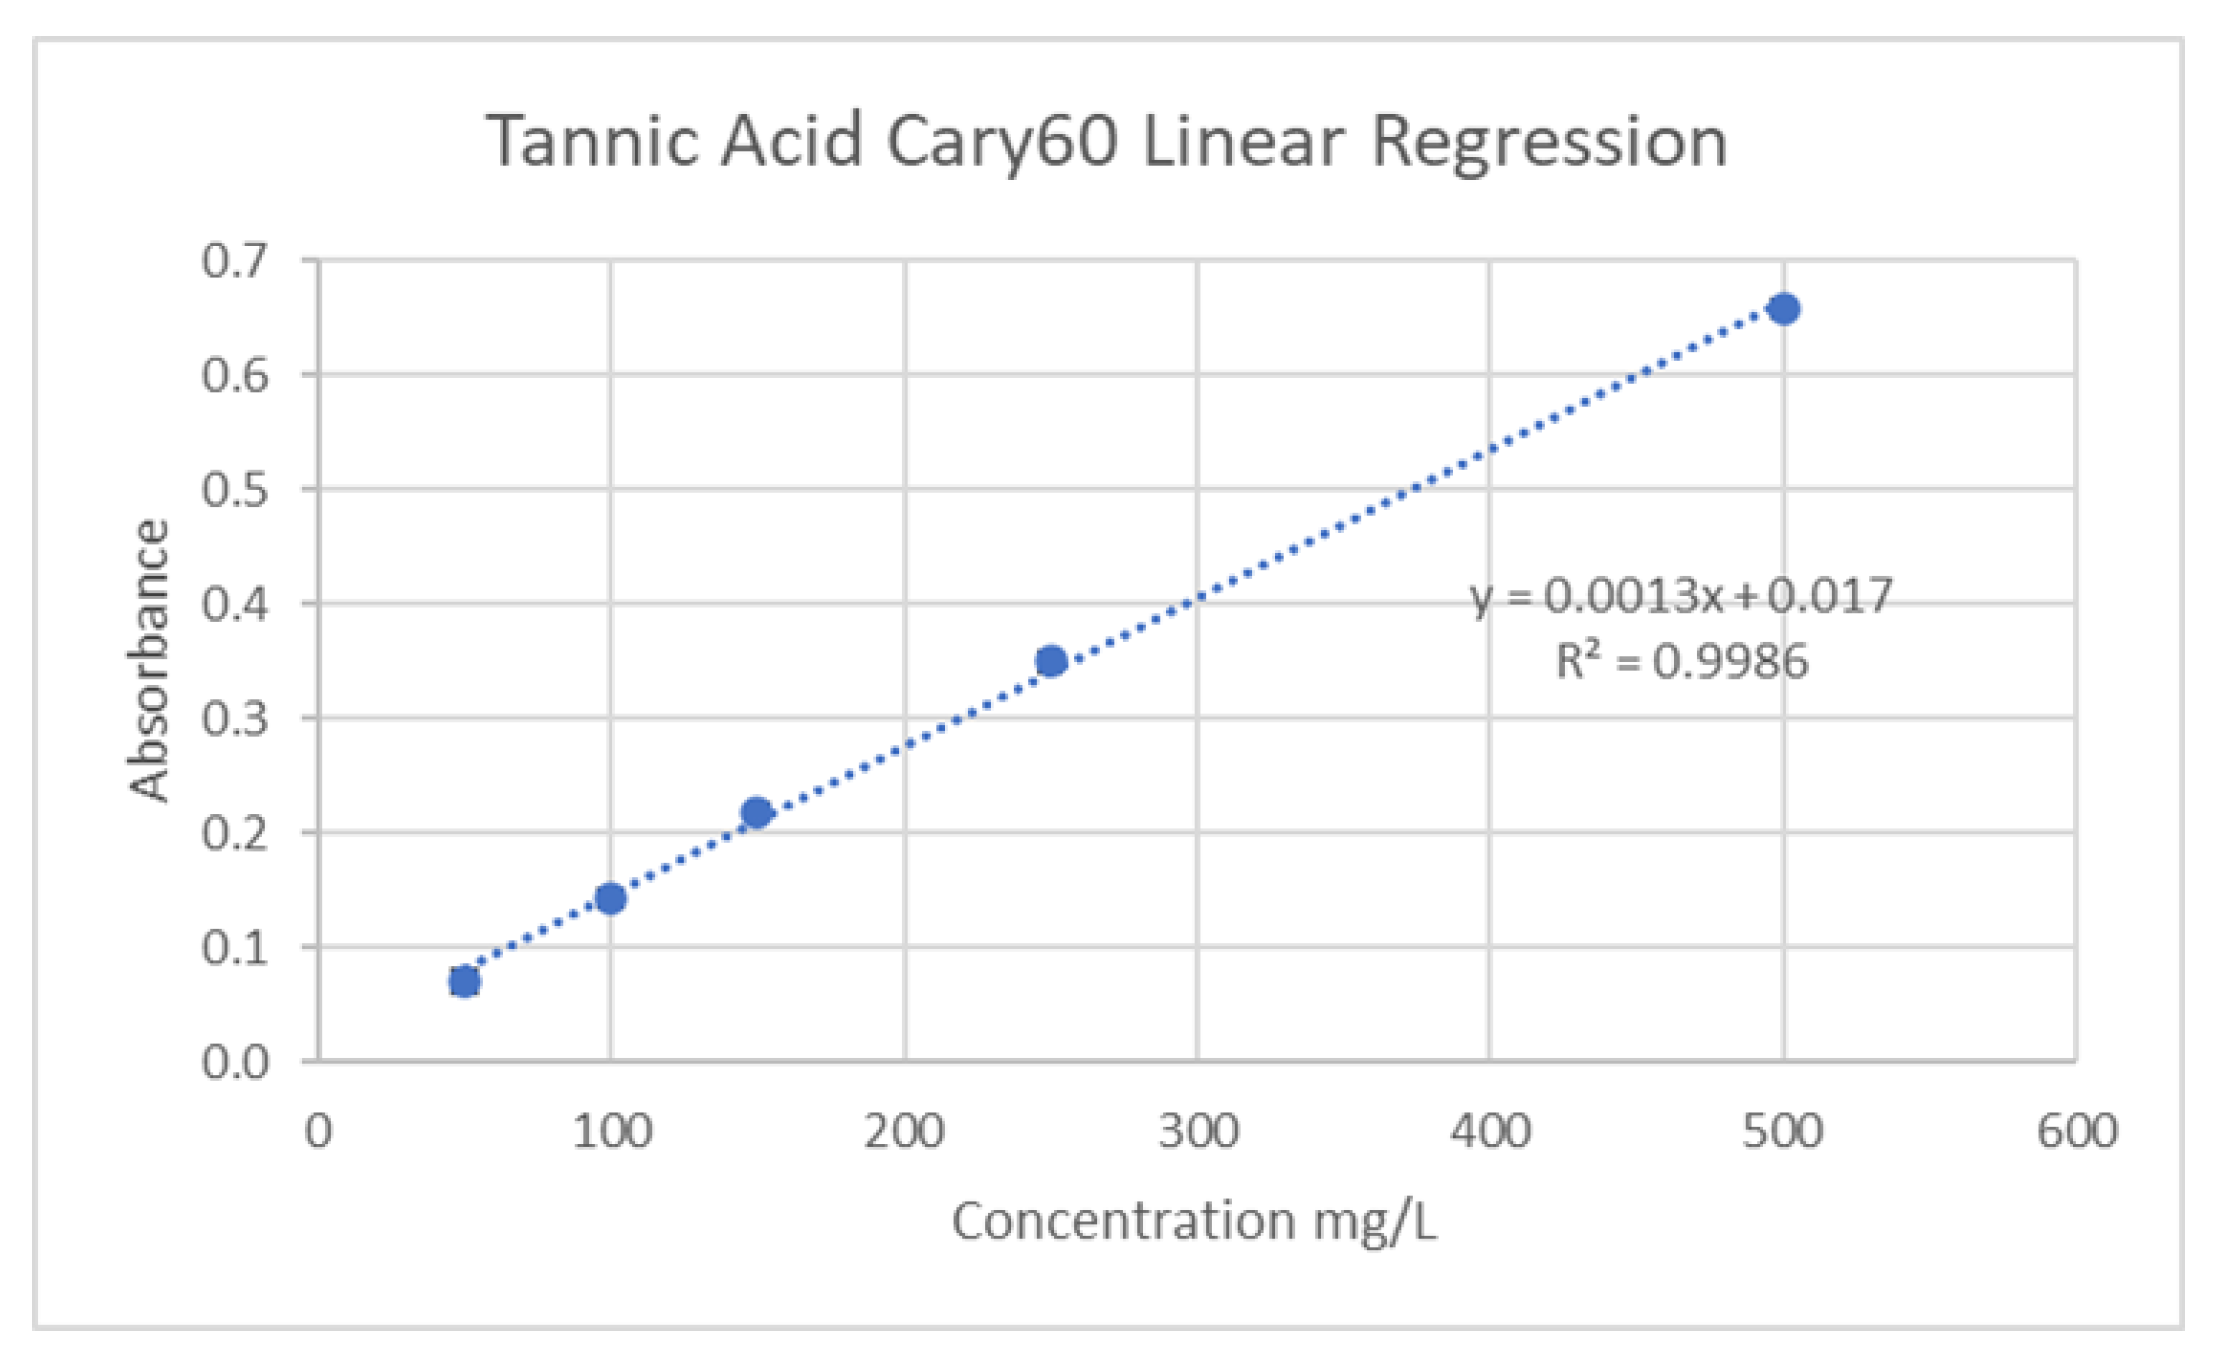
Figure 9.
Quercetin Limit of Detection.
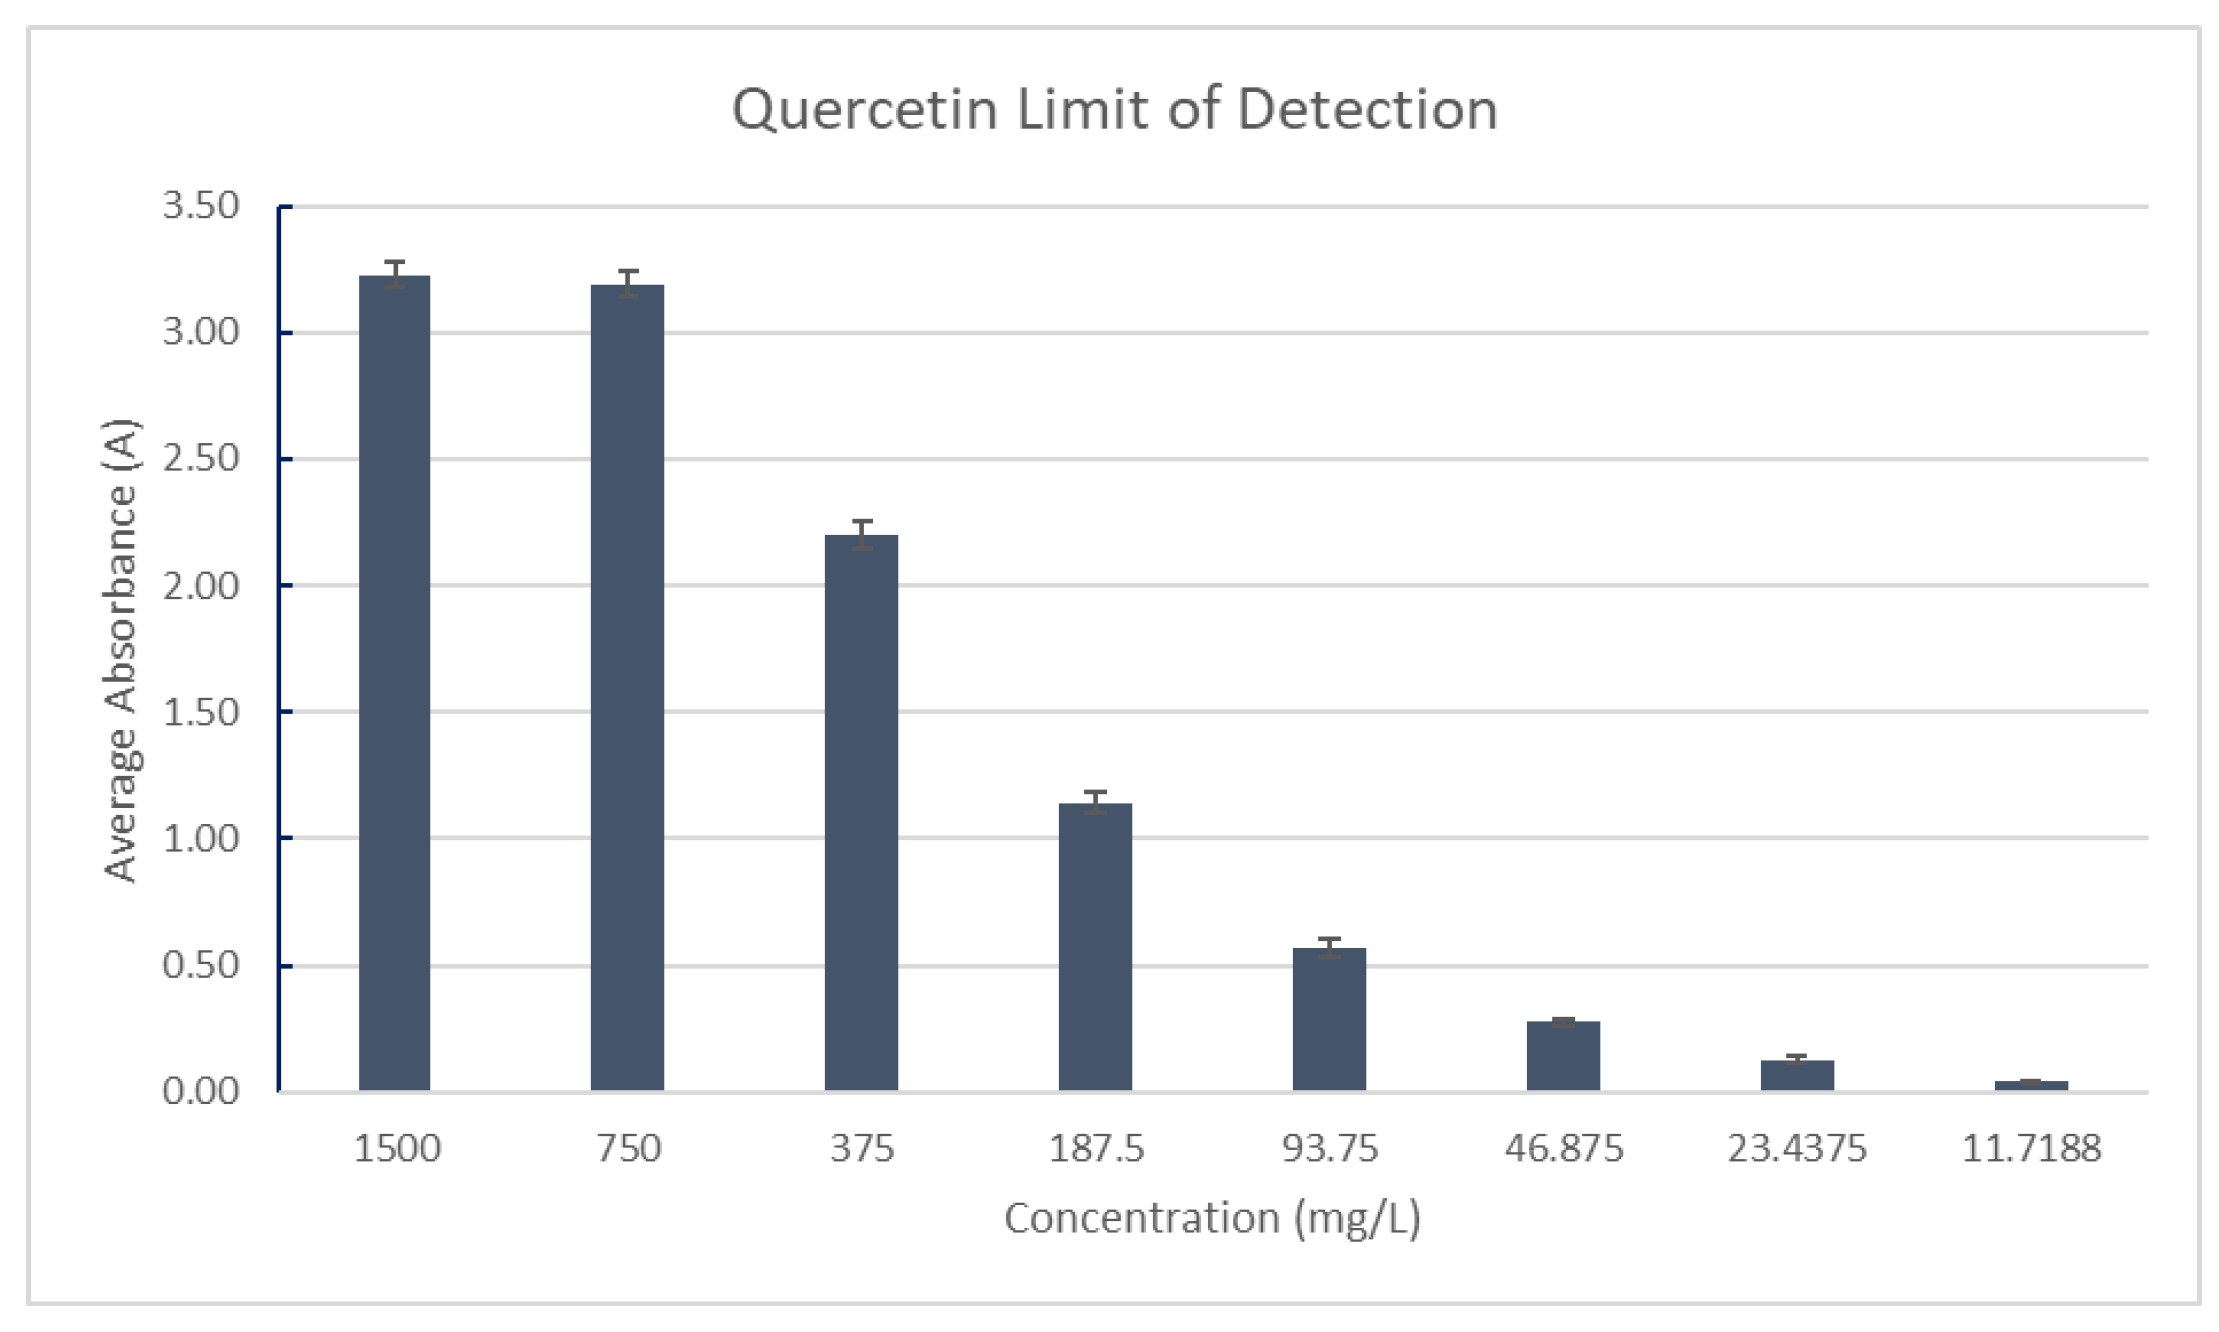
Figure 10.
Gallic Acid Limit of Detection.
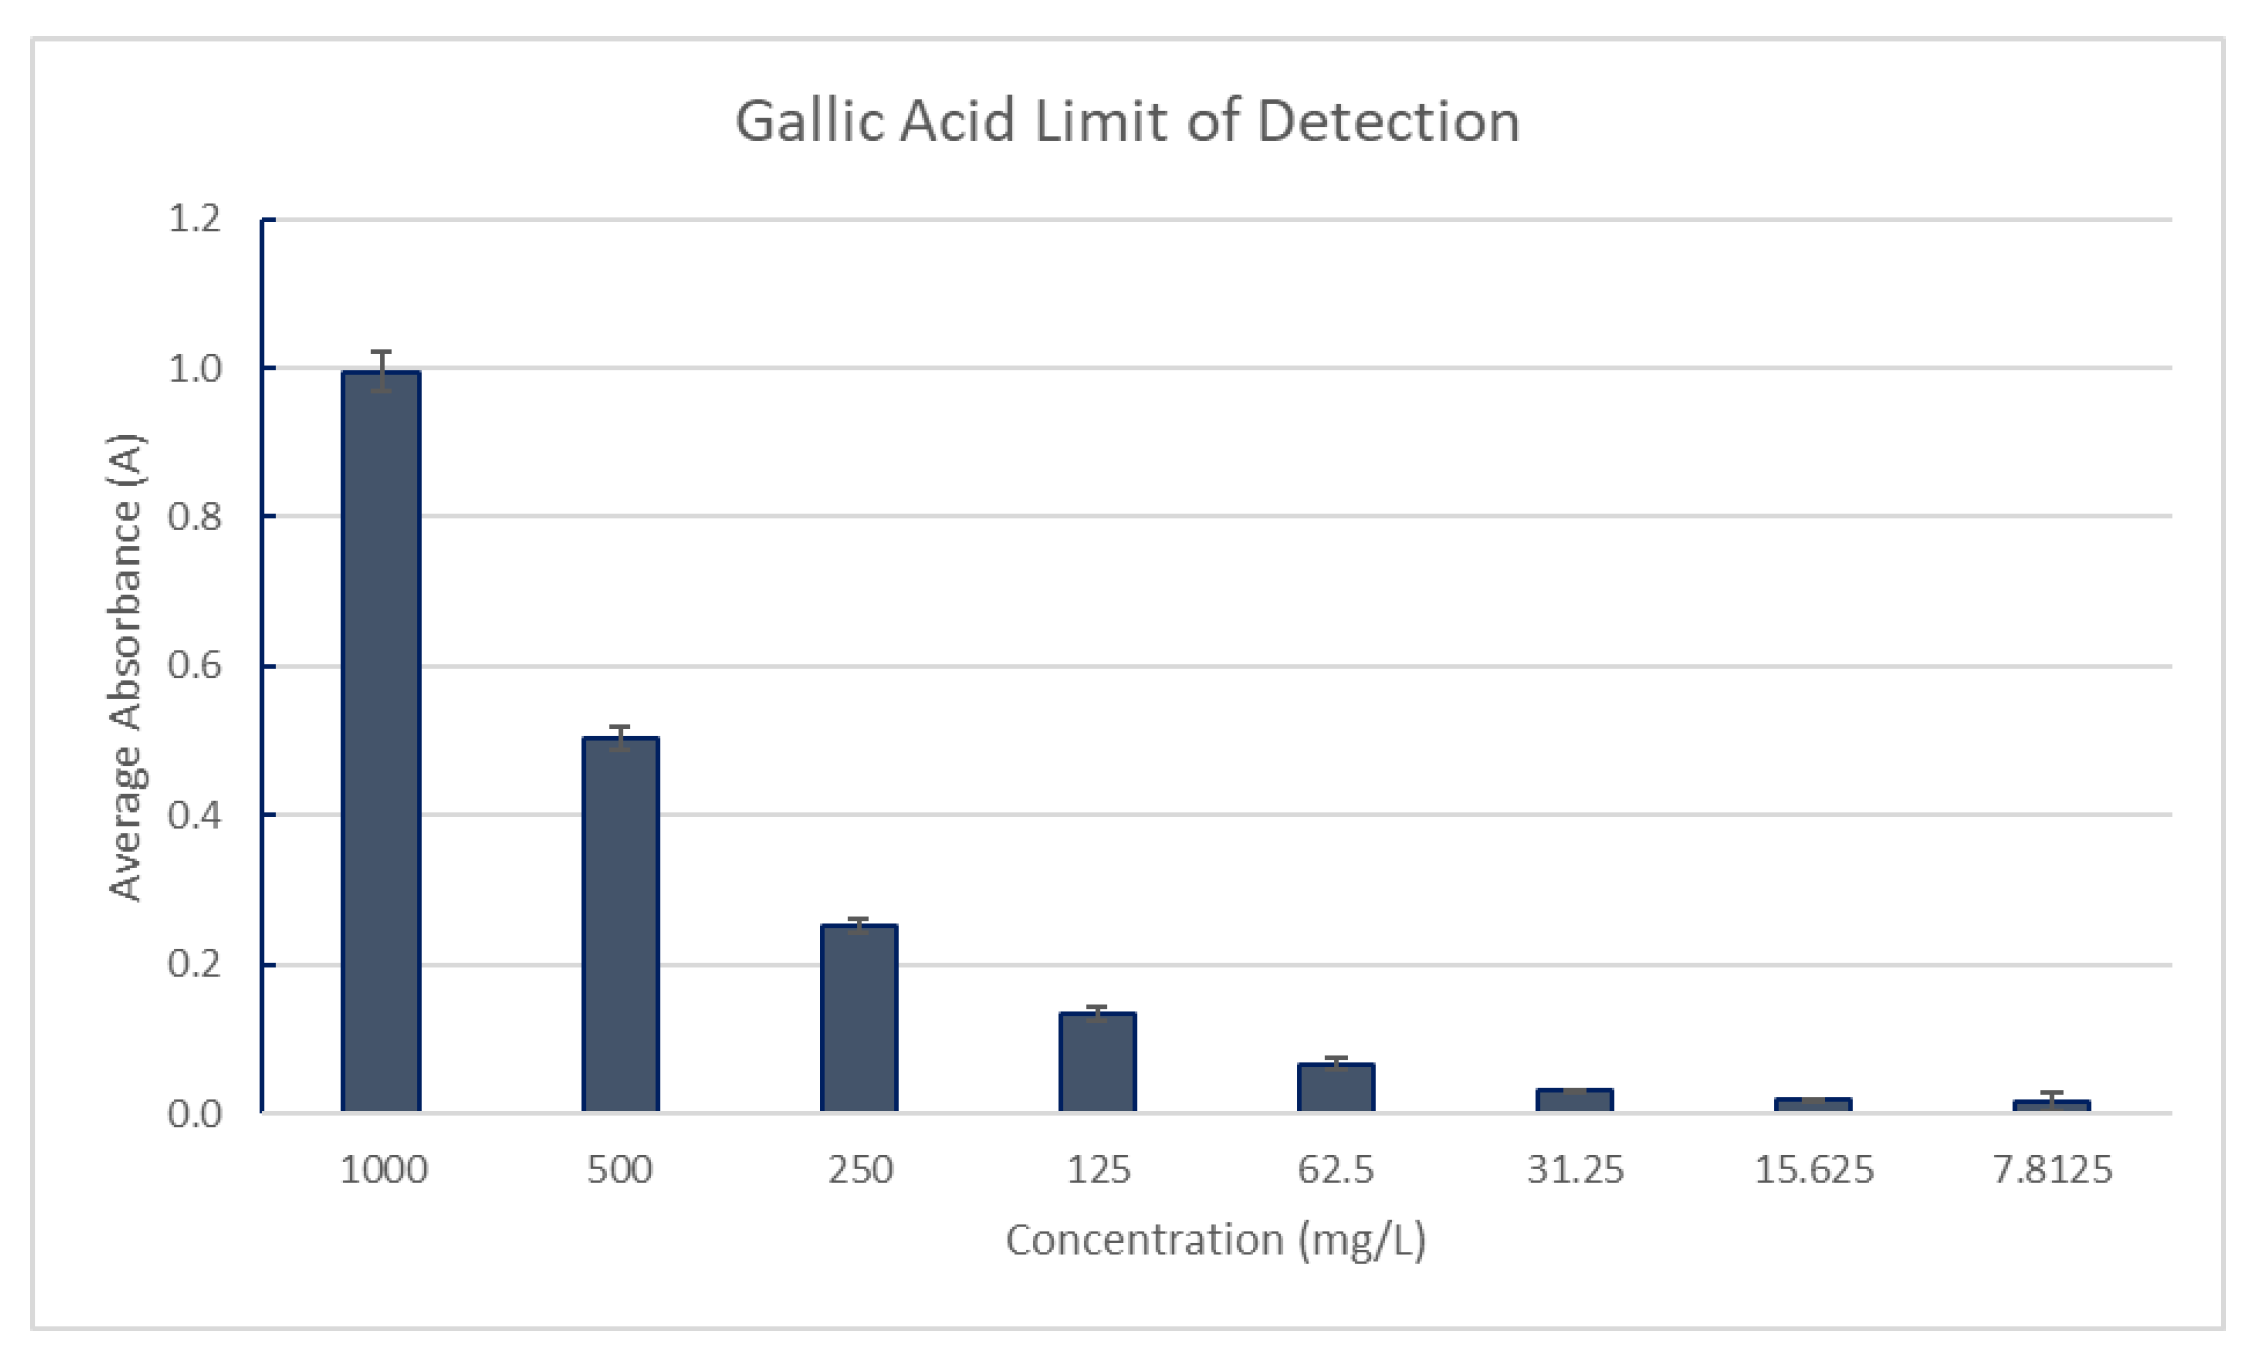
Figure 11.
Tannic Acid Limit of Detection.
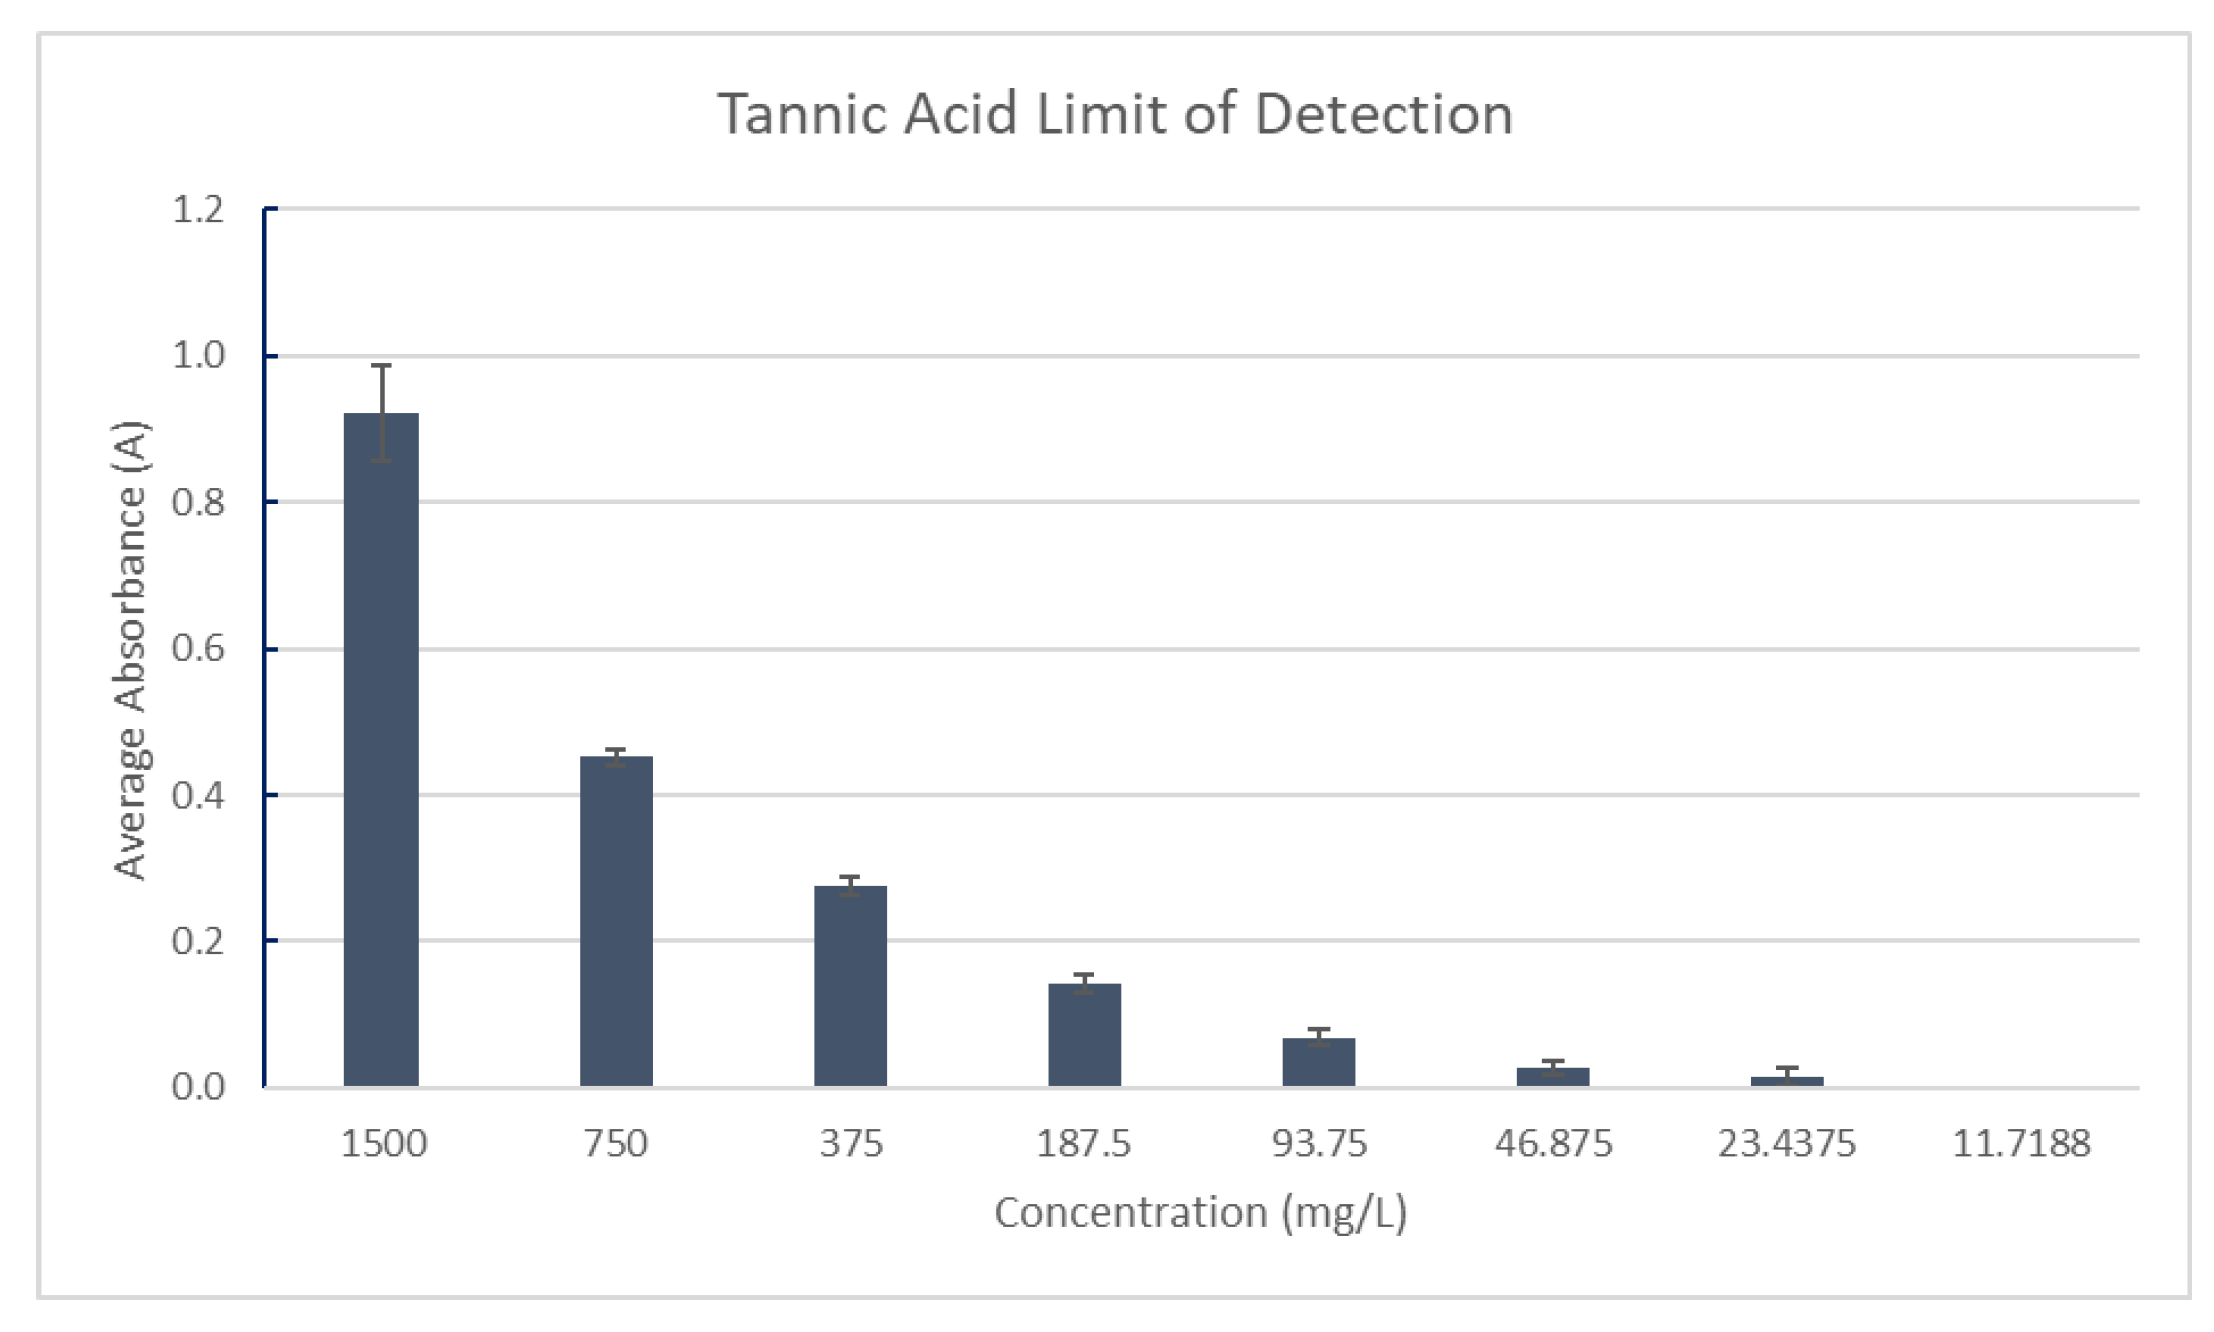
Figure 12.
Total Phenolic content of Y1 ginger (DW).
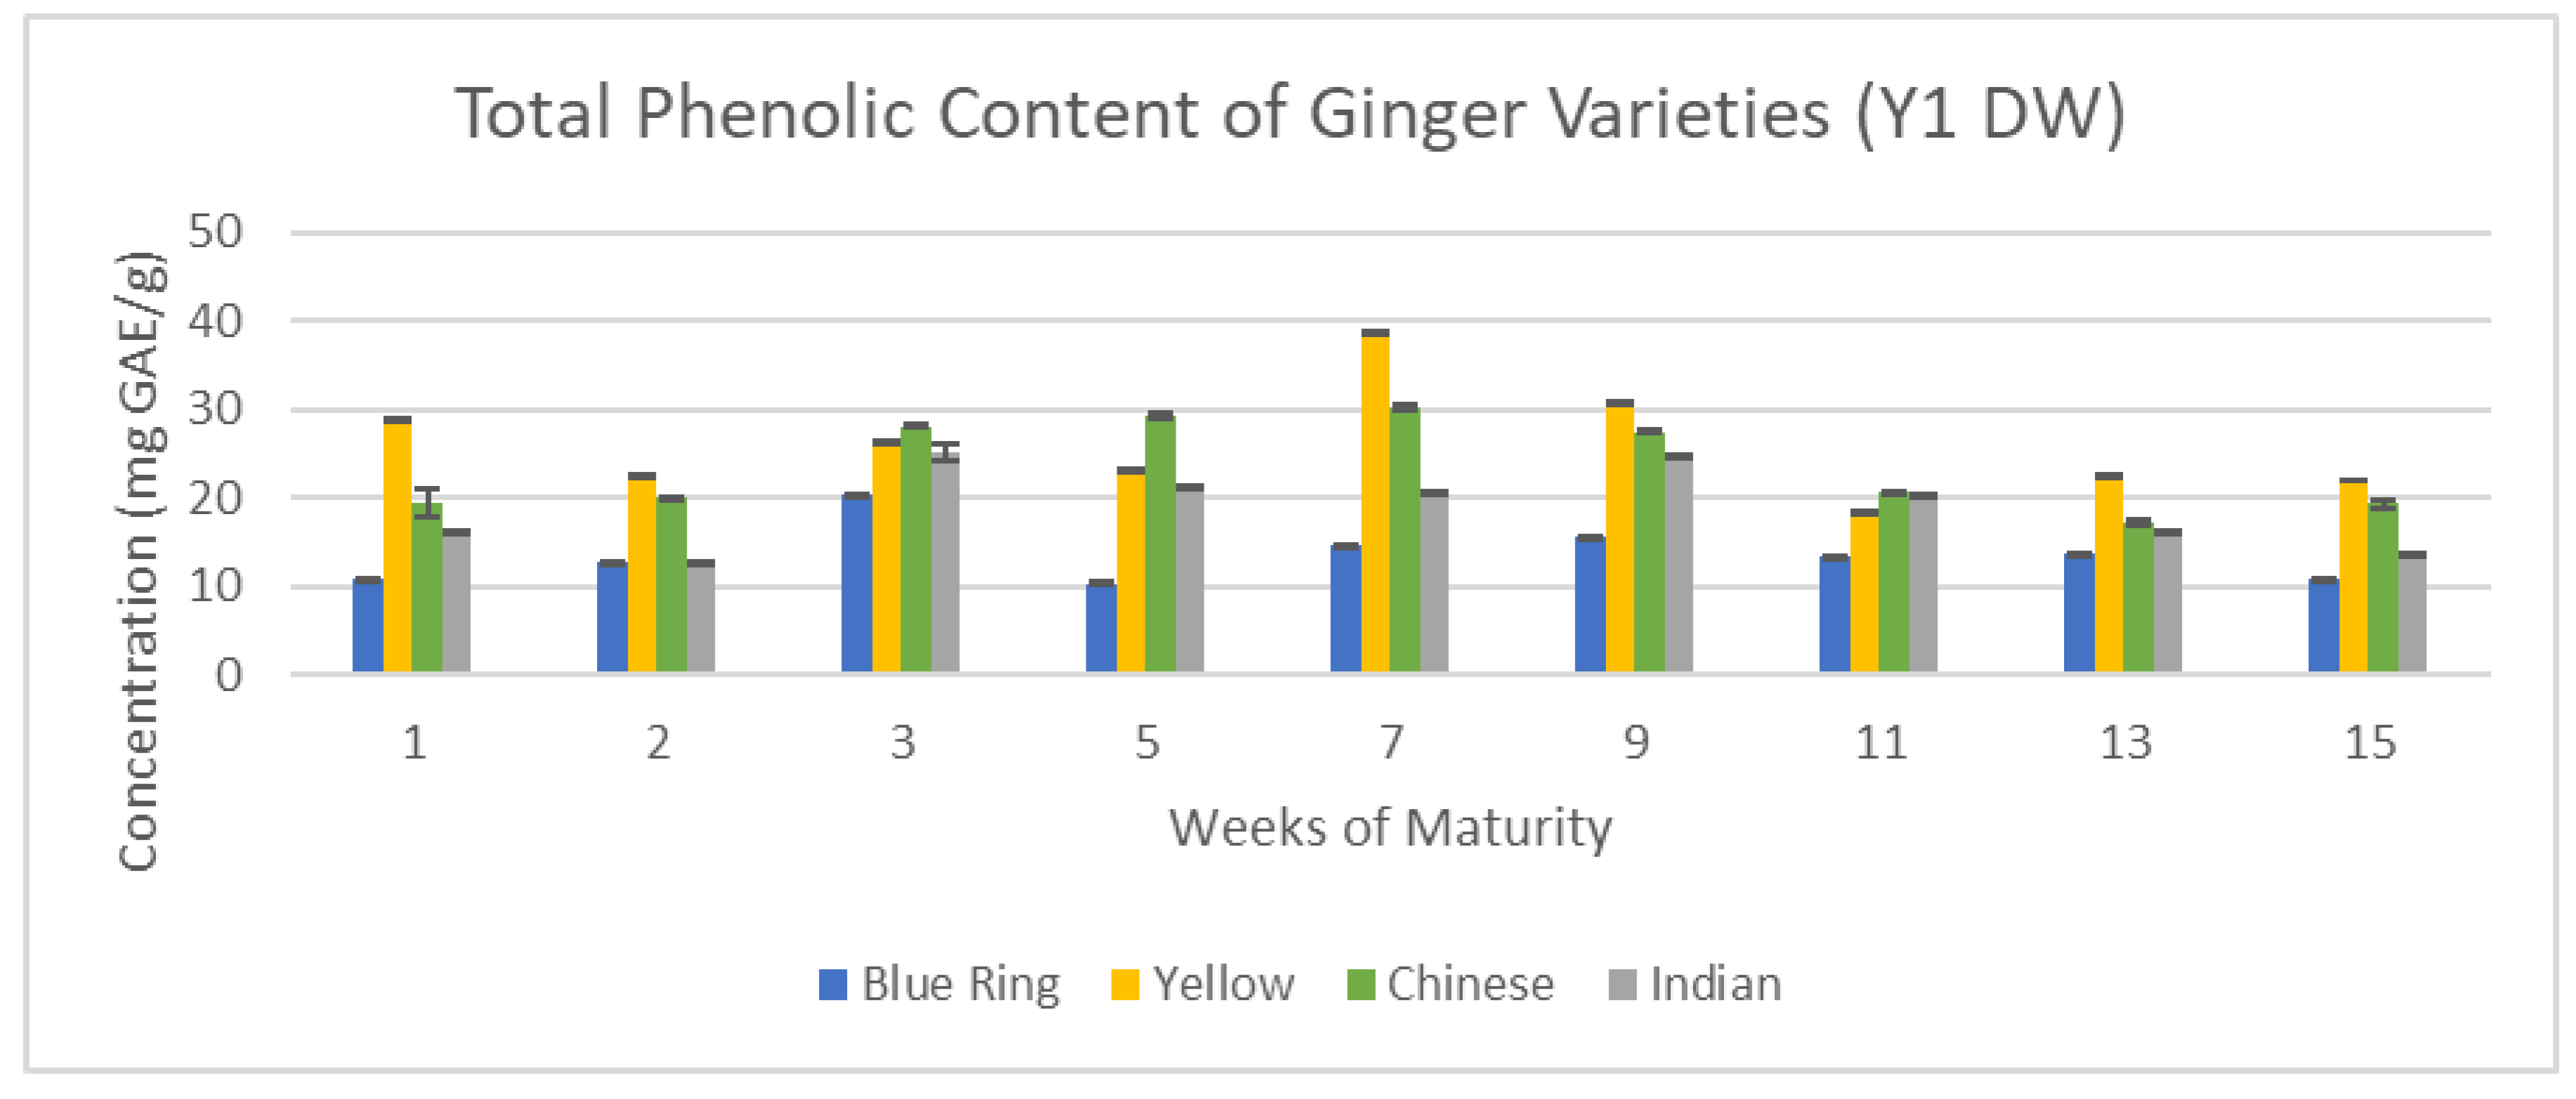
Figure 13.
Total Phenolic content of Y2 ginger (DW).
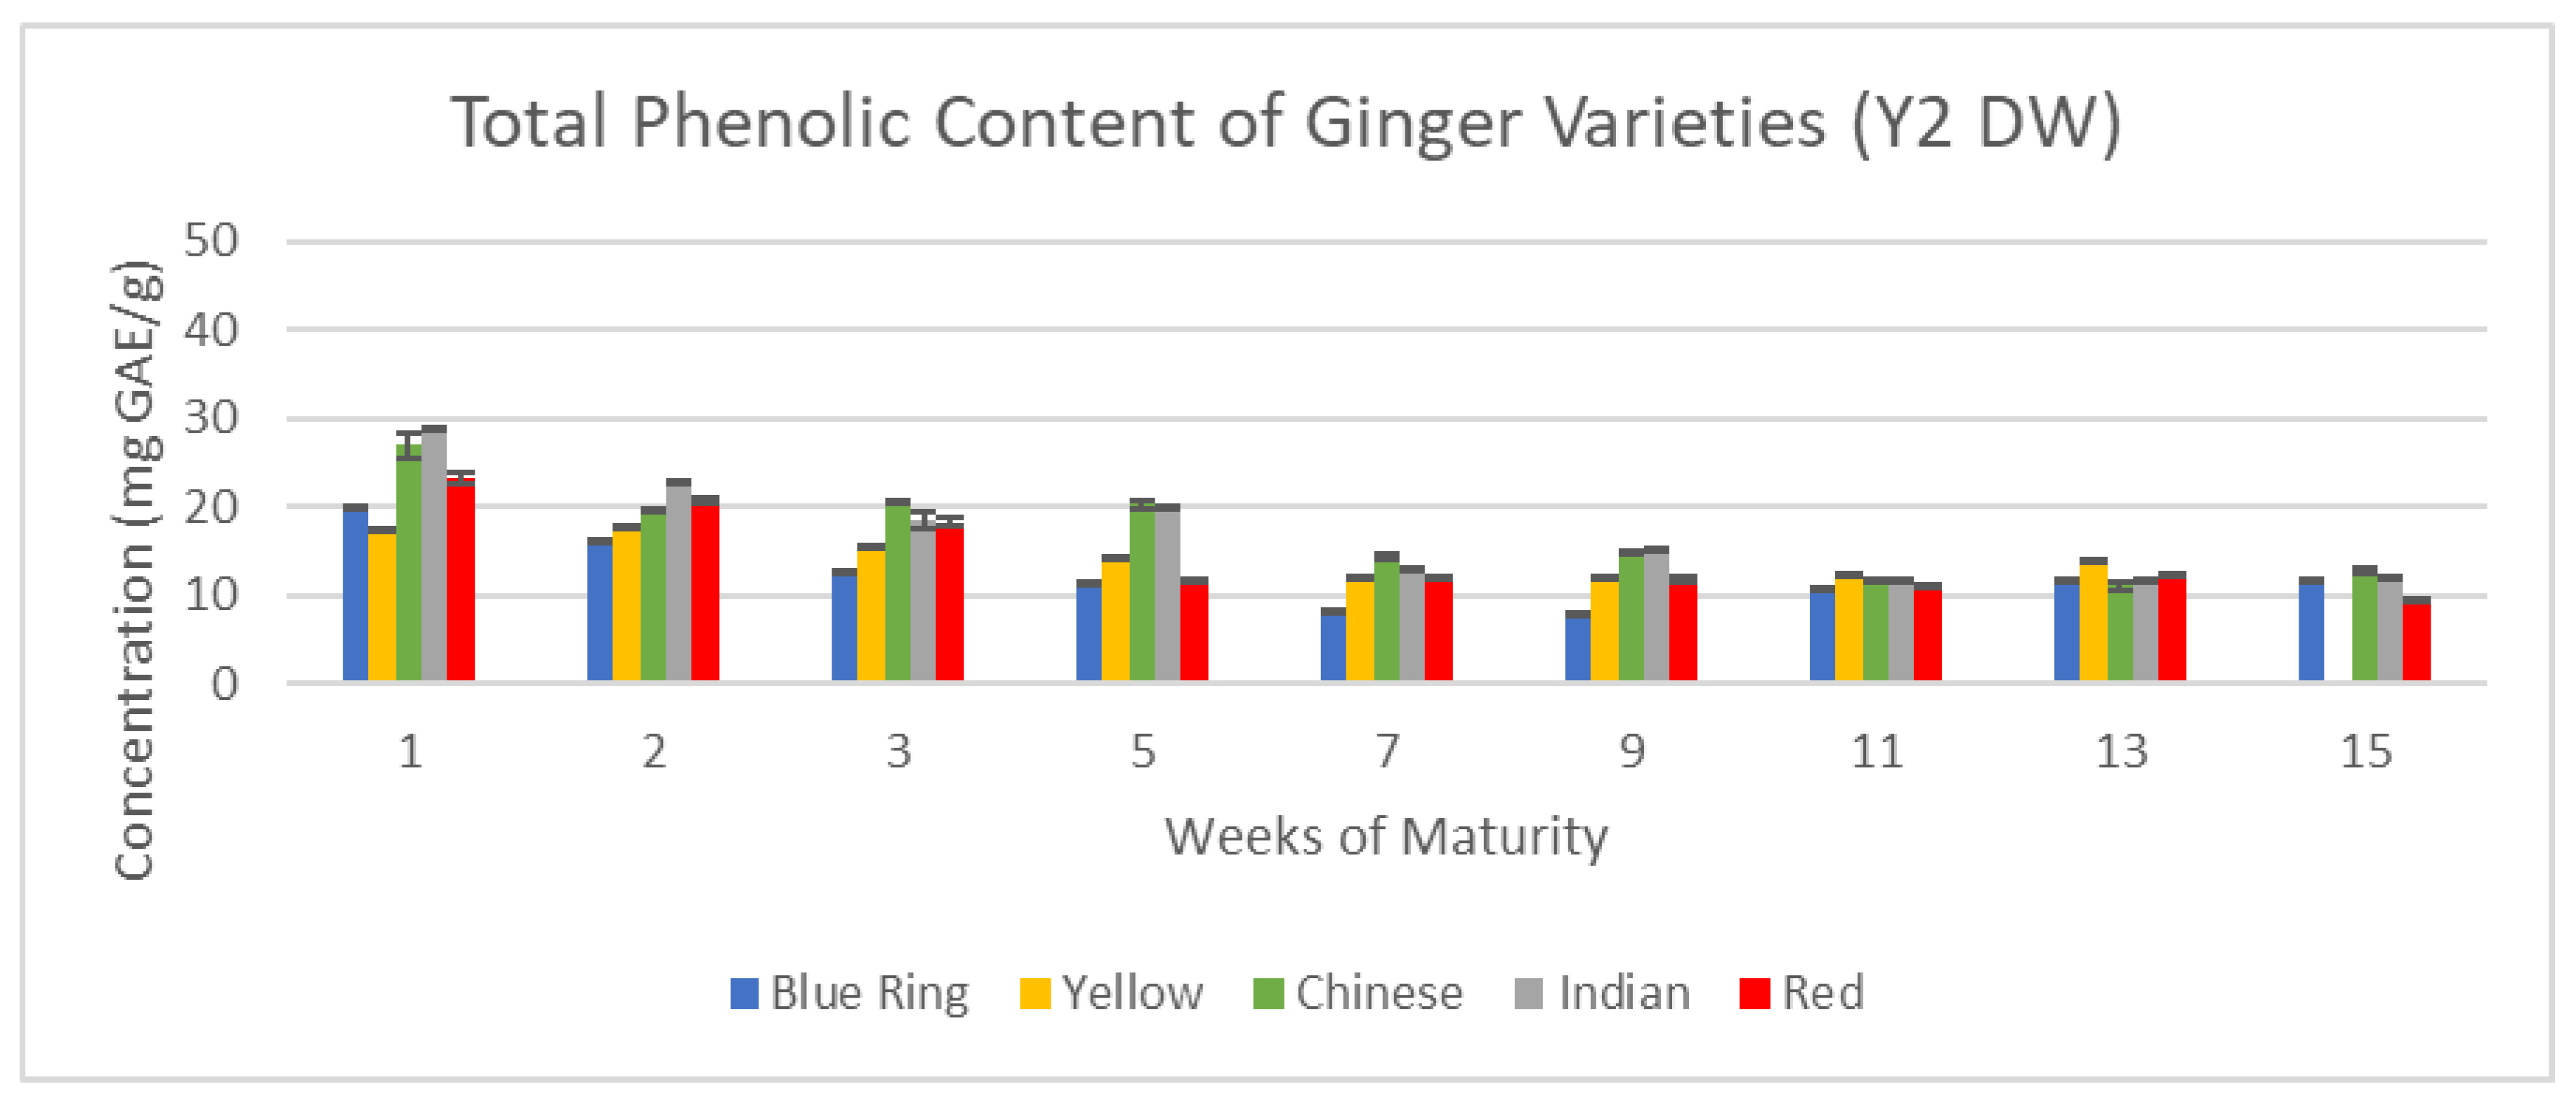
Figure 14.
Total Flavonoid content of Y1 ginger (DW).
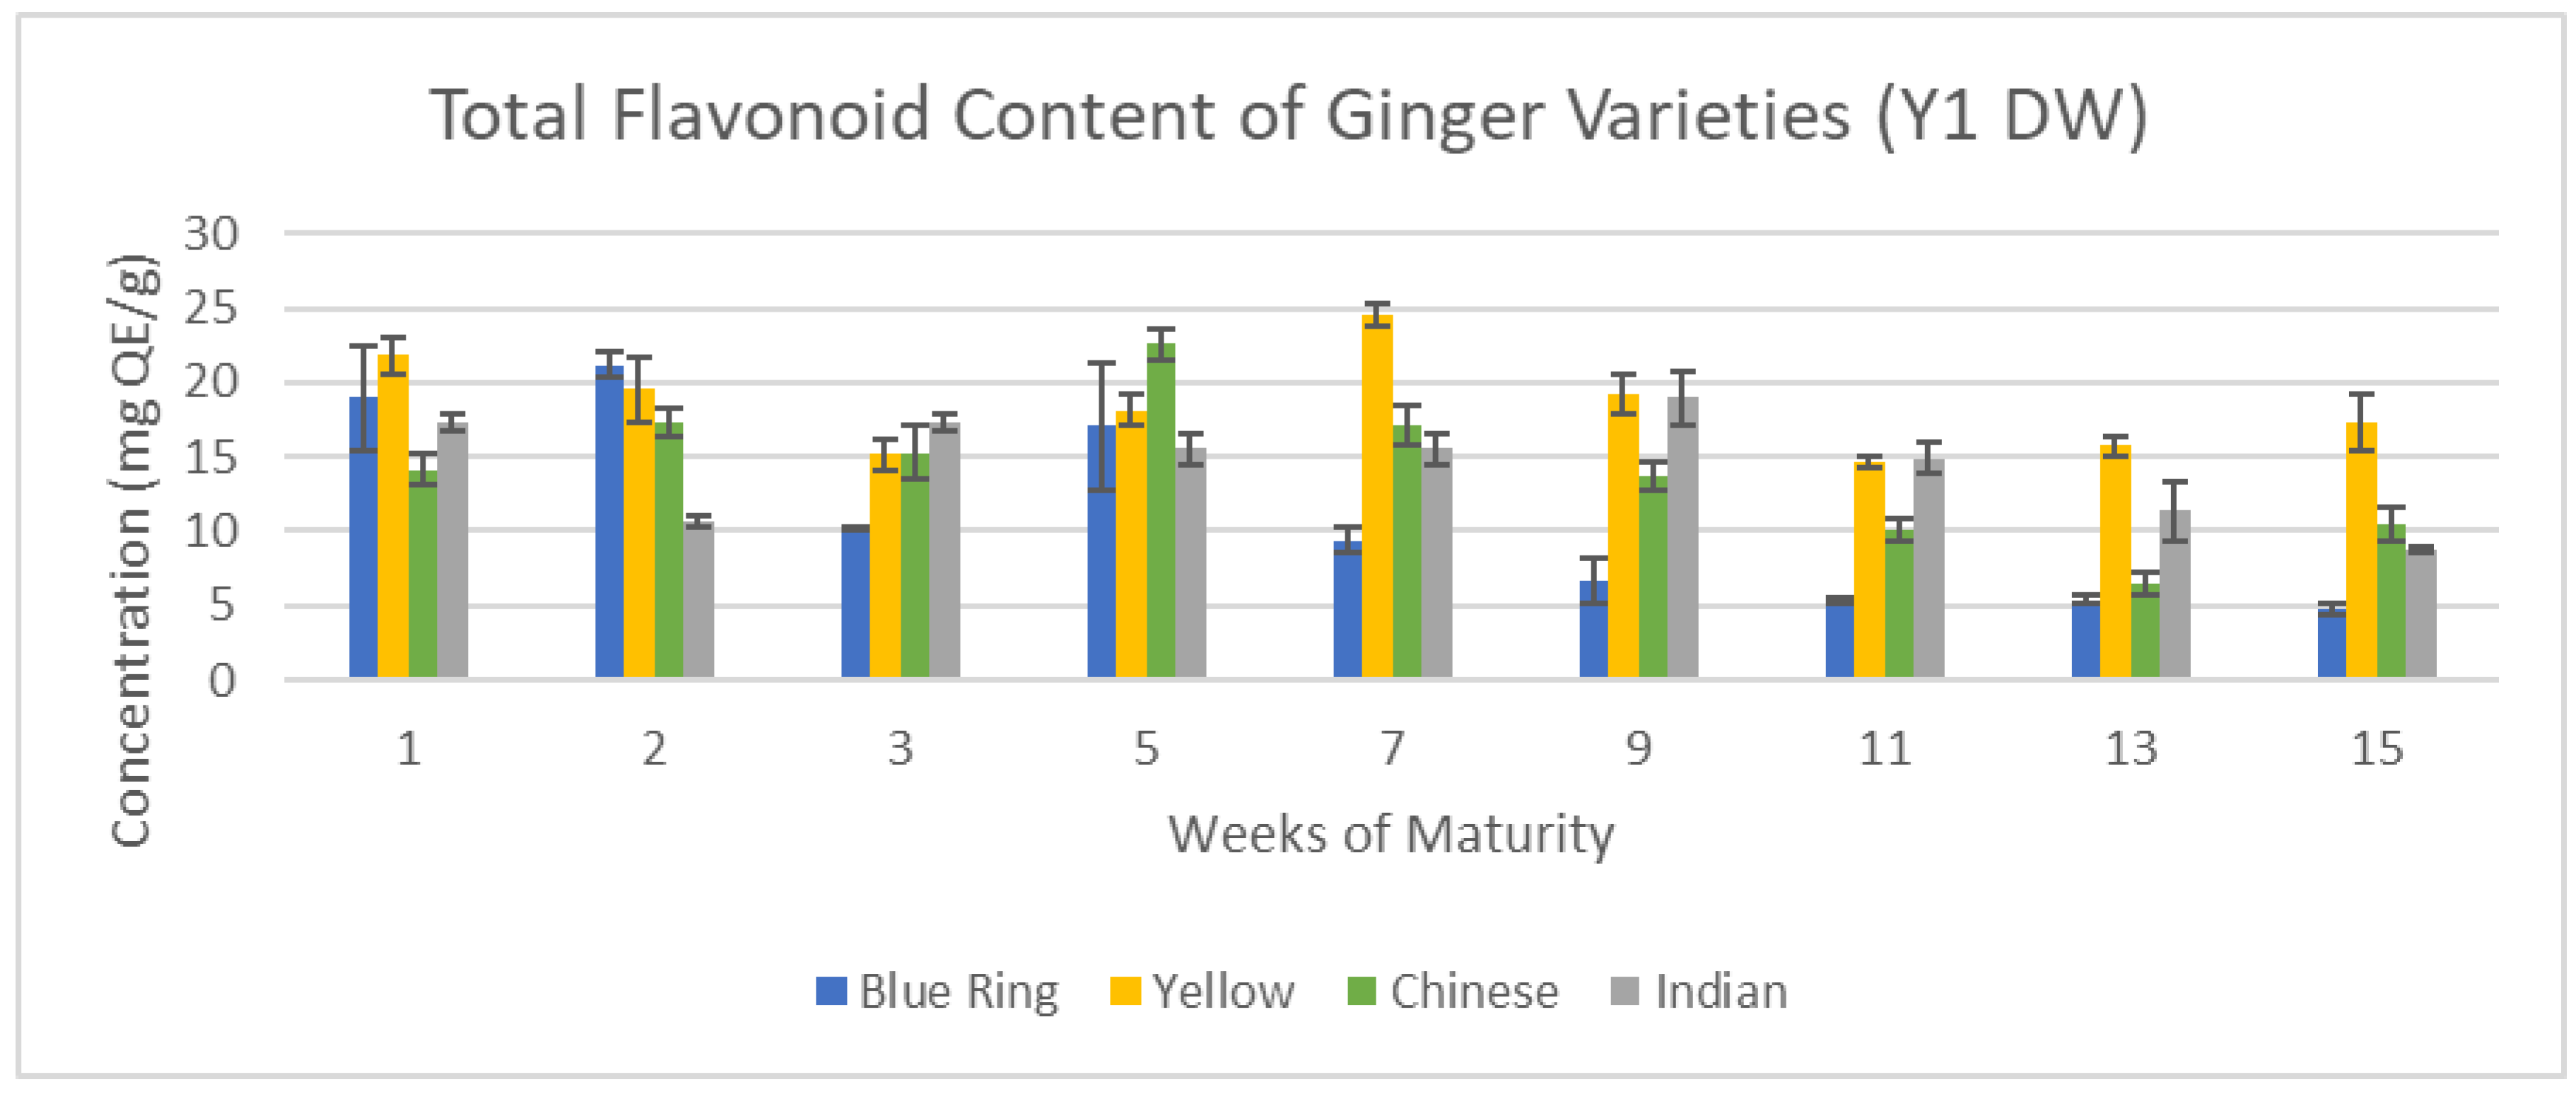
Figure 15.
Total Flavonoid content of Y2 ginger (DW).

Figure 16.
Total Tannin content of Y1 ginger (DW).
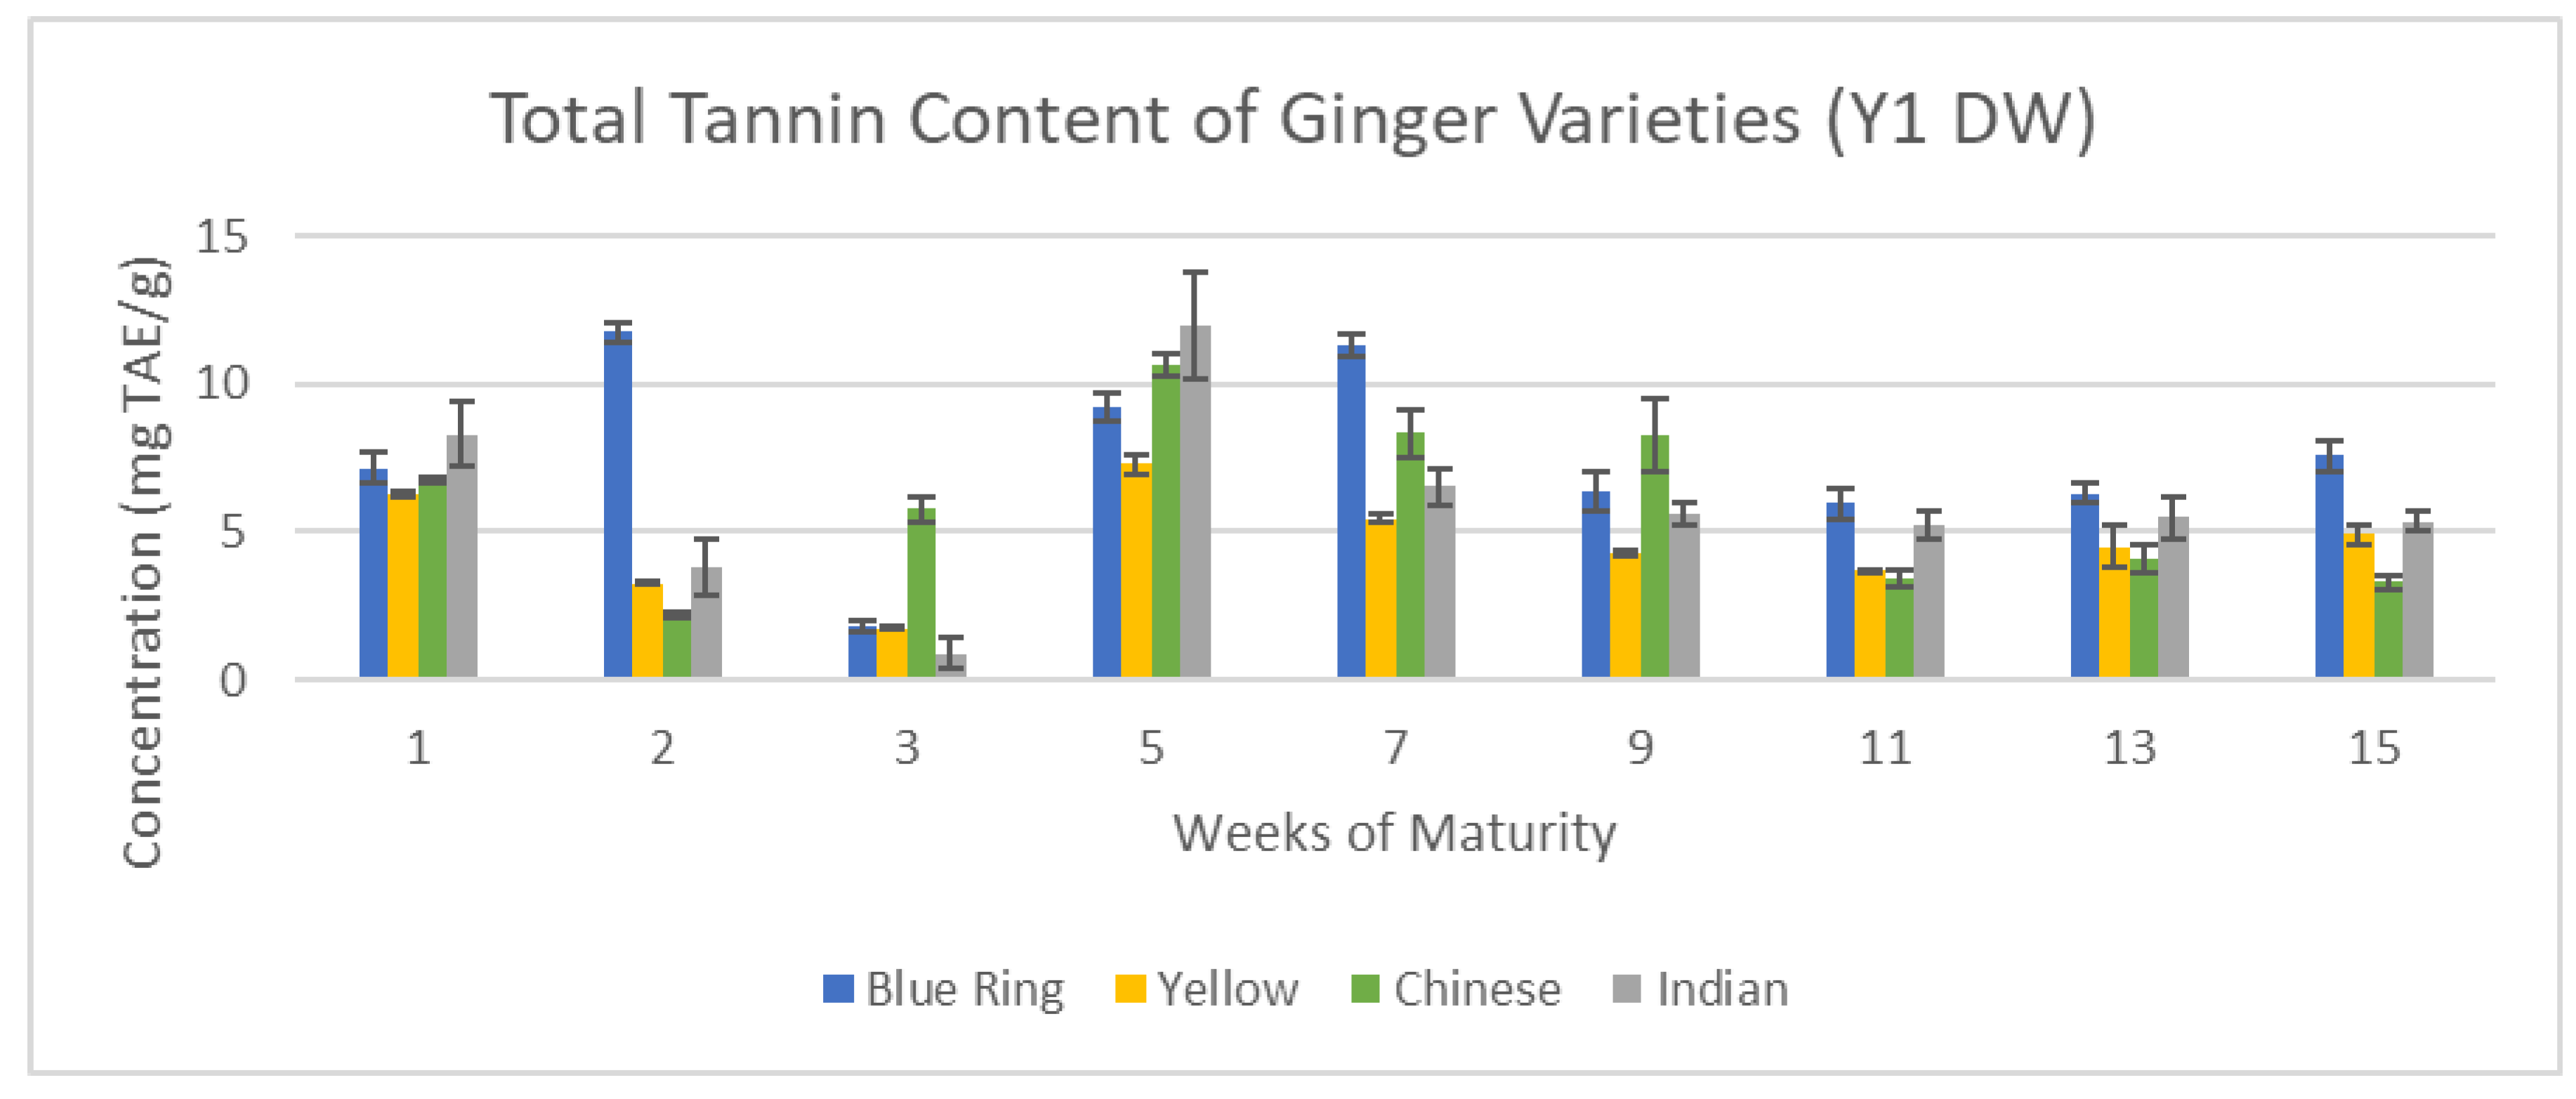
Figure 17.
Total Tannin content of Y2 ginger (DW).
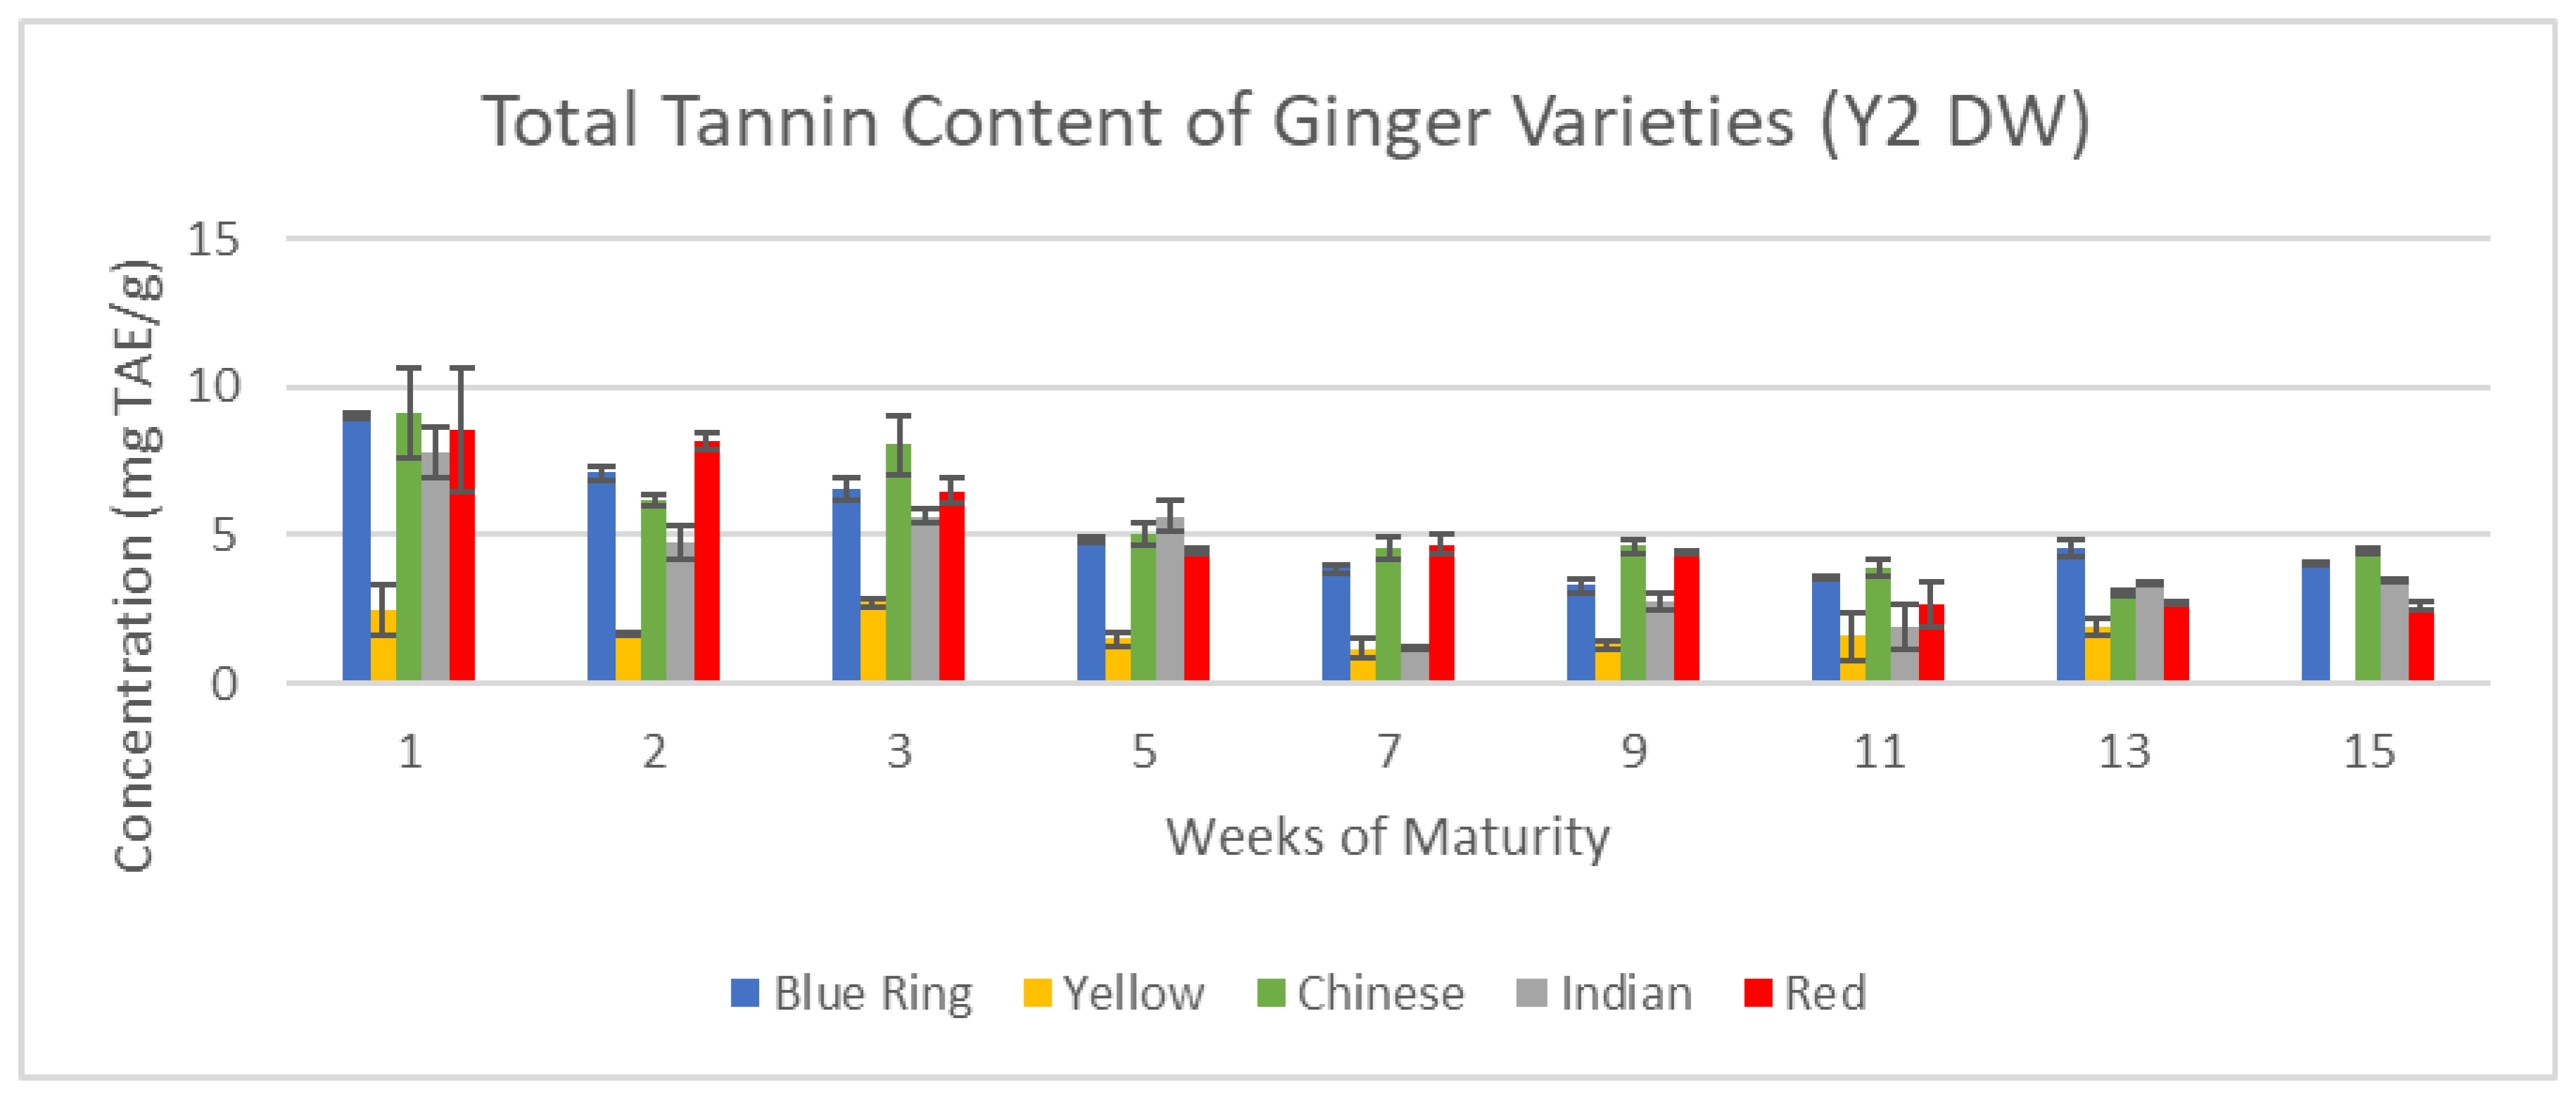
Figure 18.
Ginger Conductivity over 15 weeks.
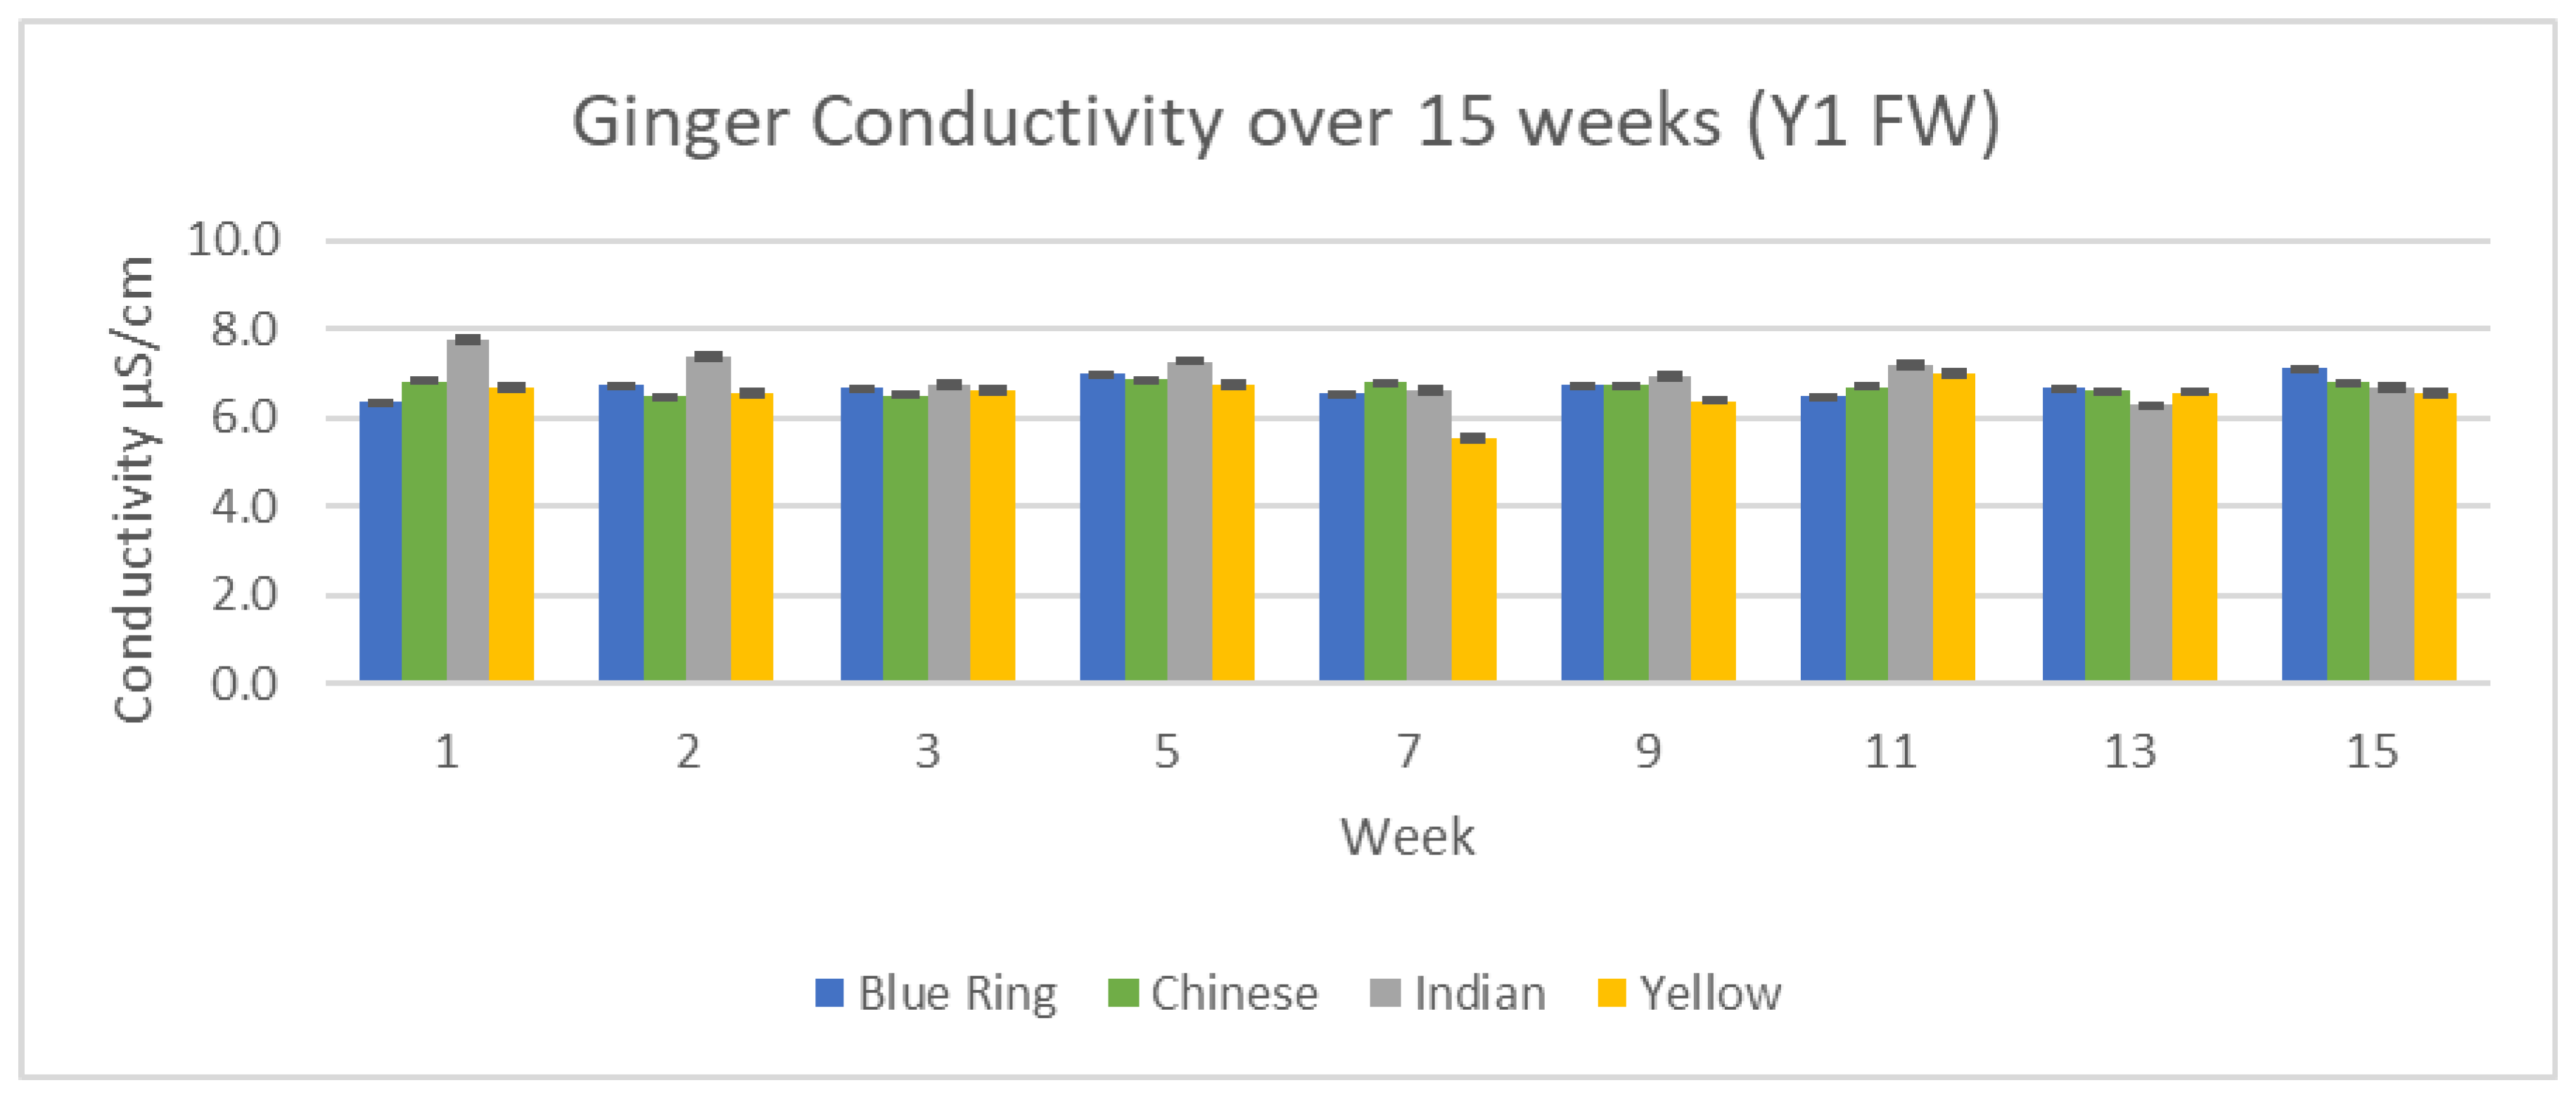
Figure 19.
Y2 Ginger Conductivity over 15 weeks.
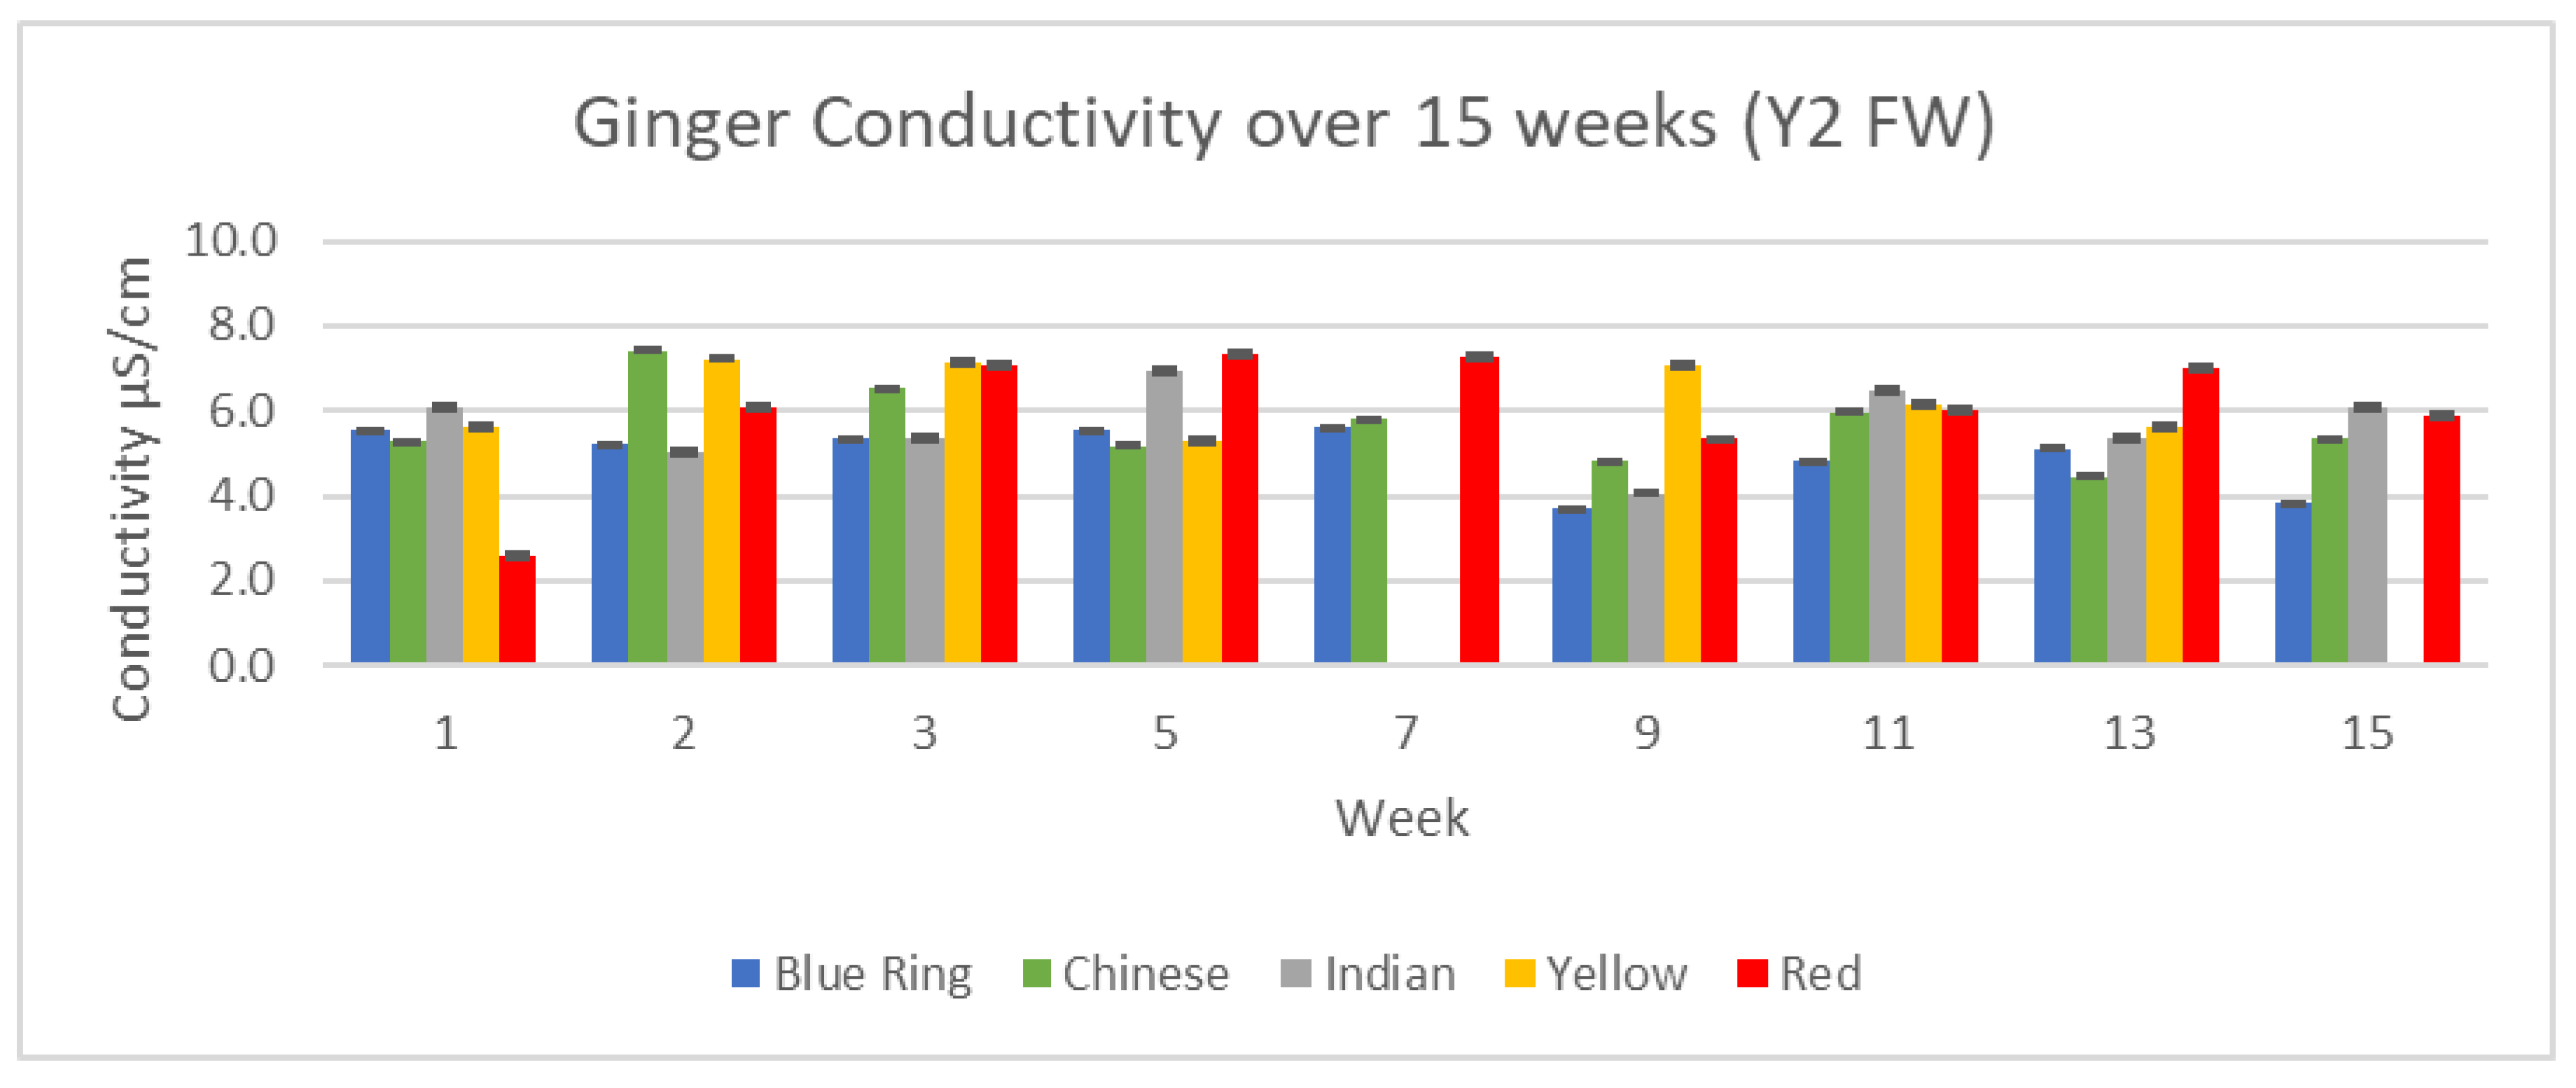
Figure 20.
Y1 Ginger pH over 15 weeks.
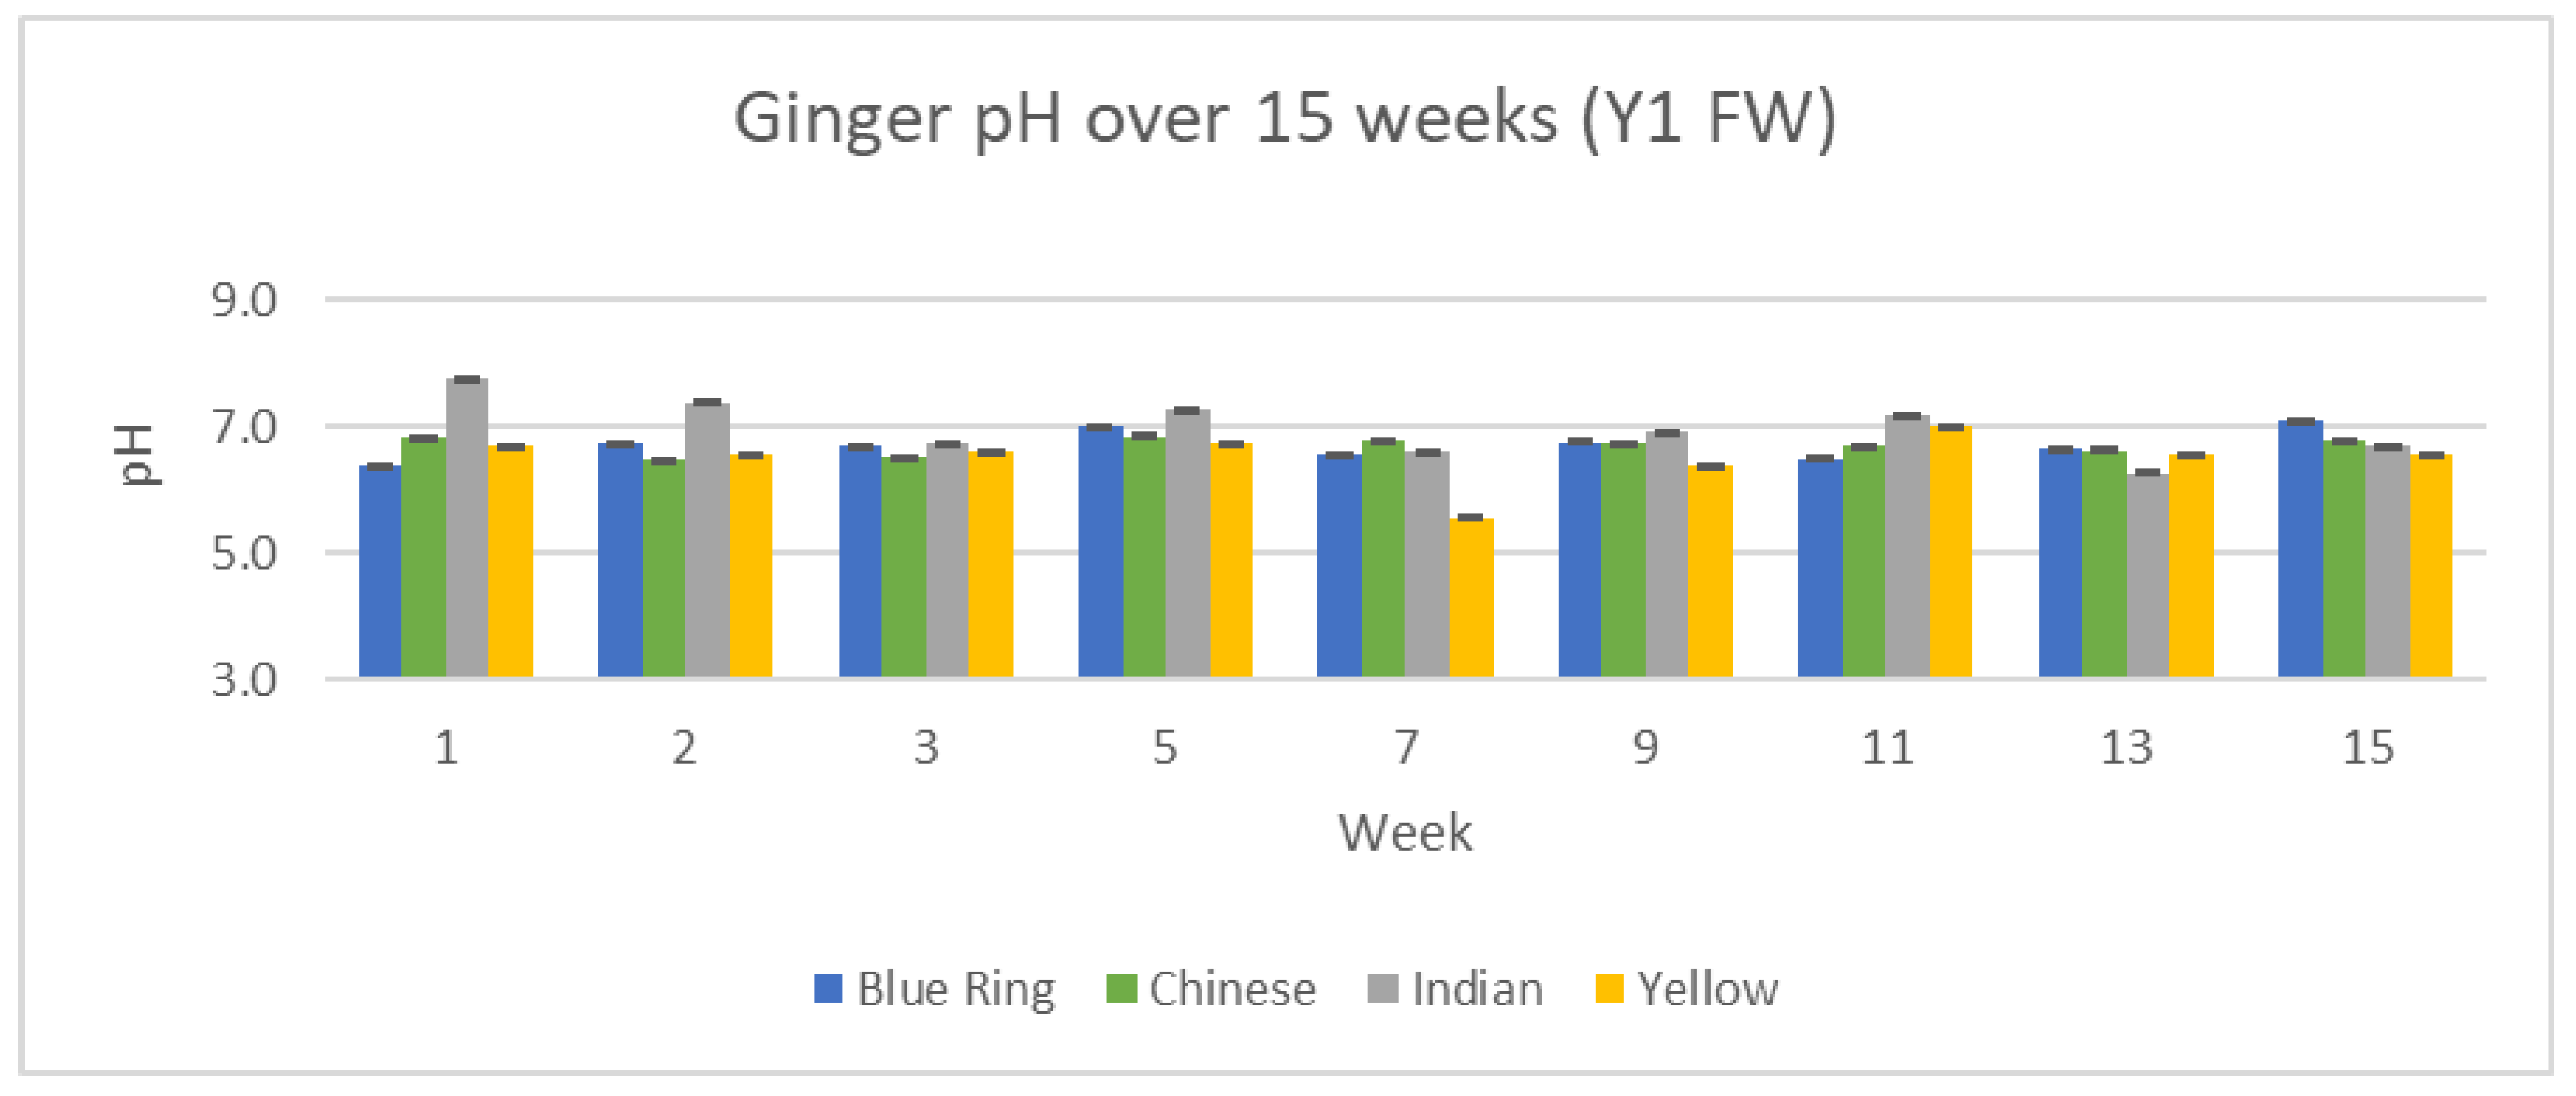
Figure 21.
Y2 Ginger pH over 15 weeks.
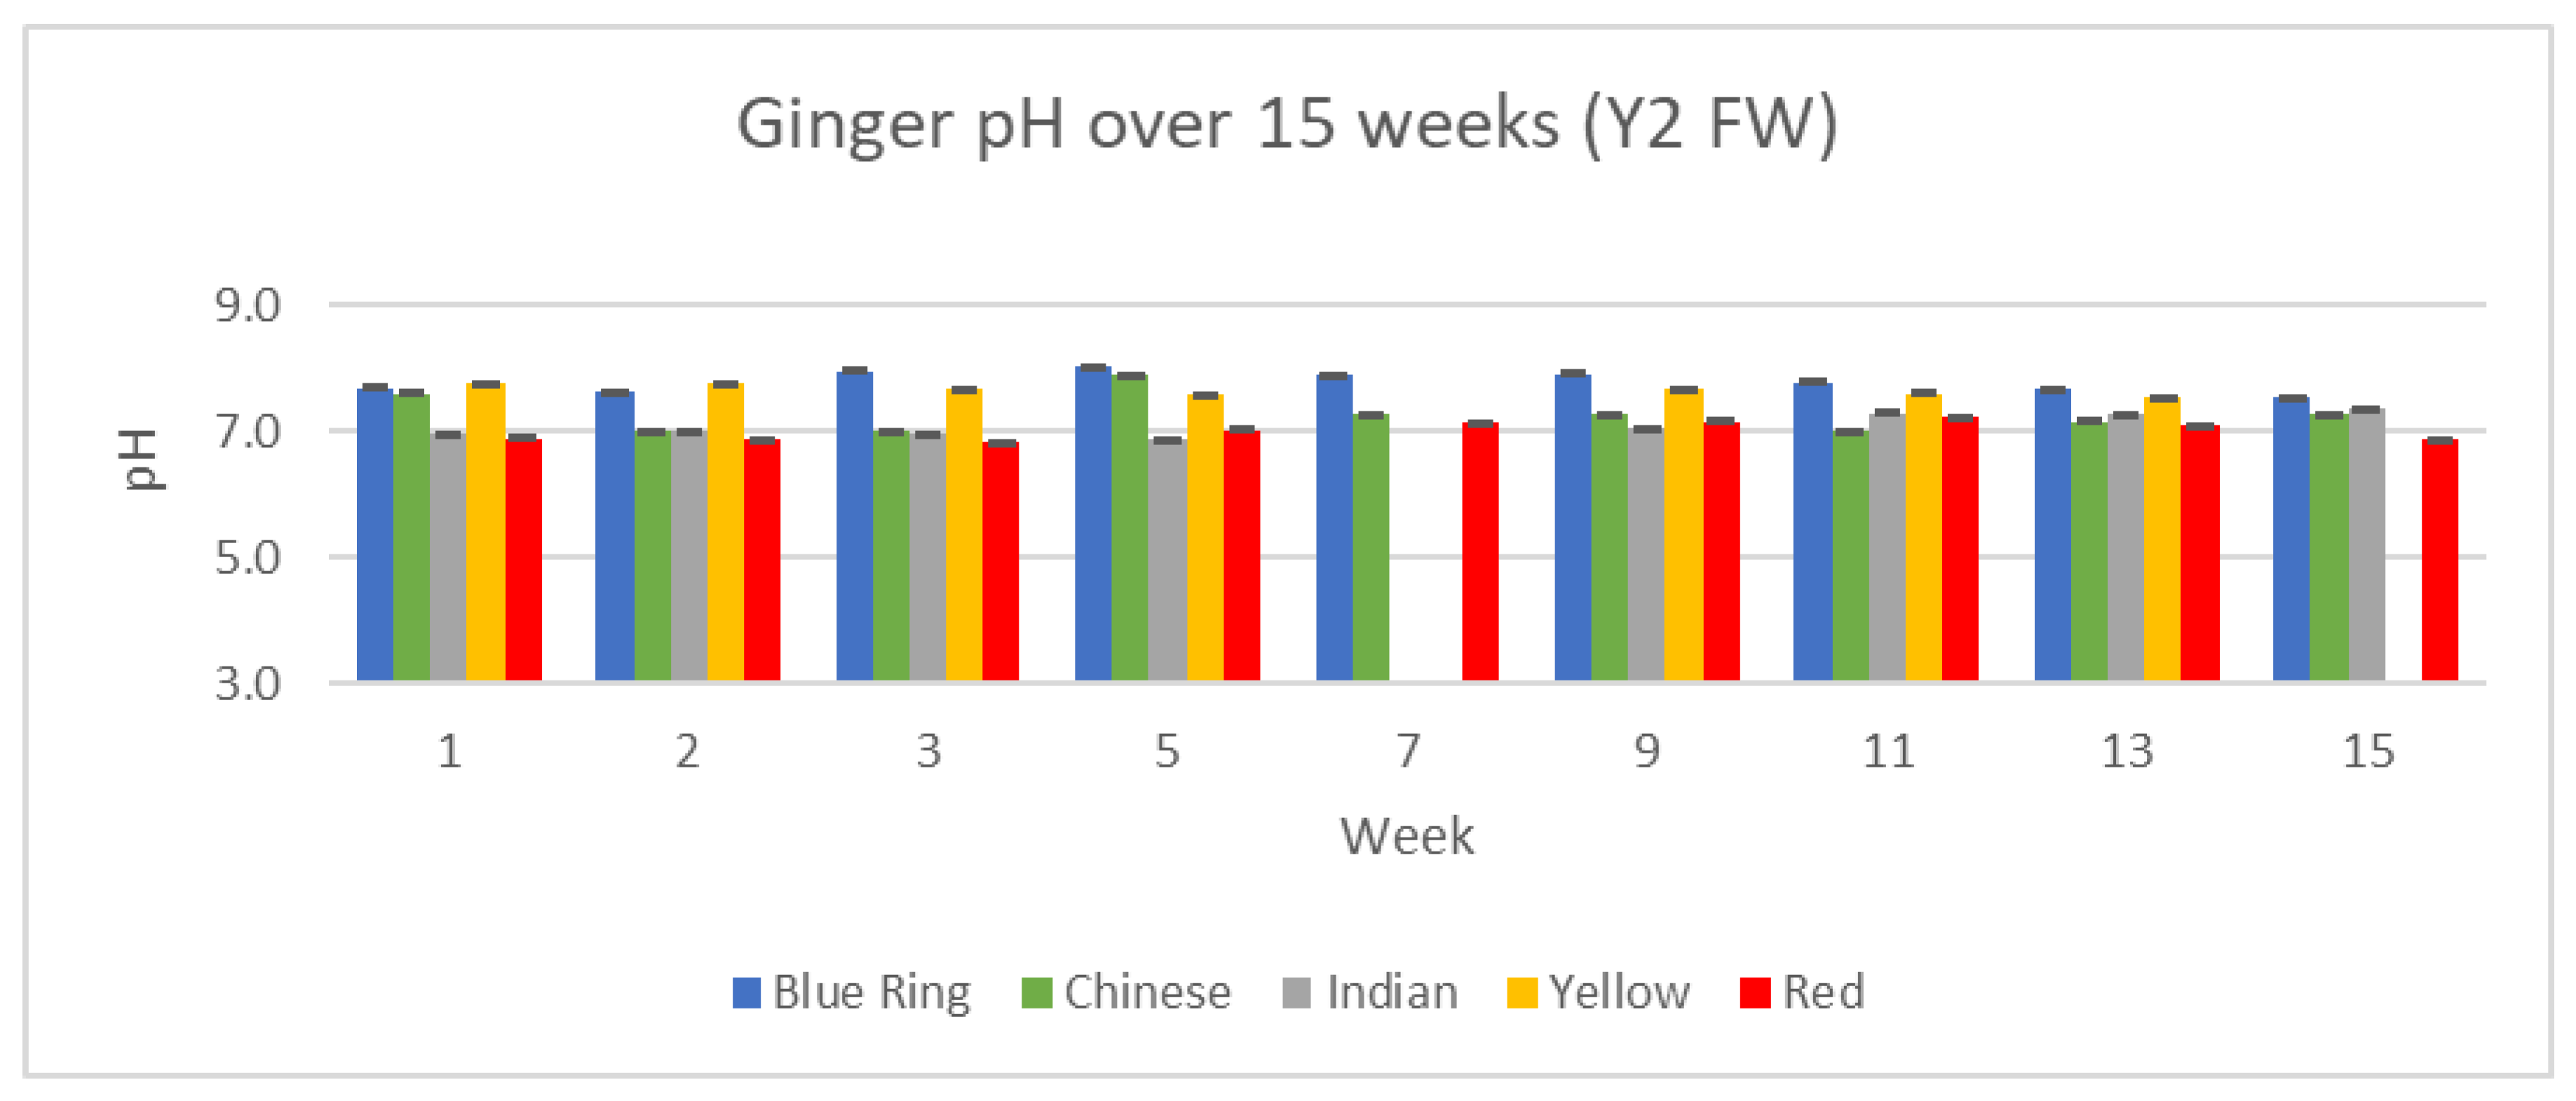
Figure 22.
Young ginger cation analysis results.
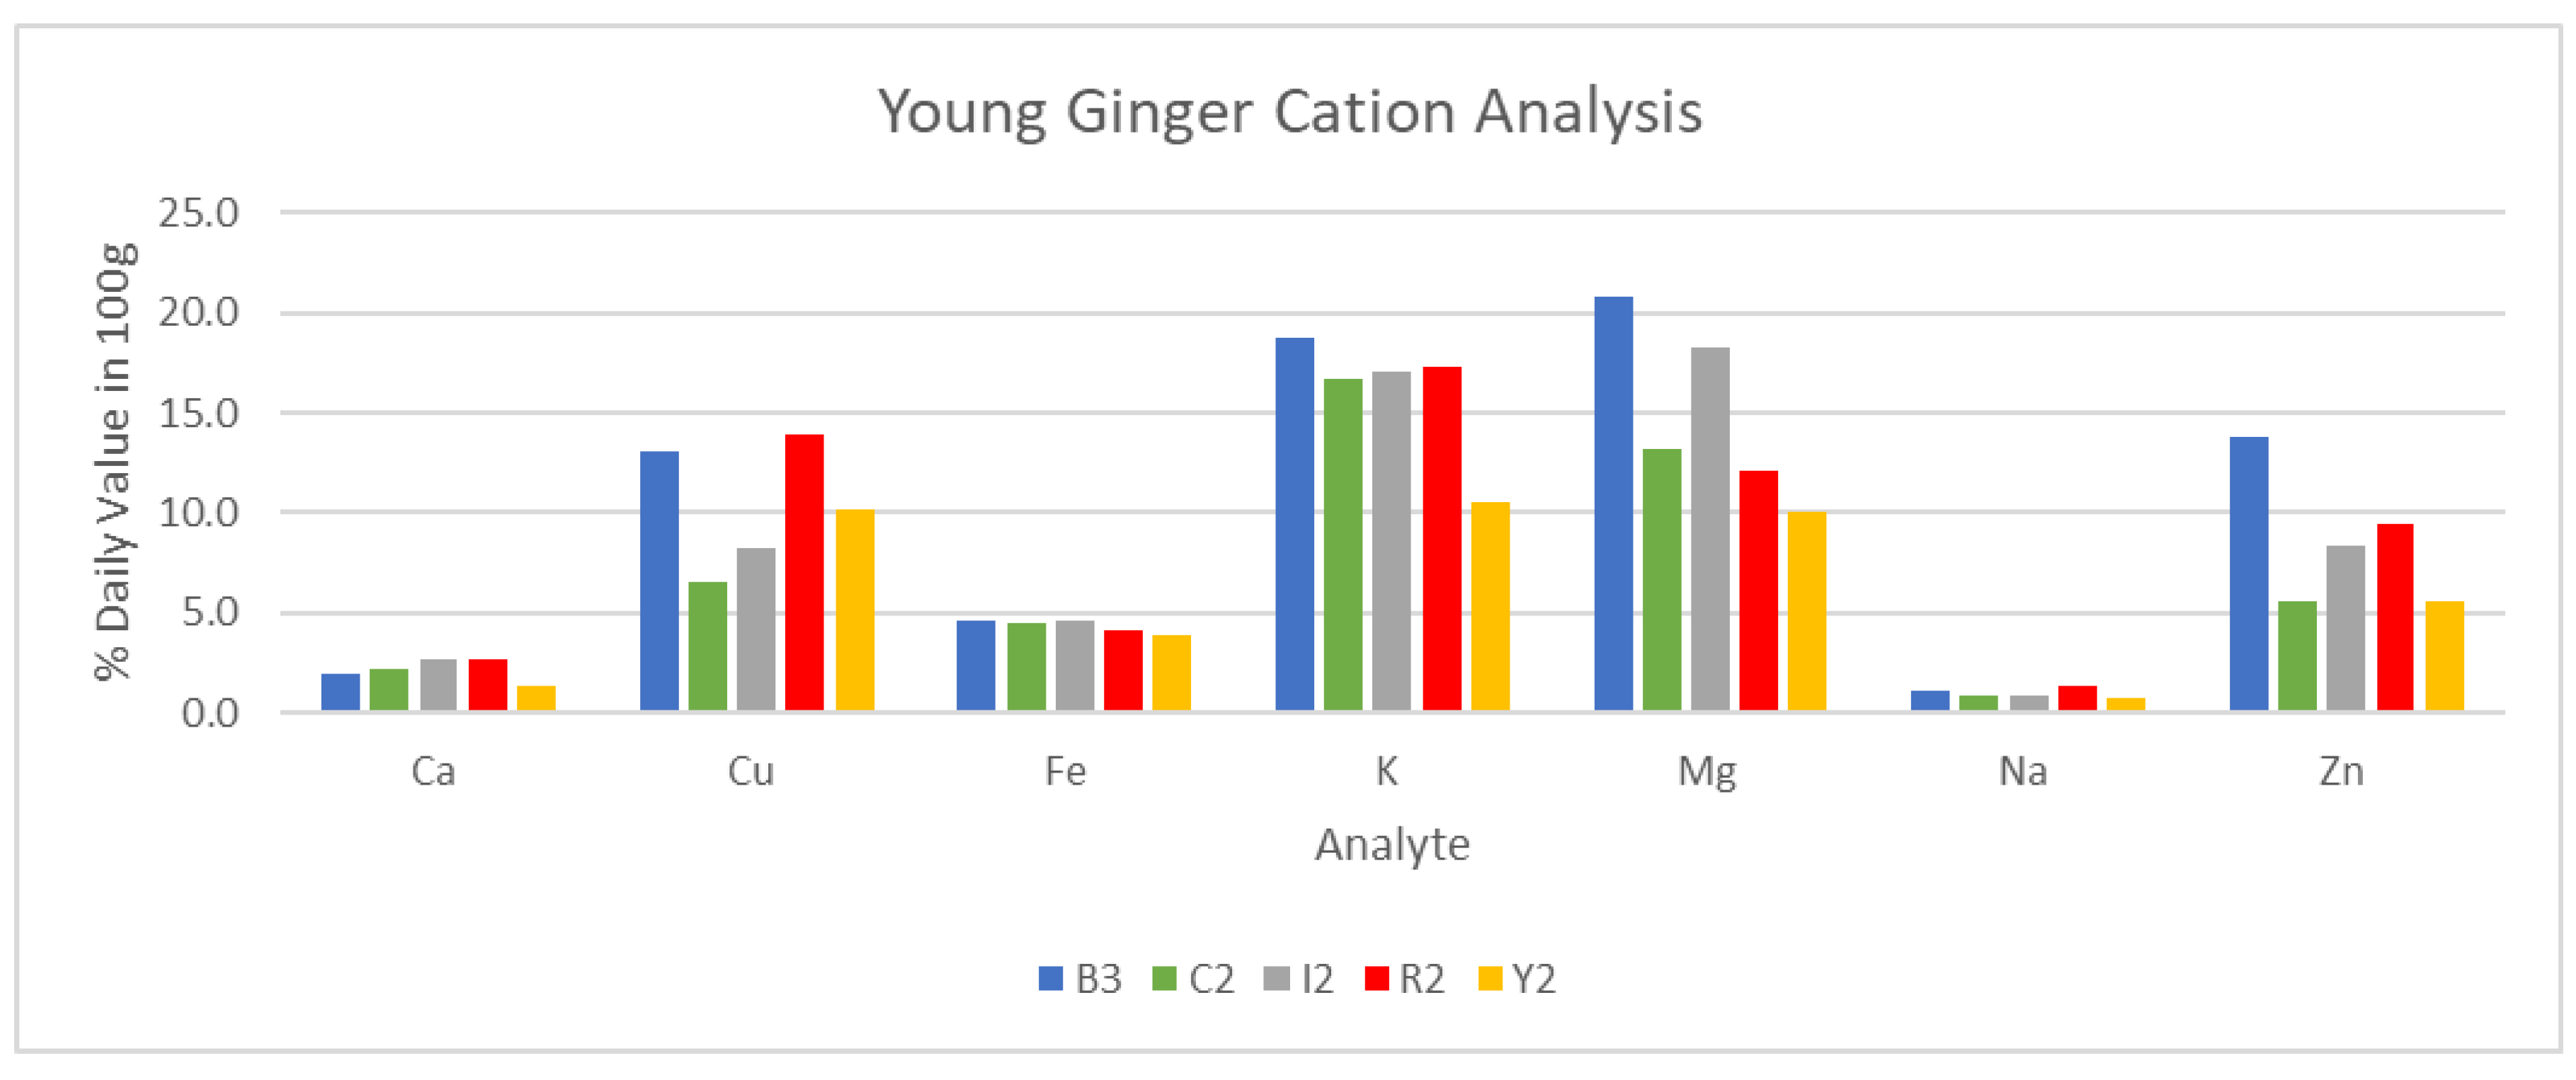
Figure 23.
Old ginger cation analysis results.
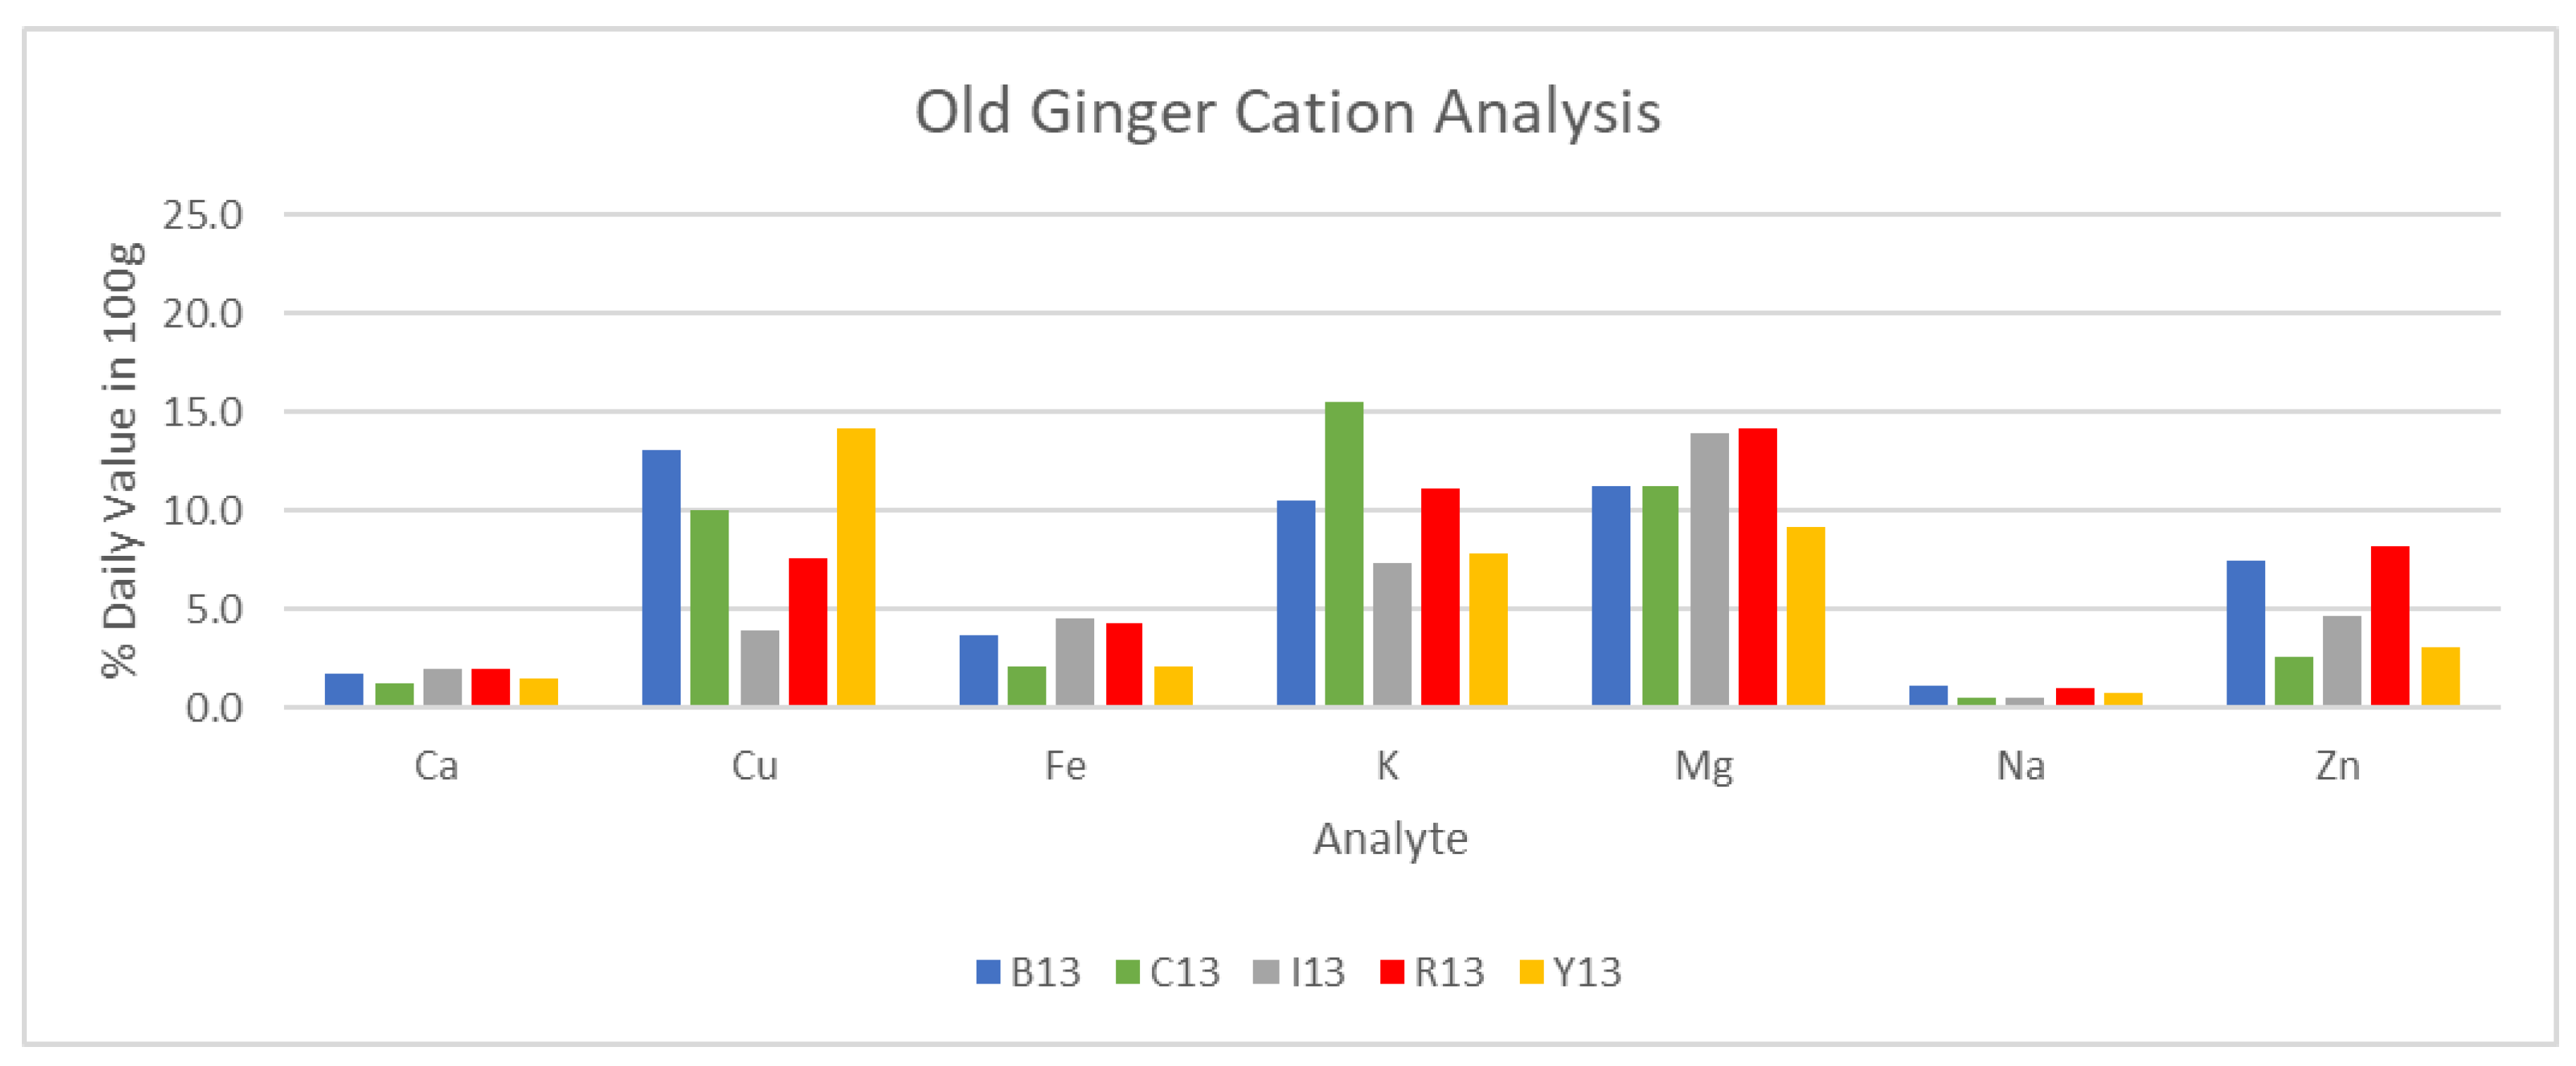
Figure 24.
Sample chromatogram from ginger samples and derived compound information.
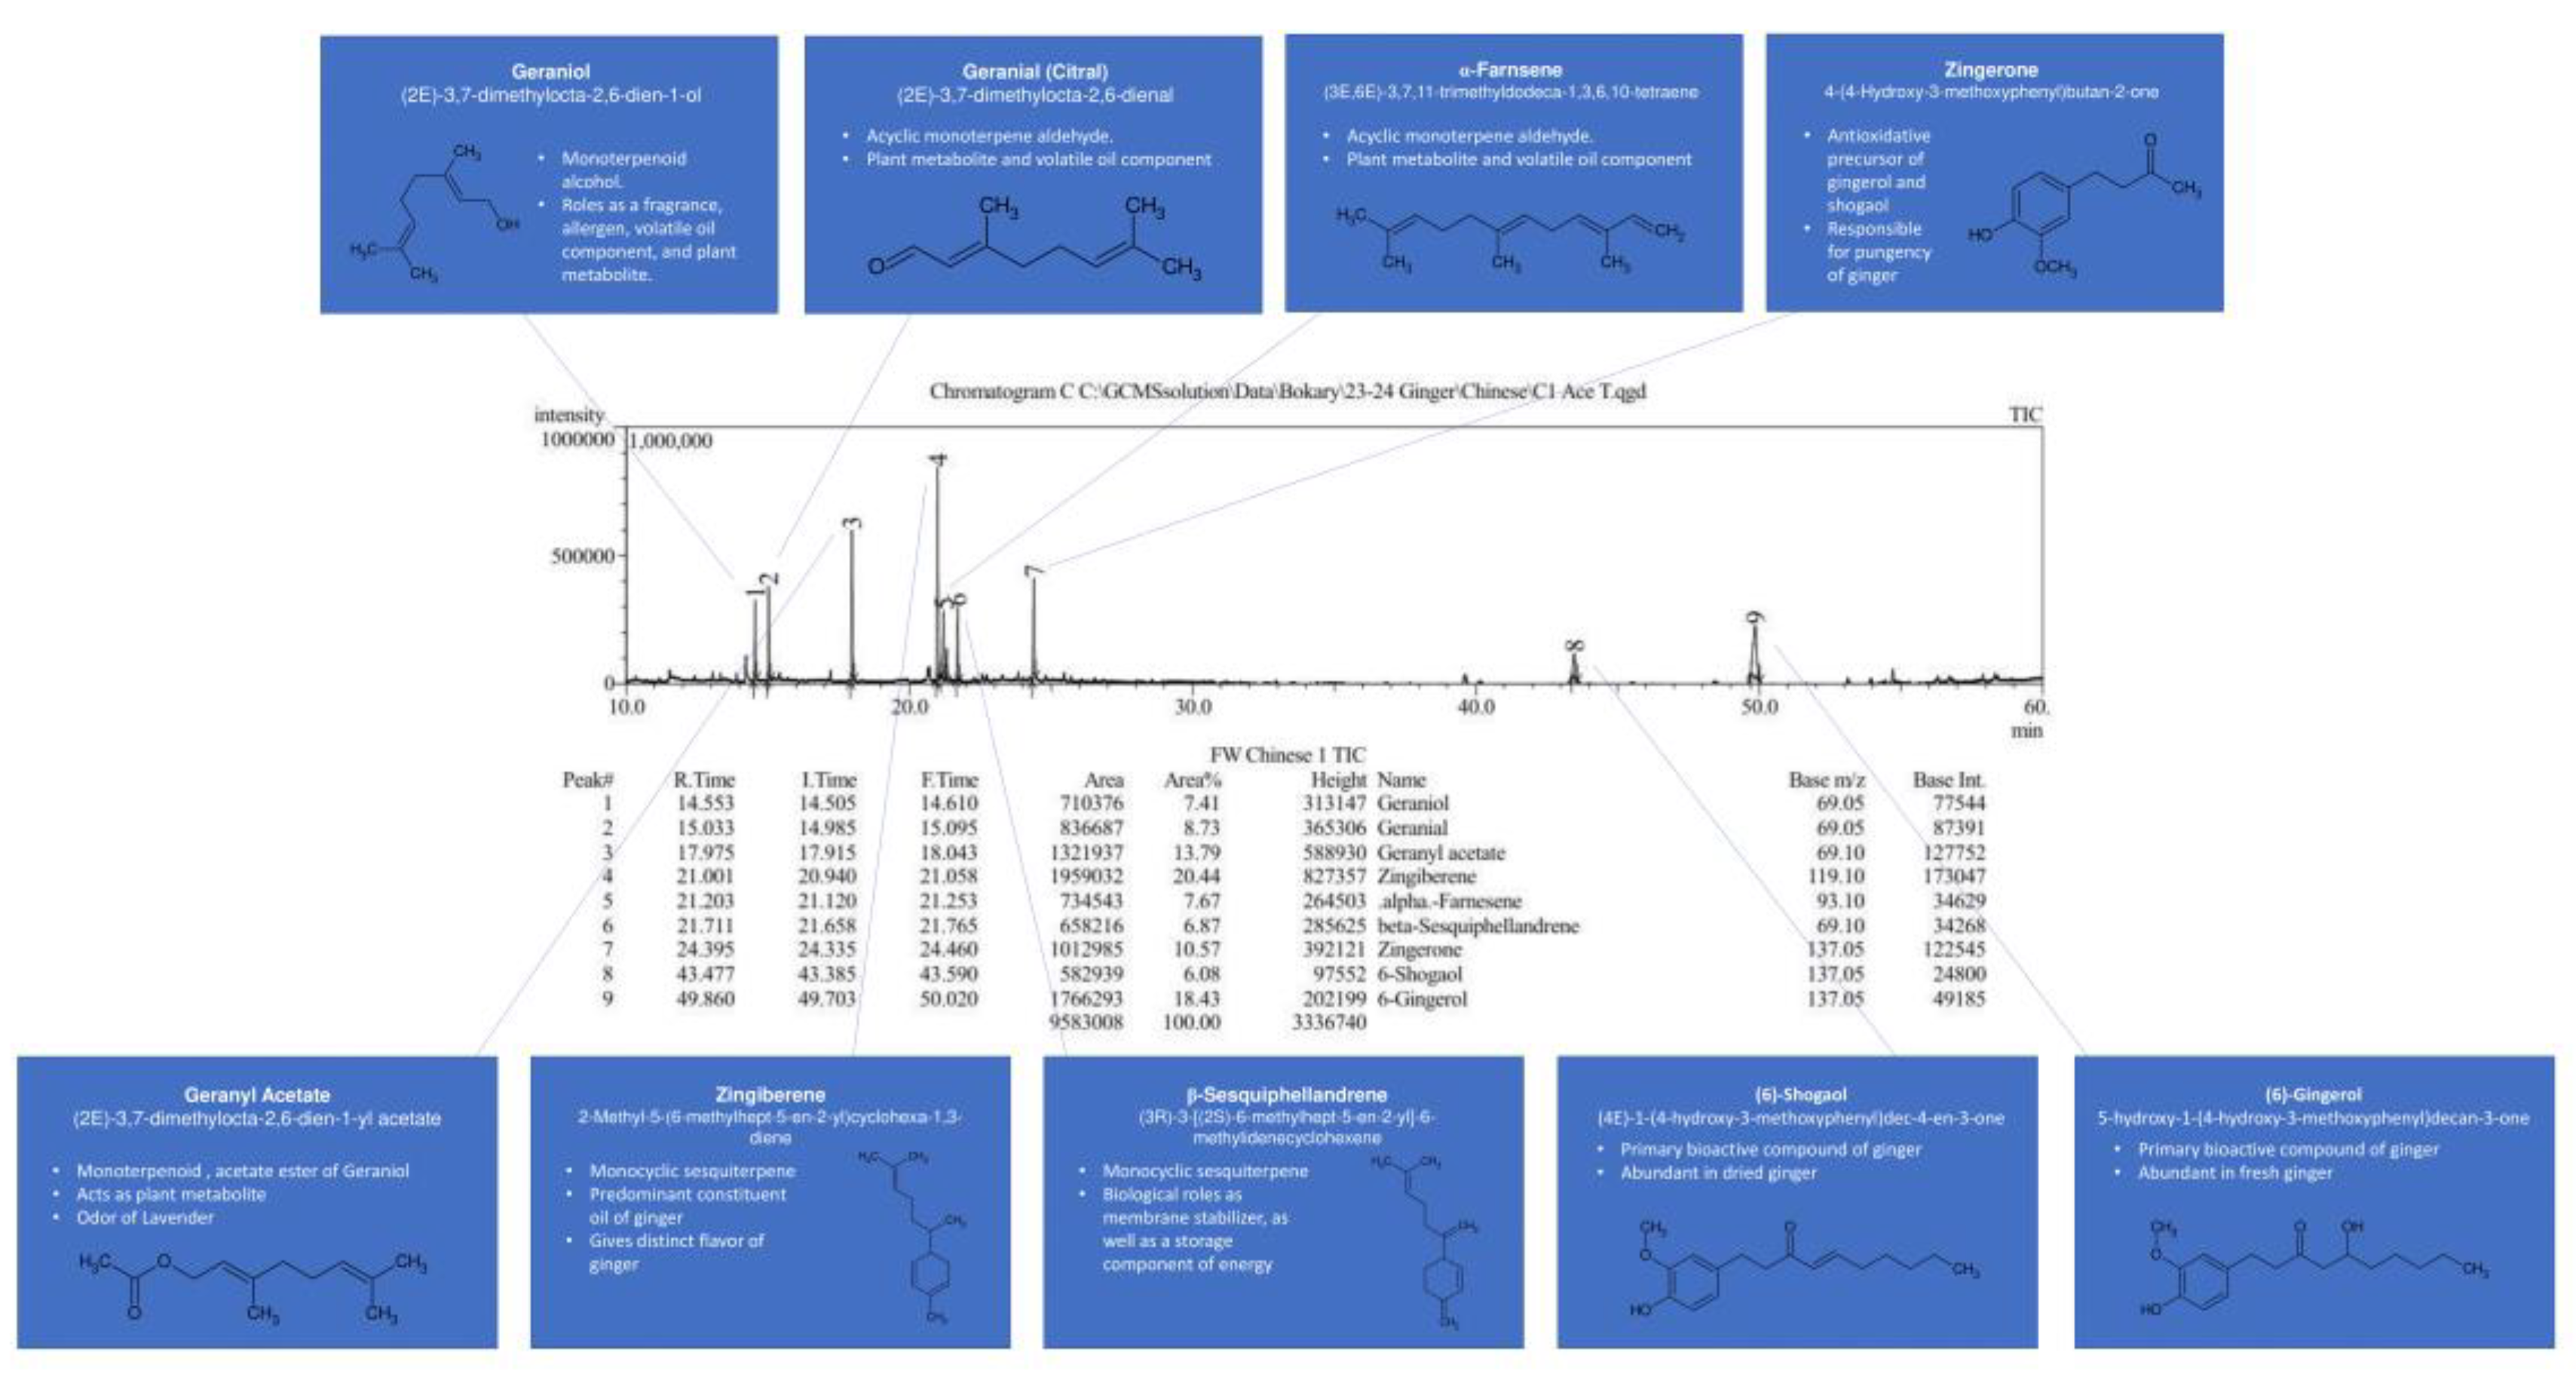
Figure 25.
GC/MS Chromatogram of Chinese ginger over 13 weeks of maturity.
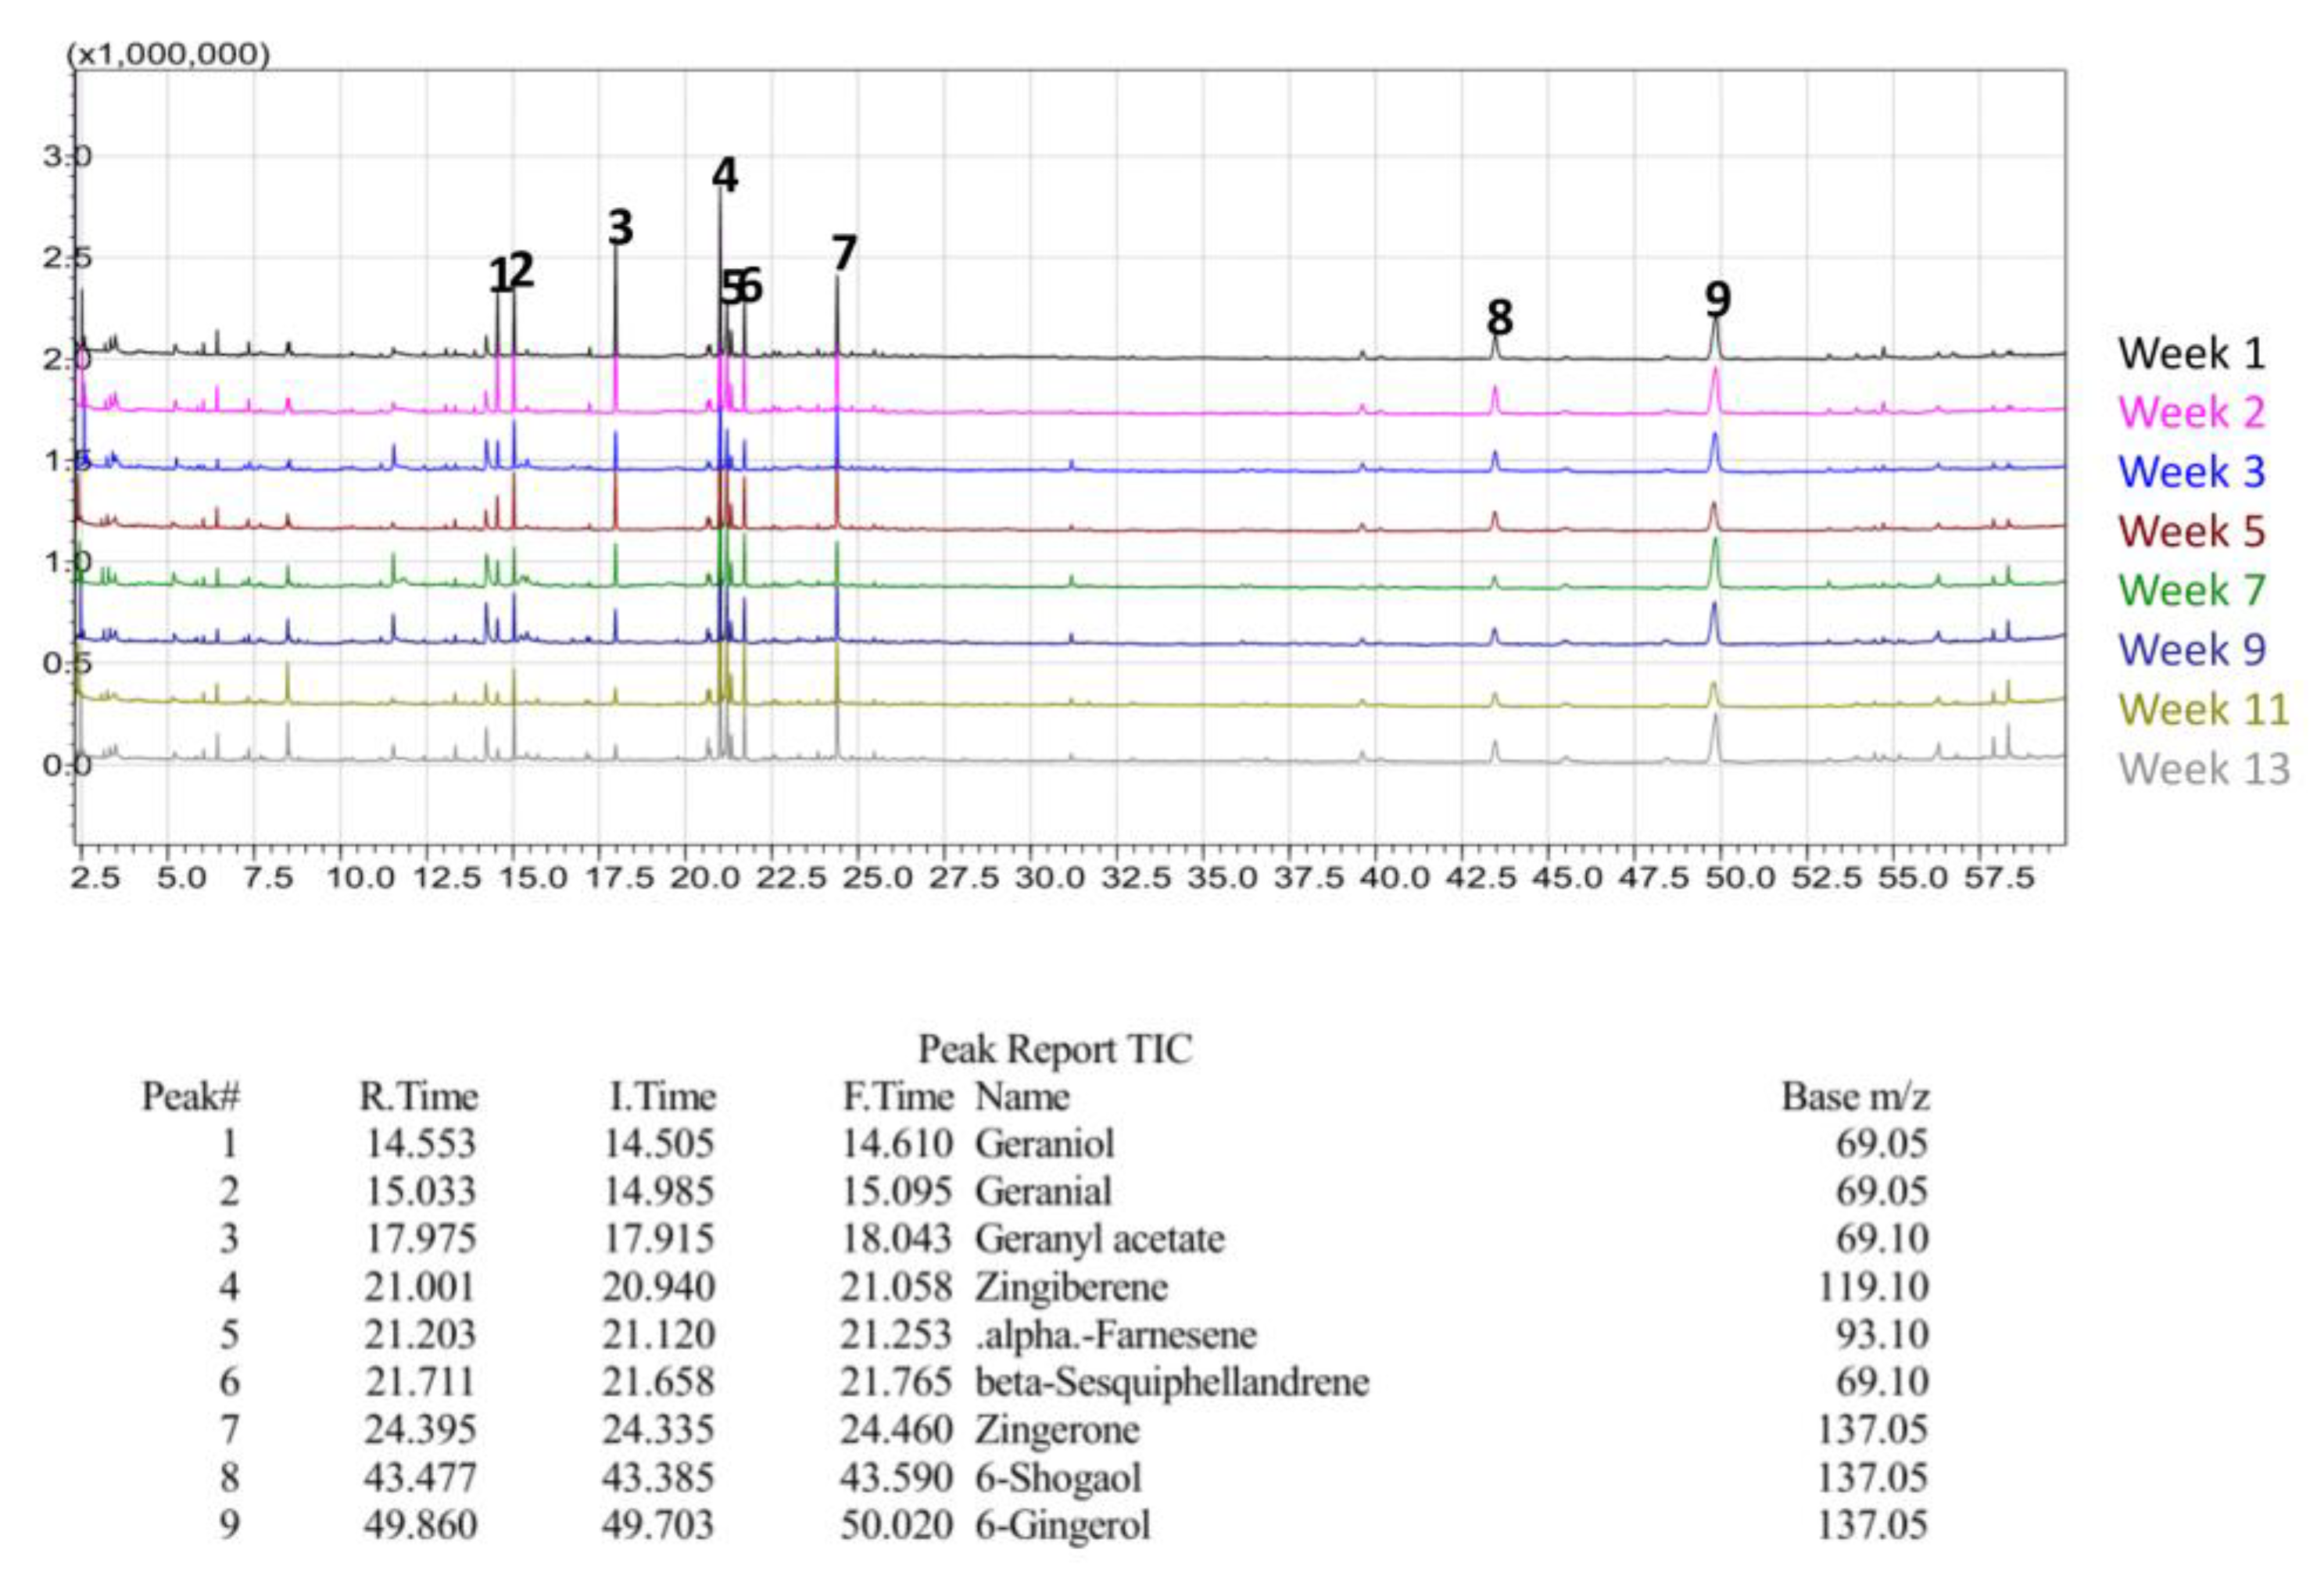
Figure 26.
GC/MS Chromatogram of Indian ginger over 15 weeks of maturity.
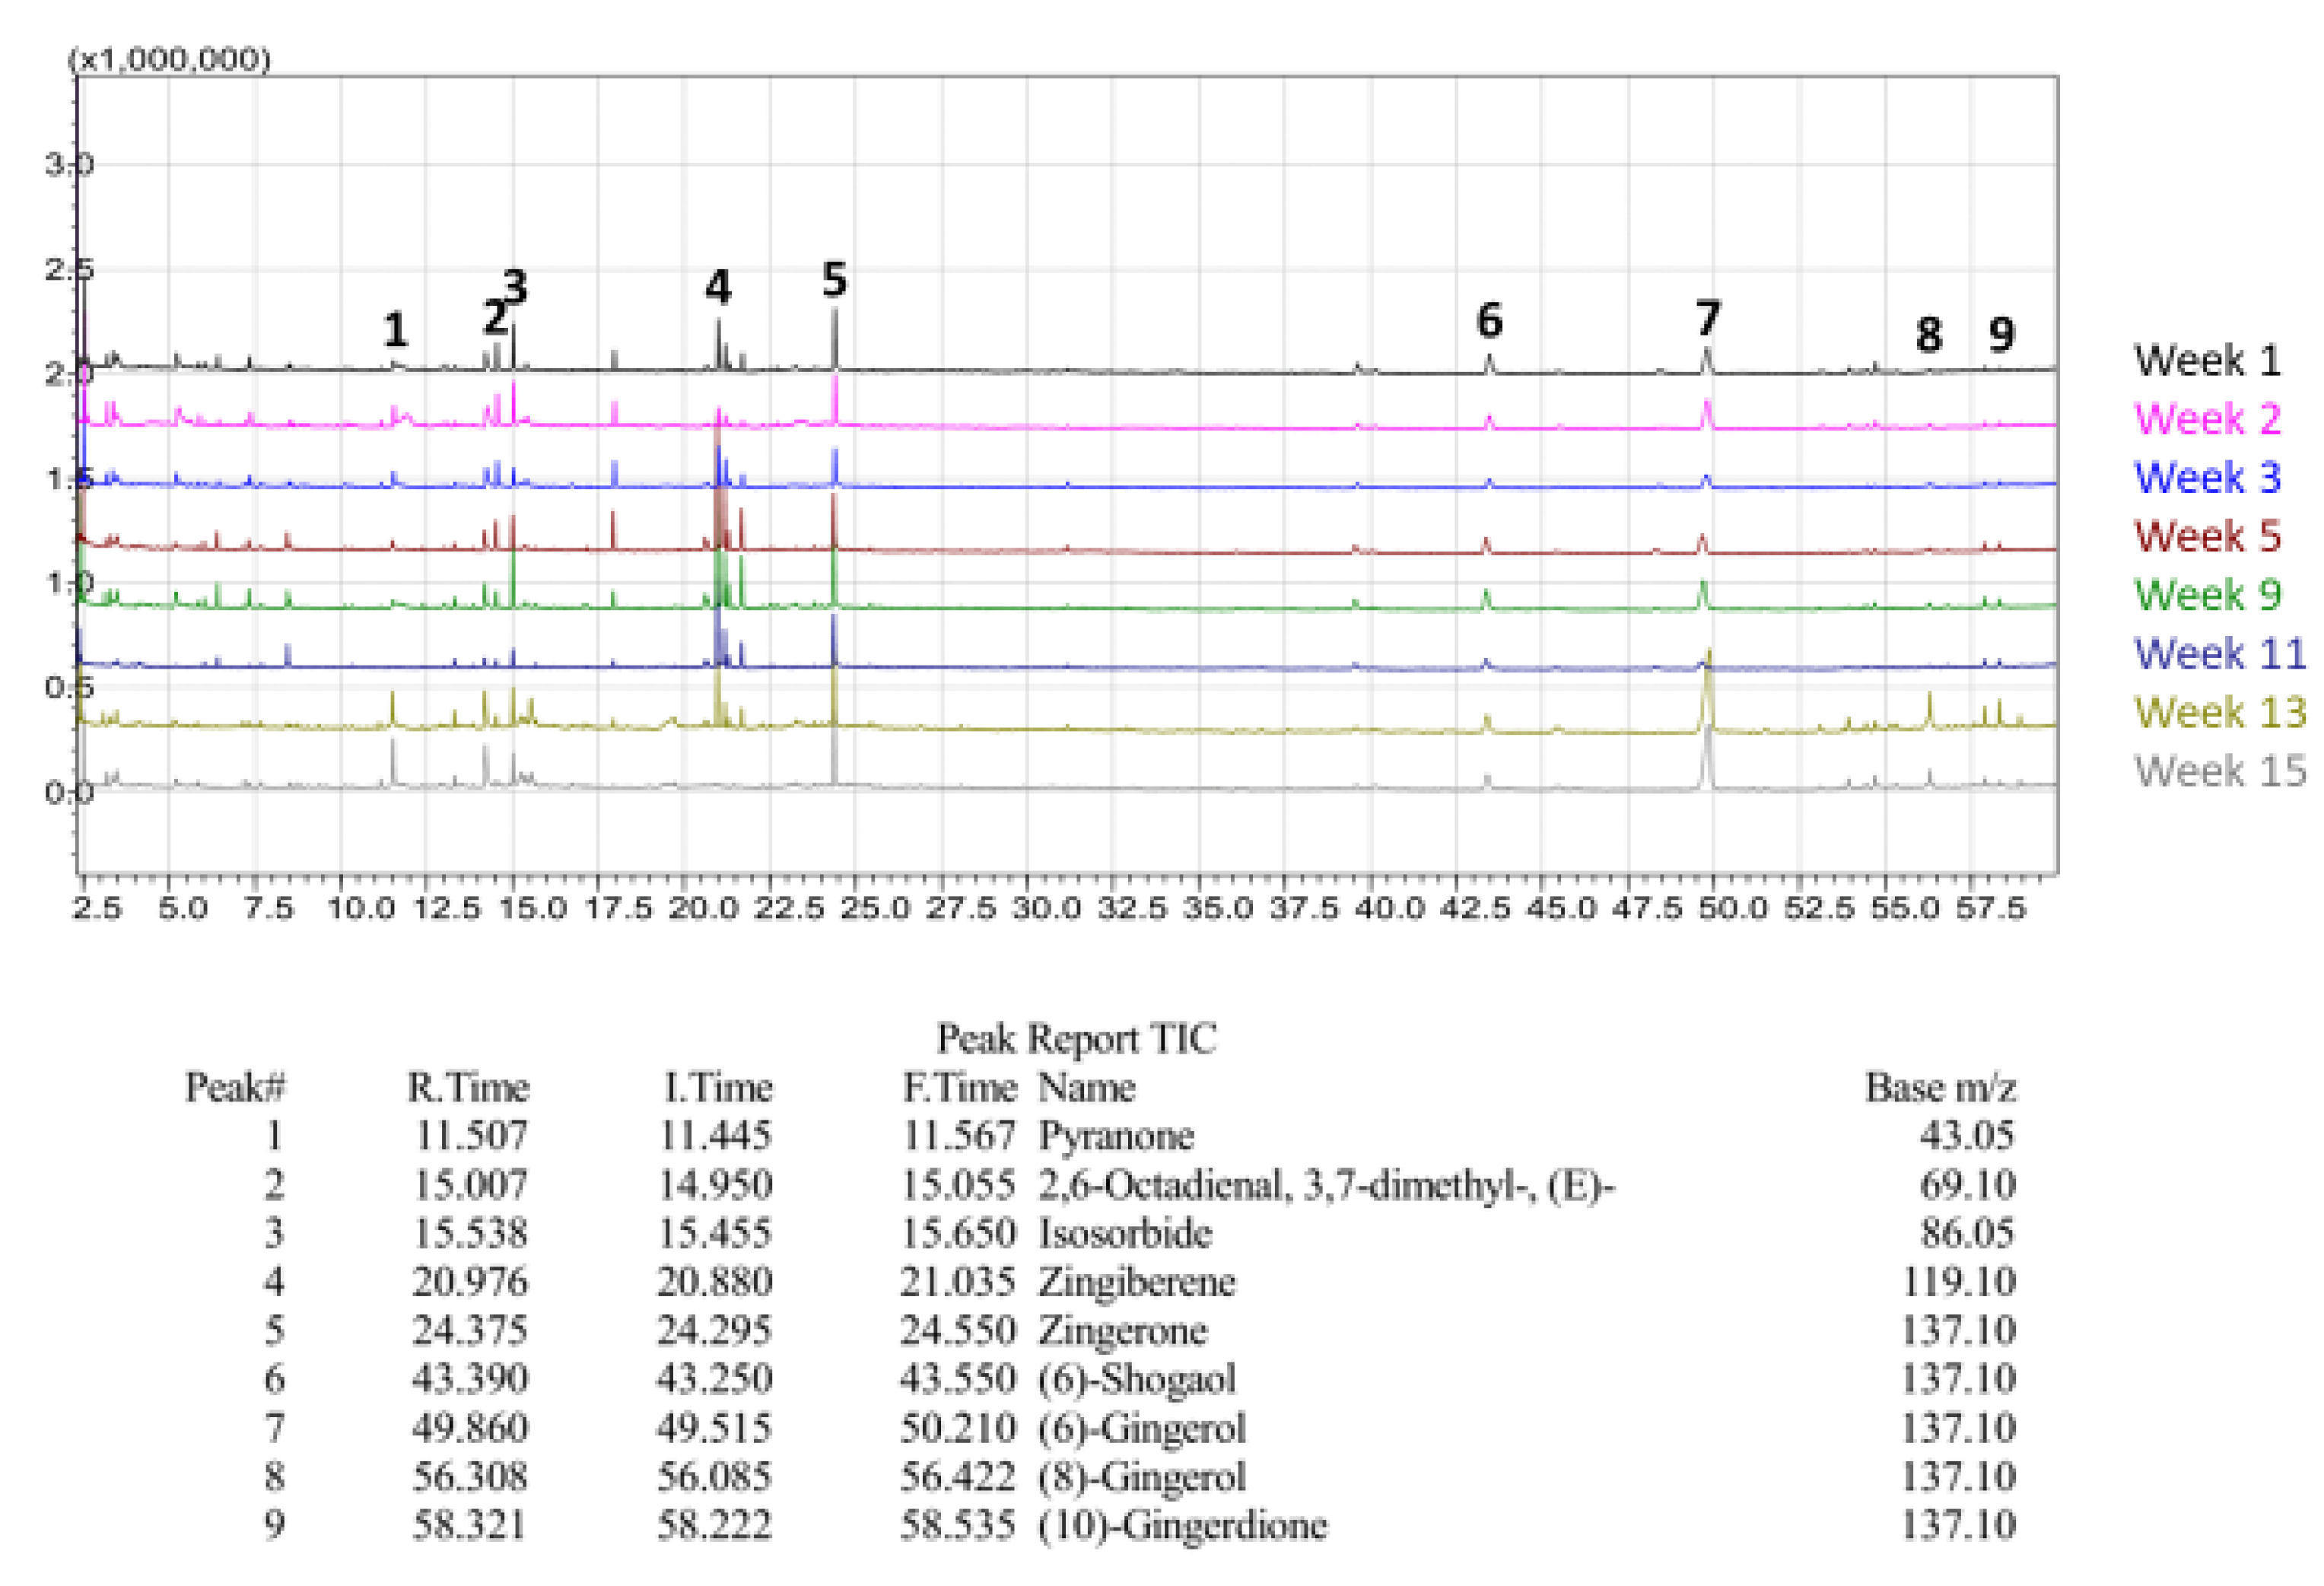
Figure 27.
GC/MS Chromatogram of Red ginger over 13 weeks of maturity.
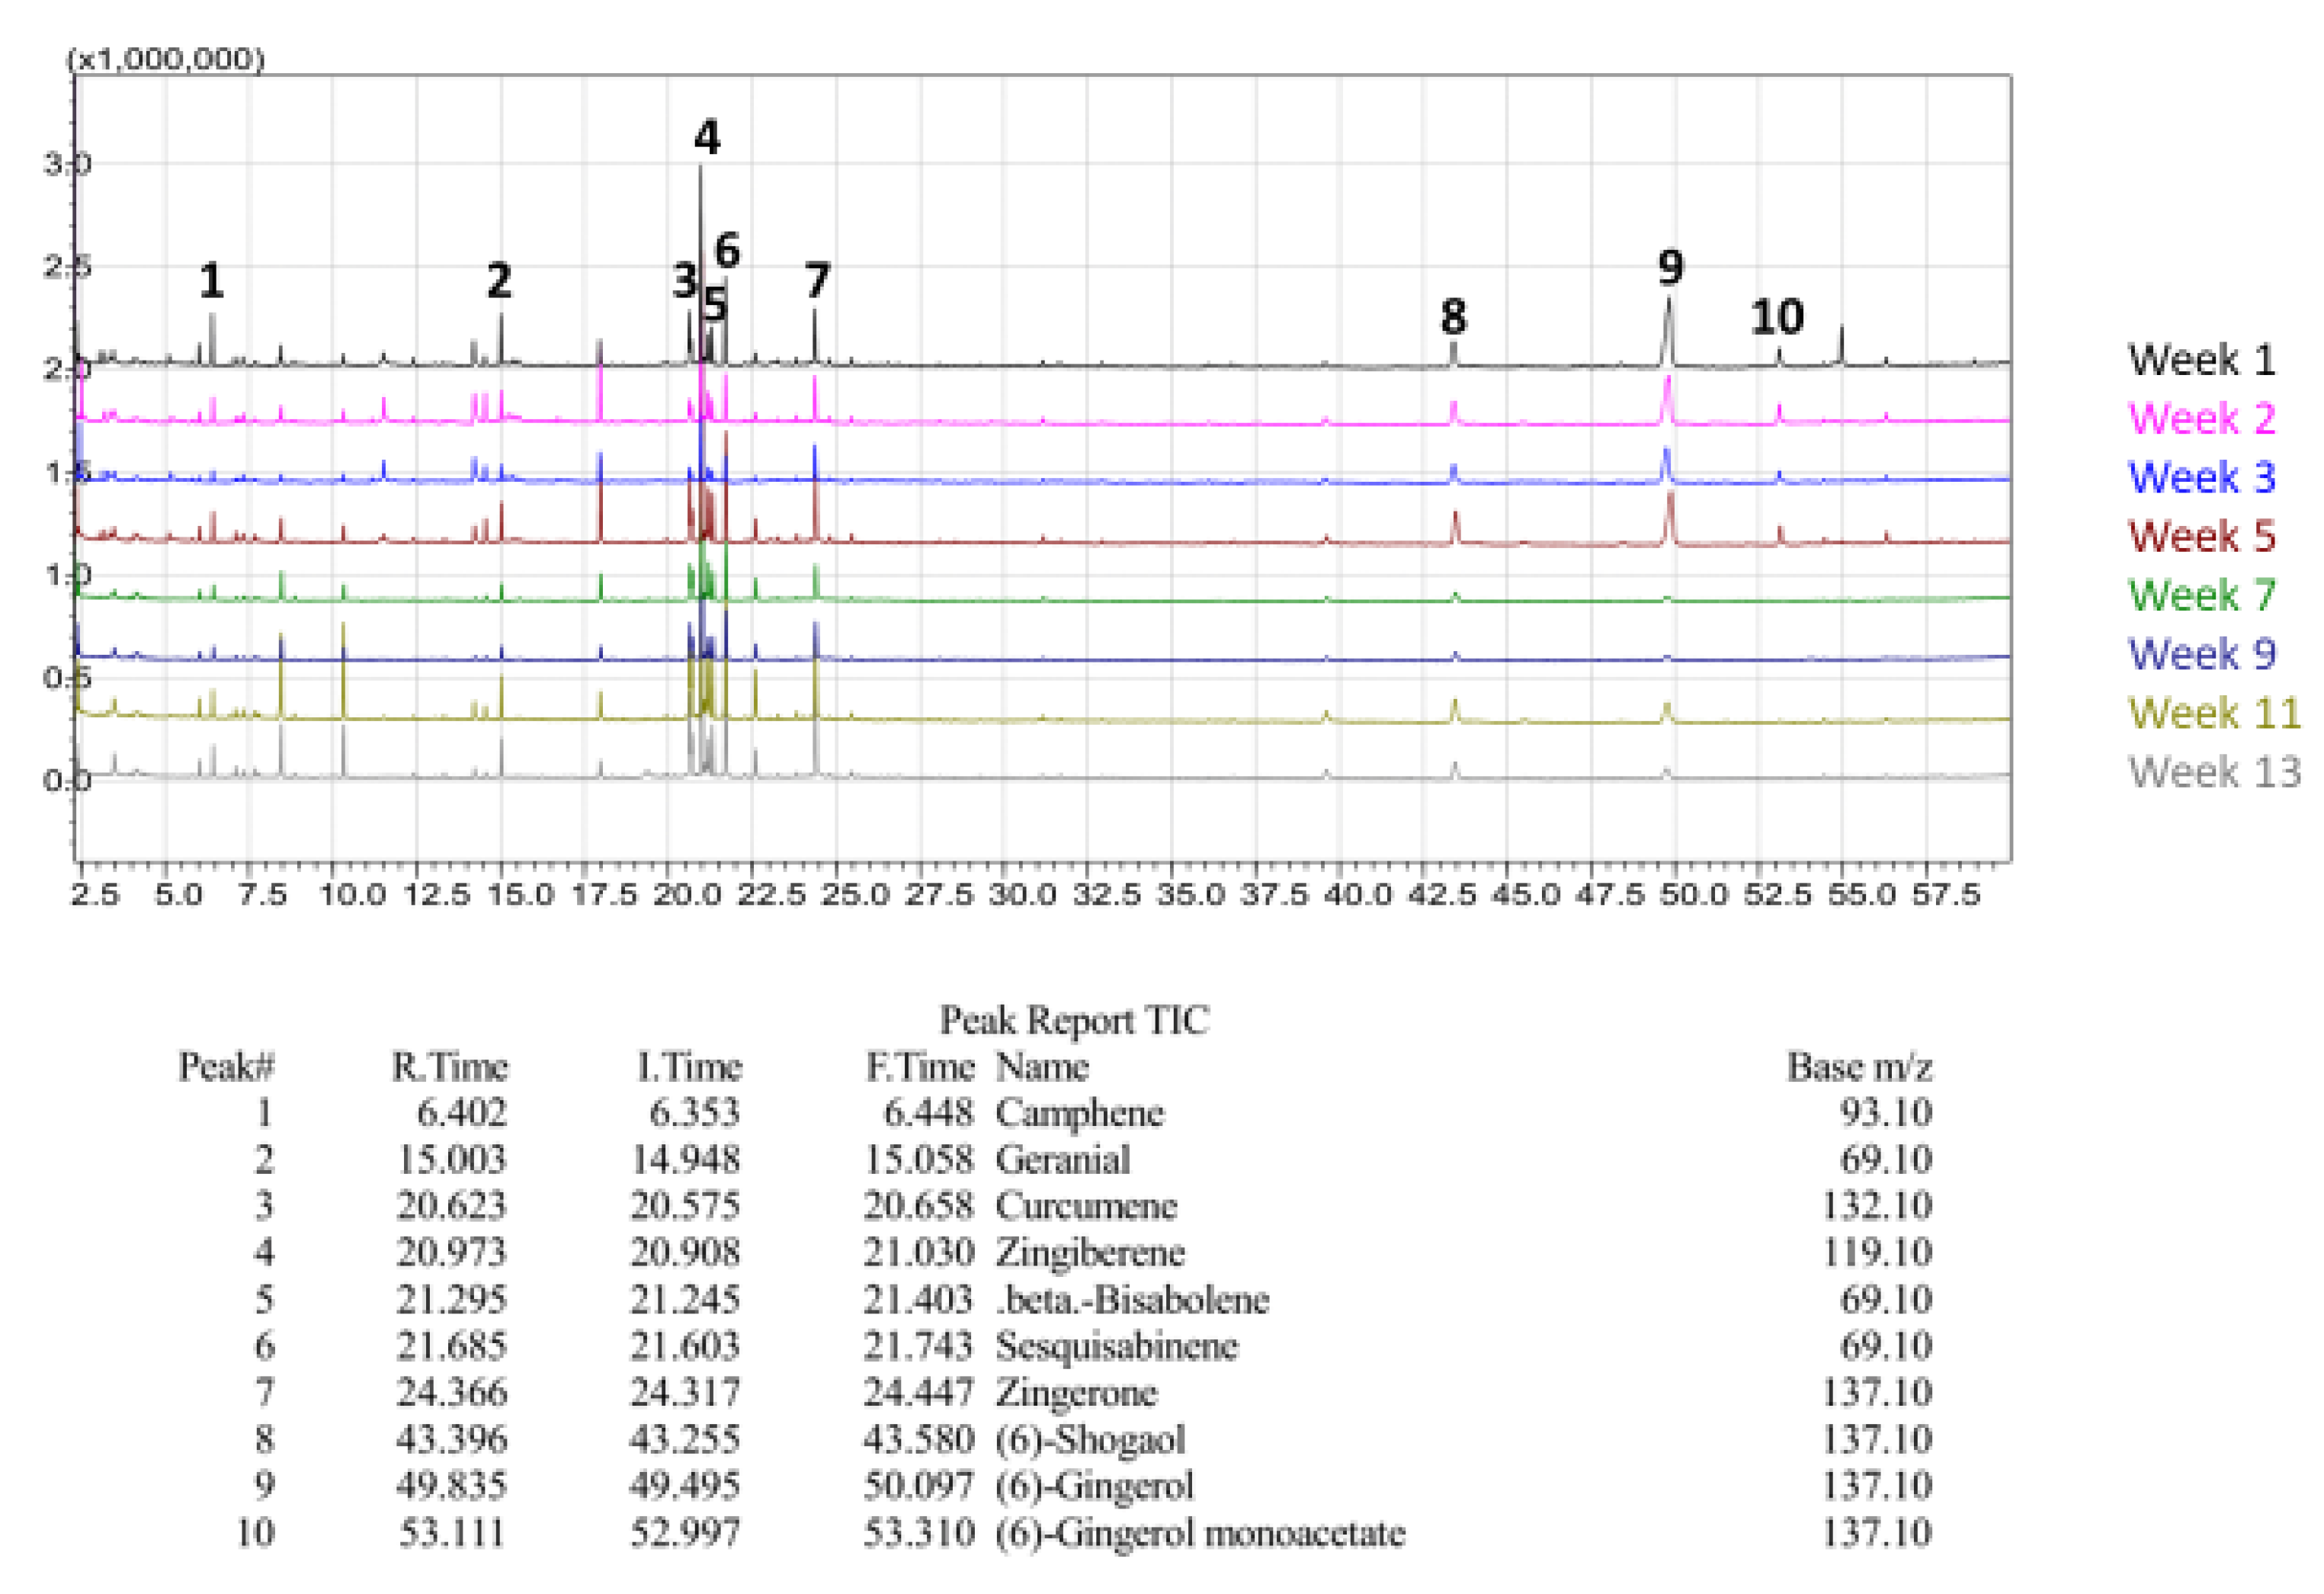

Table 1.
2021 (Y1) ginger sample list.
| Name DW | Date | Name FW | Date |
|---|---|---|---|
| Blue ring-2021 week-1 | 8/17/2021 | Blue ring-2021 week-1 | 8/17/2021 |
| Blue ring-2021 week- 2 | 8/24/2021 | Blue ring-2021 week- 2 | 8/24/2021 |
| Blue ring-2021 week- 3 | 8/31/2021 | Blue ring-2021 week- 3 | 8/31/2021 |
| Blue ring-2021 week-5 | 9/14/2021 | Blue ring-2021 week-5 | 9/14/2021 |
| Blue ring-2021 week-7 | 9/28/2021 | Blue ring-2021 week-7 | 9/28/2021 |
| Blue ring-2021 week-9 | 10/12/2021 | Blue ring-2021 week-9 | 10/12/2021 |
| Blue ring-2021 week-11 | 10/26/2021 | Blue ring-2021 week-11 | 10/26/2021 |
| Blue ring-2021 week-13 | 11/9/2021 | Blue ring-2021 week-13 | 11/9/2021 |
| Blue ring-2021 week-15 | 11/23/2021 | Blue ring-2021 week-15 | 11/23/2021 |
| Blue ring-2021 week-17 | 12/7/2021 | Blue ring-2021 week-17 | 12/7/2021 |
| Blue ring-2021 week-19 | 12/21/2021 | Blue ring-2021 week-19 | 12/21/2021 |
| Blue ring-2021 week-21 | 1/4/2022 | Blue ring-2021 week-21 | 1/4/2022 |
| Blue ring-2021 week-23 | 1/23/2022 | Blue ring-2021 week-23 | 1/23/2022 |
| Blue ring-2021 week-25 | 2/1/2022 | Blue ring-2021 week-25 | 2/1/2022 |
| Chinese-2021 week-1 | 8/17/2021 | Chinese-2021 week-1 | 8/17/2021 |
| Chinese-2021 week-2 | 8/24/2021 | Chinese-2021 week-2 | 8/24/2021 |
| Chinese-2021 week-3 | 8/31/2021 | Chinese-2021 week-3 | 8/31/2021 |
| Chinese-2021 week-5 | 9/14/2021 | Chinese-2021 week-5 | 9/14/2021 |
| Chinese-2021 week-7 | 9/28/2021 | Chinese-2021 week-7 | 9/28/2021 |
| Chinese-2021 week-9 | 10/12/2021 | Chinese-2021 week-9 | 10/12/2021 |
| Chinese-2021 week-11 | 10/26/2021 | Chinese-2021 week-11 | 10/26/2021 |
| Chinese-2021 week-13 | 11/9/2021 | Chinese-2021 week-13 | 11/9/2021 |
| Chinese-2021 week-15 | 11/23/2021 | Chinese-2021 week-15 | 11/23/2021 |
| Chinese-2021 week-17 | 12/7/2021 | Chinese-2021 week-17 | 12/7/2021 |
| Chinese-2021 week-19 | 12/21/2021 | Chinese-2021 week-19 | 12/21/2021 |
| Chinese-2021 week-21 | 1/4/2022 | Chinese-2021 week-21 | 1/4/2022 |
| Chinese-2021 week-23 | 1/23/2022 | Chinese-2021 week-23 | 1/23/2022 |
| Chinese-2021 week-25 | 2/1/2022 | Chinese-2021 week-25 | 2/1/2022 |
| Indian-2021 week-1 | 8/17/2021 | Indian-2021 week-1 | 8/17/2021 |
| Indian-2021 week-2 | 8/24/2021 | Indian-2021 week-2 | 8/24/2021 |
| Indian-2021 week-3 | 8/31/2021 | Indian-2021 week-3 | 8/31/2021 |
| Indian-2021 week-5 | 9/14/2021 | Indian-2021 week-5 | 9/14/2021 |
| Indian-2021 week-7 | 9/28/2021 | Indian-2021 week-7 | 9/28/2021 |
| Indian-2021 week-9 | 10/12/2021 | Indian-2021 week-9 | 10/12/2021 |
| Indian-2021 week-11 | 10/26/2021 | Indian-2021 week-11 | 10/26/2021 |
| Indian-2021 week-13 | 11/9/2021 | Indian-2021 week-13 | 11/9/2021 |
| Indian-2021 week-15 | 11/23/2021 | Indian-2021 week-15 | 11/23/2021 |
| Indian-2021 week-17 | 12/7/2021 | Indian-2021 week-17 | 12/7/2021 |
| Indian-2021 week-19 | 12/21/2021 | Indian-2021 week-19 | 12/21/2021 |
| Indian-2021 week-21 | 1/4/2022 | Indian-2021 week-21 | 1/4/2022 |
| Indian-2021 week-23 | 1/23/2022 | Indian-2021 week-23 | 1/23/2022 |
| Indian-2021 week-25 | 2/1/2022 | Indian-2021 week-25 | 2/1/2022 |
| Yellow-2021 week-1 | 8/17/2021 | Yellow-2021 week-1 | 8/17/2021 |
| Yellow-2021 week-2 | 8/24/2021 | Yellow-2021 week-2 | 8/24/2021 |
| Yellow-2021 week-3 | 8/31/2021 | Yellow-2021 week-3 | 8/31/2021 |
| Yellow-2021 week-5 | 9/14/2021 | Yellow-2021 week-5 | 9/14/2021 |
| Yellow-2021 week-7 | 9/28/2021 | Yellow-2021 week-7 | 9/28/2021 |
| Yellow-2021 week-9 | 10/12/2021 | Yellow-2021 week-9 | 10/12/2021 |
| Yellow-2021 week-11 | 10/26/2021 | Yellow-2021 week-11 | 10/26/2021 |
| Yellow-2021 week-13 | 11/9/2021 | Yellow-2021 week-13 | 11/9/2021 |
| Yellow-2021 week-15 | 11/23/2021 | Yellow-2021 week-15 | 11/23/2021 |
| Yellow-2021 week-17 | 12/7/2021 | Yellow-2021 week-17 | 12/7/2021 |
| Yellow-2021 week-19 | 12/21/2021 | Yellow-2021 week-19 | 12/21/2021 |
| Yellow-2021 week-21 | 1/4/2022 | Yellow-2021 week-21 | 1/4/2022 |
| Yellow-2021 week-23 | 1/23/2022 | Yellow-2021 week-23 | 1/23/2022 |
| Yellow-2021 week-25 | 2/1/2022 | Yellow-2021 week-25 | 2/1/2022 |
| Red-2021 week-1 | 8/17/2021 | Red-2021 week-1 | 8/17/2021 |
| Red-2021 week-2 | 8/24/2021 | Red-2021 week-2 | 8/24/2021 |
| Red-2021 week-3 | 8/31/2021 | Red-2021 week-3 | 8/31/2021 |
| Chinese-2021-week1 in sand | 8/17/2021 | Chinese-2021-week1 in sand | 8/17/2021 |
Table 2.
2022 (Y2) ginger sample list.
| Name DW | Date | Name FW | Date |
|---|---|---|---|
| Blue ring-2022 week-1 | 9/20/2022 | Blue ring-2022 week-1 | 9/20/2022 |
| Blue ring-2022 week- 2 | 9/27/2022 | Blue ring-2022 week- 2 | 9/27/2022 |
| Blue ring-2022 week- 3 | 10/4/2022 | Blue ring-2022 week- 3 | 10/4/2022 |
| Blue ring-2022 week-5 | 10/18/2022 | Blue ring-2022 week-5 | 10/18/2022 |
| Blue ring-2022 week-7 | 11/1/2022 | Blue ring-2022 week-7 | 11/1/2022 |
| Blue ring-2022 week-9 | 11/15/2022 | Blue ring-2022 week-9 | 11/15/2022 |
| Blue ring-2022 week-11 | 11/29/2022 | Blue ring-2022 week-11 | 11/29/2022 |
| Blue ring-2022 week-13 | 12/13/2022 | Blue ring-2022 week-13 | 12/13/2022 |
| Blue ring-2022 week-15 | 12/27/2022 | Blue ring-2022 week-15 | 12/27/2022 |
| Chinese-2022 week-1 | 9/20/2022 | Chinese-2022 week-1 | 9/20/2022 |
| Chinese-2022 week-2 | 9/27/2022 | Chinese-2022 week-2 | 9/27/2022 |
| Chinese-2022 week-3 | 10/4/2022 | Chinese-2022 week-3 | 10/4/2022 |
| Chinese-2022 week-5 | 10/18/2022 | Chinese-2022 week-5 | 10/18/2022 |
| Chinese-2022 week-7 | 11/1/2022 | Chinese-2022 week-7 | 11/1/2022 |
| Chinese-2022 week-9 | 11/15/2022 | Chinese-2022 week-9 | 11/15/2022 |
| Chinese-2022 week-11 | 11/29/2022 | Chinese-2022 week-11 | 11/29/2022 |
| Chinese-2022 week-13 | 12/13/2022 | Chinese-2022 week-13 | 12/13/2022 |
| Chinese-2022 week-15 | 12/27/2022 | Chinese-2022 week-15 | 12/27/2022 |
| Indian-2022 week-1 | 9/20/2022 | Indian-2022 week-1 | 9/20/2022 |
| Indian-2022 week-2 | 9/27/2022 | Indian-2022 week-2 | 9/27/2022 |
| Indian-2022 week-3 | 10/4/2022 | Indian-2022 week-3 | 10/4/2022 |
| Indian-2022 week-5 | 10/18/2022 | Indian-2022 week-5 | 10/18/2022 |
| Indian-2022 week-7 | 11/1/2022 | Indian-2022 week-7 | 11/1/2022 |
| Indian-2022 week-9 | 11/15/2022 | Indian-2022 week-9 | 11/15/2022 |
| Indian-2022 week-11 | 11/29/2022 | Indian-2022 week-11 | 11/29/2022 |
| Indian-2022 week-13 | 12/13/2022 | Indian-2022 week-13 | 12/13/2022 |
| Indian-2022 week-15 | 12/27/2022 | Indian-2022 week-15 | 12/27/2022 |
| Yellow-2022 week-1 | 9/20/2022 | Yellow-2022 week-1 | 9/20/2022 |
| Yellow-2022 week-2 | 9/27/2022 | Yellow-2022 week-2 | 9/27/2022 |
| Yellow-2022 week-3 | 10/4/2022 | Yellow-2022 week-3 | 10/4/2022 |
| Yellow-2022 week-5 | 10/18/2022 | Yellow-2022 week-5 | 10/18/2022 |
| Yellow-2022 week-7 | 11/1/2022 | Yellow-2022 week-7 | 11/1/2022 |
| Yellow-2022 week-9 | 11/15/2022 | Yellow-2022 week-9 | 11/15/2022 |
| Yellow-2022 week-11 | 11/29/2022 | Yellow-2022 week-11 | 11/29/2022 |
| Yellow-2022 week-13 | 12/13/2022 | Yellow-2022 week-13 | 12/13/2022 |
| Yellow-2022 week-15 | 12/27/2022 | Yellow-2022 week-15 | 12/27/2022 |
| Red-2022 week-1 | 9/20/2022 | Red-2022 week-1 | 9/20/2022 |
| Red-2022 week-2 | 9/27/2022 | Red-2022 week-2 | 9/27/2022 |
| Red-2022 week-3 | 10/4/2022 | Red-2022 week-3 | 10/4/2022 |
| Red-2022 week-5 | 10/18/2022 | Red-2022 week-5 | 10/18/2022 |
| Red-2022 week-7 | 11/1/2022 | Red-2022 week-7 | 11/1/2022 |
| Red-2022 week-9 | 11/15/2022 | Red-2022 week-9 | 11/15/2022 |
| Red-2022 week-11 | 11/29/2022 | Red-2022 week-11 | 11/29/2022 |
| Red-2022 week-13 | 12/13/2022 | Red-2022 week-13 | 12/13/2022 |
| Red-2022 week-15 | 12/27/2022 | Red-2022 week-15 | 12/27/2022 |
Table 3.
Program information for freeze-drying.
| Program | Vacuum 2 | Vacuum 1 | Ramp-Rate (min) | Freeze Temp | T1 (℃) | T2 (℃) | Freeze Hour | Hour 1 | Hour 2 (dry) |
|---|---|---|---|---|---|---|---|---|---|
| Fruit | 500 | 600 | 5 | 0 | -35 | 49 | 2 | 2 | 15 |
Table 4.
Year 1 phytochemical screening results for ginger samples.
| Phytochemical | Blue Ring | Red | Yellow | Indian | Chinese |
|---|---|---|---|---|---|
| Alkaloids | Y | Y | Y | Y | Y |
| Flavonoids | Y | Y | Y | Y | Y |
| Tannins | Y | Y | Y | Y | Y |
| Saponins | Y | Y | Y | Y | Y |
| Glycosides | Y | Y | |||
| Anthraquinones | Y | Y | Y | ||
| Steroids | Y | Y | |||
| Phenolics | Y | Y | Y | Y | Y |
| Oxalate | Y | Y | Y | Y | Y |
| Carbohydrates | Y | Y | Y |
Table 5.
Concentration of Various Mineral Analytes in ginger (DW) (Y2) (mg/100g DW).
| Analyte | Ca | Cu | Fe | K | Mg | Mn | Na | Se | Zn |
|---|---|---|---|---|---|---|---|---|---|
| B3 | 25.2 | 0.1 | 0.83 | 879.7 | 87.2 | 4.2 | 24.6 | 0.017 | 1.5 |
| B5 | 20.9 | 0.1 | 0.82 | 622.2 | 49.7 | 6.4 | 10.1 | 0.007 | 0.7 |
| B7 | 15.1 | 0.1 | 0.69 | 415.9 | 44.7 | 2.8 | 11.2 | 0.013 | 0.7 |
| B9 | 16.28 | 0.1 | 0.74 | 412.76 | 48.93 | 1.63 | 10.83 | 0.020 | 0.9 |
| B11 | 29.7 | 0.1 | 0.69 | 327.9 | 60.5 | 3.7 | 21.4 | 0.002 | 0.9 |
| B13 | 22.3 | 0.1 | 0.66 | 491.6 | 47.1 | 1.4 | 24.7 | 0.005 | 0.8 |
| B15 | 28.9 | 0.1 | 0.86 | 399.2 | 66.4 | 2.2 | 18.2 | 0.010 | 0.9 |
| C2 | 28.0 | 0.1 | 0.80 | 782.7 | 55.3 | 5.9 | 19.2 | 0.006 | 0.6 |
| C3 | 32.6 | 0.1 | 0.61 | 727.0 | 69.1 | 4.2 | 19.8 | 0.012 | 0.3 |
| C5 | 34.9 | 0.1 | 0.67 | 832.3 | 74.8 | 6.1 | 18.7 | 0.000 | 0.6 |
| C7 | 22.5 | 0.1 | 0.40 | 517.9 | 63.7 | 2.1 | 16.4 | 0.009 | 0.6 |
| C9 | 28.5 | 0.0 | 0.44 | 494.5 | 46.3 | 3.0 | 23.9 | 0.011 | 0.3 |
| C11 | 22.4 | 0.1 | 0.40 | 393.7 | 60.7 | 4.8 | 10.0 | 0.005 | 0.5 |
| C13 | 16.0 | 0.1 | 0.37 | 730.6 | 47.0 | 0.4 | 10.7 | -0.001 | 0.3 |
| C15 | 24.3 | 0.1 | 0.89 | 244.9 | 68.0 | 5.0 | 14.5 | 0.007 | 0.8 |
| I2 | 35.2 | 0.1 | 0.82 | 799.7 | 76.6 | 3.2 | 20.7 | 0.011 | 0.9 |
| I5 | 28.0 | 0.1 | 0.52 | 510.8 | 55.6 | 1.2 | 14.5 | 0.008 | 0.5 |
| I7 | 24.1 | 0.1 | 0.57 | 485.2 | 53.7 | 2.4 | 16.8 | 0.007 | 0.6 |
| I9 | 22.9 | 0.1 | 0.62 | 445.2 | 46.3 | 1.6 | 16.0 | -0.001 | 0.4 |
| I11 | 20.5 | 0.0 | 0.65 | 508.6 | 56.8 | 2.6 | 16.6 | 0.011 | 0.4 |
| I13 | 25.4 | 0.0 | 0.82 | 343.0 | 58.3 | 1.4 | 10.5 | 0.003 | 0.5 |
| I15 | 20.2 | 0.0 | 0.51 | 499.6 | 55.6 | 1.5 | 9.3 | 0.003 | 0.4 |
| R2 | 34.5 | 0.1 | 0.74 | 811.4 | 50.7 | 3.4 | 30.4 | 0.001 | 1.0 |
| R3 | 34.9 | 0.1 | 0.91 | 787.6 | 84.4 | 6.2 | 44.0 | 0.014 | 1.1 |
| R5 | 29.9 | 1.8 | 2.07 | 765.8 | 54.4 | 6.1 | 33.3 | 0.004 | 2.0 |
| R7 | 21.8 | 0.1 | 0.65 | 630.2 | 52.2 | 3.7 | 20.2 | 0.006 | 0.7 |
| R9 | 18.1 | 0.4 | 0.72 | 535.5 | 42.9 | 1.7 | 18.1 | 0.002 | 1.0 |
| R11 | 20.4 | 0.2 | 0.98 | 483.5 | 44.0 | 3.8 | 22.8 | 0.010 | 0.8 |
| R13 | 25.5 | 0.1 | 0.78 | 524.9 | 59.5 | 1.1 | 21.6 | 0.017 | 0.9 |
| R15 | 19.2 | 0.1 | 0.62 | 516.7 | 52.7 | 1.5 | 18.6 | 0.016 | 0.8 |
| Y2 | 17.9 | 0.1 | 0.69 | 496.8 | 42.4 | 1.2 | 17.8 | 0.012 | 0.6 |
| Y3 | 27.0 | 2.4 | 1.41 | 830.5 | 63.5 | 2.4 | 18.0 | -0.003 | 1.2 |
| Y5 | 21.3 | 0.1 | 0.73 | 480.0 | 53.9 | 3.0 | 17.3 | 0.005 | 0.8 |
| Y7 | 18.3 | 0.8 | 1.42 | 374.3 | 58.2 | 2.9 | 16.0 | 0.000 | 0.8 |
| Y9 | 27.4 | 0.1 | 0.53 | 301.3 | 53.9 | 3.0 | 18.5 | 0.002 | 0.6 |
| Y11 | 18.7 | 0.1 | 0.44 | 465.9 | 48.5 | 1.0 | 15.5 | 0.013 | 0.3 |
| Y13 | 19.4 | 0.1 | 0.37 | 367.6 | 367.6 | 0.7 | 17.7 | 0.004 | 0.3 |
Table 6.
Notable essential oils and terpenes found in ginger samples.
| Name | Description | Structure |
|---|---|---|
| Geraniol | A terpene alcohol used for its antioxidant, antimicrobial, and anti-inflammatory properties. | 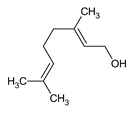 |
| Citral | Key component in lemongrass oil with strong antimicrobial and anti-inflammatory effects. | 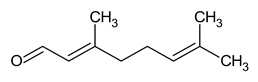 |
| Geranyl Acetate | Ester found in various essential oils, valued for its pleasant fragrance and potential anti-inflammatory properties. | 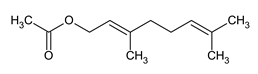 |
| Zingiberene | Major component of ginger essential oil known for its anti-inflammatory and antioxidant effects. | 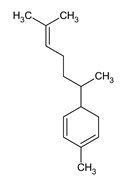 |
| Alpha Farnsene | Sesquiterpene with potential antioxidant and anti-inflammatory properties, found in the skin of apples. | 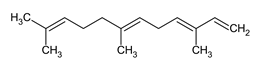 |
| Beta Sesquiphellandrene | Sesquiterpene found in ginger with possible anti-inflammatory and antimicrobial activities. | 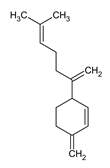 |
| Zingerone | Pungent compound in ginger known for its antioxidant, anti-inflammatory, and potential anti-cancer properties. | 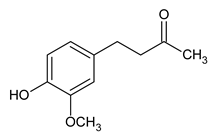 |
| 6-Shogaol | Pungent compound in ginger known for its antioxidant, anti-inflammatory, and potential anti-cancer properties. | 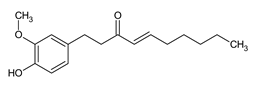 |
| 6-Gingerol | Major bioactive compound in fresh ginger with antioxidant, anti-inflammatory, and potential anti-cancer properties. | 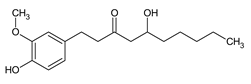 |
| 8 Gingerol | A bioactive compound in ginger known for its anti-inflammatory and antioxidant properties. | 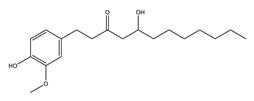 |
| Curcumene | Component of turmeric with potential anti-cancer and anti-inflammatory effects. | 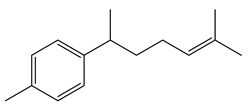 |
| Camphene | Terpene found in essential oils that has antimicrobial and anti-inflammatory properties. | 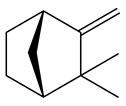 |
| Sesquisabinene | Naturally occurring sesquiterpene with potential antimicrobial and anti-inflammatory activities. | 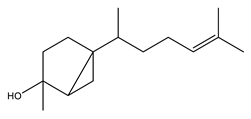 |
Disclaimer/Publisher’s Note: The statements, opinions and data contained in all publications are solely those of the individual author(s) and contributor(s) and not of MDPI and/or the editor(s). MDPI and/or the editor(s) disclaim responsibility for any injury to people or property resulting from any ideas, methods, instructions or products referred to in the content. |
© 2025 by the authors. Licensee MDPI, Basel, Switzerland. This article is an open access article distributed under the terms and conditions of the Creative Commons Attribution (CC BY) license (http://creativecommons.org/licenses/by/4.0/).
Copyright: This open access article is published under a Creative Commons CC BY 4.0 license, which permit the free download, distribution, and reuse, provided that the author and preprint are cited in any reuse.


