Submitted:
29 May 2025
Posted:
29 May 2025
You are already at the latest version
Abstract
With the rapid development of China's electric vehicle industry, the influence mechanism of government policies on consumers' purchase intention has become a research focus. This study integrates the technology acceptance model (TAM) and SOR theory to propose four key driving factors: policy incentive, perceived usefulness, perceived ease of use and test drive experience. Through stratified random sampling of 400 valid questionnaires in Shanghai, Beijing, Shenzhen and Guangzhou, four cities with high penetration rate of electric vehicles, the structural equation model (SEM) was used for empirical analysis. The results show that policy incentives have a significant impact on purchase intention, and play a mediating role through perceived usefulness and perceived ease of use; Test drive experience moderates the effects of perceived usefulness and perceived ease of use on purchase intention. Based on the research results, this paper proposes a three-stage policy optimization path: strengthening the accuracy of fiscal and tax incentives in the short term, improving the visual construction of charging network in the medium term, and establishing a network of test drive experience centers in the long term. The research conclusions provide a theoretical basis for the government to formulate differentiated electric vehicle promotion strategies, and propose a "policy-technology-service" three-dimensional implementation plan for enterprises to optimize product design and improve user experience, so as to help the sustainable development of China's electric vehicle market.
Keywords:
electric vehicles
; policy incentives
; test drive experience
; consumer purchase intention
1. Introduction
Energy and environment problems are becoming more and more serious all over the world. China is heavily dependent on imported oil, which is expected to exceed 80% by 2030. To reduce dependence on oil and ensure energy security, alternative solutions such as electric vehicles (EVs) are being promoted (Q. Wang et al., 2018).Electric vehicles also help solve environmental problems. Transport accounts for 23% of global carbon emissions, and conventional vehicles contribute to air pollution (Solaymani, 2019). Electric vehicles pollute less and are a promising way to reduce carbon emissions and improve air quality. Governments and businesses around the world are supporting electric vehicles through policies, incentives, and technological advances. In China, the rapid growth of EV sales, as well as investment in technology and infrastructure, has boosted the industry (Zhang & Bai, 2017). However, many consumers are still hesitant to buy electric vehicles due to concerns over safety, charging, and driving range. Understanding consumer behavior, especially their perceptions and purchase intentions, is crucial to promoting electric vehicles. Policies and test driving experience significantly affect consumers' purchase intentions (Y. Li et al., 2023). However, many consumers are still hesitant due to concerns over safety, charging issues and range. Macroeconomic factors such as the availability of raw materials and fluctuating energy prices also play an important role in the future EV market. For example, the tight supply of key raw materials such as lithium, cobalt and nickel may lead to higher battery production costs, which in turn affects the manufacturing cost and pricing of electric vehicles. In addition, energy price fluctuations, especially those of electricity and oil, also directly affect consumers' purchasing decisions. When oil prices rise, consumers may be more inclined to buy electric vehicles, and rising electricity prices may increase the operating costs of electric vehicles, which in turn affects their attractiveness.Therefore, this study aims to explore these factors, analyze the key drivers that promote the purchase of electric vehicles, and provide theoretical support for the development of the electric vehicle industry, thereby contributing to energy security and environmental protection. Furthermore, fluctuations in energy prices (such as oil price fluctuations) may indirectly influence consumers' purchasing decisions through the effect of regulating policy incentives. Studies show that consumers' subjective perception of oil price fluctuations (MOPV) may enhance or weaken the direct impact of policy incentives on purchase intentions. This moderating effect has not been fully explored in existing models. Therefore, this study introduces oil price volatility (MOPV) as a moderating variable to reveal how the impact of policy incentives (POI) on purchase intention (PI) varies with consumers' perception of oil price uncertainty.
2. Materials and Methods
2.1. Literature
2.1.1 Development Status of China's Electric Vehicle Market
China has become the world's largest EV market, with EV sales expected to reach 12.86 million units in 2024, accounting for 40.9% of total vehicle sales (Khaleel et al., 2024). This rapid growth is strongly supported by government policies, including fiscal subsidies, tax incentives, and the construction of charging infrastructure (Zhang et al., 2018). However, despite significant market expansion driven by policy incentives, consumer acceptance of electric vehicles is still constrained by factors such as range, ease of charging, and safety (W. Li et al., 2023).
In China, the promotion of electric vehicles is largely led by the central government, supported by local governments through supporting policies and infrastructure investment. For example, first-tier cities such as Shanghai, Beijing, Shenzhen and Guangzhou have significantly increased the penetration rate of electric vehicles through measures such as license plate concessions and the construction of charging piles (Lv et al., 2020). However, inter-regional policy implementation and consumer perception differences still pose challenges to the balanced development of the market.
2.1.2. Research on Policy Incentives and Consumer Intention
The influence of policy incentives on consumers' purchasing decisions has become a hot topic in academic circles. According to the Technology acceptance Model (TAM), consumer acceptance of electric vehicles is primarily determined by perceived usefulness (such as range) and perceived ease of use (Masrom, 2007). Research shows that fiscal subsidies and tax incentives significantly improve consumers' purchase intention by reducing the cost of car purchase (Zhang et al., 2018). In addition, improved charging infrastructure has also been shown to enhance consumer trust in electric vehicles (W. Li et al., 2023).
Government incentive policies can be subdivided into three categories, namely, production incentive, purchase incentive and after-sales incentive. The government's production policy incentives play a key role in the development of the new energy vehicle industry. These incentives include direct monetary subsidies, tax incentives, technology research and development incentives, etc., aimed at reducing enterprise production costs, promoting technological innovation, and accelerating the mass production and commercialization of electric vehicles. The implementation of these policies has promoted the rapid development of the new energy vehicle industry, making it an important part of the global sustainable transportation strategy. For example, Hao et al. (2014) points out that subsidies have significantly accelerated the adoption of electric vehicles in China, narrowing the price gap between electric vehicles and conventional internal combustion engine vehicles. Sierzchula et al. (2014) also found that purchase subsidies and tax credits are the most effective policy tools for increasing market penetration of electric vehicles. The government directly incentivizes consumers to buy electric vehicles through vehicle purchase subsidies, purchase tax exemptions, free maintenance, green licenses and other measures. These policies reduce the purchase and use costs of consumers, making them more inclined to choose electric vehicles. For example, Norway has successfully promoted the rapid growth of the new energy vehicle market through policies such as reducing purchase taxes and free passage for green license plates, even though its climate conditions are not suitable for electric vehicles. After-sales policy incentives are equally important, such as establishing after-sales service and maintenance systems for electric vehicles to reduce maintenance costs. These measures can improve the service quality of electric vehicles and reduce consumers' perceived costs and risks, thereby increasing their willingness to buy. Since electric vehicles have unique technical characteristics such as battery systems and electric drivetrains, professional after-sales service and maintenance are particularly important.
2.1.3. Research Scope
First-tier cities are usually economically developed, consumer income levels are high, infrastructure (such as charging piles) is relatively perfect, and the popularization of new energy vehicles is fast. Research shows that first-tier cities, due to their advanced economic conditions and sound infrastructure, often become key areas for policy pilot and market penetration. Sun et al. (2019) compared the NEV market in first-tier cities with other regions and found that, driven by favorable policies and infrastructure development, the consumer acceptance and market growth rate in first-tier cities were significantly higher. Therefore, studying the purchasing intention of consumers in first-tier cities can provide immediate market feedback and decision-making basis for enterprises and decision makers.
2.2. Analysis of Critical Factors
2.2.1 Policy Incentives Have a Significant Effect on Purchase Intention of EVs
Consumer purchase intention plays a key role in understanding how people decide to buy products. Studying this helps businesses create better marketing strategies. Before buying, consumers often look for information about a product's price, quality, and reliability. This helps reduce doubts and makes it easier for them to decide.EVs, as a new and energy-saving option, have gained interest, but many consumers are unsure about their features. Wang et al. (2017) noted that product details greatly influence buying decisions. Egbue and Long (2012) found that consumers may hesitate to buy EVs because they seem unfamiliar or untested. Wallis et al. explained that concerns about battery life and range also affect their acceptance. In China, safety, reliability, and range per charge are major concerns, causing many people to wait before purchasing EVs.Research also shows that economic benefits and policy incentives impact purchase intentions. Rezvani et al. (2015) highlighted that factors like costs, government support, and vehicle performance encourage people to consider EVs. This shows how important it is to provide clear information and support to increase consumer confidence in buying EVs.Hypotheses Supported by Evidence:H1: Policy incentives have a significant effect on purchase intention of EVs.H2: Policy incentives positively influence perceived usefulness of EVs.H3: Policy incentives positively influence Perceived Ease of Use of EVs.
2.2.2. The Mediating Role of Perceived Usefulness and Perceived Ease of Use
The core logic of the technology acceptance model (TAM) indicates that the influence of external variables (such as policy incentives) on behavioral intentions (such as purchase intention) should be transmitted through two cognitive factors: perceived usefulness (PU) and perceived ease of use (PE) (Davis et al., 1989). In the field of electric vehicles, this intermediary mechanism is manifested as follows: policy incentives (such as car purchase subsidies and free license plates) do not directly stimulate purchase behavior, but indirectly drive purchase decisions by improving consumers' evaluation of technical utility and operation convenience(Davis et al., 1989).The intermediary path of perceived usefulness (PU), which refers to the user's perception that technology can improve efficiency or quality of life. In the electric vehicle scenario, PU is a recognition of environmental value, long-term cost savings and technological advancement (Lashari et al., 2021). By reducing economic costs and enhancing technological confidence, policy incentives can significantly improve consumers' utility evaluation of "endurance utility" and "full cycle cost advantage" (Liu et al., 2022). For example, Norway's tax exemption reduced consumers' sensitivity to charging efficiency by 37% (Haustein et al., 2021). Liu et al. (2022) study on the Chinese market shows that the mediating effect of PU between policy and purchase intention accounts for 41.3%, which verifies its partial mediating effect.Perceived ease of use (PE) is the intermediary path, and PE reflects users' subjective judgment on the difficulty of technical operation (Baidu Intelligent Cloud, 2024). For electric vehicles, PE involves convenience of charging and fluency of interface interaction (Huang et al., 2021). Policy transmission mechanism: Infrastructure policies (such as increased coverage of charging piles) directly reduce the perception of technology use complexity. Huang et al. (2021) found that when the density of charging piles increased by 10%, users' score of "charging difficulty" decreased by 0.8 points. The mediating effect of PE was stronger in the tech-novice population (β=0.62 vs. Skilled users β=0.29), because novics rely more on intuitive experience to overcome technological strangeness. Based on the above theoretical and research basis, we propose the following hypotheses:H4: Perceived usefulness positively influences purchase intention towards EVs.H5: Perceived ease of use positively influences purchase intention towards EVs.H8: Perceived usefulness mediates the relationship between Policy incentives and purchase intention.H9: Perceived ease of use mediates the relationship between Policy incentives and purchase intention.
2.2.3. The Moderating Role of Test Driving Experience
As the core touch point of automobile marketing, the theoretical foundation of test drive can be traced back to the three classic theoretical systems. Experiential marketing theory (Schmitt et al., 2016) emphasizes the catalytic role of sensory, emotional and action experience in purchasing decision making. The consumer risk perception model reveals the inhibitory effect of functional risk and financial risk (37%) in the purchase of high-value goods, and test driving can reduce the vehicle performance verification error by 68%(Lawrence, 2022).The test drive experience has a unique scenario-enabling value in the process of consumer technology acceptance(Venkatesh & Davis, 2000). Specifically in the field of electric vehicles, test drives translate abstract technical parameters into embodied cognition by providing multi-sensory interactions(Brückmann, 2022), a process that may reconstruct consumers' subjective weights for "usefulness" (PU) and "ease of use" (PE). For example, the instantaneous torque output experienced during a test drive may enhance the user's tolerance for the range parameter (Zhao et al., 2023), thereby regulating the path of PU's influence on purchase intention. Existing studies have confirmed that highly immersive test driving experiences can reduce risk perception through a dual mechanism: real-time operations in dynamic scenarios can improve the perception of technical controllability and alleviate battery safety anxiety (White et al., 2022). Tesla's "Anxiety Elimination Test Drive Program" verifies performance stability by simulating extreme conditions, such as -20 ° C cold starts. The pleasant experience during the test drive will generate emotional imprint, which can hedge the risk consideration in rational decision making (Kim et al., 2021). Based on this, this study proposes:H6: Test drive experience moderates the relationship between perceived usefulness and purchase intention.H7: Test drive experience moderates the relationship between Perceived Ease of Use and purchase intention.
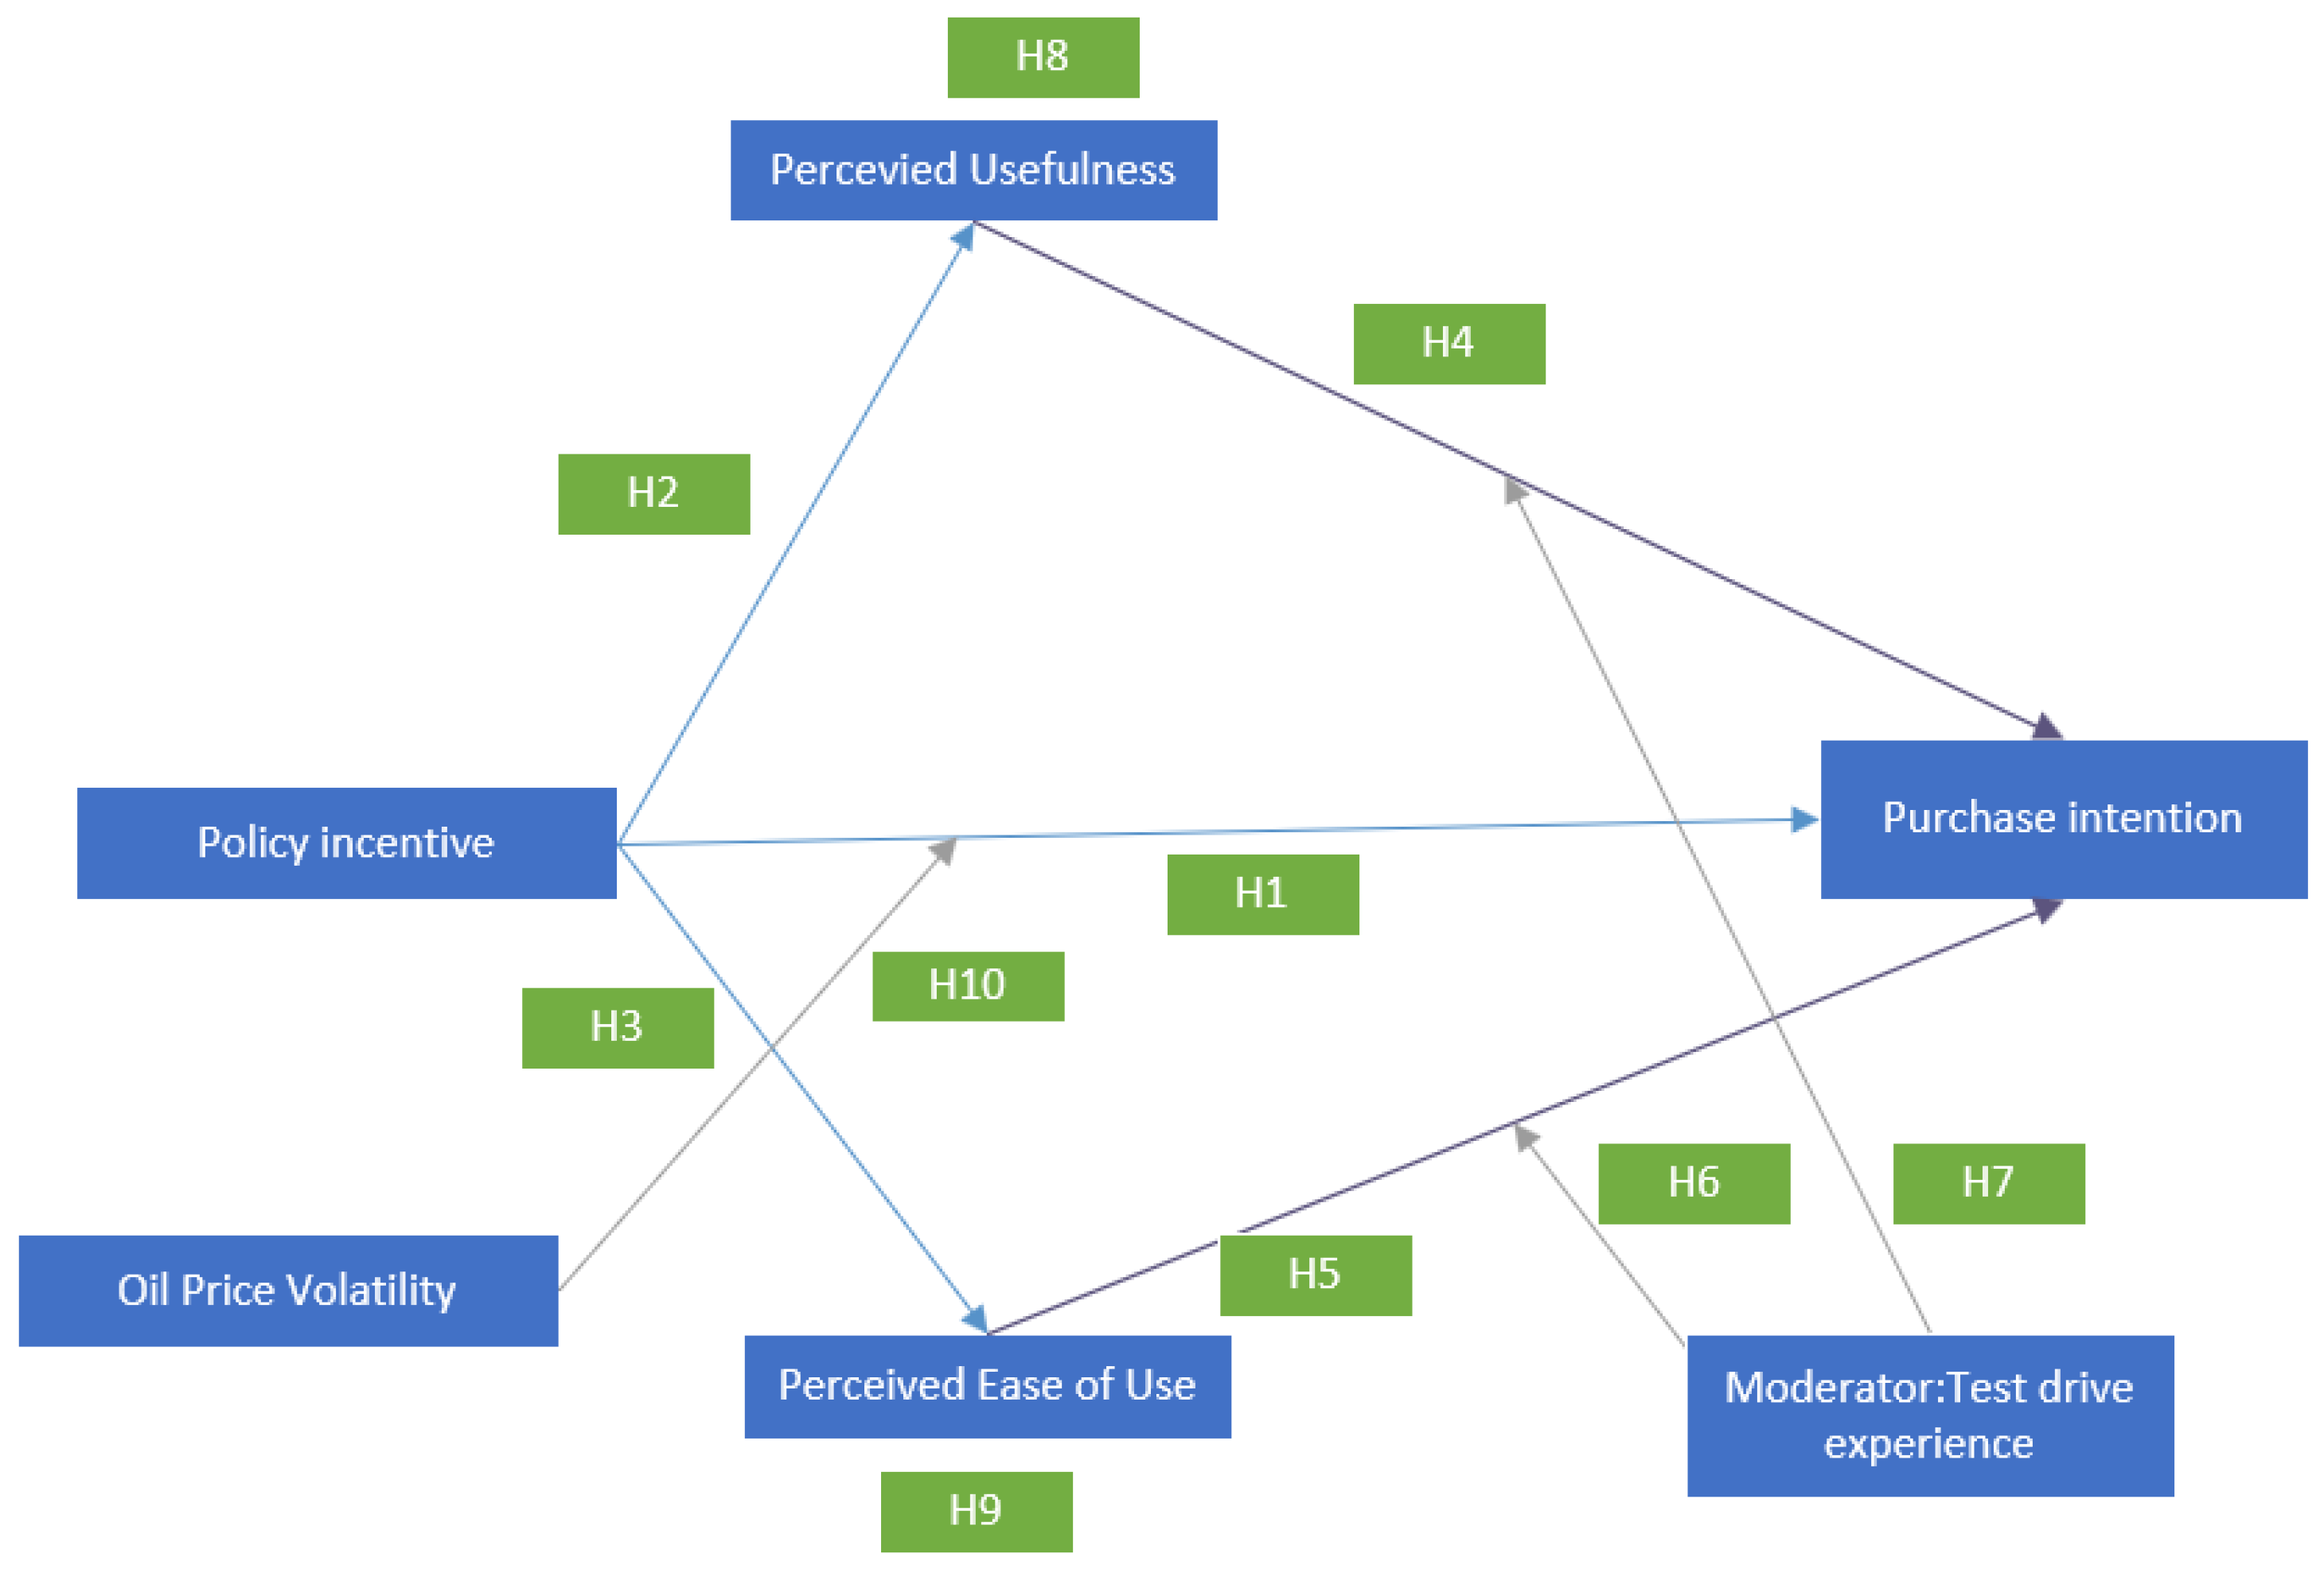
2.2.4. Research Framework
Using SEM, model fitting test and evaluation are very critical(Barrett, 2007). Based on the above assumptions, this study constructs the following research framework.
Figure 2.
1:Framework.
2.3. Methodology
2.3.1. Data Collection
Stratified random sampling is used as sampling technique in this study. Respondents were randomly selected from each tier (Zikmund et al., 2010). In this study, the tier refers to the four first-tier cities. Sekaran (2016) points out that stratified random sampling allows everyone in the population to be equally selected. Based on the suggestion of Chuan and Chuan and Penyelidikan (2006), and combined with actual demand, the sample size was determined to be 400 to ensure the representativeness and reliability of the study. When using GPOWER statistical tool to calculate the sample size, linear multiple regression analysis was adopted, and the parameter was set as effect size 0.15, significance level 0.05, detection efficiency 0.8, and the number of variables was 4. Before handing out the questionnaires, the researchers first contacted the electric vehicle sales center. This strategy was adopted to speed up the distribution of questionnaires to prospective purchasers.It should be noted that the main purpose of the test drive is to allow consumers to experience the performance and driving experience of the vehicle to help them make car purchase decisions. The test drive itself does not constitute a purchase obligation.Before the questionnaire was released, a pilot study with 60 participants was conducted to test and optimize the questionnaire design (Bougie & Sekaran, 2019). Based on the feedback, the questionnaire content was adjusted, including adding a brief description of terms, simplifying and rewriting some questions to improve clarity and understandability. The formal questionnaire was posted online for over a month, providing participants with ample time to complete and submit.

Table 2.
1: Research questionnaire.
| Constructs | Measurement Items | Code | Sources |
|---|---|---|---|
| Oil Price Volatility(MOPV) | I have recently noticed frequent fluctuations in oil prices. | MOPV1 | (Hamilton, 2009) |
| I believe oil prices change rapidly and are difficult to predict. | MOPV2 | ||
| Volatility in oil prices makes me pay more attention to the cost advantages of electric vehicles. | MOPV3 | ||
| When oil prices rise, I am more inclined to consider purchasing an electric vehicle. | MOPV4 | ||
| I feel that the instability of oil prices will influence my vehicle purchasing decisions. | MOPV5 | ||
| Percevied Usefulness(PU) | 1. Driving a electric vehicle makes me feel more relaxed. | PU1 | Venkatesh and Davis (2000) |
| 2. I think the experience of driving an EV is better and more comfortable. | PU2 | ||
| 3. I think the environmental benefits of electric vehicles positively impact my quality of life. | PU3 | ||
| 4. I believe the advanced technology features (e.g., automatic parking) in electric vehicles enhance my driving experience. | PU4 | ||
| 5. I think EV has facilities that meet my needs. | PU5 | ||
| Perceived Ease of Use(PE) | 1. I find it easy to learn how to drive an electric vehicle (EV). | PE1 | S. Wang et al. (2018) |
| 2. I find it easy to operate an EV skillfully. | PE2 | ||
| 3. I think it’s easy to charge and maintain my EV. | PE3 | ||
| 4. I believe the intelligent features in an EV are user-friendly and easy to use. | PE4 | ||
| 5. I find it very convenient to perform a remote software update for an EV. | PE5 | ||
| Purchase intention(PI) | 1. I am more willing to prioritize purchasing an electric vehicle (EV) over a traditional fuel vehicle. | PI1 | Han et al. (2017) |
| 2. I plan to buy an electric vehicle in the near future. | PI2 | ||
| 3. I am willing to recommend purchasing an electric vehicle to people around me. | PI3 | ||
| 4. I would choose to buy an electric vehicle if it were safer and more reliable. | PI4 | ||
| 5. I would choose to buy an electric vehicle if it were smarter and more technologically advanced. | PI5 | ||
| Policy incentive(POI) | 1. Electric vehicle purchase tax credit motivates me to buy an electric vehicle | POI1 | S. Wang et al. (2018) |
| 2. It's easier to get an electric vehicle license compared to a traditional gasoline vehicle | POI2 | ||
| 3. Government subsidies for electric vehicle manufacturers have reduced production costs and made more affordable, higher-quality electric vehicles available. | POI3 | ||
| 4. Convenient and affordable charging infrastructure is important | POI4 | ||
| 5. The government directly provides cash subsidies to consumers who buy electric vehicles to reduce the purchase cost. | POI5 | ||
| Test drive experience(TD) | 1. The test drive experience of the electric vehicle is great |
TD1 | Li et al. (2017) |
| 2.Learn more about EVs through test driving experience | TD2 | ||
| 3. The test drive experience made me more satisfied with EVs |
TD3 | ||
| 4.The test drive experience of electric vehicles is exciting. | TD4 | ||
| 5. The test drive experience made me want to learn more about electric vehicles. |
TD5 |
Respondents to the survey cover people aged 18 and above, with a focus on the main group of car buyers aged 20-50. Educational background covers all levels from high school and below to undergraduate and above, and occupational types include white collar, blue collar, student, freelancer, and entrepreneur. The participants came from four cities: Beijing, Shanghai, Guangzhou, and Shenzhen, with a wide geographical distribution and demographic characteristics. A total of 430 questionnaires were received, 30 of which were rejected due to inconsistencies or filling errors, and 400 valid questionnaires were retained for analysis.
Table 2.
2: Basic Questionnaire.
| Respondents’ Characteristics | Item | Count (n =399) | Percentage (%) |
|---|---|---|---|
| Gender | Male | 186 | 46.5 |
| Female | 214 | 53.5 | |
| Age | below 20 | 48 | 12 |
| 20-30 | 76 | 19 | |
| 31-40 | 220 | 55 | |
| up 40 | 48 | 12 | |
| annual salary | below 100,000 | 84 | 21 |
| 100000-200000 | 202 | 50.5 | |
| 210000-300000 | 90 | 22.5 | |
| up 300000 | 24 | 6 | |
| educational background | below bachelor degree | 80 | 20 |
| bachelor degree | 280 | 70 | |
| up bachelor degree | 40 | 10 |
2.3.2. Measurement
The indicators were determined through literature review and expert consultation, and the preliminary questionnaire was divided into two parts. The first part collects demographic data such as gender, age, education, income, and residence. The second part measured key variables using a five-point Likert scale, with responses ranging from "strongly disagree" to "strongly agree", and after the pilot survey, feedback was used to refine the questionnaire, ensuring clarity and cultural relevance (Bryman, 2016). The research model includes 6 variables, evaluates 30 measurement items, draws on foreign research and is tailored according to China's national conditions to ensure reliability and validity. The finalized questionnaire provides a solid basis for hypothesis testing and analysis.
3. Results
3.1. Measurement Model
Table 3.1 shows the reliability and validity analysis results of the research scale. It can be seen from the data that the factor loading value of each construct is greater than 0.7, indicating that the measurement index can better reflect the characteristics of the latent variable. Cronbach's Alpha value and composite reliability (CR) were both higher than 0.7 (Nunnally & Bernstein, 1978), which further indicated that the questionnaire had high internal consistency. In addition, the mean extraction variance (AVE) of all constructs was greater than 0.5 (Hair, 2009), which verified the convergence validity of the scale. These results show that the questionnaire design is scientific and reliable, which provides a good basis for the follow-up research. Table 3.2 shows the results of Fornell-Larcker criterion analysis. By comparing the correlation coefficients between AVE square root values of constructs and constructs, it can be found that each construct has good discriminant validity (Fornell & Larcker, 1981), for example, the square root values of PU and PE are higher than their correlation values with other constructs. This result verified the degree of differentiation between model constructs and further supported the rationality of the research hypothesis.
Table 3.
1: Reliability And Validity.
| Constructs | Items | Loading | Cronbach’s | CR | AVE |
|---|---|---|---|---|---|
| MOPV1 | 0.679 | ||||
| MOPV2 | 0.827 | ||||
| Oil Price Volatility(MOPV) | MOPV3 | 0.766 | 0.841 | 0.887 | 0.612 |
| MOPV4 | 0.812 | ||||
| MOPV5 | 0.818 | ||||
| Percevied Usefulness (PU) | PU1 | 0.762 | 0.859 | 0.898 | 0.639 |
| PU2 | 0.812 | ||||
| PU3 | 0.797 | ||||
| PU4 | 0.816 | ||||
| PU5 | 0.806 | ||||
| Perceived Ease of Use (PE) | PE1 | 0.725 | 0.841 | 0.887 | 0.612 |
| PE2 | 0.809 | ||||
| PE3 | 0.798 | ||||
| PE4 | 0.816 | ||||
| PE5 | 0.759 | ||||
| Purchase intention(PI) | PI1 | 0.695 | 0.846 | 0.89 | 0.62 |
| PI2 | 0.802 | ||||
| PI3 | 0.806 | ||||
| PI4 | 0.811 | ||||
| PI5 | 0.815 | ||||
| Policy incentive(POI) | POI1 | 0.694 | 0.837 | 0.885 | 0.607 |
| POI2 | 0.789 | ||||
| POI3 | 0.802 | ||||
| POI4 | 0.8 | ||||
| POI5 | 0.805 | ||||
| Test drive experience(TD) | TD1 | 0.668 | 0.891 | 0.898 | 0.64 |
| TD2 | 0.938 | ||||
| TD3 | 0.824 | ||||
| TD4 | 0.809 | ||||
| TD5 | 0.736 |
Table 3.
2: HTMT.
| MOPV | PE | PI | POI | PU | TD | TD x PU | MOPV x POI | TD x PE | |
|---|---|---|---|---|---|---|---|---|---|
| MOPV | |||||||||
| PE | 0.336 | ||||||||
| PI | 0.476 | 0.498 | |||||||
| POI | 0.367 | 0.407 | 0.468 | ||||||
| PU | 0.407 | 0.42 | 0.507 | 0.348 | |||||
| TD | 0.113 | 0.16 | 0.067 | 0.085 | 0.168 | ||||
| TD x PU | 0.115 | 0.139 | 0.212 | 0.07 | 0.105 | 0.206 | |||
| MOPV x POI | 0.313 | 0.368 | 0.354 | 0.363 | 0.321 | 0.09 | 0.036 | ||
| TD x PE | 0.13 | 0.073 | 0.227 | 0.098 | 0.135 | 0.124 | 0.218 | 0.047 |
3.2. Structural Model
In statistics, multicollinearity refers to the fact that the explanatory variables in a linear regression model are distorted or difficult to estimate accurately due to the existence of precise correlation or high correlation between the explanatory variables. Field (2024) mentioned that a VIF lower than 5 indicates that collinearity is not serious, while a VIF higher than 10 usually requires vigilance. In this study, the variance expansibility coefficient VIF was used to test the multicollinearity of each study variable. According to the results, the VIF value of each study variable is lower than 5, so there is no multicollinearity problem in this study.
Table 3.
3: VIF.
| VIF | |
| PE -> PI | 1.326 |
| POI -> PE | 1 |
| POI -> PI | 1.192 |
| POI -> PU | 1 |
| PU -> PI | 1.276 |
| TD -> PI | 1.081 |
| TD x PU -> PI | 1.143 |
| TD x PE -> PI | 1.12 |
| MOPV × POI-> PI | 1 |
R2 is mainly used to measure the predictive power of the model, and its value ranges from 0 to 1, with a larger value indicating a stronger predictive power of the model.F2 is an important index to measure the degree to which the independent variable explains the change of the dependent variable. In structural equation modeling (SEM), F2 helps us to better understand the degree of influence of exogenous variables on endogenous latent variables. According to Cohen's effect size criteria, when F2 is greater than 0.02, it is considered to meet the criteria for explaining the change (Cohen, 2013).
Table 3.
4: f-square.
| f-square | |
| PE -> PI | 0.065 |
| POI -> PE | 0.134 |
| POI -> PI | 0.059 |
| POI -> PU | 0.098 |
| PU -> PI | 0.098 |
| TD -> PI | 0.002 |
| TD x PU -> PI | 0.033 |
| TD x PE -> PI | 0.027 |
| MOPV × POI-> PI | 0.013 |
According to the results, the F square of TD on PI is 0.0021, the effect is almost negligible, and the F square value is very small, indicating that there is no influence. The F-square values of the other paths are all greater than 0.02, indicating that exogenous variables have better explanatory efficiency to endogenous variables. The model shows the significant positive effects of policy incentive (POI) on perceived usefulness (PU), perceived ease of use (PE) and purchase intent (PI). All direct paths between latent variables show statistical significance (p value is less than 0.05), and the paths of interaction terms are also significant, indicating that driving experience has a moderating effect on the main relationship. The mediating role of PU and PE in the influence of POI on PI was also verified. In addition, the R² results of the model show that policy incentives and related factors have a strong explanatory power to purchase intention. In summary, the structural model suggests that policy incentives (POI) are the core drivers of purchase intent. This has also been discussed in previous papers (Zhang et al., 2014). The indirect effects of PU and PE further prove that improving consumers' perceived usefulness and ease of use for electric vehicles is the key to improving purchase intention. The driving experience (TD) enhances the value perception of PU and PE, which suggests that more practical testing activities should be integrated into policy formulation and marketing strategies to enhance consumer acceptance and purchase intentions for EVs.
Figure 3.
1: Structural Equation Model Path Analysis.
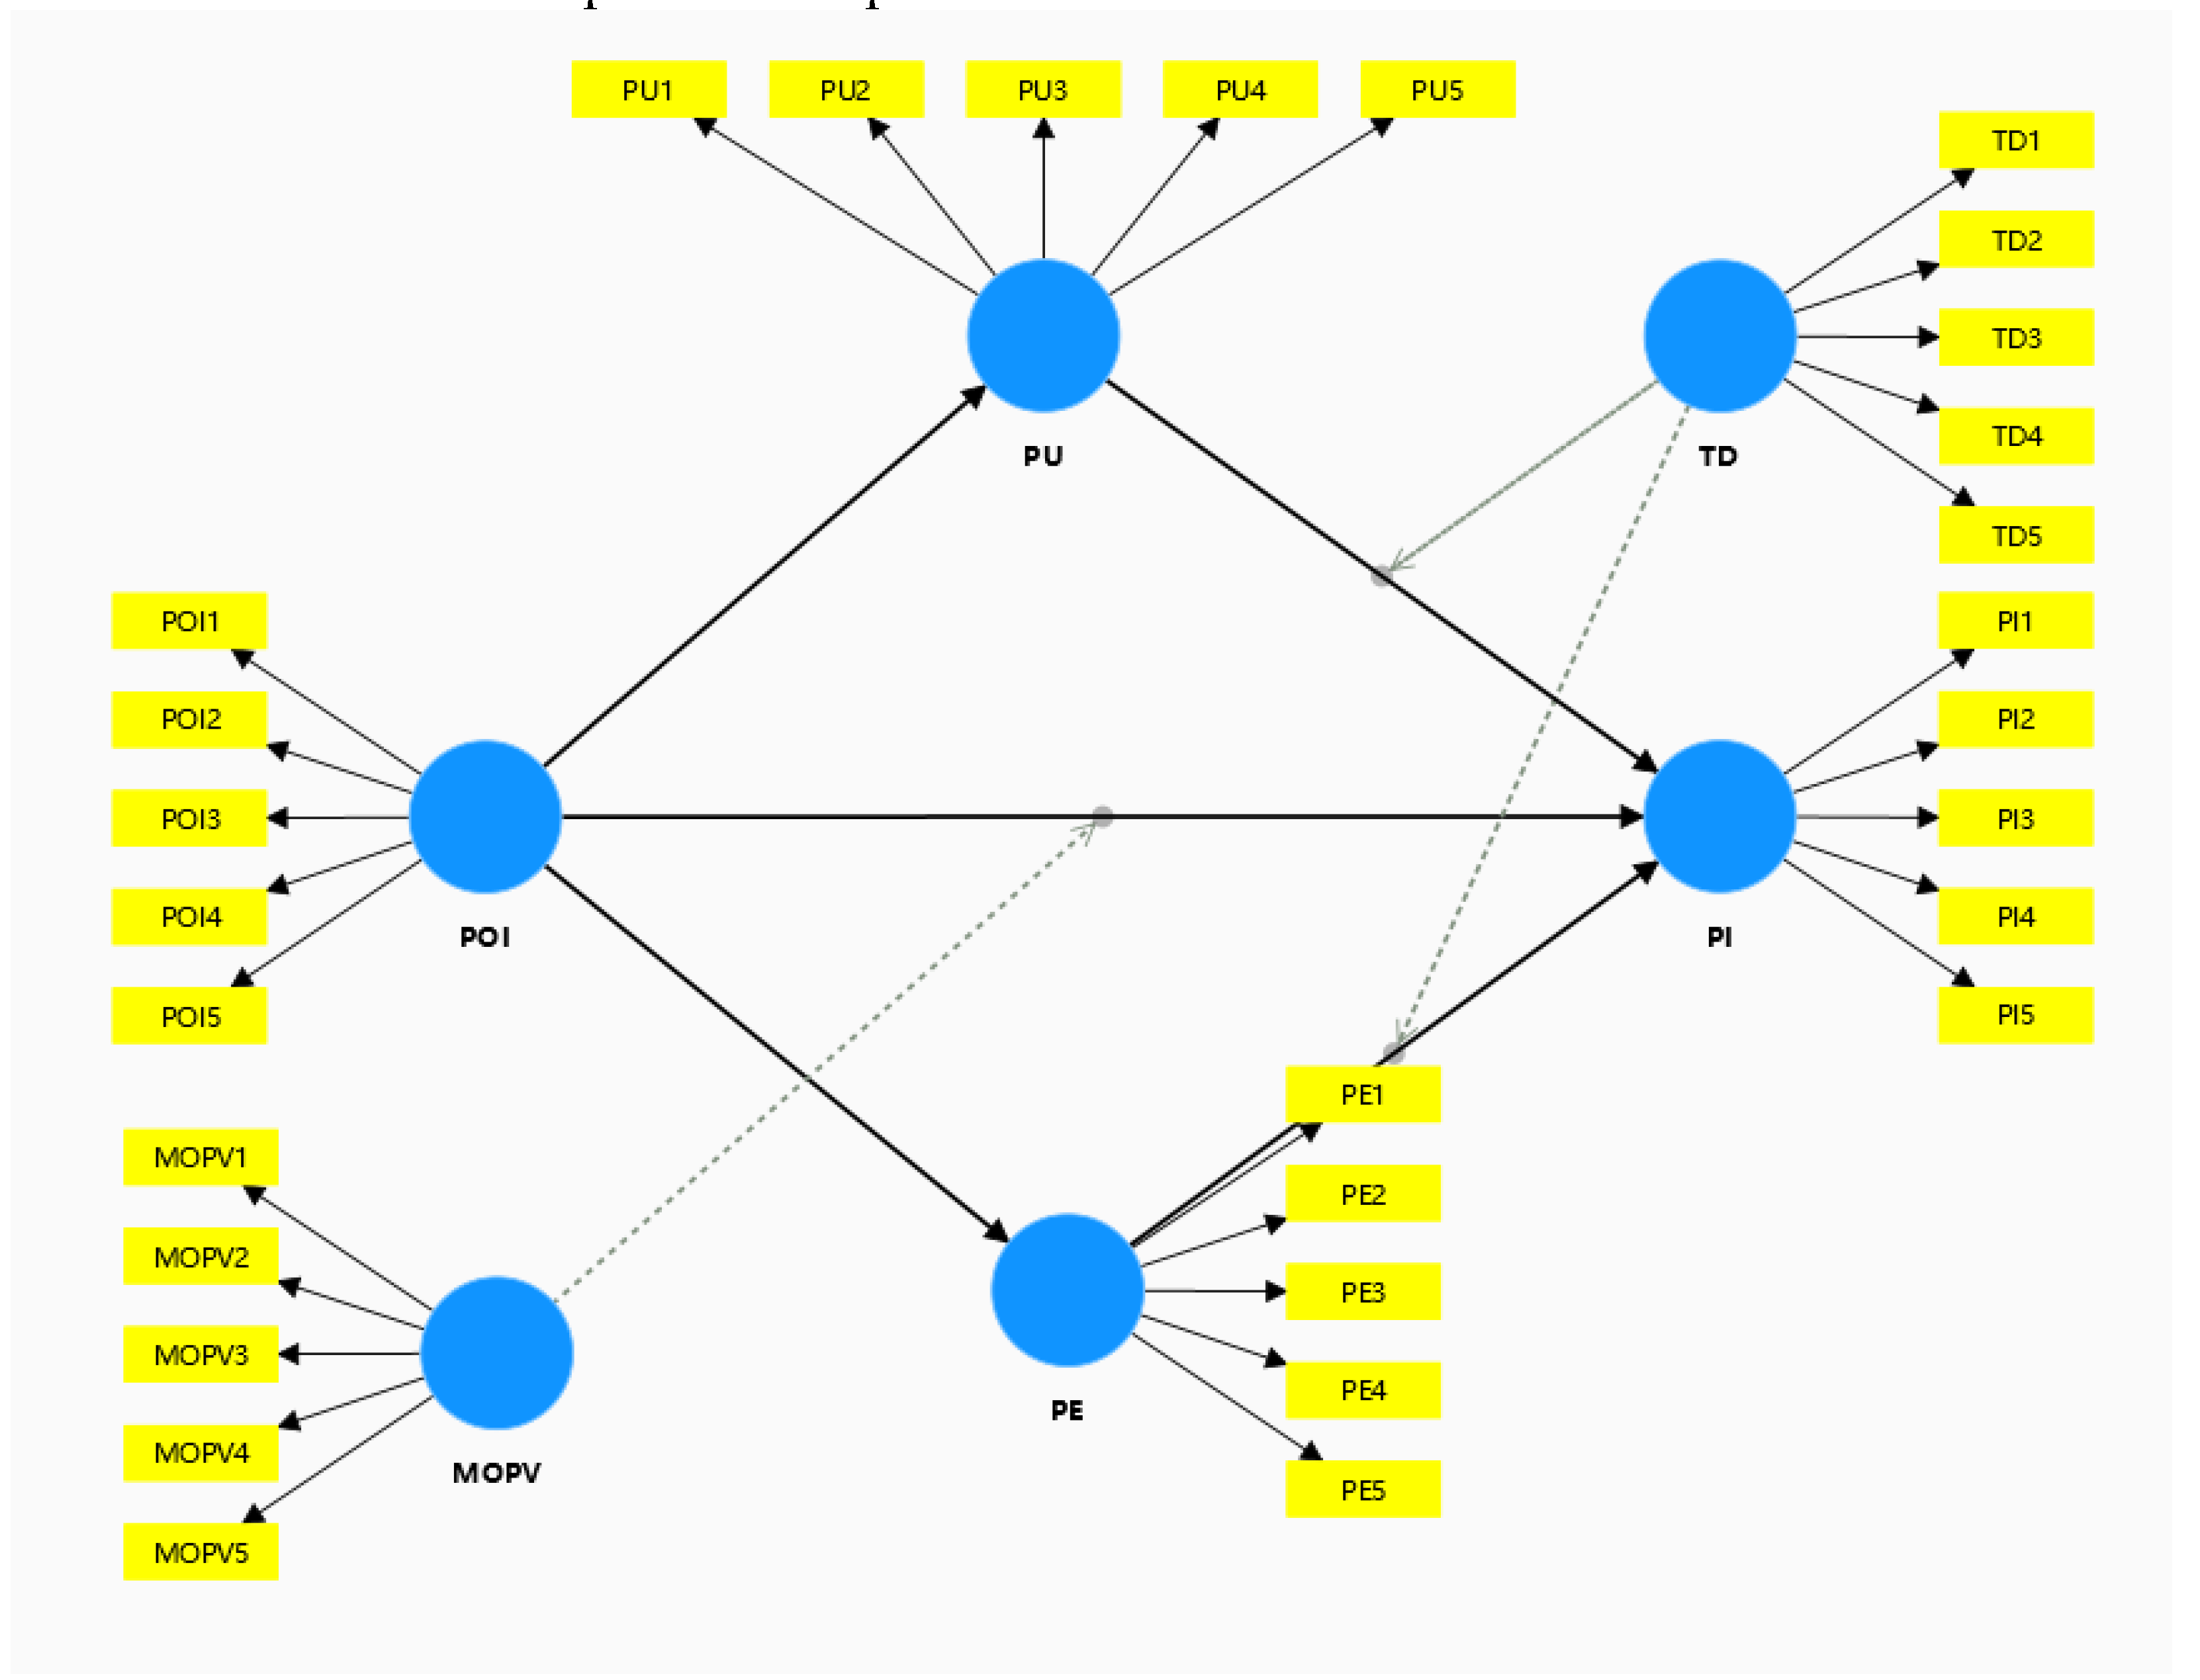
Table 3.
5: Hypothesis Testing Results.
| Hypothesis | Path coecient | T-Value | p-Value | Results |
|---|---|---|---|---|
| H1:POI -> PI | 0.210 | 4.623 | 0.000 | support |
| H2:POI -> PU | 0.298 | 5.576 | 0.000 | support |
| H3:POI -> PE | 0.344 | 6.768 | 0.000 | support |
| H4:PU -> PI | 0.281 | 6.314 | 0.000 | support |
| H5:PE -> PI | 0.233 | 5.294 | 0.000 | support |
| H6:TD x PE -> PI | 0.127 | 2.169 | 0.030 | support |
| H7:TD x PU -> PI | 0.142 | 2.444 | 0.015 | support |
| H10: MOPV × POI ➔ PI | -0.078 | 2.376 | 0.018 | Partial Support |
3.3. Mediation Analysis
The hypothesized model shows that perceived ease of use and perceived usefulness play a mediating role between policy mix and purchase intention of electric vehicles (EVs).Hair Jr et al. (2021) discussed in detail the relationship between direct effects, indirect effects and total effects in path analysis, and pointed out that VAF is an important index to measure the strength of intermediate effects.
Table 3.
6: Mediation Effect Analysis.
| Hypothesis | Direct Effect | Indirect Effect | Total Effect | VAF (%) | explain |
|---|---|---|---|---|---|
| H8:POI -> PU -> PI | 0.210 | 0.084 | 0.374 | 0.225 | Partial Mediation |
| H9:POI -> PE -> PI | 0.210 | 0.080 | 0.374 | 0.214 | Partial Mediation |
3.4. Moderation Analysis
The path coefficient was -0.078 (p < 0.05), indicating that consumers' perception of oil price fluctuations (MOPV) weakened the direct impact of policy incentives (POI) on purchase intention (PI). When consumers perceive the intensification of oil price fluctuations, they may tend to avoid large-scale consumption (such as car purchase) due to risk aversion psychology. Even if there are policy incentives, their purchasing decisions are still suppressed by uncertainties. Fluctuations in energy prices can amplify consumers' concerns about long-term economic risks, thereby offsetting the short-term appeal of policy incentives.
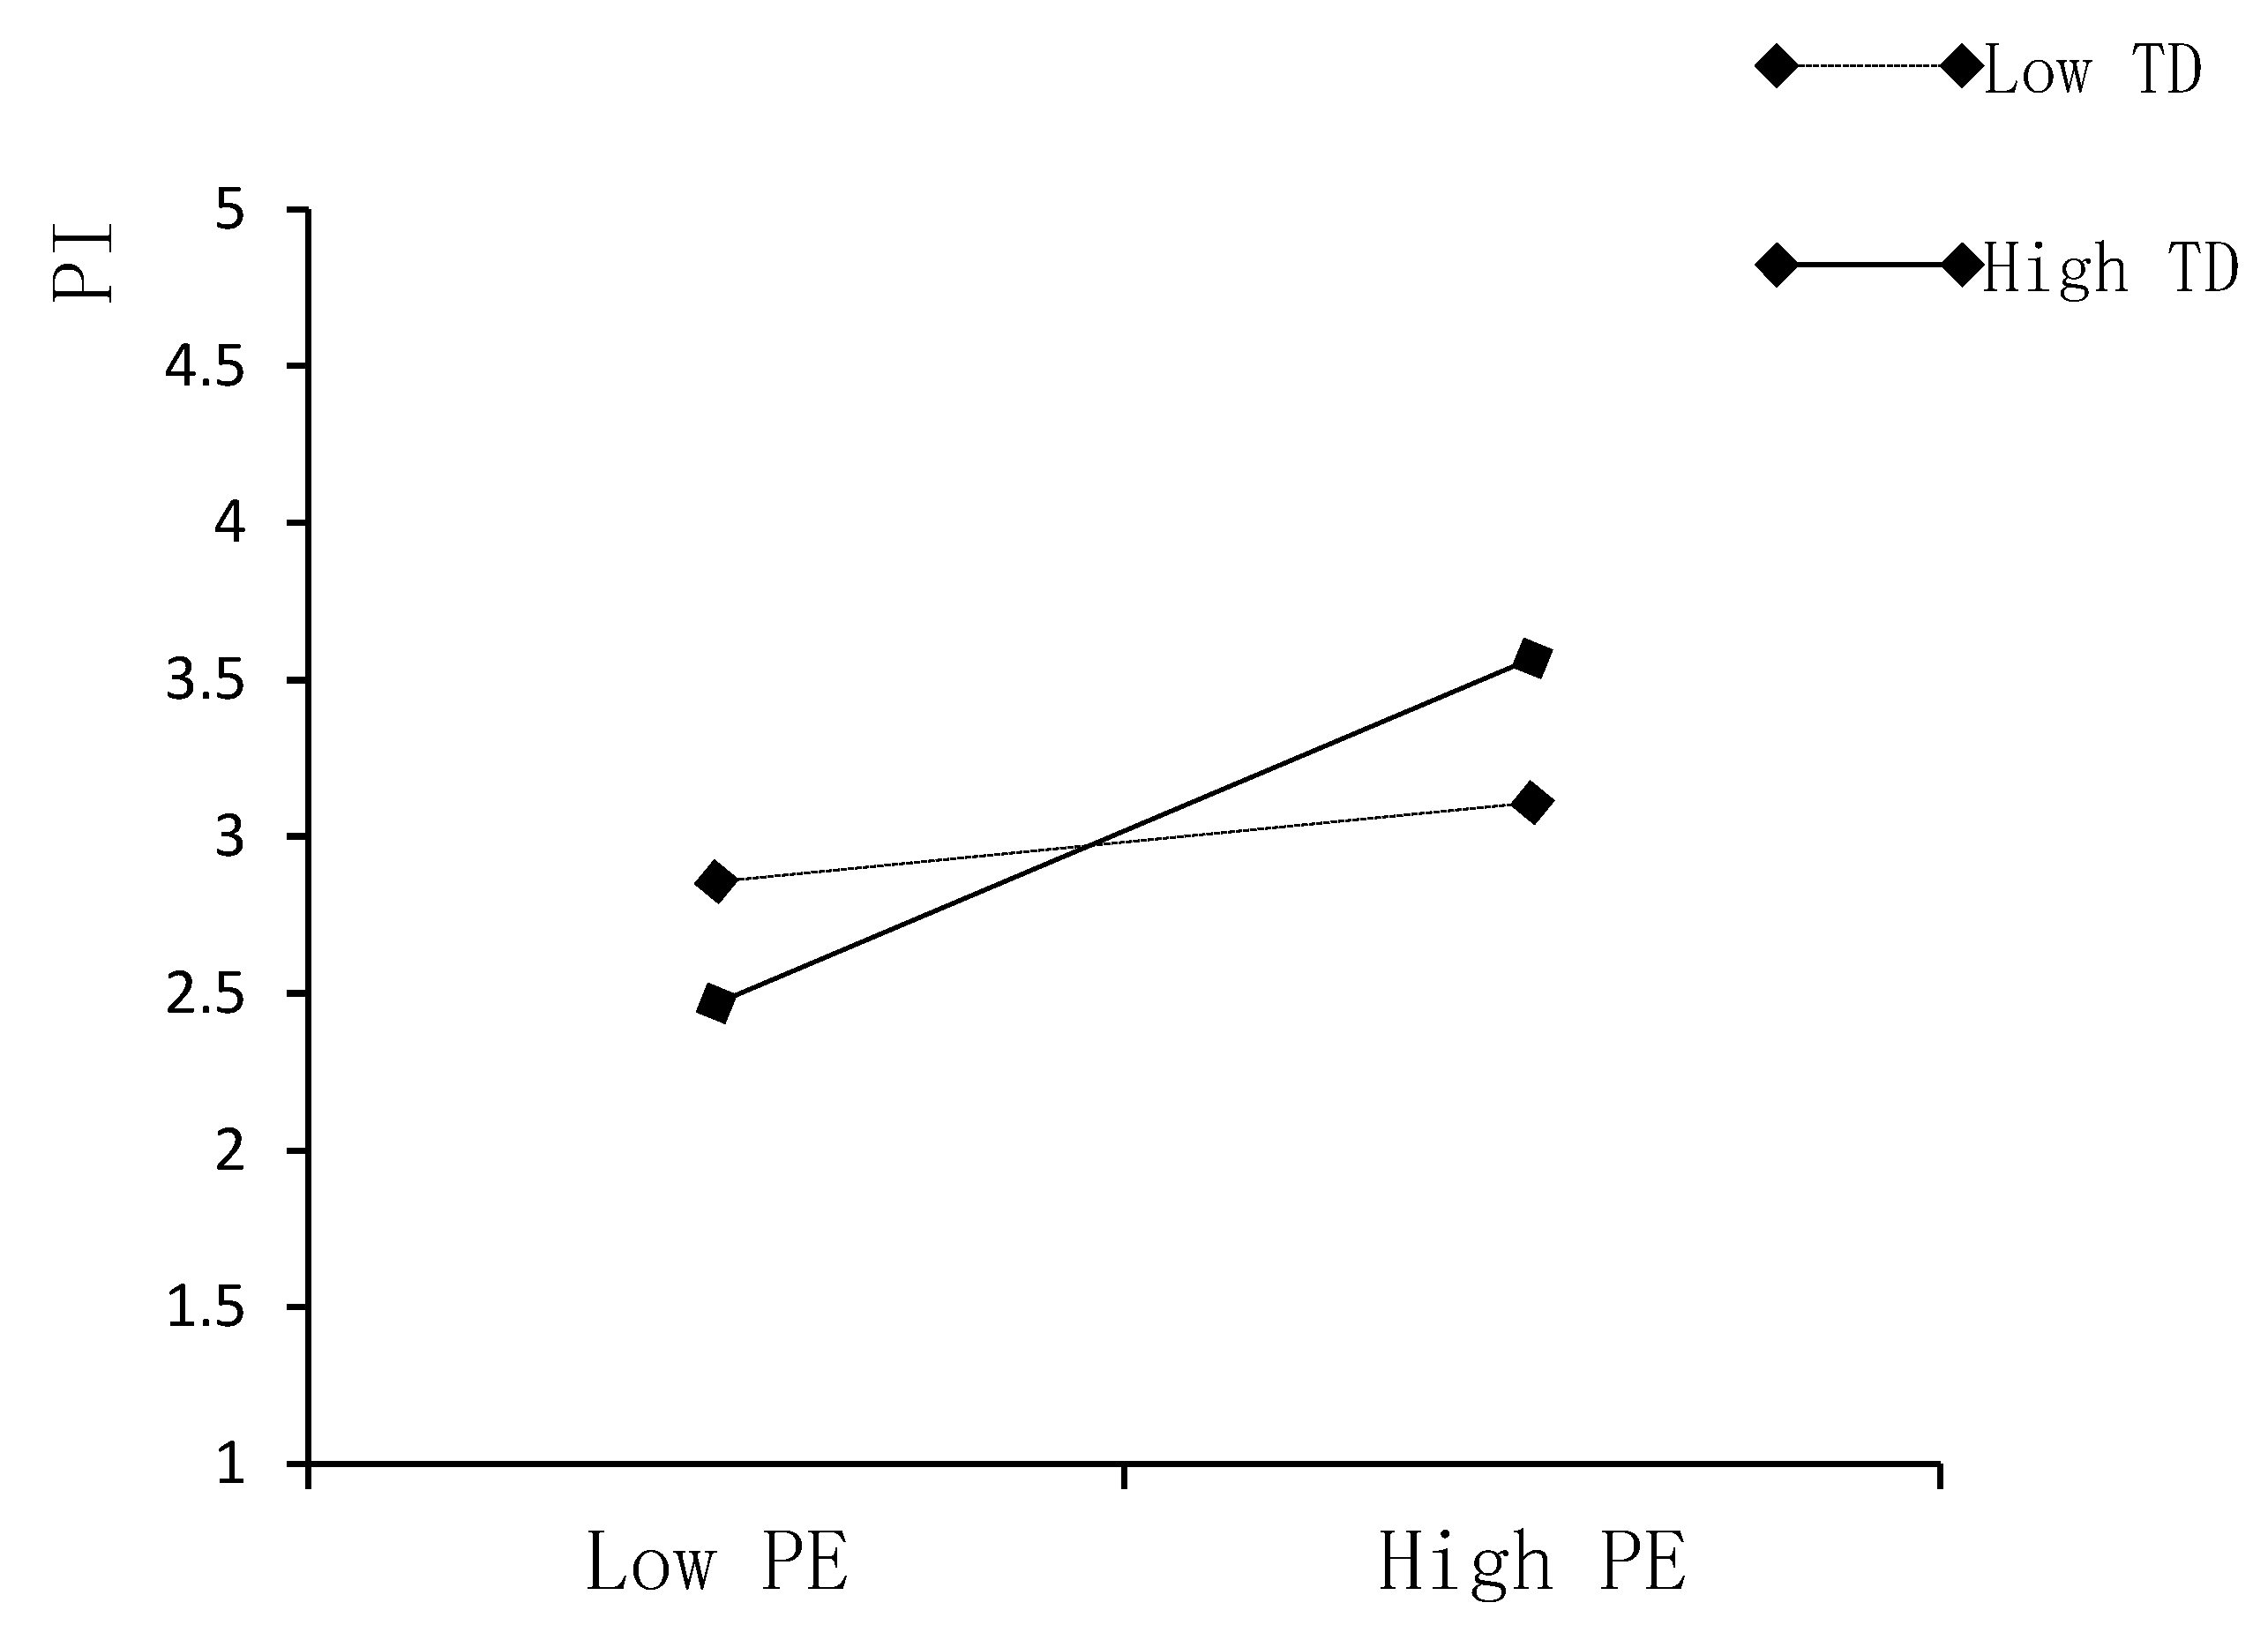
Analysis of moderating effects seeks to explore whether certain variables affect the strength or direction of relationships between other variables. Moderating effect analysis is often used to identify whether a variable enhances or weakens the relationship between independent and dependent variables, or whether it changes the nature of the relationship. A common approach to moderating effect analysis is to test through interaction terms.According to the simple slope chart, when TD is at a low level, PE has a positive effect on PI, and when TD is at a high level, PE has a positive effect on PI. That is, TD has a positive regulating effect on the influence of PE on PI.
Figure 3.
2: Simple Slope Chart.
When TD is at a low level, PU has a positive effect on PI, and when TD is at a high level, the positive effect of PU on PI is enhanced. That is, TD has a positive regulating effect on the influence of PU on PI.
Figure 3.
3: Simple Slope Chart.
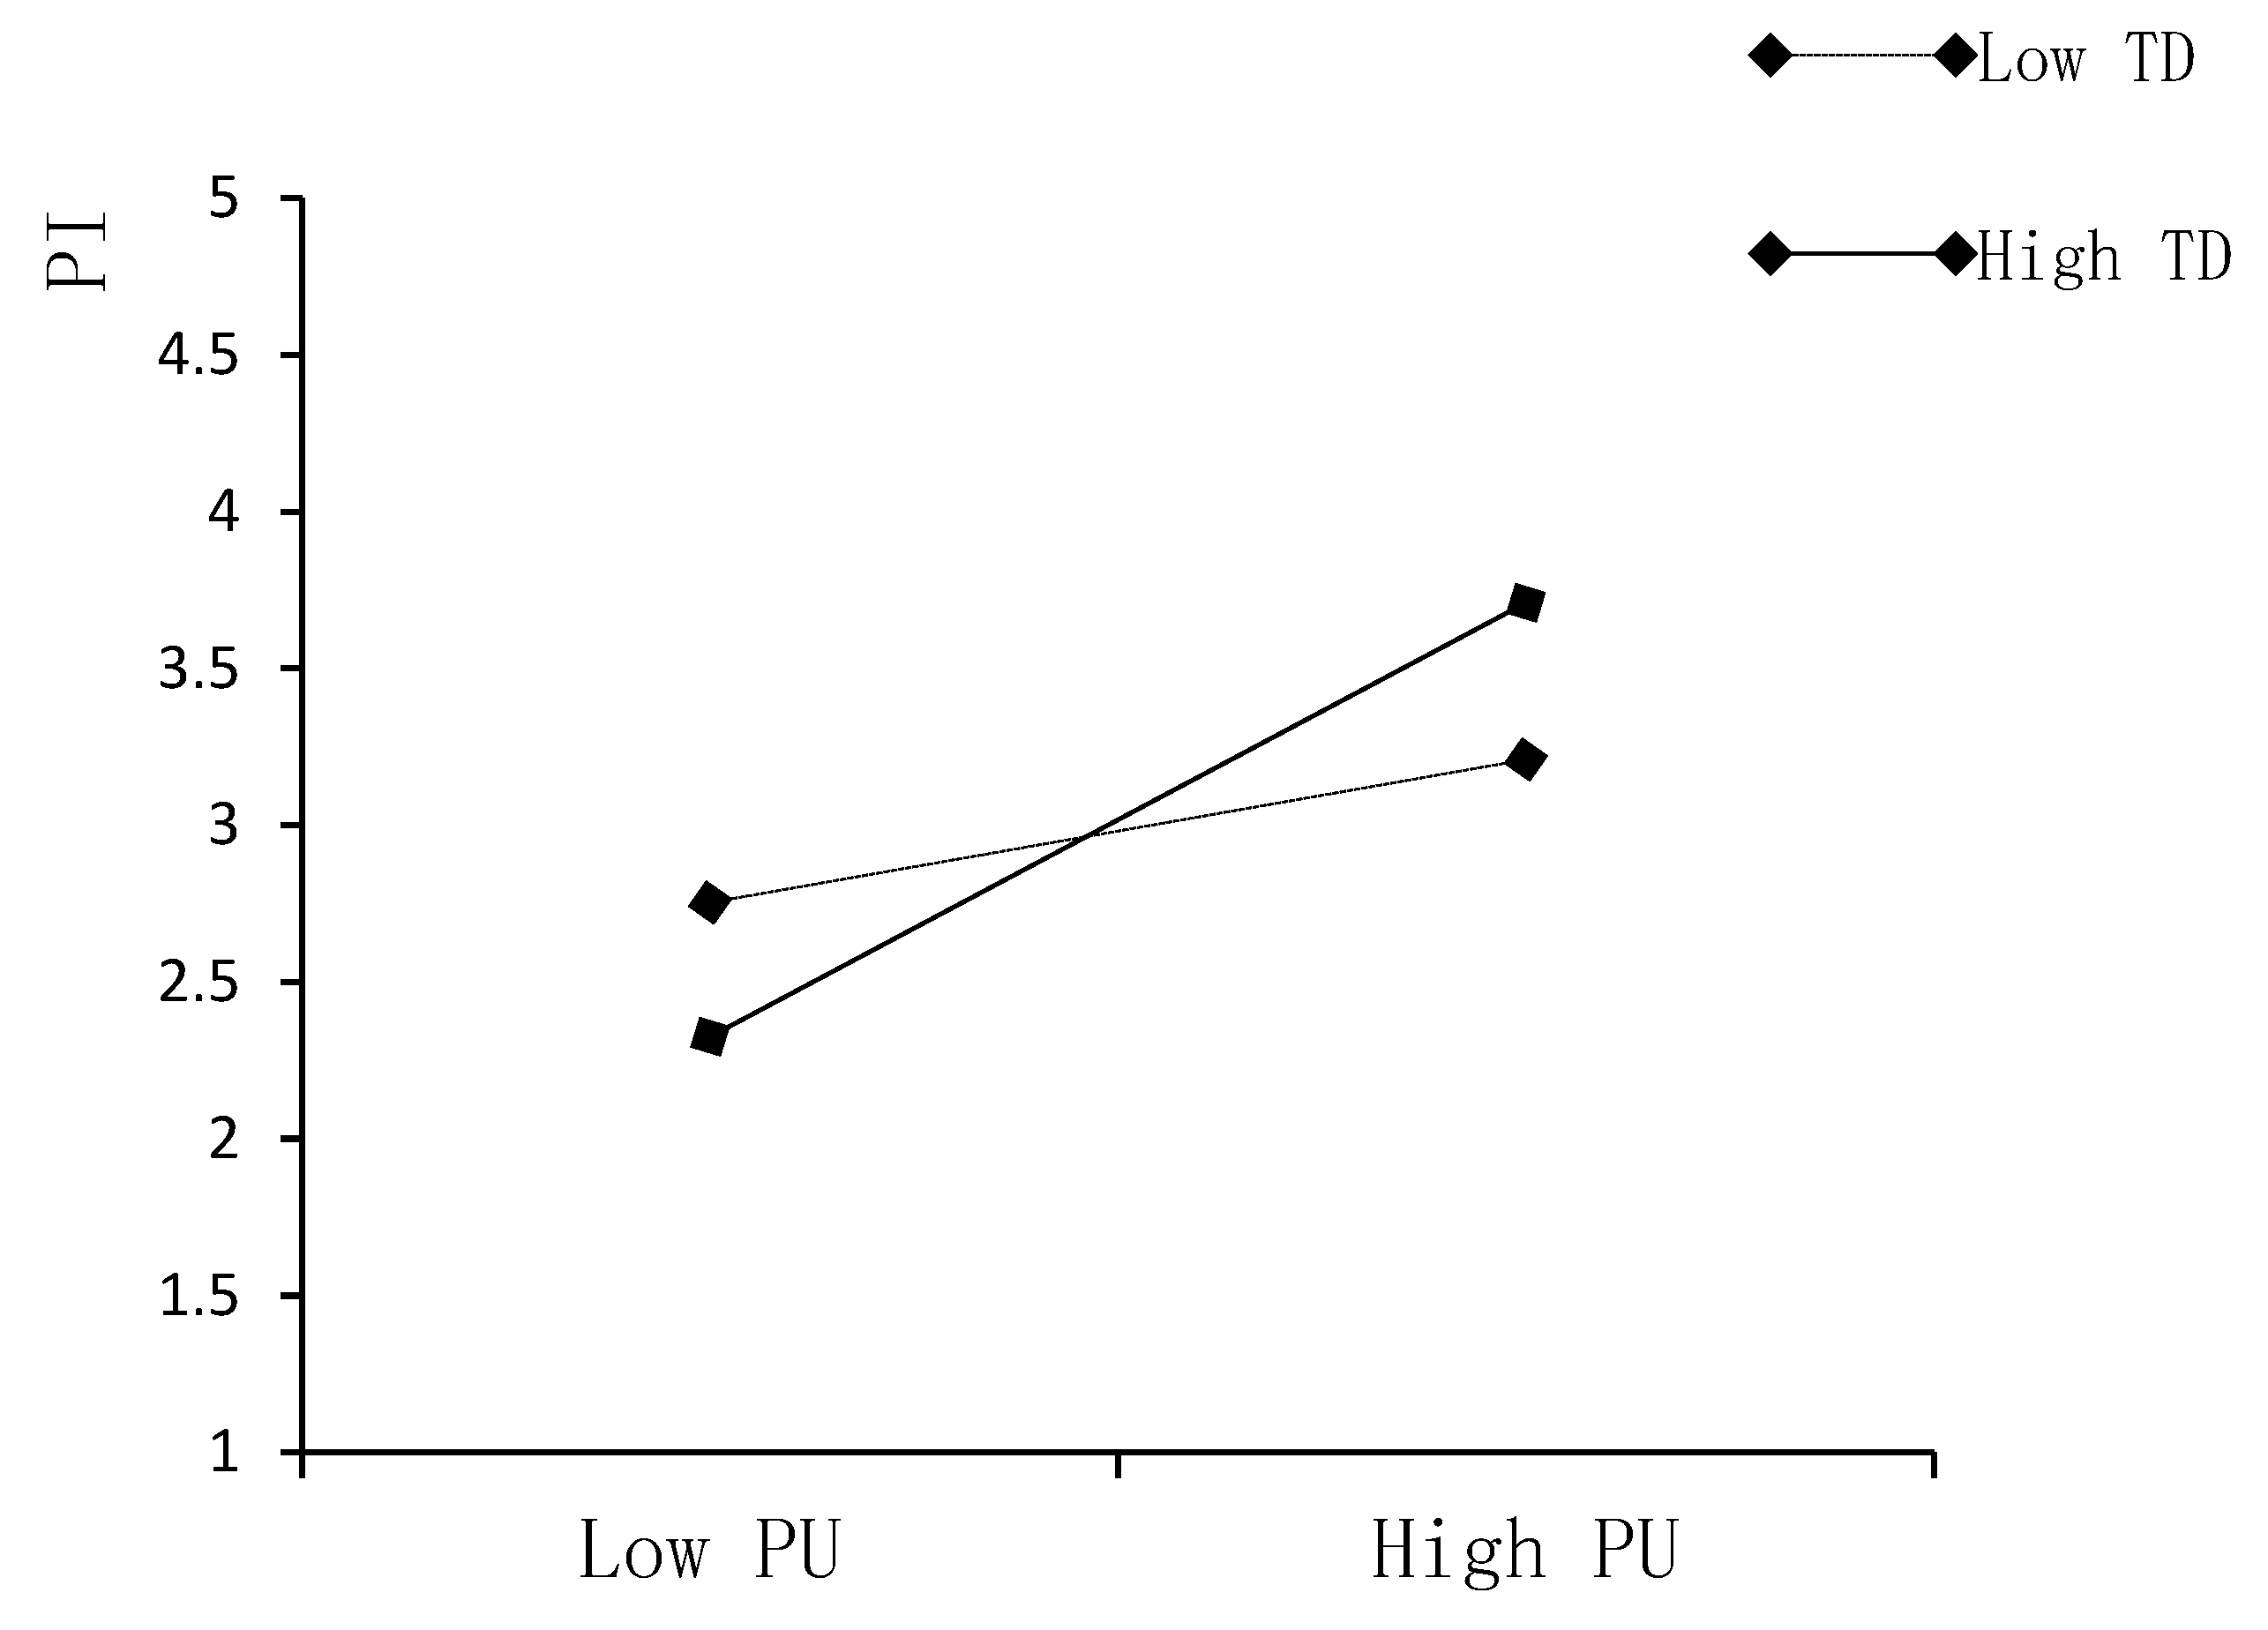
The results of the simple slope graph show that TD has a positive adjustment effect on the relationship between PE and PI and PU to PI. This means that as TD levels increase, the impact of PE and PU on PI becomes more significant, underscoring the important regulatory role of TD in these two paths. This finding contributes to a further understanding of how PE and PU affect PI at different TD levels and provides models with new regulatory effects.
4. Discussion
This study reveals the significant positive impact of policy incentives (POI) on consumers' purchase intention (PI), with a path coefficient of 0.21 (p < 0.001), which is consistent with previous studies. The central role of financial incentives, such as subsidies and tax breaks, in promoting the adoption of electric vehicles (EVs) is highlighted (Wang et al., 2017). Policy incentives are widely recognized as one of the key factors influencing consumers' EV purchase decisions (Hardman et al., 2017). For example, by providing financial support such as purchase subsidies and tax breaks, the government has significantly reduced the cost of buying cars for consumers, thus stimulating their purchase intentions. Wang et al. (2017) pointed out that policy incentives play a crucial role especially in the initial promotion stage of electric vehicles, where consumers' acceptance of electric vehicles is relatively low, and price is still the main factor affecting purchase decisions. Policy incentives will not only help reduce the cost of buying a car for consumers, but also significantly increase their awareness and confidence in electric vehicles. In addition, the study found that policy incentives significantly increased consumers' perceived usefulness (PU) and perceived ease of use (PE) for electric vehicles. Dubey and Santoso (2015) pointed out that policy support can not only reduce the cost of using electric vehicles, but also enhance consumers' confidence in using electric vehicles through infrastructure construction. This finding is consistent with the technology acceptance model (TAM) of Venkatesh et al. (2003), which points out that perceived usefulness and perceived ease of use are important factors affecting the acceptance and use of technology, and policy incentives promote consumers' purchase decisions by enhancing the perception of these two dimensions. Moreover, PU and PE mediate the relationship between POI and PI, as evidenced by partial mediation effects. This suggests that enhancing consumer perceptions of EVs' usability and utility plays a crucial role in translating policy incentives into purchase intentions. Another notable finding is the moderating role of the test drive experience (TD). Through test driving, consumers are able to experience the advantages of electric vehicles first-hand, thereby reducing doubts about their performance and enhancing positive perceptions of vehicle characteristics such as acceleration performance, driving experience, etc.(Sun et al., 2019). This study reveals for the first time the complex moderating role of perceived oil price fluctuations (MOPV) in the relationship between policy incentives (POI) and purchase intention (PI). Empirical results show that MOPV significantly negatively moderates the direct impact of POI on PI (β = -0.078, *p* < 0.05), that is, when consumers perceive intensified fluctuations in oil prices, especially when oil prices rise, the promoting effect of policy incentives on purchase intentions weakens.
5. Conclusions
This study provides new empirical support for the technology acceptance model (TAM) from a theoretical perspective, especially exploring how government policy incentives affect consumers' purchase intention through perceived usefulness and perceived ease of use. Different from previous studies which mainly focus on the indirect effect of policies, this study empirically analyzes the direct impact of policy incentives on consumer behavior. Second, the study highlights the unique moderating role of test drive experience in enhancing consumers' purchase intention. In addition, the study further revealed the mediating role of perceived usefulness and perceived ease of use between policy incentives and purchase intention, providing a theoretical basis for the government and automobile manufacturers to formulate policies.From a practical perspective, this study provides valuable guidance for governments, car manufacturers and retailers. The government should implement comprehensive policies including financial subsidies, infrastructure construction and public promotion, and increase investment in charging facilities to improve the policy effect. Automakers need to raise awareness of the benefits of electric vehicles through advertising and test-drive campaigns. This study confirms that the perception of oil price fluctuations (MOPV) reveals the complex decision-making mechanism of consumers under energy price uncertainty through the effect of negative regulatory policy incentives (POI). At the practical level, it is suggested that the government design flexible subsidy policies (such as dynamic binding of oil prices and subsidies) and jointly provide long-term value preservation services with vehicle manufacturers to enhance the agility of policy response. At the theoretical level, the research supplements the behavioral economics perspective to the Technology Acceptance Model (TAM), emphasizing the interaction between market dynamics and psychological risks, and providing a multi-dimensional analytical framework for future electric vehicle promotion strategies.
Despite the important contributions of this study, there are some limitations: This study focuses on the direct mechanisms through which policy incentives (POI), perceived usefulness (PU), and perceived ease of use (PE) influence consumers' purchase intention (PI) for electric vehicles (EVs). While the existing model incorporates charging convenience (e.g., questionnaire items on "charging infrastructure accessibility"), it is important to note that the widespread adoption of EVs is closely tied to dynamic synergies with energy systems. Dynamic electricity pricing policies (e.g., time-of-use pricing) and smart grid technologies (e.g., vehicle-to-grid (V2G) interaction) can significantly shape consumers' perceptions of EVs' lifecycle economic benefits and convenience by adjusting charging costs and operational complexity. However, current pricing policies and technical standards remain in a phase of rapid evolution (e.g., pilot programs for real-time pricing in some regions, unresolved debates over battery-swapping versus plug-in charging models, and the lack of large-scale V2G implementation). To ensure the stability and interpretability of our findings, this study does not currently integrate grid interaction or electricity price signals into the core model. Once pricing policies and technical frameworks stabilize, future research will incorporate variables such as grid interaction (e.g., smart charging station coverage) and electricity price signals (e.g., peak-valley tariff differentials) into an expanded model.Additionally, the current study's sample is concentrated in first-tier cities with stringent policy enforcement and mature infrastructure (e.g., Beijing, Shanghai). However, significant disparities exist across China's urban tiers. Consumers in lower-tier cities may rely more heavily on direct financial subsidies (e.g., instant discounts of ¥20,000 for EV purchases) and place less emphasis on charging convenience. This heterogeneity may limit the generalizability of our conclusions. Future studies will expand coverage to second- and third-tier cities and rural areas to analyze differences in policy impact pathways across urban tiers, thereby enhancing the structural universality of the model.
Author Contributions
Author Contributions: Methodology, CHEN PEI; validation, Prof. Dr. Mohama Hisyam Bin Selamat; formal analysis, CHEN PEI; investigation, CHEN PEI; data curation, CHEN PEI; writing—original draft preparation, CHEN PEI; writing—review and editing, Prof. Dr. Mohama Hisyam Bin Selamat; supervision, Prof. Dr. Mohama Hisyam Bin Selamat,conceptualization, Dr.Lee See Nie. All authors have read and agreed to the published version of the manuscript.Explanation of Roles: CHEN PEI: Handled methodology design, data curation, formal analysis, investigation, and drafted the manuscript. Prof. Dr. Mohama Hisyam Bin Selamat: Provided supervision, validated results, and edited the manuscript. Dr.Lee See Nie: Contributed to the overarching research goals (conceptualization).Authorship Note: CHEN PEI is the first author; Prof. Dr. Mohama Hisyam Bin Selamat is the second author; Dr.Lee See Nie is the corresponding author.
Funding
This research received no external funding
Conflicts of Interest
The authors declare no conflicts of interest.
Abbreviations
The following abbreviations are used in this manuscript:
| EV | Electric vehicle |
References
- Barrett, P. (2007). Structural equation modelling: Adjudging model fit. Personality and Individual differences, 42(5), 815-824. [CrossRef]
- Bougie, R., & Sekaran, U. (2019). Research methods for business: A skill building approach. John Wiley & Sons.
- Brückmann, G. (2022). Test-drives & information might not boost actual battery electric vehicle uptake? Transportation Research Part A: Policy and Practice, 160, 204-218. [CrossRef]
- Bryman, A. (2016). Social research methods. Oxford university press.
- Chuan, C. L., & Penyelidikan, J. (2006). Sample size estimation using Krejcie and Morgan and Cohen statistical power analysis: A comparison. Jurnal Penyelidikan IPBL, 7(1), 78-86.
- Cohen, J. (2013). Statistical power analysis for the behavioral sciences. routledge.
- Davis, F. D., Bagozzi, R., & Warshaw, P. (1989). Technology acceptance model. J Manag Sci, 35(8), 982-1003.
- Dubey, A., & Santoso, S. (2015). Electric vehicle charging on residential distribution systems: Impacts and mitigations. IEEE Access, 3, 1871-1893. [CrossRef]
- Egbue, O., & Long, S. (2012). Barriers to widespread adoption of electric vehicles: An analysis of consumer attitudes and perceptions. Energy Policy, 48, 717-729. [CrossRef]
- Field, A. (2024). Discovering statistics using IBM SPSS statistics. Sage publications limited.
- Fornell, C., & Larcker, D. F. (1981). Evaluating structural equation models with unobservable variables and measurement error. Journal of marketing research, 18(1), 39-50.
- Hair, J. (2009). Multivariate data analysis. Exploratory factor analysis.
- Hair Jr, J. F., Hult, G. T. M., Ringle, C. M., Sarstedt, M., Danks, N. P., & Ray, S. (2021). Partial least squares structural equation modeling (PLS-SEM) using R: A workbook. Springer Nature.
- Hamilton, J. D. (2009). Causes and Consequences of the Oil Shock of 2007-08.
- Han, L., Wang, S., Zhao, D., & Li, J. (2017). The intention to adopt electric vehicles: Driven by functional and non-functional values. Transportation Research Part A: Policy and Practice, 103, 185-197.
- Hardman, S., Chandan, A., Tal, G., & Turrentine, T. (2017). The effectiveness of financial purchase incentives for battery electric vehicles–A review of the evidence. Renewable and Sustainable Energy Reviews, 80, 1100-1111. [CrossRef]
- Haustein, S., Jensen, A. F., & Cherchi, E. (2021). Battery electric vehicle adoption in Denmark and Sweden: Recent changes, related factors and policy implications. Energy Policy, 149, 112096. [CrossRef]
- Huang, X., Lin, Y., Lim, M. K., Tseng, M.-L., & Zhou, F. (2021). The influence of knowledge management on adoption intention of electric vehicles: perspective on technological knowledge. Industrial Management & Data Systems, 121(7), 1481-1495.
- Khaleel, M., Nassar, Y., El-Khozondar, H. J., Elmnifi, M., Rajab, Z., Yaghoubi, E., & Yaghoubi, E. (2024). Electric vehicles in China, Europe, and the United States: Current trend and market comparison. Int. J. Electr. Eng. and Sustain., 1-20.
- Kim, Y., Kim, H., & Suh, K. (2021). Environmental performance of electric vehicles on regional effective factors using system dynamics. Journal of Cleaner Production, 320, 128892. [CrossRef]
- Lashari, Z. A., Ko, J., & Jang, J. (2021). Consumers’ intention to purchase electric vehicles: Influences of user attitude and perception. Sustainability, 13(12), 6778. [CrossRef]
- Lawrence, E. D. (2022). JD Power survey: More buyers are'very likely'to consider EVs. USA Today, 01B-01B.
- Li, W., Long, R., Chen, H., & Geng, J. (2017). Household factors and adopting intention of battery electric vehicles: a multi-group structural equation model analysis among consumers in Jiangsu Province, China. Natural Hazards, 87, 945-960.
- Li, W., Long, R., Chen, H., Wang, M., Li, Q., Wu, M., & Cheng, X. (2023). Inter-provincial emissions transfer embodied in electric vehicles in China. Transportation research part D: transport and environment, 119, 103756. [CrossRef]
- Li, Y., Liang, C., Ye, F., & Zhao, X. (2023). Designing government subsidy schemes to promote the electric vehicle industry: A system dynamics model perspective. Transportation Research Part A: Policy and Practice, 167, 103558. [CrossRef]
- Liu, M., Wu, J., Zhu, C., & Hu, K. (2022). Factors Influencing the Acceptance of Robo-Taxi Services in China: An Extended Technology Acceptance Model Analysis. Journal of Advanced Transportation, 2022(1), 8461212.
- Lv, Z., Qiao, L., Cai, K., & Wang, Q. (2020). Big data analysis technology for electric vehicle networks in smart cities. IEEE Transactions on Intelligent Transportation Systems, 22(3), 1807-1816. [CrossRef]
- Masrom, M. (2007). Technology acceptance model and e-learning. Technology, 21(24), 81.
- Nunnally, J. C., & Bernstein, I. (1978). Psychometric theory mcgraw-hill new york. The role of university in the development of entrepreneurial vocations: a Spanish study, 387-405.
- Rezvani, Z., Jansson, J., & Bodin, J. (2015). Advances in consumer electric vehicle adoption research: A review and research agenda. Transportation research part D: transport and environment, 34, 122-136. [CrossRef]
- Schmitt, G., Scott, J., Davis, A., & Utz, T. (2016). Patents and progress; intellectual property showing the future of electric vehicles. World Electric Vehicle Journal, 8(3), 635-645.
- Sekaran, U. (2016). Research methods for business: A skill building approach. In: John Wiley & Sons.
- Solaymani, S. (2019). CO2 emissions patterns in 7 top carbon emitter economies: The case of transport sector. Energy, 168, 989-1001. [CrossRef]
- Sun, X., Li, Z., Wang, X., & Li, C. (2019). Technology development of electric vehicles: A review. Energies, 13(1), 90. [CrossRef]
- Venkatesh, V., & Davis, F. D. (2000). A theoretical extension of the technology acceptance model: Four longitudinal field studies. Management science, 46(2), 186-204.
- Venkatesh, V., Morris, M. G., Davis, G. B., & Davis, F. D. (2003). User acceptance of information technology: Toward a unified view. MIS quarterly, 425-478.
- Wang, Q., Li, S., & Li, R. (2018). China's dependency on foreign oil will exceed 80% by 2030: Developing a novel NMGM-ARIMA to forecast China's foreign oil dependence from two dimensions. Energy, 163, 151-167. https://doi.org/http://qwrewgerhttyh.
- Wang, S., Li, J., & Zhao, D. (2017). The impact of policy measures on consumer intention to adopt electric vehicles: Evidence from China. Transportation Research Part A: Policy and Practice, 105, 14-26. [CrossRef]
- Wang, S., Wang, J., Li, J., Wang, J., & Liang, L. (2018). Policy implications for promoting the adoption of electric vehicles: do consumer’s knowledge, perceived risk and financial incentive policy matter? Transportation Research Part A: Policy and Practice, 117, 58-69. [CrossRef]
- White, L. V., Carrel, A. L., Shi, W., & Sintov, N. D. (2022). Why are charging stations associated with electric vehicle adoption? Untangling effects in three United States metropolitan areas. Energy Research & Social Science, 89, 102663. [CrossRef]
- Zhang, X., & Bai, X. (2017). Incentive policies from 2006 to 2016 and new energy vehicle adoption in 2010–2020 in China. Renewable and Sustainable Energy Reviews, 70, 24-43. [CrossRef]
- Zhang, X., Bai, X., & Zhong, H. (2018). Electric vehicle adoption in license plate-controlled big cities: Evidence from Beijing. Journal of Cleaner Production, 202, 191-196. [CrossRef]
- Zhang, X., Xie, J., Rao, R., & Liang, Y. (2014). Policy incentives for the adoption of electric vehicles across countries. Sustainability, 6(11), 8056-8078. [CrossRef]
- Zhao, X., Hu, H., Yuan, H., & Chu, X. (2023). How does adoption of electric vehicles reduce carbon emissions? Evidence from China. Heliyon, 9(9).
- Zikmund, W. G., Babin, B. J., Carr, J. C., & Griffin, M. (2010). Business Research Method 8th ed. In: Cengage Learning.
Disclaimer/Publisher’s Note: The statements, opinions and data contained in all publications are solely those of the individual author(s) and contributor(s) and not of MDPI and/or the editor(s). MDPI and/or the editor(s) disclaim responsibility for any injury to people or property resulting from any ideas, methods, instructions or products referred to in the content. |
© 2025 by the authors. Licensee MDPI, Basel, Switzerland. This article is an open access article distributed under the terms and conditions of the Creative Commons Attribution (CC BY) license (http://creativecommons.org/licenses/by/4.0/).
Copyright: This open access article is published under a Creative Commons CC BY 4.0 license, which permit the free download, distribution, and reuse, provided that the author and preprint are cited in any reuse.


