
Submitted:
28 May 2025
Posted:
28 May 2025
You are already at the latest version
Abstract
This paper presents a procedure to explain the focus of the Convolutional Neural Networks (CNNs) for classifying apple diseases. The goal of this work is to promote more transparency and trust in CNN-based diagnostic tools by using Explainable AI (XAI) methods -here Grad-CAM (Gradient-weighted Class Activation Mapping) in the agricultural setting. The main concept in the proposed pipeline is to use apple leaf images as well as the manually created lesion segmentation masks. A pre-trained CNN is used for disease classification, where the last two-weighted layers are employed to extract the significantly enriched features, and then Grad-CAM is used to output the heatmap to highlight the informative parts for the decision. One of the main contributions of this study is to quantitatively compare these Grad-CAM heatmaps with the ground truth labels (lesion masks) in terms of Intersection over Union (IoU) score. This test gives us a way to quantitatively evaluate if the CNN is learning from real disease symptoms. By making decisions about the model dependent on pathological features, this approach intends to provide the application of CNNs for apple disease classification with much valuable confidence and reliability.
Keywords:
CNN
; Explainable AI
; Grad-CAM
; Image Processing
; Intersection over Union
; Lesion Segmentation
; Apple Disease Classification
1. Introduction
Timely and precise diagnosis of plant disease plays a vital role in modern agriculture, which is directly related to crop yields, plant quality, and food security. Various forms of technology have also been utilized for this purpose, with Convolutional Neural Networks (CNNs) proving to be a powerful tool with great potential to identify and classify diseases based on images. These deep learning models have the capability of automatically learning complex patterns and features from images of plant leaves, making it possible to diagnose more rapidly and many times more accurately.
However, the “black-box” behavior of numerous deep learning models, including CNNs, can pose a great barrier toward the wide acceptance and reliability, especially in high-stakes applications such as agricultural diagnostics. Although a CNN could achieve high classification performance, it is important to guarantee that the prediction is attributed to truly meaningful pathological characteristics, rather than to other sources of correlation spuriously learned or from the background artifacts in the image. To solve this, the area known as Explainable AI (XAI) provides methods to verify the decision-making of these models.
In this paper, a method to visually and quantitatively validate the focus of a CNN when diagnosing apple diseases is outlined. We will use lesion segmentation masks that accurately define the diseased regions on an apple leaf to evaluate if the CNN is truly "seeing" the right areas. In particular, we use Grad-CAM (Gradient-weighted Class Activation Mapping), a widely used XAI method, to produce heatmaps that highlight image regions responsible for CNN's classification outcome. These heatmaps are quantitatively assessed with respect to the ground truth lesion segmentation masks using the Intersection over Union (IoU) score. This method not only gives a visual explanation for the model’s attention, but also a stable quantitative representation showing how the model aligns with human-defined disease characteristics, bringing more confidence in the efficiency of the CNN-based apple disease classification model.
2. Related Work
Deep learning (DL) algorithms, especially Convolutional Neural Networks (CNNs) have greatly contributed to leveraging-based automated disease diagnosis and classification for plant images. Different architectural designs have been studied, e.g., Devi et al. presented a CLD-CNN to perform plant disease detection with deep feature extraction, achieving 99.17% accuracy on the PlantVillage dataset [1]. Ray et al. proposed a Dual-Head CNN (DH-CNN) to simultaneously classify plant leaves and plant diseases with accuracies of 99.71% and 99.26% [3]. The PlantVillage data is commonly used as the benchmark in such studies. Yao et al. A ’s wide-ranging review classified different types of DL models—multi-model, multi-label, multi-output, and multi-task for plant identification and disease classification, with the InceptionV3 as a robust backbone CNN [4].
Some researchers concentrate on diseases of the apple tree. Agrawal et al. carried out an extensive survey of DL models for detecting plant diseases, focusing on apple leaf diseases in specific [5]. Jose et al. introduced a CNN model for apple leaf disease prediction with 99% accuracy, involving the preprocessing and hyperparameter optimization [6]. Mir et al. developed a hybrid model of CNN-SVM for multiclass detection of eight different apple leaf diseases, which obtained an accuracy of 95% [7].
Image segmentation based on how it improves disease detection even in the presence of a noisy background, has also been studied. Raj Kumar et al. original contributions: [2] An adaptive algorithm of (AH-CNN) can be implemented to achieve an accurate classification of plant diseases with original images and after the development of a method of segmentation with improved accuracies (95.27 %) when implemented on noisy real-time images through the segmentation. ROSSELLI M AND JAGTAP S applied Otsu’s thresholding-based segmentation for lesion isolation in their research work on rice plant disease identification [16]. Srivats et al. applied a UNet model for Cassava leaf segmentation and obtained an Intersection over Union (IoU) of 91.08 for segmentation accuracy [14].
Along with the complexity of DL models, Explainable AI (XAI) is increasingly more important for effective plant pathology trust. Nigar et al. pp presented an XAI-powered system with LIME for visual explanations to classify 38 type of plant diseases [8]. Kiriella et al. addressed XAI system challenges in plant disease recognition and performed a comparative study with XAI methods for symptom localization [11]. Similarly, Sneha et al. employed LIME and Grad-CAM to explain wheat disease recognition models and observed that Grad-CAM achieved explanations of higher quality [12]. There are other works where transparency is enforced by using XAI, for example in Santhi et al.'s research in coconut leaf disease diagnosis [18] and Arvind et al., About [19]. Plant disease classification in the trust of computer-aided diagnostic solutions [19].
We take Grad-CAM as an example to visualize the focus areas of CNN. Noviandy et al. employed Grad-CAM for interpretability in bean leaf disease classification and visualized that the model concentrated on the disease-specific features [10]. Peyal et al. used Grad-CAM to visualize diseases detected by their light-weight model CNN-SVM for grape leaves [13]. Otiya et al. employed Grad-CAM on different CNNs, namely ResNet50, for cotton leaf disease classification [15]. Srivats et al. integrated Grad-CAM and SHAP to explain how their UNet-based model distinguished healthy and diseased Cassava leaf regions [14]. Arvind et al. explained the predictions of their EfficientNet B5 model with XAI and corroborated these explanations with YOLOv4, indicating a step to validate XAI outputs [19].
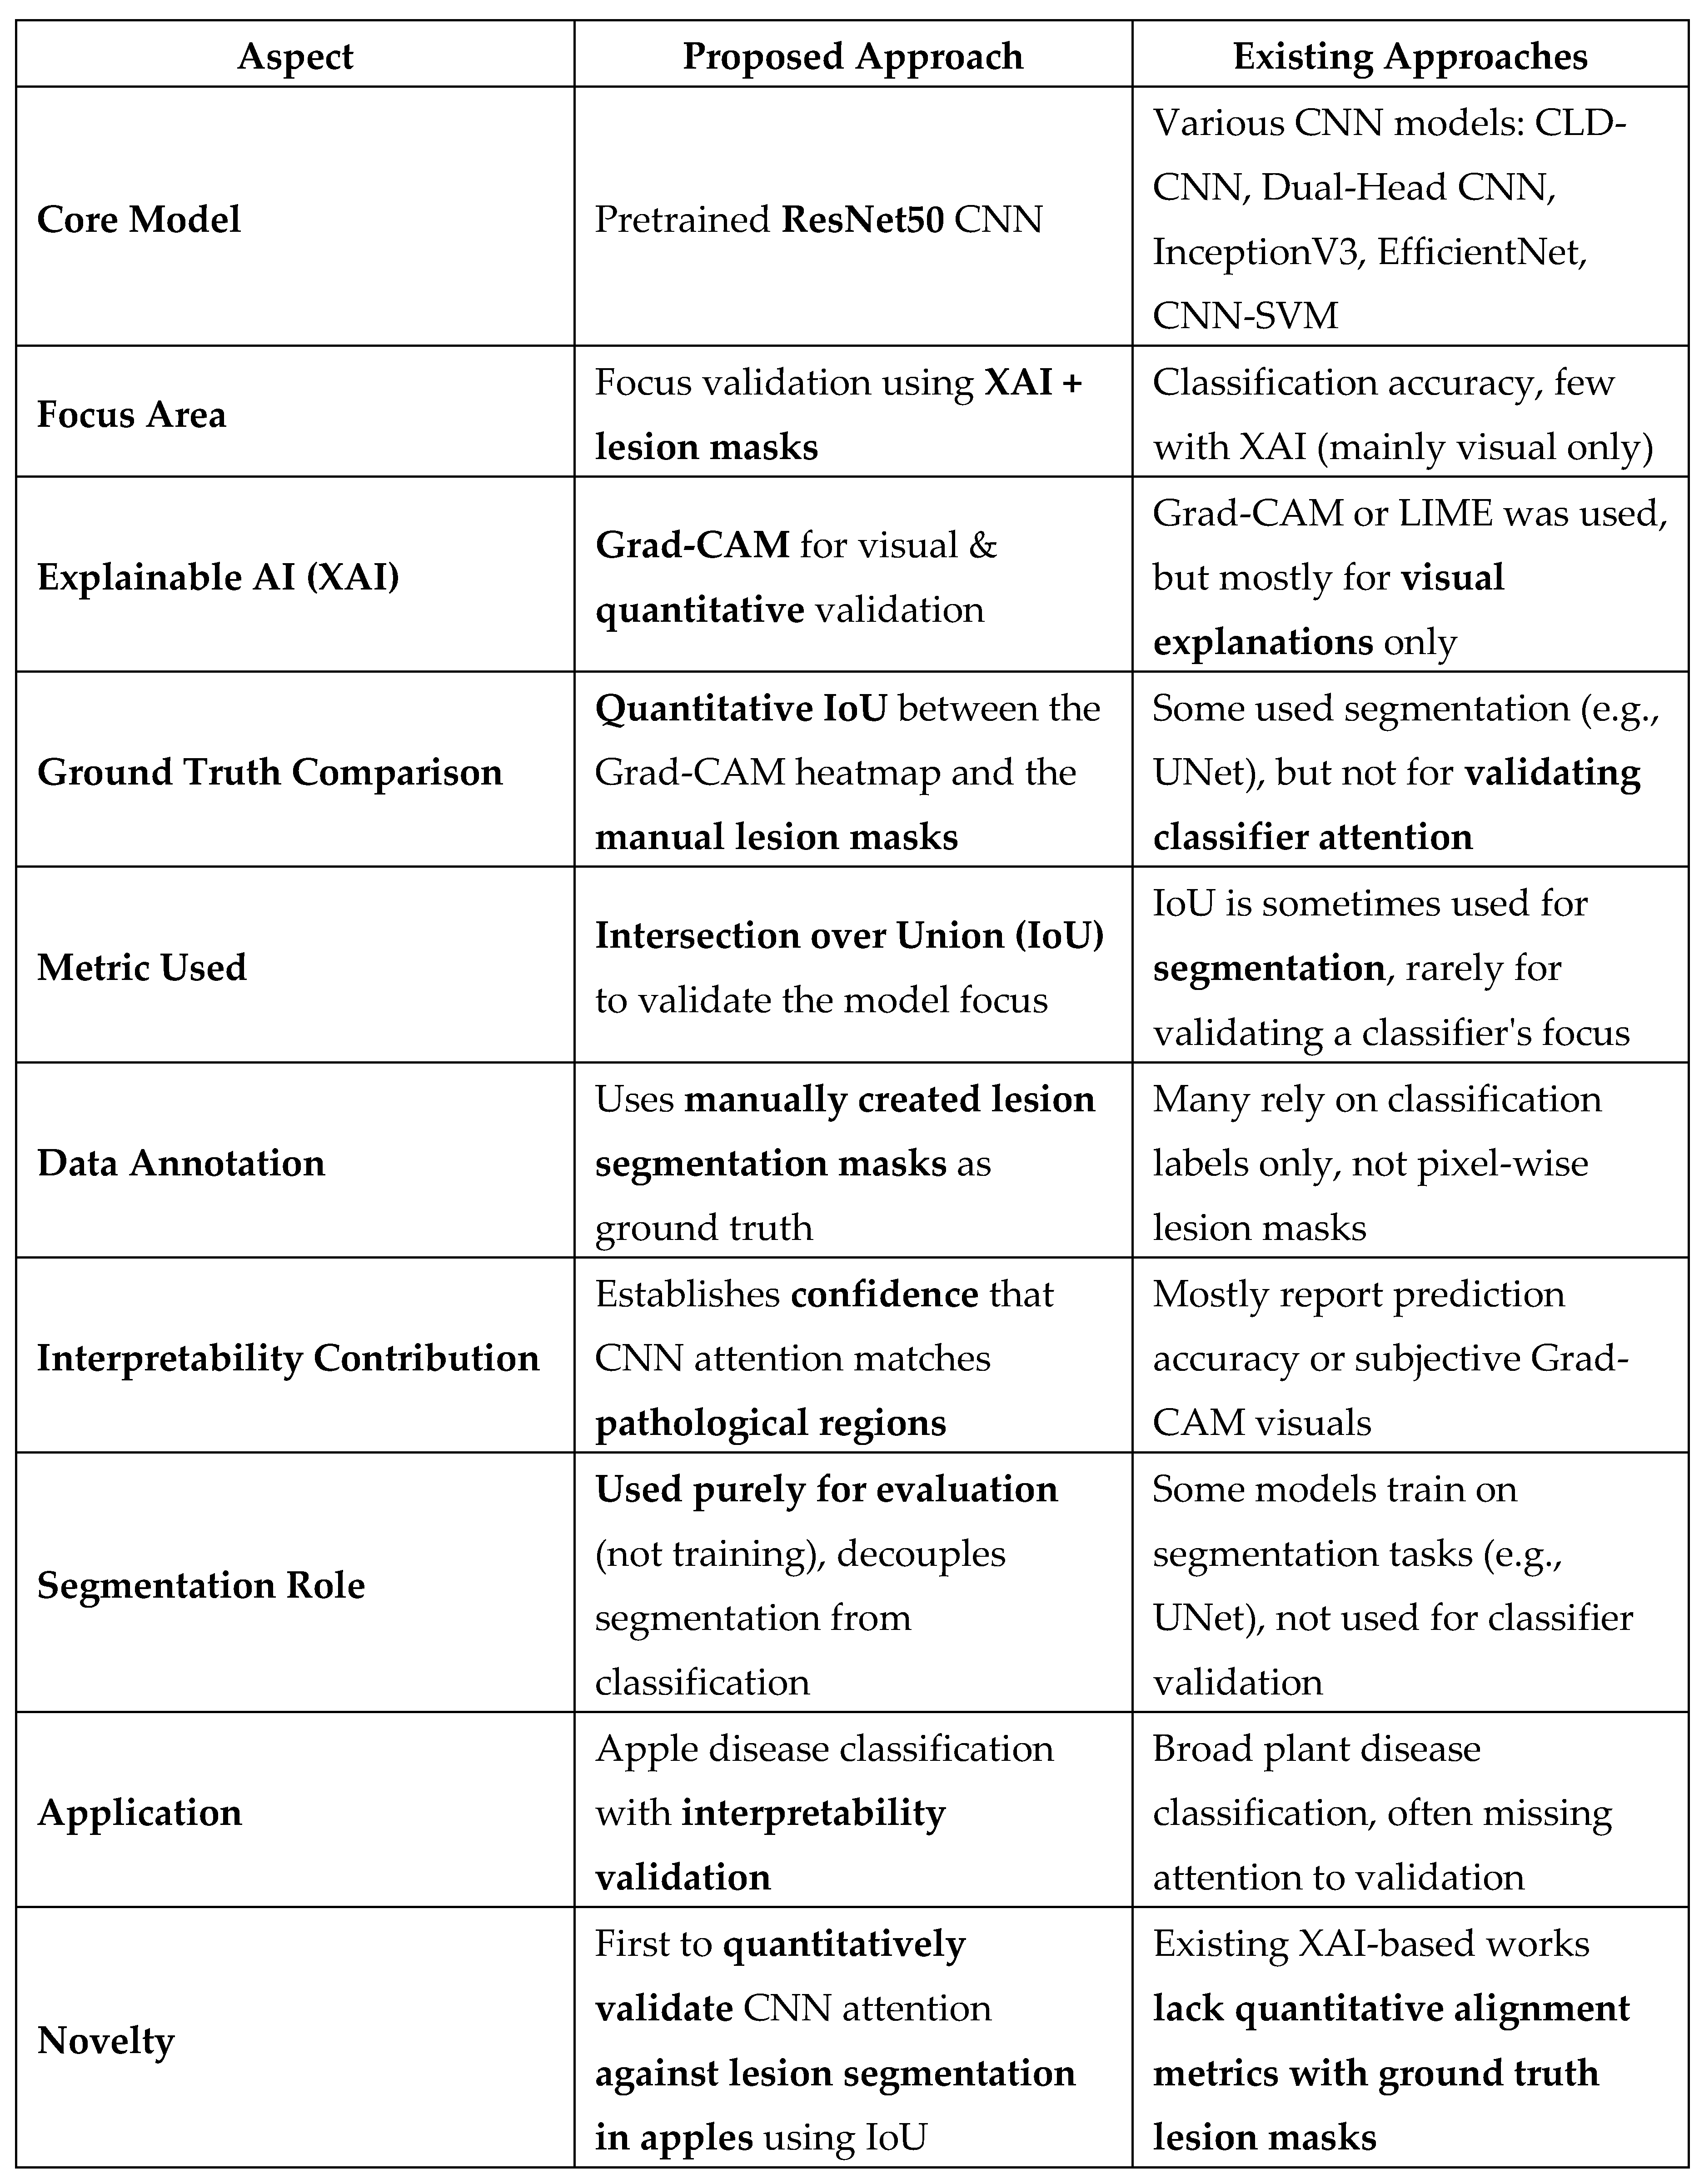
Although many studies have been carried out on Deep Learning for plant and apple disease classification and it has begun to be integrated with XAI, such as Grad-CAM for visual interpretation, the separate use for apple diseases to quantitatively validate CNN's visual foci against the ground-truth with lesion segmentation masks by utilizing IoU is less well-studied. Srivats et al.'s approach calculated IoU on a segmentation model based on UNet with XAI for visualization [14]. In this work, we attempt to fill this gap by quantitatively assessing the quality of these discriminative image regions recognized by a classification CNN on apple leaves, as well as the direct overlap with real manual delineation of diseases, via IoU. We believe this manner of validation can help to promote the reliability of CNN-based apple disease classification by providing a stricter assessment of whether the classifier is "looking" at the correct pathological characteristics.

Table 1.
Comparison of Proposed Approach with Existing Methods.
 |
3. Methodology
The adopted approach in this study is built to formally verify the attention mechanism of a Convolutional Neural Network (CNN) for the apple leaf disease classification. This is accomplished by comparing the model focus against ground truth lesion segmentation masks, computed using Explainable AI (XAI) techniques. This procedure encompasses various essential phases, including data collection and preparation, computational implementation, and quantitative assessment, which are carefully described in the following.
A. Data Loading and Pre-Processing
This study is based on well-processed, well-prepared image data. The first step includes loading the apple leaf images and their lesion segmentation masks as well as standardization in order to make them compatible and consistent with the deep learning model.
Image Loading:
The procedure starts by loading the apple leaf images from the specified dataset. Each image is then parsed and resized into the fixed-size (commonly 224x224) image format. This resizing allows for standardization across input samples as well as matches the associated standard input requirements of pre-trained CNN architectures such as ResNet50. The resulting image is resized and represented as a numerical array to be used in deep learning frameworks. Note: A copy of the original image array is transferred to the device first, and it is preserved to be used for visualization at the end.
Mask Loading:
The corresponding lesion segmentation masks are also loaded alongside the leaf images. These masks are important as they can serve as the ground-truth labelling of the infected regions on each leaf. These masks are scaled down to 224x224 pixels each, so that they match, pixel-wise, their corresponding images. The masks are usually loaded as gray-scale images.
A final step in processing these masks is normalization, where the intensity is scaled to 0-1 by dividing each pixel value by 255.0 (the maximum pixel intensity for an 8-bit image). After normalization, the masks are binarized. This is done by utilizing a threshold (e.g., a value of 0.5); pixels with a value higher than that of the threshold are set to be 1 (lesion area), and those with a value below are assigned as 0 (healthy tissue). This binarization creates a binary map of the lesion regions, which is required for the further quantification of the comparison to the mapped focus areas of the CNN. If the channel is inadvertently still present in the loaded mask array, this superfluous channel is removed or "squeezed" to have the mask be a 2D array.
B. Classification Model
Pre-Trained CNN for Image Classification pre-trained Convolutional Neural Network (CNN) is used for image classification. In particular, we use the ResNet50 model. Various models based on ResNet50 (which are deep residual learning frameworks) have shown excellent performance on different image recognition tasks. By adopting a pre-trained model (e.g., pre-trained on ImageNet), we benefit from the learned rich feature representations on a large-scale dataset.
Note: Please remember that in a real-world, production application, this pre-trained ResNet50 model would be fine-tuned on a bespoke, robust apple disease dataset. Such a fine-tuning would make the learned features more specific to the particularity of the apple leaf diseases, which should make the feature representation more discriminative and therefore the classification solution more accurate and the feature extraction more relevant for the task at hand. For the purpose of demonstrating the methodology, we use the pre-trained weights to demonstrate validation of the model's focus.
C. Grad-CAM Generation
In order to better explain and visualize the regions of an input image that the model focuses on while making a classification decision, we use the Gradient-weighted Class Activation Mapping (Grad-CAM) technique. Grad-CAM is a popular XAI approach that generates a rough localization map pointing to the crucial parts in the image for achieving the target class.
The Grad-CAM heatmap is produced by taking the gradients of the target class volume with respect to the output of the last convolutional layer of the ResNet50 model. These gradients are globally average-pooled to yield neuron importance weights, which are blended with forward activation maps of the convolutional layer. The corresponding heatmap illustrates the focus strength of the model, the hotter, the more the examined region contributed to the classification output for a specific disease class.
For quantitative comparison, this constructed Grad-CAM heatmap is then thresholded (e.g., 0.5). In the heatmap, regions whose intensity values are over the threshold are regarded as focus areas of the CNN; those with values below the threshold are not. This binarized Grad-CAM mask can now be compared directly with the actual lesion mask.
D. Alignment Metric
For quantitatively measuring the consistency between the captured region from FLS (indicated by the binarized Grad-CAM heatmap) and the lesion region (defined by the ground-truth segmentation mask), we use the Intersection over Union (IoU) metric. IoU, or the Jaccard index, is a popular measure to assess the similarity between two sets, that is widely employed in object detection and image segmentation problems.
Here the IoU is the area of overlap between the binarized Grad-CAM mask and the ground-truth lesion mask divided by the area of their union.
IoU = (Area of Intersection) / (Area of Union)
A high IoU value demonstrates good correspondence between the regions that the CNN focuses on in order to classify and the actual diseased regions on the leaf. Thus, this metric quantifies how much the attention of the CNN matches the ground truth.
E. Main Workflow
The general approach has a structured pipeline for each image-mask pair in the dataset:
Figure 1.
System architecture.
- Load and Preprocess: The apple leaf image and corresponding lesion segmentation mask are loaded and preprocessed as outlined in section 2.1.
- Classification: A preprocessed image is inputted into the pre-trained ResNet50 model to predict the classification of the disease.
- Produce Grad-CAM: A Grad-CAM (or Attention) based heatmap is produced at the time of prediction (or on any other desired class) to visualize what the CNN is focusing on. This heatmap is then thresholded.
- IoU score: The binarized Grad-CAM mask and binarized ground-truth lesion mask are compared and an IoU score is calculated to estimate the alignment of the masks.
- Visualize Results: The original image, ground truth mask, Grad-CAM heatmap (sometimes superimposed on the original image), binary Grad-CAM mask and the IoU score are displayed together to give qualitative as well as quantitative evidence of the focus of CNNs.
This integrated approach provides a systematic analysis of CNN interpretability and relevance of learned features towards apple disease classification.
4. Implementation Details
This part of the paper presents the details of the software, libraries, configuration parameters, and constitutes the key functional components on which the methodology described in the paper is based. The code was written in Python.
A. Sources and Libraries Employed
The implementation of the proposed approach was driven by several commonly used Python libraries and frameworks:
- TensorFlow (and Keras API): It has been the main deep learning framework used for constructing and executing (the pre-trained ResNet50 model), the Convolutional Neural Network. The model definition and image input/output utility function and was implemented by Keras as part of TensorFlow (tensorflow. keras. applications, tensorflow. keras. preprocessing. image, tensorflow. keras. models).
- NumPy: Used for high-performance numerical computing such as image, mask, and heatmap array manipulation.
- OpenCV (cv2): For OpenCV tasks like resizing heatmaps (cv2. resize) as well as for generating sample images.
- Matplotlib (pyplot): Used for displaying the original images, ground-truth masks, Grad-CAM heatmaps and the binarized intensities.
- Pandas: For structuring and storing results (e.g., IoU, prediction) of processing multiple images into a DataFrame.
- OS: The default Python os module was used for file system operations path joining, listing directory contents dealing with image and mask files.
B. Configuration Parameters
Employment of the following parameters standardized the processing and the operation of the model itself:
- Image Dimensions (IMG_WIDTH, IMG_HEIGHT): The Input image and mask dimensions were standardized to (224 × 224), commonly used for the inputs of ResNet50.
-
Grad-CAM Layer Names:
- ▪
- LAST_CONV_LAYER_NAME: It is the name of last conv layer used for Grad-CAM which is "conv5_block3_out" from ResNet50 model.
- ▪
- CLASSIFIER_LAYER_NAME: Given "predictions", which is the last layer for ResNet50 model for classification.
-
Binarization Thresholds:
- ▪
- A threshold of 0.5 was applied to binarize the normalized Grad-CAM heatmaps, resulting in a binary mask of the CNN’s foci.
- ▪
- A threshold of 0.5 was also applied on the loaded segmentation masks to binarize them, making a clear separation between lesion and non-lesion regions.
C. Key Functions
The implementation is broken down into a series of functions, each handling a specific part of the workflow:
- load_and_preprocess_image(img_path, target_size): This function loads an apple leaf image from img_path. it resizes the image to the target_size (eg 224x224) and preprocesses it as required by the ResNet50 model (eg by using tf.otsu etc.). keras. applications. resnet50. preprocess_input). It yields the processed image array that is used as input to the model as well as the original, resized image array that is used for display.
- load_segmentation_mask(mask_path, target_size): It loads the lesion segmentation mask from mask_path. It resizes the mask to a fixed (target) size, scales the pixel value to [0, 1] and binarizes the mask with a predefined threshold (0.5) to generate a binary map for the lesion region.
- get_classification_model(): Function to create and return a classifier model. In this demonstration, it prepares a ResNet50 base model with pre-trained ImageNet weights (and which is devoid of its top classification layer), before attaching a custom classification head specifically for a simulated set of apple disease classes. For illustration purposes, we freeze the layers of the base model.
- make_gradcam_heatmap(img_array_preprocessed, model, last_conv_layer_name, classifier_layer_name, pred_index): This function returns the Grad-CAM heatmap. It takes the preprocessed image tensor, the classification model and the last_conv_layer_name and classifier_layer_name names as input. It calculates the heatmap for the class at pred_index (or the top class if pred_index is None), and does the above restructuring.
- binarize_heatmap(heatmap, threshold): This is a helper function to convert a continuous gradient CAM heatmap into a binary map by a given threshold. The heatmap value higher than the threshold is set as 1, and others as 0.
- calculate_iou(mask1, mask2): Calculate the Intersection over Union (IoU) score between two binary masks (mask1, mask2) to get an indication of the extent of their overlap.
- decode_apple_disease_predictions(predictions, apple_disease_classes): Our decode_apple_disease_predictions function will handle decoding the raw output predictions (probabilities) into human-readable class labels using the list of apple_disease_classes that are passed along with it. Ideally, it should return the most likely classes and their probabilities.
- process_image_and_validate_focus(image_path, true_mask_path, classification_model, apple_disease_classes, show_plots): This function orchestrates the major parts of a single image. It simply loads the image and the true mask, preprocesses it, performs binary classification and outputs a Grad-CAM heatmap, computes the IoU score, and optionally visualizes the components if show_plots is true.
- find_matching_mask(image_file, mask_dir, mask_files): A utility function that will find the corresponding segmentation mask file in mask_dir for image_file based on a list of possible naming patterns.
- process_all_images(image_dir, mask_dir, classification_model, apple_disease_classes, show_plots): This function loops through all the image files in the provided image_dir and tries to find their matching masks in mask_dir, calling process_image_and_validate_focus on each valid pair. It concatenates everything (IoU scores, predictions) as a Pandas DataFrame.
- create_sample_image(image_path, mask_path): As described in the example usage in the given document, the function generates a synthetic sample apple leaf image with lesions, as well as its appropriate binary mask, if no real image data is present. This is essentially a demonstrational and testing functionality.
5. Results
In this section, we show the results achieved by applying the proposed methodology to a sample of apple leaf images and the respective lesion segmentation masks. Results are shown as qualitative visualizations of what the CNN focuses on and as quantitative scores corresponding to the alignment of this focus with the ground-truth lesion areas.
At the core of the results are the classification predictions of the ResNet50 model, the Grad-CAM heatmaps produced to demonstrate where the model looks when making the predictions, and the Intersection over Union (IoU) scores obtained with the binarized Grad-CAM heatmaps and ground-truth lesion masks. These features together enable an evaluation of not only how accurate the model is in with respect to the classification (i.e., on the sample data) but, more importantly for this study, whether the model makes decisions based on the actual pathological motifs it sees in the leaves.
Example Visualizations (Figures):
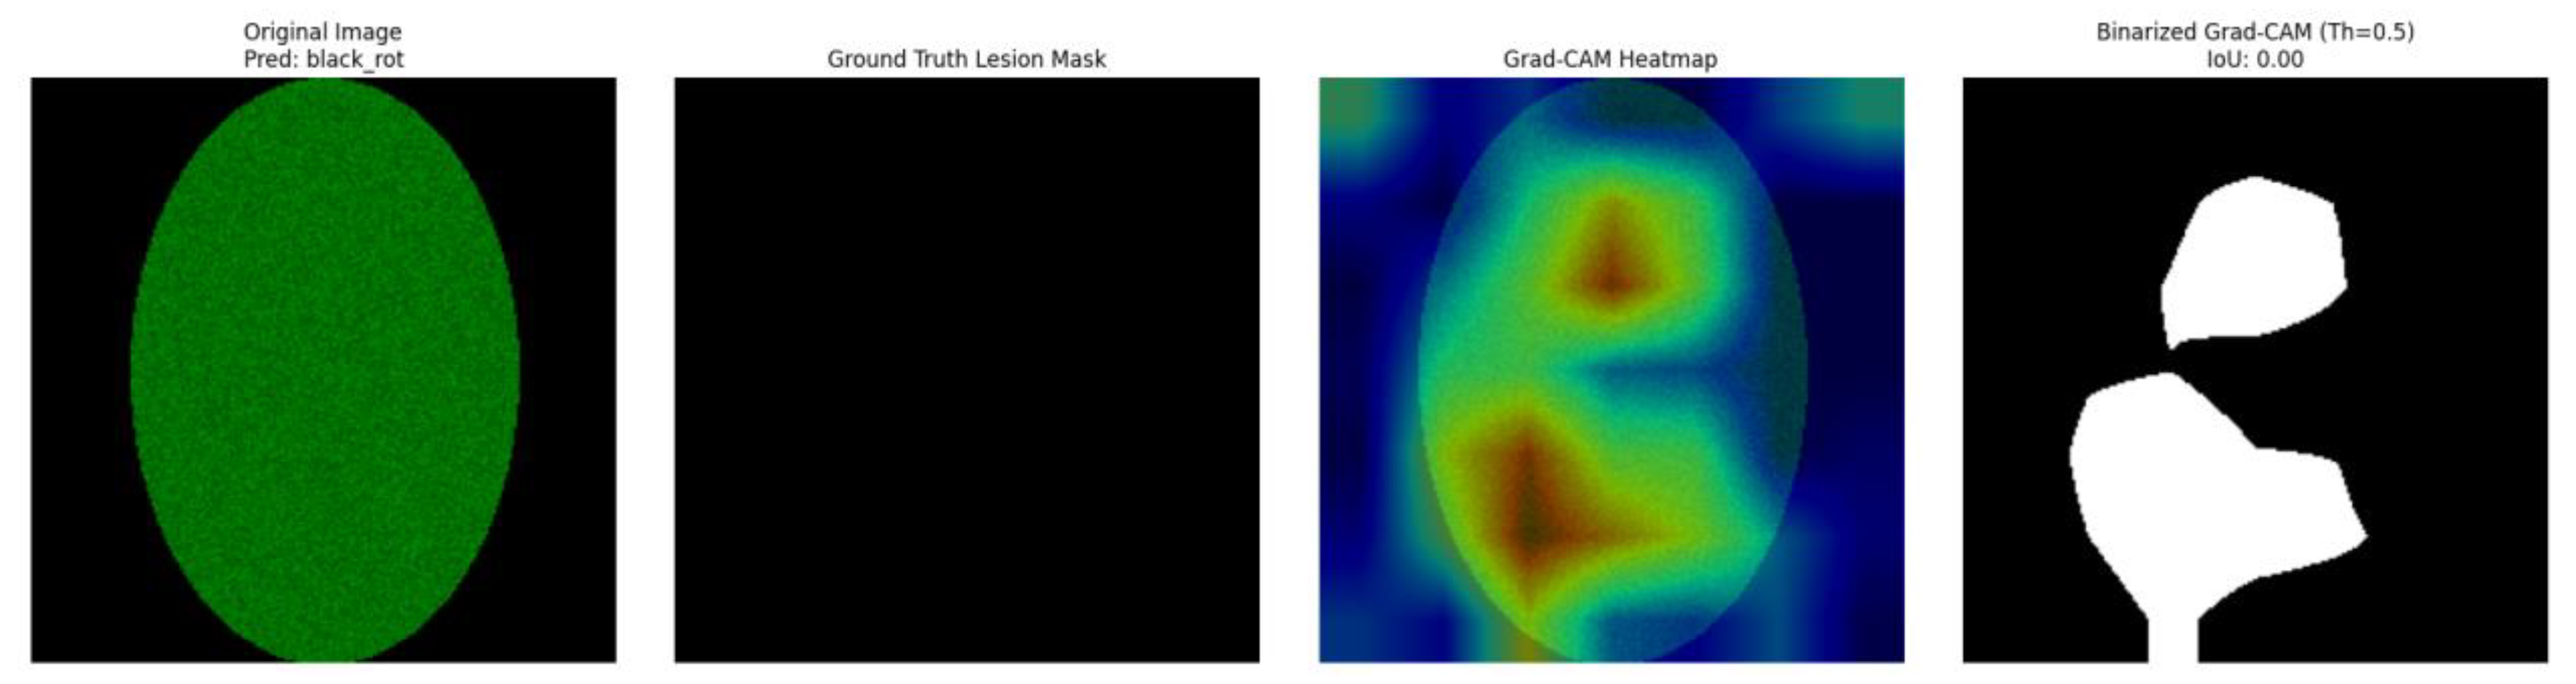
The visual outputs of the healthy apple leaf. Samples are shown by a 4-panel overlay in
Figure 2.
Healthy_apple_leaf.
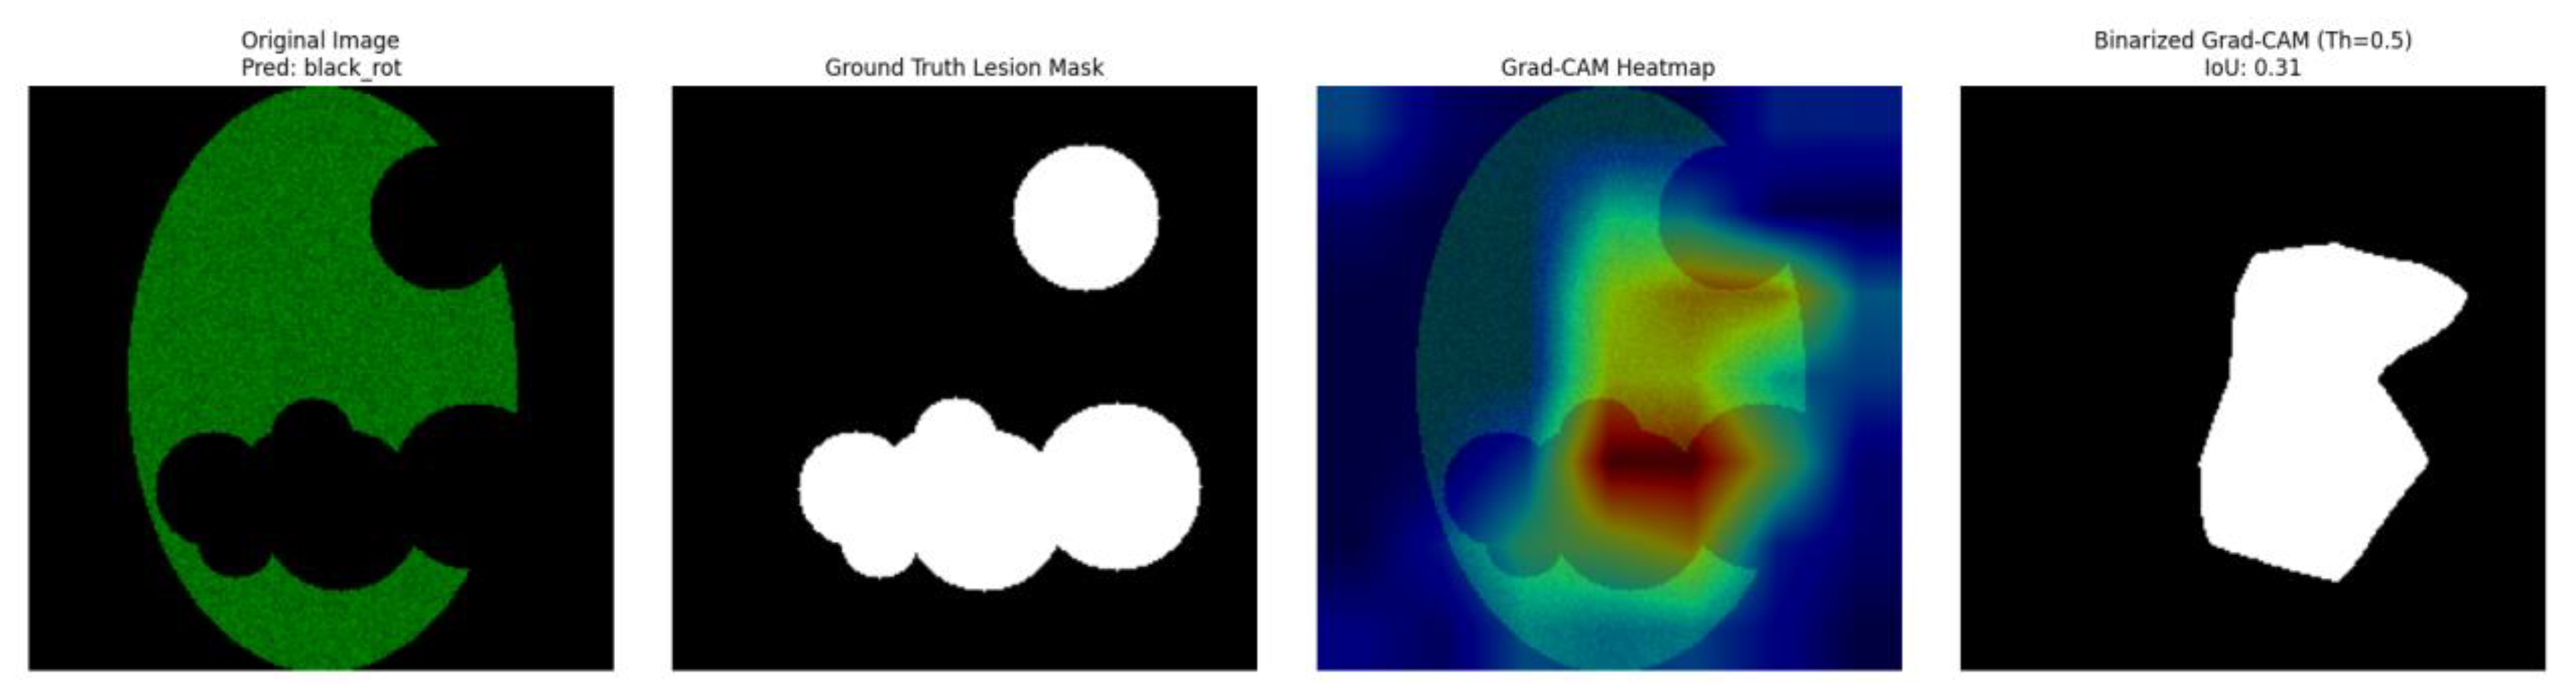
Figure 3.
Apple_scab_leaf.
These values, representing the output format described in the. the docx file (containing these multi-panel image outputs), which highlights the model’s attention and is presented below for each sample.
Table 2.
Confidence Score and Calculated IoU Score.
| Image Identifier/Filename | True Label | Top Predicted Disease Class | Confidence Score | Calculated IoU Score |
| healthy_apple_leaf | Healthy | black_rot | 0.64 | 0 |
| apple_scab_leaf | Apple Scab | black_rot | 0.66 | 0.3079 |
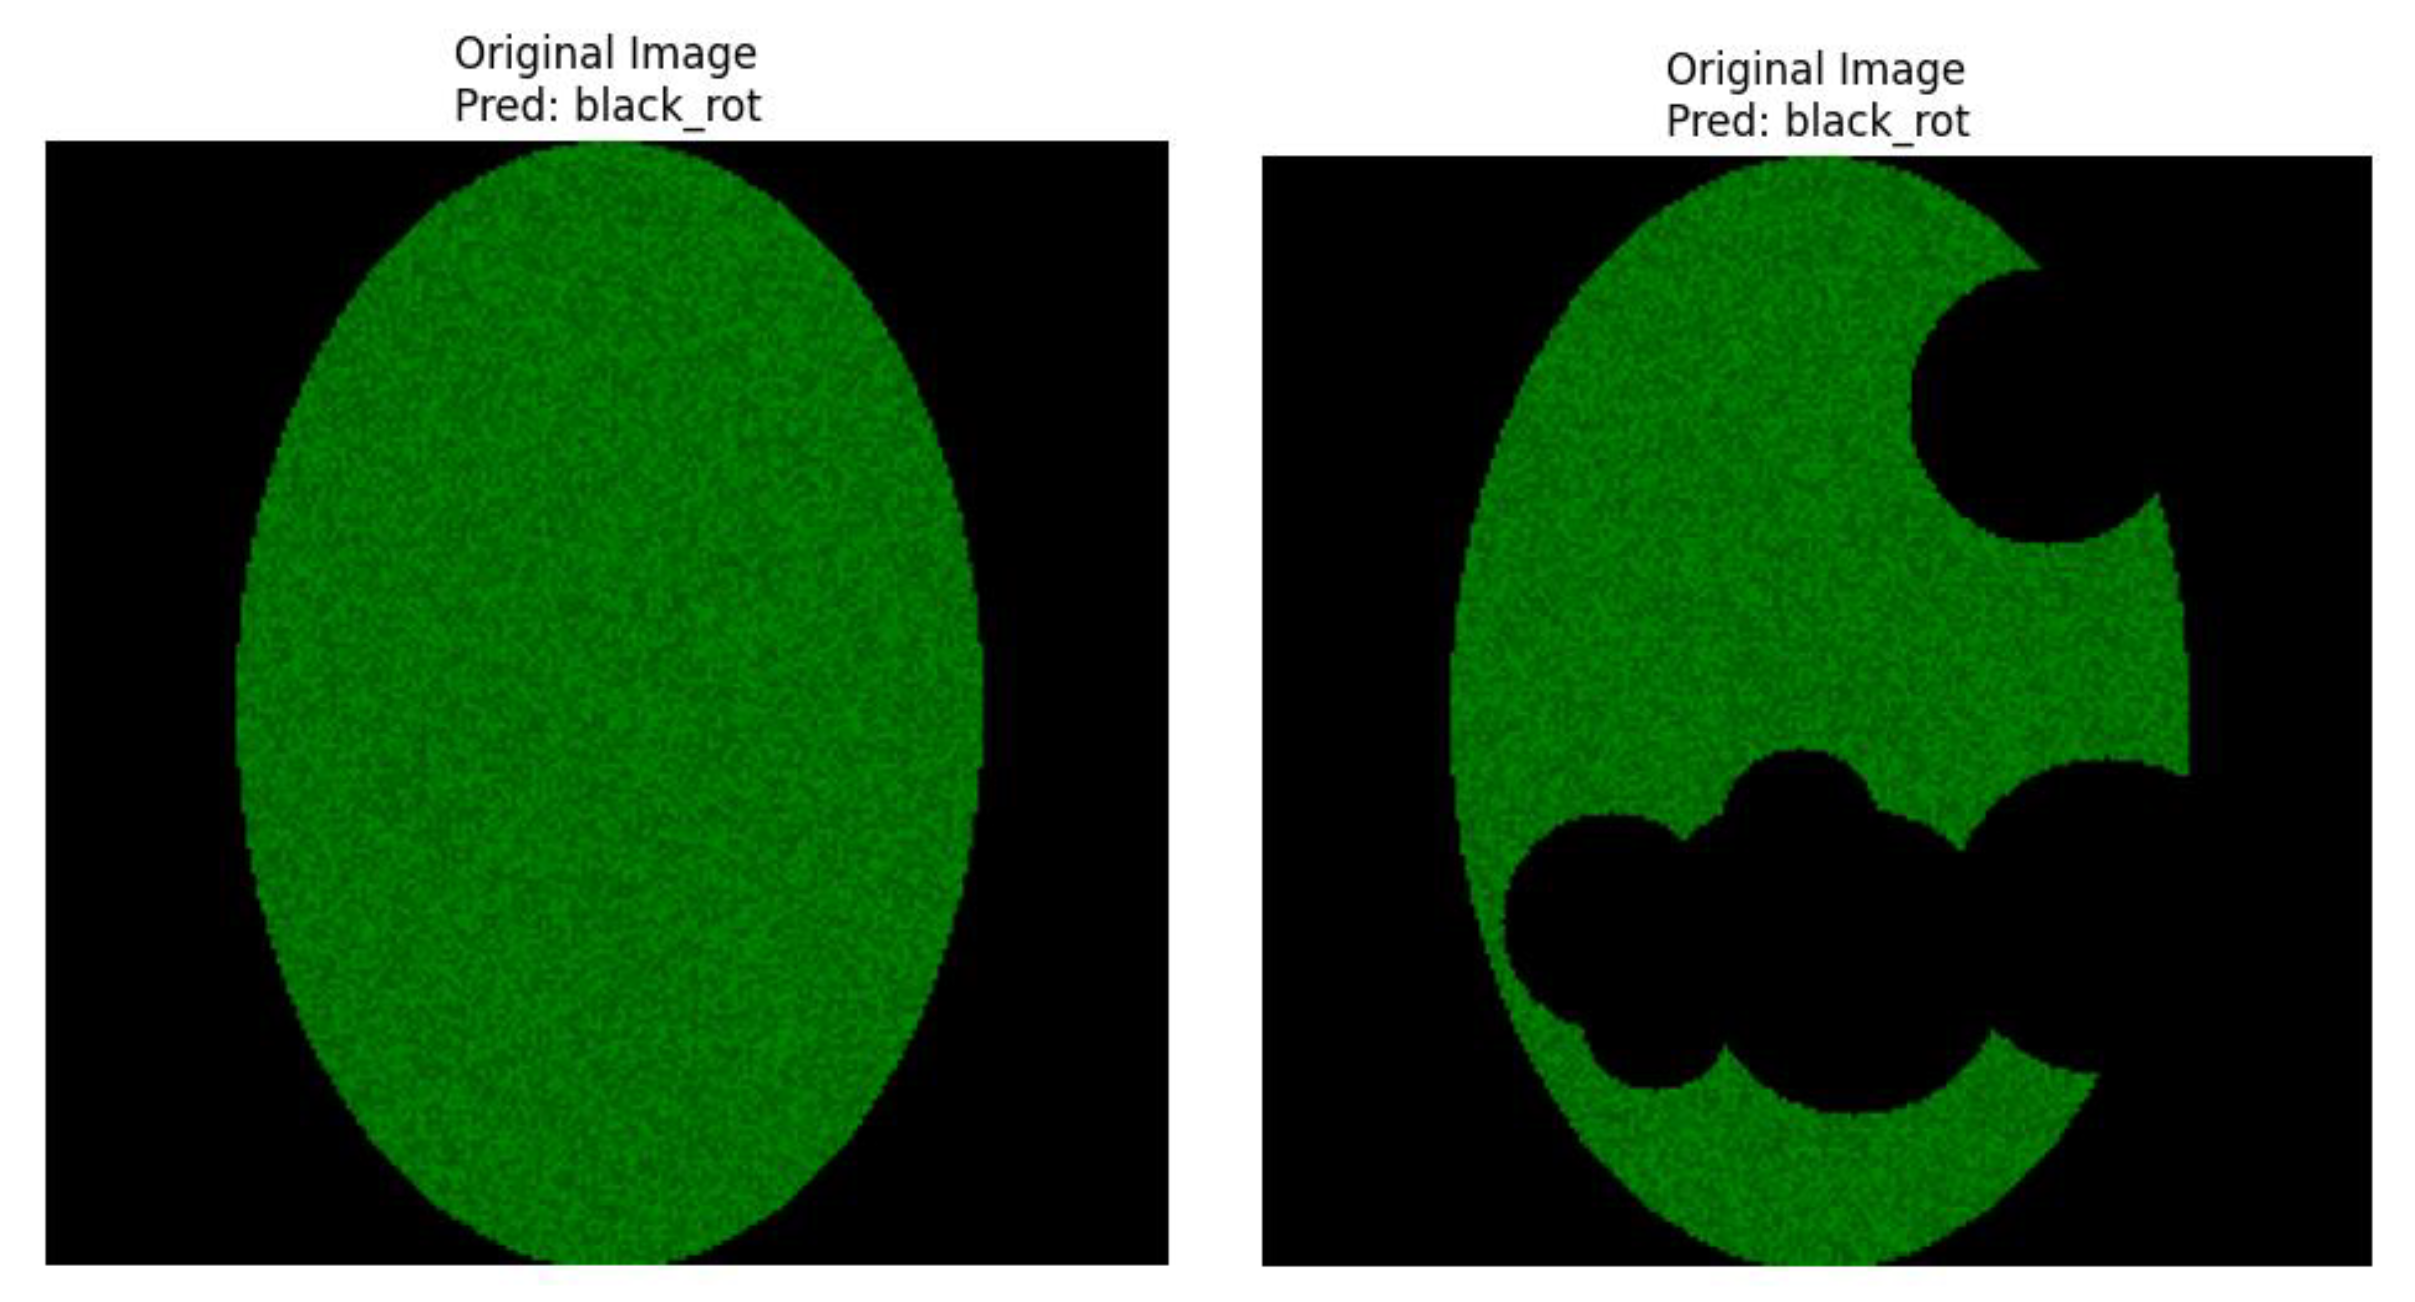
Panel A: The input apple leaf image is shown in this panel. Also, this figure shows on the top side the disease class we predict from this image by the ResNet50 classifier, along with the confidence score for that prediction. For example, considering the healthy_apple_leaf. sample the model predicted "black_rot" with 0.64 confidence. For the apple_scab_leaf. Sample model the leaf is “black_rot.” Here, among the .PNG sample, the model also guessed “black_rot,” albeit with a score of 0.66.
Figure 4.
Original Image with Prediction.
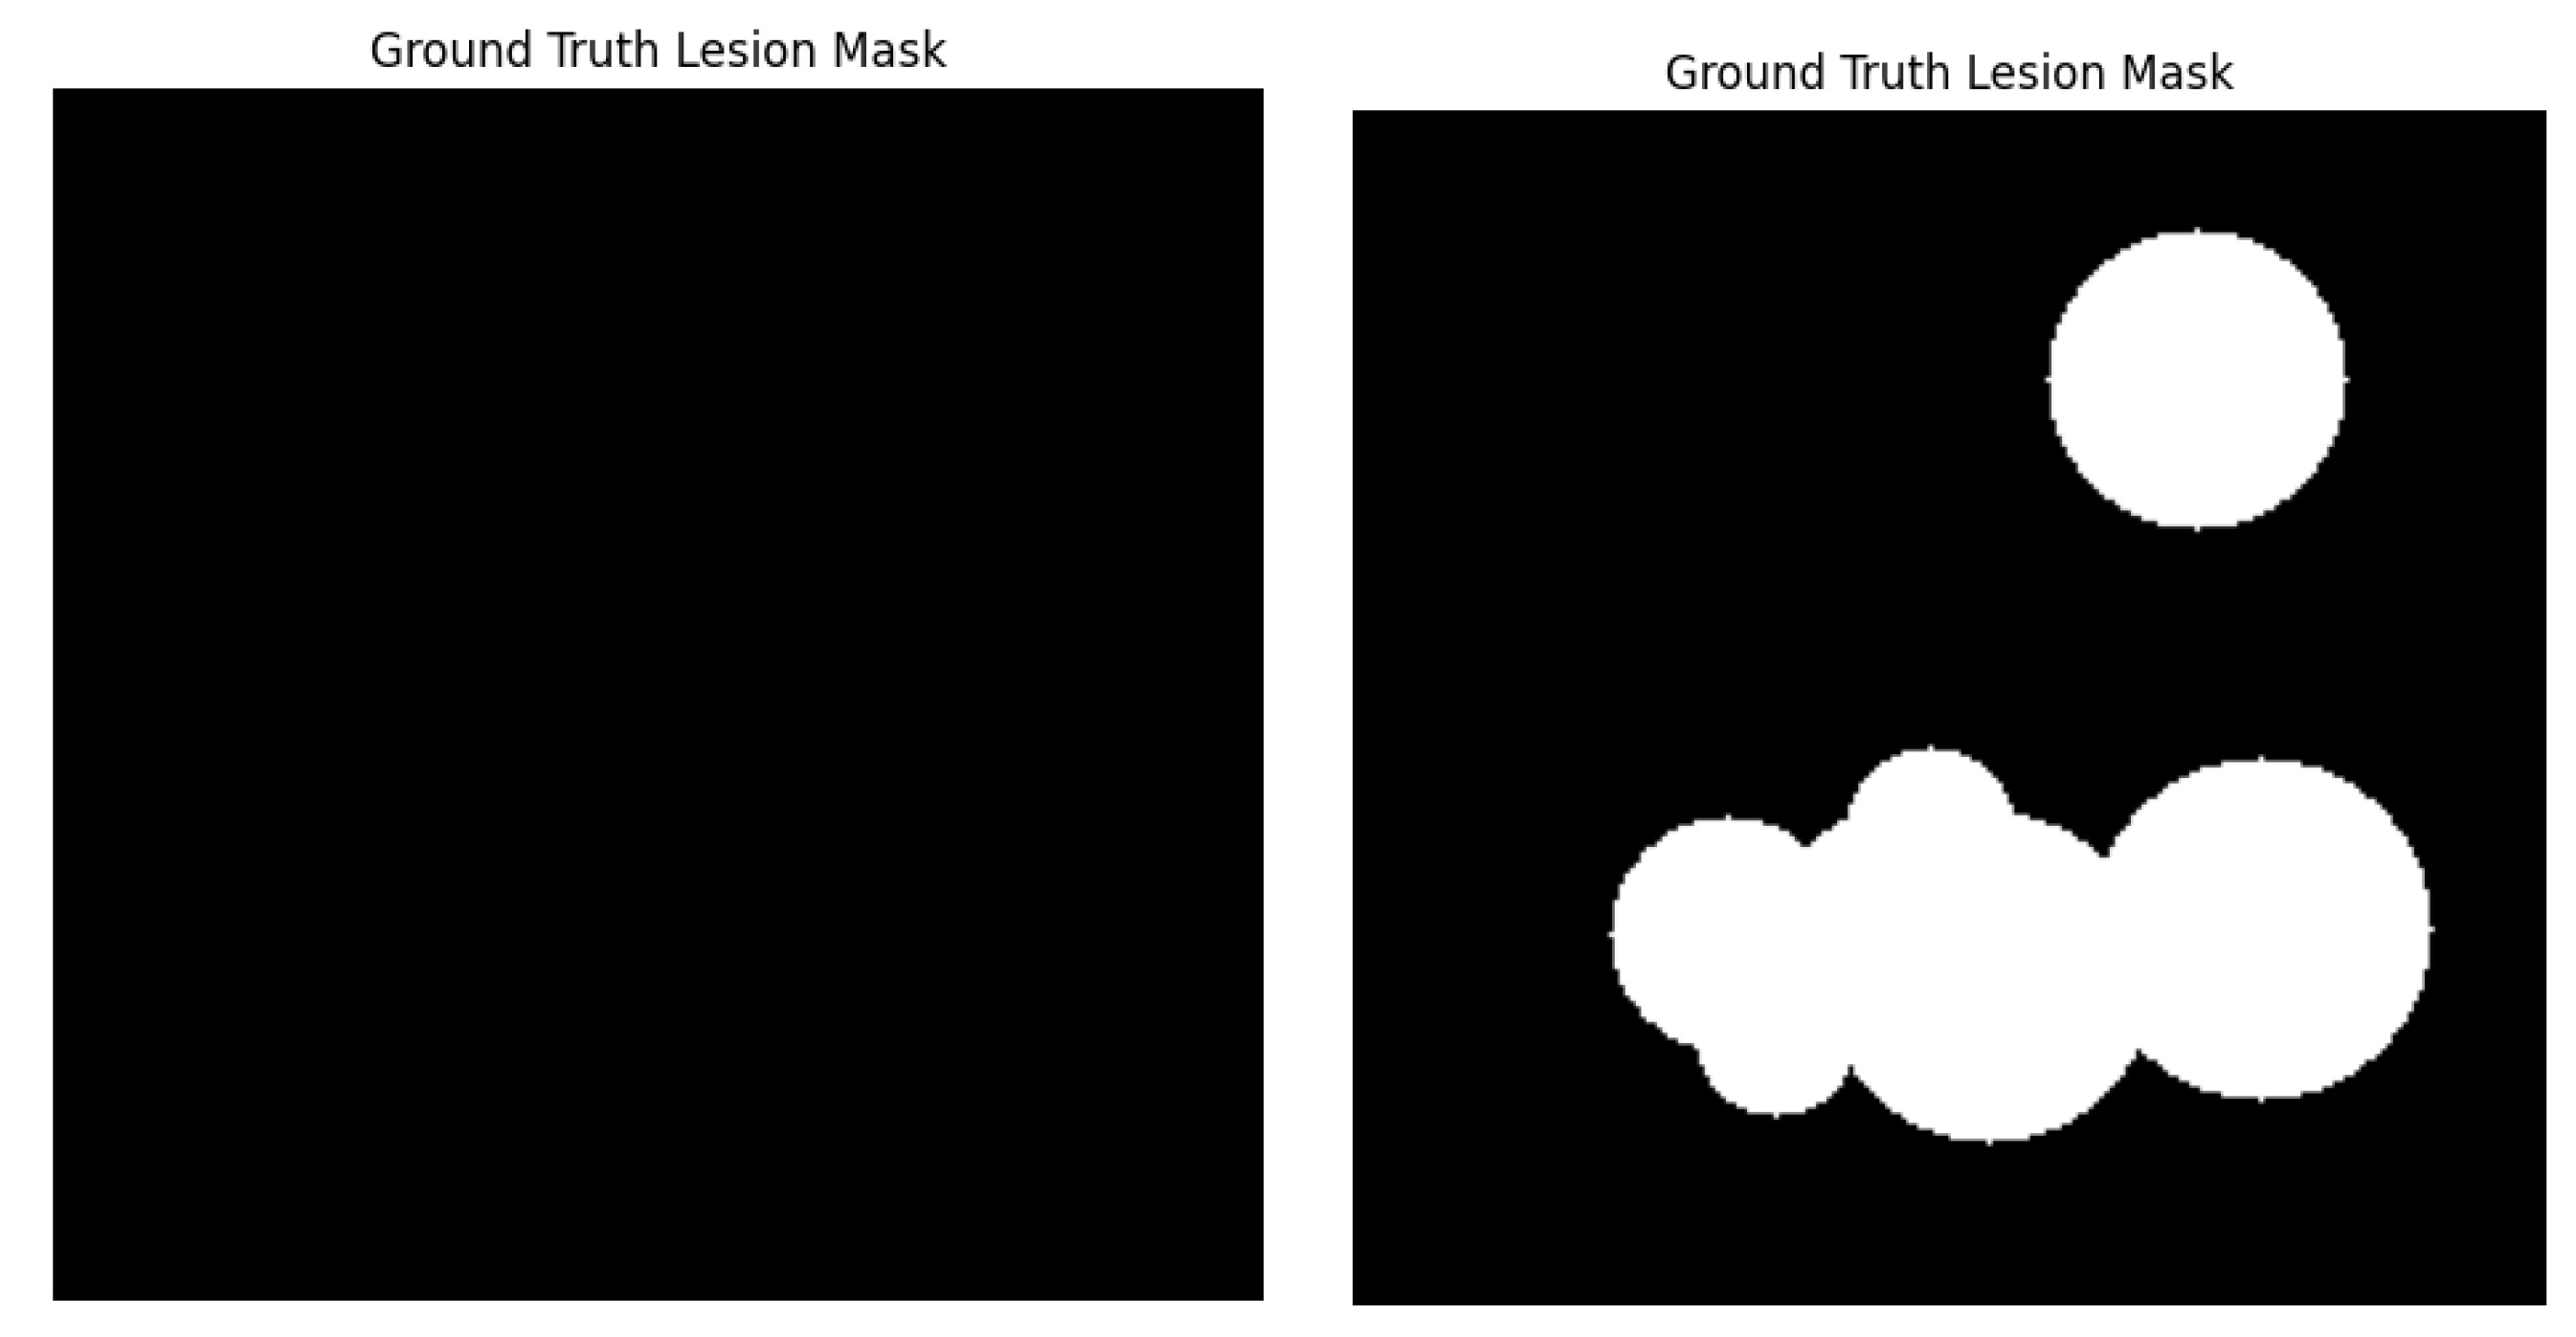
Panel B: This panel is the binarized ground-truth lesion segmentation mask of the original image. White pixels in this mask correspond to the real lesion area (the manual annotation or an already existing segmentation), while black pixels mean healthy tissue. For the healthy_apple_leaf. and this mask was completely black and indicated correctly no lesions. For apple_scab_leaf, the mask showed the presence of white areas (dark pixels), which correspond to the scab lesions.
Figure 5.
Ground Truth Lesion Mask.
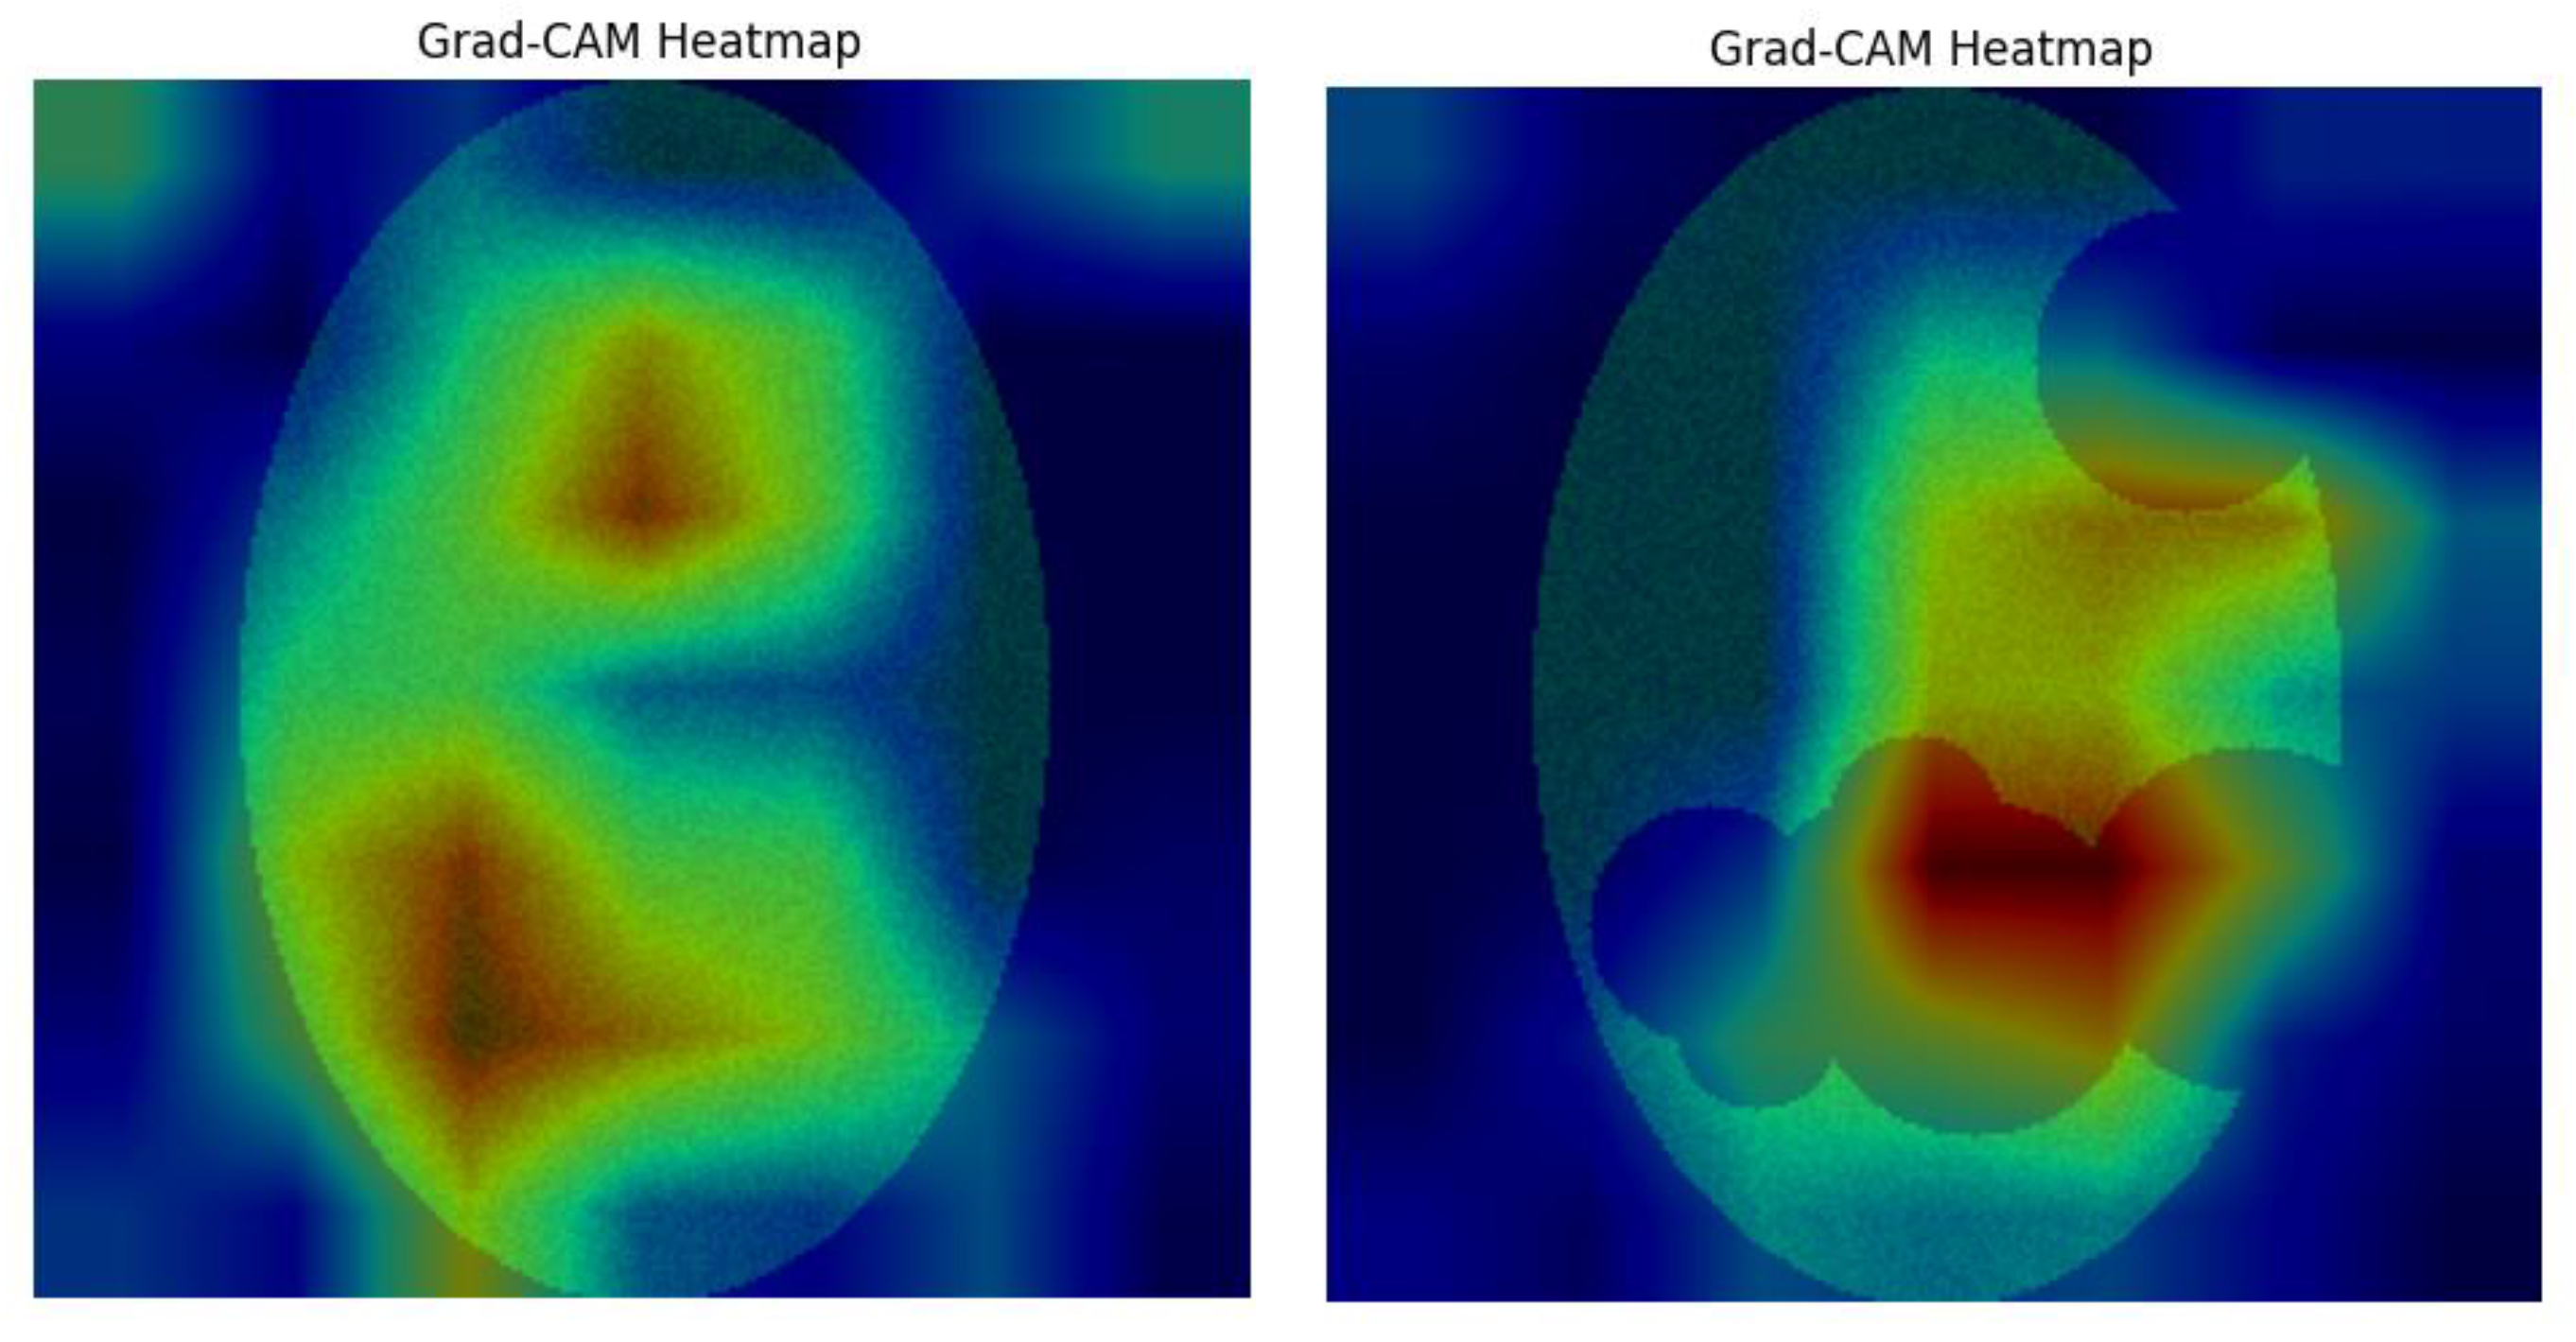
Panel C: This figure shows the Grad-CAM heatmap overlaid with transparency on the original apple leaf image, produced based on the predicted class. The heatmap uses a color spectrum (usually 'jet', where red represents higher importance, while blue represents lower importance) to visually highlight the areas in the input image that contributed the most to the CNN's classification decision. This is visualized for the healthy leaf and scab scab-infected leaf respectively.
Figure 6.
Overlay of the Grad-CAM Heatmap on the image.
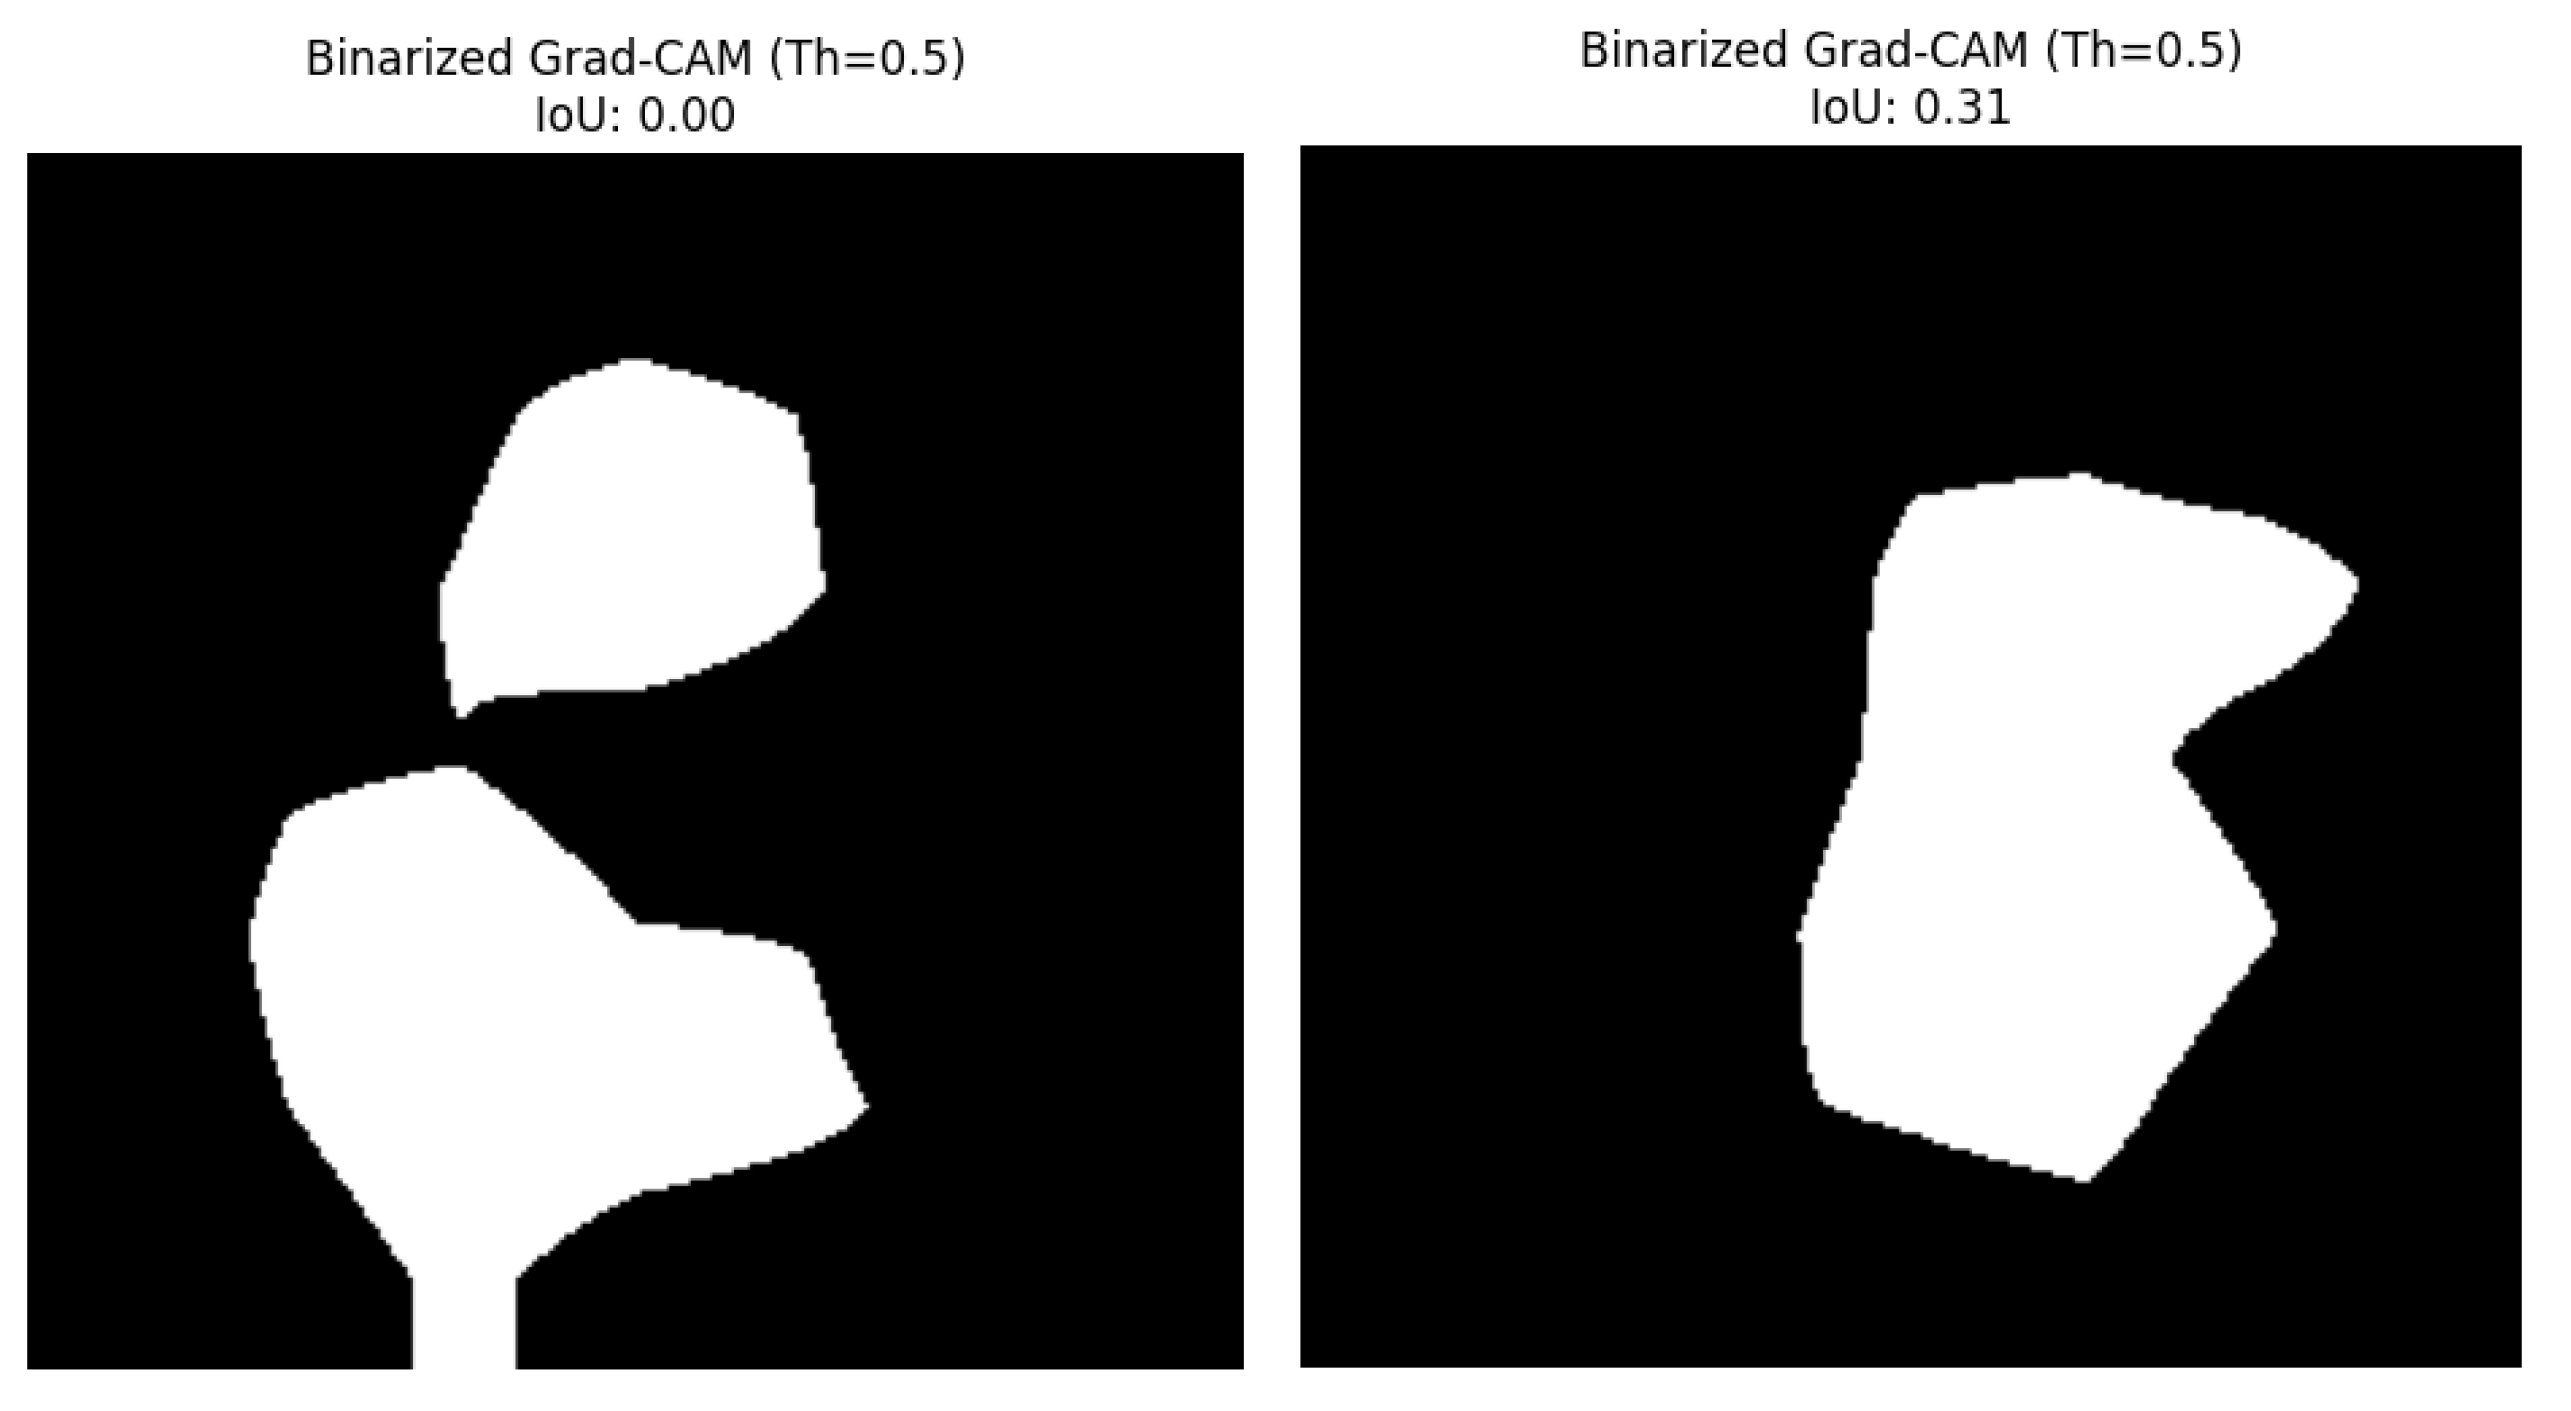
Panel D: The last panel depicts the binarized Grad-CAM mask. Said binary mask is obtained by thresholding (with a value of 0.5 in this work) the Grad-CAM heatmap to focus on the regions the CNN worthier of serving as the guidance to the CNN final prediction. Importantly, this panel is also labeled with the computed IoU score, which is a metric that quantitatively indicates how much this binarized GradCAM mask overlaps with the ground-truth lesion mask (Panel B). This is shown for the healthy leaf in and for the scab-infected leaf in
Figure 7.
Binarized Grad-CAM Mask and IoU Score.
Quantitative Results:
The primary quantitative outputs of this study are the IoU scores and the detailed classification predictions for each image.
-
Intersection over Union (IoU) Scores: IoU score can give us a direct numerical indication of the correspondence between the CNN’s attention (i.e., the binarized Grad-CAM mask) and the real lesion areas (i.e., the ground truth segmentation mask).
- ▪
- For the healthy_apple_leaf. png sample referred in Figure 1, the IoU score resulted in 0.0000. This prediction is anticipated when the ground-truth mask shows no lesions, because any region highlighted by Grad-CAM would not intersect with non-existent lesions.
- ▪
- For the apple_scab_leaf. png, explained in Figure 2, and that exhibited sharp scab lesions, the IoU score was 0.3079. This score implies a light degree of agreement between the CNN-focused regions and the true scab lesion on a leaf.
-
Classification Predictions and Confidence Scores: The ResNet50 model, not fine-tuned, produced the following top predictions for sample images:
- ▪
-
For healthy_apple_leaf:black_rot (0.64)scab (0.25)rust (0.09)
- ▪
-
For apple_scab_leaf:black_rot (0.66)scab (0.22)rust (0.09)
It is worth mentioning that, the accuracy of the classification itself (like predicting "black_rot" for a healthy leaf) is not crucial in the scope of the current work, as the main aim is to verify if the attention of a model is correct or not despite the absolute classification correctness values (with no fine-tuning) on small datasets. This is where the IoU metric comes in, and it evaluates where the model is looking.
6. Discussion
The findings of this study, in particular the visualizations (Figure 1 and Figure 2) and the resulting Intersection over Union (IoU) scores, shed light on where the Convolutional Neural Network (CNN) pays attention to when classifying apple leaf diseases. This section explains these results, their implications, limitations of the present demonstration, and directions for future research.
Interpretation of Results:
The main objective of this method was to investigate whether the CNN focuses attention on the relevant pathogenic characteristics during classification. Qualitative attention of this focus is demonstrated by the Grad-CAM visualizations, while the quantitative alignment between the CNN’s high-attention regions and the ground-truth lesion areas is expressed by the IoU score.
For the healthy apple leaf. image sample (Figure 1), the IoU score of 0.0000 is clear. If the Grad-CAM rendered any area of the input image as a hot spot, it would, by construction, not overlap with any actual lesion according to the ground truth mask, leading to the zero IoU. The images would illustrate where the model had its attention, which, in the absence of disease, could be the general texture of leaves or their edges. This situation highlights the value of using accurate ground truth masks, as zero IoU for a healthy leaf would be the desired result if the model, like ours, also detected no focused suspicious regions indicative of a lesion.
For the apple_scab_leaf. sample (Figure 2), who had scab lesions in the image, IoU score of 0.3079 indicates a moderate alignment. The Grad-CAM heatmap and the corresponding binarized mask showed that the CNN's attention area slightly matched with the actual lesion areas. This indicates that the model was somewhat "looking" at the right pathological features when it made the prediction (even if the top class predicted was in fact "black_rot" as the model was not fine-tuned). An IoU score in this range indicates that some of the attention of the model is related to the disease, but some can also be found in larger areas of the lesion that the model did not focus on as much (or in areas outside the lesion that it did focus).
Significance of High IoU:
The IoU measure is at the core of this validation protocol. A robust high IoU over many diseased samples would be of high importance. It would give us quantitative confidence that the CNN is effectively attending to the real lesion areas during classification. This alignment is critical for trust and confidence in the model’s predictions. If the high classification accuracy translates to high IoU performance, it would mean that the model’s decisions are based on interpretable visual features corresponding to that disease, rather than being driven by spurious correlations or by the unsupervised features of the background in the images. This offers potentially higher trust to the model, and as a consequence, makes the model more robust, reliable, and ultimately more useful for real-world applications in agricultural disease management, when explanation is as important as the prediction.
Limitations of the study/methodology
- Pre-trained Untuned Model: In this section, the ResNet50 model was employed, which is trained on ImageNet and not fine-tuned on a specific overall apple disease dataset. This directly affects its classification accuracy (such as the "black_rot" prediction for both healthy and scab-infected leaves). Although the point of focus validation was a proof-of-concept tutorial, with a fine-tuned model, the classification might be more accurate and, thus, Grad-CAM heatmaps may be plotted differently (and ideally, in more detail).
- Small Sample Size in Demonstration: The Sample size of related examples used in this study is small the results and interpretations are drawn with only two examples. A thorough validation of the methodology with a focus on any particular model would necessitate the processing of such a large and diverse dataset of apple leaf images at various stages of the diseases under different imaging conditions.
- Simulated Disease Classes: In the provided code, the get_classification_model generates a few apple disease classes just for demonstration. A practical application would need to be trained on a larger and more accurately labeled set of similar diseases.
- Grad-CAM Resolution: Grad-CAM results in a crude localization map. Although informative, it may not consistently provide an accurate exact definition of local lesions, which can impact the accuracy of the IoU score. The threshold for binarizing the heatmap can also have an impact on the mask and IoU.
- Limitation from Segmentation Mask Quality: The accuracy of the IoU validation is sensitive to the quality and accuracy of the segmentation masks of the ground truth lesion. Errors in these masks will cause errors in the IoU scores.
Future Work and Improvements:
Based on this approach, further research and extensions are possible:
- Follow-up with Fine-Tuned Models: An important future work would be to actually use this validation approach with CNN models that were fine-tuned on big, high-quality apple disease datasets. This would enable a more accurate evaluation of focus in models that have already learned good classifications.
- Comparison of XAI Methods: Apart from Grad-CAM, other XAI techniques (e.g., LIME, SHAP, Attention Maps for transformer models) would be applicable to extract the focus of the model. A comparison of the IoU figures of merit achieved by different XAI methods for the same model and dataset would also provide a better understanding of which XAI methods are most aligned with the ground-truth lesions.
- Studying IoU Across the Disease Stages and Types: By investigating variations of IoU scores across the stages and types of apple diseases, it could be understood whether the focus of the model is accurate for specific conditions.
- Relationship of IoU with Model Confidence and Accuracy: Studying the relationship between IoU scores, the prediction confidence of the model and its classification performance can contribute to an investigation of whether better focus-alignment results in more confident and correct predictions.
- Infusing IoU in Model Training: Future work can explore ways to inculcate a focus-alignment metric (e.g., IoU, or a differentiable surrogate) in model optimization through the model loss term. This may serve as guidance that the model can learn more directly from the visible symptoms of the disease to enhance interpretability and performance.
- Heatmap Binarization Refinement: Exploring adaptive or more advanced binarization methods to binarize the Grad-CAM heatmaps might produce more accurate representations of the CNN focus area and hence more robust IoU scores.
- Extension to Other Crops and Diseases: The process can be extended to validate CNN attentions in the disease classification task on other crops.
In summary, the integration of Grad-CAM and IoU provides a prospective method for the quantitative verification of the focus of CNNs in the classification of plant diseases. Although this experiment has limitations, it is paving the way for further work that can improve the robustness and trust in agricultural AI tools.
7. Conclusion
A methodological framework to validate Convolutional Neural Network (CNN) attention on its focus is the primary contribution of this paper in the case of apple disease classification. The novelty of our work is in the joint use of CNNs for classification, XAI (namely Grad-CAM) for visualization of model attention, and ground-truth lesion segmentation masks for an objective basis to this validation. By quantitatively measuring the IoU between these binarized Grad-CAM heatmaps and the segmentation masks, we can interpret more than accuracy, where the attention is at when making predictions.
There are two advantages to this approach. First, it provides quantifiable validation, via the IoU score, of how closely the discriminative regions from the CNN correspond with the actual (human-verified) lesion regions. High IoU scores are strong signs that the model is making decision based on meaningful pathological content. Secondly, the method provides visual validation via the Grad-CAM heatmaps and takes researchers and practitioners to qualitatively verify focus of model. Taken all together, these quantitative & visual evidences provide much improved confidence and understanding of the disease classification models. This improved explain-ability is especially important for establishing trust in AI systems, particularly in safety-critical domains like agriculture where diagnostic accuracy carries direct economic and ecological consequence.
The significance and generalization of this approach are not only shown specifically for apple diseases. The ideas of employing XAI to interpret model predictions and quantitatively testing the interpretation against ground truth data are general to many image-based classification challenges, in both agriculture and other domains. By making sure deep learning models are not only accurate but also interpretable and focused on relevant features, we can encourage the creation of more resilient, trustworthy, and effective AI-powered solutions. While extending that work by using it in conjunction with different downstream tasks trained on larger datasets as well as studying its integration into the training paradigms, could further enhance the credibility of AI in practice.
References
- E.A. Devi, S. Gopi, U. Padmavathi, S. R. Arumugam, S. P. Premnath and D. Muralitharan, "Plant Disease Classification using CNN-LSTM Techniques," 2023 5th International Conference on Smart Systems and Inventive Technology (ICSSIT), Tirunelveli, India, 2023, pp. 1225-1229. [CrossRef]
- Raj Kumar, Singh, A.P. & Chug, A. Adaptive Disease Detection Algorithm Using Hybrid CNN Model for Plant Leaves. Opt. Mem. Neural Networks 33, 355–372 (2024). [CrossRef]
- Sajeeb Kumar Ray, Md. Anwar Hossain, Naima Islam, Mirza A.F.M. Rashidul Hasan,Enhanced plant health monitoring with dual head CNN for leaf classification and disease identification, Journal of Agriculture and Food Research,Volume 21,2025,101930,ISSN 2666-1543. [CrossRef]
- Jianping Yao, Son N. Tran, Saurabh Garg, and Samantha Sawyer. 2024. Deep Learning for Plant Identification and Disease Classification from Leaf Images: Multi-prediction Approaches. ACM Comput. Surv. 56, 6, Article 153 (June 2024), 37 pages. [CrossRef]
- N.Agrawal, S. S. Bhadoriya and R. K. Nagar, "Comprehensive Review of Deep Learning Models for Plant Disease Detection with a Focus on Apple Leaf Pathologies," 2024 First International Conference on Data, Computation and Communication (ICDCC), Sehore, India, 2024, pp. 312-317. [CrossRef]
- M.D. Jose, M. Niba and J. Chunkath, "Apple Leaf Disease Prediction Using CNN," 2025 Emerging Technologies for Intelligent Systems (ETIS), Trivandrum, India, 2025, pp. 1-5. [CrossRef]
- T. A. Mir, S. Gupta, S. Malhotra, S. Devliyal, D. Banerjee and K. R. Chythanya, "Hybrid CNN-SVM System for Multiclass Detection of Apple Leaf Diseases," 2024 IEEE International Conference on Information Technology, Electronics and Intelligent Communication Systems (ICITEICS), Bangalore, India, 2024, pp. 1-6. [CrossRef]
- M.Nigar, H. Muhammad Faisal, M. Umer, O. Oki and J. Manappattukunnel Lukose, "Improving Plant Disease Classification With Deep-Learning-Based Prediction Model Using Explainable Artificial Intelligence," in IEEE Access, vol. 12, pp. 100005-100014, 2024. [CrossRef]
- A. Jain, K. Harshita, A. Karar and D. D. S, "Plant Leaf Disease Classification and Identification Using Deep Convolution Neural Network," 2025 International Conference on Computational, Communication and Information Technology (ICCCIT), Indore, India, 2025, pp. 312-317. [CrossRef]
- T.R. Noviandy, A. Maulana, F. Khowarizmi and K. Muchtar, "Effect of CLAHE-based Enhancement on Bean Leaf Disease Classification through Explainable AI," 2023 IEEE 12th Global Conference on Consumer Electronics (GCCE), Nara, Japan, 2023, pp. 515-516. [CrossRef]
- S.Kiriella, S. Fernando, S. Sumathipala and E. Udayakumara, "Explainable AI techniques for Deep Convolutional Neural Network based plant disease identification," 2023 8th International Conference on Information Technology Research (ICITR), Colombo, Sri Lanka, 2023, pp. 1-6. [CrossRef]
- Sneha, H. K. Ruchitha, A. Kodipalli and T. Rao, "Wheat disease recognition: A Multi-Model Analysis with Customized CNN and Transfer Learning enhanced by Explainable AI techniques with LIME and Grad-CAM," 2024 4th International Conference on Intelligent Technologies (CONIT), Bangalore, India, 2024, pp. 1-8. [CrossRef]
- H.I. Peyal et al., "A Lightweight CNN-SVM Explainable AI Approach for Classification and Visualization of Grape Leaf Disease," 2024 3rd International Conference on Advancement in Electrical and Electronic Engineering (ICAEEE), Gazipur, Bangladesh, 2024, pp. 1-5. [CrossRef]
- R.Srivats, A. Sharma, K. V and S. Saravanan, "Explainable AI with SHAP and Grad-CAM: A Novel Approach to Visualizing Cassava Leaf Health using CIVE, ECI Indices, and an Advanced UNet Framework," 2025 International Conference on Innovation in Computing and Engineering (ICE), Greater Noida, India, 2025, pp. 1-6. [CrossRef]
- R.Otiya, P. Faldu and P. Goel, "Cotton Leaf Disease Classification using Deep Convolution Neural Network with Explainable AI," 2023 International Conference on Sustainable Communication Networks and Application (ICSCNA), Theni, India, 2023, pp. 1417-1424. [CrossRef]
- D.F. Rose Anandhi and S. Sathiamoorthy, "Deep Learning based Automated Rice Plant Disease Recognition and Classification Model," 2023 First International Conference on Advances in Electrical, Electronics and Computational Intelligence (ICAEECI), Tiruchengode, India, 2023, pp. 1-6. [CrossRef]
- R.E. Shrestha, A. R. Aurnob, S. A. Tanim, M. Islam and K. Nur, "Revolutionizing Cucumber Agriculture: AI for Precision Classification of Leaf Diseases," 2024 6th International Conference on Electrical Engineering and Information & Communication Technology (ICEEICT), Dhaka, Bangladesh, 2024, pp. 776-781. [CrossRef]
- S.Santhi, M. Murugan, N. V, V. S and K. D, "Cocoscan: AI-Powered Precision Diagnostics for Coconut Leaf Disease," 2025 4th International Conference on Sentiment Analysis and Deep Learning (ICSADL), Bhimdatta, Nepal, 2025, pp. 1756-1762. [CrossRef]
- C. Arvind et al., "Deep Learning Based Plant Disease Classification With Explainable AI and Mitigation Recommendation," 2021 IEEE Symposium Series on Computational Intelligence (SSCI), Orlando, FL, USA, 2021, pp. 01-08. [CrossRef]
- G.H S, I. Priya, K. B. Sree and A. Kushwaha, "Enhancing Crop Health Monitoring: A ResNet50 Approach to Automated Plant Disease Severity Prediction," 2025 IEEE International Students' Conference on Electrical, Electronics and Computer Science (SCEECS), Bhopal, India, 2025, pp. 1-5. [CrossRef]
Disclaimer/Publisher’s Note: The statements, opinions and data contained in all publications are solely those of the individual author(s) and contributor(s) and not of MDPI and/or the editor(s). MDPI and/or the editor(s) disclaim responsibility for any injury to people or property resulting from any ideas, methods, instructions or products referred to in the content. |
© 2025 by the authors. Licensee MDPI, Basel, Switzerland. This article is an open access article distributed under the terms and conditions of the Creative Commons Attribution (CC BY) license (http://creativecommons.org/licenses/by/4.0/).
Copyright: This open access article is published under a Creative Commons CC BY 4.0 license, which permit the free download, distribution, and reuse, provided that the author and preprint are cited in any reuse.


