Submitted:
27 May 2025
Posted:
28 May 2025
You are already at the latest version
Abstract
We present empirical evidence on the sensitivity of housing demand in Chile to changes in mortgage interest rates, focusing on units priced between 2,000 and 4,000 UF (approximately USD 80,000 to 160,000). This segment, which comprises nearly two-thirds of the country’s housing supply, has experienced a significant decline in sales since 2021. Given its size and responsiveness, it represents a key target for policy measures aimed at reactivating the Chilean real estate market such as demand-side subsidies for middle-income households. Using impulse response functions derived from vector autoregressive (VAR) and semi-structural models estimated via Bayesian methods with Markov Chain Monte Carlo (MCMC) simulations, we find that a 100 basis-point increase in mortgage rates leads to an average annual 18% drop in housing sales during the first quarter after the shock. This effect intensified over time, resulting in a cumulative decline of approximately 57% by the end of the year. A comparable reduction in mortgage rate yields a symmetrical response. Finally, we offer a linear extrapolation of potential impacts under a hypothetical 200 basis point decrease in mortgage rates.
Keywords:
housing demand
; mortgage rates
; monetary policy
; interest rate elasticity
1. Introduction
The real estate sector plays a vital role in the economy because of its ability to create jobs, attract investment, and foster urban development. The housing market acts as a key indicator of the economic cycle through activities such as construction, transactions, and related services, including the supply of inputs, transportation, and financial services [1]. It mirrors investor and consumer confidence, and has a significant impact on economic growth and financial stability. In Chile, data from the National Accounts of the Central Bank show that Construction and Housing and Real Estate Services contributed 6% and 8% of the Gross Domestic Product and 4% and 15% of the Gross Fixed Capital Formation over the past decade, respectively. Additionally, mortgage credit currently accounts for 34% of the banking sector’s loans and 41% of GDP [2].
Since 2021, the real estate industry has faced a complex situation marked by a sharp decline in housing sales, slowdown in new construction, and challenges in securing financing. This has led to a significant accumulation of completed, but unsold housing stock, affecting the liquidity and solvency of companies [3]. A key factor contributing to the drop in sales is the difficulty of obtaining mortgage financing, largely because of rising interest rates. Consequently, measures to revitalize the industry should focus on easing access to credit. In this regard, subsidizing mortgage rates or payments could significantly boost housing demand, particularly among middle-income segments of the population.
This study assesses the sensitivity of demand for intermediate housing values (ranging from 2,000 to 4,000 UF) to fluctuations in the mortgage credit rate. This analysis assumes that two-thirds of the housing supply is concentrated within this range, making it the most accessible for middle-income households. The academic literature robustly demonstrates that, in response to an expansionary monetary policy (characterized by a reduction in interest rates), the housing market typically exhibits an increase in demand [4,5,6] and prices [7,8,9].
This study makes a novel contribution to the analysis of the Chilean real estate market for three primary reasons. First, although there may be partial precedents, no existing studies have been identified that directly examined the relationship between mortgage rates and housing sales, particularly in the middle-income segment. This segment constitutes a substantial portion of the market, and has been the focus of several recent housing policies. Second, the analysis is situated within a highly pertinent context: the mortgage rate subsidy policy for middle-income housing has recently been approved for short-term implementation. This endows the study with an applied and timely approach as it evaluates the potential macroeconomic effects of a specific fiscal measure ex ante. Finally, the study employs three complementary estimation strategies—VAR, SVAR, and a semi-structural model—which not only enhance the robustness of the results but also incorporate rational expectations to capture the effects of anticipated measures, an aspect seldom addressed in studies applied to the Chilean real estate market.
Our results align with international evidence on the interest rate elasticity of housing demand: a 100 basis point rate shock results in an 18% contraction in home sales during the first quarter, culminating in a 57% decline by the fourth quarter. These figures are consistent with those reported by [5] and [10], who observed declines ranging from 25% to 50% and 6% to 15%, respectively. Generally, the academic literature corroborates the negative elasticity of housing demand in response to interest rates, with values ranging between 1.5 and 3.4 [11,12,13].
2. Materials and Methods
Monetary policy influences the housing market through adjustments in interest rates and credit availability. A reduction in interest rates, as dictated by monetary policy, results in more affordable mortgages. Consequently, increased affordability stimulates the demand for housing, potentially driving real estate prices. Conversely, an increase in interest rates renders borrowing more costly, which can lead to a decrease in housing demand and may result in the stabilization or reduction of property prices.
Substantial evidence indicates that monetary policy significantly influences the real estate industry. It is widely acknowledged that monetary policy operates through the credit channel. Consequently, fluctuations in interest rates lead to changes in credit availability, which in turn affect demand in the housing market, subsequently affecting consumption and investment [14]. Other components of the real estate industry are similarly affected by monetary policy. For instance, when monetary policy becomes more restrictive, there is a decline in residential investment, starts, and building permits [15,16]. A prominent example is the 2008 financial crisis, during which there was a substantial increase in sales and elevated real estate prices due to the ease of obtaining mortgage credit at very low rates [17].
Beyond interest rates, monetary policy encompasses additional instruments to stimulate or moderate sectoral activities. The financial sector presents several barriers that can restrict access to mortgage credit, thereby reducing home purchases and complicating home ownership, particularly for low-income households [18]. These barriers include loan-to-value and debt-to-income ratios as well as credit scores. Indeed, some studies suggest that these barriers often hold greater significance than interest rates in explaining the dynamics of mortgage credit and the real estate sector [13].
2.1. Interest Rates and Housing Prices
Academic literature examining the relationship between monetary policy, specifically interest rates, and housing prices has been extensive, particularly since the 2000s. This period was marked by a surge in real estate sales and escalating prices, culminating in a significant speculative bubble and a subsequent global financial crisis. At the macroeconomic level, numerous studies have employed a panel of countries to estimate the potential causal relationship between monetary policy and housing prices. One group of studies investigated the relationship between interest rates and housing prices and identified a negative elasticity. These studies confirm that a reduction in mortgage interest rates stimulates housing prices [7,19,20]. Nevertheless, real estate values are not solely determined by interest rates. Other studies have demonstrated the significant impact of additional financial conditions on housing prices. Specifically, the relaxation of credit standards and flexibility in loan-to-value and debt-to-income ratios are crucial for explaining the housing bubble of the 2000s [8,9,20].
At the national level in the United States, there is consensus regarding the inverse relationship between interest rates and housing prices. In certain instances, elasticities of a higher magnitude than those observed in other countries are identified, with effects that may persist for up to four years [5]. It is estimated that, on average, 30% of the dynamics in housing prices can be attributed to monetary policy, whereas during boom periods, up to 69% of the price variation is driven by monetary shocks [21]. Conversely, an inelastic supply results in the transmission of monetary shocks to prices, because it is not feasible to increase housing production at the same rate as demand in the short term [22]. This inelastic supply behavior helps elucidate the significant regional disparities observed in the United States in the response of housing prices to changes in monetary policy [23]. Additionally, the local regulatory framework contributes to explaining regional differences [24].
In various countries, a notable inverse correlation between monetary policy and housing price has been observed. In Australia, [25] affirmed that housing prices respond to increases in mortgage rates, but this effect diminishes rapidly. Furthermore, the extent of this effect was significantly influenced by local conditions. Within the European Union, research by [26] and [27] indicates that monetary policy exerts considerable effects on real estate prices, which are heavily contingent on the local economic environment. Specifically for Spain, [28] identified a substantial impact of the European Central Bank’s monetary and macroprudential policies on the trajectory of housing prices, with provincial particularities playing a crucial role in explaining observed disparities. Recent studies in Chile corroborate international findings, confirming a significant and negative relationship between interest rates and housing prices. Both [29] and [30] demonstrate the significant impact of mortgage rates on the long-term dynamics of real estate prices.
2.2. Interest Rates and Housing Demand
In addition to the influence of interest rates on price dynamics, monetary policy directly impacts housing demand. It is widely acknowledged that the interest rate, whether the benchmark or mortgage lending rate, serves as a reliable predictor of residential demand, although its predictive power diminishes during periods of volatility [4]. In more specific instances, utilizing high-frequency data, an inverse relationship between rates and demand can be established, with a significant effect peaking 15 weeks after a shock [6]. Furthermore, monetary policy affects not only real estate sales but also other sectoral indicators, such as construction activities and building permits, which are equally sensitive to fluctuations in financial conditions [5].
Numerous studies substantiate the inverse relationship between interest rates and residential demand in specific locations. In the United States, [31] demonstrate that at the aggregate level, a monetary shock resulting in increased rates leads to a decline in sectoral activities, such as construction, permits, and sales. Furthermore, [32], focusing on San Diego, observed that rising rates correlated with reduced levels of sales and building permits. Similarly, in other countries, the findings corroborate the impact of monetary policy on housing sales, indicating negative elasticity of residential demand to interest rates. This phenomenon is evident in Italy [33], France [34], and Mexico [35].
2.3. Mortgage Credit Subsidy Programmes
One specific area of study within the relationship between mortgage rates and housing demand is the impact of credit subsidy programmes. These programmes, which are government initiatives or public policies, aim to facilitate access to home ownership through mechanisms, such as interest rate subsidies, home purchase subsidies, or tax benefits. By providing more affordable mortgage financing, these programmes are intended to enhance the ability of individuals, particularly those in the most vulnerable or lower-income segments of the population, to purchase housing.
The international evidence on the impact of these public policies varies. Nonetheless, it is feasible to identify relatively consistent outcomes, such as increased home sales, enhanced homeownership, and capitalization of subsidies in property prices. In the United States, [11] and [36] assessed the reduction in mortgage insurance premiums through a subsidy, discovering that the resultant lower mortgage rate stimulated housing demand, particularly among more vulnerable households. Similarly, [37] examined fiscal measures, specifically mortgage interest deductions, and concluded that they can lead to undesirable outcomes, such as price increases, efficiency losses, and welfare reduction, when demand and supply are inelastic or financial conditions are restrictive.
Regarding other countries, [38] examined the fiscal implications of subsidizing stamp duty tax in Australia. Their study revealed that although the subsidy effectively stimulated demand and housing construction, it also resulted in property price inflation and a reduction in apartment size. Additionally, subsidies increase the likelihood of purchasing properties for rental purposes. Similarly, in Mexico, [39] observed a price increase in the housing segment that received subsidies compared with those that did not. This inflation is attributed to real estate developers’ market power and the information asymmetries prevalent in the industry. In the context of Colombia, [40] assess a government program that subsidized mortgage rates. They found that although the program successfully increased mortgage placements, it coincided with higher interest rates, resulting in incomplete pass-through.
Analogous studies have been conducted in Europe to assess the effect of subsidizing mortgage loans. In the United Kingdom, the Help to Buy (HtB) programme, designed to augment the availability of mortgage credit, successfully stimulated construction without exerting upward pressure on prices. However, this effect was confined to regions with elastic supply [41]. In Germany, the Bavarian region introduced a housing purchase subsidy with a fixed amount per household to encourage housing construction and acquisition. According to [42], the subsidy failed to achieve its intended objectives, as it merely capitalized on existing housing prices and had a negligible impact on construction. In Belgium, [43] examined the outcomes of the Woonbonus’ tax incentives for homebuyers. They concluded that the benefit was absorbed into the prices of existing homes, thereby advantaging households that were already homeowners and failing to stimulate new construction. In Portugal, Credito Bonificado has been implemented as a subsidy for mortgage dividends. [44] found that the likelihood of financing through mortgage credit under this program is inversely related to the interest rate. Furthermore, households facing credit access challenges (e.g., young or low-income households) are more sensitive to rate fluctuations.
2.4. Model Parameterization
The proposed model is designed to incorporate a forward-looking component associated with the interest rate, alongside a backward-looking component related to housing sales. Formally, this is expressed as follows:
where is the interest rate for housing loans, commonly referred to as mortgage rate. Additionally, reflects the anticipated future rate contingent upon the information set available in time . The variable pertains to the demand for housing within the price range of 2,000-4,000 UF. The lag represents the transaction costs inherent in the market, illustrating the persistence or inertia observed in home sales. Furthermore, and represent endogenous shocks related to the interest rate and housing demand, respectively, which enhance the model’s fit. Specifically, can be construed as a risk premium that captures the unobservable effects of sentiment in the financial market. Finally, and denote exogenous shocks to the system.
By integrating the interest rate equation into the housing sales equation and excluding the shocks, we demonstrate that housing demand is structurally influenced by inertia and expectations concerning the future trajectory of the mortgage interest rate. This approach more effectively captures the impact of a potential policy to subsidize the purchase of new homes in middle-income sectors, which may have an effect analogous to a reduction in interest rates, with the aim of revitalizing the real estate market in a context in which demand has persistently remained low.
This equation is estimated using three econometric techniques: Vector Autoregression (VAR), Structural Vector Autoregression (SVAR), and a semi-structural model. The application of these three estimation strategies facilitates comprehensive and complementary analysis. The VAR model establishes an initial empirical framework for assessing the response of housing sales to innovations in the interest rate pertinent to the housing market by modeling the variables within a fully endogenous system. Subsequently, the SVAR model enhances causal interpretation by enabling structural identification of the transmission mechanism of the cost of credit, represented by the mortgage rate, on housing demand. Finally, the semi-structural model, part of the DSGE family, incorporates rational expectations, reflecting a prospective component of agents’ behavior concerning the future trajectory of the mortgage rate. This variable has been utilized by the government as a fiscal policy instrument to temporarily stimulate the real estate market. The inclusion of the expectations component allows us to capture the effect of non-surprise measures, specifically those announced before their effective implementation.
2.5. Parameter Estimation
The estimation is derived from quarterly data on interest rates in UF for housing loans, as published by the Central Bank of Chile, and national real estate sales data provided by the Chilean Chamber of Construction, specifically focusing on the price range between 2,000 and 4,000 UF. It is important to note that the national figures do not differentiate between subsidized and unsubsidized housing; thus, the data encompass operations involving housing subsidies for middle and emerging sectors (units between 1,400 and 2,800 UF), but exclude subsidies for vulnerable sectors (less than 1,400 UF). Given that subsidies for middle-income sectors require complementary mortgage financing, their inclusion in this analysis is pertinent. Furthermore, this price segment (2,000-4,000 UF) comprises a significant portion of the housing stock that has remained stagnant, exhibiting sales considerably lower than historical patterns. Consequently, it is considered a potential target for the implementation of policies aimed at revitalizing the real estate market. The analysis period extends from the first quarter of 2015 to the second quarter of 2024, as real estate sales data for the specified price segment are available only within this timeframe.
The initial parameter values of the proposed model were derived from independent estimates using the Generalized Method of Moments (GMM). This approach offers preliminary insights into the magnitude of the parameters, thereby aiding in the formulation of prior distributions. The structural parameter estimates derived through Bayesian methods, utilizing Markov chain Monte Carlo (MCMC) simulations, are presented in Table 1.
3. Results
3.1. Chilean Real Estate Market
Figure 1 presents a quarterly retrospective analysis of the variation, measured in basis points, of the average rates of housing loans (annual rate adjustable in UF), commonly referred to as the mortgage rate, categorized by loan size. Additionally, the annual growth rate of housing demand is depicted and segmented into three price categories: between 2,000 and 3,000 UF, between 3,000 and 4,000 UF, and an aggregate range of 2,000-4,000 UF. It is noteworthy that this latter segment constitutes nearly two-thirds of the current housing supply and has exhibited a significant decline in sales in recent years. Furthermore, it is evident that the evolution of mortgage rates does not significantly differ across credit brackets, which, to some extent, indicates a transversal transfer of financial conditions across different segments of the real estate market.
Figure 1 illustrates the substantial fluctuations in mortgage rates, with periods of increasing rates corresponding to subsequent declines in housing sales and conversely, periods of significant rate reductions associated with eventual increases in sales. For instance, home sales within the 2,000-3,000 UF range exhibited annual growth rates of 51%, 114%, and 49% during the first three quarters of 2021. Similarly, housing demand in the 3,000-4,000 UF range recorded annual increases of 75%, 87%, and 155% between the fourth quarter of 2020 and the second quarter of 2021. Notably, during this period, the mortgage rate experienced a cumulative quarterly reduction of 53 basis points between the third quarter of 2020 and the first quarter of 2021, along with a cumulative decrease of 117 basis points in 2019.
In contrast, one of the most significant declines in sales during the second quarter of 2020, approximately -54% year-over-year across all three specified price segments, coincided with increases in mortgage rates of 45 and 36 basis points in the first and second quarters of that year, respectively. It is crucial to acknowledge that this period aligns with the initial impact of the COVID-19 pandemic. More than two years after the peak of the crisis, in the fourth quarter of 2023, the mortgage rate increased by 77 basis points quarter-over-quarter, whereas sales in all the aforementioned price segments experienced a decline of approximately double digits. Notably, sales in the price segment between 3,000 and 4,000 UF, which grew by approximately 25% annually during the third quarter, contracted by 14% by the end of the same year.
The annual growth rate of housing mortgage loan placements, categorized by amount brackets (in millions of UF) and published by the Financial Market Commission (CMF), is depicted alongside the annual change in home sales in Figure 2. The temporal discrepancy between these two series is attributable to the fact that sales figures are based on promises to sell, whereas placements are recorded at the time of execution. This time lag can range from a few weeks or months to over two years. According to CMF available information about mortgage allocations, there is a notable concentration of financial resources within price segments that correspond to heightened housing demand, reflecting consistent patterns of access to financing within the real estate market. Specifically, mortgage placements ranging from 1,500 to 5,000 UF represent 58% of total mortgage loans in Chile. This analysis indicates that the housing price segment under consideration is not only indicative of the relatively stagnant housing supply but also highlights the significance of the associated placements within the housing credit portfolio.
It must be acknowledged that credit tranches were selected to align as closely as possible with the housing price segments analyzed. However, since the tranches available from CMF are utilized, they may encompass a broader range of housing prices than those examined in this study. Nonetheless, this selection is more suitable than employing an aggregate series of mortgage loans published by the Central Bank.
From the previous analysis, it is evident that mortgage rates exhibit negative covariance with loan amounts, a relationship that is economically rational. In general, an increase in the interest rate renders loans more costly for borrowers, thereby discouraging borrowing and establishing an inverse relationship between loan placements and interest rates. This principle applies when the interest rate decreases. In this context, Figure 3 demonstrates the strong correlation between mortgage rates and the inverse of housing loans within the 1,500-5,000 UF segment, presenting this last variable as an index to facilitate comparative analysis. Additionally, Figure 3 highlights a notable reduction in the dispersion of mortgage rates across credit segments during the period of sustained interest rate increases (post-2021) in contrast to the greater heterogeneity observed in the years preceding the 2020 health crisis.
The behavior of the analyzed housing loan tranches is intrinsically linked to the dynamics of real estate transactions within the respective price segments. Consequently, the mortgage lending rate demonstrates a negative correlation with housing placements and sales, aligned with economic expectations. As interest rates increase, the cost of credit also increases, thereby discouraging loan applications and subsequently reducing transactions in the real estate market.
3.2. Model Fit to the Data
Figure 4 shows the fit of the semi-structural model to the observed data concerning home sales within the 2,000-4,000 UF price range. The data indicate that housing demand in this segment increased by over 60% year-over-year in the first quarter of 2021, and by more than 120% during the second quarter of the same year. In the preceding period, spanning from the third quarter of 2020 to the first quarter of 2021, the mortgage rate experienced a cumulative decline of 53 basis points. This empirical evidence implies that sales in this segment may exhibit significant sensitivity to changes in the mortgage rate, a phenomenon effectively captured by the semi-structural model. Notably, the model accounts for 98% of the observed variability in home sales.
3.3. Impulse-Response Functions
While modeling the data effectively captured the dynamic impact of interest rates on housing demand, the estimation of the impulse-response functions yielded results that were not significantly different from a parametrization excluding placements, focusing solely on housing sales and interest rates. This discrepancy may arise from the fact that tranches associated with placements, as published by the CMF, encompass a broader range of housing prices than those examined in this study. Furthermore, given the relatively short time series of real estate sales within the 2,000-4,000 UF price segment, the specification of more complex VAR (Vector Autoregressive) models was constrained, leading to the selection of a more parsimonious model for the primary analysis in this study. Appendix A includes the results that consider all three variables: mortgage rate, housing loans, and home sales.
Table 2 presents the response of housing demand during the initial period, following a reduction in the mortgage rate by 100 basis points. The most pertinent aspect of these findings is that the estimated ranges of variation in real estate sales behavior, as determined by the various models employed, align with extant empirical evidence. Specifically, these results are consistent with the growth data of housing sales within the price segment of 2,000-4,000 UF, as reported by the Chilean Chamber of Construction.
For instance, residential property sales within the 2,000-3,000 UF range exhibited annual growth rates of 51%, 114%, and 49% during the first three quarters of 2021. Similarly, the sales of homes priced between 3,000 and 4,000 UF demonstrated annual increases of 75%, 87%, and 155% from the fourth quarter of 2020 to the second quarter of 2021. During this timeframe, the mortgage rate experienced a cumulative quarterly reduction of 53 basis points between the third quarter of 2020 and the first quarter of 2021, along with a cumulative decrease of 138 basis points from the first quarter of 2016 to the same period in 2021.
In conclusion, empirical evidence indicates that this segment of real estate demand is significantly sensitive to fluctuations in the mortgage rate. Consequently, Table 2 presents a relatively conservative estimate of the annual change in sales during the first quarter in response to a 100 basis point reduction in the mortgage rate when compared to the behavior observed in the specified price segment.
Regarding the impulse-response functions depicted in Figure 5 and considering an extended analysis horizon, the semi-structural quantitative model, characterized by its forward-looking nature through the incorporation of expectations regarding the future trajectory of the mortgage rate, predicts that a standard innovation that increases the mortgage rate by 100 basis points relative to its equilibrium level, results in an immediate decline of 13% per annum in real estate sales during the period in which the shock occurs. Subsequently, this effect intensified, culminating in a cumulative decrease of approximately 53% per year by the end of the first year. The HPD credible interval, derived from Bayesian inference, encompasses the impulse-response functions obtained from alternative models such as the SVAR (Structural Vector Autoregressive Model) and conventional VAR. In contrast to the semi-structural approach, these models employ a backward-looking structure, primarily based on the historical dynamics of the mortgage rate, without explicitly considering the expectation channel, which partially accounts for the observed differences in the magnitude and persistence of the responses.
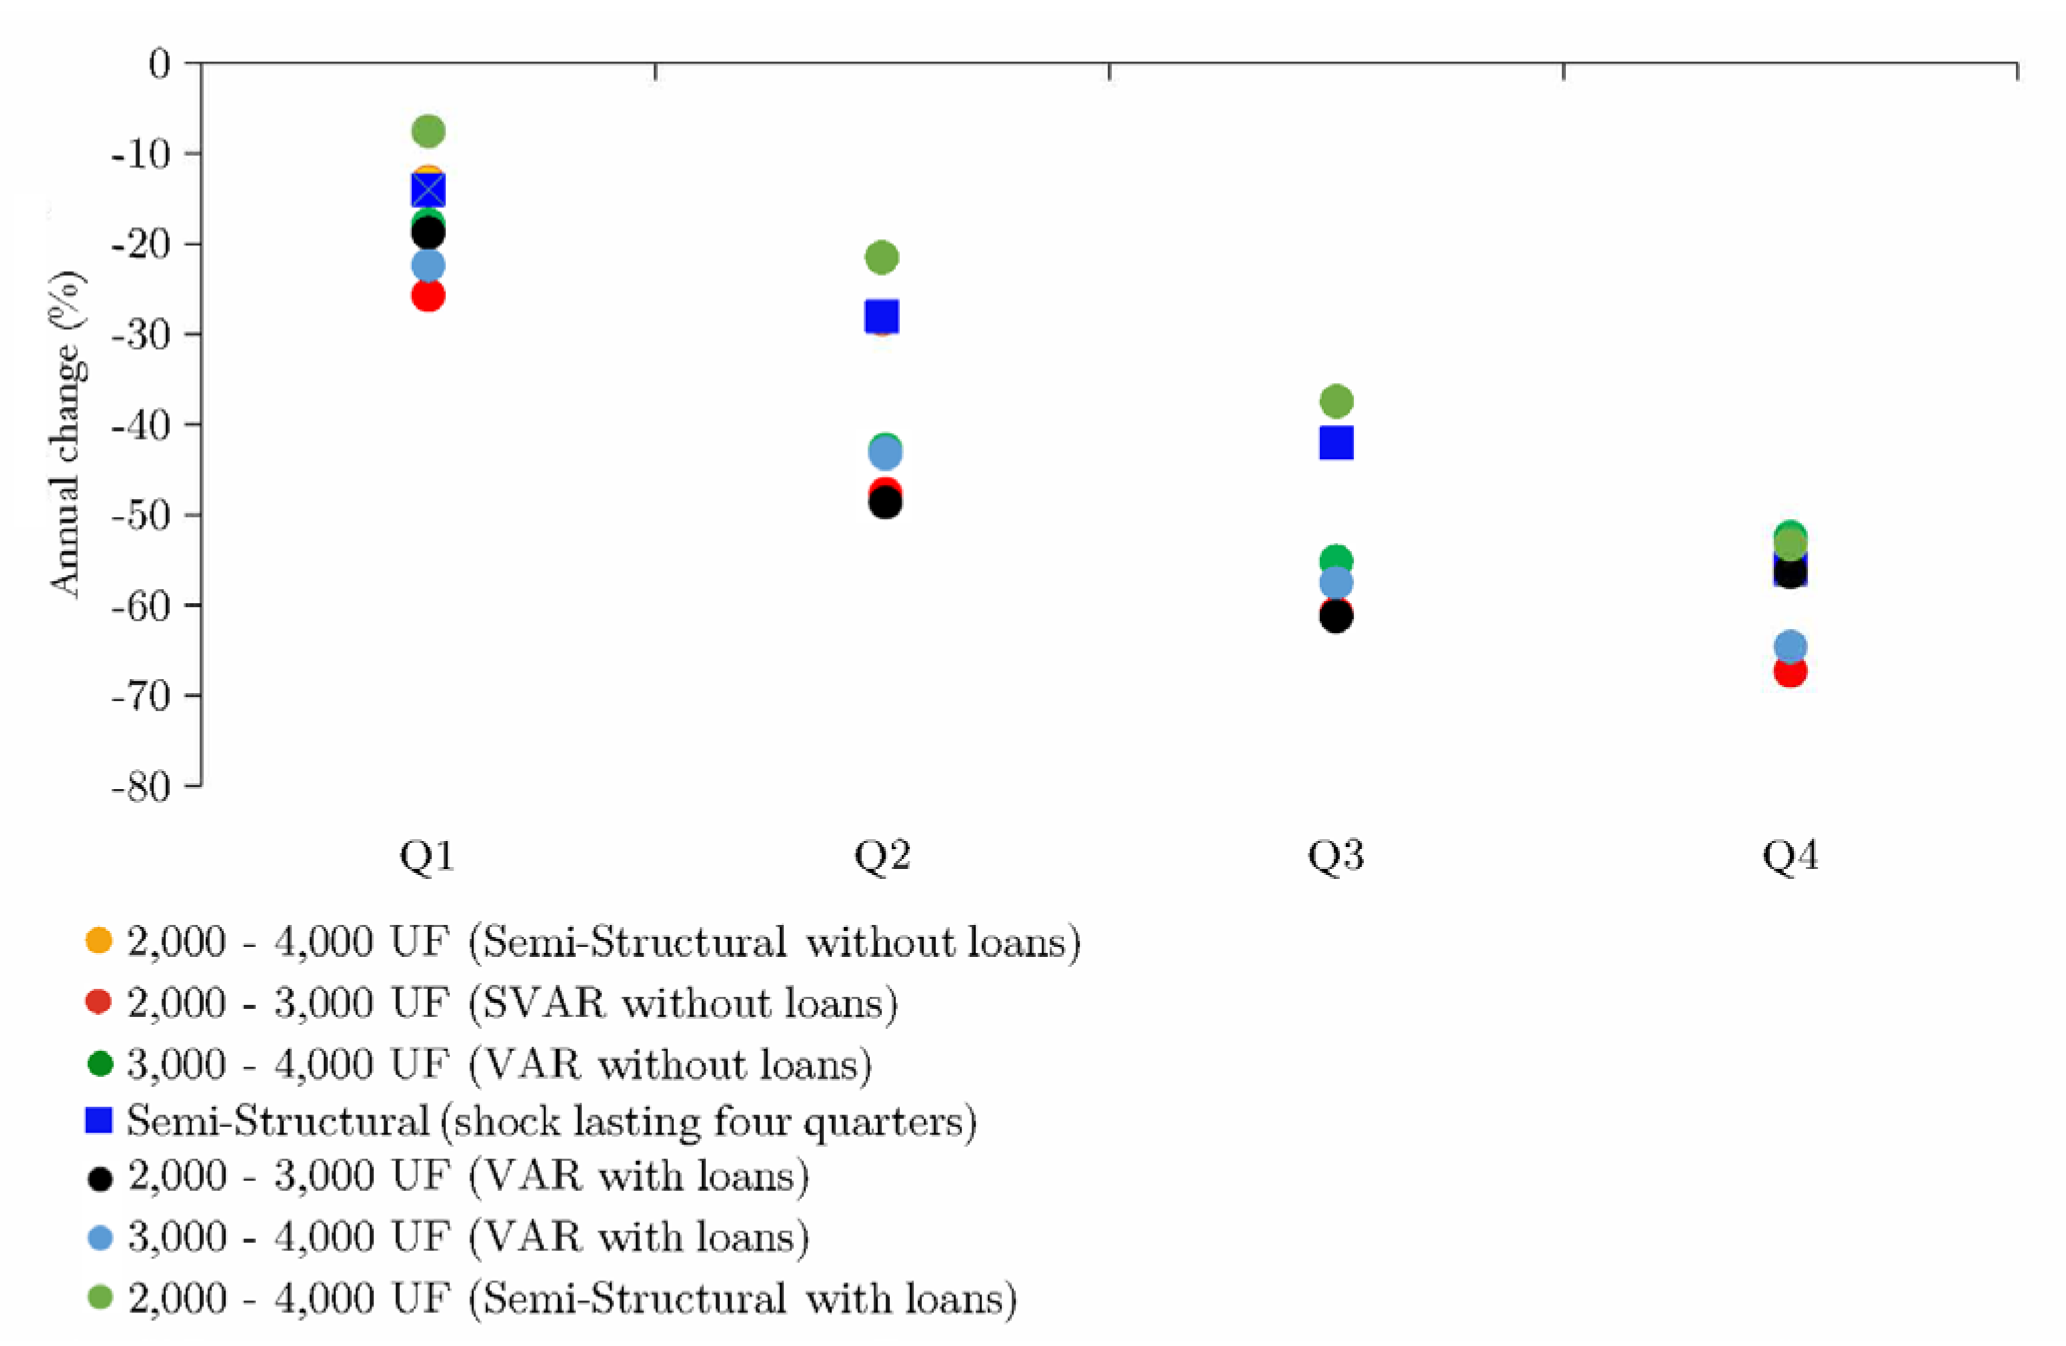
Figure 6 illustrates the cumulative annual variations in real estate sales in the fourth quarter following the interest rate shock based on the outcomes derived from the various estimated models. From this analysis, it can be inferred that a 100 basis point increase in the mortgage rate may result in a cumulative decline in sales ranging from 52% to 67% by the end of one year.
Furthermore, when simulating a shock with a duration exceeding one quarter, such as a shock persisting over four consecutive quarters, the impact on sales is generally more pronounced in the semi-structural model, as anticipated (Figure 7). Similarly, if a demand-side subsidy policy intervention results in an effect equivalent to a 100 basis point reduction in the mortgage rate on sales and if this policy and its effects are sustained for one year, a consistent sales trajectory is expected, not only in the short term but also during the first half of the subsequent year following the policy shock. This phenomenon can be attributed to the inherent inertia in sales behavior, possibly due to transaction costs and other factors, suggesting that sales committed at the conclusion of the tax benefit period (at the first-year margin) materialize at the beginning of the following year after the shock has dissipated. Specifically, an effect akin to a reduction in mortgage rates on real estate sales could be achieved through a temporary subsidy targeting the demand for new housing in middle-income sectors, with the aim of revitalizing real estate investment, a labor-intensive activity.
Table 3 provides an estimation of the short-term response of potential real estate transactions to a 200 basis point reduction in the mortgage rate or to a public policy initiative designed to achieve a comparable impact on sales through subsidies targeting the demand of middle-income households. This table delineates two scenarios of anticipated annual growth in housing sales within the price range of 2,000-4,000 UF. The first scenario represents the 25th percentile of the distribution of impulse-response functions derived from each model employed, whereas the second scenario pertains to the median of this distribution. These findings are presented for both the initial post-shock period and cumulative effect over the year.
In Appendix A, we present the impulse-response functions associated with the models that incorporate loan placements, along with mortgage rates and housing sales.
4. Discussion
The present study provides preliminary evidence indicating that the decline in real estate sales observed since the last quarter of 2021, which has resulted in excess supply, is largely attributable to the increase in mortgage rates. This is explained by the fact that units within the price range of 2,000-4,000 UF, which constitute approximately two-thirds of the new housing supply, demonstrate high sensitivity to interest rate fluctuations. Consequently, through impulse-response functions, it was determined that an innovation equivalent to a 100 basis point increase in the mortgage rate resulted in an average decrease of 18% in real estate sales during the first quarter. This effect progressively intensified, culminating in an average cumulative decline of approximately 57% per year by the end of the first year. It is noteworthy that this principle is analogous in the case of a decline in mortgage rate. This finding underscores the direct influence of financing conditions on real estate dynamics, particularly within the specified price segment.
Moreover, the potential risk associated with a policy intervention aimed at revitalizing sectoral activity, such as subsidizing housing sales through mortgage rates, culminating in increased real estate prices, as documented in international literature, is presently minimal. As shown in Appendix 2, the current market velocity, measured in months of housing supply, significantly exceeds historical averages. Consequently, the implementation of a measure designed to stimulate the real estate market could facilitate the industry’s return-to-equilibrium dynamics without substantially reducing absorption rates or posing significant risks of upward price pressure.
In conclusion, considering that the data provided by the Chilean Chamber of Construction pertain to preliminary sale agreements, it is recommended as an extension of this study to examine the influence of mortgage rates on withdrawal rates. This entails estimating the impulse-response functions using sales figures adjusted for cancellations and comparing them with the gross amount of sales for each quarter. Such an approach could potentially reveal the heightened sensitivity of the housing market to fluctuations in mortgage rates, indicating that the findings of this study may be conservative.
Author Contributions
Conceptualization, B.I-A. and F-J.L.; methodology, B.I-A.; software, B.I-A.; investigation, B.I-A. and F-J.L.; resources, B.I-A. and F-J.L.; data curation, B.I-A.; writing—original draft preparation, B.I-A. and F-J.L.; writing—review and editing, B.I-A. and F-J.L. All authors have read and agreed to the published version of the manuscript.
Funding
This research received no external funding.
Institutional Review Board Statement
Not applicable.
Informed Consent Statement
Not applicable.
Data Availability Statement
Data available on request due to privacy restrictions.
Acknowledgements
We are especially grateful to Slaven Razmilic and Matías Bernier for their valuable and insightful comments during the development of this document, which greatly contributed to its improvement.
Conflicts of Interest
The authors declare no conflicts of interest.
Abbreviations
The following abbreviations are used in this manuscript:
| UF | Unidad de Fomento |
| USD | U.S. dollars |
| VAR | Vector Autoregression |
| MCMC | Markov Chain Monte Carlo |
| GDP | Gross Domestic Product |
| SVAR | Structural Vector Autoregression |
| HtB | Help to Buy |
| DSGE | Dynamic Stochastic General Equilibrium |
| GMM | Generalized Method of Moments |
| HPD | Highest Posterior Density |
| CMF | Comisión del Mercado Financiero |
Appendix A
This section presents a comparative analysis of the impulse-response functions of the models discussed in the main body of this paper with those derived from models that incorporate housing mortgage loan placements as an additional variable. As illustrated in the Figures below (A1 and A2), the inclusion of this new variable results in short-run dynamics of real estate transactions that exhibit only slight differences compared to models that exclude it. This outcome may be attributed, among other factors, to the fact that the loan tranches defined by the CMF encompass a broader segment of housing prices than those examined in this study.
When the variable of placements is incorporated, the semi-structural model is parameterized as follows:
where represents housing loan placements within the 1,500 to 5,000 UF range, as predefined in the CMF databases, rather than being a definition specifically chosen for this analysis. The variable represents an endogenous disturbance affecting placements, thereby enhancing the model’s alignment with the data. Finally, is an exogenous disturbance within the model and its variance. This leads to the following behavioral structure of real estate sales, excluding stochastic disturbances:
In this formulation, the lagged sales term encapsulates the persistence characteristic of the dynamic behavior of this variable, as empirically observed. The term corresponding to placements in previous periods partially serves as a proxy variable, reflecting the financial conditions of the real estate market. Furthermore, the model incorporates rational expectations concerning the future mortgage rate , which directly influence purchase decisions. This is particularly pertinent in contexts where this rate can be employed as an instrument of public policy. An example is the implementation of mortgage rate subsidies aimed at stimulating housing demand. The parameters estimated using Bayesian techniques are presented in Table A1.

Table A1.
Parameter estimation.
| Parameter | Prior1 | Post. (avg) | CI HPD (90%) | Dist. (prior) |
|---|---|---|---|---|
| 0.9 | 0.9135 | 0.8476 - 0.9704 | Beta | |
| 0.5 | 0.6484 | 0.5867 - 0.7394 | Beta | |
| 0.4 | 0.3086 | 0.2206 - 0.3698 | Beta | |
| 0.7 | 0.6777 | 0.6163 - 0.7457 | Beta | |
| 0.2 | 0.1969 | 0.1551 - 0.2496 | Beta | |
| 0.4 | 0.4038 | 0.3882 - 0.4205 | Beta | |
| 0.2 | 0.4544 | 0.3476 - 0.5722 | Beta | |
| 0.2 | 0.1959 | 0.1192 - 0.2699 | Beta | |
| 0.5 | 0.3911 | 0.3325 - 0.4558 | Inv. Gamma | |
| 0.5 | 0.5122 | 0.3714 - 0.6487 | Inv. Gamma | |
| 0.5 | 0.2052 | 0.1712 - 0.2408 | Inv. Gamma |
1 Based on preliminary GMM estimates.
Figure A1.
Response of housing demand to a 100bp shock to mortgage rate.
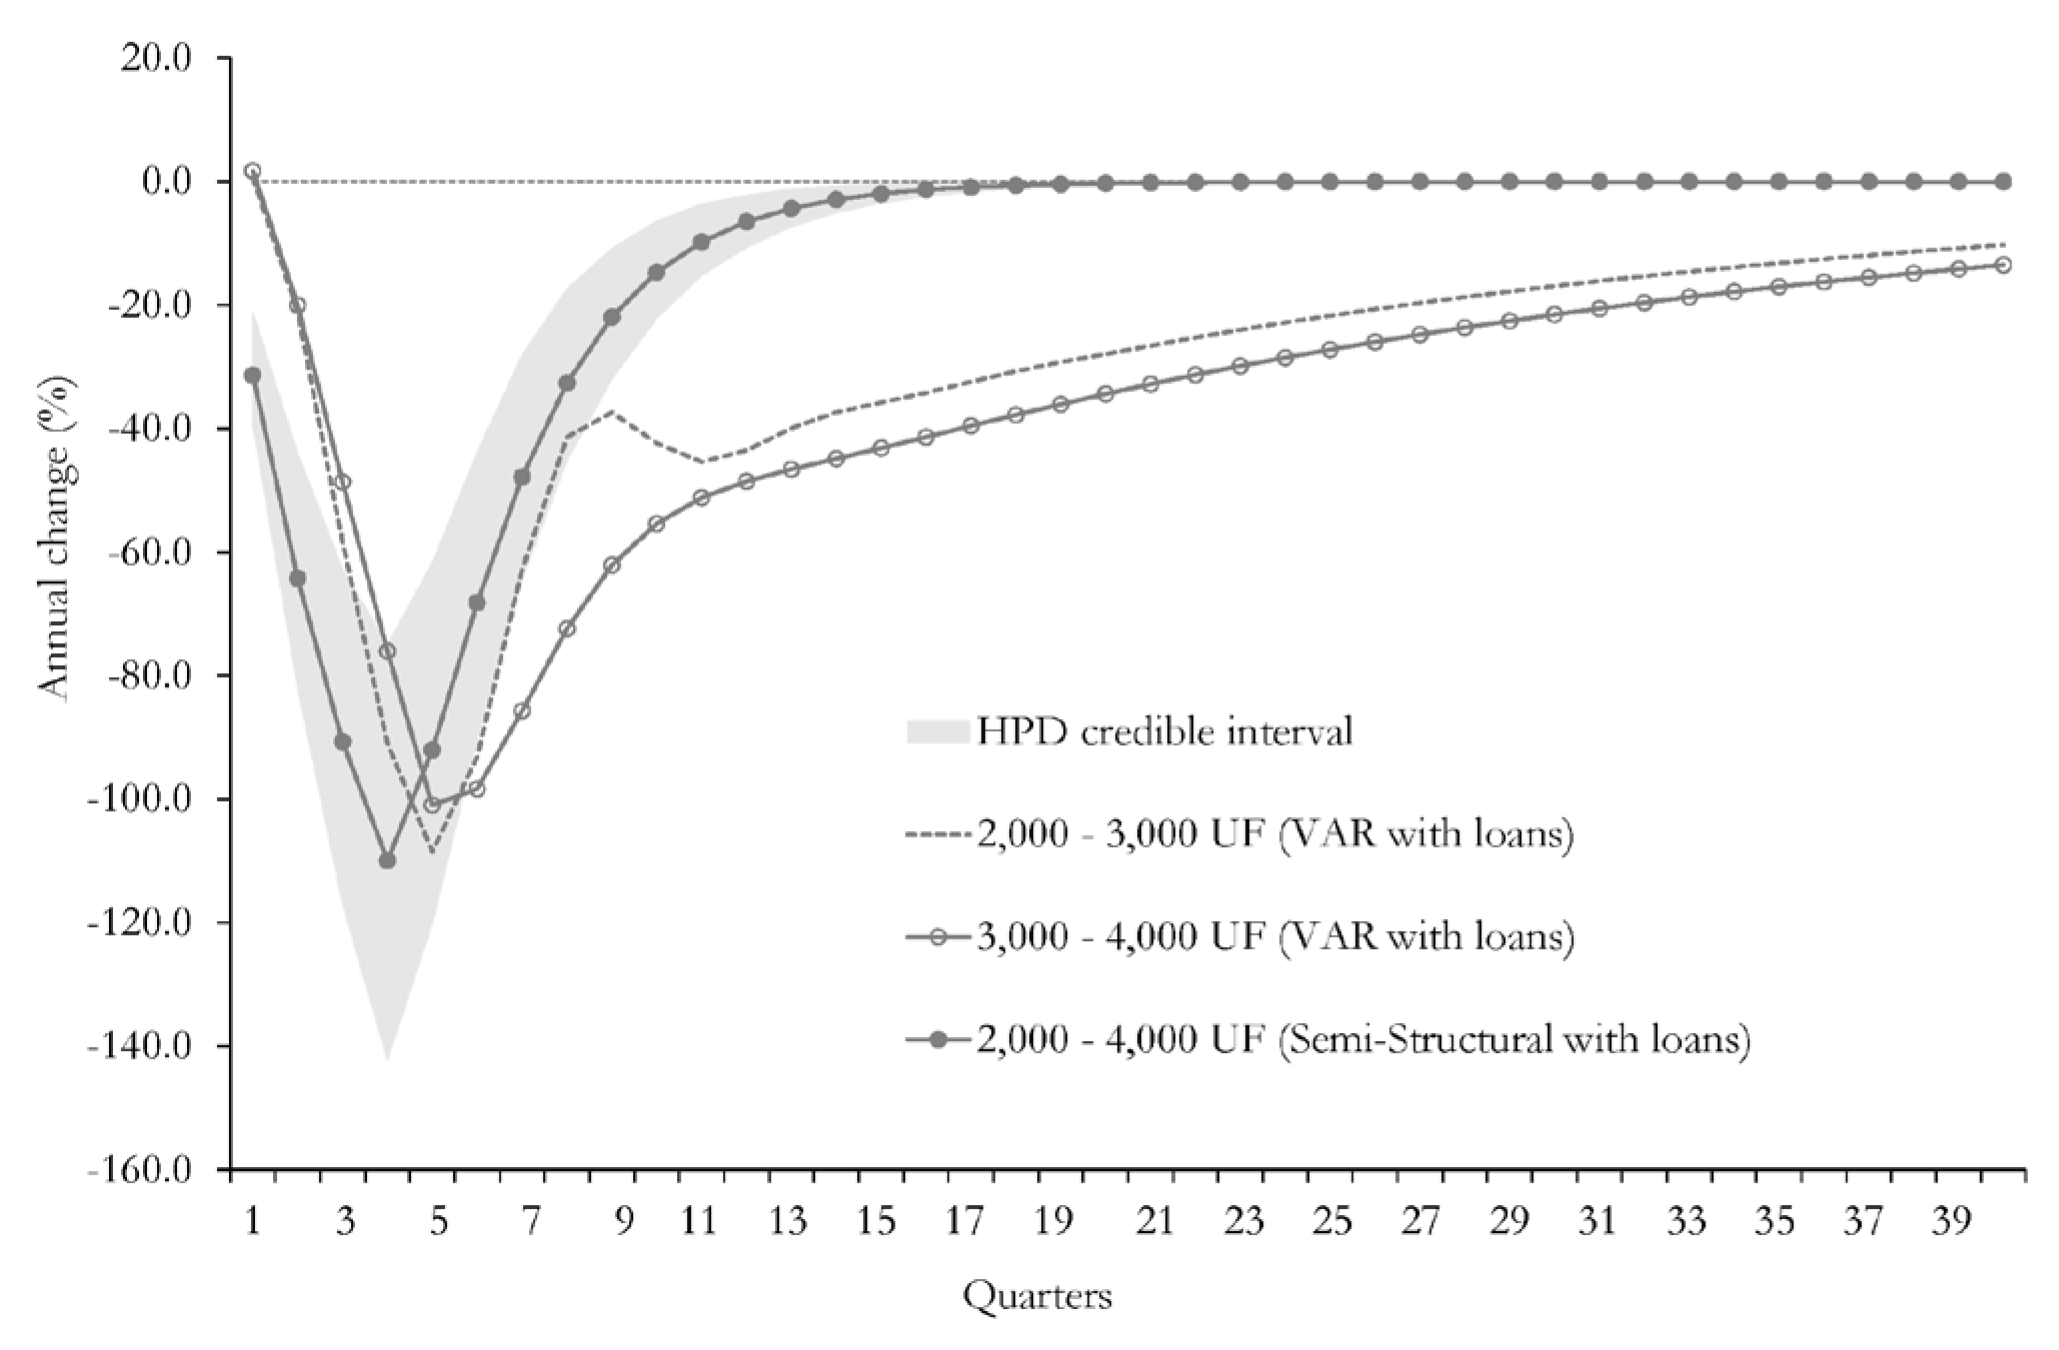
Figure A2.
Cumulative response of housing demand to a 100bp shock to mortgage rate.
Appendix B
Structural change in the absorption rate of housing supply: Why is the upside price risk limited?
The current housing inventory in months indicates a structural shift in its dynamics, marked by a transition towards substantially elevated levels compared to historical patterns. This transformation is illustrated in Figure A3a, which depicts an increase in the months of housing supply, and in A3b, which suggests a regime change in this variable, establishing statistically elevated levels.
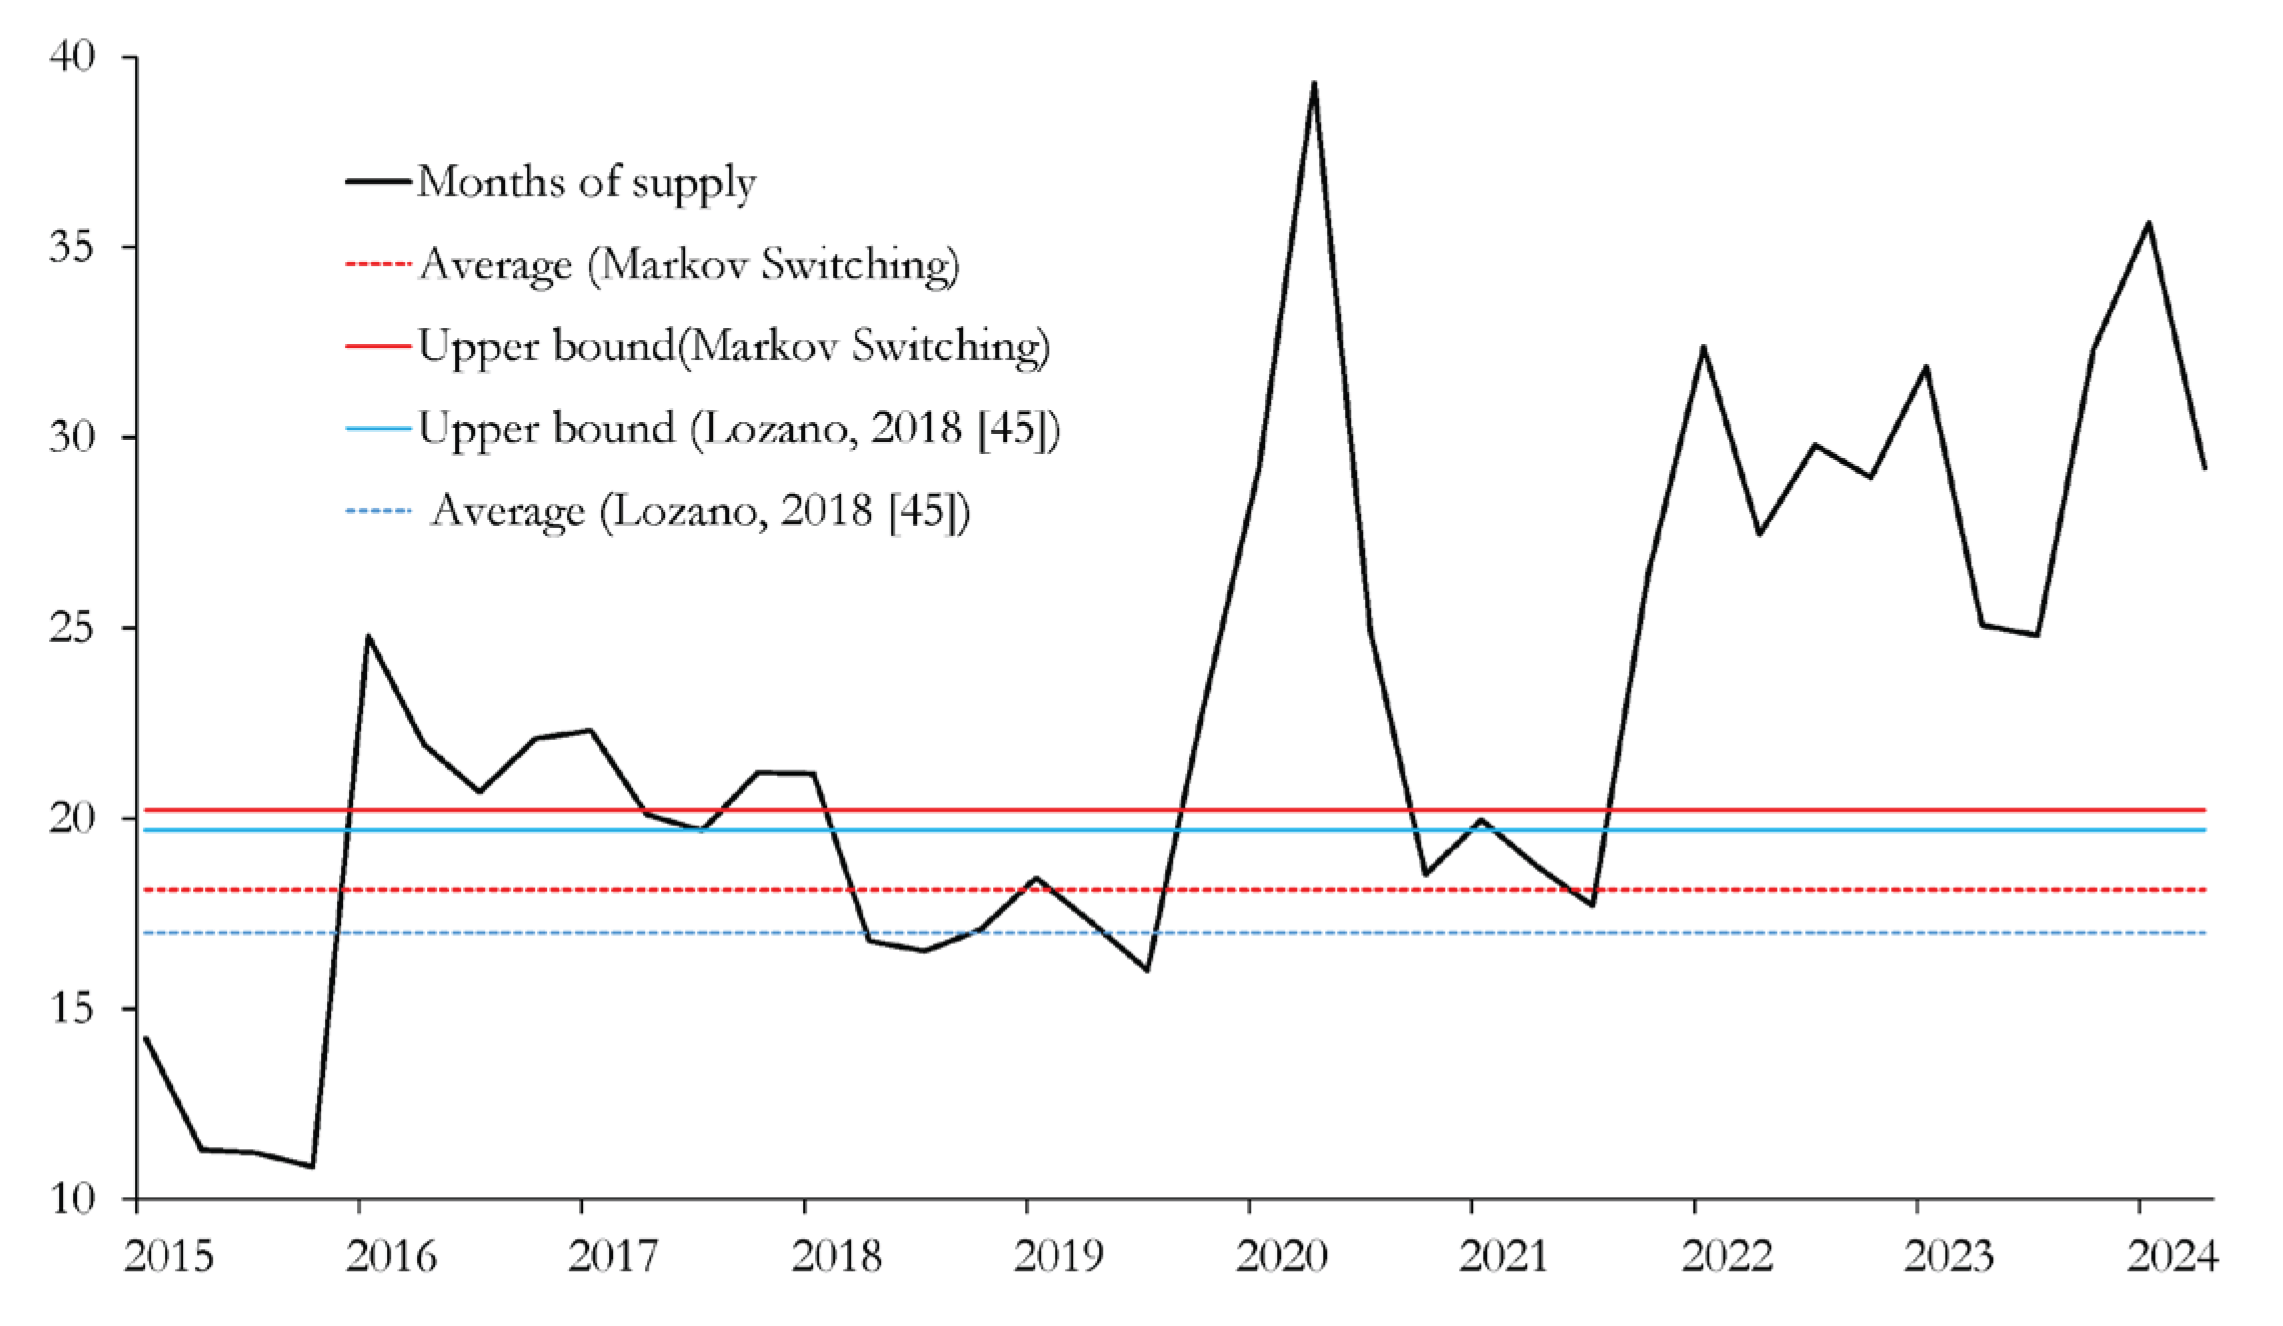
As long as the absorption rate remains above its historical average, particularly at the upper end of its range (see Figure A4), the likelihood of a substantial increase in housing prices is relatively low. In this context, the implementation of a measure aimed at revitalizing the market could facilitate the convergence to equilibrium within the sector’s dynamics, without significant risks of upward pressures resulting from an excessive reduction in the absorption times of the available inventory.
Figure A3.
Housing inventory in months: (a) Structural change in months of supply; (b) Regime change probabilities.
Figure A3.
Housing inventory in months: (a) Structural change in months of supply; (b) Regime change probabilities.
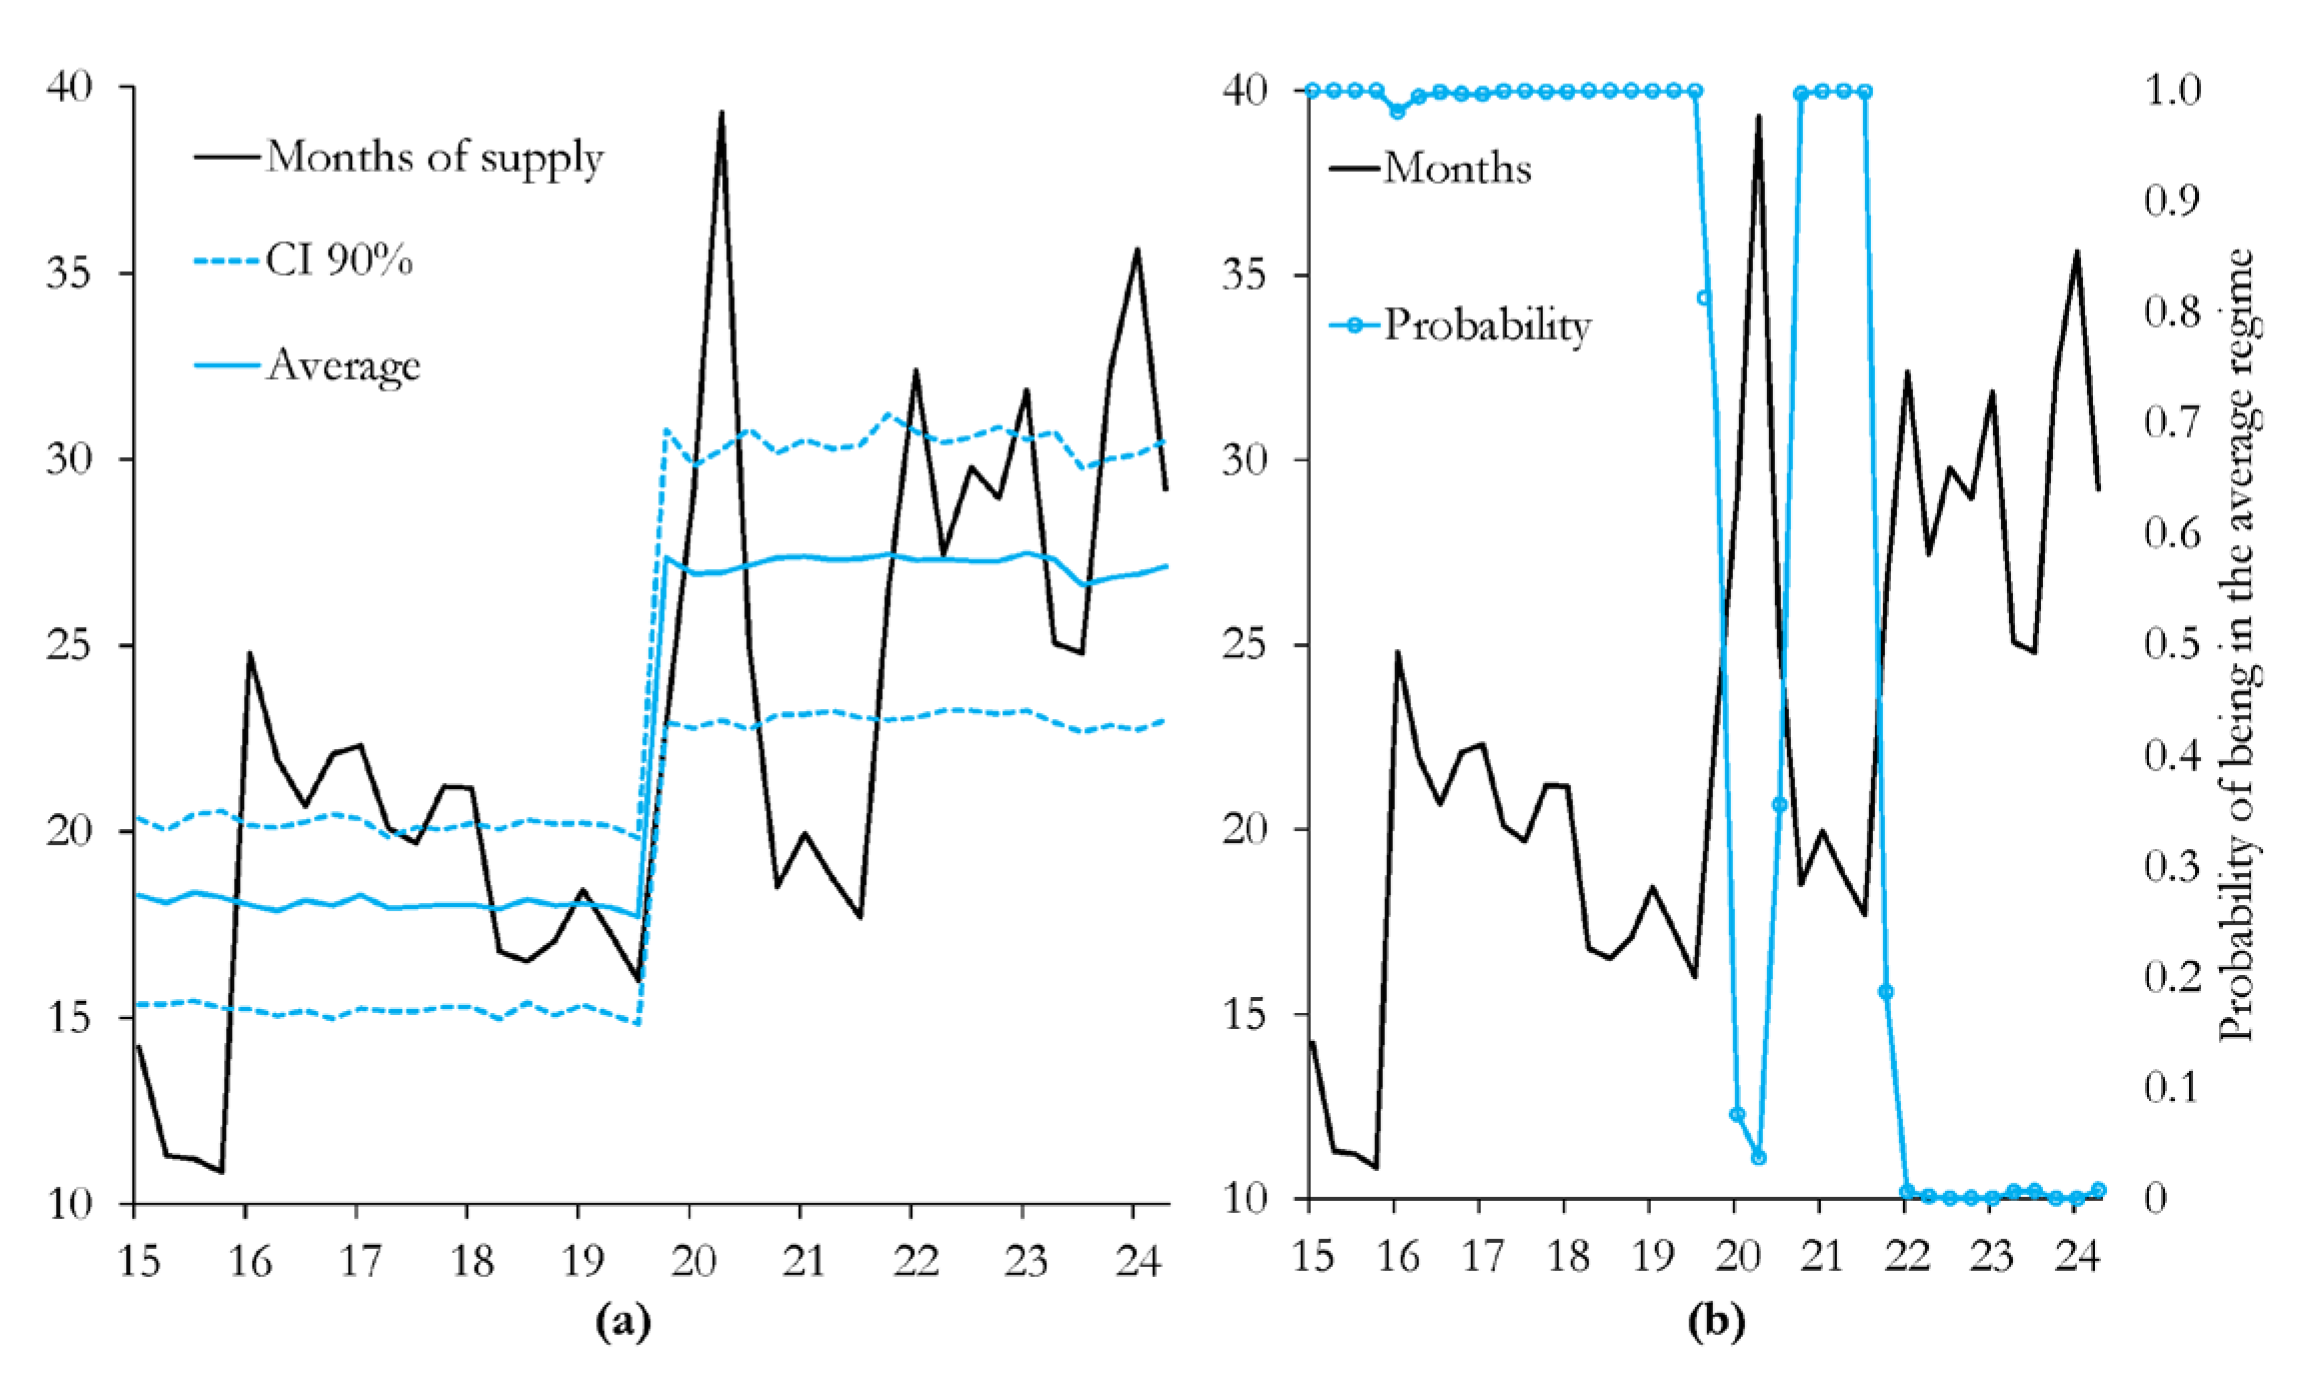
Figure A4.
Housing inventory in months and long-term averages.
References
- Leamer, E. E. Housing Really Is the Business Cycle: What Survives the Lessons of 2008–09? Journal of Money, Credit and Banking 2015, 47(S1), 43-50. [CrossRef]
- Base de datos estadísticos, Banco Central de Chile. Available online: https://si3.bcentral.cl/siete (accessed on 19th May 2025).
- Central Bank of Chile. Informe de Estabilidad Financiera, Primer Semestre 2025; Banco Central de Chile, Chile, 2025.
- Baghestani, H.; Kaya, I. Do financial indicators have directional predictability for US home sales? Applied Economics 2016, 48(15), Article 15. [CrossRef]
- Časta, M. The Impact of Mortgage Rates on the Housing Market. SSRN 2024. [CrossRef]
- Hamilton, J. D. Daily monetary policy shocks and new home sales. Journal of Monetary Economics 2008, 55(7), 1171–1190. [Google Scholar] [CrossRef]
- Adams, Z.; Füss, R. Macroeconomic determinants of international housing markets. Journal of Housing Economics 2010, 19(1), 38–50. [Google Scholar] [CrossRef]
- Agnello, L.; Schuknecht, L. Booms and busts in housing markets: Determinants and implications. Journal of Housing Economics 2011, 20(3), 171–190. [Google Scholar] [CrossRef]
- Kern, M.; Wagner, H. House-Prices and the Credit Market—Evidence from an International Panel of Industrialized Economies. SSRN Electronic Journal 2018. [CrossRef]
- Anenberg, E.; Ringo, D. Volatility in Home Sales and Prices: Supply or Demand? Journal of Urban Economics 2024, 139, 103610. [Google Scholar] [CrossRef]
- Davis, M. A.; Oliner, S. D.; Peter, T. J.; Pinto, E. J. The Impact of Federal Housing Policy on Housing Demand and Homeownership: Evidence from a Quasi-Experiment. Journal of Housing Economics 2020, 48, 101670. [Google Scholar] [CrossRef]
- DeFusco, A. A.; Paciorek, A. The Interest Rate Elasticity of Mortgage Demand: Evidence from Bunching at the Conforming Loan Limit. American Economic Journal: Economic Policy 2017, 9(1), 210-240. [CrossRef]
- Fuster, A.; Zafar, B. The Sensitivity of Housing Demand to Financing Conditions: Evidence from a Survey. American Economic Journal: Economic Policy 2021, 13(1), 231-265. [CrossRef]
- Iacoviello, M.; Minetti, R. The credit channel of monetary policy: Evidence from the housing market. Journal of Macroeconomics 2008, 30(1), 69–96. [Google Scholar] [CrossRef]
- Ume, E. The impact of monetary policy on housing market activity: An assessment using sign restrictions. Economic Modelling 2018, 68, 23–31. [Google Scholar] [CrossRef]
- Vargas-Silva, C. Monetary policy and the US housing market: A VAR analysis imposing sign restrictions. Journal of Macroeconomics 2008, 30(3), 977–990. [Google Scholar] [CrossRef]
- Justiniano, A.; Primiceri, G. E.; Tambalotti, A. Credit Supply and the Housing Boom. Journal of Political Economy 2019, 127(3), 1317–1350. [Google Scholar] [CrossRef]
- Acolin, A.; Bricker, J.; Calem, P.; Wachter, S. Borrowing Constraints and Homeownership. American Economic Review 2016, 106(5), Article 5. [CrossRef]
- Iossifov, M. P. K.; Cihak, M. M.; Shanghavi, A. Interest Rate Elasticity of Residential Housing Prices. IMF Working Papers 2008, No. 2008/247. International Monetary Fund. [CrossRef]
- Dokko, J.; Doyle, B. M.; Kiley, M. T.; Kim, J.; Sherlund, S.; Sim, J.; Van Den Heuvel, S. Monetary policy and the global housing bubble. Economic Policy 2011, 26(66), 237–287. [Google Scholar] [CrossRef]
- Chen, S.-S.; Lin, T.-Y.; Wang, J.-K. Monetary policy and housing market cycles. Macroeconomic Dynamics 2024, 28(8), 1682–1714. [Google Scholar] [CrossRef]
- Albuquerque, B.; Iseringhausen, M.; Opitz, F. Monetary policy and US housing expansions: The case of time-varying supply elasticities. Economics Letters 2020, 195, 109471. [Google Scholar] [CrossRef]
- Aastveit, K. A.; Anundsen, A. K. Asymmetric Effects of Monetary Policy in Regional Housing Markets. American Economic Journal: Macroeconomics 2022, 14(4), Article 4. [CrossRef]
- Fischer, M. M.; Huber, F.; Pfarrhofer, M.; Staufer-Steinnocher, P. The Dynamic Impact of Monetary Policy on Regional Housing Prices in the United States. Real Estate Economics 2021, 49(4), 1039–1068. [Google Scholar] [CrossRef]
- Costello, G.; Fraser, P.; MacDonald, G. Monetary policy influences in Australian housing markets. International Journal of Housing Markets and Analysis 2015, 8(2), 265–286. [Google Scholar] [CrossRef]
- Kasparova, D.; White, M. The Responsiveness of House Prices to Macroeconomic Forces: A Cross-Country Comparison. European Journal of Housing Policy 2001, 1(3), 385–416. [Google Scholar] [CrossRef]
- Koeniger, W.; Lennartz, B.; Ramelet, M. A. On the transmission of monetary policy to the housing market. European Economic Review 2022, 145, 104107. [Google Scholar] [CrossRef]
- Torres Gutiérrez, J. J. La transmisión de la política monetaria al mercado inmobiliario español. Revista de Estudios Empresariales 2023. Segunda Época, 127-164. [CrossRef]
- Silva, C.; Vio, C. Housing prices and macroeconomic factors: Evidence from Chile. Economía Chilena 2015, 18(1), 4-24. https://econpapers.repec.org/RePEc:chb:bcchec:v:18:y:2015:i:1:p:4-24.
- Idrovo-Aguirre, B. J.; Lozano, F. J.; Contreras-Reyes, J. E. Prosperity or Real Estate Bubble? Exuberance Probability Index of Real Housing Prices in Chile. International Journal of Financial Studies 2021, 9(3), 51. [Google Scholar] [CrossRef]
- Gupta, R.; Jurgilas, M.; Kabundi, A.; Miller, S. M. Monetary policy and housing sector dynamics in a large-scale Bayesian vector autoregressive model. International Journal of Strategic Property Management 2012, 16(1), 1–20. [Google Scholar] [CrossRef]
- Anenberg, E.; Kung, E. Interest Rates and Housing Market Dynamics in a Housing Search Model. SSRN Electronic Journal 2017. [CrossRef]
- Fiorelli, C.; Marzano, E.; Piselli, P.; Rubinacci, R. The Role of House Prices and Transactions in Monetary Policy Transmission: The Case of Italy. Italian Economic Journal 2024. [CrossRef]
- Gary-Bobo, R. J.; Larribeau, S. The Bank’s Market Power and the Interest-Rate Elasticity of Demand for Housing: An Econometric Study of Discrimination on French Mortgage Data. Annales d’Économie et de Statistique 2003, 71/72, 377. [CrossRef]
- Fontenla, M.; Gonzalez, F. Housing demand in Mexico. Journal of Housing Economics 2009, 18(1), 1–12. [Google Scholar] [CrossRef]
- Bhutta, N.; Ringo, D. The effect of interest rates on home buying: Evidence from a shock to mortgage insurance premiums. Journal of Monetary Economics 2021, 118, 195–211. [Google Scholar] [CrossRef]
- Rappoport, D. E. Do Mortgage Subsidies Help or Hurt Borrowers? Finance and Economics Discussion Series 2016, 2016.0(81). [CrossRef]
- Agarwal, S.; Hu, M.; Lee, A. D. Who Gains from Housing Market Stimulus? Evidence from Homeowner Grants with Threshold Prices. SSRN Electronic Journal 2020. [CrossRef]
- Zapata, L. G.; Ramirez, G. D.; Gonzalez, A. A.; Monroy, M. A. The Impact of Subsidies on Housing Prices in Mexico’s Mortgage Market for Low-Income Households 2013-2019. SSRN 2022. https://ssrn.com/abstract=4213316. [CrossRef]
- Hofstetter, M.; Tovar, J.; Urrutia, M. Effects of a Mortgage Interest Rate Subsidy: Evidence from Colombia. Inter-American Development Bank 2011. [CrossRef]
- Carozzi, F.; Hilber, C. A. L.; Yu, X. On the economic impacts of mortgage credit expansion policies: Evidence from help to buy. Journal of Urban Economics 2024, 139, 103611. [Google Scholar] [CrossRef]
- Krolage, C. The effect of real estate purchase subsidies on property prices. International Tax and Public Finance 2023, 30(1), 215–246. [Google Scholar] [CrossRef]
- Rouwendal, J.; Damen, S. Mortgage Subsidies and House Prices. Effects Across the Price Distribution and Anticipation. SSRN 2024. [CrossRef]
- Martins, N. C.; Villanueva, E. The impact of mortgage interest-rate subsidies on household borrowing. Journal of Public Economics 2006, 90(8-9), 1601-1623. [CrossRef]
- Lozano, F. J. Estimación del equilibrio del mercado inmobiliario [Real estate market equilibrium estimation]. MPRA Paper 2018, 118260, University Library of Munich, Germany. https://ideas.repec.org/p/pra/mprapa/118260.html.
Figure 1.
Housing demand and mortgage rates.
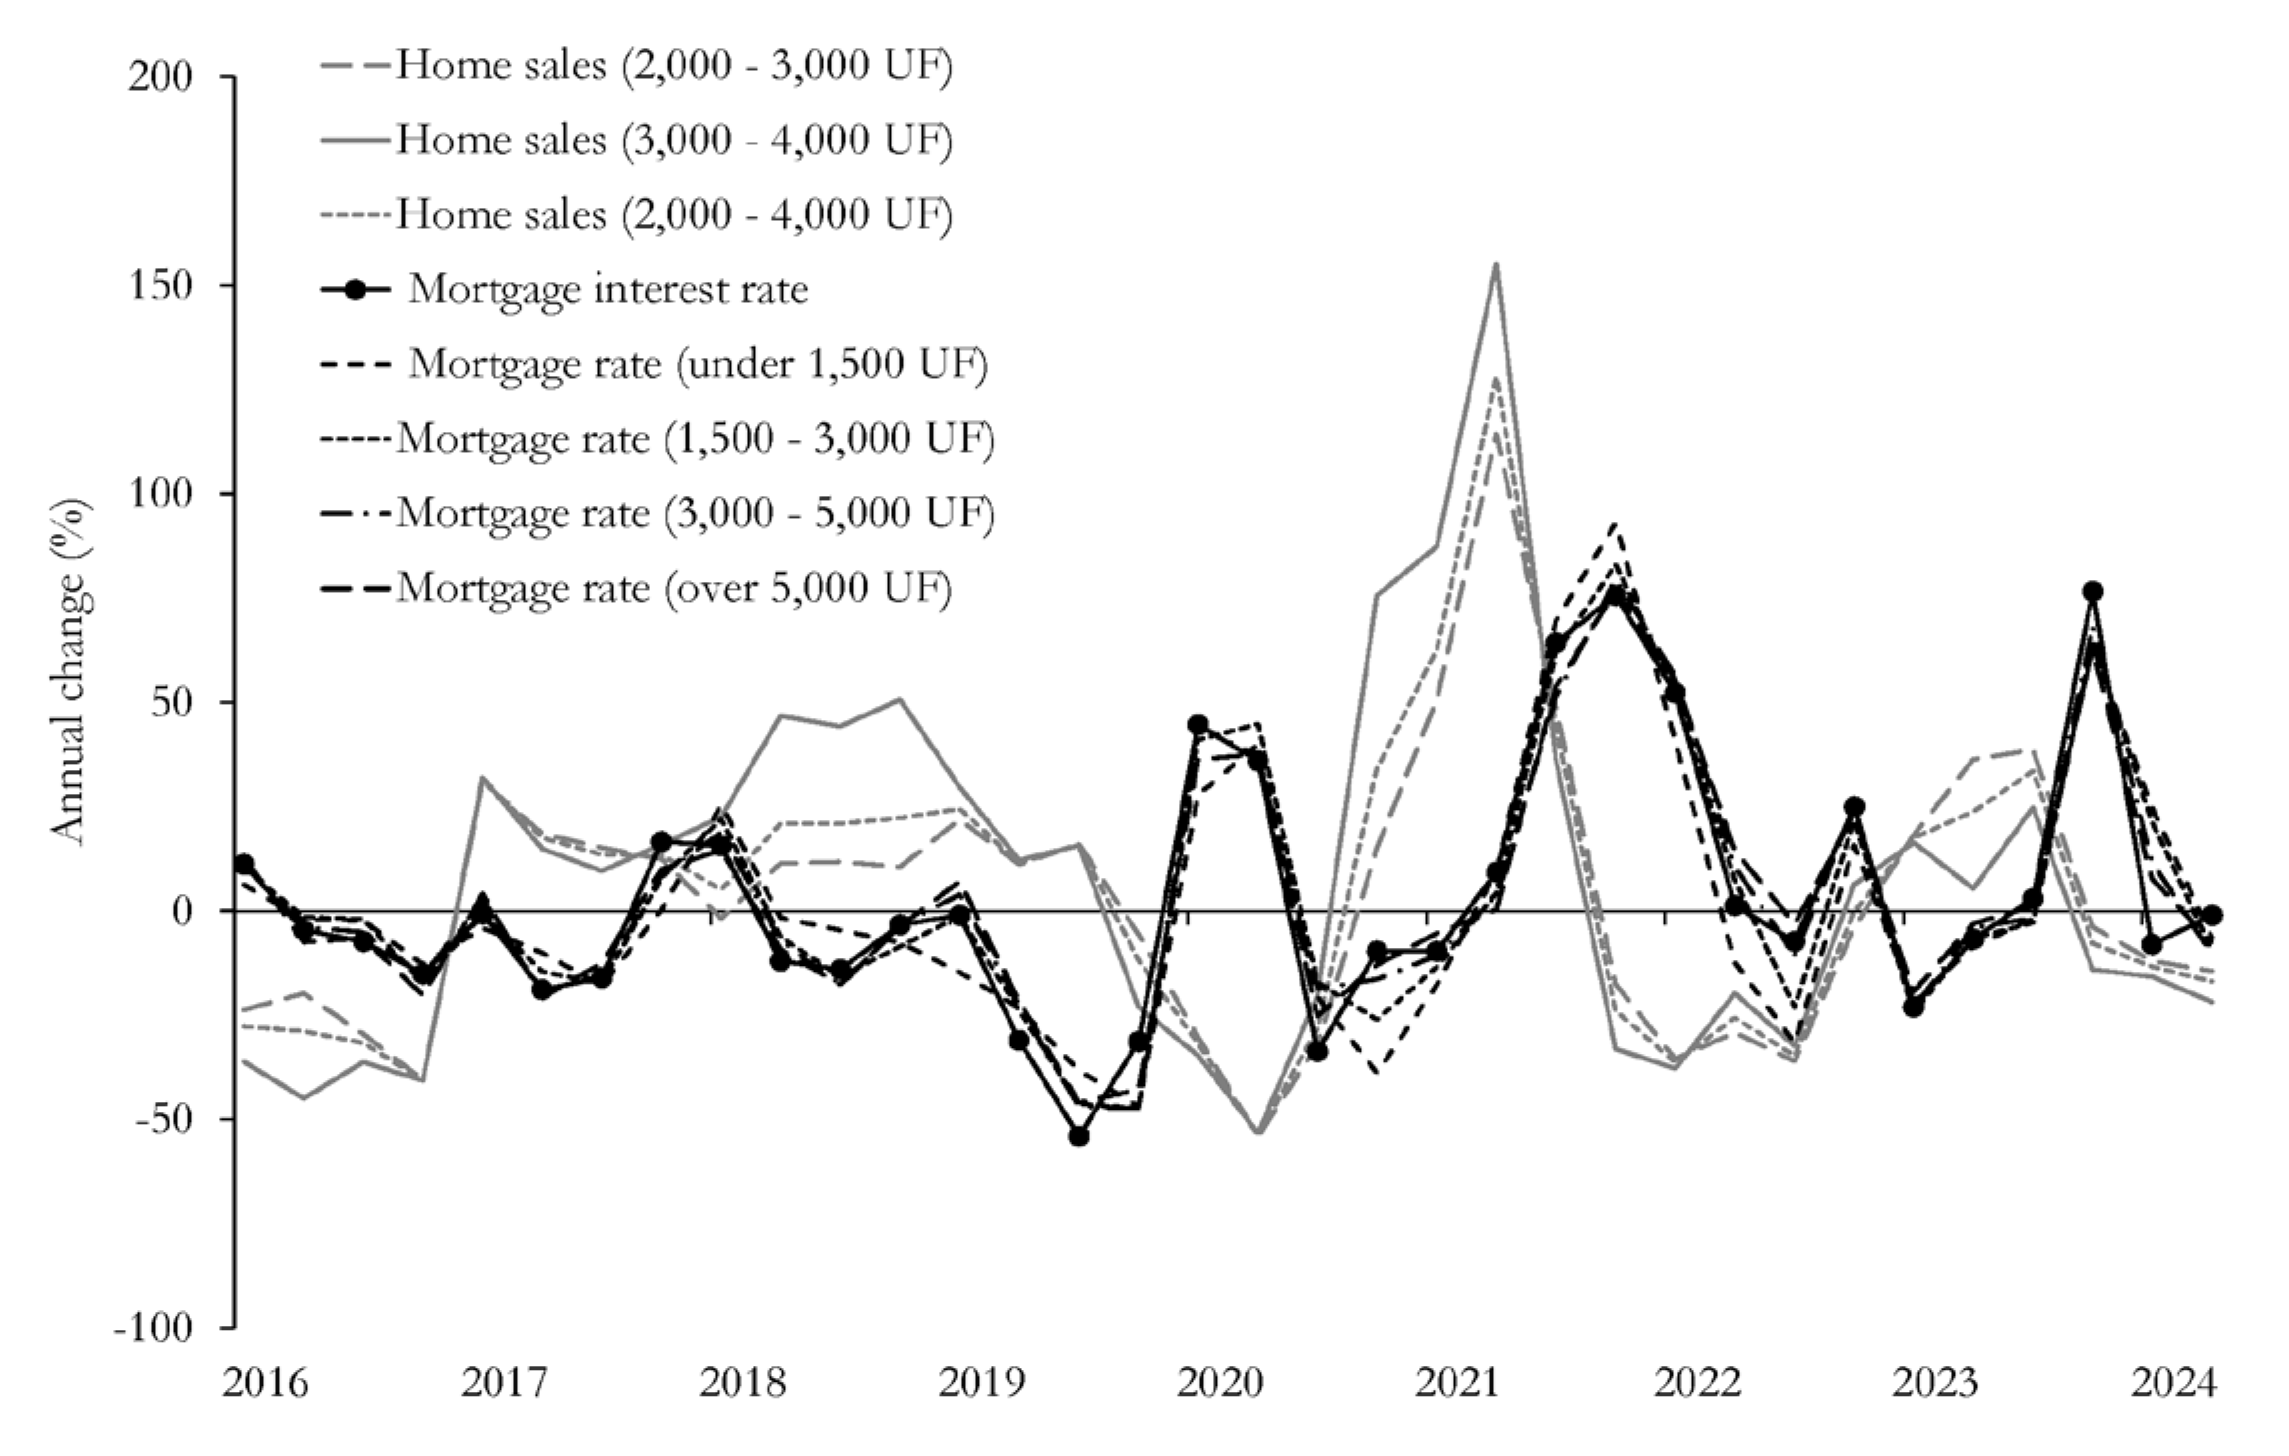
Figure 2.
Housing demand and mortgage loans.
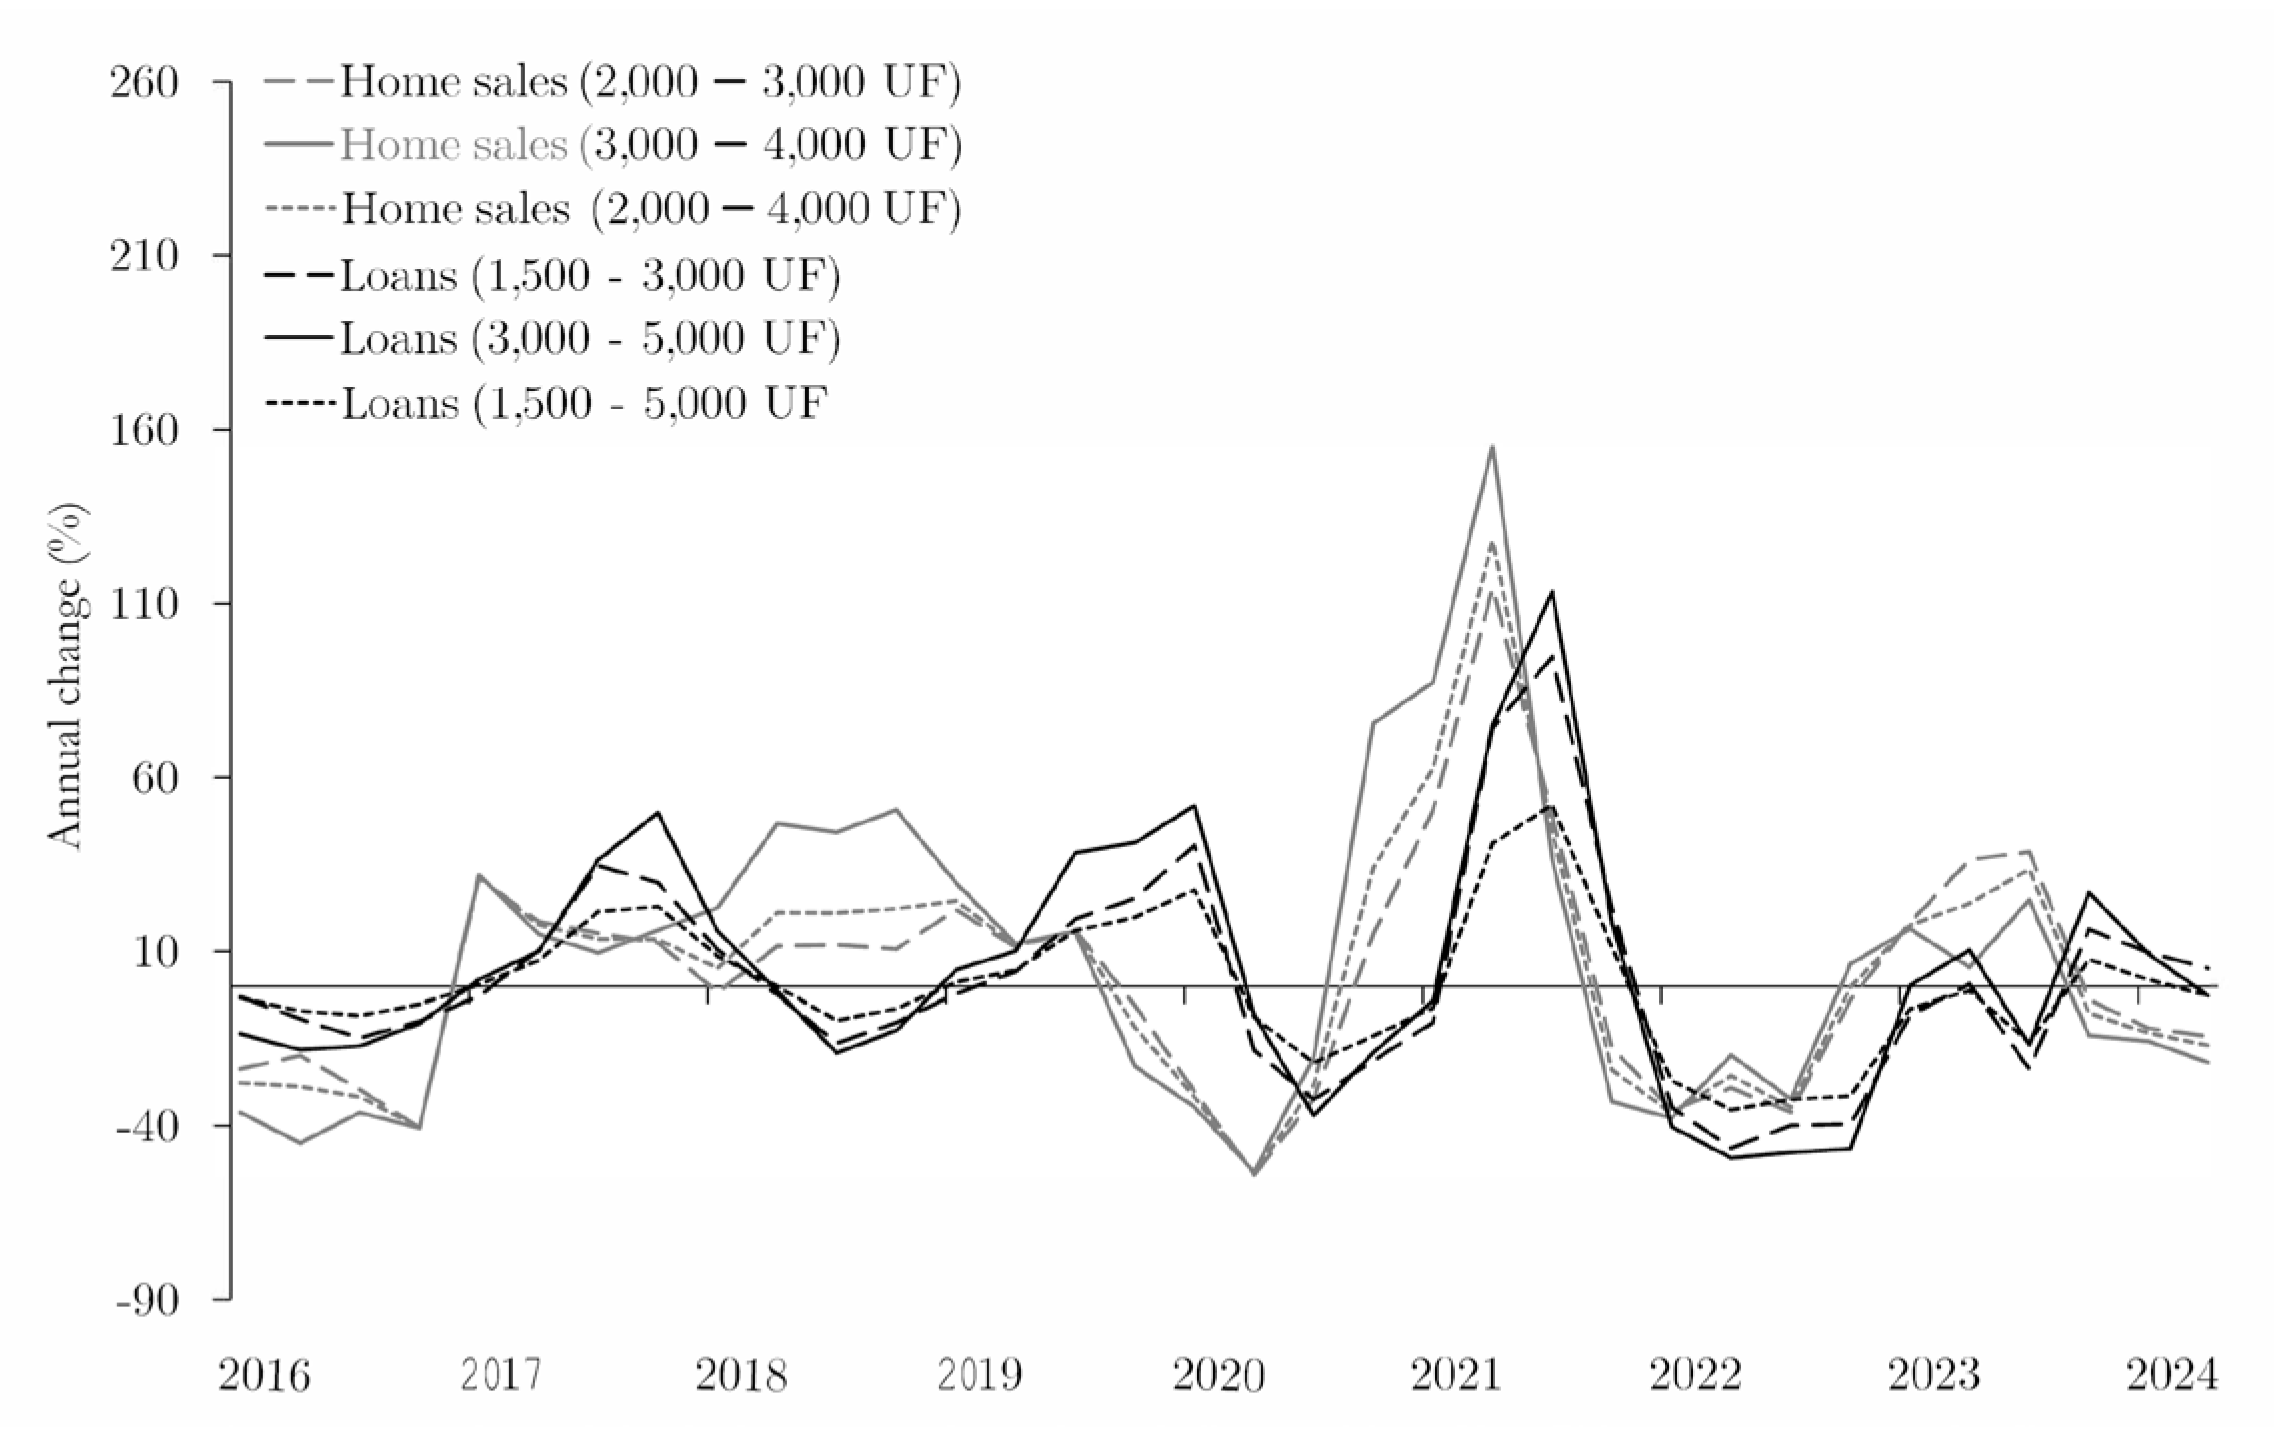
Figure 3.
Mortgage rates and loans.
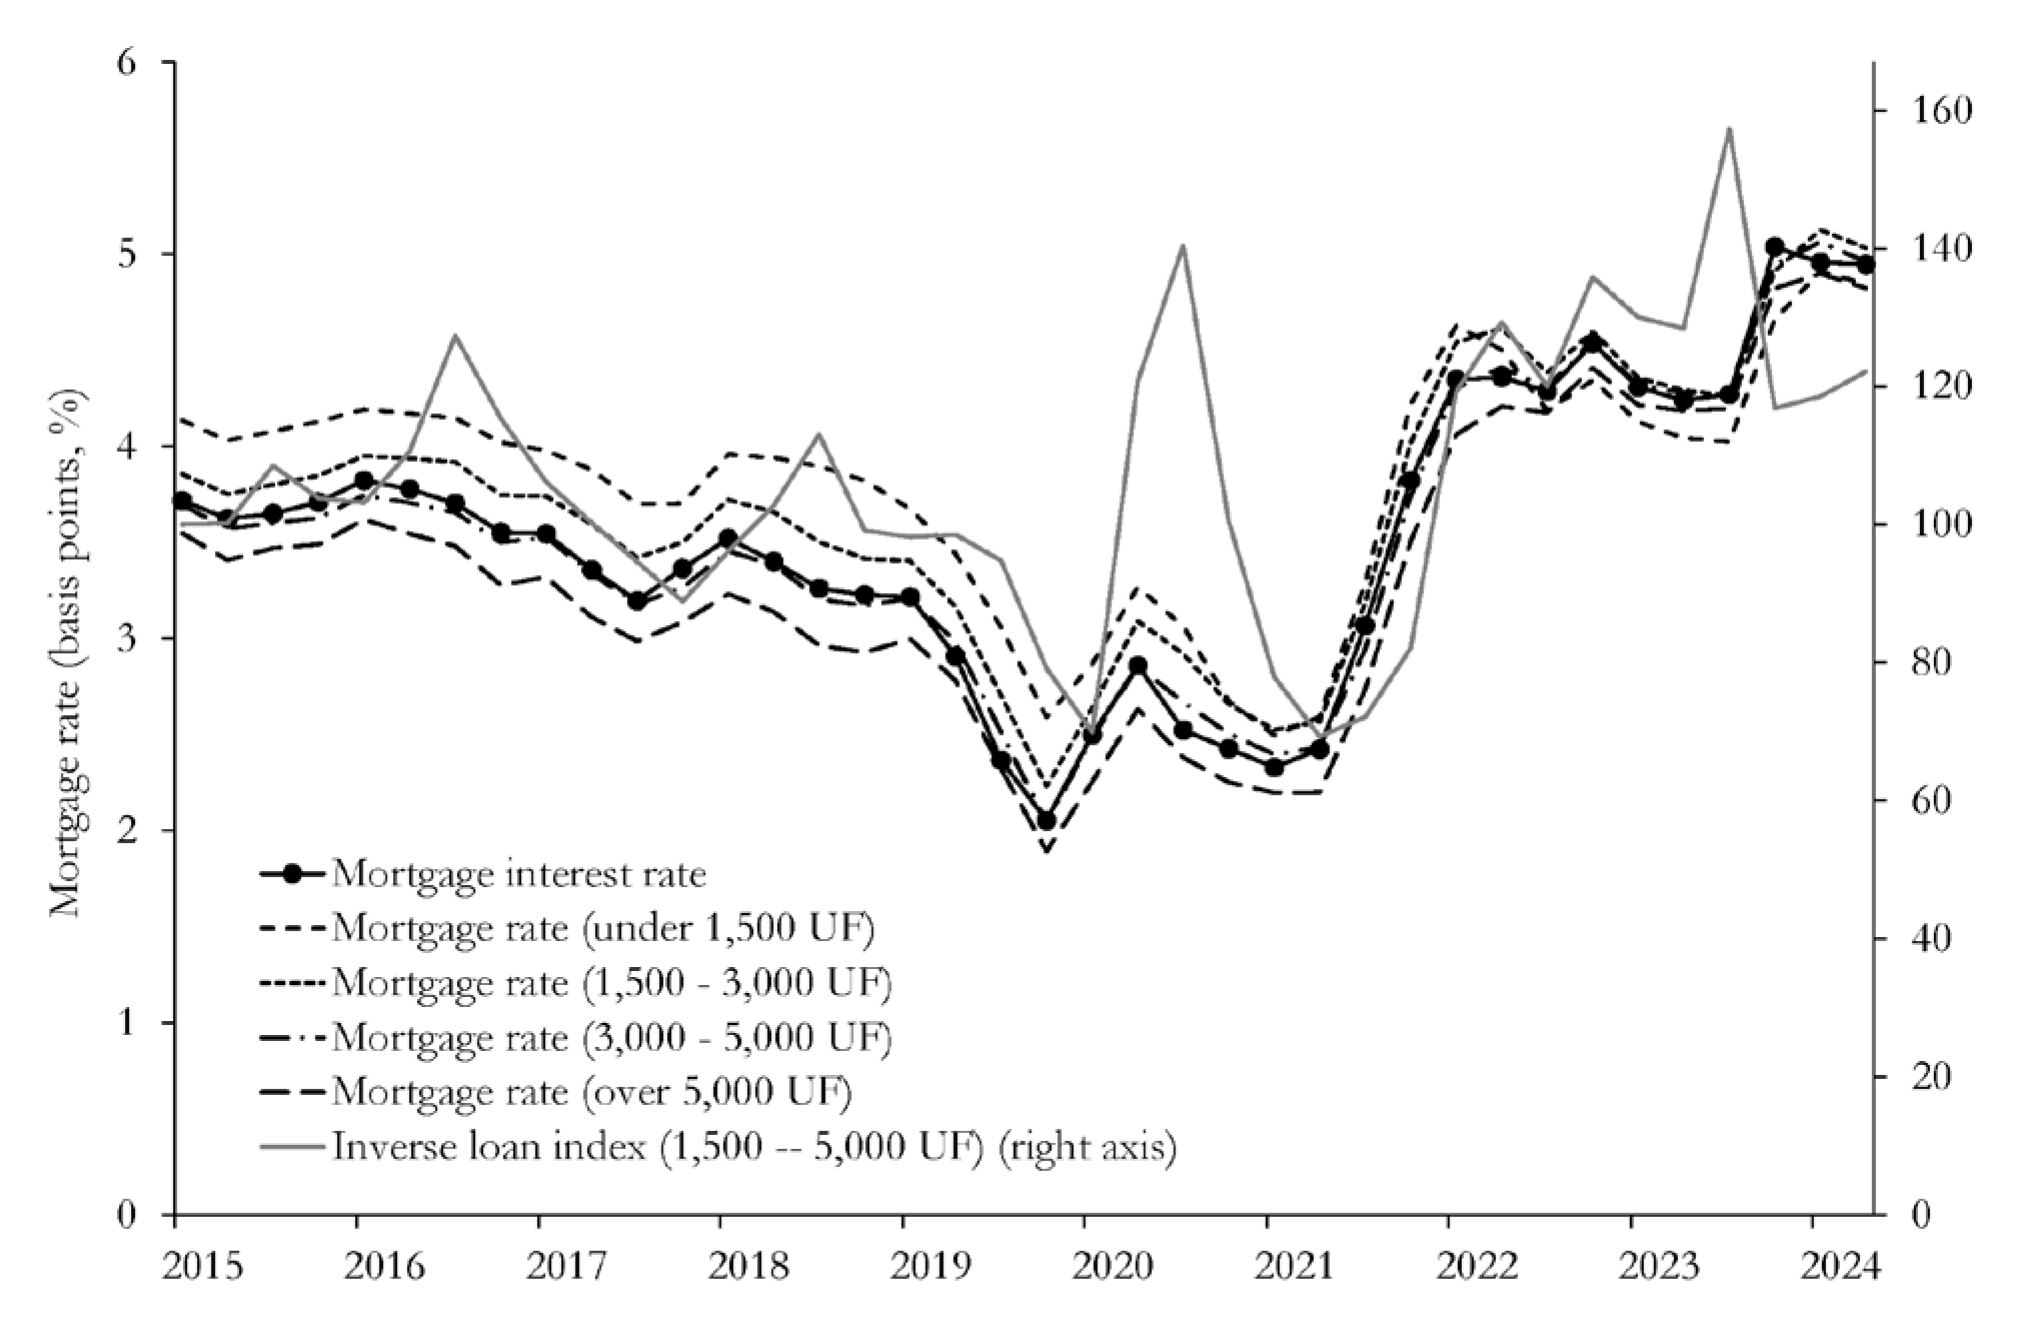
Figure 4.
Housing demand (2,000 – 4,000 UF), observed and estimated.
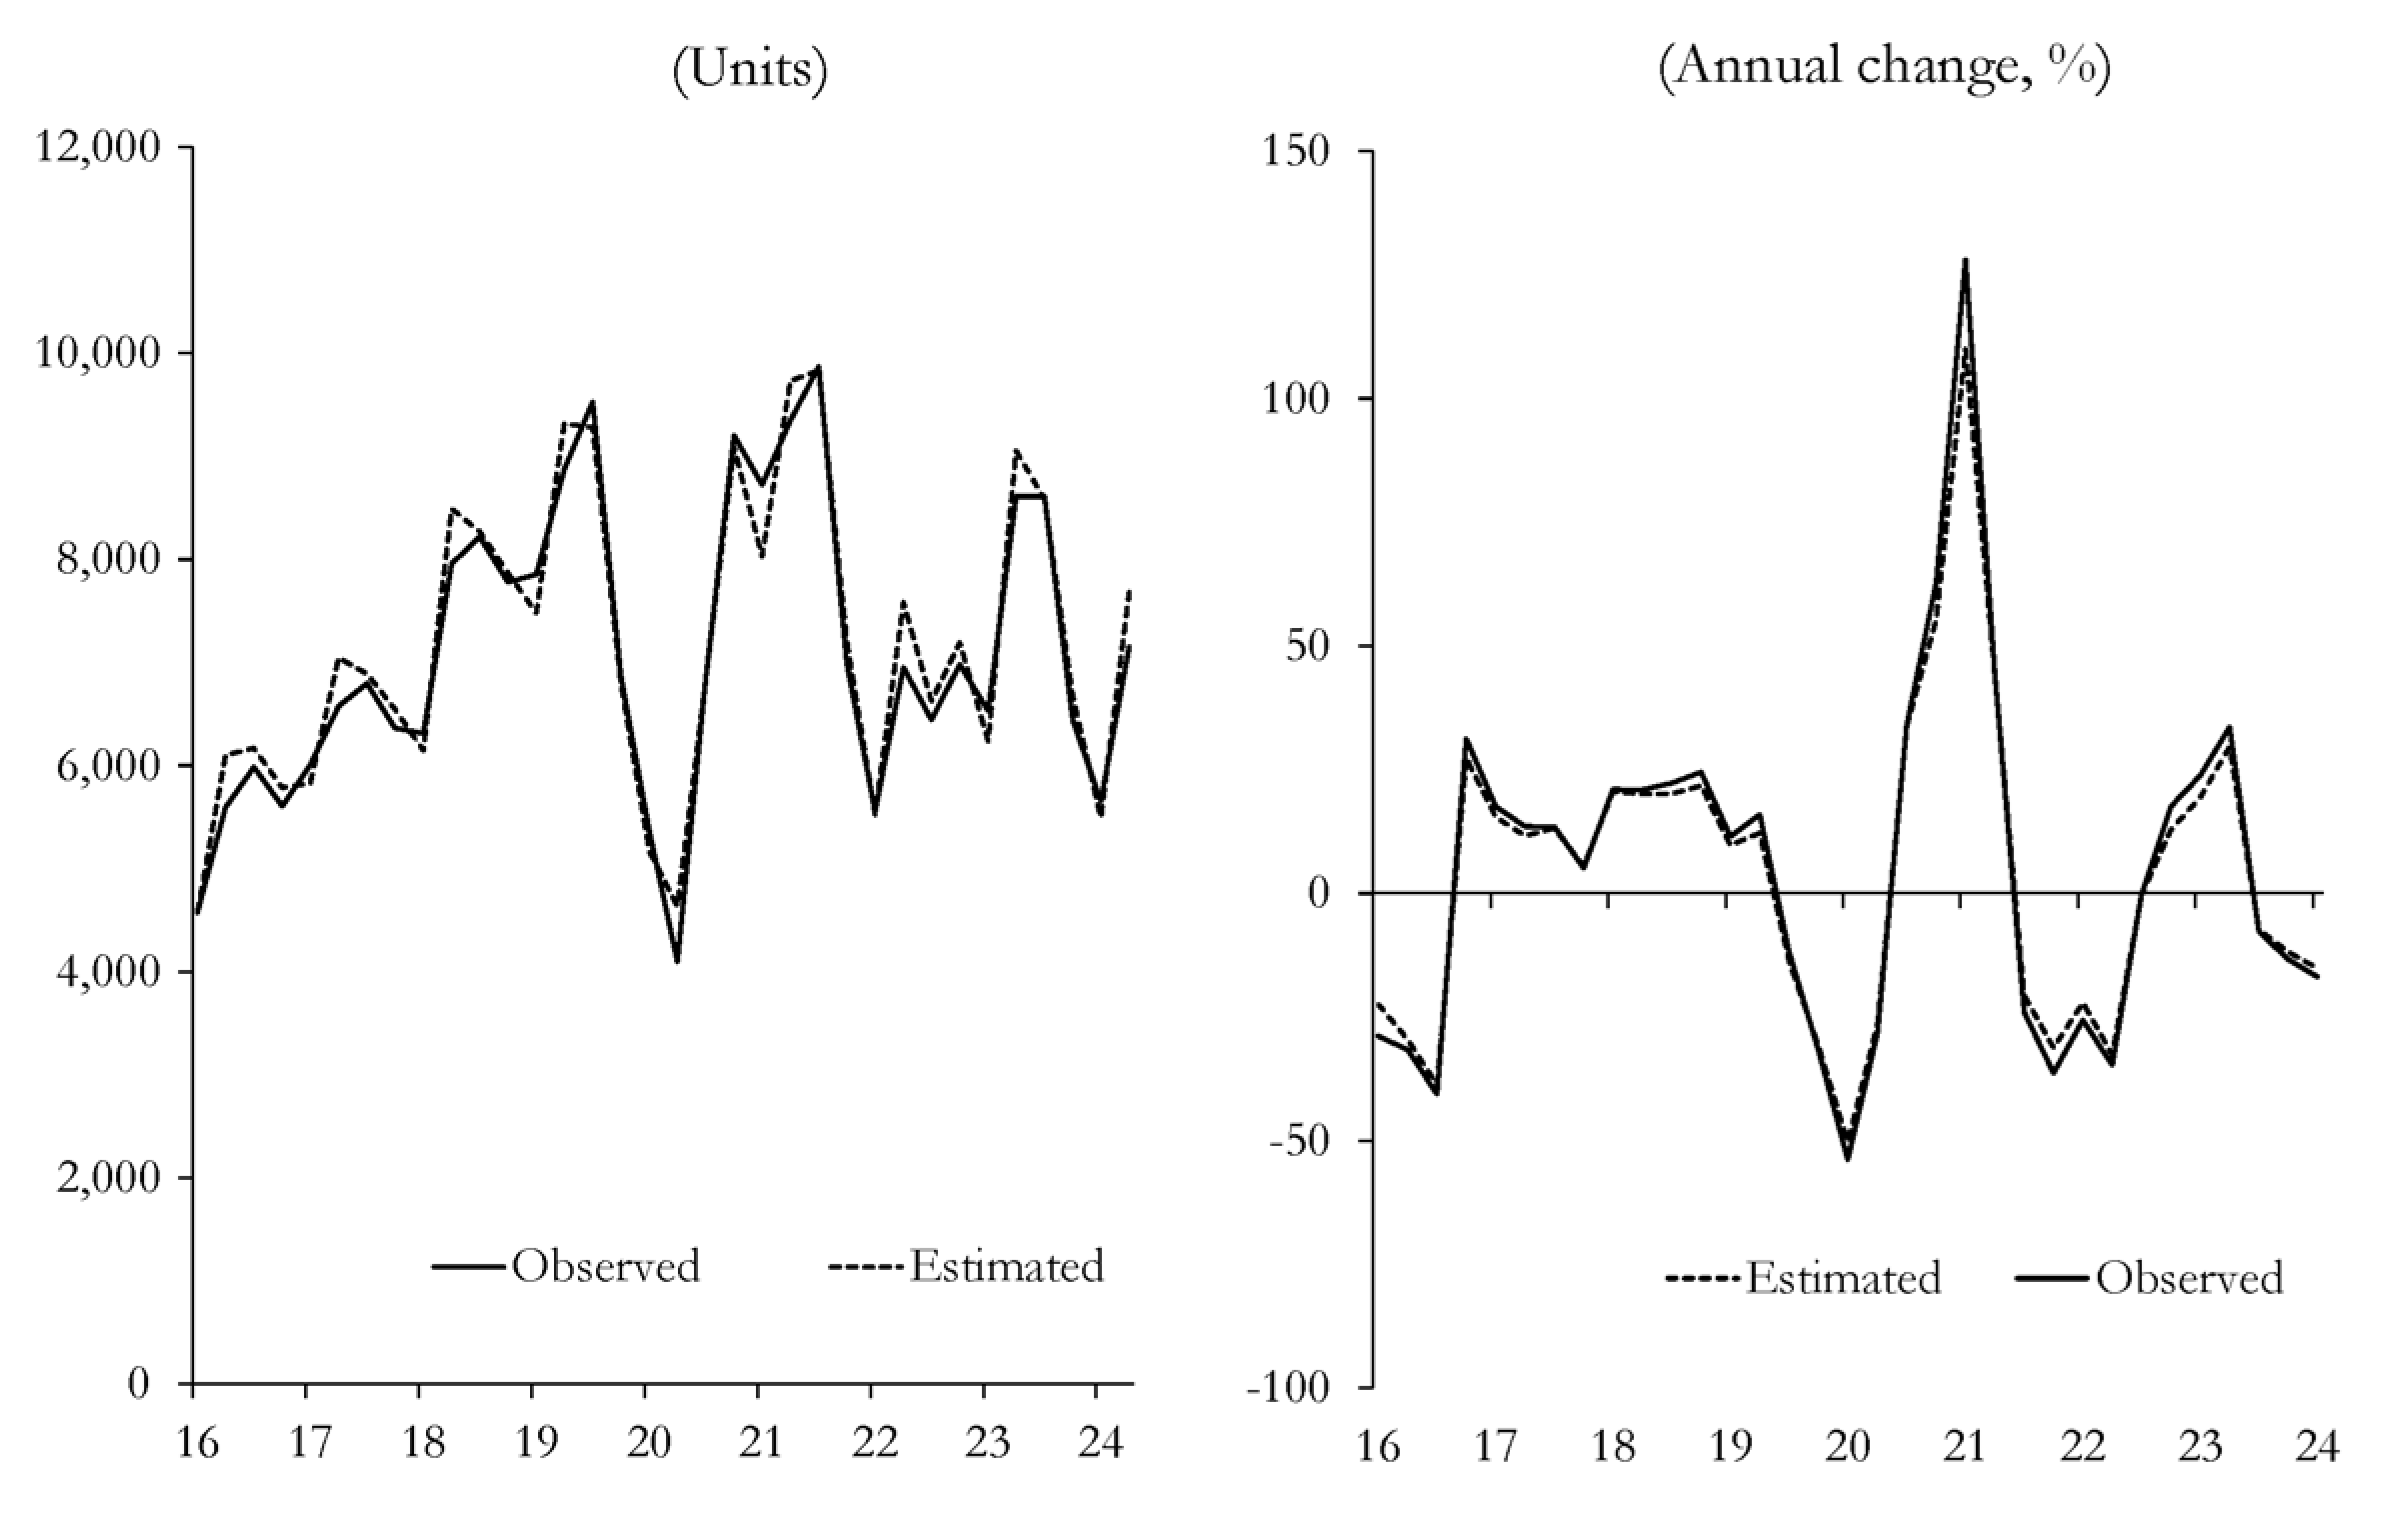
Figure 5.
Impulse-response functions: (a) Response of mortgage rate to a 100bp shock to mortgage rate; (b) Response of housing demand to a 100bp shock to mortgage rate.
Figure 5.
Impulse-response functions: (a) Response of mortgage rate to a 100bp shock to mortgage rate; (b) Response of housing demand to a 100bp shock to mortgage rate.
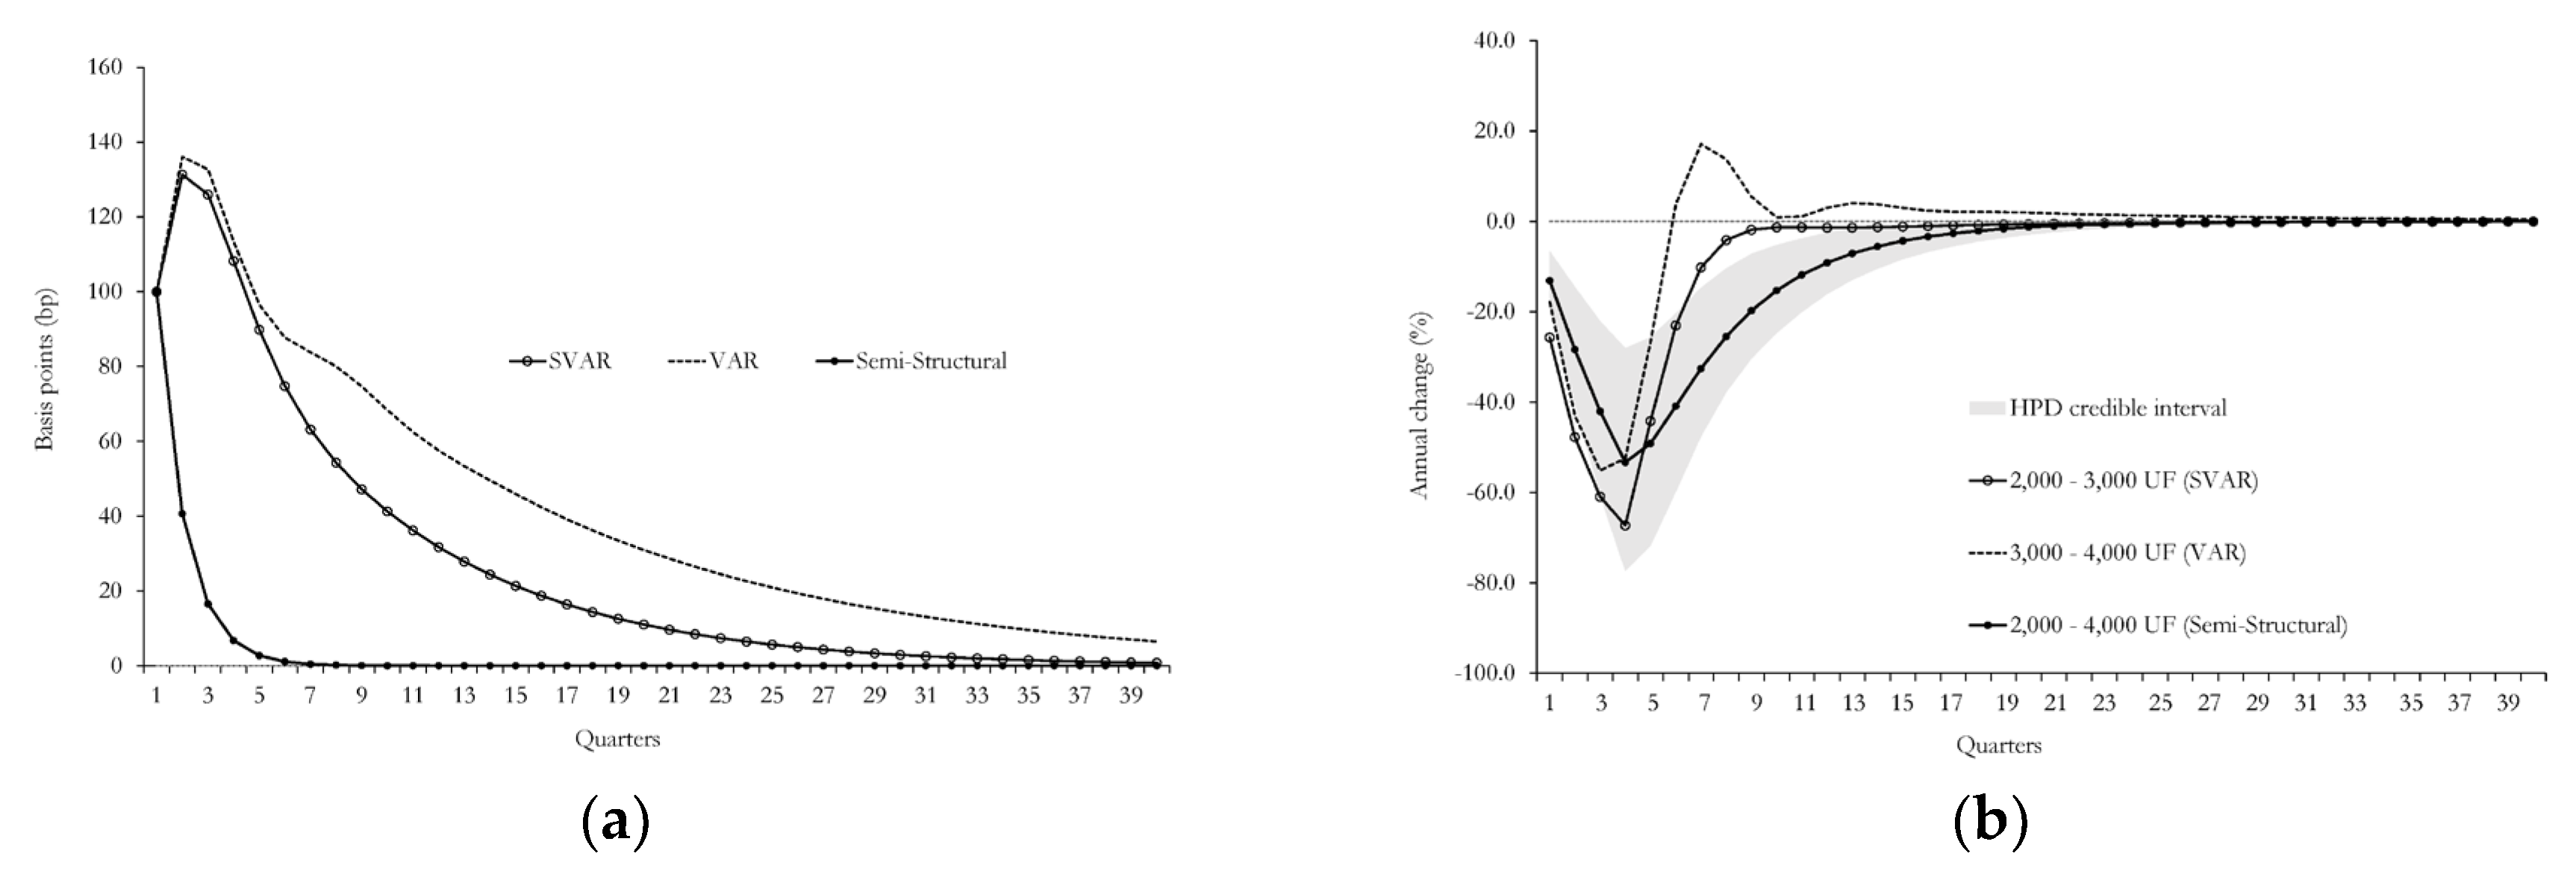
Figure 6.
Cumulative response of housing demand to a 100bp shock to mortgage rate.
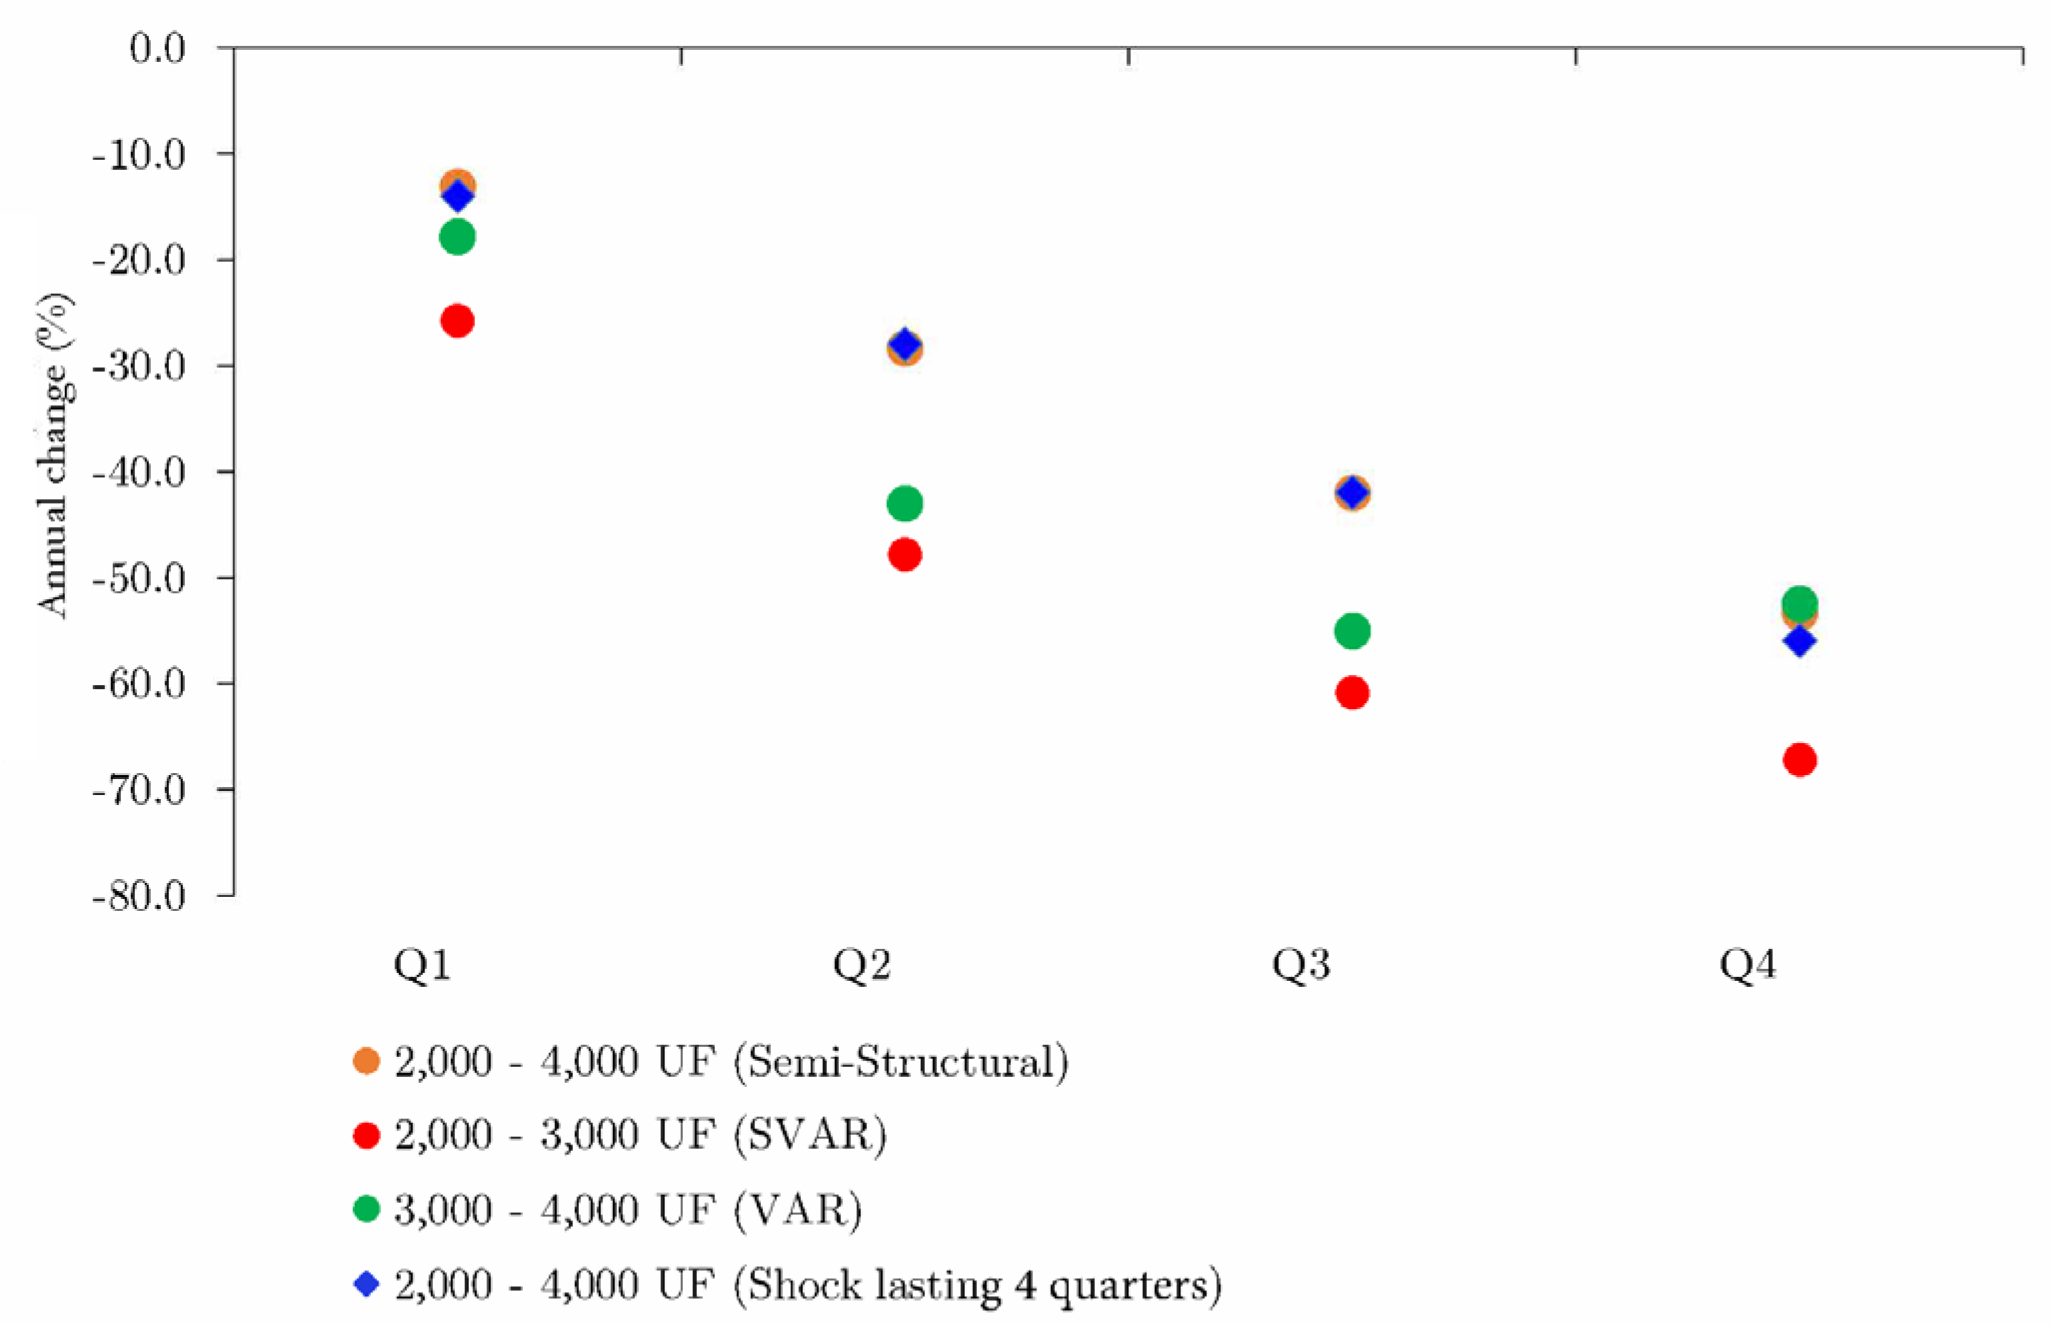
Figure 7.
Impulse-response functions (shock lasting four quarters): (a) Response of mortgage rate to a 100bp shock to mortgage rate; (b) Response of housing demand to a 100bp shock to mortgage rate.
Figure 7.
Impulse-response functions (shock lasting four quarters): (a) Response of mortgage rate to a 100bp shock to mortgage rate; (b) Response of housing demand to a 100bp shock to mortgage rate.
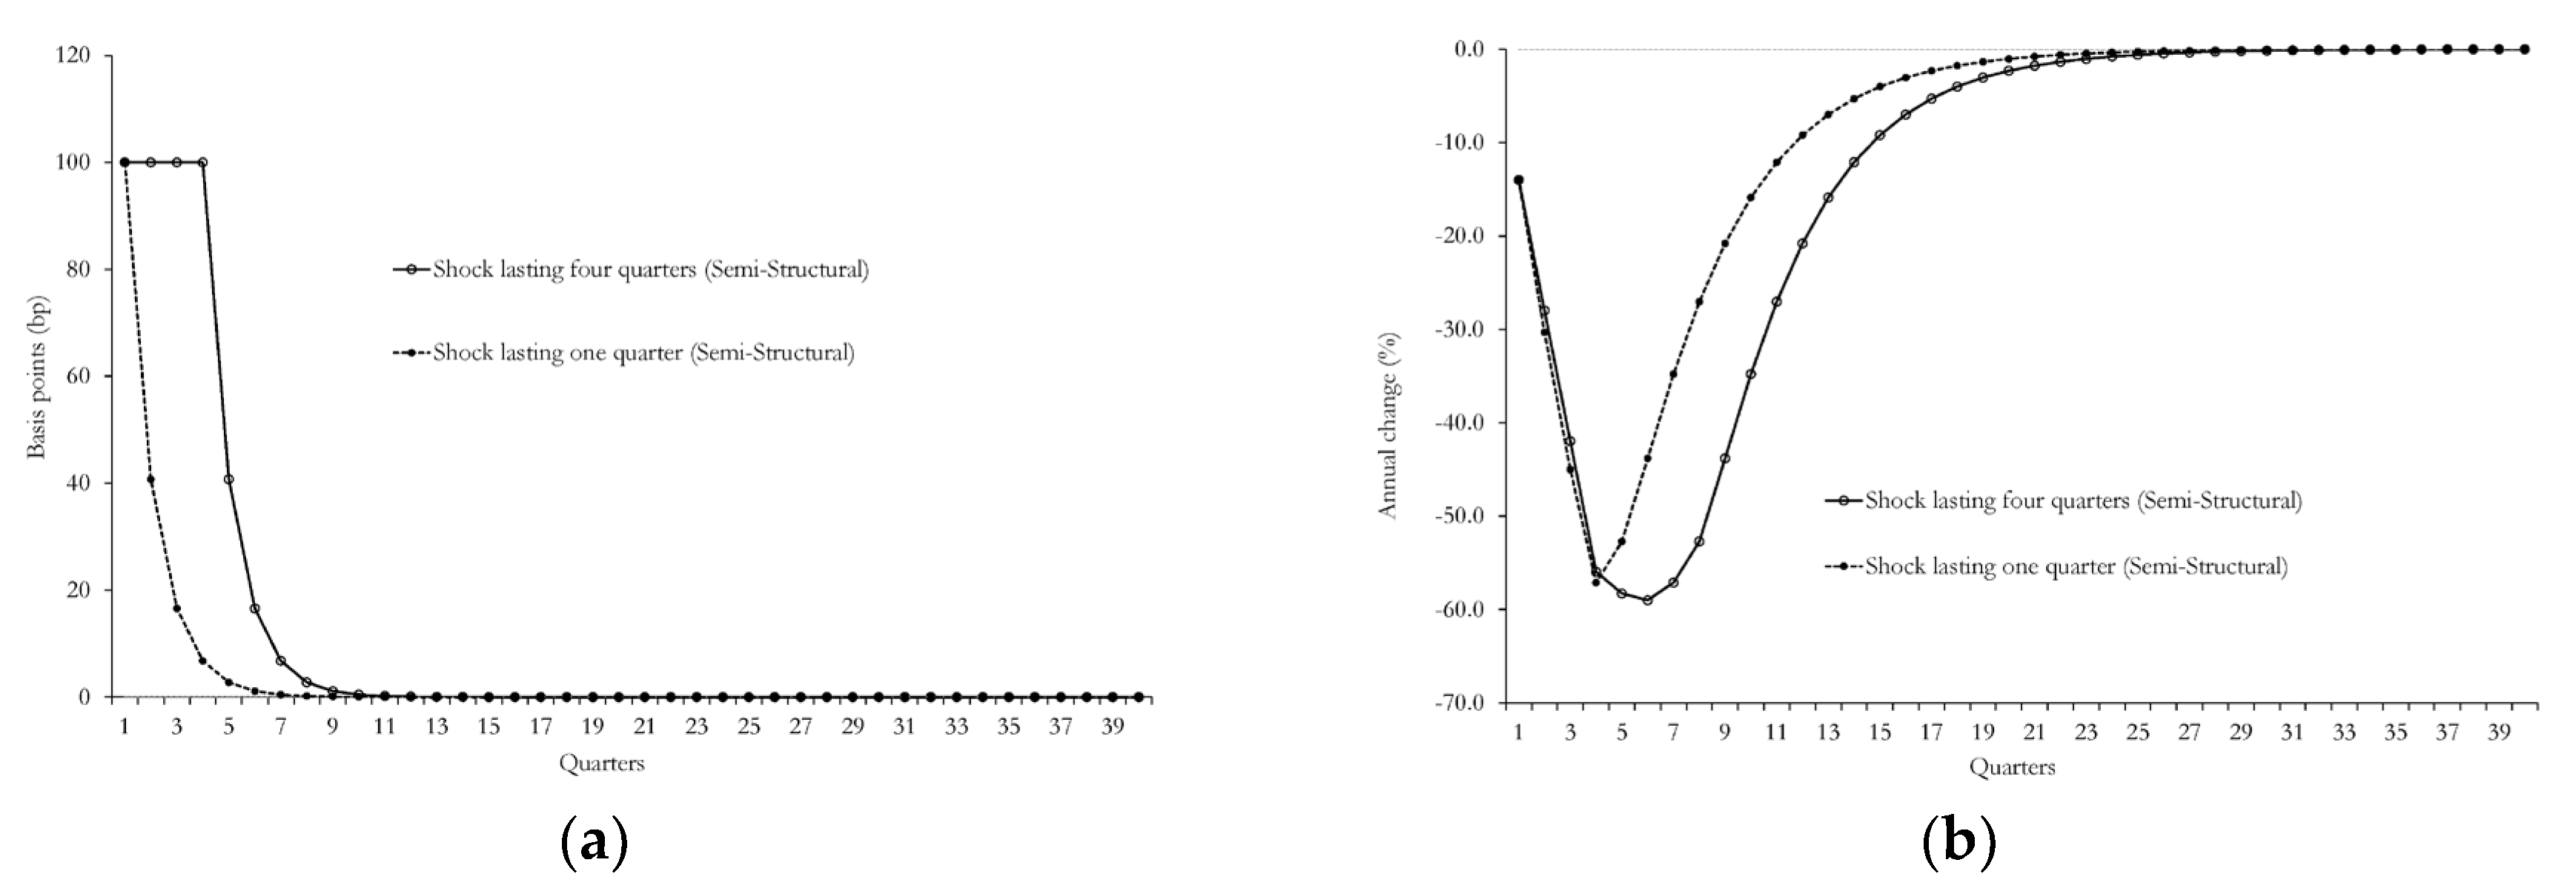
Table 1.
Parameter estimation.
| Parameter | Prior1 | Post. (avg) | CI HPD (90%) | Dist. (prior) |
|---|---|---|---|---|
| φ | 0.9 | 0.9009 | 0.8852 - 0.9178 | Beta |
| α | 0.7 | 0.7578 | 0.6808 - 0.8330 | Beta |
| γ | 0.2 | 0.1323 | 0.0697 - 0.1924 | Beta |
| ρR | 0.4 | 0.4062 | 0.3896 - 0.4230 | Beta |
| ρV | 0.2 | 0.5452 | 0.3555 - 0.7213 | Beta |
| σμR | 0.5 | 0.3848 | 0.3133 - 0.4560 | Inv. Gamma |
| σμV | 0.5 | 0.2791 | 0.2257 - 0.3391 | Inv. Gamma |
1 Based on preliminary GMM estimates.
Table 2.
Estimated housing demand response to a 100bp decrease in mortgage rates.
| Model | Price segment | 1st quarter | 4th quarter |
|---|---|---|---|
| Shock lasting one quarter |
|||
| SVAR | 2,000 – 3,000 UF | 25.70 | 67.28 |
| VAR | 3,000 – 4,000 UF | 17.84 | 52.46 |
| Semi-structural | 2,000 – 4,000 UF | 13.11 | 53.31 |
| Shock lasting four quarters |
|||
| Semi-structural | 2,000 – 4,000 UF | 13.99 | 55.95 |
| Average: | 17.66 | 57.25 | |
Table 3.
Estimated housing demand response to a 200bp decrease in mortgage rates.
| Model | Price segment | 1st quarter | 4th quarter | ||
|---|---|---|---|---|---|
| P25 | P50 | P25 | P50 | ||
| Shock lasting one quarter |
|||||
| SVAR | 2,000 – 3,000 UF | 41.64 | 51.41 | 91.88 | 134.55 |
| VAR | 3,000 – 4,000 UF | 22.75 | 35.68 | 73.98 | 104.93 |
| Semi-structural | 2,000 – 4,000 UF | 22.16 | 26.22 | 89.69 | 106.61 |
| Shock lasting four quarters |
|||||
| Semi-structural | 2,000 – 4,000 UF | 23.91 | 27.97 | 94.98 | 111.90 |
| Average: | 28.86 | 35.32 | 87.63 | 114.50 | |
Disclaimer/Publisher’s Note: The statements, opinions and data contained in all publications are solely those of the individual author(s) and contributor(s) and not of MDPI and/or the editor(s). MDPI and/or the editor(s) disclaim responsibility for any injury to people or property resulting from any ideas, methods, instructions or products referred to in the content. |
© 2025 by the authors. Licensee MDPI, Basel, Switzerland. This article is an open access article distributed under the terms and conditions of the Creative Commons Attribution (CC BY) license (http://creativecommons.org/licenses/by/4.0/).
Copyright: This open access article is published under a Creative Commons CC BY 4.0 license, which permit the free download, distribution, and reuse, provided that the author and preprint are cited in any reuse.


