Submitted:
27 May 2025
Posted:
28 May 2025
You are already at the latest version
Abstract
Trans fatty acids (TFAs) pose significant health risks, including cardiovascular disease and metabolic disorders. However, accurate TFA analysis remains challenging due to complex isomerism, trace concentrations, and methodological limitations in Flame Ionization Detector. In this study, we developed a high-sensitive and high-throughput GC-MS method to simultaneously determine 23 TFA isomers. The method validation demonstrated good sensitivity, linearity, accuracy, and precision. Based on the proposed method, we analyzed 170 edible oil samples and systematically compared 11 common edible oils, establishing a comprehensive TFA profile for each type. Ruminant fats (beef tallow, mutton tallow, butter) had high TFA levels (0.8-4.8 g/100g), dominated by vaccenic acid (C18:1 t11) and CLA, while vegetable oils (soybean, Corn, peanut and sesame oil) exhibited lower concentrations (0.5–2.2 g/100g), especially TMUFA. Particularly, soybean oil was rich in C18:3 isomers, while shortening presented the closest similarity to sesame oil. Cluster analysis distinguished oils by TFA composition, highlighting low-TFA clusters (sunflower oil, pork lard, cream). In conclusion, our study provides technical methods and data support for the quality safety evaluation and risk assessment of edible oils.
Keywords:
simultaneous determination
; trans fatty acids
; edible oils
; GC-MS
1. Introduction
Trans fatty acids (TFAs) are a class of unsaturated fatty acids characterized by the presence of one or more double bonds in the trans configuration. Naturally occurring unsaturated fatty acids predominantly adopt the cis configuration, while TFAs exist in small quantities in ruminant-derived products (e.g., beef, lamb, and dairy) due to microbial hydrogenation in the rumen [1, 2]. In contrast, industrially processed fats, such as partially hydrogenated vegetable oils (PHOs) found in margarine and shortening, contain significantly higher proportions of TFAs [3]. The trans configuration confers a more linear molecular structure, enabling tighter packing and higher melting points compared to their cis counterparts (e.g., elaidic acid trans-C18:1 melts at 44°C, whereas oleic acid cis-C18:1 melts at 13°C). Due to these physicochemical properties, TFAs incorporated into biological membranes reduce membrane fluidity, leading to impaired blood-brain barrier permeability, mitochondrial dysfunction, neuronal membrane abnormalities [4-7]. Furthermore, TFAs competitively inhibit the metabolism of essential fatty acids, disrupting lipid metabolic pathways. This interference results in altered membrane phospholipid composition, dysregulated neurotransmitter synthesis and release, lipoprotein metabolism disorders [6]. Clinically, TFA consumption is associated with elevated cardiovascular risk, metabolic disturbances, and chronic inflammation [5, 6, 8, 9]. The World Health Organization (WHO) reports that each 2% of energy intake from TFAs was associated with a 23% increase in cardiovascular disease risk [10]. Consequently, the WHO has mandated the global elimination of industrial TFAs by 2023, restricting their content to <2% of total fats [10].
The comprehensive and accurate quantification of fatty acids in edible oils presents significant challenges due to the vast diversity of fatty acid species and their wide concentration ranges [11]. Currently, gas chromatography with flame ionization detection (GC-FID) remains the predominant analytical approach. While this method enables rapid quantification of major fatty acids through area normalization, it faces considerable limitations in separating various isomers, including cis/trans isomers and double-bond positional isomers [12]. Even when employing strongly polar 100-m capillary columns, baseline separation of all isomers remains unachievable. Particular difficulties arise in the analysis of trans fatty acids (TFAs), which typically exist at trace levels below the detection limit of FID. Furthermore, their coexistence with abundant fatty acids often leads to column overload or peak coelution issues. To improve resolution, some studies have employed combined separation strategies. Dual temperature programs on the same column [13], sequential analysis using different chromatographic columns [14, 15], or silver-ion thin layer chromatography (Ag+-TLC) prefractionation prior to GC analysis [16-18], etc. have been applied and discussed. While these approaches enhance separation of multiple trans isomers, they complicate the integration of complete fatty acid profiling data [11]. To address sensitivity limitations, mass spectrometry (MS) detection has become essential. However, MS quantification requires individual calibration curves for each compound based on characteristic ions, significantly increasing method development workload compared to the rapid area normalization approach possible with FID.
The content of TFAs in edible oils exhibits significant variation depending on oil type and processing methods (e.g., refining, hydrogenation). Naturally processed palm oil contains negligible TFAs, while virgin olive oil maintains exceptionally low levels [19]. In common vegetable oils (soybean, corn, and rapeseed oils), TFAs typically constitute 0.1%–2% of total fatty acids [20]. Industrial hydrogenated vegetable oils, such as shortening and margarine, are commonly assumed to contain elevated levels of TFAs. C18:1 t9 (elaidic acid) was identified as the predominant TFA isomer in hydrogenated oils [21]. Trace amounts of C16:1 trans isomers were also detected in these products, with concentrations consistently below 0.3% of total fatty acids, while these C16:1 trans isomers were absent in non-hydrogenated vegetable oils [20]. Notably, significant variations in TFA content exist due to differences in processing technologies [22]. Ruminant-derived fats (e.g., beef tallow, lamb fat, and butter) contain 2%-9% TFAs due to microbial hydrogenation in the rumen [23]. Among the TFAs present in natural animal fats, C18:1 t11 constitute the predominant fraction, accounting for over 50%-80% of total TFAs [24]. C18:2 and C18:3 trans isomers, which demonstrate notable functional properties as polyunsaturated fatty acids, are also abundance in edible oils [21], and C18:2 c9t11 (conjugated linoleic acid, CLA) is characteristically found in animal-derived fats.
However, the lack of standardized detection methods, particularly the limited and inconsistent coverage of TFAs species analyzed across studies, has resulted in fragmented historical data. Furthermore, the insufficient sensitivity of conventional GC-FID methods has led to the under-detection of many low-abundance TFAs. These methodological limitations have posed significant challenges for comprehensive characterization and systematic evaluation of TFAs in edible oils. Therefore, this study established a GC-MS method for simultaneous detection of 23 TFA species with both high sensitivity and high throughput. Using this optimized approach, we performed quantitative analysis of TFAs in 11 commonly consumed edible oils and constructed their corresponding fingerprint profiles.
2. Materials and Methods
2.1. Chemicals and Reagents
Methanol and n-hexane (all HPLC grade) were obtained from Fisher Scientific. Ethanol (purity ≥ 95%), NaOH (purity ≥ 95%), and acetyl chloride (purity > 99.5%) were purchased from Sinopharm Chemical Reagent Co., Ltd. Ultrapure water was prepared using a Milli-Q purification system (Millipore).
The reference standards used in this study were as follows: FAME solution GLC 674 from Nu-Chek Prep; 37-FAME-Mix from Alta Scientific; 2-CLA FAME-mix (C18:2 cis-9,trans-11 and C18:2 trans-10,cis-12), 4-C18:2 FAME-mix (C18:2 trans-9,cis-12, C18:2 cis-9,trans-12, C18:2 trans-9,trans-12, C18:2 cis-9,cis-12), and 8-C18:3 FAME-mix (C18:3 trans-9,trans-12,trans-15, C18:3 trans-9,trans-12,cis-15, C18:3 trans-9,cis-12,trans-15, C18:3 cis-9,cis-12,trans-15, C18:3 cis-9,trans-12,trans-15, C18:3 cis-9,trans-12,cis-15, C18:3 trans-9,cis-12,cis-15, C18:3 cis-9,cis-12,cis-15) were all purchased from ANPEL. The internal standard C10:1 cis-4 FA individual standard was obtained from Macklin.
2.2. Samples Collection
This study collected a total of 170 batches of 11 commonly consumed edible oils for analysis, including 18 batches of peanut oil from local markets in Shandong, China and 4 batches from open fair in Shandong; 15 batches of corn oil from local markets in Shandong, Shanghai and Guangdong, China; 13 batches of soybean oil from local markets in Shandong and Shanghai, China; 14 batches of sesame oil from local markets in Shandong, China and 3 batches from local open fair in Shandong; 12 batches of sunflower oil from local markets in Shandong, Tianjin and Jiangsu, China along with 2 batches from local open fair in Shandong; 18 batches of lard from local markets in Shandong, Fujian and Jiangsu, China; 11 batches of beef tallow from local markets in Henan and Chongqing, China; 10 batches of mutton tallow from local markets in Shandong and Henan, China together with 2 batches from local open fair in Shandong; 17 batches of cream from local markets in Shandong, Jiangsu and Guangdong, China; 2 batches of butter from Air Canada flights (brands: Lurpak and Saputo) and 18 batches from local markets in Shandong, Hebei and Shanghai, China; and 11 batches of shortening from local markets in Guangdong and Tianjin, China. All samples were stored at -20°C.
2.3. Sample Preparation
The frozen samples were completely thawed at room temperature prior to analysis. Lipid extraction and methyl esterification were performed according to the method described by Wang [11], with subsequent analysis of the resulting FAMEs by GC-MS.
Briefly, approximately 0.5 g of sample was weighed, and dissolved in 5 ml of n-hexane by vortex mixing. Internal standard C10:1 cis-4 FA was then added. Three methylation approaches were comparatively evaluated: (a) base methylation,: 2 mL of 2% sodium hydroxide-methanol solution was added, followed by sealing and incubation at 50°C for 15 min; (b) acid methylation: 2 mL of 10% acetyl chloride-methanol solution was added, followed by sealing and incubation at 90°C for 150 min; (c) base and acid methylation: initial treatment with base methylation, followed by the acid methylation after cooling.
After methylation, the samples were cooled to room temperature, followed by sequential addition of 5 ml n-hexane and 5 ml water along the tube wall. After phase separation, the n-hexane layer was collected, and subsequently diluted and analyzed by GC-MS.
2.4. GC-MS Detection
FAMEs were analyzed using an Agilent 7890B GC system equipped with a 5977 MS detector (Agilent Technologies) and a capillary CP-Sil 88 column (100 m × 0.25 mm × 0.2 μm). The injection volume was 1 μL, and the split ratio was 10:1. Helium was employed as the carrier gas with a total run time of 165 min. The pressure was controlled using a programmed pressure-variable mode: maintained at 38 psi from 0-75 min, decreased to 26 psi from 75-81 min, held at 26 psi from 81-111 min, increased back to 38 psi from 111-114 min, and finally maintained at 38 psi from 114-165 min. The inlet temperature was 270°C, and the oven temperature had the following program: 100°C held for 8 min, increased by 4°C/min to 120°C, held for 8 min and increased by 4°C/min to 160°C, held for 35 min and increased by 0.2°C/min to 170°C, and then increased by 1°C/min to 180°C, and increased by 2°C/min to 210°C, held for 15 min and increased by 20°C/min to 230°C, held for 8 min. The temperature of the transfer line was set to 250°C, and the solvent delay was 40 min.
The temperature of the MS ion source was set to 230°C, and the ionizing energy was 70 eV. Qualitative and quantitative analyses of FAME were performed in the selected ion monitoring mode (Table 1). Peak identification of FAME was based on retention time and the characteristic ions, including 1 quantitative ion and 3 qualitative ions. Based on the peak area of the quantitative ion, FAME quantification was performed using standard curves of each external standard and calibrated using the internal standard. To improve sensitivity, the quantitative ion of each FAME was selected at the best signal-to-noise ratio, and the runtime was divided into 9 time windows to scan the selected characteristic ions, in which the dwell time of each ion was >8 ms, and the scanning frequency was >4.1 cycle/s. The quantification results were expressed as absolute contents, with individual fatty acids reported in g/kg and their total sum reported in g/100g.
2.5. Method Validation
Sensitivity, linearity, accuracy, and precision were involved in validating the method (ICH, 2005). Sensitivity was calculated from the concentrations with signal-to-noise ratios (SNR) of 3 and 10, and expressed as the limit of detection (LOD) and quantitation (LOQ), respectively. The standard curve and linear range for each FAME were established, and at least 6 different concentrations were used to determine the regression equation. In this study, we initially conducted preliminary analyses on 11 sample matrices to identify the absent TFA species. Subsequently, a standardized mixture containing 23 TFA reference standards (each at three different concentration levels) was added to all samples. The accuracy and precision of the proposed method were then evaluated by calculating the recoveries and variation coefficients of the previously absent TFAs.
2.6. Statistical Analysis
The data were analyzed and sorted using Excel 2023. Principal component analysis (PCA) was performed using GraphPad Prism 9 (GraphPad Software). Heatmap clusters were analyzed using the Omic share tools at Gene Nenovo website (https://www.omicshare.com/tools/).
3. RESULTS AND DISCUSSION
3.1. Chromatographic Separation of 23 Kinds of TFAMEs
In this study, chromatographic separation was achieved using a 100-m CP Sil-88 column with programmed pressure and a carefully optimized temperature gradient, resulting in a total analysis time of 165 minutes. These conditions significantly improved column efficiency and chromatographic resolution, almost achieving the baseline separation of all FAMEs, including cis, trans, and branched-chain isomers. As illustrated in Figure 1a, the proposed method successfully achieved simultaneous chromatographic separation of 23 common TFAMEs,including 11 monounsaturated trans-FAMEs (C14-C22), 5 C18:2 FAME isomers and 7 C18:3 FAME isomers.
Notably, only one co-elution peak was observed among these 23 TFAMEs, corresponding to C18:3 t9t12c15 and C18:3 t9c12t15 (Figure 1c). These particular C18:3 isomers presented analytical challenges due to their nearly identical retention times and shared characteristic ions, as reported in previous studies [25, 26]. In this study, they were quantified using peak summation. Moreover, while C19:1 t10 and C18:2 c9c12 FAMEs exhibited similar retention times in chromatographic separation (Figure 1a), as did C20:1 t11 and C18:3 c9c12c15 FAMEs, effective resolution of these critical isomer pairs was successfully achieved through selective ion monitoring (Figure 1c). It should be noted that C18 FAMEs exhibit particularly complex isomerism with closely related physicochemical properties, potentially leading to additional co-elution phenomena [25]. However, the commercial unavailability of certain standards (particularly for FA or FAME isomers such as C18:1 t10) limited complete identification and may potentially lead to co-elution or misjudgment in practical analyses.
3.2. Method Validation
To enhance signal response, a multi-window scanning mode was employed in mass spectrometric detection, which optimally increased the dwell time of characteristic ions while maintaining appropriate scanning frequency, thereby significantly improving instrument sensitivity. As presented in Table 1, the method achieved quantification limits of 10 µg/mL for 9 TFAMEs, 20 µg/mL for 9 compounds, 30 µg/mL for 3 species, 40 µg/mL for 1 compound, and 60 µg/mL for 3 analytes (including the co-eluting compounds C18:3 t9t12c15 and C18:3 t9c12t15). With a 500-fold dilution factor employed in sample preparation, the corresponding quantification ranges in original samples were 0.001-0.006 g/100 g. Compared with previous reports [11, 25], the current method demonstrates improved sensitivity. Furthermore, the detection sensitivity could be further enhanced by adjusting the dilution factor according to specific analytical requirements.
To meet the analytical requirements of sample detection, the linear ranges of the calibration curves were carefully optimized according to the typical concentration levels of each fatty acid. For low-abundance TFAs such as C14:1 t9, the linear range was set at 5-250 ppb, while for more abundant species like C18:1 t11, an extended range of 30-6000 ppb was selected. This selection of the linear range significantly improved the accuracy of quantitative analysis. As shown in Table 1, all examined TFAs demonstrated excellent linearity with coefficient of determination (R2) values exceeding 0.999 for their respective regression equations, indicating superior fitting of the calibration curves.
A preliminary screening of TFAs was conducted in 11 commonly consumed edible oils to confirm the absence of detectable TFAs. For method validation, recovery experiments were performed using one sunflower oil and one lard sample spiked with a FAME mixed standard at three concentration levels. Triplicate analyses were conducted for each spiked sample, with the proportional composition of FAMEs matching the available standard mixture. As summarized in Table 2, the proposed method demonstrated good accuracy and precision, with recoveries ranging from 75.4% to 92.6% and coefficients of variation (CVs) between 2.8% and 9.1%.
3.3. The Profile of TFAs in Edible Oil
Analysis of 170 samples established comprehensive TFA profiles comprising 23 species across 11 commonly consumed edible oils (Table 3). Among the five vegetable oils examined, monounsaturated TFAs occurred at relatively low levels and were exclusively represented by C18:1 t9 and C18:1 t11. Sesame oil exhibited significantly higher C18:1 t9 content, resulting in greater total monounsaturated TFA content compared to other vegetable oils, which is consistent with previous reports [20]. The C18:2 trans fatty acids constituted a predominant proportion of total TFAs in vegetable oils, with C18:2 c9t12 and C18:2 t9c12 being the major isomers, with no detectable CLA (C18:2 c9t11 and C18:2 t10c12). Corn oil contained markedly elevated total C18:2 TFA levels versus other vegetable oils, aligning with literature data [20]. Substantial variability was observed for C18:3 TFAs, with soybean oil demonstrating particularly high concentrations of C18:3 c9c12t15 and C18:3 t9c12c15, leading to significantly greater total C18:3 TFA content. Total TFA concentrations across vegetable oils ranged from 0.5-2.2 g/100g, with sunflower oil consistently showing the lowest values for all TFA categories (monounsaturated, C18:2, and C18:3 isomers), in agreement with published data [20].
Animal fats exhibited greater diversity and higher concentrations of TFAs compared to vegetable oils. Ruminant-derived fats (beef tallow, mutton tallow, and butter) contained exceptionally high levels of monounsaturated TFAs, predominantly contributed by C18:1 t11 (vaccenic acid). The total content of C18:2 TFAs was comparable between animal and vegetable fats. However, a striking distinction was observed in their isomeric composition: animal fats predominantly contained CLA isomers, whereas vegetable oils exclusively comprised non-conjugated C18:2 trans isomers (e.g., C18:2 c9t12 and C18:2 t9c12), with no detectable CLA. Notably, C18:2 t10c12 was exclusively detected in bovine-derived products (beef tallow, butter, and cream). The C18:3 TFA content showed similar quantitative ranges but greater species variability in animal fats, likely reflecting the complex biohydrogenation pathways mediated by rumen microbiota [27]. Total TFA concentrations in animal fats ranged from 0.8-4.8 g/100g, with cream and pork lard showing significantly lower values. This reduction in cream can be attributed to its high water content, while the lower TFA levels in pork lard may reflect the absence of microbial biohydrogenation in monogastric pigs, whose fatty acid profiles primarily derive from dietary sources rather than endogenous microbial synthesis.
Notably, shortening, a hydrogenated vegetable oil product, did not demonstrate significantly higher TFA content than conventional vegetable oils, showing only increased diversity and concentration of monounsaturated TFAs (e.g., C16:1 t9). This observation likely reflects the industrial transition from traditional partial hydrogenation (which generates TFAs) to modern processing technologies such as complete hydrogenation and interesterification [28], resulting in higher saturation levels rather than trans-isomer formation.
Overall, ruminant-derived fats (beef tallow, mutton tallow, and butter) exhibited significantly higher TFA content, while sunflower oil and pork lard presented lower content on the contrary. Given the dualistic biological effects of polyunsaturated fatty acids (PUFAs) such as C18:2 and C18:3 - which exhibit both beneficial and adverse health impacts - these compounds were excluded from TFA risk assessment. When evaluating only monounsaturated TFAs, soybean, corn, and sunflower oils demonstrated significantly lower concentrations (<0.05g/100g of total fatty acids) compared to other oil types.
3.4. Cluster Analysis
Based on the TFA profiling results, cluster analysis was performed for the 11 common edible oils. As illustrated in Figure 2, beef tallow, mutton tallow, and butter exhibited similar TFA compositions that were markedly distinct from other tested oils, characterized by significantly higher levels of monounsaturated TFAs along with elevated contents of CLA and C18:2 t9t12. Soybean oil formed a separate cluster primarily due to its uniquely high C18:3 TFA content. Corn oil, peanut oil, and sesame oil showed comparable TFA profiles, with shortening demonstrating the closest similarity to sesame oil. In contrast, pork lard, cream, and sunflower oil were grouped together, distinguished from other oils by their consistently low concentrations across all TFA categories.
4. Conclusions
This study developed a sensitive GC-MS method for simultaneous analysis of 23 TFA isomers, achieving superior chromatographic separation and quantitation limits. The method validation demonstrated good sensitivity, linearity, accuracy, and precision, fully meeting the analytical requirements for practical sample detection. Based on the proposed method, we analyzed 170 edible oil samples and constructed TFA profiles for 11 common edible oils. Ruminant fats (beef tallow, mutton tallow, butter) had high TFA levels (0.8-4.8 g/100g), dominated by vaccenic acid (C18:1 t11) and CLA, while vegetable oils (soybean, Corn, peanut and sesame oil) exhibited lower concentrations (0.5–2.2 g/100g), especially TMUFA. Particularly, soybean oil was rich in C18:3 isomers, while shortening presented the closest similarity to sesame oil. Cluster analysis distinguished oils by TFA composition, highlighting low-TFA clusters (sunflower oil, pork lard, cream). In conclusion, our study provides technical methods and data support for the quality safety evaluation and risk assessment of edible oils.
Acknowledgments
This study was funded by the Central Guiding Local Science and Technology Development Special Fund Project (YDZX2024015, YDZX2023006); the Key Innovation Project of Qilu University of Technology (Shandong Academy of Sciences) (2024ZDZX03); and the 2023 Provincial Key R&D Plan (Rural Revitalization Science and Technology Innovation Boosting Action Plan(2023TZXD003).
References
- Lock, A.L.; Parodi, P.W.; Bauman, D.E. The Biology of Trans Fatty Acids: Implications for Human Health and the Dairy Industry. Aust. J. Dairy Technol. 2005, 60, 134–142. [Google Scholar]
- Enjalbert, F.; Zened, A.; Cauquil, L.; Meynadier, A. Integrating Data from Spontaneous and Induced trans-10 Shift of Ruminal Biohydrogenation Reveals Discriminant Bacterial Community Changes at the OTU Level. Front. Microbiol. 2023, 13, 1012341. [Google Scholar] [CrossRef]
- Niforou, A.; Magriplis, E.; Klinaki, E.; Niforou, K.; Naska, A. On Account of Trans Fatty Acids and Cardiovascular Disease Risk - There Is Still Need to Upgrade the Knowledge and Educate Consumers. Nutr. Metab. Cardiovasc. Dis. 2022, 32, 1811–1818. [Google Scholar] [CrossRef] [PubMed]
- Larqué, E.; García-Ruiz, P.A.; Perez-Llamas, F.; Zamora, S.; Gil, A. Dietary Trans Fatty Acids Alter the Compositions of Microsomes and Mitochondria and the Activities of Microsome Δ6-Fatty Acid Desaturase and Glucose-6-Phosphatase in Livers of Pregnant Rats. J. Nutr. 2003, 133, 2526–2531. [Google Scholar] [CrossRef] [PubMed]
- Harvey, K.A.; Arnold, T.; Rasool, T.; Antalis, C.; Miller, S.J.; Siddiqui, R.A. Trans-Fatty Acids Induce Pro-Inflammatory Responses and Endothelial Cell Dysfunction. Br. J. Nutr. 2008, 99, 723–731. [Google Scholar] [CrossRef]
- Pase, C.S.; Bürger, M.E. Trans Fat Intake and Behavior. In The Molecular Nutrition of Fats; Academic Press, 2019; pp. 189–197. [Google Scholar] [CrossRef]
- Wang, L.; Liu, T.; Guo, J.; Zhao, T.; Tang, H.; Jin, K.; et al. Abnormal Erythrocyte Fatty Acid Composition in First-Diagnosed, Drug-Naïve Patients with Depression. J. Affect. Disord. 2022, 318, 414–422. [Google Scholar] [CrossRef]
- Baer, D.J.; Judd, J.T.; Clevidence, B.A.; Tracy, R.P. Dietary Fatty Acids Affect Plasma Markers of Inflammation in Healthy Men Fed Controlled Diets: A Randomized Crossover Study. Am. J. Clin. Nutr. 2004, 79, 969–973. [Google Scholar] [CrossRef]
- Crupkin, M.; Zambelli, A. Detrimental Impact of Trans Fats on Human Health: Stearic Acid-Rich Fats as Possible Substitutes. Compr. Rev. Food Sci. Food Saf. 2008, 7, 271–279. [Google Scholar] [CrossRef]
- World Health Organization. Policies to Eliminate Industrially Produced Trans-Fat Consumption; WHO/NMH/NHD/18.5; WHO: Geneva, 2018. [Google Scholar]
- Wang, F.; Chen, M.; Luo, R.; et al. Fatty Acid Profiles of Milk from Holstein Cows, Jersey Cows, Buffalos, Yaks, Humans, Goats, Camels, and Donkeys Based on Gas Chromatography–Mass Spectrometry. J. Dairy Sci. 2022, 105, 20750. [Google Scholar] [CrossRef]
- Amores, G.; Virto, M. Total and Free Fatty Acids Analysis in Milk and Dairy Fat. Separations 2019, 6, 14. [Google Scholar] [CrossRef]
- Kramer, J.K.C.; Fellner, V.; Dugan, M.E.R.; Sauer, F.D.; Mossoba, M.M.; Yurawecz, M.P. Evaluating Acid and Base Catalysts in the Methylation of Milk and Rumen Fatty Acids with Special Emphasis on Conjugated Dienes and Total Trans Fatty Acids. Lipids 1997, 32, 1219–1228. [Google Scholar] [CrossRef] [PubMed]
- Precht, D.; Molkentin, J.; Vahlendieck, M. Influence of the Heating Temperature on the Fat Composition of Milk Fat with Emphasis on cis-/trans-Isomerization. Nahrung 1999, 43, 25–33. [Google Scholar] [CrossRef]
- Bravo-Lamas, L.; Aldai, N.; Kramer, J.K.G.; Barron, L.J.R. Case Study Using Commercial Dairy Sheep Flocks: Comparison of the Fat Nutritional Quality of Milk Produced in Mountain and Valley Farms. LWT-Food Sci. Technol. 2018, 89, 374–380. [Google Scholar] [CrossRef]
- Momchilova, S.M.; Nikolova-Damyanova, B.M. Advances in Silver Ion Chromatography for the Analysis of Fatty Acids and Triacylglycerols - 2001 to 2011. Anal. Sci. 2012, 28, 837–844. [Google Scholar] [CrossRef] [PubMed]
- Precht, D.; Molkentin, J.; Destaillats, F.; Wolff, R.L. Comparative Studies on Individual Isomeric 18:1 Acids in Cow, Goat, and Ewe Milk Fats by Low-Temperature High-Resolution Capillary Gas-Liquid Chromatography. Lipids 2001, 36, 827–832. [Google Scholar] [CrossRef] [PubMed]
- Rodriguez-Alcala, L.M.; Alonso, L.; Fontecha, J. Stability of Fatty Acid Composition after Thermal, High Pressure, and Microwave Processing of Cow Milk as Affected by Polyunsaturated Fatty Acid Concentration. J. Dairy Sci. 2014, 97, 7307–7315. [Google Scholar] [CrossRef]
- Sarwar, S.; Shaheen, N.; Ashraf, M.M.; et al. Fatty Acid Profile Emphasizing Trans-Fatty Acids in Commercially Available Soybean and Palm Oils and Its Probable Intake in Bangladesh. Food Chem. Adv. 2024, 4, 100611. [Google Scholar] [CrossRef]
- Fang, H.; Cao, M.; Zhang, X.; Wang, K.; Deng, T.; Lin, J.; Liu, R.; Wang, X.; Liu, A. The Assessment of Trans Fatty Acid Composition in Edible Oil of Different Brands and Regions in China in 2021. Food Chem. 2021, 345, 128861. [Google Scholar] [CrossRef]
- Ganguly, R.; Pierce, G.N. The Toxicity of Dietary Trans Fats. Food Chem. Toxicol. 2015, 78, 170–176. [Google Scholar] [CrossRef]
- Abramovič, H.; Vidrih, R.; Zlatić, E.; et al. Trans Fatty Acids in Margarines and Shortenings in the Food Supply in Slovenia. J. Food Compos. Anal. 2018, 73, 55–61. [Google Scholar] [CrossRef]
- Field, C.J.; Blewett, H.H.; Proctor, S.; Vine, D. Human Health Benefits of Vaccenic Acid. Appl. Physiol. Nutr. Metab. 2009, 34, 979–991. [Google Scholar] [CrossRef] [PubMed]
- Bassett, C.M.; Edel, A.L.; Patenaude, A.F.; et al. Dietary Vaccenic Acid Has Antiatherogenic Effects in LDLr-/- Mice. J. Nutr. 2010, 140, 18–24. [Google Scholar] [CrossRef] [PubMed]
- Chen, M.; Zhang, Y.; Wang, F.; et al. Simultaneous Determination of C18 Fatty Acids in Milk by GC-MS. Separations 2021, 8, 118. [Google Scholar] [CrossRef]
- Teng, F.; Wang, P.; Yang, L.; Ma, Y.; Day, L. Quantification of Fatty Acids in Human, Cow, Buffalo, Goat, Yak, and Camel Milk Using an Improved One-Step GC-FID Method. Food Anal. Methods 2017, 10, 2881–2891. [Google Scholar] [CrossRef]
- El-Aal, Y.A.A.; Abdel-Fattah, D.M.; Ahmed, K.E.D. Some Biochemical Studies on Trans Fatty Acid-Containing Diet. Diabetes Metab. Syndr. 2019, 13, 1753–1757. [Google Scholar] [CrossRef]
- Mavlanov, U.; Czaja, T.P.; Nuriddinov, S.; et al. The Effects of Industrial Processing and Home Cooking Practices on Trans-Fatty Acid Profiles of Vegetable Oils. Food Chem. 2025, 469, 142571. [Google Scholar] [CrossRef]
Figure 1.
(a) Total ion chromatograms (TIC) of the FAME from mixed standards solution; (b) Selected ion chromatograms (SIC) of C18:2 c9c12 (m/z=67) and C19:1 t10 (m/z=278); (c) Selected ion chromatograms (SIC) of C18:3 t9t12c15 (m/z=67, 79) and C18:3 t9c12t15 (m/z=67, 79); (d) Selected ion chromatograms (SIC) of C18:3 c9c12c15 (m/z=79) and C20:1 t11 (m/z=250). The serial numbers of trans fatty acids in Table 1 are labeled on the chromatograms.
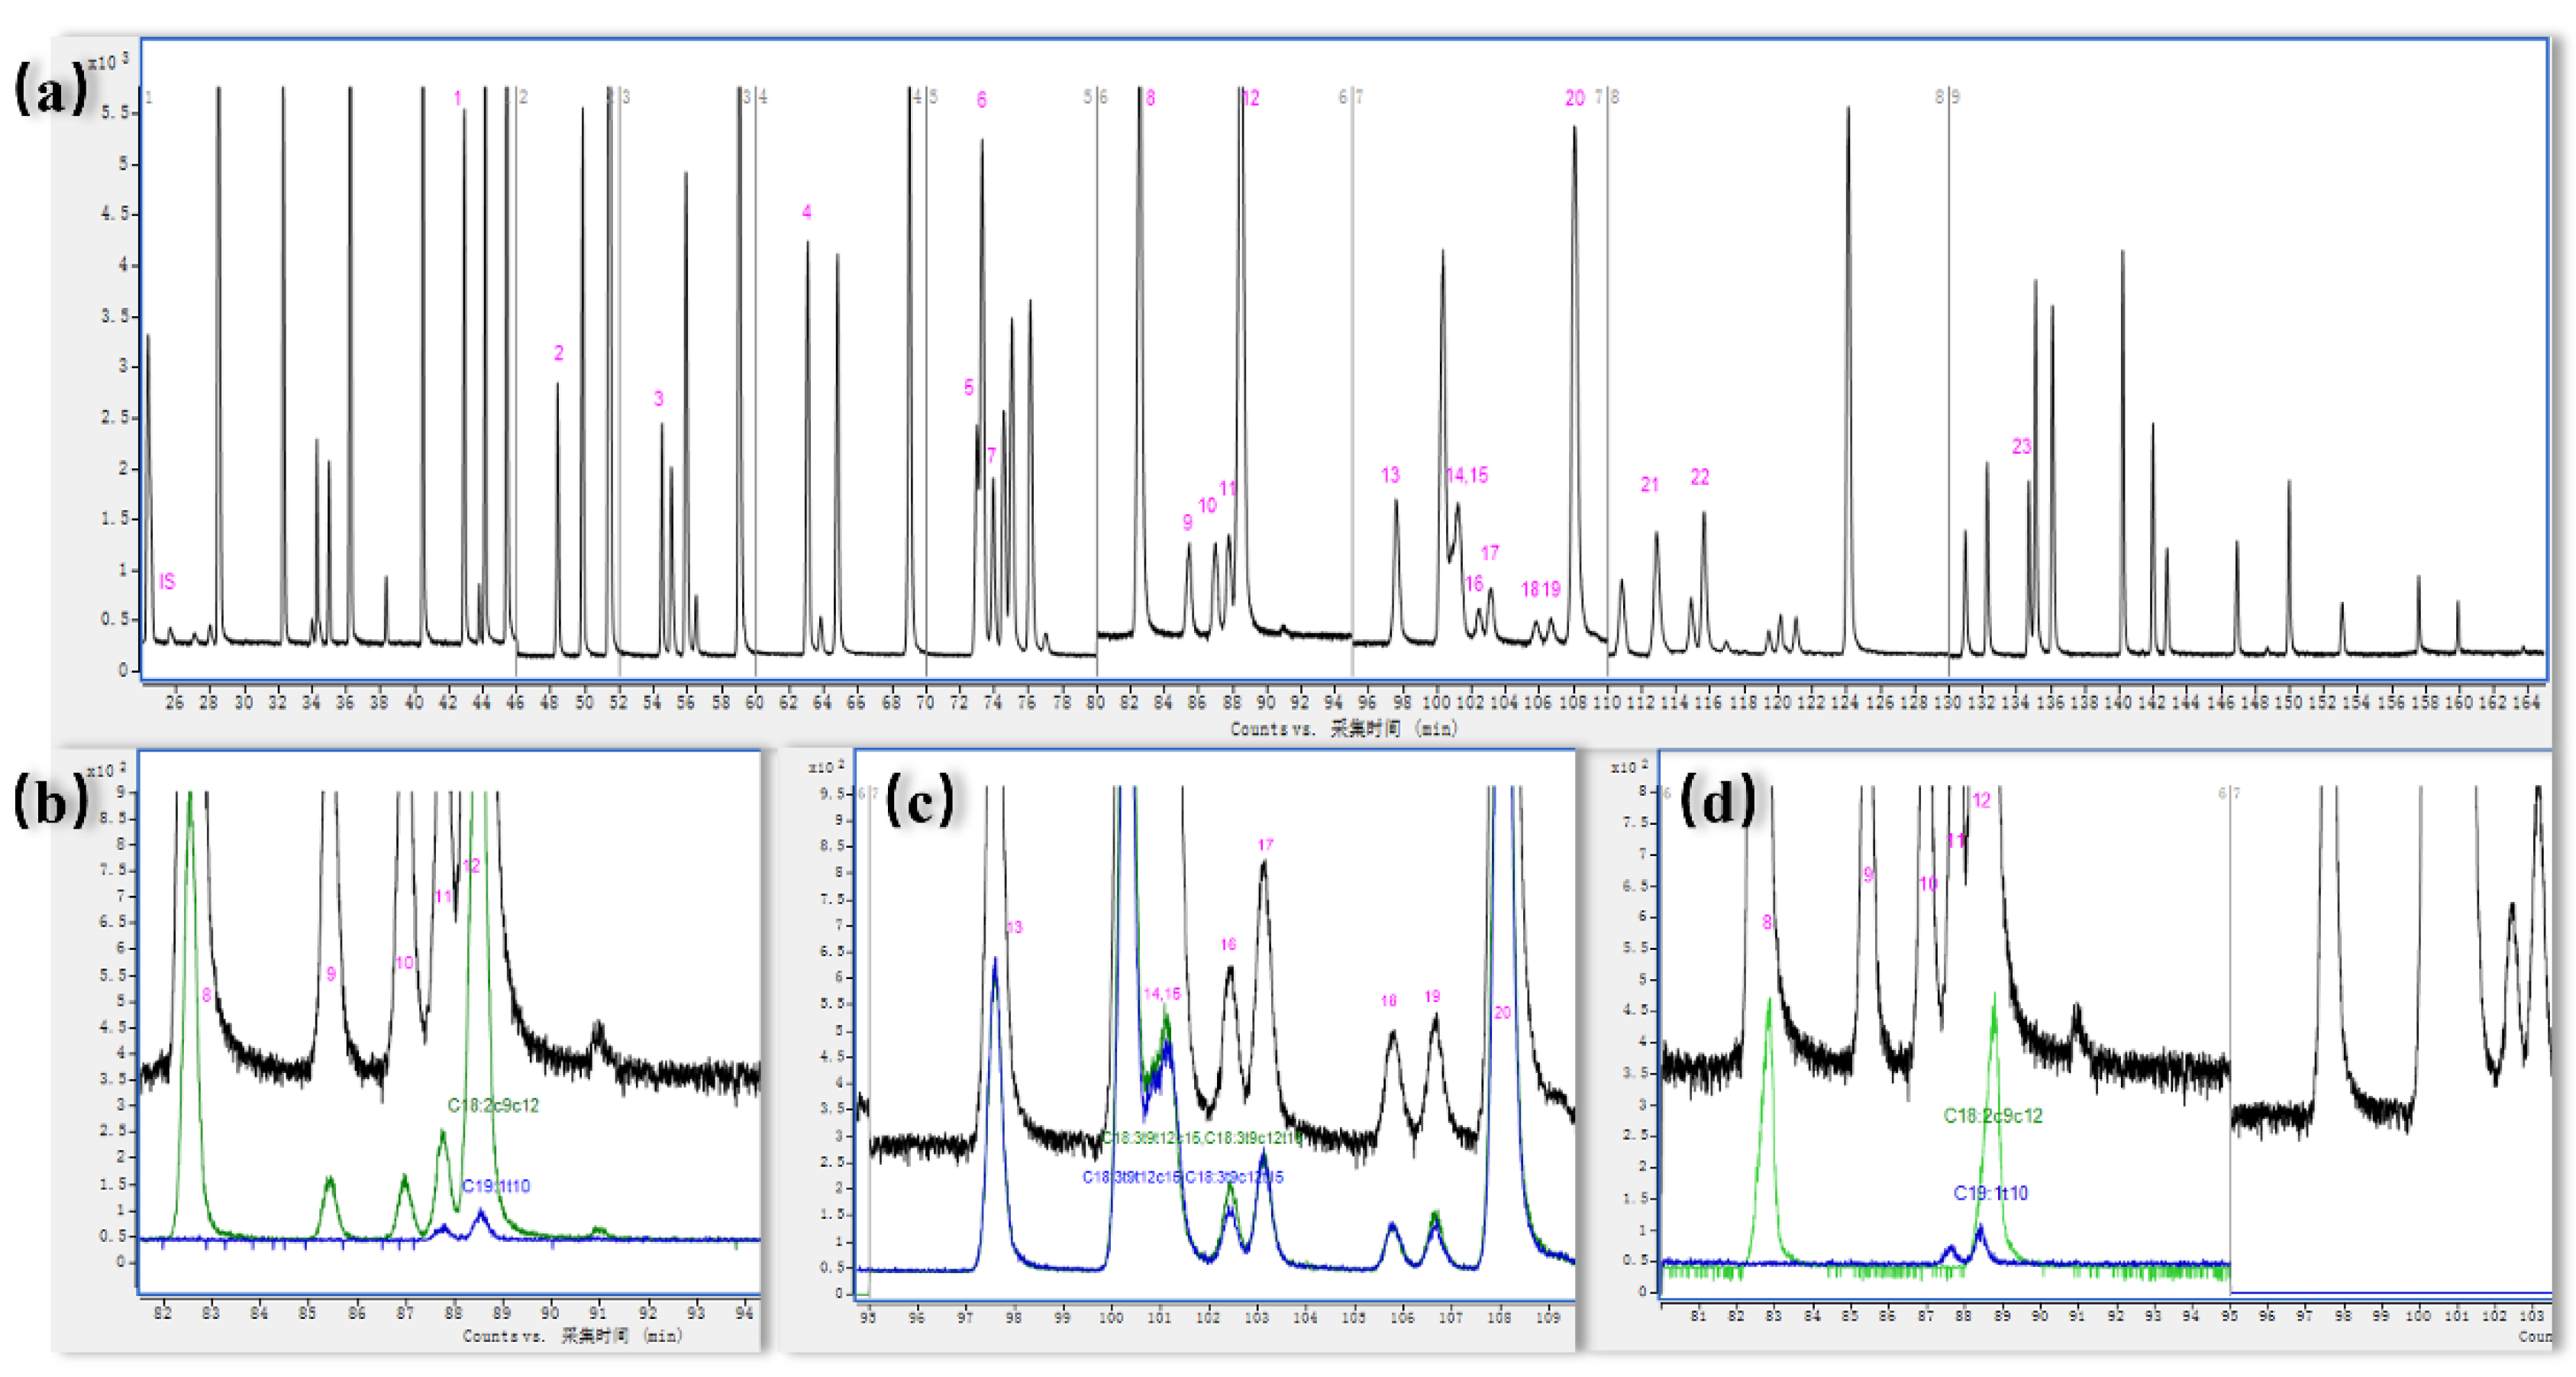
Figure 2.
Heatmap of the trans fatty acids (TFA) in common edible oil samples. c = cis; t = trans; TMUFA = trans monounsaturated fatty acids.
Figure 2.
Heatmap of the trans fatty acids (TFA) in common edible oil samples. c = cis; t = trans; TMUFA = trans monounsaturated fatty acids.
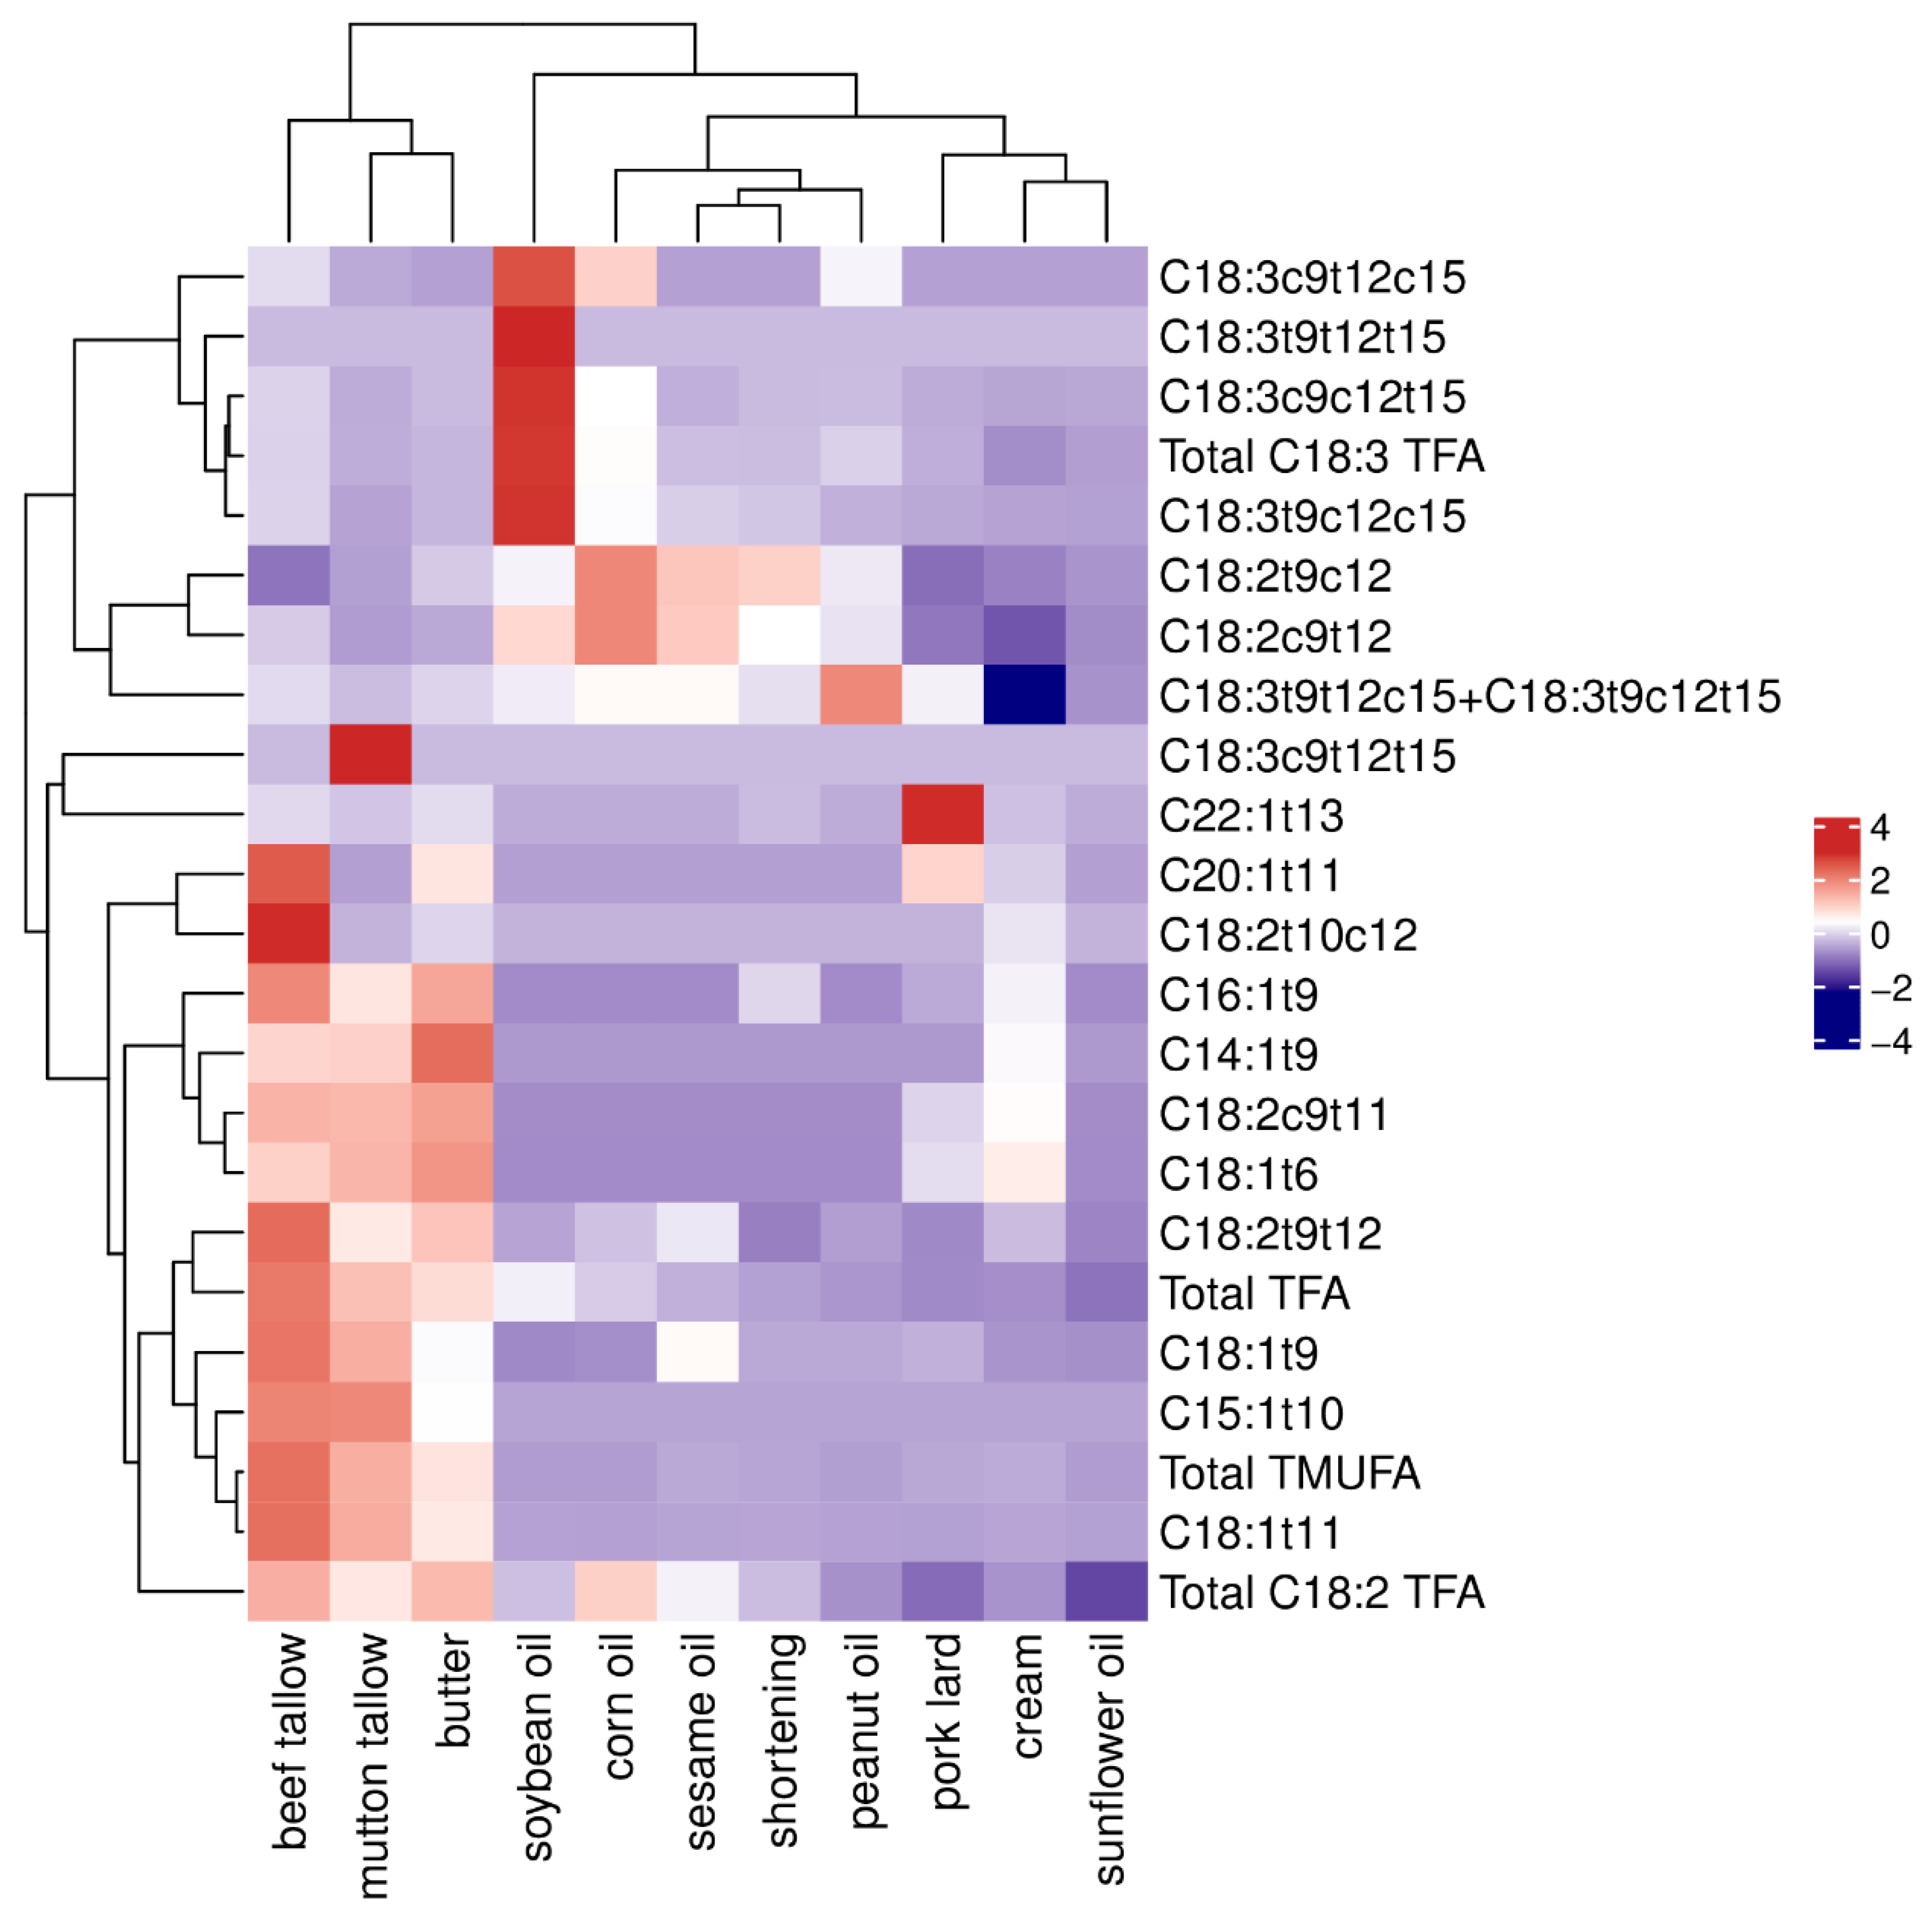

Table 1.
Selected ion monitoring parameters of the proposed GC-MS method.
| No. | Trans Fatty acid (TFA) |
Windows (No.) |
Retention time (min) |
Quantitative Ion (m/z) |
Qualitative ion (m/z) |
Dwell time (ms) |
LOQ (ppb) |
Linearity range (ppb) |
Standard curve regression equation (ppb) |
R2 | FAME-FA Conversion coefficient |
||
| IS | C10:1 c4 | 1 | 25.8 | 74 | 110 | 152 | 96 | 12 | / | / | / | / | / |
| 1 | C14:1 t9 | 42.9 | 166 | 87 | 74 | 208 | 12 | 10 | 5-250 | Y=2.1238x-22.6676 | 0.9998 | 0.9417 | |
| 2 | C15:1 t10 | 2 | 48.4 | 74 | 69 | 180 | 222 | 12 | 10 | 5-250 | Y=11.5450x-131.148 | 0.9996 | 0.9449 |
| 3 | C16:1 t9 | 3 | 54.43 | 194 | 69 | 74 | 236 | 12 | 10 | 5-250 | Y=6.5063x-250.9835 | 0.9997 | 0.9477 |
| 4 | C17:1 t10 | 4 | 62.9 | 208 | 74 | 69 | 250 | 12 | 20 | 10-500 | Y=1.5149x-76.8526 | 0.9991 | 0.9503 |
| 5 | C18:1 t6 | 5 | 72.7 | 74 | 69 | 222 | 264 | 12 | 20 | 10-500 | Y=9.0349x-405.8 | 0.9993 | 0.9527 |
| 6 | C18:1 t9 | 73.0 | 74 | 69 | 222 | 264 | 12 | 10 | 5-250 | Y=38.7466x-763.8356 | 0.9998 | ||
| 7 | C18:1 t11 | 73.7 | 74 | 69 | 222 | 264 | 12 | 30 | 15-3000 | Y=3.5880x-174.2697 | 0.9991 | ||
| 8 | C18:2 t9t12 | 6 | 82.4 | 294 | 67 | 81 | 263 | 10 | 10 | 125-5000 | Y=11.9951x-6754.5248 | 0.9994 | 0.9524 |
| 9 | C18:2 c9t12 | 85.3 | 294 | 67 | 81 | 263 | 10 | 10 | 50-2000 | Y=10.3814x-3425.0548 | 0.9991 | ||
| 10 | C18:2 t9c12 | 86.9 | 294 | 67 | 81 | 263 | 10 | 10 | 50-2000 | Y=9.6048x+3268.9916 | 0.9990 | ||
| 11 | C19:1 t7 | 87.1 | 278 | 74 | 236 | 194 | 10 | 10 | 5-250 | Y=0.7035x+0.4895 | 0.9991 | 0.9548 | |
| 12 | C19:1 t10 | 88.0 | 278 | 69 | 236 | 194 | 10 | 20 | 10-500 | Y=0.9160x-65.8606 | 0.9994 | ||
| 13 | C18:3 t9t12t15 | 7 | 97.7 | 79 | 67 | 121 | 292 | 8 | 60 | 75-1500 | Y=12.0283x-8181.0863 | 0.9995 | 0.9520 |
| 14 | C18:3 t9t12c15 | 101.2 | 79 | 67 | 121 | 292 | 8 | 60 | 75-1500 | Y=10.2026x-649.0786 | 0.9990 | ||
| 15 | C18:3 t9c12t15 | ||||||||||||
| 16 | C18:3 c9c12t15 | 102.6 | 79 | 67 | 121 | 292 | 8 | 20 | 17.5-3500 | Y=10.2953x-1140.8669 | 0.9994 | ||
| 17 | C18:3 c9t12t15 | 103.2 | 79 | 67 | 121 | 292 | 8 | 40 | 37.5-750 | Y=7.3719x-1904.6952 | 0.9993 | ||
| 18 | C18:3 c9t12c15 | 106.0 | 79 | 67 | 121 | 292 | 8 | 20 | 17.5-350 | Y=8.0243x-1368.4318 | 0.9991 | ||
| 19 | C18:3 t9c12c15 | 106.8 | 79 | 67 | 121 | 292 | 8 | 20 | 17.5-3500 | Y=10.2532x-1452.9265 | 0.9994 | ||
| 20 | C20:1 t11 | 107.2 | 250 | 69 | 208 | 292 | 8 | 20 | 20-1000 | Y=0.3553x-1.5752 | 0.9994 | 0.9568 | |
| 21 | C18:2 c9t11 | 8 | 113.0 | 294 | 67 | 81 | 149 | 8 | 20 | 10-2000 | Y=0.6747x-718.5914 | 0.9991 | 0.9524 |
| 22 | C18:2 t10c12 | 115.8 | 294 | 67 | 81 | 149 | 8 | 20 | 10-2000 | Y=0.5267x-467.0668 | 0.9995 | ||
| 23 | C22:1 t13 | 9 | 134.4 | 74 | 69 | 320 | 236 | 8 | 10 | 5-250 | Y=0.5267x-467.0668 | 0.9995 | 0.9602 |
IS = internal standard; LOQ = limit of quantification; c = cis; t = trans.
Table 2.
Recovery and variable coefficient (CV) of TFAMEs in soybean oil and pork lard (n = 3).
| Trans Fatty acid (TFA) |
Concentration multiple | Sunflower oil | Pork lard | ||||||||||||
| 25 mg/kg | 100 mg/kg | 200 mg/kg | 25 mg/kg | 100 mg/kg | 200 mg/kg | ||||||||||
| Recovery (%) |
CV (%) |
Recovery (%) |
CV (%) |
Recovery (%) |
CV (%) |
Recovery (%) |
CV (%) |
Recovery (%) |
CV (%) |
Recovery (%) |
CV (%) |
||||
| C14:1 t9 | 1 | 82.5 | 5.1 | 87.8 | 4.5 | 89.2 | 6.4 | 83.4 | 7.7 | 84.2 | 3.5 | 89.7 | 4.9 | ||
| C15:1 t10 | 1 | 83.2 | 4.2 | 85.3 | 4.6 | 89.8 | 7.5 | 81.2 | 6.2 | 83.4 | 4.3 | 88.4 | 7.2 | ||
| C16:1 t9 | 1 | 86.5 | 8.5 | 86.4 | 6.5 | 88.7 | 4.6 | NA | |||||||
| C17:1 t10 | 2 | 85.4 | 4.6 | 85.4 | 4.6 | 90.2 | 5.5 | 81.5 | 4.4 | 85.2 | 5.6 | 89.7 | 8.9 | ||
| C18:1 t6 | 2 | 89.7 | 8.9 | 83.6 | 4.4 | 91.4 | 4.1 | NA | |||||||
| C18:1 t9 | 1 | NA | NA | ||||||||||||
| C18:1 t11 | 3 | NA | NA | ||||||||||||
| C18:2 t9t12 | 5 | NA | NA | ||||||||||||
| C18:2 c9t12 | 2 | NA | NA | ||||||||||||
| C18:2 t9c12 | 2 | NA | NA | ||||||||||||
| C19:1 t7 | 1 | 88.7 | 3.8 | 89.7 | 6.9 | 90.2 | 8.6 | 79.3 | 3.5 | 81.2 | 7.2 | 89.9 | 3.6 | ||
| C19:1 t10 | 2 | 83.5 | 4.5 | 88.2 | 7.1 | 89.7 | 3.5 | 78.5 | 4.7 | 82.2 | 6.9 | 91.3 | 4.7 | ||
| C18:3 t9t12t15 | 4 | 84.3 | 7.3 | 88.6 | 5.4 | 91.5 | 7.4 | 81.2 | 5.1 | 83.6 | 4.6 | 91.3 | 7.3 | ||
| C18:3 t9t12c15 | 4 | NA | NA | ||||||||||||
| +C18:3 t9c12t15 | |||||||||||||||
| C18:3 c9c12t15 | 1 | NA | NA | ||||||||||||
| C18:3 c9t12t15 | 2 | 79.6 | 5.4 | 83.5 | 3.5 | 91.2 | 6.2 | 83.6 | 7.4 | 88.1 | 2.3 | 90.2 | 6.7 | ||
| C18:3 c9t12c15 | 1 | 88.1 | 5.5 | 89.7 | 2.4 | 90.6 | 9.1 | 82.4 | 3.8 | 85.7 | 3.8 | 92.6 | 3.8 | ||
| C18:3 t9c12c15 | 1 | NA | NA | ||||||||||||
| C20:1 t11 | 1 | 75.4 | 5.3 | 79.8 | 5.3 | 86.5 | 3.7 | NA | |||||||
| C18:2 c9t11 | 4 | 81.5 | 6.6 | 85.5 | 4.3 | 85.4 | 5.9 | NA | |||||||
| C18:2 t10c12 | 4 | 82.3 | 3.8 | 83.7 | 2.9 | 86.4 | 8.6 | 83.3 | 4.0 | 86.9 | 3.9 | 90.6 | 3.7 | ||
| C22:1 t13 | 1 | 79.6 | 4.2 | 81.3 | 3.7 | 85.1 | 4.9 | NA | |||||||
NA = Not available.
Table 3.
The content of TFAs in common edible oils(g/100 g, mean±SD).
| Trans Fatty acid (TFA) |
Soybean oil n=13 |
Peanut oil n=22 |
Coil oil n=15 |
Sunflower oil n=14 |
Sesame oil n=17 |
Pork lard n=18 |
Beef tallow n=11 |
Mutton tallow n=12 |
Butter n=20 |
Cream n=17 |
Shortening n=11 |
| C14:1 t9 | ND | ND | ND | ND | ND | ND | 0.009±0.002 | 0.009±0.004 | 0.017±0.008 | 0.006±0.003 | ND |
| C15:1 t10 | ND | ND | ND | ND | ND | ND | 0.008±0.003 | 0.008±0.003 | 0.003±0.003 | ND | ND |
| C16:1 t9 | ND | ND | ND | ND | ND | 0.014±0.003 | 0.122±0.051 | 0.067±0.035 | 0.105±0.085 | 0.046±0.054 | 0.034±0.011 |
| C17:1 t10 | ND | ND | ND | ND | ND | ND | ND | ND | ND | ND | ND |
| C18:1 t6 | ND | ND | ND | ND | ND | 0.034±0.014 | 0.074±0.081 | 0.090±0.063 | 0.107±0.105 | 0.058±0.045 | ND |
| C18:1 t9 | 0.027±0.016 | 0.056±0.026 | 0.033±0.014 | 0.033±0.022 | 0.143±0.043 | 0.063±0.024 | 0.303±0.136 | 0.235±0.126 | 0.131±0.143 | 0.037±0.022 | 0.056±0.019 |
| C18:1 t11 | 0.022±0.013 | 0.022±0.019 | 0.012±0.004 | 0.016±0.008 | 0.041±0.025 | 0.019±0.021 | 2.538±1.050 | 1.840±0.708 | 1.120±0.620 | 0.059±0.039 | 0.055±0.045 |
| C18:2 t9t12 | 0.078±0.009 | 0.077±0.007 | 0.086±0.010 | 0.069±0.009 | 0.097±0.031 | 0.070±0.004 | 0.158±0.083 | 0.112±0.015 | 0.125±0.032 | 0.085±0.045 | 0.068±0.002 |
| C18:2 c9t12 | 0.474±0.252 | 0.329±0.131 | 0.670±0.539 | 0.171±0.105 | 0.509±0.120 | 0.129±0.084 | 0.285±0.106 | 0.199±0.061 | 0.222±0.095 | 0.060±0.045 | 0.380±0.063 |
| C18:2 t9c12 | 0.258±0.089 | 0.246±0.102 | 0.482±0.421 | 0.135±0.093 | 0.373±0.086 | 0.082±0.019 | 0.092±0.015 | 0.151±0.055 | 0.206±0.155 | 0.110±0.085 | 0.357±0.107 |
| C19:1 t7 | ND | ND | ND | ND | ND | ND | ND | ND | ND | ND | ND |
| C19:1 t10 | ND | ND | ND | ND | ND | ND | ND | ND | ND | ND | ND |
| C18:3 t9t12t15 | 0.083±0.008 | ND | ND | ND | ND | ND | ND | ND | ND | ND | ND |
| C18:3 t9t12c15 + C18:3 t9c12t15 |
0.115±0.012 | 0.180±0.025 | 0.125±0.019 | 0.081±0.045 | 0.125±0.014 | 0.116±0.027 | 0.108±0.019 | 0.097±0.007 | 0.106±0.011 | 0.022±0.042 | 0.110±0.009 |
| C18:3 c9c12t15 | 0.613±0.191 | 0.057±0.096 | 0.171±0.244 | 0.019±0.024 | 0.035±0.028 | 0.029±0.015 | 0.096±0.074 | 0.029±0.018 | 0.054±0.028 | 0.016±0.010 | 0.055±0.025 |
| C18:3 c9t12t15 | ND | ND | ND | ND | ND | ND | ND | 0.025±0.037 | ND | ND | ND |
| C18:3 c9t12c15 | 0.094±0.031 | 0.025±0.009 | 0.045±0.020 | ND | ND | ND | 0.018±0.016 | 0.003±0.005 | ND | ND | ND |
| C18:3 t9c12c15 | 0.466±0.162 | 0.024±0.011 | 0.123±0.211 | 0.003±0.007 | 0.063±0.152 | 0.013±0.038 | 0.068±0.058 | 0.006±0.011 | 0.031±0.026 | 0.005±0.010 | 0.053±0.016 |
| C20:1 t11 | ND | ND | ND | ND | ND | 0.024±0.023 | 0.049±0.056 | ND | 0.020±0.030 | 0.007±0.021 | ND |
| C18:2 c9t11 | ND | ND | ND | ND | ND | 0.234±0.124 | 0.690±0.278 | 0.668±0.322 | 0.767±0.613 | 0.382±0.276 | ND |
| C18:2 t10c12 | ND | ND | ND | ND | ND | ND | 0.164±0.023 | ND | 0.016±0.050 | 0.024±0.069 | ND |
| C22:1 t13 | ND | ND | ND | ND | ND | 0.017±0.012 | 0.002±0.002 | 0.001±0.002 | 0.002±0.003 | 0.001±0.002 | 0.001±0.001 |
| ∑TMUFA | 0.048±0.029 | 0.079±0.034 | 0.045±0.018 | 0.049±0.029 | 0.185±0.056 | 0.172±0.036 | 3.106±1.155 | 2.250±0.747 | 1.506±0.746 | 0.214±0.123 | 0.147±0.043 |
| ∑ C18:2 TFA | 0.811±0.327 | 0.651±0.231 | 1.238±0.954 | 0.376±0.103 | 0.979±0.191 | 0.515±0.160 | 1.388±0.349 | 1.130±0.363 | 1.337±0.651 | 0.660±0.417 | 0.804±0.154 |
| ∑ C18:3 TFA | 1.371±0.334 | 0.286±0.107 | 0.464±0.484 | 0.103±0.033 | 0.222±0.146 | 0.162±0.054 | 0.290±0.146 | 0.160±0.054 | 0.191±0.055 | 0.044±0.052 | 0.218±0.039 |
| ∑ TFA | 2.216±0.595 | 1.016±0.319 | 1.748±1.169 | 0.528±0.103 | 1.386±0.257 | 0.849±0.195 | 4.784±1.282 | 3.540±0.863 | 3.034±1.216 | 0.917±0.537 | 1.169±0.208 |
ND = Not Detected
Disclaimer/Publisher’s Note: The statements, opinions and data contained in all publications are solely those of the individual author(s) and contributor(s) and not of MDPI and/or the editor(s). MDPI and/or the editor(s) disclaim responsibility for any injury to people or property resulting from any ideas, methods, instructions or products referred to in the content. |
© 2025 by the authors. Licensee MDPI, Basel, Switzerland. This article is an open access article distributed under the terms and conditions of the Creative Commons Attribution (CC BY) license (http://creativecommons.org/licenses/by/4.0/).
Copyright: This open access article is published under a Creative Commons CC BY 4.0 license, which permit the free download, distribution, and reuse, provided that the author and preprint are cited in any reuse.


