
Submitted:
27 May 2025
Posted:
27 May 2025
You are already at the latest version
Abstract
Italy strives to meet its renewable energy targets for 2030 and 2050, with photovoltaic (PV) technology playing a central role. However, the push for increased solar adoption, spurred by past incentive schemes such as “Conto Energia” and “Superbonus 110%”, raises long-term challenges related to PV waste management. In this study, we present a multi-scale approach to forecast End-of-Life (EoL) PV waste across Italy’s 20 regions, aiming to support national circular economy strategies. Historical installation data (2008–2024) were collected and combined with socio-economic and energy-related indicators to train a Backpropagation Neural Network (BPNN) for regional PV capacity forecasting up to 2050. Each model was optimised and validated using R² and RMSE metrics. The projections indicate that current trends fall short of meeting Italy’s decarbonisation targets. Subsequently, by applying a Weibull reliability function under two distinct scenarios (Early-loss and Regular-loss), we estimated the annual and regional distribution of PV panels reaching their EoL. This analysis provides spatially explicit insights into future PV waste flows, essential for planning regional recycling infrastructures and ensuring sustainable energy transitions.
Keywords:
Backpropagation Neural Network
; Circular Economy
; End-of-Life Panels
; Photovoltaic
; Regional Forecasting
; Weibull Distribution
1. Introduction
The transition to renewable energy sources is a cornerstone of global strategies to combat climate change [1]. Among the available technologies, photovoltaics (PV) stand out for their modularity, scalability, and economic competitiveness. According to the International Renewable Energy Agency (IRENA) report [2], the cost of PV modules decreased by 93% between 2009 and 2023, supporting their large-scale deployment. PV systems contribute to the production of clean energy and to reducing air pollution, aligning with the circular economy goal of minimising dependence on primary raw materials and energy [3]. In Italy, PV plays a key role in the national energy strategy, having been supported in the past by incentive schemes such as Conto Energia (active between 2008 and 2013) and the Superbonus 110% (introduced in 2020 and progressively phased out from 2023). According to data from the “Gestore dei Servizi Energetici” (GSE), Italy’s installed PV capacity surpassed 36 GW in 2024, up from 25 GW in 2022, an increase of almost 50% over two years. This growth is expected to continue in pursuit of the targets set by the “Piano Nazionale Integrato per l’Energia e il Clima” (PNIEC) for 2030 and the 2050 climate neutrality strategy. At the European level, the European Union (EU) aims to transition member state economies to zero-emission systems, with a minimum target of 30% renewable energy by 2030 [4]. In the long term, PV is projected to meet 32% of global energy demand by 2050, with an estimated installed capacity of 14 TW [5]. However, the rapid increase in PV installations raises new challenges. PV modules contain strategic materials, particularly silicon and silver, whose circular management is essential for the sustainability of the sector [5]. Recycling End-of-Life (EoL) PV panels is therefore crucial for both environmental protection and resource conservation [5]. Currently, the PV industry operates largely under a linear “take–make–use–dispose” model, which leads to increasing landfill waste and associated environmental impacts [6]. Moreover, most research and development efforts have focused on improving module efficiency, with limited attention given to economically viable dismantling and recycling technologies [6].
In Italy the lack of a national strategy and dedicated infrastructure for PV waste management represents a structural weakness [3,7]. On the regulatory side, the European Union has classified PV modules as electronic waste (WEEE), with the adoption of the WEEE Directive (EC, 2012), which promotes resource efficiency and design-for-recycling [8,9].
In this context, effective EoL planning requires the spatial and temporal forecasting of PV waste flows [10]. Scientific literature presents a lack of studies dedicated to the forecasting of the installed capacity, and consequently of the waste stream generated by EoL PV modules, especially at the regional level [10]. Such information is essential for appropriately sizing treatment infrastructure and minimising reverse logistics costs related to waste collection and transport.
To address this gap in the literature, this study proposes a multi-scale approach to forecast PV waste generation in Italy through 2050, with regional resolution. Several international studies have estimated PV waste flows in different countries, including United States and Mexico ([11,12]), India [13], Italy [14], Spain [15], Indonesia [16], Australia [17] and China [10]. However, to the best of our knowledge, no systematic analysis at the regional scale has been conducted for the Italian context.
Historical PV installation data from 2008 to 2024 were collected for all 20 Italian regions ([18,19,20,21,22,23,24,25,26,27,28,29,30,31,32,33]). Future installations from 2025 to 2050 were then forecast by comparing different modelling approaches. The best-performing model was the Backpropagation Neural Network (BPNN), previously applied in China [10], and trained using a set of demographic, economic, and energy policy-related variables.
To complete the modelling framework, the Weibull function was applied, a method widely adopted in similar studies ([10,11,12,13,15]), to model the decommissioning of PV modules under two scenarios: Early-loss and Regular-loss. The resulting annual and regional estimates of EoL volumes support the design of efficient recycling systems aligned with circular economy principles and demonstrate the importance of a proactive national strategy tailored to the Italian context.
2. Materials and Methods
The methodology applied in this study consists of three main phases, each aimed at constructing a forecasting model for waste from PV modules. The methodological structure is shown in Figure 1.
The first phase of the work involved collecting historical data on PV installations on a regional scale for the period 2008-2024, expressed in terms of installed power (MW). These data form the basis for the forecast analysis of PV waste flows. The sources used are official and established national and European energy and statistical bodies. In particular, the data on installed capacity for each region were acquired from GSE, the main reference in Italy for monitoring production from renewable sources, and from Terna, the national transmission grid operator. Additional socio-economic and energy indicators were collected from official statistical sources: ISTAT and Eurostat for demographic and economic aspects and the IRENA for contextual energy parameters. The selection of these sources meets the criteria of authoritativeness, extended time availability, regional territorial coverage and continuous updating, which are essential to ensure reliability and consistency in the forecast models developed.
According to Figure 2, Italy ranks among the leading countries in Europe in terms of installed capacity in 2024, with a significant and continuous growth since 2008 [34].
2.1. Forecasting Model
The first step of the empirical research involves forecasting installed capacity at the regional level. Different forecasting approaches were compared, inspired by the main methods used to estimate the volume of electrical and electronic equipment. Four models have been implemented: linear regression, AutoRegressive Integrated Moving Average (ARIMA) model, BPNN and Long Short-Term Memory (LSTM) recurrent neural network [10,35,36]. Traditional statistical models, such as linear regression and ARIMA, perform well in modelling historical trends, effectively capturing linear dynamics and seasonality in data. However, they have limitations in representing complex and nonlinear phenomena, especially over long-time horizons [10]. To address these complexities, machine learning models have also been considered. BPNN, optimised by genetic algorithms, are particularly suited to handle large volumes of data and nonlinear relationships between variables [35,37]. Similarly, LSTM networks, which belong to the family of recurrent neural networks, can capture long-term temporal dependencies and are widely used for multistep forecasting over time [10,36].
To evaluate the performance of the forecasting models, the historical dataset was divided into a training set (80%) and a test set (20%). The goodness of the models was measured through two widely used metrics: the coefficient of determination (R²) and the Root Mean Squared Error (RMSE), which allow for evaluating the quality of the adaptation and the accuracy of the forecasts, respectively. The more complex models, namely BPNN and LSTM, characterised by greater flexibility and a high number of hyperparameters, were subject to an optimisation process using Grid Search [38,39].This technique allowed for systematically exploring a wide combination of parameters, modifying one at a time, to identify the configuration with the best forecasting performances. In the case of the BPNN model, the network was built with multiple layers, and it was optimised based on parameters such as the number of neurons (units: 32, 64, 128, 256), dropout rate (0.2, 0.3), learning rate (learning rate: 0.001, 0.01, 0.0001), batch size (16, 32), number of epochs (100, 200). Two optimisation algorithms were employed: RMSprop and Adam, both tested to improve the convergence and stability of the model. The same optimisation process was also applied to the LSTM model, which, thanks to its recurrent architecture, is particularly suitable for capturing long-term temporal dependencies in the data. The same ranges of values for the hyperparameters and the same optimization algorithms (RMSprop and Adam) were adopted to guarantee a homogeneous basis of comparison between the models.
To increase the predictive ability of deep learning models (BPNN and LSTM), the input was not limited to the historical series of installed PV. In fact, several contextual explanatory variables were integrated, selected for their potential contribution to explaining the regional dynamics of PV deployment; these include economic, demographic and energy-policy indicators specific to each region. The integration of these variables made it possible to enrich the model with a more structured and multidimensional view of the phenomenon under consideration, improving forecasts’ accuracy in terms of adaptation to historical data and future projection. The forecasting outcomes yielded by BPNN exhibit the highest level of accuracy through validation using historical data (Table 1). Therefore, this study chooses BPNN to predict the future installed capacity of PV modules in Italian regions.
2.2. Waste Generation
This study employs predictive modelling that incorporates two distinct forecasting schemes: Early-loss and Regular-loss, both modelled using the Weibull function, as illustrated in (1):
where:
- F(t) is the Weibull function;
- t is the lifespan of panels in years;
- T is mean lifetime of PV panels;
- α represents the shape parameter, which determines the characteristic form of the Weibull curve.
An α value of 2.4928 was designated for the Early-loss scenario, whereas a value of 5.3759 was assigned for the Regular-loss scenario [13,40,41]. A 99.99% probability of module loss after 40 years of operation is presumed for both scenarios [41]. Additionally, in the Early-loss scenario, a loss chance of 0.5% is presumed during the first year due to damage incurred during shipment and installation, along with an extra failure probability of 0.5% within the initial two years of operation [41]. A threshold of 25 years was adopted to estimate the average useful life of a PV panel. The Weibull function was applied iteratively for each year and region to the new installation. So, it was possible to assume the new installed capacity for each year, calculated as follows:
where:
- is the new installed capacity in region i in year t;
- is the total installed capacity in region i at year t;
- is the decommissioned capacity in region i in year t.
The conversion from MW to tonnes represents the last step to obtain waste stream. Although it is possible to assume a fixed average conversion factor (e.g. tons per MW installed), this approach would be inaccurate in the long-term considering different technologies and efficiencies [15,42]. Technological evolution in the PV sector (which has led to more efficient solar cells and a progressive reduction of the material used) has decreased the mass/power ratio over time [15]. So, a decreasing exponential function was adopted, in line with what was proposed by IRENA [41], who analysed average data of nominal power and weight of modules produced between 1980 and 2013. The ratio for the modules installed in year i was calculated as (3) [15,41,42]:
In particular, the fitting parameters of the exponential function were estimated as follows:
- A = 1.11 × 10³ t/MW;
- B = 48.24 years;
- i is the current year.
However, it should be noted that this procedure introduces a certain degree of uncertainty, particularly for long-term projections. This is because the mass/power ratio derives from an extrapolation process based on historical data, and therefore the estimate’s precision tends to decrease as the period moves away [15,42].
3. Results
This section presents the regional forecasts of PV installed capacity and waste flows generation. Italian regions are aggregated according to the NUTS 1 classification for clarity and spatial consistency: Northern, Central, and Southern Italy. This grouping supports comparative analysis of macro-area dynamics and expected PV waste flows by 2050.
3.1. Territorial Distribution of Photovoltaic Capacity: Regional Dynamics and Enabling Factors
Analysing installed PV capacity by macro-area highlights significant regional disparities, driven by demographic, economic, infrastructural, and policy factors (Figure 3). All regions in Northern Italy exhibit consistent growth, with Lombardy leading the way. An expected result, considering the high resident population, industrial density and economic-financial availability that characterise the region. Although not benefiting from the best conditions for solar radiation, Lombardy still manages to assert itself thanks to a favourable context in terms of infrastructure, planning capacity and access to incentives. On the contrary, regions such as Trentino-Alto Adige and Valle d'Aosta present lower values, probably due to the Alps’ morphology, low population density and landscape constraints, which limit the development of large plants. This evidence suggests that, in Northern contexts, the economic-industrial aspect has played a more relevant role than the simple availability of solar resources.
In Central Italy, Lazio stands out for its sharp increase in installed capacity starting in 2023. Lazio also combines good solar irradiation with intense demographic pressure, factors that accelerate PV deployment when supported by coherent policy frameworks. On the contrary, despite having similar climatic and territorial characteristics, Tuscany and Marche show more modest growth, which could suggest a lower effectiveness of regional policies or a less dynamic response by local actors.
Puglia maintains its leadership in Southern Italy due to its high irradiation, land availability, and regional support for renewables. Although Sicily and Sardinia have similar levels of irradiation, they are experiencing slower growth rates. In Sicily, wind power has absorbed a larger share of investments, while Sardinia faces infrastructural and environmental constraints limiting large-scale installations. Regional disparities are also evident between Campania and Calabria, where similar natural conditions yield different outcomes, suggesting that administrative capacity and local governance play a key role in enabling development.
Overall, 2024 marked a shift in market dynamics. The utility-scale segment (>1 MW) recorded the highest growth (+163%), with a concentration of grid connections in the second half of the year (from 1,157 MW in 2023 to 3,045 MW in 2024). In contrast, the residential sector declined following the phase-out of the Superbonus 110% and the end of the tax credit transfer mechanism. The commercial and industrial segment (20 kW–1 MW) grew moderately (+8%), reaching 1,961 MW in 2024 (Source: Terna Database). These results highlight the growing role of utility-scale systems and the impact of policy discontinuities on smaller-scale installations. This trend is supported by improving cost competitiveness. The Levelized Cost of Electricity (LCOE) for utility-scale PV declined by 14% in Italy in 2023, outperforming the global average reduction of 12% [2]. This decline reflects decreasing installation costs and improved system performance, reinforcing the economic viability of large-scale projects in the national context.
3.2. PV Waste Flows: Forecast Scenarios
The analysis of annual PV waste flows at the regional level (reported in Figure 4), disaggregated by macro-area and degradation scenario, reveals distinct temporal and quantitative patterns between the Early-loss and Regular-loss scenarios.
In the Early-loss scenario, waste increases progressively and steadily throughout the 2025–2050 horizon. This emphasises early module failures due to manufacturing defects, transport damage, or installation issues. The resulting waste is temporally distributed, producing smoother but cumulatively higher volumes. Regions with the largest installed capacity, such as Lombardy, Lazio, and Puglia, show consistently elevated and stable waste levels over time.
Conversely, the Regular-loss scenario shows a more discontinuous profile. This reflects a longer module lifetime, with decommissioning concentrated 22–28 years after installation. Waste volumes remain low in the short term but surge rapidly once large cohorts of modules reach EoL, leading to sharp annual peaks. The projected increase in installations strongly influences post-2040 waste flows under this scenario. This is particularly evident in regions like Lombardy and Puglia, where waste flows appear stable under Early-loss but fluctuate sharply in the Regular-loss case. Planning efforts at both national and regional levels must account for both scenarios, balancing the risk of under-dimensioning infrastructure (typical of Regular-loss) with the potential inefficiency of over-dimensioning (linked to Early-loss), to ensure the operational resilience and environmental sustainability of the PV sector.
4. Discussion
This study proposed a multi-scale methodology to forecast future PV waste generation in Italy, combining regional projections of PV installations with two distinct EoL scenarios. Historical installation data (2008–2024) and region-specific support variables were used to train a BPNN, enabling forecasts of new capacity by region up to 2050. These projections were coupled with Weibull-based lifetime distributions to estimate annual and regional EoL waste flows under Early-loss and Regular-loss scenarios.
The national-level forecast developed in this study (Figure 5) indicates that PV installations in Italy are expected to exceed the targets set by the December 2019 version of the PNIEC, which aimed for 52 GW by 2030. However, the projected growth remains below the revised PNIEC objectives published in June 2023, which call for approximately 79 GW of installed capacity by 2030.
This discrepancy highlights the gap between current deployment trends and the increased ambition of national climate policy. While the forecast model necessarily involves a degree of uncertainty, especially in long-term projections, it is important to note that the impact of potential forecasting errors on waste estimation is attenuated over time. Due to the average 25-year lifespan of PV modules and the smoothing effect of the Weibull-based lifetime model, errors in near-term installation forecasts have a greater influence on short- and medium-term waste flows than those occurring in the distant future.
These findings suggest that, in the absence of further structural interventions or policy reinforcements, the current pace of growth may not be sufficient to meet the latest national decarbonisation targets. The EoL management of PV modules represents a strategic challenge for the sustainability of the sector, both environmentally and economically. As highlighted in the literature, the current economic framework for recycling PV panels, particularly silicon-based ones, is not yet favourable, primarily due to the high costs of infrastructure implementation relative to the economic returns from material recovery [43,44]. However, while landfill disposal remains more economically advantageous, its competitiveness may decline over time due to potential regulatory and fiscal developments [45]. In this context, recycling already emerges as the environmentally preferable option [45], and its cost-effectiveness may improve as increasing volumes of modules reach the end of their life cycle, enabling economies of scale [46,47].
An effective management system requires centralised planning of the recycling supply chain, with treatment facilities of adequate scale capable of ensuring economic viability [48,49]. The adoption of closed-loop circular economy models and the promotion of an integrated cycle, including collection, storage, transport, recycling, and reuse, have been recognised as essential tools for reducing environmental impact and improving sector-wide efficiency [3,50,51]. In this context, the present study offers a valuable contribution by providing spatially disaggregated forecasts of PV waste generation at the regional level. This granularity enables more accurate and efficient national planning of collection and treatment infrastructure, allowing stakeholders to align logistical capacity with the actual territorial distribution of EoL PV modules.
To date, the only national-level study estimating PV waste quantities in Italy does not apply a probabilistic lifetime distribution such as the Weibull function [14]. As a result, direct comparison with the present results would lack methodological consistency and could lead to misleading conclusions regarding the timing and magnitude of future waste flows.
A photovoltaic panel is primarily composed of glass, aluminium, silicon, and small quantities of valuable metals such as silver and copper, along with various polymers used for encapsulation and insulation. Among the recoverable materials, silicon is the most significant, both in terms of mass and economic value, and it is classified as a critical raw material by the EU [52,53]. Efficient recovery of high-purity silicon is therefore crucial not only for environmental sustainability but also for securing industrial supply chains and limiting the embedded energy associated with wafer production [54,55].
Other materials, although present in small quantities, can also contribute significantly to the profitability of recycling. For instance, silver accounted for approximately 35% of the economic value derived from silicon-based module recycling [56], while copper contributed over 5% [57]. Nonetheless, the absence of robust regulation and a developed market for recycled materials, coupled with the lack of specific obligations in many countries, has so far limited large-scale implementation, with global estimates suggesting that only around 10% of PV modules are currently recycled [58,59].
Based on the projections developed in this study, future waste flows from PV modules, particularly under scenarios characterised by sudden peaks (Regular-loss), necessitate systemic reflection on the absorption and treatment capacity of national infrastructure. The early adoption of low-cost recycling technologies, supported by coherent regulatory frameworks and targeted incentives, therefore appears essential to ensure a truly sustainable and circular energy transition.
Author Contributions
Conceptualization, A.F. and M.A.; methodology, A.F. and C.L.; software, A.F. and C.L.; validation, A.F. and C.L.; formal analysis, A.F., M.A. and C.L.; investigation, A.F. and C.L.; data curation, A.F., C.L.; writing—original draft preparation, A.F. and C.L.; writing—review and editing, A.F. and C.L.; visualization, A.F.; supervision, M.B., M.A. and E.V.; project administration, A.F. . All authors have read and agreed to the published version of the manuscript.
Funding
This research received no external funding.
Institutional Review Board Statement
Not applicable.
Informed Consent Statement
Not applicable.
Data Availability Statement
The data presented in this article can be obtained from the corresponding authors upon request.
Conflicts of Interest
The authors declare no conflicts of interest.
Abbreviations
The following abbreviations are used in this manuscript:
| ARIMA | AutoRegressive Integrated Moving Average |
| BPNN | Backpropagation Neural Network |
| EoL | End of Life |
| EU | European Union |
| GSE | Gestore dei Servizi Energetici |
| IRENA | International Renewable Energy Agency |
| LSTM | Long Short-Term Memory |
| MSE | Mean Squared Error |
| PV | Photovoltaic |
| RMSE | Root Mean Squared Error |
| WEEE | Waste Electrical and Electronic Equipment |
References
- V. Savvilotidou and E. Gidarakos, “Pre-concentration and recovery of silver and indium from crystalline silicon and copper indium selenide photovoltaic panels,” J Clean Prod, vol. 250, Mar. 2020. [CrossRef]
- IRENA, RENEWABLE POWER GENERATION COSTS IN 2023. 2024. [Online]. Available: www.irena.org.
- P. S. S. Camargo et al., “c-Si PV module recycling: Analysis of the use of a mechanical pre-treatment to reduce the environmental impact of thermal treatment and enhance materials recovery,” Waste Management and Research, vol. 41, no. 11, pp. 1661–1673, Nov. 2023. [CrossRef]
- J. Vaněk, K. Jandova, P. Vanýsek, and P. Maule, “Chemical Delamination Applicable to a Low-Energy Recycling Process of Photovoltaic Modules,” Processes, vol. 11, no. 11, Nov. 2023. [CrossRef]
- D. Sah and S. Kumar, “Experimental, cost and waste analysis of recycling process for crystalline silicon solar module,” Solar Energy, vol. 273, p. 112534, May 2024. [CrossRef]
- P.-H. Chen, W.-S. Chen, C.-H. Lee, and J.-Y. Wu, “Comprehensive Review of Crystalline Silicon Solar Panel Recycling: From Historical Context to Advanced Techniques,” Sustainability, vol. 16, no. 1, p. 60, Dec. 2023. [CrossRef]
- O. Malandrino, D. Sica, M. Testa, and S. Supino, “Policies and Measures for Sustainable Management of Solar Panel End-of-Life in Italy,” Sustainability, vol. 9, no. 4, p. 481, 2017. [CrossRef]
- P. Su et al., “Environmentally friendly recycling process for crystalline silicon photovoltaic modules: Airflow separation and AlCl3·6H2O + H2O2 etching system,” Sep Purif Technol, vol. 343, Sep. 2024. [CrossRef]
- F. Ardente, C. E. L. Latunussa, and G. A. Blengini, “Resource efficient recovery of critical and precious metals from waste silicon PV panel recycling,” Waste Management, vol. 91, pp. 156–167, May 2019. [CrossRef]
- G. Wang, Q. Liao, and H. Xu, “Anticipating future photovoltaic waste generation in China: Navigating challenges and exploring prospective recycling solutions,” Environ Impact Assess Rev, vol. 106, p. 107516, May 2024. [CrossRef]
- O. Domínguez and R. Geyer, “Photovoltaic waste assessment in Mexico,” Resour Conserv Recycl, vol. 127, pp. 29–41, 2017. [CrossRef]
- Domínguez and R. Geyer, “Photovoltaic waste assessment of major photovoltaic installations in the United States of America,” Renew Energy, vol. 133, pp. 1188–1200, 2019. [CrossRef]
- Sharma, P. Mahajan, and R. Garg, “End-of-life solar photovoltaic panel waste management in India: forecasting and environmental impact assessment,” International Journal of Environmental Science and Technology, vol. 21, no. 2, pp. 1961–1980, Jan. 2024. [CrossRef]
- Paiano, “Photovoltaic waste assessment in Italy,” Renewable and Sustainable Energy Reviews, vol. 41, pp. 99–112, 2015. [CrossRef]
- J. D. Santos and M. C. Alonso-García, “Projection of the photovoltaic waste in Spain until 2050,” J Clean Prod, vol. 196, pp. 1613–1628, Sep. 2018. [CrossRef]
- Made Wahyu Widyarsana, D. S. Supramono, and N. Fadel, “Electronic Waste Generation Prediction in Bandung City, Indonesia,” Environmental and Climate Technologies, vol. 25, no. 1, pp. 111–120, Jan. 2021. [CrossRef]
- V. Tan, R. Deng, and R. Egan, “Solar photovoltaic waste and resource potential projections in Australia, 2022–2050,” Resour Conserv Recycl, vol. 202, Jan. 2024. [CrossRef]
- Gestore dei Servizi Energetici (GSE), “Solare fotovoltaico Rapporto Statistico - 2008”.
- Gestore dei Servizi Energetici (GSE), “Solare fotovoltaico Rapporto Statistico - 2009”.
- Gestore dei Servizi Energetici (GSE), “Solare Fotovoltaico Rapporto Statistico - 2010.” [Online]. Available: www.gse.it.
- Gestore dei Servizi Energetici (GSE), “Solare Fotovoltaico Rapporto Statistico - 2011”.
- Gestore dei Servizi Energetici (GSE), “Solare fotovoltaico Rapporto Statistico - 2012”.
- Gestore dei Servizi Energetici (GSE), “Solare fotovoltaico Rapporto statistico - 2013”.
- Gestore dei Servizi Energetici (GSE), “Solare fotovoltaico Rapporto Statistico - 2014”.
- Gestore dei Servizi Energetici (GSE), “Solare Fotovoltaico Rapporto Statistico - 2015”.
- Gestore dei Servizi Energetici (GSE), “Solare Fotovoltaico Rapporto Statistico - 2016”.
- Gestore dei Servizi Energetici (GSE), “Solare Fotovoltaico Rapporto Statistico - 2017.
- Gestore dei Servizi Energetici (GSE), “Solare Fotovoltaico Rapporto Statistico - 2018.
- Gestore dei Servizi Energetici (GSE), “Solare Fotovoltaico Rapporto Statistico - 2019.
- Gestore dei Servizi Energetici (GSE), “Solare Fotovoltaico Rapporto Statistico - 2020.
- Gestore dei Servizi Energetici (GSE), “Solare Fotovoltaico Rapporto Statistico - 2021.
- Gestore dei Servizi Energetici (GSE), “Solare Fotovoltaico Rapporto Statistico - 2022.
- Gestore dei Servizi Energetici, “Solare Fotovoltaico Rapporto Statistico - 2023.
- A. Franzoni, C. Leggerini, and M. Bannò, “A Predictive Framework for Photovoltaic Waste Quantities and Recovery Values: Insights and Application to the Italian Context,” Environmental and Climate Technologies, vol. 28, no. 1, pp. 243–257, Jan. 2024. [CrossRef]
- Zhou et al., “Spatiotemporal evolution of decommissioned photovoltaic distribution and integrated energy-economic-environmental-social sustainable benefit assessment in China,” Appl Energy, vol. 384, p. 125459, Apr. 2025. [CrossRef]
- Wang, X. Qi, and H. Liu, “Photovoltaic power forecasting based LSTM-Convolutional Network,” Energy, vol. 189, p. 116225, Dec. 2019. [CrossRef]
- G. Wang, Q. Liao, and H. Xu, “Anticipating future photovoltaic waste generation in China: Navigating challenges and exploring prospective recycling solutions,” Environ Impact Assess Rev, vol. 106, p. 107516, May 2024. [CrossRef]
- Y. Chen, J. Liu, B. Liu, S. Liu, and D. Zhang, “Research on Photovoltaic Long-Term Power Prediction Model Based on Superposition Generalization Method,” Processes, vol. 13, no. 5, p. 1263, Apr. 2025. [CrossRef]
- D. El-Shahat, A. Tolba, M. Abouhawwash, and M. Abdel-Basset, “Machine learning and deep learning models based grid search cross validation for short-term solar irradiance forecasting,” J Big Data, vol. 11, no. 1, p. 134, Sep. 2024. [CrossRef]
- S. Mahmoudi, N. Huda, and M. Behnia, “Photovoltaic waste assessment: Forecasting and screening of emerging waste in Australia,” Resour Conserv Recycl, vol. 146, pp. 192–205, 2019. [CrossRef]
- S. Weckend, A. Wade, and G. Heath, “IRENA and IEA-PVPS, End-of-life Management, Solar Photovoltaic Panels,” 2016.
- E. Kastanaki, “Dynamic assessment of photovoltaic waste streams in the EU-27 countries under the circular economy principles of ‘Reduce, Reuse and Recycle,’” Resour Conserv Recycl, vol. 214, p. 108033, Mar. 2025. [CrossRef]
- P. H. Chen, W. S. Chen, C. H. Lee, and J. Y. Wu, “Comprehensive Review of Crystalline Silicon Solar Panel Recycling: From Historical Context to Advanced Techniques,” Jan. 01, 2024, Multidisciplinary Digital Publishing Institute (MDPI). [CrossRef]
- J. Tao and S. Yu, “Review on feasible recycling pathways and technologies of solar photovoltaic modules,” Solar Energy Materials and Solar Cells, vol. 141, pp. 108–124, Oct. 2015. [CrossRef]
- Z. Ngagoum Ndalloka, H. Vijayakumar Nair, S. Alpert, and C. Schmid, “Solar photovoltaic recycling strategies,” Solar Energy, vol. 270, p. 112379, Mar. 2024. [CrossRef]
- D’Adamo, M. Miliacca, and P. Rosa, “Economic Feasibility for Recycling of Waste Crystalline Silicon Photovoltaic Modules,” International Journal of Photoenergy, vol. 2017, pp. 1–6, 2017. [CrossRef]
- J.-K. Choi and V. Fthenakis, “Crystalline silicon photovoltaic recycling planning: macro and micro perspectives,” J Clean Prod, vol. 66, pp. 443–449, Mar. 2014. [CrossRef]
- Niekurzak, W. Lewicki, H. H. Coban, and A. Brelik, “Conceptual Design of a Semi-Automatic Process Line for Recycling Photovoltaic Panels as a Way to Ecological Sustainable Production,” Sustainability (Switzerland), vol. 15, no. 3, Feb. 2023. [CrossRef]
- . Cucchiella, I. D׳Adamo, and P. Rosa, “End-of-Life of used photovoltaic modules: A financial analysis,” Renewable and Sustainable Energy Reviews, vol. 47, pp. 552–561, Jul. 2015. [CrossRef]
- Y. Xu, J. Li, Q. Tan, A. L. Peters, and C. Yang, “Global status of recycling waste solar panels: A review,” Waste Management, vol. 75, pp. 450–458, 2018. [CrossRef]
- R. Contreras-Lisperguer, E. Muñoz-Cerón, J. Aguilera, and J. de la Casa, “A set of principles for applying Circular Economy to the PV industry: Modeling a closed-loop material cycle system for crystalline photovoltaic panels,” Sustain Prod Consum, vol. 28, pp. 164–179, Oct. 2021. [CrossRef]
- Riech et al., “Experimental Methodology for the Separation Materials in the Recycling Process of Silicon Photovoltaic Panels,” Materials, vol. 14, no. 3, p. 581, Jan. 2021. [CrossRef]
- E. Klugmann-Radziemska, P. Ostrowski, K. Drabczyk, P. Panek, and M. Szkodo, “Experimental validation of crystalline silicon solar cells recycling by thermal and chemical methods,” Solar Energy Materials and Solar Cells, vol. 94, no. 12, pp. 2275–2282, Dec. 2010. [CrossRef]
- Li et al., “Progress in recovery and recycling of kerf loss silicon waste in photovoltaic industry,” Sep Purif Technol, vol. 254, Jan. 2021. [CrossRef]
- Y. Yan et al., “Recovery of Silicon via Using KOH-Ethanol Solution by Separating Different Layers of End-of-Life PV Modules,” JOM, vol. 72, no. 7, pp. 2624–2632, Jul. 2020. [CrossRef]
- E. Kastanaki, E. Lagoudakis, G. Kalogerakis, and A. Giannis, “Hydrothermal Leaching of Silver and Aluminum from Waste Monocrystalline and Polycrystalline Photovoltaic Panels,” Applied Sciences (Switzerland), vol. 13, no. 6, Mar. 2023. [CrossRef]
- P. S. S. Camargo, A. da S. Domingues, J. P. G. Palomero, A. C. Kasper, P. R. Dias, and H. M. Veit, “Photovoltaic module recycling: Thermal treatment to degrade polymers and concentrate valuable metals,” Detritus, vol. 16, pp. 48–62, Sep. 2021. [CrossRef]
- D. S. Prasad, B. Sanjana, D. S. Kiran, P. P. Srinivasa Kumar, and R. Ratheesh, “Process optimization studies of essential parameters in the organic solvent method for the recycling of waste crystalline silicon photovoltaic modules,” Solar Energy Materials and Solar Cells, vol. 245, Sep. 2022. [CrossRef]
- R. Gahlot, S. Mir, and N. Dhawan, “Recycling of Discarded Photovoltaic Solar Modules for Metal Recovery: A Review and Outlook for the Future,” Dec. 15, 2022, American Chemical Society. [CrossRef]
Figure 1.
Methodological structure.
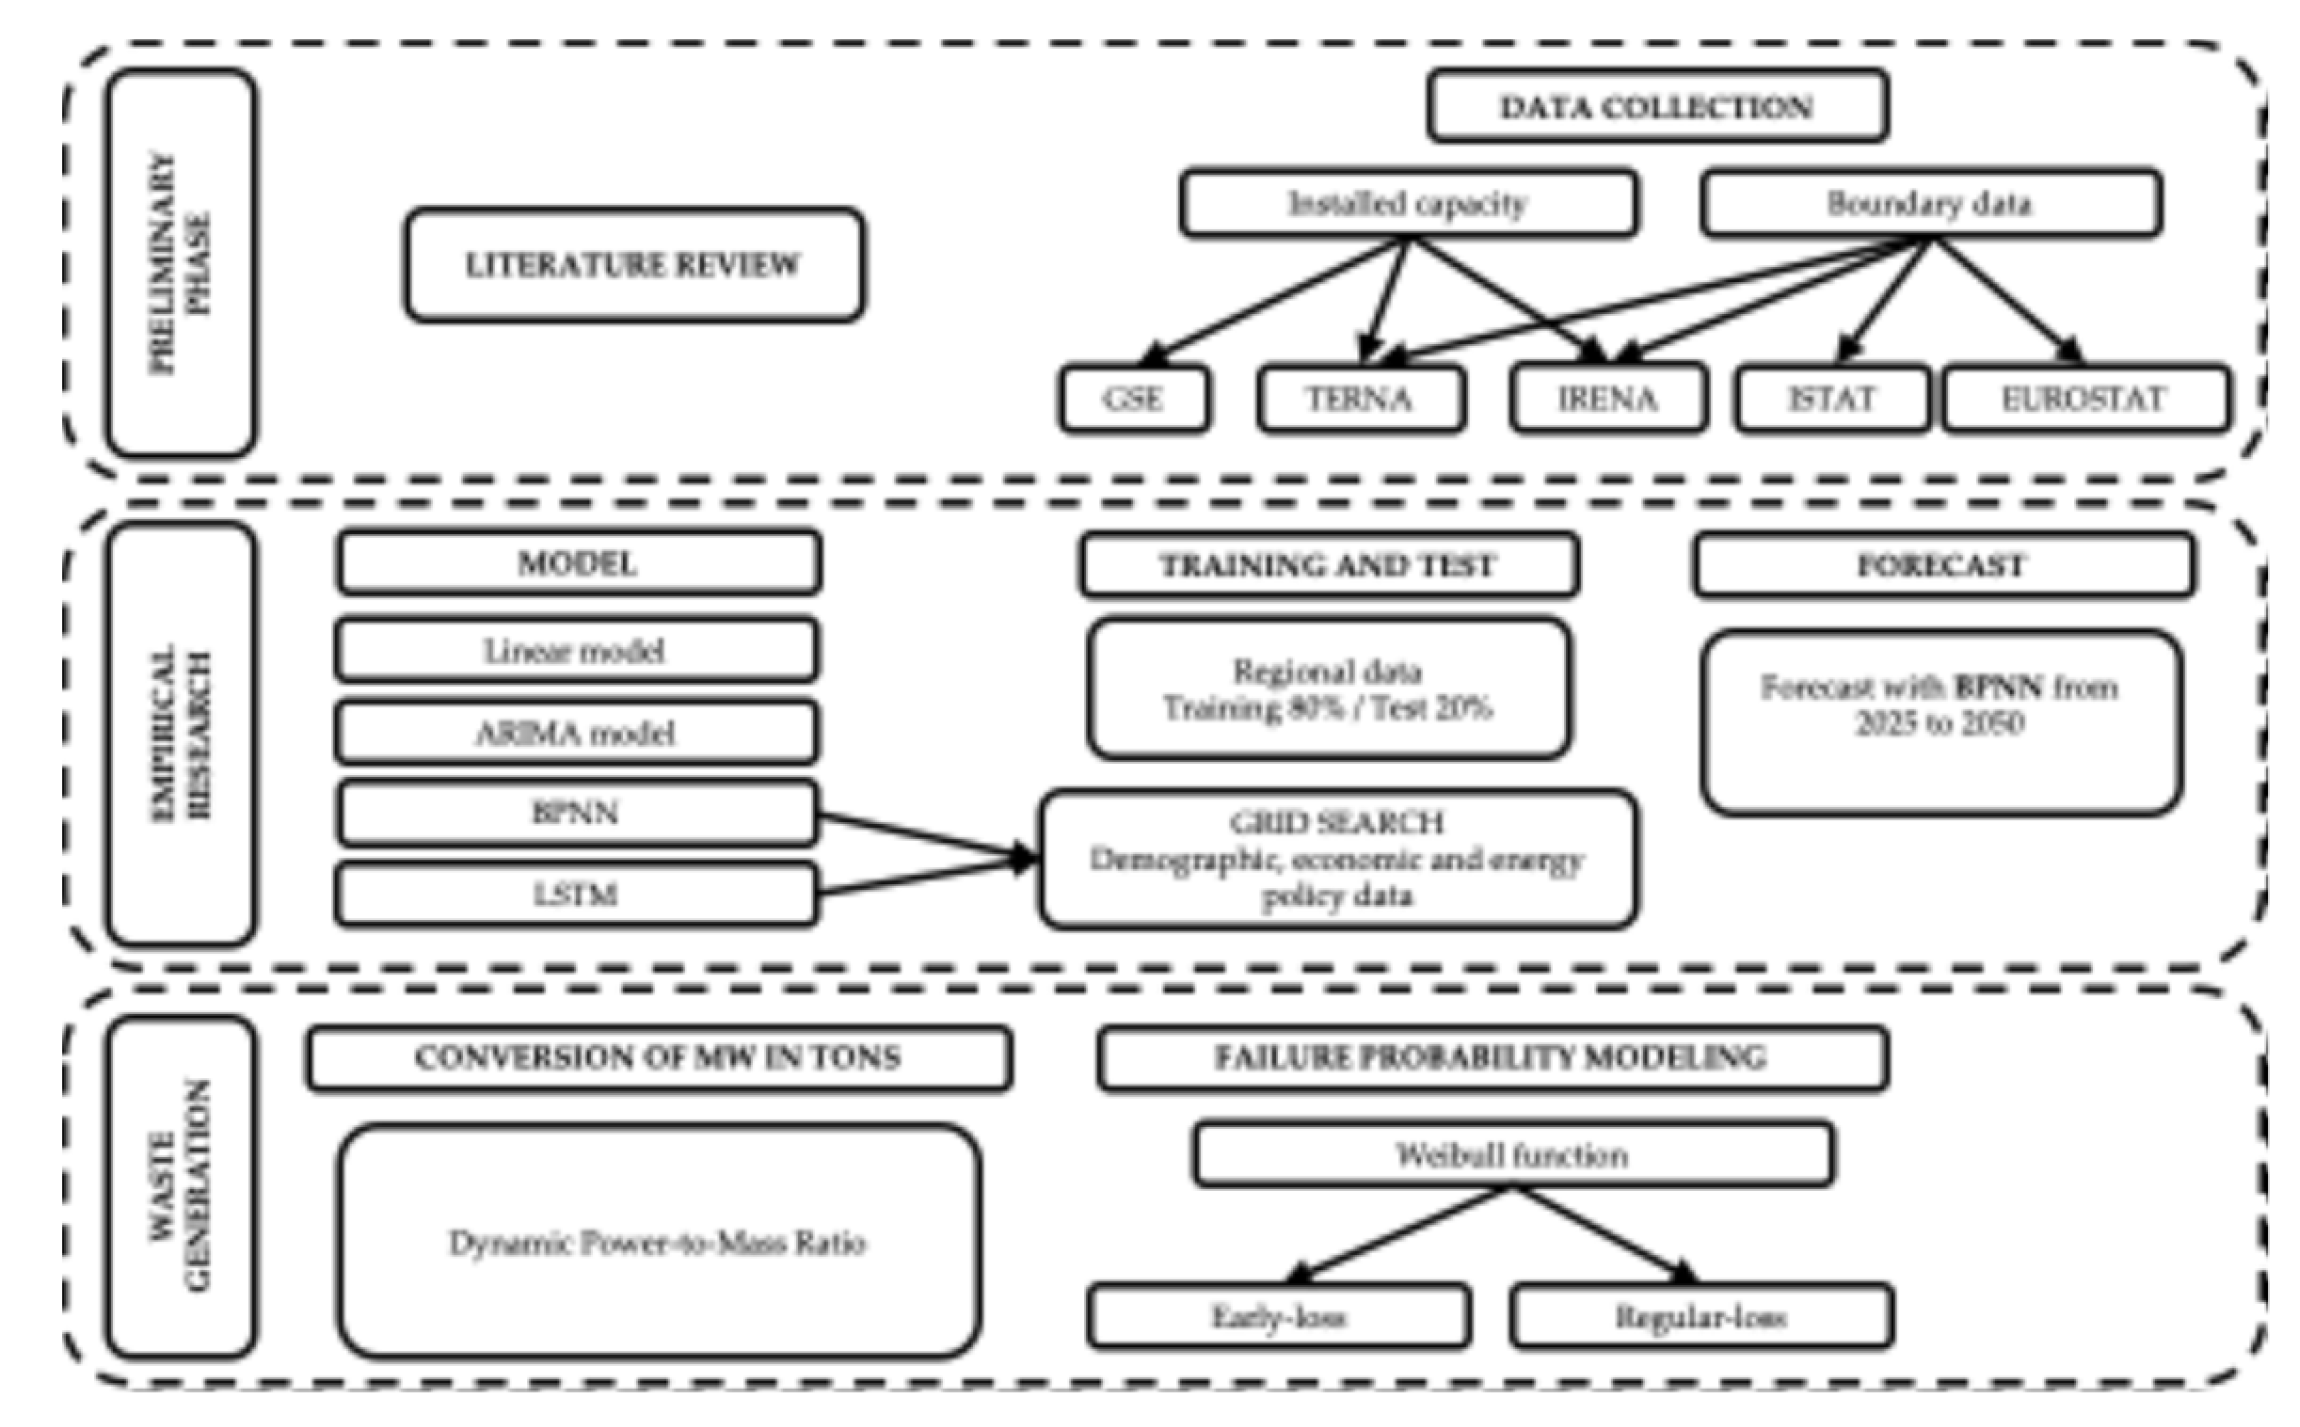
Figure 2.
Evolution of Installed PV Capacity in the Top 8 European Countries (2015–2024). Source: Renewable Capacity Statistics, 2025 (IRENA).
Figure 2.
Evolution of Installed PV Capacity in the Top 8 European Countries (2015–2024). Source: Renewable Capacity Statistics, 2025 (IRENA).
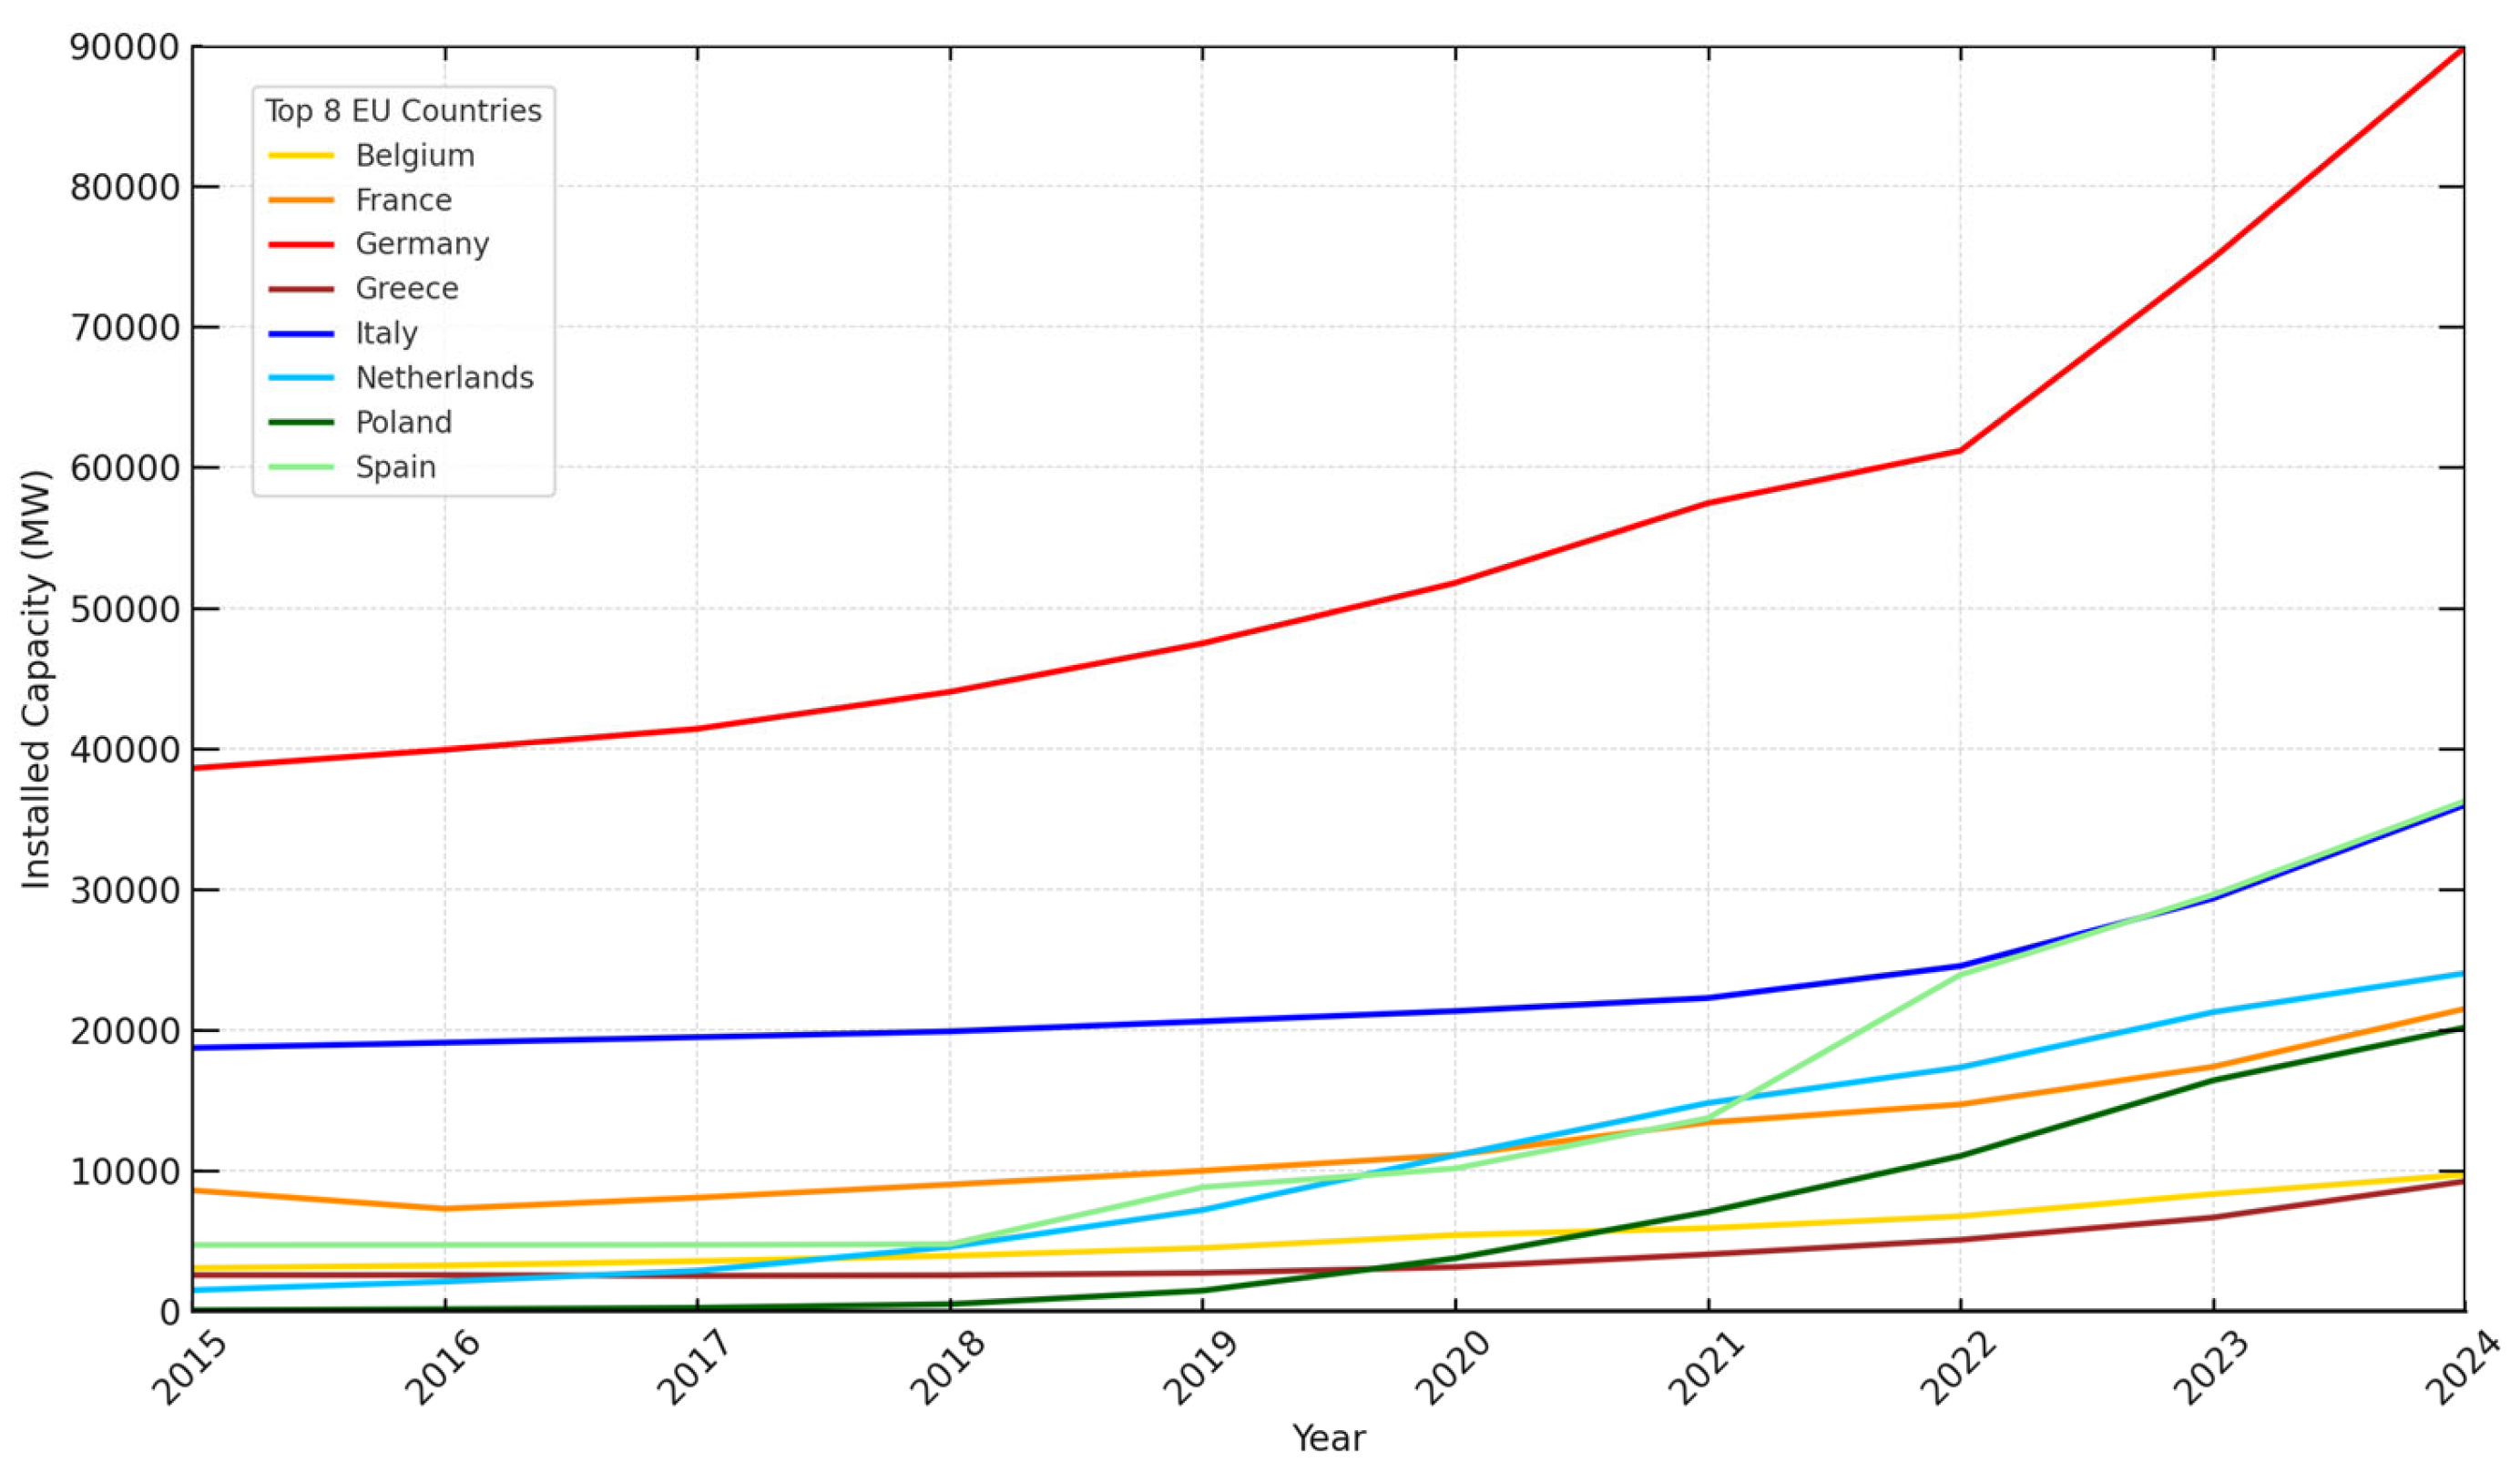
Figure 3.
Historical data (2008–2024) and projected photovoltaic installed capacity (2025–2050) for the three Italian macro-areas. Projections are based on BPNN forecasts at regional level. (a) North Italy: regional trends for Lombardia, Veneto, Emilia-Romagna, Piemonte, Liguria, Friuli-Venezia Giulia, Trentino-Alto Adige, and Valle d’Aosta; (b) Central Italy: regional trends for Lazio, Toscana, Marche, and Umbria; (c) South Italy: regional trends for Puglia, Campania, Calabria, Sicilia, Basilicata, Molise, and Sardegna.
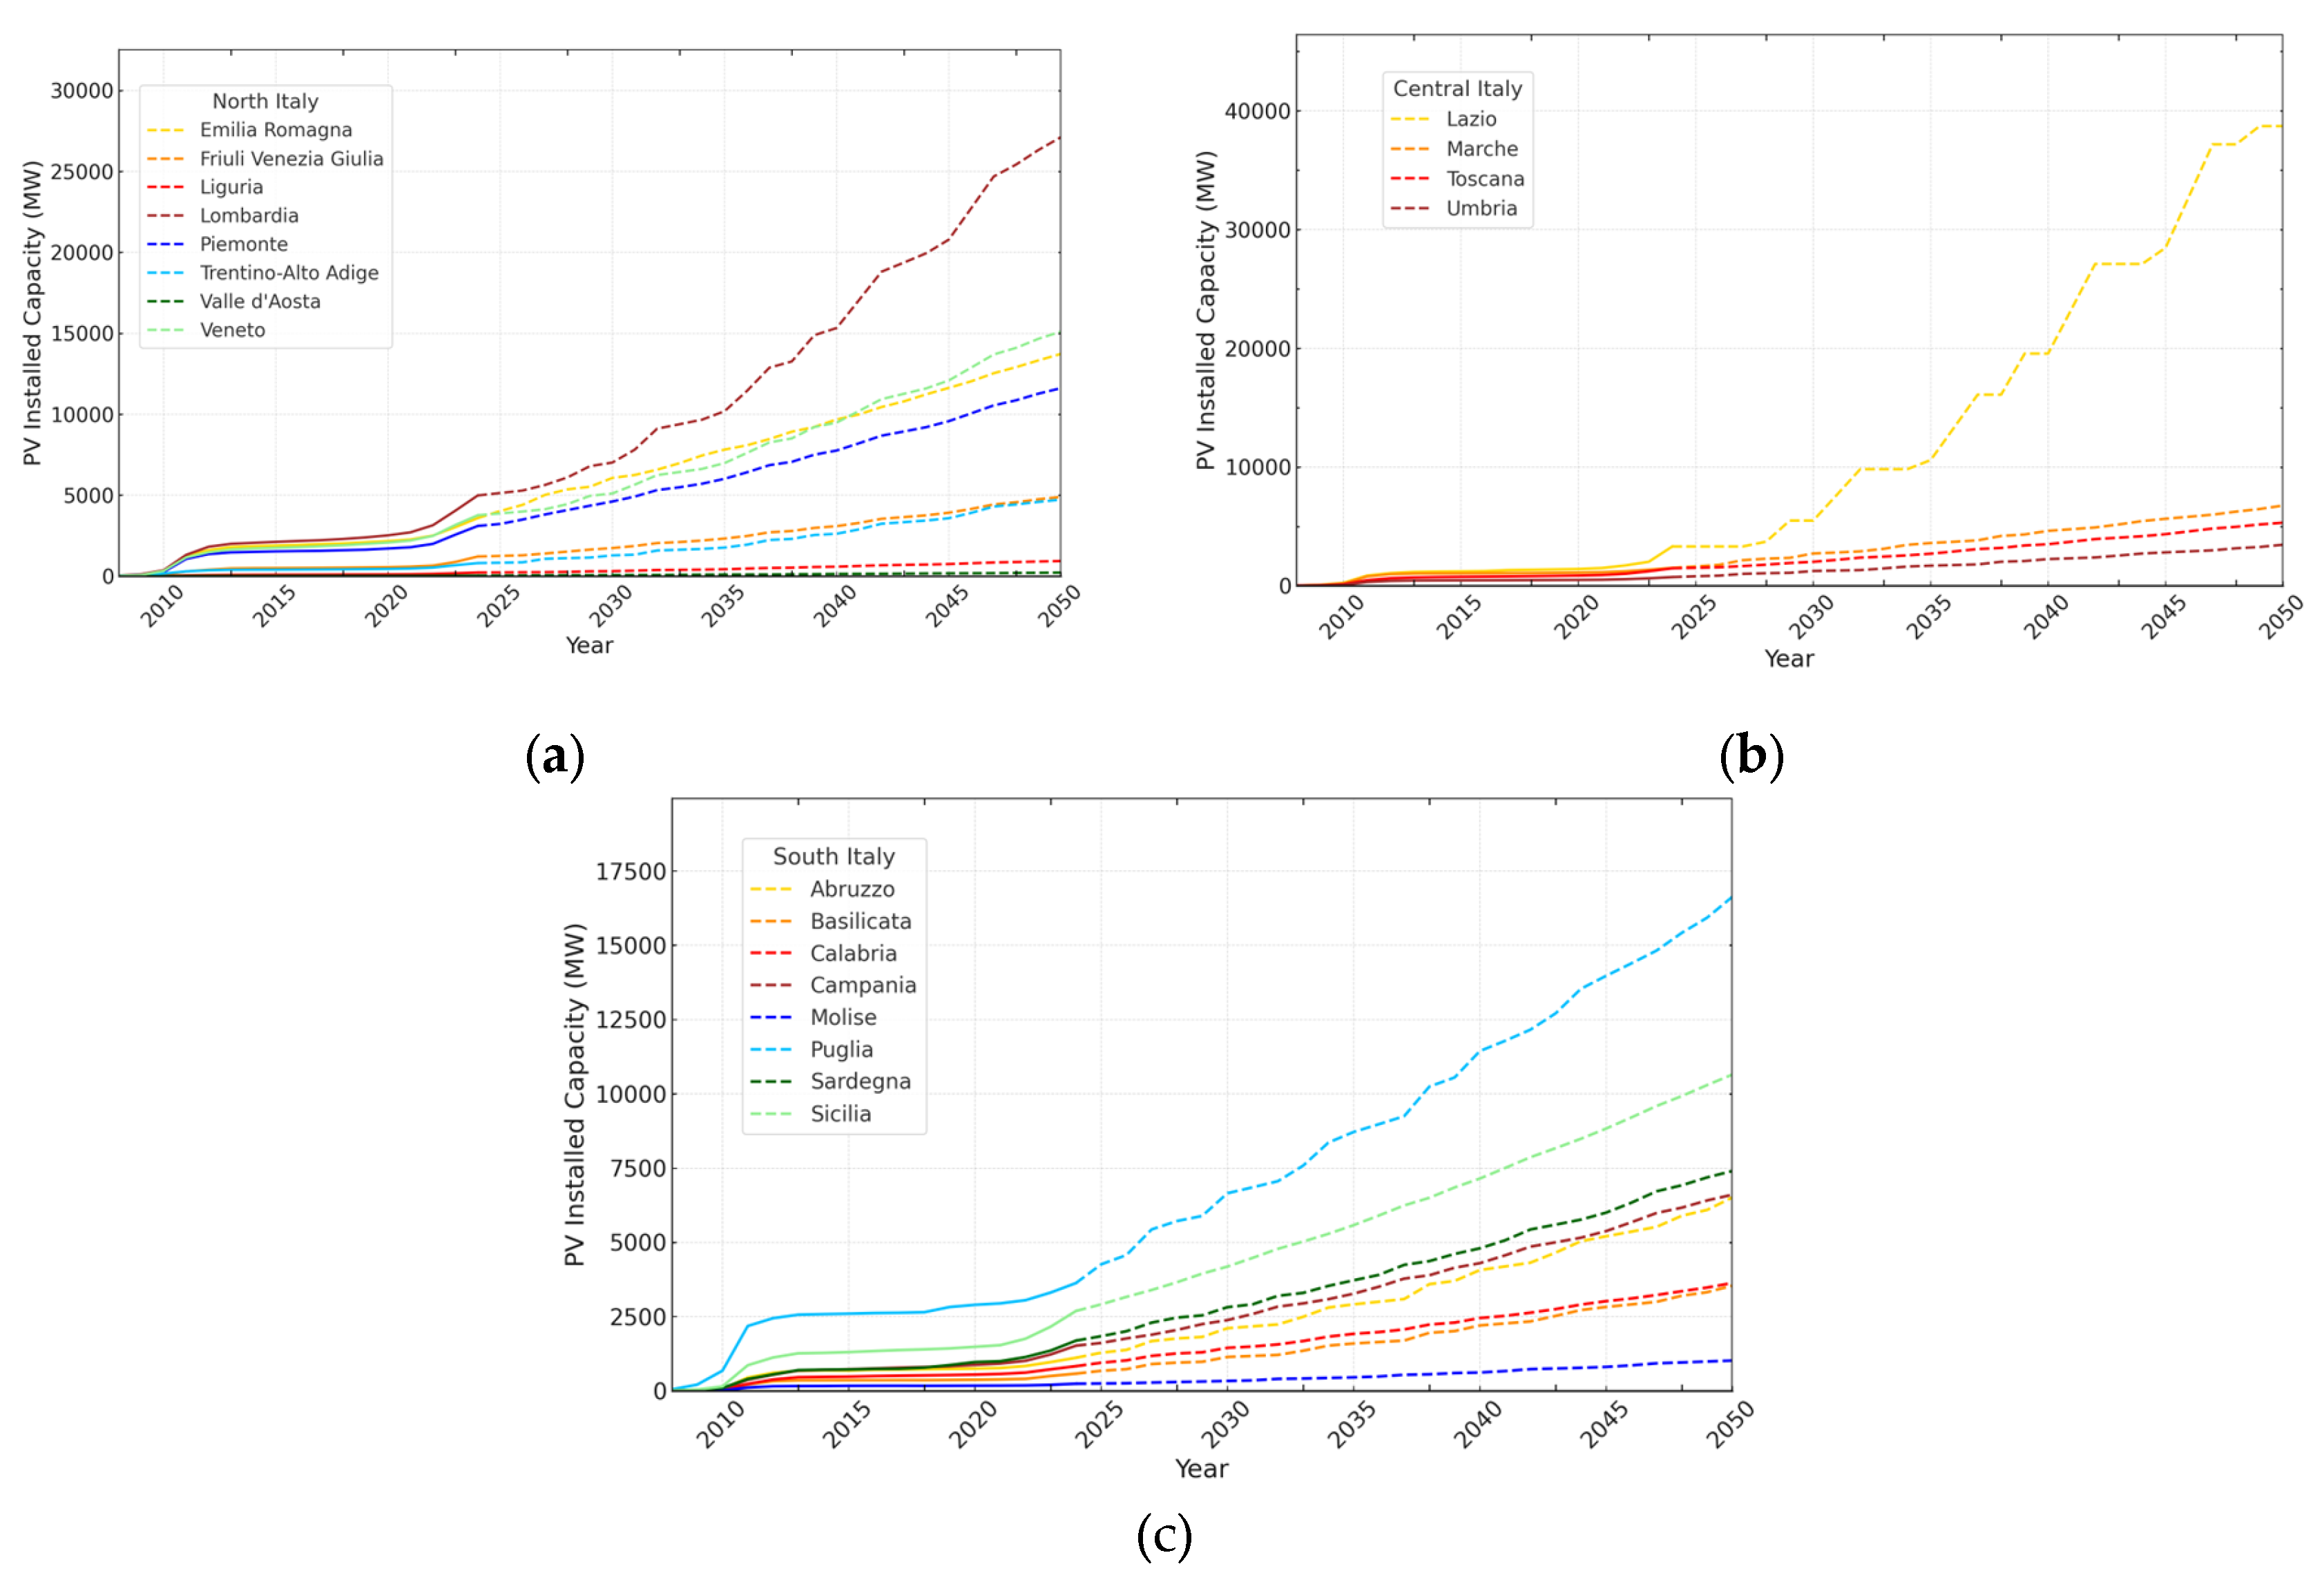
Figure 4.
Projected photovoltaic waste generation (2025–2050) in tonnes for the two EoL scenarios across Italian macro-areas. Results are disaggregated at regional level. (a) Early-loss scenario for North Italy; (b) Regular-loss scenario for North Italy; (c) Early-loss scenario for Central Italy; (d) Regular-loss scenario for Central Italy; (e) Early-loss scenario for South Italy; (f) Regular-loss scenario for South Italy.
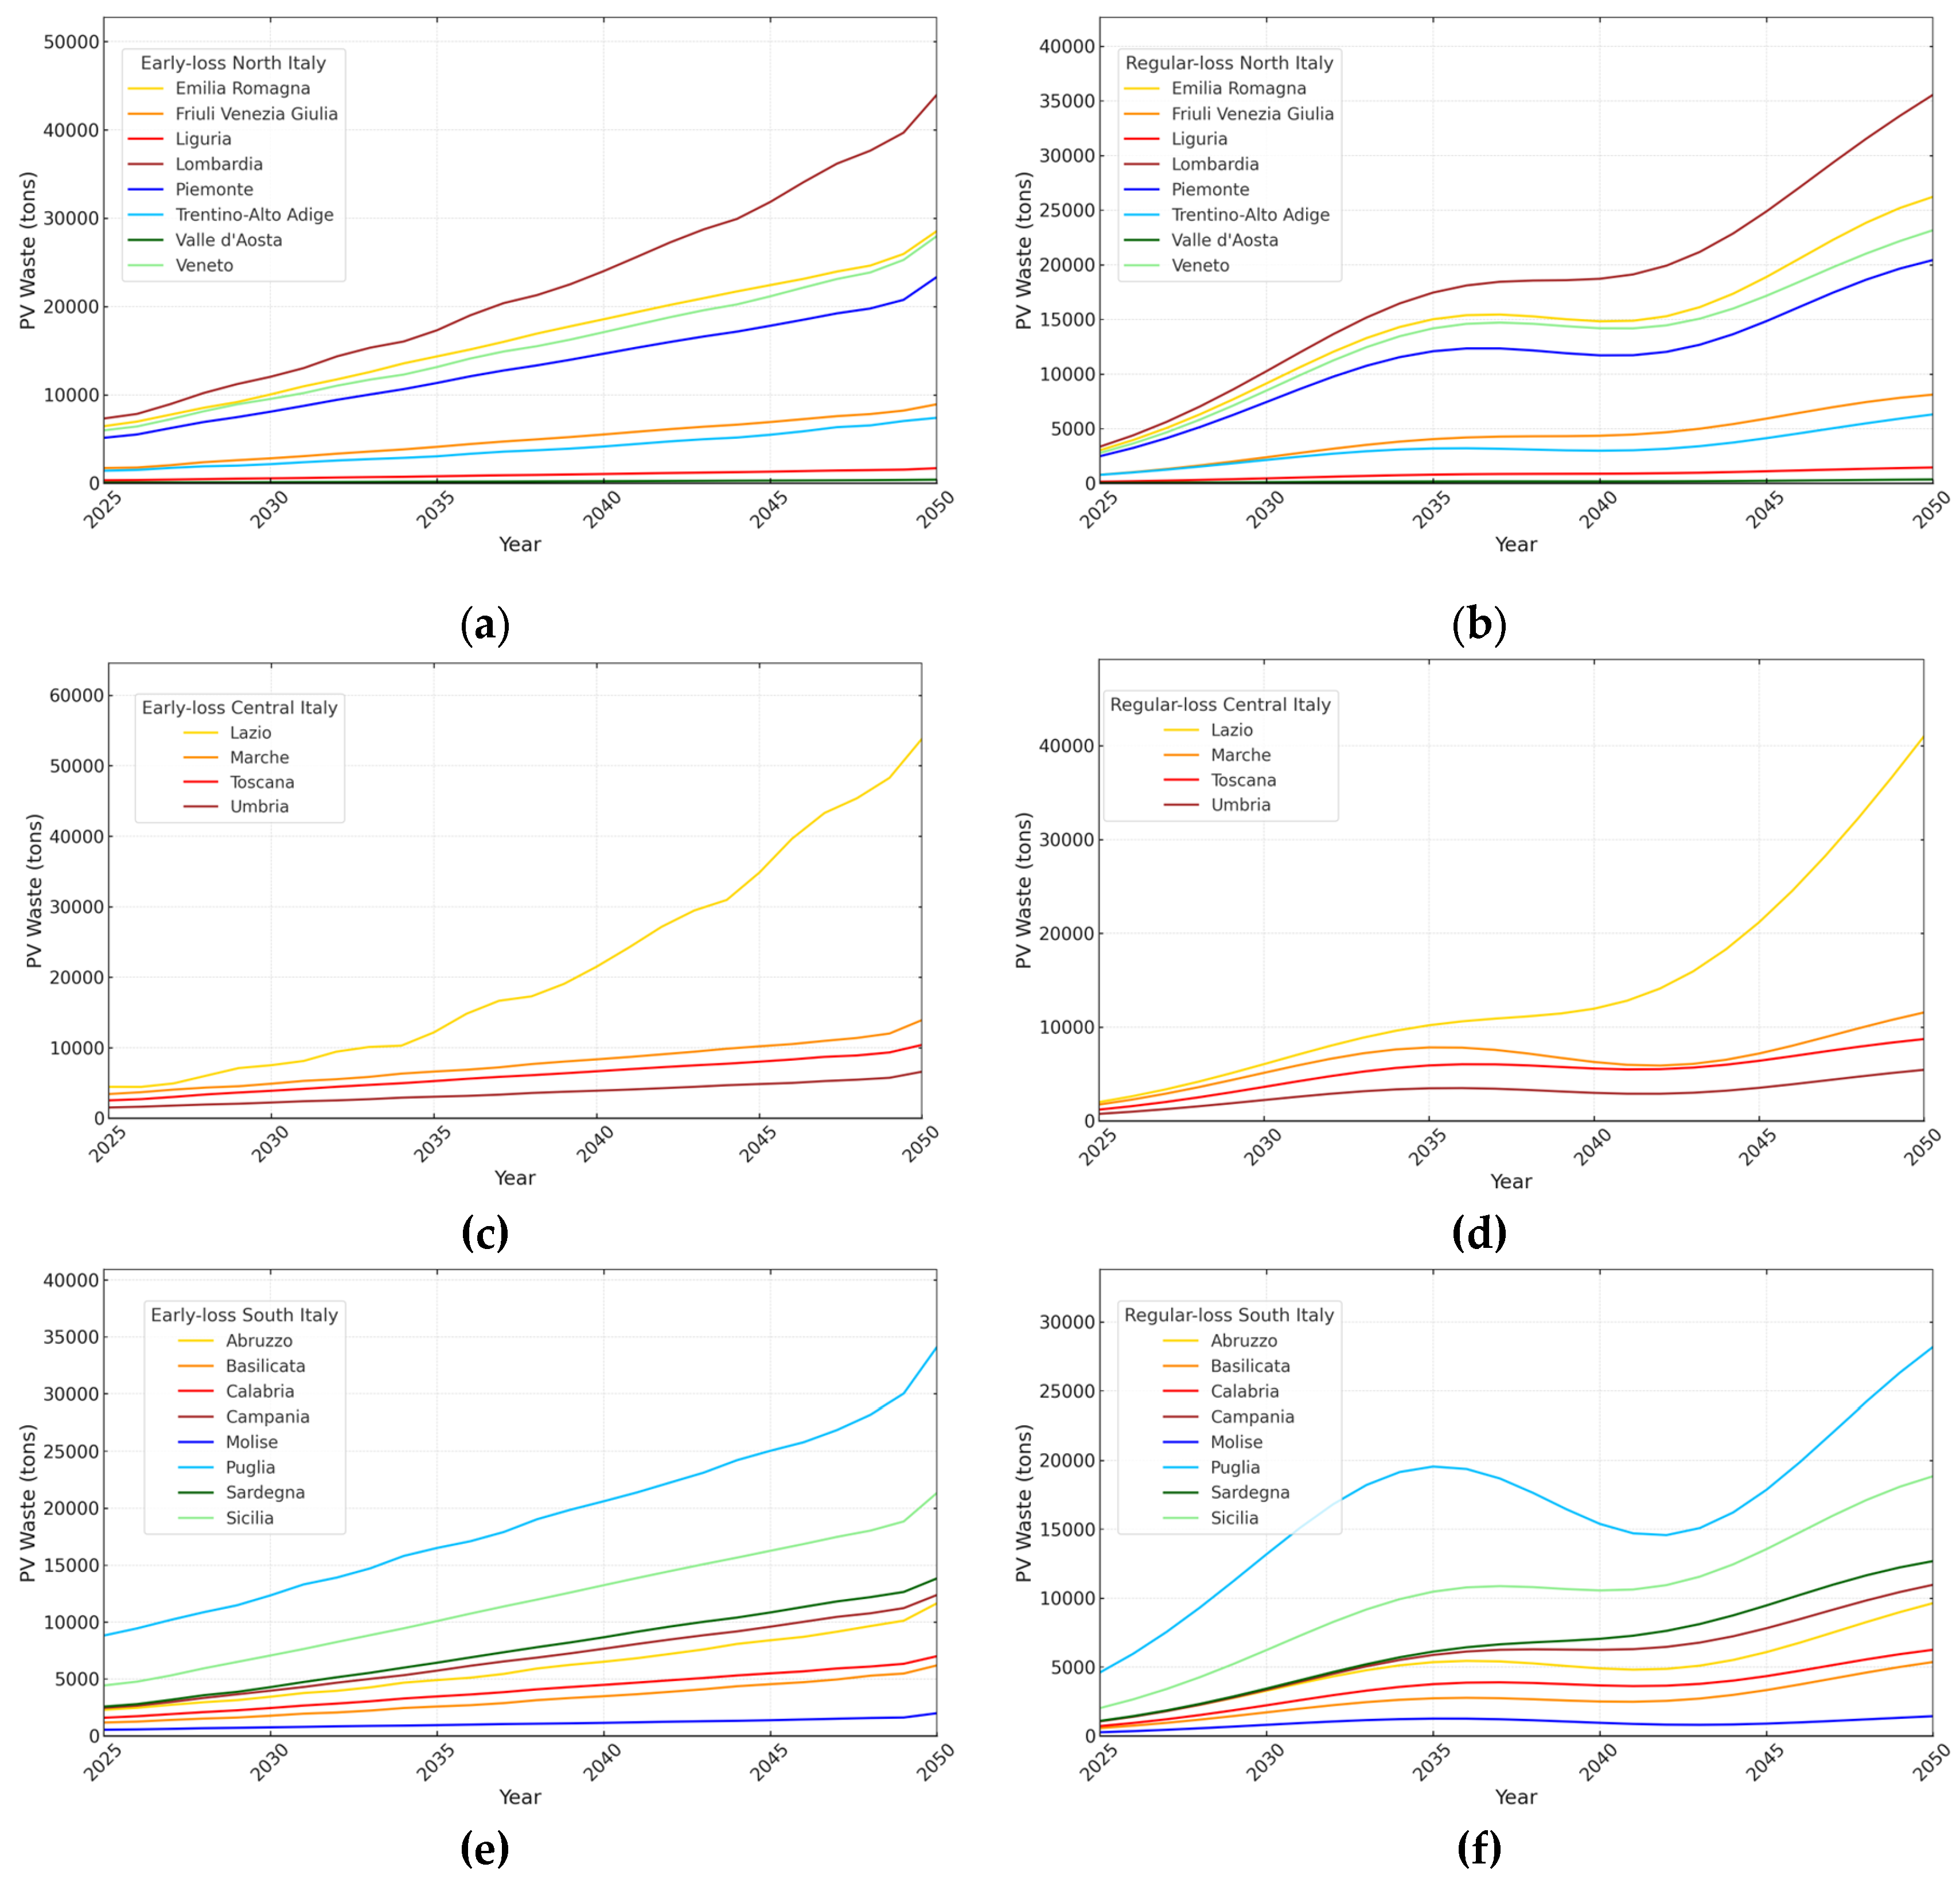
Figure 5.
Historical (2008–2024) and projected (2025–2050) installed photovoltaic capacity in Italy. The figure also highlights the 2030 national targets set by the PNIEC in its original 2019 version (52 GW) and in the updated 2023 version (approximately 79 GW). The projection is based on national aggregation of regional BPNN forecasts.
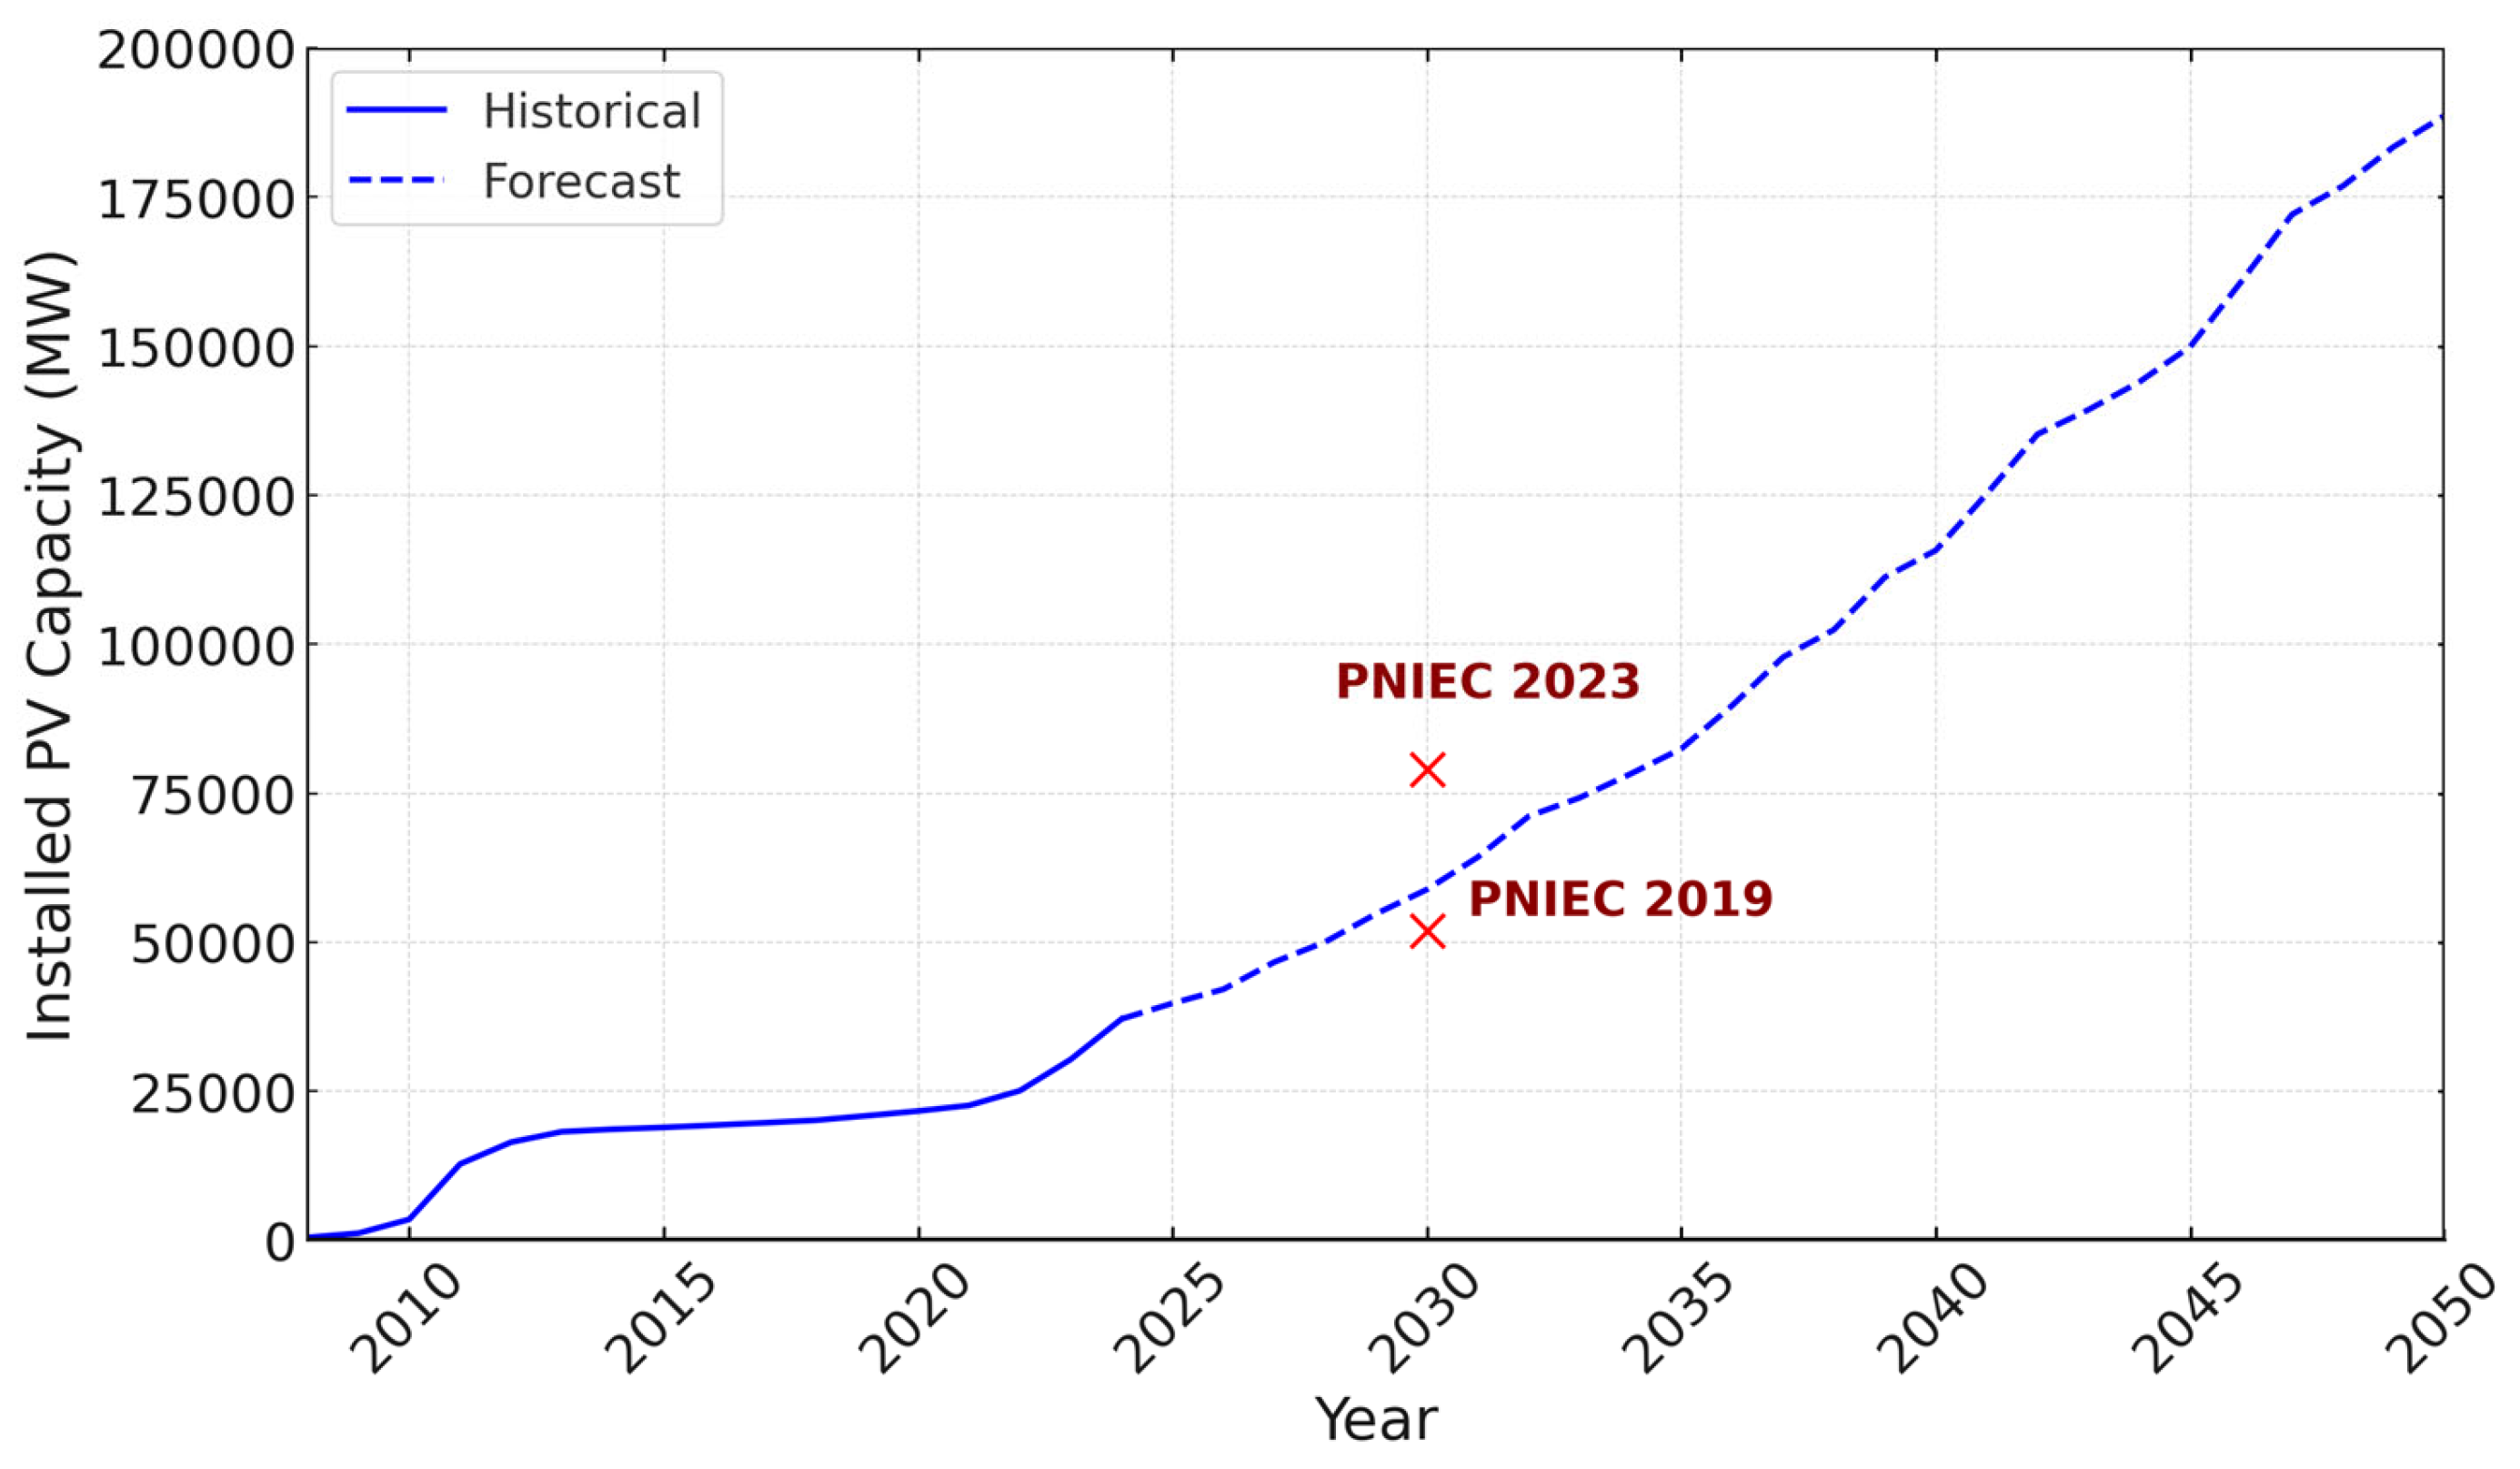

Table 1.
Error characteristic for our four prediction methods.
| Linear model | Arima | BPNN1 | LSTM1 | |
|---|---|---|---|---|
| R^2 | -0,1949 | -2,6088 | 0,90561 | 0,72345 |
| RMSE | 355,23 | 488,57 | 171,45 | 336,54 |
1 For BPNN and LSTM we report the mean of the region’s best results from the grid search.
Disclaimer/Publisher’s Note: The statements, opinions and data contained in all publications are solely those of the individual author(s) and contributor(s) and not of MDPI and/or the editor(s). MDPI and/or the editor(s) disclaim responsibility for any injury to people or property resulting from any ideas, methods, instructions or products referred to in the content. |
© 2025 by the authors. Licensee MDPI, Basel, Switzerland. This article is an open access article distributed under the terms and conditions of the Creative Commons Attribution (CC BY) license (http://creativecommons.org/licenses/by/4.0/).
Copyright: This open access article is published under a Creative Commons CC BY 4.0 license, which permit the free download, distribution, and reuse, provided that the author and preprint are cited in any reuse.


