Submitted:
26 May 2025
Posted:
27 May 2025
You are already at the latest version
Abstract
Understanding public service performance remains a persistent challenge, particularly when services are delivered through complex interorganizational networks. This difficulty is amplified in contexts addressing wicked problems such as homelessness, where needs are multifaceted, solutions are interdependent, and outcomes are hard to measure. In the United States, the Continuum of Care (CoC) system represents a federally mandated and HUD-funded network model designed to coordinate local responses to homelessness through collaborative governance. Despite its standardized structure and federal oversight, CoC performance varies significantly across regions. This study investigates the conditions that influence CoC network performance, focusing on the delivery of Permanent Supportive Housing (PSH) services, a critical intervention for addressing chronic homelessness. It applies a dual-theoretical framework that combines Ansell and Gash’s collaborative governance model with Emerson et al.’s integrative framework, allowing for a comprehensive assessment of internal network factors—such as board composition, leadership structure, and HUD funding—and external system contexts, including political orientation, income levels, and housing market pressures. Drawing on regression analysis of data from 343 CoCs across the United States, the study identifies structural and contextual drivers of high-performing networks. The findings contribute to the literature on public service delivery in complex systems and offer actionable insights for improving collaborative responses to entrenched social problems.
Keywords:
Public Service Network Performance
; Collaborative Governance
; Homelessness
; Permanent Supportive Housing (PSH)
; Continuum of Care (CoC)
1. Introduction
The provision and delivery of public services to address multifaceted societal challenges like homelessness, crimes and health inequity have become complex due to the growing interdependence of the organizations across sectors-governmental, nonprofit and private. Therefore, collaborative service networks for public service delivery has been increasingly adopted in public service domains like homelessness where multiple organizations collaborate in a network setting pooling resources, expertise and capabilities to improve the effectiveness and reach of services. Evaluating the performance of such networks is therefore crucial to ensure that these vital services are effectively provided to the vulnerable population that needs it, while maximizing the use of the limited, scarce public resources.
In recent years, studies on homeless service delivery have focused primarily on the Continuum of Care (CoC) networks- federally funded homeless service programs that mandates organizations within communities to collaborate in order to address homelessness through collaborative governance structures across the United States. Although CoC networks are designed to promote coordinated and data-driven responses to homelessness, their performance varies significantly across regions. This variation highlights the importance of examining the factors that influence network effectiveness and points to a critical area of inquiry in the broader field of public service network performance.
This study examines the factors that influence the performance of the public service network, the Continuum of Care (CoC) homeless service networks, with a specific focus on the Permanent Supportive Housing (PSH) services, one of the major and highly funded services of the CoC. The study analyzes internal network dynamics and external system context to examine its effect on the CoC network performance across the United States.
2. Research Objective
This study explores the performance of public service network in context of human services-specifically homeless service networks’ ability and capacity to provide homeless services to the vulnerable homeless population. It explores the critical internal network factors like board member size, leadership and funding and external system context like political climate, gross household income and median rent, and its effect on the CoC network’s ability to perform effectively. By incorporating both internal factors and external system contexts, and exploring real-world performance of CoCs, the study provides a more nuanced understanding of the complex interactions shaping CoC performance.
The study contributes to the field of public service network performance research in several ways. First, the study includes multiple internal network conditions and external system context factors such as nonprofit leadership, board member size, federal funding, political climate, and socioeconomic conditions as influencers of network performance to offer a comprehensive evaluation of network performance within the context of public service delivery networks. There have been significant advances in the study of public service network performance over the past where scholars have tested various network factors such as leadership, network size, funding, and external socio-political conditions as potential influencers of CoC performance [1,2,3,4,5,6,7,8,9,10,11], however, there are still significant gaps remaining in the study of public service network performance which lacks a comprehensive study that considers both internal network factors and external system context to study the network performance. Public service network performance studies that examine the impact of external system contexts as critical influencers of network performance remain scarce. These may include socioeconomic conditions, policy or political climate, that can significantly influence network performance [12,13]. It is the surrounding system context factors which can be a host of political, legal, socioeconomic, environmental (Emerson et. al., 2011), and other influencers that affect, and are affected by the collaborative governance networks. The collaborative governance evolves within this system context which are multi-layered and can create opportunities as well as pose unanticipated challenges, for example- an election, economic downturn, new regulation, natural disaster, thereby influencing network dynamics and network performance. In this regard, system context are critical influencers of network as they can affect its performance anytime expectedly or unexpectedly.
For instance, Mosley and Park (2022) examined how external political conditions, such as local government support for affordable housing initiatives, shape the performance of Continuum of Care (CoC) networks. They found that political environments that prioritize housing solutions help CoC networks succeed, while restrictive zoning regulations or political opposition can hinder their efforts. Dobbin et al. (2022) studied socioeconomic conditions and found that they also drive network performance outcomes. However, these studies focus on only qualitative methods and small sample sizes of fifty or less to explain external environment factors as key determinants of network performance leaving a gap to pursue statistical analysis research to explore the same which this research explores.
Second, this study develops a theoretical foundation by integrating two influential theories of network performance: Ansell and Gash's (2008) collaborative governance theory, which focuses on internal network dynamics, and Emerson et al.'s (2011) integrative framework of collaborative governance, which includes environmental factors that are the system contexts as determinants of performance. While their theories provide a theoretical framework and generic foundation for evaluating public service network performance, this study applies and tests these theories in a human and social service setting of public service-most specifically the homeless service network.
There is a need for innovative theories that reflect current social, economic, and political contexts. While a few scholars have developed configurational theories to measure network performance, these approaches are still at nascent stages. For example, Turrini et al. (2010) conducted a meta-analysis to explain network performance based on Provan and Milward's (1995) framework, proposing structural and functional characteristics of networks as key performance factors. Raab et al. (2013) added network age as a factor in their analysis and used more complex data analysis techniques to explore nonlinear relationships. Wang (2016) also developed a configurational theory using Provan and Milward's model but found, contrary to their conclusions, that network density, rather than centralization, is more important in influencing performance. These findings need further exploration using new theories which this research aims to address.
And third, this research deploys a robust statistical method of regression using a large sample size of 343 CoC networks across the United States to address the issue of generalizability and reliability. Research on studying network factors and their effect on network performance using rigorous methods often involve small sample sizes, limiting the generalizability and reliability of their findings. For instance, Wang (2015) demonstrated data analysis but with a sample size of fewer than fifty cases. This study fulfills the research objectives by exploring the following research question: What internal network conditions and external system contexts affect the performance of CoC networks in delivering homeless services?
The study examines the determinants of Continuum of Care (CoC) network performance through statistical analysis of network-level factors. This inquiry is particularly timely, as CoC performance offers valuable insight into the conditions and mechanisms that influence effective collaboration in addressing homelessness. By analyzing a national sample of 343 CoCs across the United States, the study explores both internal network dynamics and the influence of external system context on performance variation. As HUD (2023) mentions, this measurement involves identifying performance indicators and criteria, collecting relevant data, and using a measurable and quantifiable approach to assess progress. In addition to this, by exploring which of the internal factors and system context have strongest influence on CoCs, CoCs can compare, improve, sustain and justify their efforts and ensure that resources are being directed where they will have the most significant impact for the vulnerable homeless population that need them.
3. Theoretical Framework
The research integrates Ansell and Gash’s (2007) collaborative governance theory, which emphasizes the importance of broad network membership, inclusive network structures, facilitative leadership and rich resources, with Emerson et al.’s (2011) collaborative governance framework, which considers for external environmental conditions-that are the system context such as political climate and socioeconomic conditions that shape collaborative network performance. The dual-theory approach allows for a comprehensive assessment of CoC networks, considering both internal network dynamics and broader external system-level influences.
Ansell and Gash’s (2007) collaborative governance theory that argues that inclusion of large number of board members that are diverse, and that are affected by, or care about the issue helps in successful collaboration outcomes and that leadership of collaborative governance networks must be facilitative with leaders within the community who are organic and operate within the stakeholders’ community.
Emerson et al.’s (2011) integrative framework of collaborative governance defines external environmental factors as system context such as political climate and socioeconomic conditions which affect the collaborative network process and outcomes. The system context in Emerson et al. (2011) integrative framework demonstrates a significant addition to Ansell and Gash (2007) theory, in that it considers wider system factors that are external to the collaborative governance network but significantly influence collaborative process, outcome and overall performance.
System context in Emerson et. al. (2011) framework is the surrounding system context factors which can be a host of political, legal, socioeconomic, environmental and other influencers that affect, and are affected by the collaborative governance networks. It states that collaborative governance evolves within this system context which are multi-layered and can create opportunities as well as pose unanticipated challenges, for example- an election, economic downturn, new regulation, natural disaster thereby influencing network dynamics and network performance. In this regard, system context are critical influencers of network as they can affect its performance anytime expectedly or unexpectedly. While Emerson et al. (2011) framework provides an overall generic theoretical framework to assess public service network performance, we apply this system context and test it in a social and human services context – more specifically, the homeless service network. System contexts are critical to be examined for CoC network performance as well as political climate and socioeconomic conditions can enhance or impede a CoC network’s ability to performs successfully. For example, CoC may have challenges if the political climate of their area restricts the development of affordable housing or imposes zoning regulations that will seriously limit the placement of homeless shelters and supportive housing. The CoCs collaborate with the federal, state, and local governments to execute and grow homelessness services. The political climate can affect the government's will to work with the CoCs and provide them with resources and support. In a supportive political climate, there opens opportunities for CoCs for coordination, resource acquisition, and collaboration. The political climate also helps shape the public's perception of their support for effective homelessness solutions.
The integration of these theories provides a structured framework for evaluating CoC networks and contributes to the broader literature on public service network effectiveness. The study tests this collaborative governance theory in the context of homeless services, that is the CoC network for which collaboration is not only necessary, but also mandatory.
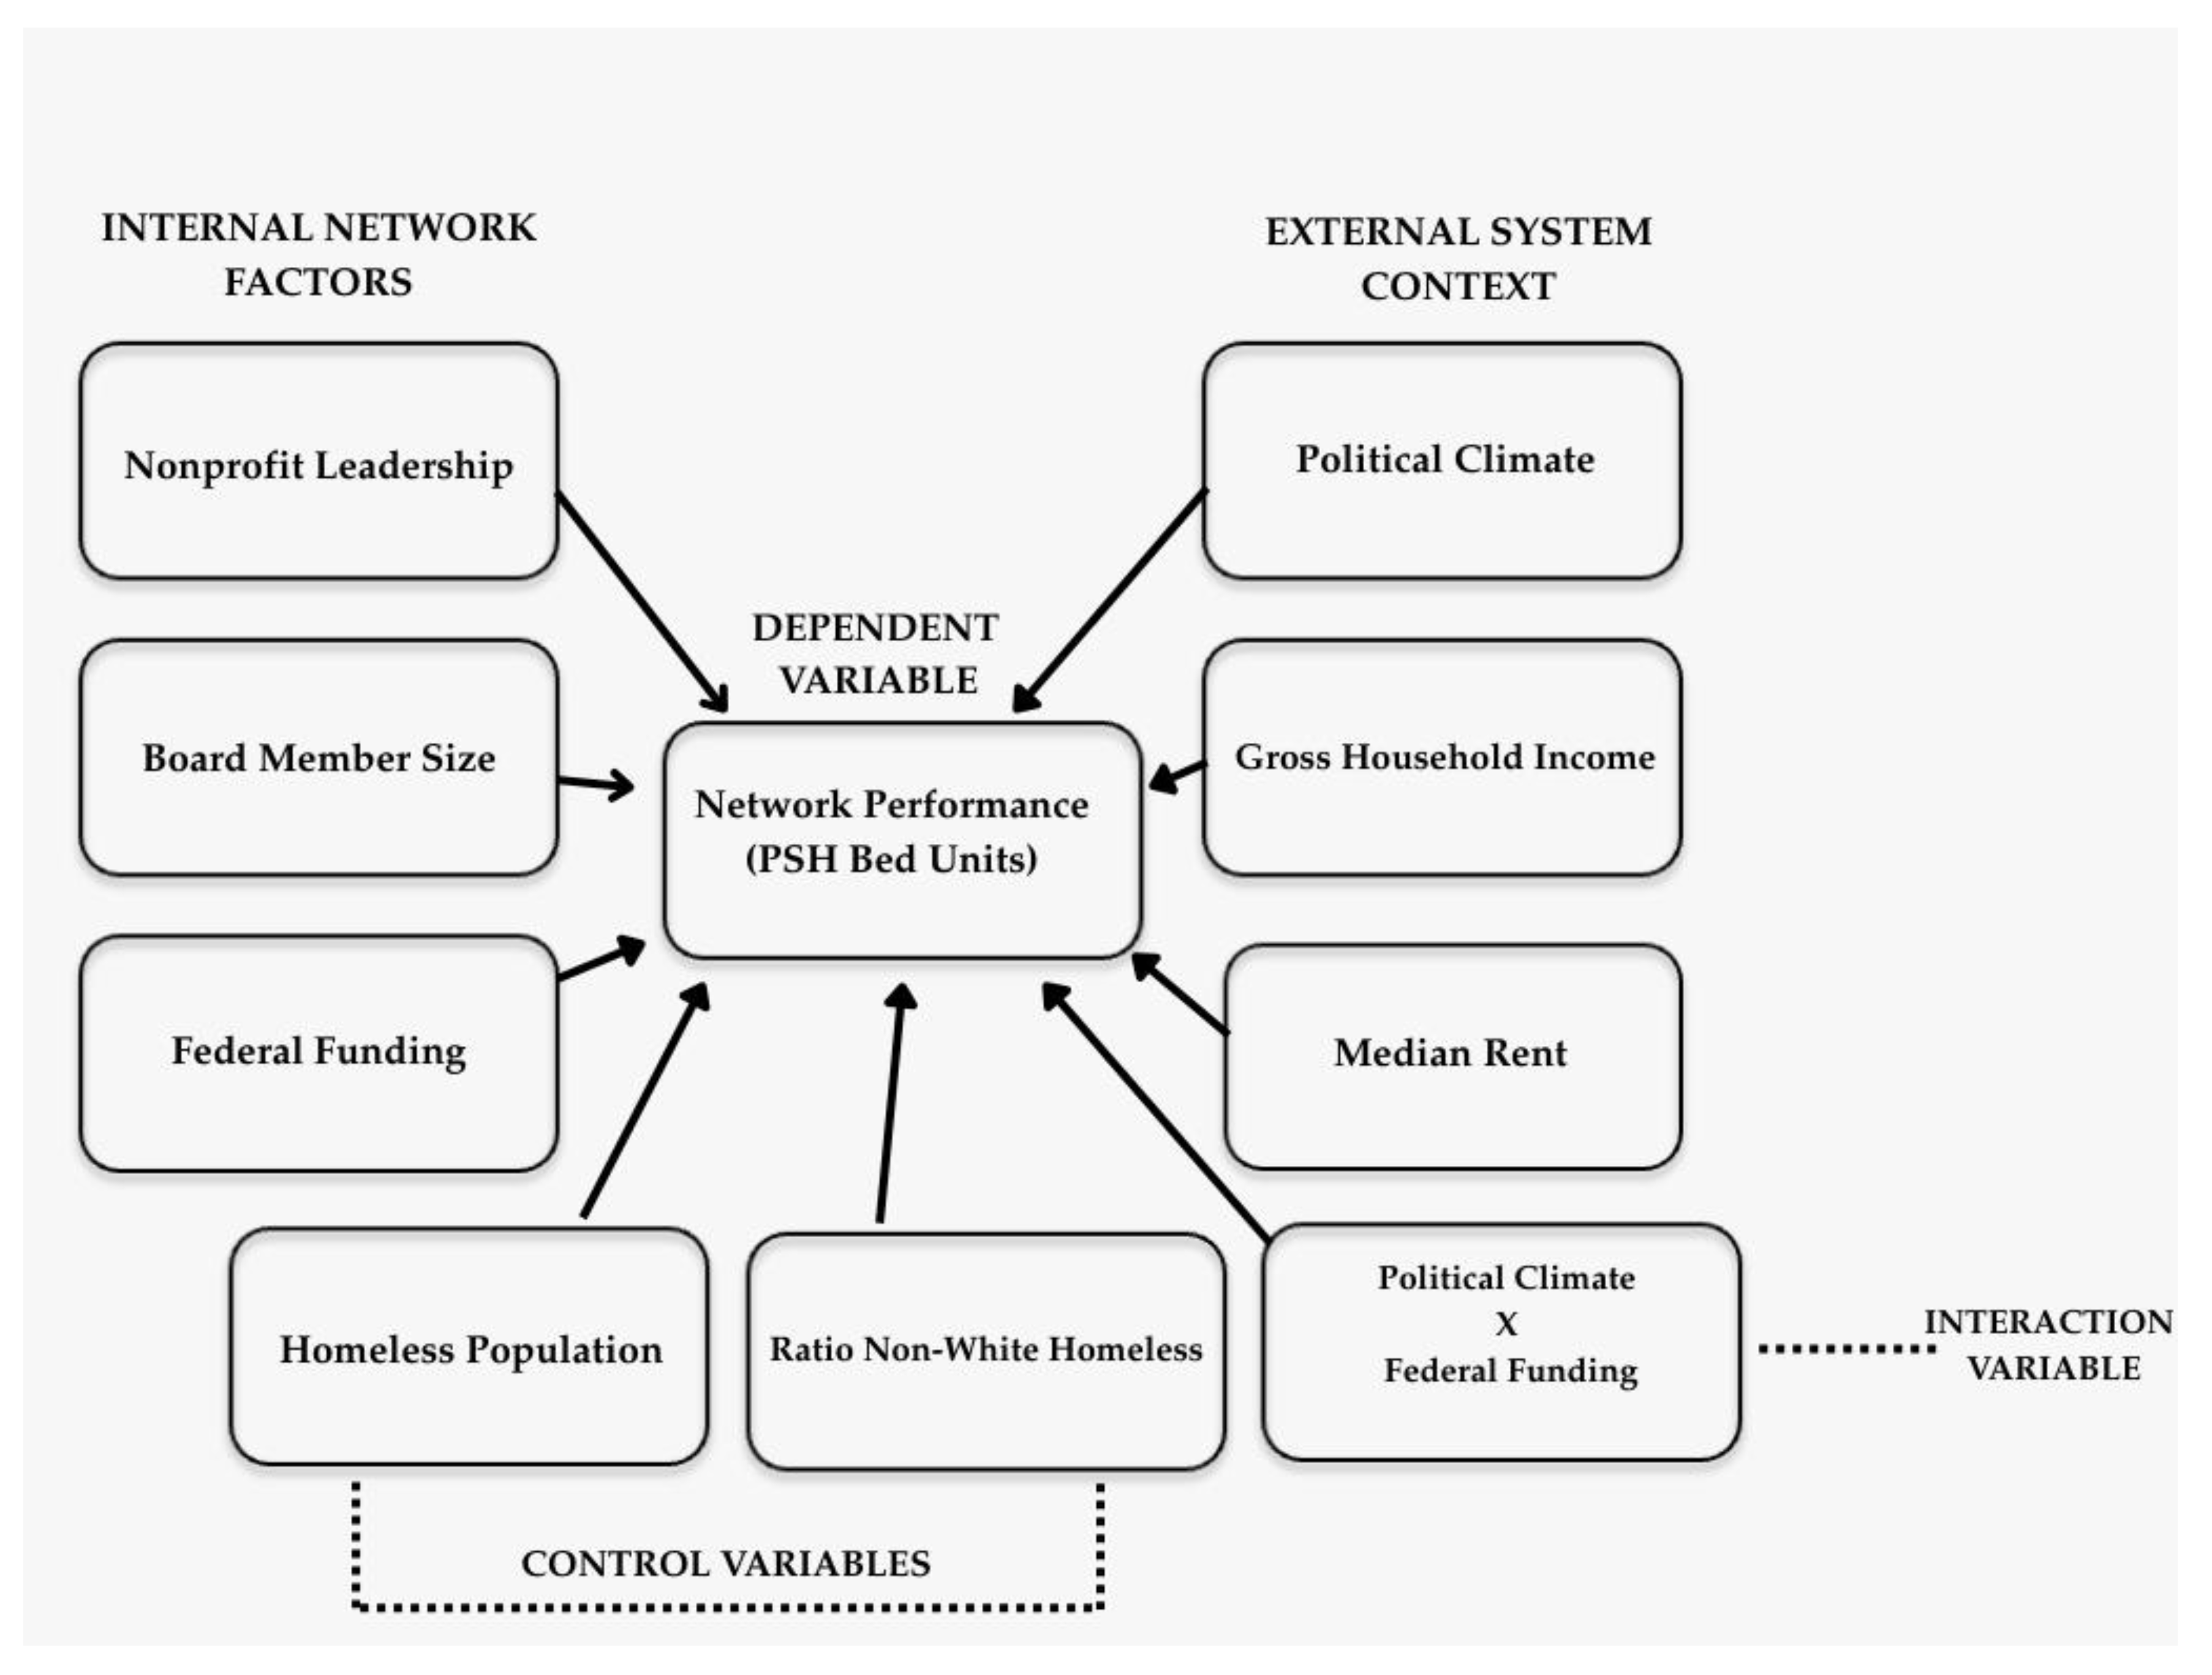
Seven hypotheses are formulated to test the effects of nonprofit leadership, board member size, federal funding, political climate, gross household income, and median rent as independent variables on the dependent variable- CoC network performance which is operationalized by PSH bed units’ availability. The study hypothesizes that nonprofit-led CoCs, larger CoC board, and higher federal funding will enhance network performance (measured by PSH service availability) by fostering inclusivity and resource mobilization. It also hypothesizes that favorable political climates will have positive effect on PSH service availability where political climate and policies supportive to homelessness will help in smooth delivery of homeless services for the CoCs with minimal political barriers. It also posits that CoCs in areas with higher gross household income have higher PSH availability due to rich resources and that areas with high median rent will have lower PSH availability due to housing unaffordability and limited housing supply issues. Similarly, an interaction variable is explored where effect of political climate on federal funding is tested. A hypothesis- a favorable political climate will aid in high federal funding is formulated.
Hypothesis 1 :
CoC networks led by nonprofit organizations will have higher Permanent Supportive Housing (PSH) bed unit availability
Ansell and Gash (2007) emphasized the role of leadership in improving collaborative network outcomes. The type of organization that leads the collaborative network significantly affects how the network initiates, performs and sustains. Their collaborative governance theory stresses on the need to engage of diverse non-state actors like nonprofit and community members to contribute their unique resource, skills, experience and perspective for solving public and social issues through collective decision making and problem solving [15]. In this context, the type of lead agency that manages and leads this kind of diverse network also needs to be diverse and inclusive with members from different backgrounds. Diversity and inclusivity also helps create legitimacy and credibility as it reflects decisions and interests of wider individuals. Most public service networks like the CoC network include organizations from public, nonprofit and for-profit sectors. Each sector has their own set of strategies and capacities on how they operate and manage in a network. Therefore, the type of lead agency can have varying effect on the network performance depending on what type of agency is leading the network-nonprofit or government.
Public service network that are led by nonprofits and those that are led by government agencies as Valero et al., (2021) suggest, will have different strategies to manage network, achieve network mission, mobilize resource and expertise and solve problem and conflict. Nonprofits are also increasingly becoming a choice to lead the public service network to deliver public goods and services, primarily in human and social services like homelessness, education, and health care [7]. Multiple empirical studies have shown the effectiveness of nonprofits within public service networks. Valero and Jang (2016), in their study of nonprofits' role in homeless networks, found that nonprofits are key actors in delivering the federal homeless policy and that they take coordination and leadership roles consolidating the efforts of the entire homeless network working to reduce homelessness in the community. Feiock and Jang (2009), in their study of nonprofit contracting in providing elderly service, state that nonprofits significantly mitigate conflicts and tensions between the community and the government since they can relate to community values better than the government.
Nonprofits are increasingly taking network leadership roles in public service networks [9] in addition to only being a service provider in the network. While the government creates policies and funds service programs, nonprofits take charge to implement and lead them to get positive outcomes. In this context, nonprofits are shifting from only co-production to a more diverse role of co-governance, such as design, operation, advocacy, implementation, and network leadership [1,7]. With their proximity to the community, skills, and flexibility, nonprofit can be considered a network partner that has a unique set of distinctive characteristics and skill set to pool resources, skills, and expertise not only from the organization but also from the community by promoting community engagement [36] in solving the community problems. The nonprofit sector plays a significant role in the network for mobilizing the social capital and resources within the community for public service delivery.
Hypothesis 2 :
Continuum of Care (CoC) networks with larger board member size will have higher Permanent Supportive Housing (PSH) bed unit availability.
Ansell and Gash (2007) establish that increased collaborative network performance can be achieved by including many diverse organizations, actors and stakeholders of broad and diverse backgrounds, skills, and expertise. Including such multiple actors enables legitimacy in the collaboration and effective mobilization of power, resource, and expertise. Other studies consider network size as a significant condition for assessing collaboration network processes, outcomes, and effectiveness. In their study of public-nonprofit collaboration in homeless services, Valero, Lee, and Jang (2021) found that the network size significantly impacted the network's capacity to secure federal grants. Their study found that a network that can engage many organizations has a greater capacity to manage service networks and have positive network performance. More extensive networks can serve as a proxy of professionalization to engage in specialized homeless policies [9], will have a greater capacity to mobilize resources, skills, and expertise and manage the network for better outcomes. HUD has specific requirements for the CoC’s composition of board members including that the CoC board must include organizations or projects that serve homeless within the CoC’s geographic area and that it must have at least one homeless or formerly homeless person in the board [18]. However, the number of board members is not mandated by HUD and these numbers vary among CoCs boards.
Multiple studies show that the board size impact CoC performance particularly in areas of resource allocation program outcomes [2,15,17] and governance [1]. Large board size is seen to have positive outcomes especially for programs that have diverse needs [17].
While incorporating board members with expertise that aligns with CoC goals from areas like health, housing and nonprofits is important to stay focused on shared goal, large board size must be balanced with inclusivity, efficiency and clear governance structures to enhance performance. If members from the community are at the planning table, getting involved in decision-making, the realistic needs of the community can be identified and worked upon to address and cater to those needs. There is no one-size that fits all for the number of board members [17], but the size must align with the CoC’s operational context and its goals. Too small board may lack expertise while too big board size may have coordination challenges. Board size based on CoC’s community needs, goals and representation from the stakeholders including homeless people is essential to ensure effective service delivery. Defining roles, responsibilities and accountability will help establish clear roles, regardless of the board size to ensure CoC’s goals are met.
Hypotheses 3 :
CoC networks that receive higher amounts of federal funding will have higher Permanent Supportive Housing (PSH) bed unit availability.
Provan and Milward (1995) established that when a network operates in an environment with rich resources, the network effectiveness of such a network improves significantly from low to high. This is supported by additional network characteristics such as network stability and integration. Resource is therefore, one of the main conditions that help to explain the differences in network performance and are deemed paramount in maintaining effective network performance. Thomson and Perry (2006) assert that resources are critical for collaborative performance success. Jang, Valero, and Jeong (2020), in their study of cross-sector health service for the homeless, found that collaborative service model like the Continuum of Care (CoC) networks helps the community to pool resources to provide medical and health service needs of the homeless individuals. The study showed that the CoC network effectively tackled and responded to the health challenges by providing multiple health services to the homeless. In this study of CoC network performance, the major funding source- the funding by federal body, HUD (Department of Housing and Urban Development) is utilized and hypotheses three tests the effect of this federal funding on network performance.
The federal funding by HUD is the primary source of fund for Continuums of Care (CoCs), that helps CoC and provide critical homeless services such as permanent supportive housing, rapid rehousing, and emergency shelter. Without the significant HUD resources, CoCs face resource deficit in their efforts to address homelessness. As of now, HUD provides over $3 billion annually through the Continuum of Care (CoC) Program to support efforts to end homelessness nationwide. During the financial year- FY 2023 CoC Competition, HUD awarded funding to approximately 7,000 projects across all CoCs in the United States. This supported housing services for more than 1.2 million people experiencing homelessness each year [43].
The Department of Housing and Urban Development (HUD) investment have significantly increased the PSH unit availability for CoCs across the United States. A report by US Interagency Council on Homelessness (2021) found that in 2021 the overall PSH inventory across the nation included more than 376,000 year-round beds for homeless individuals. The expansion of PSH has contributed to a 25% decrease in number of chronically homeless individuals [19] in the past decade between.
The New Orleans/Jefferson Parish CoC, which has been a high-performing CoC for the last five years receives significant HUD funding for its homeless services. HUD funding for the CoC has grown steadily, increasing from $25.6 million in 2021 to $32.9 million in 2023, with 61% allocated to PSH projects. Similarly, HUD provided over $9 billion to Louisiana for housing recovery efforts post Hurricane Katrina in 2005, majority portion of which was managed through the CoC [18]. Similarly, FEMA provided over $6 billion for emergency housing, restoration and repairs [20] in the Greater New Orleans area. As a result of this efforts by the CoC, by 2011 over 85% displaced residents of hurricane Katrina were successfully rehoused either in permanent or in temporary housings . During the year 2007 to 2019, period driven by post Katrina recovery efforts, chronic homelessness in New Orleans dropped by 85% and PSH bed utilization rate were at 99.4% indicating maximization of the housing resources [21]. The largest portion of this improvement by the CoC was because of the HUD funding support.
Hypotheses 4 :
CoC networks operating in political climates favorable to homeless services will have higher Permanent Supportive Housing (PSH) bed unit availability.
The political climate, along with the policies it produces, can significantly influence the performance of collaborative networks [13,22]. These system contexts are recognized as significant conditions or elements affecting collaborative governance and its performance. Various studies have explored these elements in the system context influencing collaborative governance and its performance outcomes.
Bryson and Crosby (2008) explored administrative, legal, and policy conditions that affect the collaborative governance process. Ansell and Gash (2008) explored power and political dynamics within levels of government and communities and how it affects the collaborative governance process and outcomes. Solid political support for addressing homelessness may result in more funding that adequately funds the CoC programs in addressing homelessness. While, in a lesser supportive political climate, there may be limited funding which poses challenges for CoCs to meet the demands of people experiencing homelessness. The housing initiatives that the CoC takes to reduce homelessness, such as rental assistance programs, affordable housing, and supportive housing, are better supported by the political leadership and local government, which prioritize housing solutions and facilitate such initiatives by CoC [10].
CoC may have challenges if the political climate of their area restricts the development of affordable housing or imposes zoning regulations that will seriously limit the placement of homeless shelters and supportive housing. The CoCs collaborate with the federal, state, and local governments to execute and grow homelessness services. The political climate can influence the government's willingness to engage with CoCs and to provide them with resources and institutional support. In a supportive political environment, CoCs are more likely to benefit from enhanced opportunities for coordination, resource acquisition, and cross-sector collaboration. The political climate also helps shape the public's perception of their support for effective homelessness solutions [26].
A favorable political climate fosters public support for CoC, while an unfavorable political climate may hinder the CoC's efforts to provide services and gain public support. CoCs need to know the political climate of the region they are operating in, as it can vary and change across states, regions, communities, and jurisdictions over time. CoCs need to collaborate with policymakers in community advocacy to understand and navigate the political climate and effectively advocate for effective policies that support homelessness services. As Mosley and Park (2022) suggest, various political ideologies have different policy priorities, goals and strategy for resource allocation that favor or restrict social equality and shape governance. The political climate can have a significant effect on the network performance.
High performing CoCs are seen to benefit from political support for housing initiatives and stronger nonprofit partnerships [18]. PSH services works more efficiently in communities where there is local support and political will to implement PSH services to tackle homelessness. Building relationships with the political leadership in the community was seen to have a significant impact in getting support for PSH projects, specifically on collaboration on finding solutions for homelessness issues and ease of implementation of those solution with least political barriers [24].
Maintaining positive relationships with community members and political leaders help to create external environment that support PSH development and its successful implementation. In a report by Vision Action Network (2018) on limitations of PSH services in Washington county, Oregon found that restrictive housing tax policies and constrained local government fundings on PSH projects are responsible for increased homelessness and decreased ability of PSH services to cater to these homeless population as they struggle with housing instability, poverty and increased housing prices. In the democratic regions, there is often stronger advocacy for federal HUD funding and allocation and mobilization of local resources to build PSH networks. Areas with affordable housing shortages (e.g., Las Vegas CoC, Riverside CoC) and restrictive housing policies see limited PSH success whereas CoCs that has favorable housing policies fostering collaboration, for example New Orleans CoC and Miami-Dade CoC leads to higher retention and participation rates for PSH services.
The political climate therefore significantly helps shape the performance outcomes of CoCs. CoCs in regions with favorable political climate is favored by political will to invest in PSH, supportive housing policies and enhanced service coordination that is robust. CoCs in regions with unfavorable political climate, on the other hand, face challenges related to funding priorities, policy limitations, and service delivery gaps. [24].
The research investigate this external environmental condition-political climate to see to what extent is it affecting the overall CoC performance.
Hypotheses 5 :
CoC networks operating in regions with higher gross household income will have higher Permanent Supportive Housing (PSH) bed unit availability.
Gross household income is the total income of all the family members before tax and any other deductions, including income from all sources each living in the household receives. Gross household income is often used in housing contexts such as housing affordability and homelessness rates and is an essential community-level determinant of homelessness [38]. Gross household income can significantly impact the performance of CoC and the homelessness rate in the area. The level of gross household income directly affects the homelessness rates. A low level of gross household income can contribute to higher poverty levels, leading to increased homelessness for both individuals and families as they may struggle to afford housing or rental and mortgage payments which can put them at eviction or foreclosure risk. This can lead to greater homeless population with low income requiring more CoC service in these regions . The gross household income of the region where CoC operates can also impact the funding and resources for homeless services, that will impact their performance. Lower-income areas may not have significant resources, struggle to meet the homelessness reduction goals and perform poorly as they are constantly challenged compared to high-income areas [11]. They may therefore need help to secure resources, funding, and federal support if their performance is not as expected.
Housing programs usually calculate the eligibility and affordability of individuals based on percentage of gross household income using the measure Area Median Income (AMI). An AMI of less than 30% is considered low-income. CoCs in low AMI regions may face challenges of increased CoC resource demands as they may not be able to secure affordable housing independently due to their low-income. This increases the reliance on PSH services putting pressure on CoC resources. For example- New Orleans CoC has a median household income of $30,247 that is below the national average of $70,000. Many residents there qualify as low-income and eligible for PSH services where CoC services surges with demand for service while the supply may not be enough to meet these demands. Similarly, the tenant contributions to the PSH programs are usually capped at 30% of income [26] which means that for regions with lower income, the CoC has to provide larger subsidies to fill the gap between the housing costs and the tenant payments.
Hypotheses 6 :
CoC networks operating in regions with higher median rent will have lower Permanent Supportive Housing (PSH) bed unit availability.
Data by NLIHC (2023) suggests that a 10% rise in median rent results in a 13.6% increase in homelessness in urban areas. High rent put the vulnerable population at higher risk homelessness, increasing the demand of PSH services. The ability to find, secure and afford rent in each community also affects the CoC network performance and the length of time individuals stay and rely on the homeless services provided by the CoC. This may also affect the ability of individuals experiencing homelessness to access permanent supportive housing as there may be longer wait times for the services and, due to housing unaffordability, longer time to secure permanent supportive housing services. The median rent in an area can have a significant impact on CoC's ability to supply housing services to meet the demands of the homeless population [26]. The median rent shows the average cost of housing units in a particular area. High median rent of a particular area means higher housing costs; this; may pose affordability challenges for the homeless population [11], even with the CoC assistance, who have themselves face the challenges of a smaller pool of housing availability in these areas and struggle to find appropriate housing placements for people without homes which contributes to increased homelessness [27].
In areas with high median rent, there might be shortage of supply in affordable housing units [22]. This may create longer waitlists for CoCs and making it more challenging to find housing placements. Due to this, the CoC network in high-rent areas may not be able to meet the demand of the homeless population as effectively as the CoC network in relatively low-rent areas, which can affect the CoC network performance.
The HUD places high priority on the permanent supportive housing services where nonprofit agencies want to collaborate to provide affordable housing in high rent areas that poses significant risk of homelessness for low-income households. Due to the affordability issues in the housing market, communities have collaborated with nonprofit to tackle this problem. For example, in the San Francisco Bay Area, Alameda County collaborated with the nonprofit Base Closure Initiative to get 239 additional permanent supportive housing unit on a closed navy base [43]. Other communities have collaborated with multiple agencies and individual donors and local government to secure funds for PSH units. For example, in the Columbus/Franklin County, the city, county, state housing funds, the United way foundation, the drug, alcohol and mental health agency and other private donors came together to leverage their resources to develop 800 PSH units for chronically homeless individuals with mental health and substance abuse problems and those with disabilities that are long-term shelter users [43].
Similarly, some housing authorities have established priorities in their housing policies and mandates to provide PSH units for homeless people. For example, under the Rehabilitation program, Boston Housing Authority provides more than 450 units of PSH for homeless individuals. The housing authority in Columbus/Franklin County, Ohio and Rhode Island give priorities to homeless families in the PSH wait list. Similarly, Montgomery County and Maryland’s housing authority receive a significant amount of the county’s CoC funds for their permanent supportive housing unit project. Similarly, UNITY of New Orleans, the lead agency for New Orleans/Jefferson Parish CoC build their own nonprofit owned buildings and apartments for the low-income and homeless individuals to address the challenge of affordable housing. It also added 2200 new PSH units since Hurricane Katrina in 2005 [21]. The rent of the area where the CoC operates therefore impacts its capacity to provide PSH services.
Hypotheses 7 :
CoC networks operating in regions with favorable political climates toward homeless services will receive higher levels of federal funding.
High performing CoCs are seen to benefit from political support for housing initiatives and stronger nonprofit partnerships [18]. Supportive political climate for housing policies support PSH initiatives while less supportive regions deprioritize long-term PSH initiatives with more shot-term solutions like emergency shelters and transitional housing. In regions with favorable political climate for homelessness initiatives, PSH services works more efficiently in communities where there is local support and political will to implement PSH services to tackle homelessness. Building relationships with the political leadership in the community was seen to have a significant impact in getting support for PSH projects, specifically on collaboration on finding solutions for homelessness issues and ease of implementation of those solution with least political barriers [24].
Maintaining positive relationships with community members and political leaders help to create external environment that support PSH development and its successful implementation. In a report by Vision Action Network (2018) on limitations of PSH services in Washington county, Oregon found that restrictive housing tax policies and constrained local government fundings on PSH projects are responsible for increased homelessness and decreased ability of PSH services to cater to these homeless population as they struggle with housing instability, poverty and increased housing prices. In the democratic regions, there is often stronger advocacy for federal funding and allocation and mobilization of local resources to build PSH networks. Areas with affordable housing shortages (e.g., Las Vegas, Riverside) and restrictive housing policies see limited PSH success whereas CoCs in democratic region has favorable housing policies fostering collaboration, for example New Orleans and Miami. This leads to higher retention and participation rates for PSH services.
The political climate therefore significantly helps shape the performance outcomes of CoCs. CoCs in democratic regions are favored by political will to invest in PSH, supportive housing policies and enhanced service coordination that is robust. CoCs in republican regions, on the other hand, face challenges related to funding priorities, policy limitations, and service delivery gaps. However, it must be noted that even CoC in regions that are homelessness friendly like Chicago highlight that favorable political climates alone are insufficient without effective execution, coordination, and housing infrastructure [43]. This comparison highlights the need for suitable strategies that consider political climates along with emphasis on networked collaboration to enhance PSH service outcomes across CoCs.
A study identifying the social, economic and political factors influencing PSH service and implementation [28] found that there should be political will to help facilitate affordable housing opportunity specially to the low-income people that are already paying high rents and are in an increased risk of homelessness. In regions with household income of less than 30% of the total area median income and high median rent, it is even harder to find affordable housing. Having flexible regulations to increase the supply of affordable housing units such as inclusionary zoning ordinances that mandates certain percentage of units to be made affordable to low-income individual families can help create affordable housing units for PSH services as well to meet needs of low-income people that are at risk of homelessness or those experiencing homelessness. In regions struggling to meet the PSH services due to affordable housing that affects the areas with low household income and higher median rent, PSH service performance seems to be low. Regions’ socioeconomic condition is therefore a determining factor for PSH service availability and effectiveness.
Figure 1.
Theoretical Framework.
4. Methodology and Data Analysis
4.1. Data Sources
The data for the study was collected from multiple sources, including HUD Point-in-Time and Housing Inventory Count data and HUD funding from the HUD website data repository for the year 2023, 2020 census data from the Central Bureau of Statistics and individual CoC websites. Email correspondence was also done with those CoCs who board member size did not have explicitly mentioned in their websites to get the board member size data. Table 1 shows the data sources and metrics used to capture the performance outcomes for CoC networks. It provides an overview of where each variable's data was collected to ensure a transparent and traceable methodology for this study.
The performance of the CoC network which is the measure of dependent variable-network performance was evaluated based on the bed unit availability for permanent supportive housing services which is derived from the HUD (2023) Housing Inventory Count (HIC) dataset. The independent variables for the study are the internal and external factors that may affect the CoC performance. Network size measured by network board member size, network leadership measured by nonprofit leadership in the CoC, network funding measured by federal funding that CoC receives from HUD, the political climate where the CoC operates measured by the political orientation in the region where the democratic and republican are recorded using dummy variables coding zero for those CoC areas that are democratic and coding one for those CoC areas are republican. Socioeconomic factors is measured by gross household income and median rent which are merged using FIPS code for those CoCs that cover multiple counties. The data for control variables-homeless population of each CoC and Non-white population of each CoC is derived from the HUD Point-In-Time (PIT) data of 2023.
4.2. Data Analysis
For conducting the data analysis, first multicollinearity among the independent variables is assessed using collinearity diagnostics and a correlation matrix. This step ensures the reliability of the regression models by identifying any high correlations that could distort the results. Independent variables with acceptable levels of multicollinearity are included in subsequent data analyses- the exploratory data analysis (EDA). EDA is performed using the descriptive statistics to determine data variability, potential outliers and missing data. This step helps to understand the data helping to address the data variability issue, potential outliers and other transformation of data as needed to ensure robustness in subsequent modelling-the regression model. For instance, for the variables that exhibited high level of skewness-funding, gross household income and median rent, log transformation was applied for their normal distribution. Similarly, categorical variables-lead agency and political climate are dummy coded to be included in the regression model. The data has a sample size of 343 Continuum of Care (CoC) networks across the United States, excluding Balance of State (BoS) CoCs due to their aggregated structure, which does not align with the study’s unit of analysis. Each CoC represents the unit of analysis, providing a localized perspective on network performance and characteristics.
Finally, two regression models using Ordinary Least Square (OLS) method is developed to explore the relationship between the dependent and the independent variables. Model 1 includes all the explanatory (independent) variables selected for the study to test their relationship and statistical significance along with our control variables-homeless population size and ratio of non-white population to isolate the effect of independent variables for more robust result. relationship. Model 2 adds interaction variable (HUD funding and political climate) to the variables in model 1 to explore if interaction variables have an effect on the PSH units and the overall model. Statistical significance using p-values (p<0.01) is used to identify independent variables with strong explanatory power over the dependent variable. The entire data analysis is conducted using SPSS software, which facilitates the generation of collinearity diagnostics, descriptive statistics and regression models.
4.3. Correlation Between Independent Variables
Table 2 shows correlation matrix indicating the relationship between the dependent variable and the independent variable for our analysis. The correlation table shows that most correlations between the variables are weak or moderate (less than 0.5) with only the correlation between gross household income and median rent showing slightly higher than 0.5. However, the collinearity statistics showed tolerance value close to 1 and VIF less than 5 for both these variables, which is an acceptable level to include these independent variables in our analysis.
Table 3 shows the collinearity statistics- tolerance value and Variance Inflation Factor (VIF) to determine if any of the independent variables are corelated to each other to avoid the problem of multicollinearity. The table assesses the multicollinearity between the independent variables which is the high correlation between the independent variables that can disrupt the regression analysis and results. It shows the tolerance and Variance Inflation Factor (VIF) of the variables where tolerance value close to 1 indicate low multicollinearity and values near 0 mean high multicollinearity. VIF below 5 indicate acceptable range of multicollinearity which would not disrupt regression results.
VIF is referred as a reliable statistic to check for multicollinearity because it accounts for the cumulative effects of all the variables in the model, unlike the correlation matrix which only indicates pairwise relationships. Similarly, a high correlation between any two variables does not necessarily always mean that they cause the multicollinearity problem in the model.
For control variables, although they show moderate collinearity in the colinear matrix with the independent variables, we include them in the study as they have acceptable levels of VIF and tolerance value. Additionally, control variables are included to account for the factors that may have confounding effects on the dependent variable. Although, they may correlate with the independent variable to some extent, which is deemed acceptable as justified by the VIF, the primary purpose of the control variables is to isolate the effects of the independent variables on the outcome.
All the independent variables, including control variables have an acceptable collinearity where the tolerance value is closer to 1 than 0 and the VIF is less than 5. The independent variables do not have concerning level of multicollinearity issue and are acceptable to be included in the analysis.
4.4. Descriptive Statistics
The second step, descriptive statistics is deployed to help summarize our data and provide understanding of the variable distribution (median and mean), and variability (standard deviation). It helps us understand the baseline characteristics of our independent variables- board member size, HUD funding, gross household income and median rent, and if they are a good choice for independent variables. It also helps the study to identify the quality of data, identify potential outliers and patterns of the data. For categorical variables, leadership and political climate- dummy coding is done prior to data analysis. For leadership, nonprofit leadership is coded as 1 and government leadership as 0. For political climate, democratic region is coded as 1 and republican region as 0. We also deploy log transformation for the variables-funding, gross household income and median rent due to the high positive skewness of the data.
Table 4 below shows the descriptive analysis of the study.
Table 4 shows the descriptive statistics for the dependent and independent variables. The dependent variable- PSH bed units shows high variability across regions with a standard deviation of 1.45914 which is the variation of PSH units around the mean 5.7231 (the average number of PSH units across observations). This is confirmed by the very high variance of 2.129 and a range of 8.24 that is higher than the mean of 5.7231. This descriptive analysis suggests significant disparities in the number of PSH units provided across the CoCs.
The variable board member size varies significantly as showed by the range with small size of 3 to a large board size of 39. The range (36) and variance (45.028) that are significantly higher than the mean along with the standard deviation (6.710) that is typically high showing the variation in board sizes around the mean (15.50) which is the average size of board across observations. This shows high variability and diversity in the board size.
The variable lead agency has been coded into dummy variable indicating “1” for nonprofit led CoCs and “0” for government lead agency. The mean of 0.5423 shows that 54% of observations have value of 1 which is the value for nonprofit led CoCs. This means that 54% of the CoCs are led by the nonprofits while the rest of the 45% are led by government agencies. Standard deviation shows that the lead agency is well-distributed between nonprofit, and government led CoCs with a value of 0.49894 which is near to its maximum possible value of 0.50. This shows that the lead agency for CoCs has almost a 50-50 split between nonprofit and government led agencies.
The variable political climate is also well-distributed where almost 45% of the observations are Democratic-led CoC regions and 54% of them are Republican-led CoC regions. This shows that the political climate for CoC also has a 50-50 split between Democratic-led regions and Republican-led regions with standard deviation value near the maximum possible value of 0.50 at 0.49.
For the variable funding, log transformation has been used for this variable to reduce skewness. The variability in funding is seen to be relatively moderate with variance at 2.154 and standard deviation at 1.46751. The range is lower than the mean at 8.24 which suggest low variability in the data. This shows that funding did not vary significantly across the CoCs.
For the variable gross household income which also went through a log transformation, shows consistent distribution across observation. It has low variability across regions as shown by standard deviation 0.29821 and variance 0.089. Range is at 3.60 which is less than the mean (11.1783) which is the average of the gross household income suggesting low variability in the data.
For the log transformed variable-median rent, range (2.81) is less than the mean (7.1076) suggesting low variability in the data. The standard deviation (0.31) and the variance (0.99) also suggest that SD is only moderately dispersed from the mean which indicated only moderate variation.
For the control variables-homeless population and non-white population, homeless population has been log transformed. The homeless population across CoCs vary widely with the minimum value being 4.01 and maximum 11.39 with a range of 7.38 where some CoCs have low homeless population at 4.01 and some as high of 11.39. For ratio of non-white homeless population- a mean of 45.0622% shows that on average about 45% of homeless population across CoCs are non-white. The wider range of 0.00% to 90.41 and a high standard deviation of 19.79% indicate that there is a substantial variation in the racial composition across CoCs.
The descriptive analysis helped identify large variation in data, potential outliers and help to identify skewness and variability and treat them with log transformation to reduce skewness and balance categorical variables by dummy coding them. The data is normally distributed and suitable to be included for the next and final step of data analysis-the regression analysis.
4.5. Regression Analysis
Ordinary linear regression technique is deployed to assess the strength and direction between the multiple independent variables and the continuous dependent variable. Ordinary Least square (OLS) regression is deployed for determining the effect of each of these internal and external CoC conditions on their performance. SPSS software was used to run the analysis. It allows to see the unique contribution of each independent variable as predictors of the dependent variable. For example- we can determine how board membership size influence network performance, independent of federal funding or leadership type. We developed two models for regression-first, with the internal and external conditions together and second, adding the interaction variable, HUD funding and political climate as the predictors for network performance of the CoC.
5. Findings
Table 5 shows the findings for the two models tested. Both models show statistical significance. For model 1, the relationship between PSH bed units and political climate is statistically significant where r= .216, p<.001. This indicates that the political climate that is coded as “1” which are the CoCs with favorable political climate are associated with higher PSH units. Similarly, the PSH units also seem to have positive relationship with HUD funding where r=.435 and statistically significant at p<.001. This suggests that increased HUD funding is significantly associated with more PSH units. A similar finding is seen between PSH bed units and board member size (r=.157, p=.004) indicating statistical significance where large board sizes are associated with higher PSH units. High median rents were associated with lower PSH bed units, with a r= -.160 and statistically significant with p=0.003. For nonprofit leadership, contrary to our hypotheses, we find that value r= − 0.057 indicating negative association between PSH Units and nonprofit leadership and no statistical significance at r=.292. This suggests that nonprofit as lead agency (which is coded as 1) has no significant impact on PSH bed units. Gross household income had no statistical significance at r=0.084, p=0.120 which suggests that gross household income does not have any significant effect on PSH bed units. For control variables, homeless population and ratio of non-white population, both the variables are statistically significant at p<0.001 and p=0.002 respectively. The overall model has a good fit with a high F-statistics at 13.080 and p<0.01 and moderate predictability at r= .216. For Model 2, interaction variables for HUD funding and political climate is added to the analysis to see their interplay’s effect on the overall model. It showed statistical significance at r= .265 and p<.001 which means the interaction variable influences PSH bed units. It also improved the model considerably, with r=.237*** and p=<.001, the F statistic was 11.37, suggesting a good model fit.
Among our hypotheses tested, hypotheses 1: Larger CoC board member size influence the number of PSH bed unit availability is supported by both the models in which it was included and showed statistical significance. The models show that relationship between board member size and PSH bed units shows statistically significant . The statistical significance supports our assumption that large board size impact PSH bed units.
Hypotheses 2: CoC networks led by nonprofit organizations will have higher Permanent
Supportive Housing (PSH) bed unit availability is not supported by both the models. The type of lead agency therefore does not have significant influence on PSH bed unit availability.
Hypotheses 3: Higher the amount of HUD funding the CoC networks receive, higher the Permanent Supportive Housing (PSH) bed units is supported by both the models.
There is high statistical significance with PSH bed units indicating HUD funding as a strong predictor of PSH units.
Hypotheses 4: Higher the amount of HUD funding the CoC networks receive, higher the Permanent Supportive Housing (PSH) bed unit availability is supported by both the models. It indicates that political climate to be a significant predictor of PSH units (in all models).
Hypotheses 5: Gross household income of region where CoCs operate will impact the Permanent Supportive Housing (PSH) unit is not supported by both the models. It suggests that the impact is statistically insignificant. Gross household income therefore becomes a non-significant predictor which is not meaningful to explain variability in the PSH units.
Hypotheses 6: CoC networks operating in region with high median rent will have lower Permanent Supportive Housing (PSH) units is supported by both the models indicating median rent as a strong predictor of PSH units. This indicates that high median rent is significantly and associated with PSH unit availability. This suggests an increase in median rent caused decrease in the PSH unit availability.
Hypotheses 7: CoCs operating in region with favorable political climate will have high HUD funding is supported by both models. It was statistically significant and introducing it to the model also improved the model accuracy. This suggests that effect of political climate on HUD funding impacts the PSH units of CoCs.
6. Discussion
Nonprofit Leadership
The findings reject the assumption that nonprofit leadership in CoCs help to increase the PSH bed units. This maybe because more than the type of the lead agency-nonprofit or government, the capacity or characteristic of lead agency such as expertise, ability to collaborate, partnerships and mobilize funding and resources [34] may matter more to explain how effectively they lead the CoC for positive PSH outcomes. For collaborative networks like CoC, regardless of the leadership type, the collaborative governance of the network and the effectiveness with which the collaboration is fostered may achieve better result in explaining PSH units [33]. Similarly, some regions may rely heavily on nonprofits, while some on government agencies depending on the local governance structures influencing the outcomes indirectly. For improving PSH unit availability, focusing on how lead agency strengthens CoC capacity and inter-agency collaboration and exploring its effect on PSH units bed units may provide a clearer understanding of the role of lead agency on PSH, rather than only the agency type which (as the result shows) has little to no relevance on the PSH outcomes.
Board Member Size
The findings support the argument that large board size has positive influence on the PSH bed units. This maybe because, larger boards may enhance the governance capacity with their diverse expertise (Ansell and Gash, 2007), resources and network management skills. However, larger boards also come with potential challenges in coordination, slow decision making, conflict of interest, which may limit their effectiveness [35]. This may explain the weak correlation where although board member size is a measurable impact, but it is not a dominant factor to explain PSH units. The availability of PSH units may not merely depend on higher board size but also the effectiveness of the board size on how actively involved the board is, to improve PSH outcomes. It also may depend on the type of leadership that steer these large boards to avoid potential conflict and coordination challenges of a large board size. While larger boards may enhance resource access, effective management is required to avoid conflicts and inefficiencies. While board size is seen to be important in explaining PSH unit availability, it is secondary to other predictors like political climate and funding. Rather than exploring only the number of board members, it may be useful to explore how the board functions and the board composition since boards with mix of government, nonprofit and private sector may have different dynamics as compared to boards dominated by single sector which can impact how the CoC functions and its impact on the PSH services. Similarly, capturing the board members according to the CoC region may help justify PSH bed unit variability as boards in urban CoCs may function differently than those in rural CoCs due to their geographical differences and demands.
Federal Funding
The findings support the assumption that HUD funding has a positive influence on the PSH units. It is evident that HUD funding is a key factor in influencing the number of PSH units. This was also consistent with our descriptive analysis where we found that high performing CoCs like New Orleans CoC with high level of HUD funding had significantly high PSH bed units. It is evident that the regions that receive higher HUD CoC funding will show significant increase in PSH unit [40] and had direct impact on the PSH outcomes. These highly funded CoCs will have significant resources at their disposal to expand their PSH services and bed units to address the demand of the homeless population as and when needed. The sustained funding also helps scale the PSH programs for the homeless population as per their need [27] as they are better equipped to address these needs by increasing their PSH capacity. Since HUD funding significantly impacts the PSH service performance, priority must be directed towards allocating funding for those areas that are underserved and have racial inequities. The fundings tend to be allocated in higher amounts for higher performing CoCs as indicated by the system performance measures (SPM). But the CoCs that are struggling for resources continue to be stuck in the loop where they do not get adequate funding due to lower SPM and they continue having lower SPM because they do not get enough funding. This cycle must be broken, and HUD funding should also direct the funding not only based on the SPM but also provide resources to help the CoCs that are struggling for resources to improve their SPM. In this context, equity consideration must be made where funding allocation should consider the local and regional disparity and inequity to ensure that the communities meet their PSH service needs effectively. Regions with underserved population, for example higher ratio of non-white in our study is seen to have high influence on PSH units. Focusing on these regions with targeted federal and state fundings will help achieve higher PSH service performance, equitable allocation of funding [29] in achieving housing stability and reducing homelessness in underserved communities.
Political Climate
The findings support the assumption that CoCs with favorable political climate will have increased PSH bed units. Democratic-led CoC regions tend to have flexible homelessness policies and addressing the issue through prioritization and adoption of progressive policies like “Housing First” approaches and long-term housing solutions like the PSH services, especially for vulnerable population that provides housing without any preconditions [30]. While long-term sustainable housing stability maybe the goal for these CoCs, for Republican-led CoC regions, the goal maybe to prioritize temporary measures to provide immediate housing solutions and may focus more on emergency shelters and temporary housing solutions to address homelessness [31]. The funding allocation and mobilization priorities for these may also differ, impacting the PSH bed units. Democratic-led CoC regions may advocate for receiving larger funding from federal and state level to sustain and expand housing initiatives for more PSH units while Republican-led areas may allocate funding differently focusing on other forms of housing assistance like emergency shelters [27]. Inter-agency collaboration may also vary depending on the political climate where democratic regions typically seem to be more flexible and open to collaboration with nonprofits, local community and key stakeholders for PSH development and adopt innovative and robust funding for housing policies. [32]. Equitable resource allocation may also be affected by the political climate where political regions with lesser equity-focused distribution may exacerbate racial disparity and higher homeless population. This is also evident in our data where Democratic regions had lower non-white homeless population than the Republican regions.
However, it is not always true that all Democratic regions will prioritize PSH equally and all Republican regions neglect it. Considering regional differences and nuances are important when considering the political influence on homeless services. It may be on a case by case basis for CoCs where some CoCs even in Republican-led regions maybe highly focuses, and innovatively driven to address homelessness issues. Encouraging a bipartisan collaboration will mitigate ideological divides and ensure PSH unit availability aligns with regional needs regardless of political leadership. The New Orleans/Jefferson Parish CoC is an ideal example of such a case where the CoC ensures positive PSH performance outcomes, regardless of the political leadership. It has appointed UNITY of Greater Orleans, a bipartisan nonprofit organization as its lead agency to overlook all the activities of the CoC. It has been consistently high performing CoC with high PSH bed availability. It effectively collaborates with other organization, local and federal government to mitigate challenges and effectively provide homeless services to the people, irrespective of the political climate and it has set an example as the most successful CoC in the United States. The focus of the CoCs should be evidence-based advocacy to align priorities across the political divides to serve the homeless population for an effective service delivery and equitable housing outcomes that arises from the need of the vulnerable population rather than the political climate.
Gross Household Income
The findings do not support the assumption that CoCs with higher household income have impact on PSH bed units. While these regions may have slightly more resources and community capacity to invest in PSH units, the effect is weak and inconsistent. It alone is not a determinant of PSH availability. Having the community capacity does not necessarily mean they would invest it in homeless services. Their attitudes towards homelessness within their community and how they approach it also influences the investment. For example- affluent communities with a reputation of having high gross household income and sophisticated residents that are close knit and familiar may not want a homeless shelter being established in their community thinking that could tarnish the communities’ long-standing reputation of being affluent or consider it unsafe as people from various backgrounds may reside in the homeless shelter. Some affluent communities also would not want nonprofits or housing developments in their communities to be built regardless of if they are homeless shelters or real-estate developments that could disrupt their quality of life. In these cases, “Not-In-My-Backyard (NIMBY)” is highly advocated for by the community where there is a strong pushback by the residents to provide any support or investment to these kind of development in their community [10,24]. This can limit the PSH unit availability instead of expanding them. Gross household income therefore may not be a useful measure to capture PSH unit availability. Communities with high income disparity and inequity where some have high income and some extremely low could be more interested in investing in PSH units to close the gap. Taking income inequality in the community could play a more critical role in determining the influence on PSH outcome rather than gross household income [37]. Future studies could therefore explore on the impact of income inequality of communities to better understand the regional variation in the PSH service availability.
Median Rent
The findings support the assumption that increase in median rent of the region where the CoC operates, decreases the PSH bed units for the CoC. This relationship shows the interplay between the affordable housing, housing markets and homelessness services. It is evident that high median rent areas reflect a higher land cost, build cost and development cost, making it expensive for CoCs to build, find and sustain PSH units [39]. This seriously impeded the ability of CoCs to expand PSH units because of high rent, impacting especially the urban areas with significantly higher rents. Similarly, in areas with high rents, resources may have to allocated towards rental assistance programs for existing houses, rather than expanding new PSH programs thereby limiting PSH expansion [27]. Similarly, the high-rent regions most often than not have strict zoning laws and land-use regulations which can further create barriers for PSH units development. Although we can see that high rent areas, especially in urban areas may have more PSH units due to high homelessness rate, service demand and targeted federal funding, the pace at which they expand and develop is often slow due to high rents creating cost barriers [37], for example, Los Angeles CoC. For such CoCs, targeted federal and state funding only for PSH unit expansion may not be effective due to the high cost of sustaining it. They may require additional rent subsidies or incentives to offset the higher costs of PSH development. Additionally, addressing the regulatory barriers for more incentive-based and flexible zoning/land-use reforms can also help facilitate the development of PSH units in high-rent areas.
The significant negative relationship between median rent and PSH units reflects the challenges of developing, expanding and sustaining permanent supportive housing units in high-rent areas. While higher rents often indicate a greater housing demand for the homeless population, they also create financial and regulatory barriers that impede PSH development. Addressing these barriers through targeted policy reforms and innovative funding strategies is essential to ensure PSH availability and expansion in high-rent regions.
Political Climate and Federal Funding
The political climate of whether the leadership is supportive or non-supportive in homelessness policies can influence the utilization and diversification of HUD funding or how effectively CoCs can diversify their resources with local government support and advocacy. For example, regions with more supportive political climate may use HUD funds more efficiently by focusing on long-term homelessness solutions like PSH service expansion, while less supportive climates might restrict how funds are used with higher levels of regulatory barriers like strict zoning laws. Exploring how political climate affects the ability to acquire, utilize, maximize, diversify HUD funding helps to identify how political climate can be mitigated and how effective advocacy can help diversify HUD funding despite political climate to improve overall network performance for the CoCs.
7. Conclusion
Public service performance, particularly when delivered through interorganizational networks, is shaped by a dynamic interplay of internal structures and external system contexts. This study provides evidence-based insights into how these conditions affect the performance of Continuum of Care (CoC) networks in the United States, federally mandated and HUD-funded systems tasked with coordinating homelessness services. Focusing on the availability of Permanent Supportive Housing (PSH) units as a core performance indicator, the study identifies key factors that influence CoC effectiveness in addressing the wicked problem of homelessness.
Through regression analysis of 343 CoCs, several important patterns emerge. While the type of lead agency—government or nonprofit—was not a significant determinant of PSH availability, this finding suggests that leadership characteristics such as alignment with community values, collaborative capacity, and leadership experience may matter more than sector affiliation. Future research should explore these leadership dimensions more deeply.
Board size was found to significantly affect network performance. Larger boards enhance access to diverse resources, expertise, and sectoral representation, contributing to more robust collaborative capacity. However, the findings also highlight the need to balance inclusivity with coordination efficiency. Governance design should reflect the unique context and operational capacity of each CoC to avoid inefficiencies or conflict.
Federal funding emerged as a major driver of CoC performance. CoCs with greater HUD support had stronger PSH capacity, but the performance-based funding allocation model may inadvertently reinforce systemic disparities. Lower-performing CoCs, often under-resourced to begin with, risk becoming trapped in a cycle of low funding and limited capacity. A more equity-oriented funding mechanism that accounts for structural disadvantages could help level the playing field.
Political climate also significantly shaped PSH performance. CoCs in more progressive environments with supportive housing policies and fewer regulatory barriers tended to perform better. However, political alignment alone does not guarantee success. High-performing CoCs also exhibited strong internal capacities—such as resource innovation, transparency, community engagement, and data-driven decision-making—that allowed them to overcome external constraints.
In contrast, gross household income did not have a statistically significant relationship with PSH availability. Affluent communities may resist PSH development due to concerns about property values and neighborhood identity, revealing the need to explore local attitudes and political behavior in future studies.
Median rent was a significant barrier to PSH expansion. High-rent areas face affordability challenges that limit the development and sustainability of PSH units, even with sufficient funding. Structural support such as rent subsidies and local policy incentives are critical to support CoCs operating in these high-cost environments.
Overall, this study underscores that public service network performance is not a static outcome but the result of adaptive responses to evolving structural and environmental conditions. The findings highlight that improving performance requires more than structural adjustments, it demands intentional governance, strategic resource management, and collaborative resilience. By identifying key leverage points within the system, this research offers practical and theoretical contributions to the study of collaborative public service networks, particularly those confronting complex social issues like homelessness.
8. Limitations And Future Studies
While the study provides empirical evidence on how certain factors influence PSH units and what can be done at a practical and policy level to improve the CoC performance by mitigating the influencing factors, it does come with its own set of limitations. First, the data is drawn from a single year-2023, with census data of 2020. While this allows for consistency in variable measurement, it also limits the ability to observe temporal changes and causal trends of the data and its effect on network performance. CoC governance structures and lead agency assignments can change frequently, and a longitudinal approach would offer deeper insight into how these changes affect performance over time.
Second, the study deploys OLS regression to analyze the data that looks at linear relationships between the network factors and network performance. While this is appropriate for answering the research questions developed, future studies could explore more complex statistical techniques such as multilevel modeling, or structural equation modeling to statistically analyze this relationship between network variables and its effect on performance.
Finally, the study examines limited set of independent variables to see its impact on PSH performance. Additional variables such as income inequality, racial disparities, leadership characteristics and geographical differences can be considered as additional factors to examine its impact on PSH services in future studies for further exploring its effects the network performance.
9. Policy and Practice Implications
PSH service offers stable housing along with critical supportive services such mental health care, substance abuse treatment, rehabilitation facilities, job training, and health services for chronic health conditions for the individuals experiencing homelessness. Yet, the delivery of these services is susceptible to internal network conditions and governance limitations, inequities in funding and service access, political climate and housing affordability issues. To improve CoC network performance, it is critical to identify and address both internal network conditions and capacities (board member size, leadership, HUD funding) and external system contexts (political climate, socioeconomic conditions). Although the CoC’s short-term goal could be increasing the number of PSH units and maximize their utilization to meet the immediate demands, the long-term objective must be aimed at sustaining these PSH services to enable the individuals using the services to transition successfully and permanently out of homelessness.
Achieving sustainable housing solutions and improved network performance requires more equitable practices, innovative and alternative funding strategies, inclusive governance practices, effective leader that drives these initiatives through community collaboration and policies aligned with community needs to promote community engagement. This study contributes to this goal by providing a foundation for evidence-based policy reform and capacity-building strategies to enhance the effectiveness and efficiency of CoCs across diverse contexts and challenges.
This study contributes to the field of public service network performance research by conducting a statistical analysis to understand how human service networks like homeless CoC networks can enhance their performance through collaborative governance, strategic resource use, and mitigation of external challenges. Through identification of both enabling factors that improve network performance and constraining factors that hinder high network performance, the research offers practical and proven recommendations for improving CoC networks to provide stable and long-term, effective, efficient, timely and appropriate services for the vulnerable homeless population that needs them.
Author Contributions
Conceptualization, J.R.C. and H.J.S. ; methodology, J.R.C and H.J.S.; software, J.R.C; validation, J.R.C. and H.J.S.; formal analysis, J.R.C.; investigation, J.R.C. and H.J.S. .; resources, H.J.S. .; data curation, J.R.C.; writing—original draft preparation, J.R.C.; writing—review and editing, J.R.C. and H.J.S.; visualization, J.R.C.; supervision., H.J.S. All authors have read and agreed to the published version of the manuscript.
Funding
This research received no external funding.
Data Availability Statement
The original data presented in the study are openly available in https://www.hud.gov and https://www.census.gov
Conflicts of Interest
The authors declare that they have no known competing financial interests or personal relationships that could have appeared to influence the work reported in this paper
References
- Ansell, C., & Gash, A. (2008). Collaborative governance in theory and practice. Journal of Public Administration Research and Theory, 18(4), 543–571. [CrossRef]
- Emerson, K., Nabatchi, T., & Balogh, S. (2012). An integrative framework for collaborative governance. Journal of Public Administration Research and Theory, 22(1), 1–29. [CrossRef]
- Raab, J., Mannak, R. S., & Cambré, B. (2013). Combining structure, governance, and context: A configurational approach to network effectiveness. Journal of Public Administration Research and Theory, 25(2), 479–511. [CrossRef]
- Wang, H. (2015). Explaining collaborative performance in homeless service delivery: A network governance perspective. Journal of Public Administration Research and Theory, 25(4), 1221–1246.
- Valero, J. N., & Jang, H. S. (2016). Leadership and performance in collaborative governance: Evidence from homeless service networks. Public Performance & Management Review, 39(4), 864–886.
- Christofoli, D., & Markovic, J. (2016). Effects of network governance on performance: Empirical evidence from the public sector. Journal of Public Administration Research and Theory, 26(4), 696–711.
- Cheng, Y. (2018). Managing nonprofit governance in cross-sectoral collaborations: Lessons from homeless service networks. Nonprofit Management and Leadership, 28(4), 479–493.
- Valero, J. N., & Jang, H. S. (2020). Nonprofit leadership in collaborative networks: Evidence from homelessness governance. Nonprofit Policy Forum, 11(1), 1–22.
- Valero, J. N., Lee, K., & Jang, H. S. (2021). Governing the homeless service network: Collaborative structures and federal funding outcomes. Public Administration Review, 81(5), 847–860.
- Mosley, J. E. (2021). Racial equity and homelessness services: Challenges in networks and nonprofits. Nonprofit and Voluntary Sector Quarterly, 50(2), 346–370.
- Mosley, J. E., & Park, H. S. (2022). Policy environments and nonprofit networks: Political support and housing services for homeless populations. Urban Affairs Review, 58(3), 731–757.
- Turrini, A., Cristofoli, D., Frosini, F., & Nasi, G. (2010). Networking literature: From theory to practice. Public Administration Review, 70(3), 392–402. [CrossRef]
- Emerson, K., Nabatchi, T., & Balogh, S. (2011). An integrative framework for collaborative governance. Journal of Public Administration Research and Theory, 22(1), 1–29. [CrossRef]
- Dobbin, F., Schrage, D., & Kalev, A. (2022). How socio-political factors shape network performance. Sociological Science, 9, 1–24.
- Fung, A., & Wright, E. O. (2001). Deepening democracy: Institutional innovations in empowered participatory governance. Politics & Society, 29(1), 5–41. [CrossRef]
- Feiock, R. C., & Jang, H. S. (2009). Nonprofit contracting and collaboration in elderly services. Public Administration Review, 69(6), 970–983.
- Jang, H. S., Valero, J. N., & Jeong, B. (2020). Cross-sector collaboration in homeless health services. Journal of Health and Human Services Administration, 43(2), 141–162.
- U.S. Department of Housing and Urban Development. (2023). Continuum of Care Program Reports. https://www.hud.gov.
- Office of the Assistant Secretary for Planning and Evaluation. (2014). The evidence behind PSH and chronic homelessness reduction. U.S. Department of Health & Human Services.
- Federal Emergency Management Agency. (2024). Disaster assistance reports. https://www.fema.gov.
- UNITY of Greater New Orleans. (2024). Annual report. https://unitygno.org.
- Hanratty, M. (2017). Housing, homelessness, and public policy. Annual Review of Public Health, 38, 341–356.
- Bryson, J. M., & Crosby, B. C. (2008). Failing into cross-sector collaboration successfully. Public Administration Review, 68(6), 123–134.
- Serna, G. (2023). Public leadership and housing collaboration: Lessons from successful CoCs. Journal of Public Leadership, 8(2), 45–59.
- Vision Action Network. (2018). PSH challenges in Washington County. https://visionactionnetwork.org.
- National Low Income Housing Coalition. (2023). Out of reach report. https://nlihc.org.
- Culhane, D. P., Metraux, S., & Hadley, T. (2013). Public service reductions associated with supportive housing. Housing Policy Debate, 24(2), 357–380.
- Mental Health Services Act. (2022). Barriers to supportive housing expansion. California Department of Health Care Services.
- Wilkins, V. M., & Mullins, L. (2018). Performance management in racially diverse communities. Public Administration Review, 78(3), 426–437.
- Padgett, D. K., Henwood, B. F., & Tsemberis, S. J. (2016). Housing first: Ending homelessness, transforming systems. Oxford University Press. [CrossRef]
- Henwood, B. F., Wenzel, S. L., & Mangano, P. F. (2015). The role of housing in ending family homelessness. Children and Youth Services Review, 53, 1–9.
- Chen, B., & Graddy, E. A. (2010). The effectiveness of nonprofit lead agencies in human service delivery networks. Nonprofit Management and Leadership, 20(4), 405–422. [CrossRef]
- Moeser, J., & Carr, P. J. (2016). Leading networks: The role of executive agency in collaborative governance. Journal of Public Administration Research and Theory, 26(1), 189–202.
- Provan, K. G., & Kenis, P. (2008). Modes of network governance: Structure, management, and effectiveness. Journal of Public Administration Research and Theory, 18(2), 229–252. [CrossRef]
- Brown, W. A. (2005). Exploring the association between board and organizational performance. Nonprofit Management and Leadership, 15(3), 317–339. [CrossRef]
- Ott, J. S., & Dicke, L. A. (2012). Understanding nonprofit organizations: Governance, leadership, and management(2nd ed.). Westview Press.
- Desmond, M. (2016). Evicted: Poverty and profit in the American city. Crown Publishing Group.
- Byrne, T., Fargo, J., Montgomery, A., & Munley, E. (2012). The relationship between community income and rates of homelessness. American Journal of Public Health, 102(1), 139–144.
- Byrne, T., Montgomery, A., & Fargo, J. (2015). The impact of rental market affordability on homelessness. Housing Policy Debate, 25(2), 280–296.
- Byrne, T., Fargo, J., Montgomery, A., & Khadduri, J. (2017). Supportive housing outcomes. American Journal of Community Psychology, 59(1–2), 32–45.
- Provan, K. G., & Milward, H. B. (1995). A preliminary theory of interorganizational network effectiveness: A comparative study of four community mental health systems. Administrative Science Quarterly, 40(1), 1–33. [CrossRef]
- Thomson, A. M., & Perry, J. L. (2006). Collaboration processes and performance: A review of the literature. Journal of Public Administration Research and Theory, 16(2), 231–252. [CrossRef]
- U.S. Department of Housing and Urban Development. (2023). 2023 Continuum of Care (CoC) homeless assistance programs homeless populations and subpopulations report. https://www.hud.gov.

Table 1.
Data Sources for Dependent and Independent Variables Measurement.
| Variables | Measurement | Data Source | Year |
|---|---|---|---|
| Dependent Variable | |||
| Network Performance (CoC) | PSH Bed Unit Availability | HUD Website [ Point-in-Time (PIT) and Housing Inventory County (HIC) 2023 ] | 2023 |
| Independent Variables | |||
| Nonprofit Leadership | Type of leadership (nonprofit or government) (Nonprofit=1, Government=0) |
CoC websites Correspondence with CoC point of contact (via email) |
2023 |
| Board Member Size | Number of CoC board members | CoC websites (Governance Charter) | 2023 |
| Federal Funding | HUD funding received by each CoC | HUD Website (FY-2023 CoC Award) | 2023 |
| Political Climate | Regional political orientation (Democratic = 1, Republican = 0) | United States Census Bureau Data 2020 Office of the Clerk (U.S. House of Representatives) |
2020 2023 |
| Gross Household Income | Gross Household Income of the region CoC operates (FIPS code to merge data of CoCs covering multiple counties) | United States Census Bureau Data 2020 HUD Website (CoC Dashboard Report 2023) |
2020/2023 |
| Median Rent | Median of the region CoC operates (FIPS code to merge data of CoCs covering multiple counties) | United States Census Bureau Data 2020 HUD Website (CoC Dashboard Report 2023) |
2020/2023 |
| Homeless Population |
Total Homeless Population of each CoC | HUD PIT Count 2023 | 2023 |
| Ratio Non-White Homeless | Non-White Homeless People of each CoC | HUD PIT Count 2023 | 2023 |
Table 2.
Correlation Matrix of Dependent, Independent and Control Variables.
| Variables | PSH Bed Units | Nonprofit Leadership | Board Member Size | Federal Funding | Political Climate | Gross Household Income | Median Rent | Homeless Population | Ratio of Non-White Homeless |
|---|---|---|---|---|---|---|---|---|---|
| PSH Bed Units | 1.0 | -0.057 | 0.157 | 0.422 | 0.222 | 0.084 | 0.16 | 0.417 | 0.166 |
| Nonprofit Leadership | -0.057 | 1.0 | -0.088 | -0.161 | -0.313 | -0.226 | -0.261 | -0.164 | -0.109 |
| Board Member Size | 0.157 | -0.088 | 1.0 | 0.213 | 0.183 | 0.035 | 0.054 | 0.2 | 0.088 |
| Federal Funding | 0.422 | -0.161 | 0.213 | 1.0 | 0.472 | 0.152 | 0.306 | 0.694 | 0.389 |
| Political Climate | 0.222 | -0.313 | 0.183 | 0.472 | 1.0 | 0.236 | 0.385 | 0.373 | 0.362 |
| Gross Household Income | 0.084 | -0.226 | 0.035 | 0.152 | 0.236 | 1.0 | 0.67 | 0.145 | 0.077 |
| Median Rent | 0.16 | -0.261 | 0.054 | 0.306 | 0.385 | 0.67 | 1.0 | 0.395 | 0.103 |
| Homeless Population | 0.417 | -0.164 | 0.2 | 0.694 | 0.373 | 0.145 | 0.395 | 1.0 | 0.097 |
| Ratio of Non-White Homeless | 0.166 | -0.109 | 0.088 | 0.389 | 0.362 | 0.077 | 0.103 | 0.097 | 1.0 |
Table 3.
Collinearity Statistic (VIF and Tolerance Value).
| Variables | VIF | Tolerance |
|---|---|---|
| Nonprofit Leadership | 1.161 | .861 |
| Board Member Size | 1.053 | .949 |
| Federal Funding | 1.337 | .748 |
| Political Climate | 1.484 | .674 |
| Gross Household Income | 1.831 | .546 |
| Median Rent | 2.073 | .482 |
| Homeless Population | 2.294 | .436 |
| Ratio of Non-White Homeless | 1.350 | .741 |
Table 4.
Descriptive Statistics.
| Variable | N | Range | Minimum | Maximum | Mean | Std. Error | Std. Deviation | Variance |
|---|---|---|---|---|---|---|---|---|
| PSH Bed Units | 342 | 8.24 | 1.39 | 9.63 | 5.7231 | .08032 | 1.45914 | 2.129 |
| Nonprofit Leadership | 343 | 1.0 | 0.0 | 1.0 | 0.5423 | 0.02694 | 0.49894 | 0.249 |
| Board Member Size | 343 | 36 | 3 | 39 | 15.5 | 0.362 | 6.71 | 45.028 |
| Federal Funding | 342 | 8.24 | 10.82 | 19.06 | 14.839 | 0.07935 | 1.46751 | 2.154 |
| Political Climate | 343 | 1.0 | 0.0 | 1.0 | 0.4548 | 0.02693 | 0.49868 | 0.249 |
| Gross Household Income | 342 | 3.6 | 10.5 | 14.1 | 11.1783 | 0.01613 | 0.29821 | 0.089 |
| Median Rent | 343 | 2.81 | 6.53 | 9.34 | 7.1076 | 0.01699 | 0.31461 | 0.099 |
| Homeless Population | 343 | 7.38 | 4.01 | 11.39 | 6.4968 | .06067 | 1.12366 | 1.263 |
| Ratio of Non-White Homeless | 343 | 90.41% | 0.00% | 90.41% | 45.0622% | 1.06857 | 19.79018 | 391.651 |
| Valid N (listwise) | 340 |
Table 5.
Regression Analysis Results.
|
Independent Variables |
PSH Bed Units | |
|---|---|---|
| Model 1 | Model 2 | |
| Nonprofit Leadership | -.057 (.292) | -.057(.292) |
| Board Member Size | .157*** (.004) | .157***(0.004) |
| Federal Funding | .435*** (<.001) | .427***(<.001) |
| Political Climate | .251***(<.001) | .226***(<.001) |
| Gross Household Income | .084 (.120) | .083(.120) |
| Median Rent | -.160*** (.003) | -.161***(.003) |
| Homeless Population | .417*** (<.001) | .416***(<.001) |
| Ratio of Non-White Homeless | .166*** (.002) | .169***(.002) |
| Political Climate* Federal Funding | - | .265***(<.001) |
| Observation | 342 | 340 |
| R-Squared | 0.216 | 0.237 |
| F-Statistics | 13.080*** | 11.373*** |
*** p<0.01, **p<0.05, * p<0.1. Two-tailed test.
Disclaimer/Publisher’s Note: The statements, opinions and data contained in all publications are solely those of the individual author(s) and contributor(s) and not of MDPI and/or the editor(s). MDPI and/or the editor(s) disclaim responsibility for any injury to people or property resulting from any ideas, methods, instructions or products referred to in the content. |
© 2025 by the authors. Licensee MDPI, Basel, Switzerland. This article is an open access article distributed under the terms and conditions of the Creative Commons Attribution (CC BY) license (http://creativecommons.org/licenses/by/4.0/).
Copyright: This open access article is published under a Creative Commons CC BY 4.0 license, which permit the free download, distribution, and reuse, provided that the author and preprint are cited in any reuse.


