Submitted:
25 May 2025
Posted:
27 May 2025
You are already at the latest version
Abstract
In order to improve the quality and efficiency of advertisement creative generation, an advertisement creative optimization and performance improvement system based on multimodal deep learning is designed. The system fuses three types of data, namely image, text and user behavior, and utilizes ResNet50 and BERT-base co-coding to achieve cross-modal feature alignment through a multi-layer attention fusion network, and a three-layer Transformer structure for deep semantic modeling. The experimental setup includes 12,00 sets of multimodal samples, the training batch is 128, the total number of training rounds is 200, the optimizer is AdamW, the learning rate is set to 1e-4, and the loss function contains the three-modal reconstruction loss and the cross-modal consistency loss. The system evaluates the performance of the advertisement creative through the multidimensional aspects of click rate prediction, sentiment consistency and image attractiveness. The experimental results show that the advertisement creative generation using this multimodal deep learning system is better than the traditional model, with a click-through rate accuracy of 0.681, an F1 value of 0.791, a PSNR of 28.94, and a composite score of 0.729, which is a significant improvement over the traditional method, demonstrating the advantages of the system in improving the quality of advertisement creative generation and user experience.
Keywords:
ad creative optimization
; multimodal deep learning
; performance evaluation
; user behavior analysis
1. Introduction
In the current digital era, the generation and evaluation of advertising creative has become a core task in the marketing field. Traditional advertising creative generation methods mostly rely on a single data source, such as images or text, resulting in a large gap between the semantic consistency and visual appeal of the generated creative. With the continuous progress of deep learning technology, how to improve the quality and accuracy of ad creative generation through multimodal data fusion has become an urgent problem in the advertising industry. By integrating image, text and user behavior data, multimodal deep learning technology can effectively capture the intrinsic connection between different modalities and improve the generation effect of advertising content. In the performance evaluation process of advertisement creativity, how to comprehensively consider multi-dimensional factors such as user behavior, content quality and visual appeal is also a hot topic in current research. Based on this, the research is committed to designing an efficient advertisement creative optimization and performance enhancement system through multimodal deep learning technology, with a view to promoting the further development of advertisement creative generation technology under the multi-level and multi-dimensional evaluation system.
2. Overall Design of Advertisement Creative System Based on Multimodal Deep Learning
The system architecture is based on the tri-modal data fusion mechanism of image, text and user behavior, with input dimensions of image resolution 224×224×3, maximum length of text sequence 512, dimension of behavioral data 64, and embedding dimension up to 1024 after the overall feature splicing.The feature extraction module adopts the joint coding of ResNet50 and BERT-base, and cross-modal feature alignment is carried out by multilayer attention fusion network for cross-modal feature alignment [1] . The system adopts a three-layer Transformer structure, the number of parameters is about 45M, the batch data of each round in the training phase is 128 groups, the learning rate is set to 1e-4, the number of training rounds is 200 using the AdamW optimizer, and the loss function includes the loss of the three-modal reconstruction loss and the loss of the cross-modal consistency, which is shown in Figure. 1 in detail.
3. Multimodal Deep Learning Key Technologies
3.1. Multimodal fusion technology
The multimodal fusion technique in this system uses three types of data: image, text and user behavior, with dimensions of 224×224×3, maximum sequence length of 512 and 64-dimensional sparse vectors, which are uniformly mapped to a 1024-dimensional representation space after being processed by the feature extraction module (see Figure 2). The feature fusion stage introduces a multi-head attention mechanism with a fusion matrix of 128×1024 dimensions, and the fusion output is normalized by LayerNorm and inputted into a three-layer Transformer structure to model the deep semantic relationships across modalities [2] . To improve the consistency of the fusion representation, the following loss function is introduced to construct the joint optimization objective:
(1)
where denotes the three-modal reconstruction loss of the graphic behavior, is the cross-modal consistency loss, and is the balance coefficient, with empirical values of 0.6 and 0.4, respectively. The attentional heatmap among modalities is shown in Figure 2, and the visualization results show that there is a significant aggregation area of semantic pairing in the cross-modal path. The detailed feature mapping layer parameters and training dimension configurations are shown in Table 1, covering the multimodal input dimensions, the number of attentional heads and the positional encoding strategy.
3.2. Deep Learning Model Design
This system uses a three-layer stacked Transformer structure as the core modeling unit, the input is a 1024-dimensional fusion vector with encoding dimensions [128, 256, 512], each layer contains 8, 8 & 16 multi-head attention channels, respectively, with an attention dimension of 64, and the Dropout rate is set to 0.1. Each layer of the sub-structure contains a FeedForward sub-layer, the internal linear projection dimension is 2048, and the activation function is chosen to be GELU. The internal linear projection dimension is 2048, the activation function is chosen to be GELU, and LayerNorm normalization is applied after residual linkage [3] . The overall parameter count of the model is controlled within 45M, the training batch is 128, the total number of training rounds is 200, the initial learning rate is 1e-4, and the cosine annealing learning rate strategy is used. In order to enhance the coherence and constraints in the semantic generation process, the regularization optimization objective is introduced:
(2)
where denotes the target representation vector of the first sample, is its corresponding model output vector, and is the total number of samples. In order to strengthen the alignment ability of different modal features in the attention path, auxiliary supervised signals are also added:
(3)
where is the number of attention heads, is the number of time steps, and represents the normalized attention weight of the attention head at the position. The configuration of the model structural parameters is shown in Table 2, and the density of the attention distribution during the training process is shown in Figure 3, which clearly presents the trajectory of the model’s focus on text and image features in the generation phase.
3.3. Algorithm for evaluating advertisement creative performance
The algorithm design of advertisement creative performance evaluation is based on the fusion mechanism of multi-dimensional indicators, taking into account the user behavior response characteristics, the semantic quality of the generated content and the matching degree of visual presentation [4] . The system performs quantitative scoring for each generated idea, and the length of the evaluation feature vector is set to 96 dimensions, which is composed of the CTR estimation module (32 dimensions), emotion recognition sub-network (24 dimensions), and visual subjective attractiveness model (40 dimensions) outputs, respectively. The overall evaluation function is defined as follows:
(4)
where, denotes the click-through rate prediction score, denotes the verbal emotional stability score, is the image attractiveness score; . Further to improve the model evaluation distribution differentiation, a cross entropy stretching term is introduced:
(5)
where is the high-quality creative score, is the negative sample score, and is the sample size. Figure 4 shows a comparison chart of the distribution of scores under different evaluation dimensions, clearly demonstrating the distribution trend of each sub-model in the assessment task. Details of the dimension composition and weight setting of each index are shown in Table 3.
4. Functional Validation of a Multimodal Deep Learning Advertisement Creative System
4.1. Experimental Design
In order to comprehensively verify the usability and stability of the system in real advertisement creative generation scenarios, a functional test scheme covering multi-dimensional variables is constructed: (1) The input layer simulates the image, copy and user click data in real advertisement scenarios, with the input sample size of 12,00 groups, and the dimensions of the three-modal features are set to be 224×224×3, 512, and 64; (2) The test module calls an integrated Transformer encoder to evaluate the output coherence of the three-layer structure under the consistency of generative style; (3) the performance evaluation end collects CTR prediction scores, sentiment consistency indexes and image quality evaluations, and the output dimensions are unified into a 96-dimensional triple-nested representation, which is used to support the subsequent score modeling experiments. The experimental structure is designed to ensure that the various modules of the system can achieve stable and synergistic output under large-scale multimodal input [5] .
4.2. Model Training and Parameter Tuning
The training phase uses 12,000 multimodal samples, with 200 rounds of training. Each round includes 128 batches, totaling around 18,750 steps. The model parameters are initialized using a Xavier uniform distribution, and AdamW is used as the optimizer, with an initial learning rate of 1e-4, dynamically adjusted by a cosine annealing strategy with thermal restart. The multimodal reconstruction and cross-modal consistency losses are weighted at 0.7 and 0.3, respectively, and the overall loss is L2-regularized with a weight decay of 1e-5. The validation set loss is monitored, and early stopping is applied if there is no improvement for 10 consecutive rounds, with a threshold of 0.01 for overfitting [6] . Hyperparameter tuning is done via five-fold cross-validation, with a sampling ratio of 0.8 per restart and grid search for hidden dimensions, attention heads, and feed-forward layer size. The final configuration includes 1024 hidden units, 8 attention heads, and 2048-dimensional feed-forward layers, ensuring balanced convergence speed, semantic consistency, and generative stability for large-scale multimodal tasks [7] .
4.3. Comparison Experiments
4.3.1. Comparison with traditional methods
In order to verify the performance advantages of this system in the task of advertisement creative generation, the comparison experiments with three traditional generation methods are constructed, including the TF-IDF-based keyword splicing model, the LSTM graphic generation model, and the FastText+CNN combination model [8] . The experiments use the same test set (2,000 ad samples), and the five metrics of click-through rate prediction accuracy, linguistic generation F1 value, image quality (PSNR), average generation time, and composite score are used as the comparison dimensions. Table 4 demonstrates the evaluation results of each model under the five metrics.
As seen in Table 4, the multimodal Transformer system outperforms the three traditional generative models in all five core metrics. In the click-through accuracy dimension, the system reaches 0.681, which is about 30.7% higher than the TF-IDF splicing model and about 16.0% higher than LSTM, indicating that the multimodal semantic modeling effectively captures user interest patterns. In the F1 value dimension, this system is 0.791, which is significantly better than the 0.725 of the FastText+CNN model, with an improvement of about 9.1%, reflecting the advantage of generative language in contextual logic and emotional structure. The image quality index PSNR reaches 28.94, which is 2~5dB ahead of the traditional model, reflecting that the system can effectively output clearer and more reasonably composed creative images in graphic fusion. Although the average generation time is slightly higher than FastText+CNN, the time difference is controlled within 8ms, which is acceptable overall. The comprehensive score reaches 0.729, which is higher than the traditional method by more than 0.081, further indicating that the system achieves balanced optimization under multiple indicators. Overall, the overall improvement in performance stems from the highly modeling ability of the three-modal feature fusion and cross-modal attention mechanism for semantic consistency and structural integrity [9] .
4.3.2. Comparison of the performance of different models
To further validate the performance of the system under different network structures, model structure comparison experiments are designed to make changes in two dimensions, encoder structure and decoder mechanism, respectively, and evaluated using consistent data inputs, parametric quantities and training strategies [10] . Table 5 and Table 6 show the experimental results of each model under the five evaluation metrics.
Table 5 shows that the encoder structure has a direct impact on the final generation results. The unified Transformer encoder model outperforms the traditional shallow stacked model by 0.118 in click-through rate accuracy, and BLEU-4 by 0.105, indicating that it possesses stronger comprehensive modeling capabilities in cross-modal semantic understanding and reconstruction. Compared to the ResNet50+BERT independent coding structure, Transformer improves 0.067 in F1 value, showing that it is more effective in unifying the graphic-behavioral tri-modal inputs. Although its generation time rises slightly, it is within a manageable range, balancing efficiency and quality.
As seen in Table 6, different decoder mechanisms have significant effects on both the semantic coherence and graphic alignment effects of the generation. The traditional RNN-based generator has the lowest score of 0.661 on visual coherence and 0.578 on click-through accuracy despite its low computational effort, indicating that it is difficult to capture cross-modal semantic mappings.The Transformer-Decoder structure has a significant improvement in all metrics, with an F1 value of 0.746, suggesting that it is better than RNN in modeling the logic of language generation. outperforms RNN.Further introduction of the GPT-refined variant improves the visual consistency score to 0.752, and the click-through rate prediction accuracy reaches 0.673, validating its advantages in high-dimensional dependency modeling.
5. Conclusion
The multimodal deep learning ad creative optimization system achieves efficient ad creative generation and evaluation by integrating image, text and user behavior data. The deep fusion of tri-modal features and the cross-modal attention mechanism effectively improve the relevance and attractiveness of the advertisement content, surpassing the traditional model in a number of performance evaluation indexes, showing its potential for application in real advertising scenarios. In the future, with further optimization of the technology, the performance of the system in terms of generation speed and processing of large-scale datasets can be further improved. In-depth exploration of the integration of multimodal deep learning and other fields of application will help promote the development of advertising creative generation technology and provide more possibilities for personalized advertising recommendation and user experience optimization.
References
- Sharakhina, L.; Ilyina, I.; Kaplun, D.; et al. AI technologies in the analysis of visual advertising messages: survey and application. Journal of Marketing Analytics, 2024, 12, 1066–1089. [Google Scholar] [CrossRef]
- Isalman, I.; Mubaraq, A.; Conny, C.; et al. Creative training in creating advertising content on social media for entrepreneur students. Society: Jurnal Pengabdian Masyarakat, 2025, 4, 1–11. [Google Scholar] [CrossRef]
- Bijalwan, P.; Gupta, A.; Johri, A.; et al. Unveiling sora open AI’s impact: a review of transformative shifts in marketing and advertising employment. Cogent Business & Management, 2025, 12, 2440640. [Google Scholar]
- Bijalwan, P.; Gupta, A.; Johri, A.; et al. Unveiling sora open AI’s impact: a review of transformative shifts in marketing and advertising employment. Cogent Business & Management, 2025, 12, 2440640. [Google Scholar]
- van Deventer, M.; Saraiva, M. Antecedents of Generation Y consumers’ perceived value of social media advertisements. Cogent Social Sciences, 2025, 11, 2450097. [Google Scholar] [CrossRef]
- Braun, M.; Schwartz, E.M. Where A/B Testing Goes Wrong: How Divergent Delivery Affects What Online Experiments Cannot (and Can) Tell You About How Customers Respond to Advertising. Journal of Marketing, 2025, 89, 71–95. [Google Scholar] [CrossRef]
- Prihatiningsih, T.; Panudju, R.; Prasetyo, I.J. Digital Advertising Trends and Effectiveness in the Modern Era: a Systematic Literature Review. Golden Ratio of Marketing and Applied Psychology of Business, 2025, 5, 01–12. [Google Scholar] [CrossRef]
- Peschiera, A.N.; Chapa, S. Does co-brand placement work on ad recall? Exploring the impact of co-brand placement in storytelling animated advertising. Economicus Journal of Business and Economics Insights, 2025, 2, 26–35. [Google Scholar]
- Syafitri, H.R.; Hamid, R.S.; Maszudi, E. Optimization of Creativity and Performance: Self-Efficacy, Knowledge Sharing, and Digital Literacy as Moderator Variables. International Conference of Business, Education, Health, and Scien-Tech. 2024, 1, 1159–1173. [Google Scholar]
- Truong, V. Optimizing mobile in-app advertising effectiveness using app publishers-controlled factors. Journal of Marketing Analytics, 2024, 12, 925–943. [Google Scholar] [CrossRef]
Figure 1.
Overall architecture of creative optimization system based on multimodal deep learning.
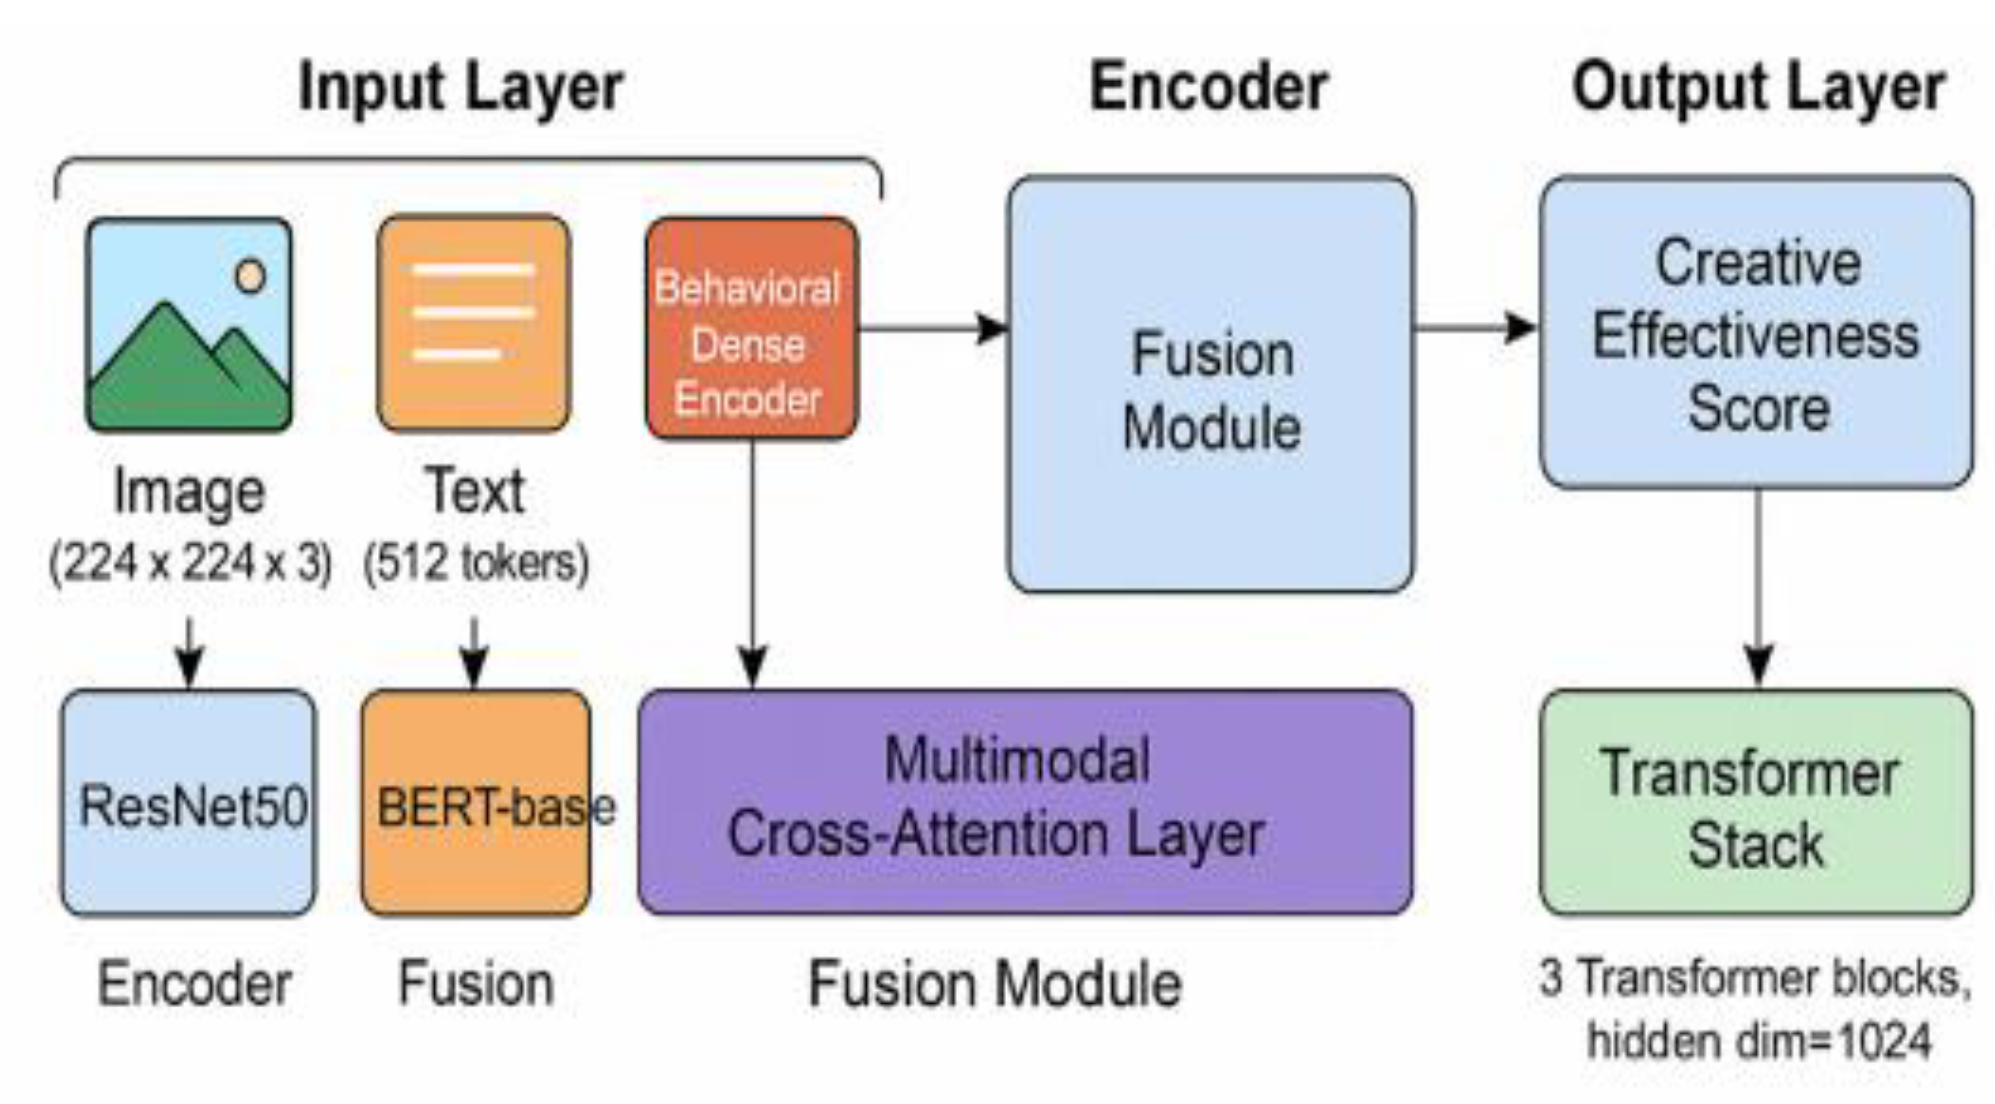
Figure 2.
Modal Attention Weights Heat Map with Feature Alignment Presentation.
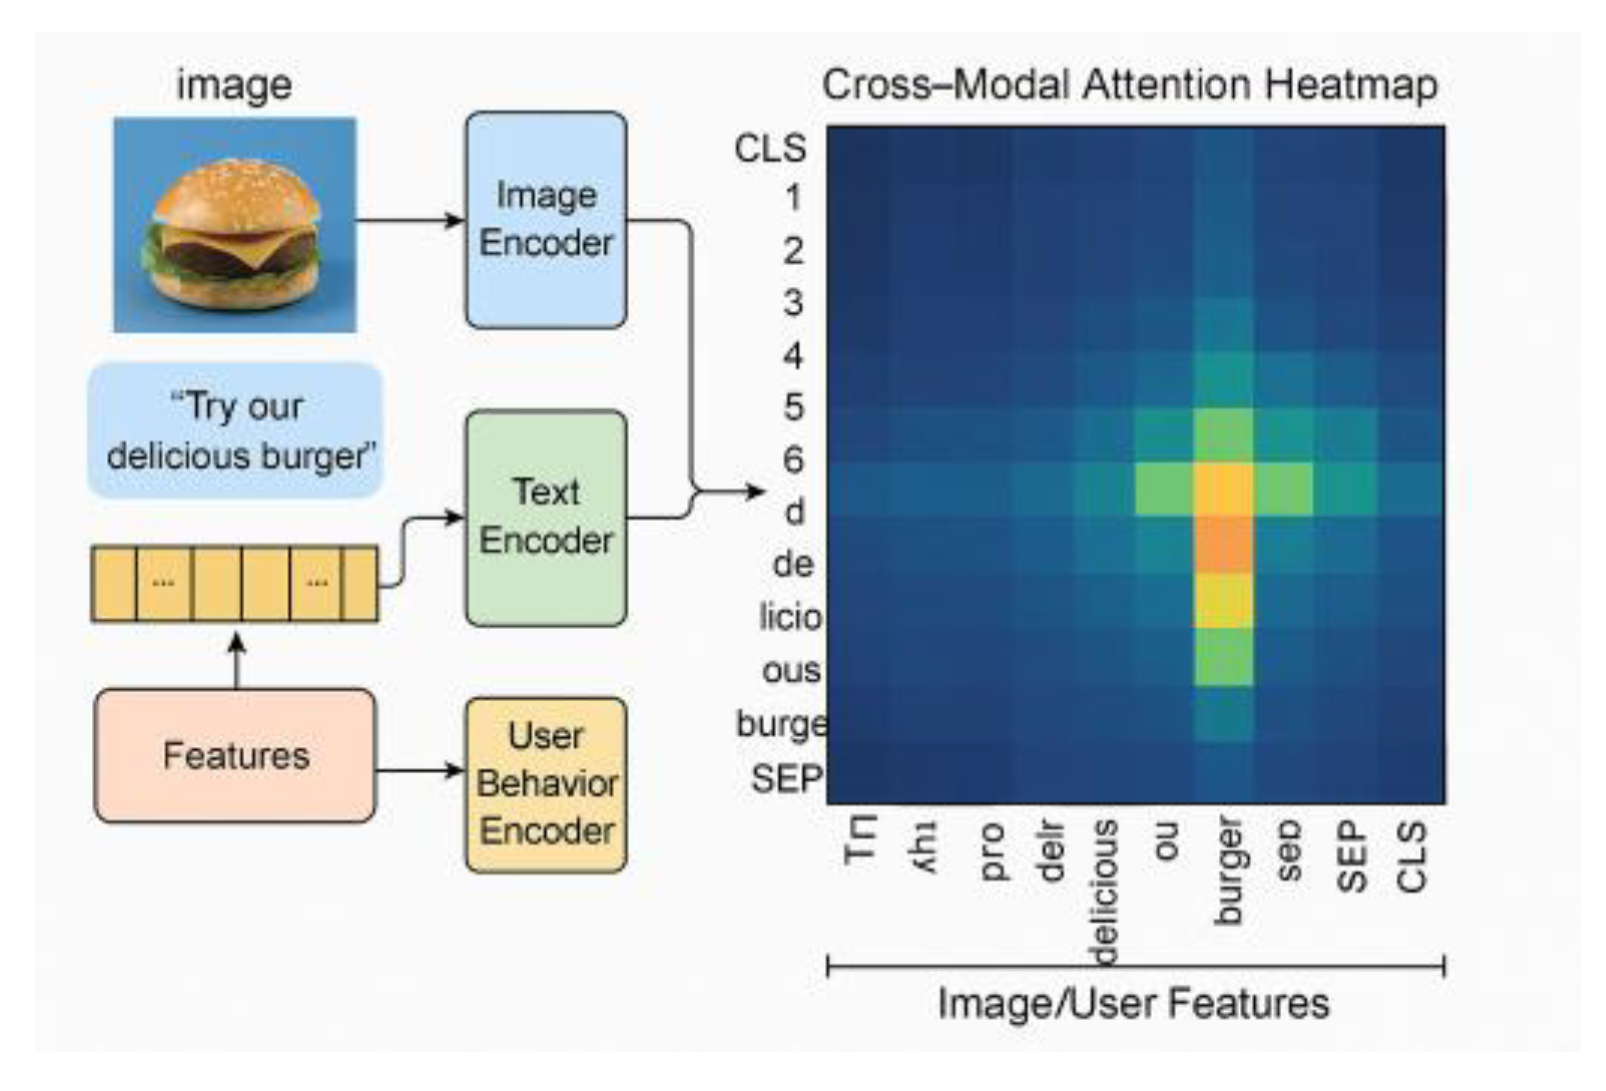
Figure 3.
Evolution of the attention distribution during model training.
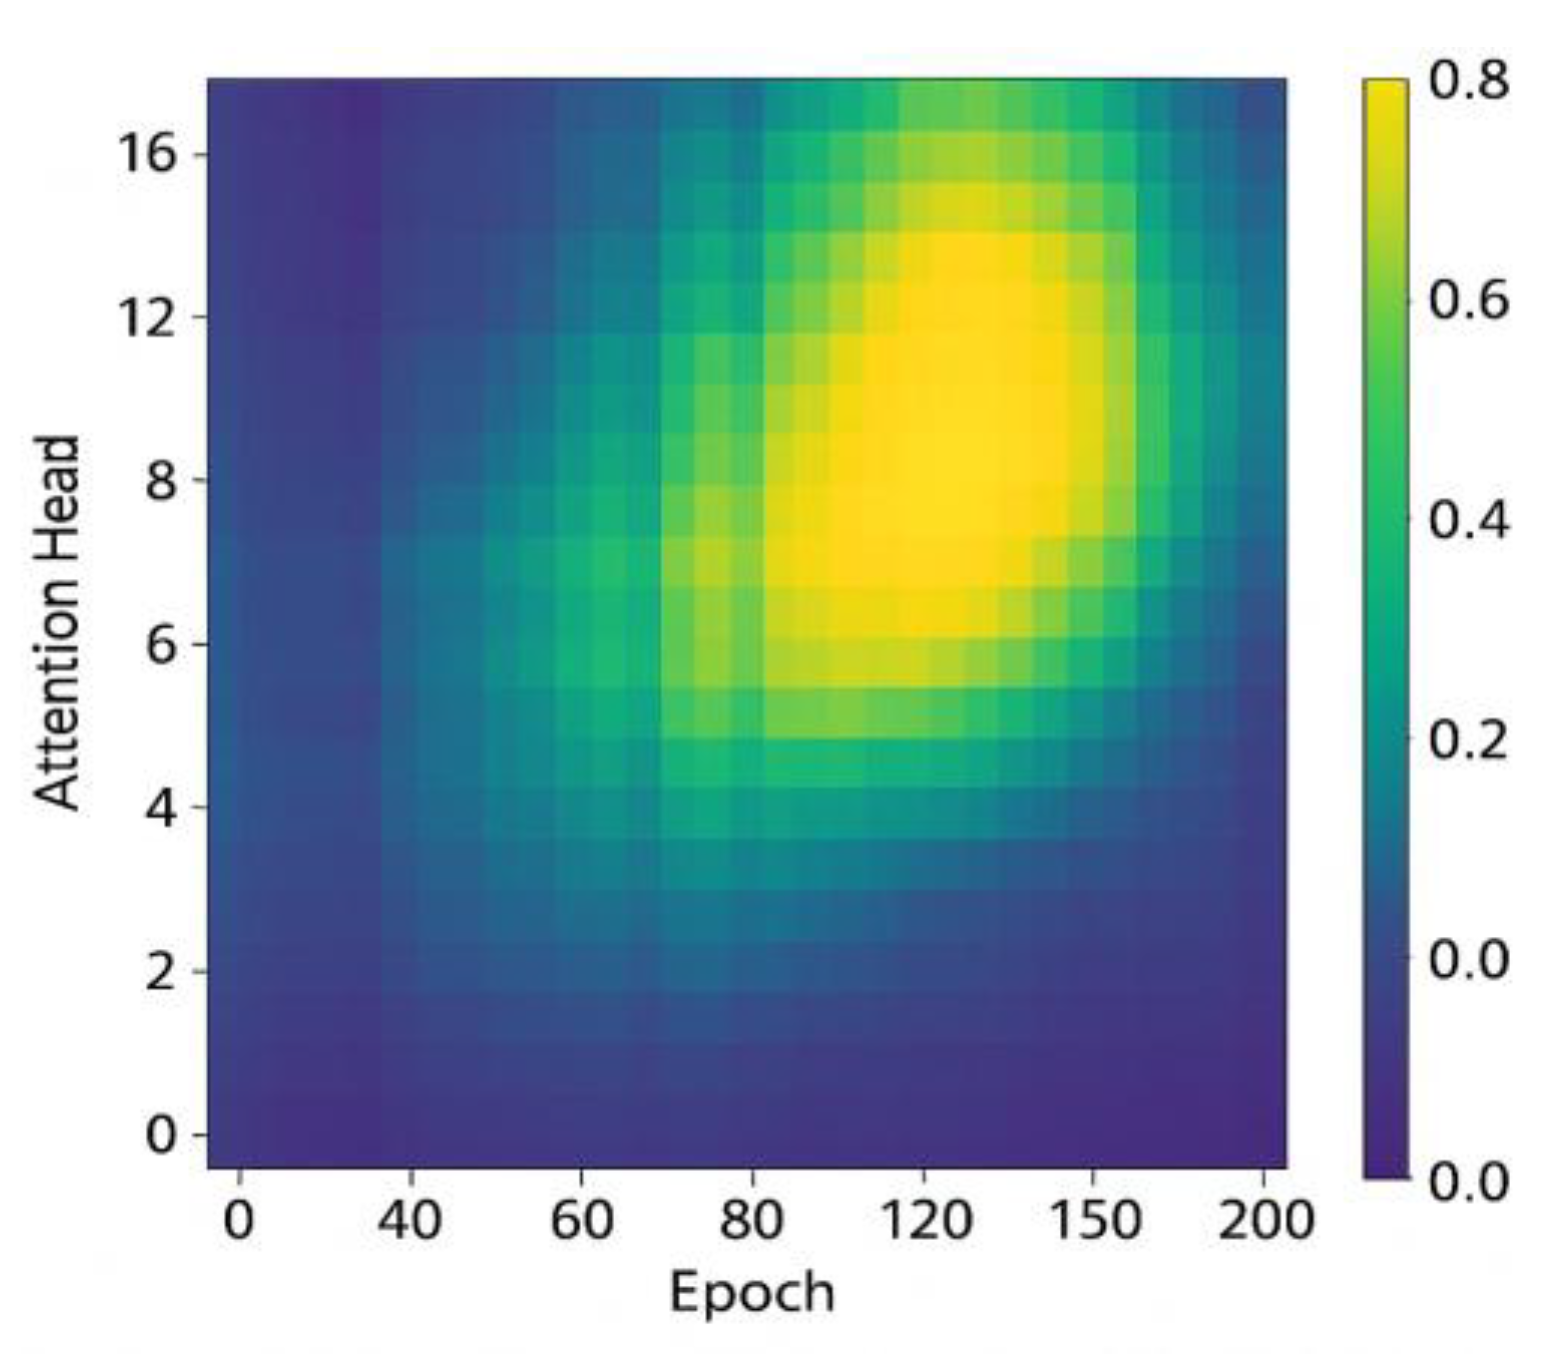
Figure 4.
Distribution of ad creative scores under different evaluation dimensions.
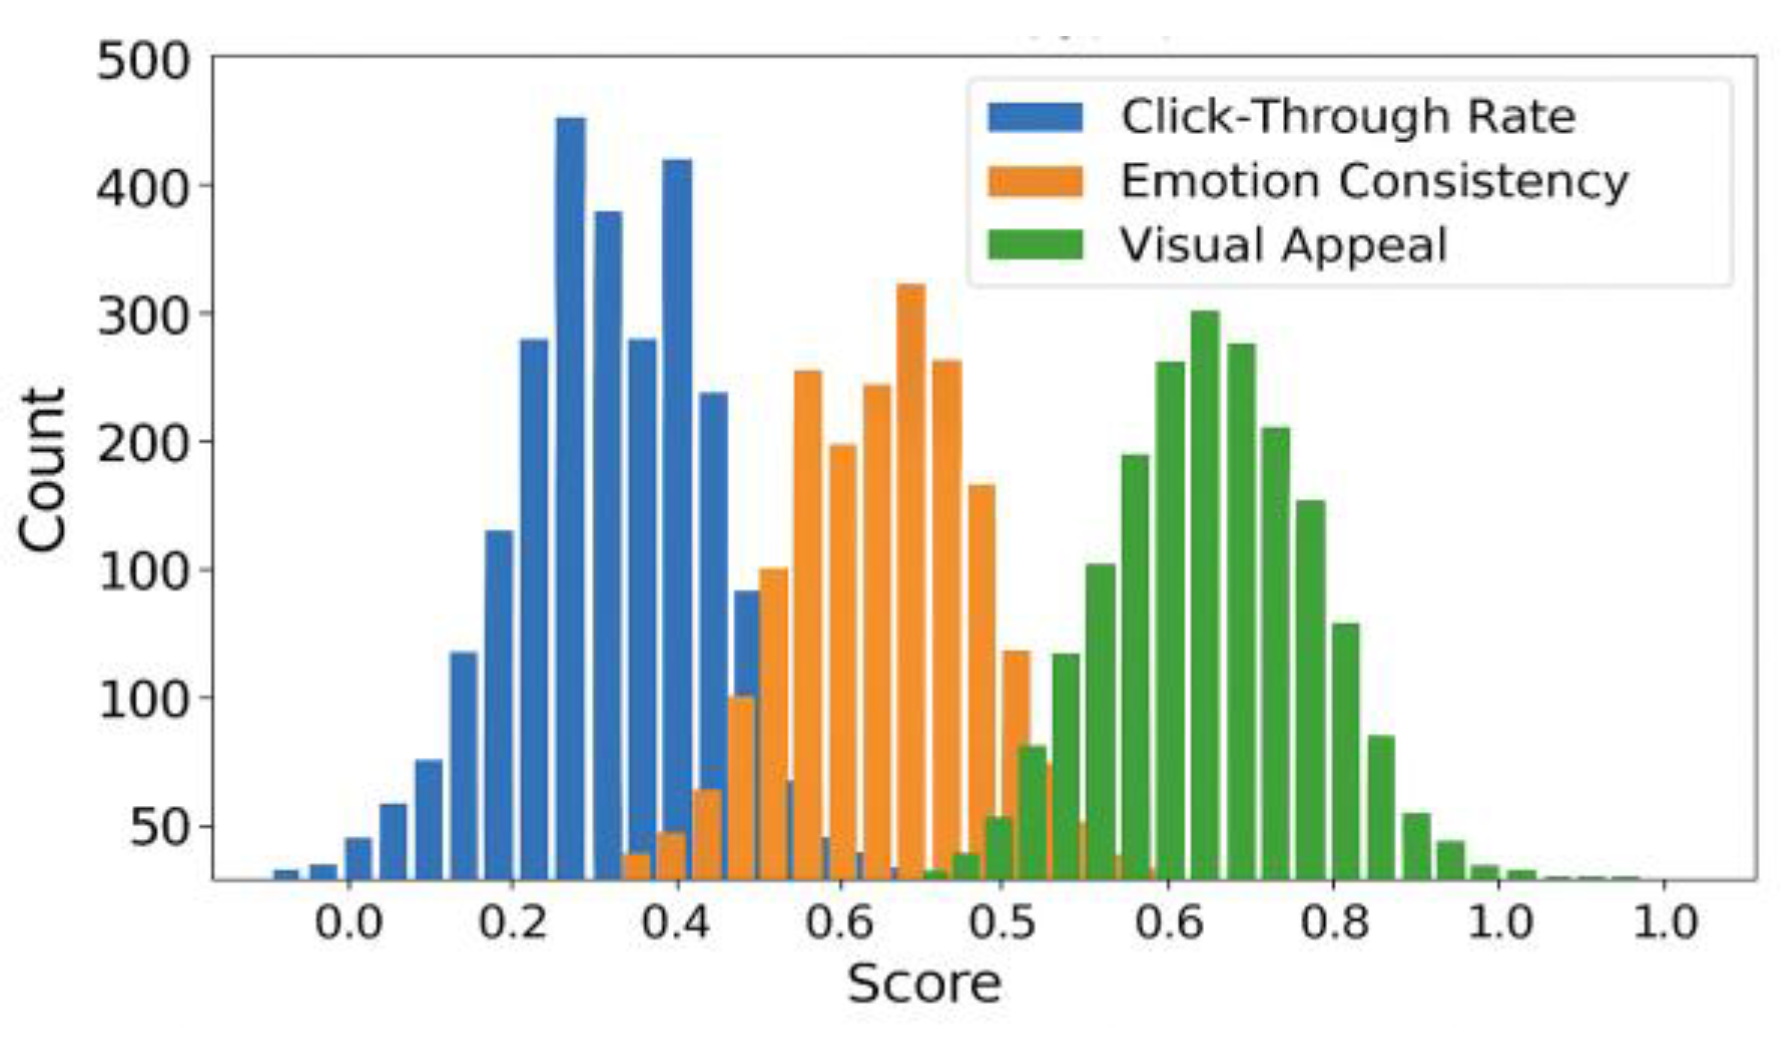

Table 1.
Configuration table of system feature fusion module parameters.
| Module Name | input Dimension | Output Dimension | Attention Span | Residual Link | Standardized Approach |
|---|---|---|---|---|---|
| image encoder | 224 × 224 x 3 | 512 | - | clogged | - |
| text encoder | 512 (maximum number of Token) | 512 | - | clogged | - |
| User Behavior Encoder | 64 | 128 | - | clogged | - |
| Fusion layer after feature splicing | 512+512+128=1152 | 1024 | 8 | be | LayerNorm |
| Cross-modal Attention Module | 128 x 1024 | 128 x 1024 | 8 | be | LayerNorm |
Table 2.
Configuration table of parameters for each layer of the depth model.
| Network Level | Input Dimension | Output Dimension | Attention Span | Feedforward Layer Dimension | Activation Function | Standardized Approach | Dropout Rate |
|---|---|---|---|---|---|---|---|
| Transformer Layer 1 | 1024 | 128 | 8 | 2048 | GELU | LayerNorm | 0.1 |
| Transformer Layer 2 | 128 | 256 | 8 | 2048 | GELU | LayerNorm | 0.1 |
| Transformer Layer 3 | 256 | 512 | 16 | 2048 | GELU | LayerNorm | 0.1 |
Table 3.
Structure of indicators for evaluating the performance of advertising creativity.
| Assessment Dimensions | Number of Dimensions | Module Source | Meaning of the Indicator | Weighting |
|---|---|---|---|---|
| Hits Predictive Score | 32 | CTR Predictive Model Output | characterize users’ expectation of click-through willingness | 0.5 |
| Emotional Sentiment Match | 24 | Sentiment analysis submodel | Does the description text consistently express the promotional sentiment | 0.3 |
| Visual Appeal Score | 40 | Image Attention/Attraction Model | Comprehensive judgment of color, composition, clarity and other elements | 0.2 |
Table 4.
Experimental results of performance comparison of different ad generation methods.
| Model Name | Click-Through Accuracy | F1 Value | PSNR Value | Average Generation Time (ms) | Overall Rating |
|---|---|---|---|---|---|
| TF-IDF splicing model | 0.521 | 0.633 | 23.12 | 28.6 | 0.568 |
| LSTM generative model | 0.587 | 0.712 | 25.46 | 36.2 | 0.631 |
| FastText+CNN Combined Model | 0.602 | 0.725 | 26.51 | 33.9 | 0.648 |
| Multimodal Transformer System | 0.681 | 0.791 | 28.94 | 41.7 | 0.729 |
Table 5.
Experimental results of encoder structure comparison.
| Model Name | Click-Through Accuracy | F1 Value | BLEU-4 | Average Generation Time (ms) | Overall Rating |
|---|---|---|---|---|---|
| Unimodal shallow stacking model | 0.563 | 0.681 | 0.427 | 25.3 | 0.594 |
| ResNet50+BERT independent coding | 0.608 | 0.724 | 0.473 | 32.1 | 0.648 |
| Multimodal Unified Transformer Encoding | 0.681 | 0.791 | 0.532 | 41.7 | 0.729 |
Table 6.
Experimental results of decoder mechanism comparison.
| Decoder Structure | Click-Through Accuracy | F1 Value | Visual Consistency Score | Average Generation Time (ms) | Overall Rating |
|---|---|---|---|---|---|
| Baseline RNN Generator | 0.578 | 0.692 | 0.661 | 26.5 | 0.609 |
| Transformer Decoder | 0.641 | 0.746 | 0.719 | 33.8 | 0.683 |
| Streamlined GPT structure | 0.673 | 0.783 | 0.752 | 39.2 | 0.716 |
Disclaimer/Publisher’s Note: The statements, opinions and data contained in all publications are solely those of the individual author(s) and contributor(s) and not of MDPI and/or the editor(s). MDPI and/or the editor(s) disclaim responsibility for any injury to people or property resulting from any ideas, methods, instructions or products referred to in the content. |
© 2025 by the authors. Licensee MDPI, Basel, Switzerland. This article is an open access article distributed under the terms and conditions of the Creative Commons Attribution (CC BY) license (http://creativecommons.org/licenses/by/4.0/).
Copyright: This open access article is published under a Creative Commons CC BY 4.0 license, which permit the free download, distribution, and reuse, provided that the author and preprint are cited in any reuse.


