Submitted:
26 May 2025
Posted:
27 May 2025
You are already at the latest version
Abstract
Pleioblastus amarus (P. amarus) (Keng) Keng f.is widely distributed in the southern region of China and is a medicinal and food resource there. Flavonoids are important bioactive components in P. amarus and play important anti-tumour, anti-inflammatory, and antioxidation roles. In this study, the targeted metabolomics method based on liquid chromatography–mass spectrometry (LC-MS/MS) was used to analyze 35 flavonoids in 6 leaf samples and 6 shoot samples of P. amarus, and the contents of 20 flavonoids were detected. Cynaroside was the most abundant in P. amarus dry leaf samples (13.17 μg/g), while Isovitexin was the most abundant in P. amarus dry shoot samples (1.34 μg/g). The total content and types of flavonoids in P. amarus leaves were higher than those in P. amarus shoots. The cluster diagram results of the similarity heatmap showed that there were significant differences in the structure of flavonoids between leaves and shoots. Fifteen characteristic differential flavonoids were screened by orthogonal partial least squares-discriminant analysis, sorted by importance, including Luteolin, Kaempferide, Naringin, Icariin, Quercetin 3-glucoside, Catechin, Naringenin, Glycitin, Diosmin, Cynaroside, Rutin, Vitexin, Isovitexin, Quercetin, and L-Epicatechin. The correlation cluster diagram analysis showed that the 20 flavo-noids were mainly divided into two groups: Catechin, L-Epicatechin, Formononetin, and Glycitin in one, and Chrysin, Fisetin, Genistin, Kaempferide, Diosmin, Quercitrin 3-glucoside, Quercetin, Naringenin, Apigenin, Rutin, Icariin, Vitexin, Isovitexin, Quercitrin, Cynaroside, and Luteolin in the other. We investigated the metabolic pathways of these two groups of flavonoids, analyzed the reasons for their division into two groups, and provided a foundation for further research on the flavonoid metabolic pathways in P. amarus. In conclusion, this study lays a foundation for the subsequent directional separation and identification of flavonoids in P. amarus.
Keywords:
Pleioblastus amarus
; Flavonoids
; Targeted metabolomics
; LC-MS / MS
1. Introduction
Pleioblastus amarus (Keng) keng f. is a special and important provenance of the Pleioblastus species [1,2], which is widely distributed in southern China [3], and the bamboo shoots and leaves of P. amarus have high medicinal value because they contain flavonoids [4]. The most commonly used parts in our daily life are the leaves and shoots of P. amarus, which are therefore the focus of this study. Flavonoids, which are also known as bioflavonoids, are compounds that are widely found in various parts of plants and have the structure of 2-phenylchromogenone. Most flavonoids are combined with sugars to form glycosides or carbon glycosyls, and some exist in free forms [5]. Thus far, more than 8,000 flavonoids have been identified based on flavonoid structure [6]. Such compounds are produced after a long period of natural selection, during which secondary metabolites are formed. Flavonoids are contained in different parts of the plant such as the roots, stems, leaves, flowers, and fruits [7,8].
Notably, there are only 27 flavonoids which have been found in the leaves and shoots of P. amarus. Xiao Yisong et al. [9] identified five flavonoid compounds from P. amarus leaves using liquid chromatography–mass spectrometry (LC-MS). Guo Jing et al. [10] determined the contents of Chlorogenic acid, Isoorientin, Orientin, Isovitexin, Cynaroside, Luteolin, and Apigenin by high-performance liquid chromatography (HPLC). Wang Hongbing et al. [11] isolated five flavonoids from the leaves of P. amarus; one was isolated for the first time, which was (E)-3-[4-hydroxy-2-methoxy-5-(2-methylbut-3-en-2-yl)phenyl]-1-(4-hydroxyphenyl)prop-2-en-1-one. Wei Qi et al. [12] isolated seven compounds including Quercetin, Luteolin, Isovitexin, Orientin, Isoorientin, Isovitexin-2''-O-rhamnopyranoside, and Luteolin -6-C-arabinopyranoside. Li et al. [13] used LC-MS/MS to identify seven compounds including Quercetin, Rutin, Luteolin, Kaempferol, Isovitexin, Vitexin, Orientine, Isoorientin, and N-tris(hydroxymethyl)methylglycine from P. amarus leaves. Some flavonoids have also been found in close relatives of P. amarus, and due to the large number of species, they are shown in a list below.
In summary, it seems that the study of flavonoids in the leaves and shoots of P. amarus and their detection techniques is still limited, and the study of flavonoids in the relatives of P. amarus mainly focuses on the leaves; there are few reports on the use of metabolomic analysis to detect and analyze the flavonoids in P. amarus. Meanwhile, with the progress of science and technology, the rapid development of molecular biology, and the growing needs of people for a better life, increasingly more people are also paying more attention to the study of the regulation of flavonoid biosynthesis and metabolism pathways [33]. Molecular biology techniques are constantly developing, and the synthesis pathways and regulatory mechanisms of flavonoid compounds have now been elucidated and are also gradually delving into the study of external environmental factors and biological factors [33]. Flavonoid compounds are widely distributed in the leaves, flowers, fruits, and roots of plants, and they are synthesized in the cytoplasm before being transported to the vesicles for accumulation in the synthesis process [34]; their contents vary among different species and different organs (flowers, stems, and leaves) [35,36]. The main influences on the regulation of flavonoid synthesis in plants are light [37], temperature [38], water [39], salt stress [39], UV radiation [40], and other environmental and biological factors [39] and regulatory genes [39].
Metabolites are the end products of cellular regulatory processes that reflect the response of biological systems to genetic or environmental changes, and the accurate, quantitative, and qualitative analysis of secondary metabolites of chemical diversity in organisms by means of appropriate analytical platforms is one of the important tasks of metabolomics [7]. In recent years, the targeted metabolomics method has been widely used in plant metabolism research, which can not only objectively and accurately assess the consistency between different samples, but also screen out the differential characteristic components between different samples; meanwhile, this technique can also be used to discriminate the attribution of unknown samples [41]. Metabolomics provides a comprehensive platform for the detection and analysis of most metabolites and helps in fully understanding the information of flavonoids in plants [7]. A commonly used technique in metabolomics studies is LC-MS/MS, which is widely used in biochemistry because of the high sensitivity and accuracy of the LC-MS/MS detection technique [42]. For example, in order to study the pharmacokinetic properties of Doxorubicin in rats, LC-MS/MS can be used to monitor Doxorubicin and its conjugated metabolites in plasma [43]; to determine flavonol glycosides in the plasma of SD rats, which is subsequently proposed to be used for the treatment of hyperlipidemia in the clinical trial of a new drug [44]; to determine the total flavonoids of the sour jujube leaf in Ziziphus jujuba leaf [45]; to simultaneously determine the four major metabolites of Epimedium flavonoids in rat plasma, tissues, feces, and urine [46]; to analyze the flavonoids in Wild Horse Chase and the Wild Horse Chase compound capsule [47]; to investigate the differences in flavonoids in the seed kernels of Avena sativa in different origins [48]; and to investigate the flavonoids of Avena sativa seed kernels from different places of origin [49]. The differences in flavonoids in the seed kernel of Avena sativa from different origins were investigated by LC-MS/MS [48].
The relative metabolic levels of different parts of the plant represent the overall nutritional and phytochemical profiles and distributions, which helps identify the most favourable plant parts for further targeted bioactive metabolite studies [50,51]. Therefore, our study utilizes the detection and metabolomic analysis of 35 flavonoid compounds in P. amarus leaves and shoots using targeted metabolomics based on LC-MS/MS technology, which can lay the foundation for the subsequent targeted extraction and isolation of flavonoids in P. amarus leaves and shoots.
2. Materials and Methods
2.1. Chemicals and Reagents
LC-MS-grade methanol (>99.9%) was purchased from Thermo (Beijing, China), and LC-MS-grade formic acid (>98%) was purchased from TCI (Shanghai, China). Naringenin was obtained from Sigma-Aldrich (Shanghai, China). Puerarin was obtained from Macklin (Shanghai, China). Chrysin, Daidzein, Fiseti, Kaempferol, Luteolin, (-)-catechin, Quercetin, Quercetin 3-glucoside, Icariin, Naringin, and Diosmin were all obtained from Aladdin (Shanghai, China). Genistein and Baicalin were obtained from OKA (Beijing, China). Kaempferide, Myricetin, Silybin, and Rutin were all obtained from Shyuanye (Shanghai, China). Biochanin A, (+)-epicatechin, and Isovitexin were all obtained from Dalian Meilun Biotechnology Co., Ltd. (Liaoning, China). Liquiritigenin, Formononetin, Apigenin, Glycitein, Taxifolin, Dihydromyricetin, Vitexin, Genistin, Glycitin, Astragalin, Quercitrin, Cynaroside, and Daidzin were all obtained from Chengdu Refensi Biotechnology Co., Ltd. (Sichuan, China).
2.2. Plant Material and Preparation of Extracts [52,53]
The leaves and shoots of P. amarus were collected in the summer morning of April 2023 in Yibin City, Sichuan Province, China, with 12 samples taken from ten-year-old plants of the same species. Both the leaves and shoots of P. amarus reach their peak harvest in summer. These materials come from the same species. After washing the leaf and shoot samples of P. amarus, they were immediately transferred to a bake-out furnace (60 ℃). The dried materials were cut into a fine powder using a pulverizer (FW-100, Tianfeng, Shanghai, China). Then, 1 gram of these leaves and shoots was placed into a 2 mL centrifuge tube, and 600 μL of methanol was accurately added and vortexed for 60 s. Two steel balls were added to the sample, and this sample was then put into a tissue grinder and ground at 60 Hz for 1 m. This operation was repeated at least three times. Then, it was sonicated for 15 min at room temperature and centrifuged at 12,000 rpm for 5 min at 4 ℃. The supernatant was filtered through a 0.22 μm membrane, and the filtrate was added to the LC-MS bottle. Three repeats for each sample were prepared and analyzed in triplicate (technical repeats) to gain accuracy and precision (n = 9). The overall results generated were representative of two independent experiments (n = 18). A quality control (QC) material consisting of aliquots from all the samples was also prepared to monitor the stability of the samples, the instrumentation, and analyses.
2.3. UHPLC-ESI-MS/MS System [53,54]
An ACQUITY UPLC® BEH C18 column (2.1×100 mm, 1.7 μm, Waters, USA) was used, the injection volume was 5 μL, the column temperature was 40 °C, mobile phase A1 was 0.1% formic acid water, mobile phase B was methanol, and the flow rate was 0.25 mL/min. The gradient elution conditions were 0~1 min, 10% B; 1~3 min, 10%~33% B; 3~10 min, 33% B; 10~15 min, 33%~50% B; 15~20 min, 50%~90% B; 20~21 min, 90% B; 21~22 min, 90%~10% B; and 22~25 min, 10% B.
The optimized operating parameters in negative ion mode were as follows: the electrospray ionization (ESI) source was negative ionization mode, the ion source temperature was 500 ℃, the ion source voltage was -4500 V, the collision gas was 6 psi, the curtain gas was 30 psi, and the atomizing gas and auxiliary gas were both 50 psi. Scans were performed using multiple reaction monitoring (MRM).
2.4. Data Preprocessing
First, Proteowizard software (v3.0.8789) was used to convert the obtained raw data into mzXML format (xcms input file format). Then, the XCMS package of R (v3.1.3) was used for peak identification, peak filtration, and peak alignment. The data matrix including the mass-to-charge ratio (m/z), retention time, and intensity was obtained. The precursor molecules in the positive and negative ion modes were obtained, and the data were exported to Excel for subsequent analysis.
2.5. Quality Evaluation, Quality Control, and Standardized Processing Analysis
The metabolome analysis process in this study was based on the R language MetaboAnalystR package [55].
The distribution of PC1 values at all sample points was used to evaluate whether the laboratory sample preparation and sample measurement process were in a controlled state. Sample points outside the control limits (3 standard deviations) were considered outliers.
The normalization correction was divided into three steps, including sample correction: the sample included all the features of abundance divided by the sample median; the content of matrix correction: the conversion and the log of all content values; and in-feature correction: the abundance of all samples corresponding to the feature minus the mean abundance of the feature and divided by the standard deviation of the feature abundance.
2.6. Statistical Analysis of Metabolite Content
The statistical analysis of metabolite content in this study was based on standardized corrected data and then imported into the R language MetaboAnalystR package [118] for analysis. The imported data were then subjected to basic statistical analysis of metabolite content, structural similarity analysis of flavonoid compound composition, and orthogonal partial least squares-discriminant analysis (OPLS-DA). OPLS-DA was followed by a substitution test, which was also a test of the OPLS-DA, and was also used to compare and select metabolites with clear differences, with the condition of VIP>1. In addition to the above tests, a correlation test was also required, using the Pearson method, which is a method that can detect the correlation between different groups that have the same metabolites, and a clustering heat map was constructed after the assay. Finally, differential content analysis of the flavonoid compounds between P. amarus leaves and shoots was carried out.
3. Results
3.1. Method Validation
3.1.1. Total Ion Flow Chromatogram
Figure 1.
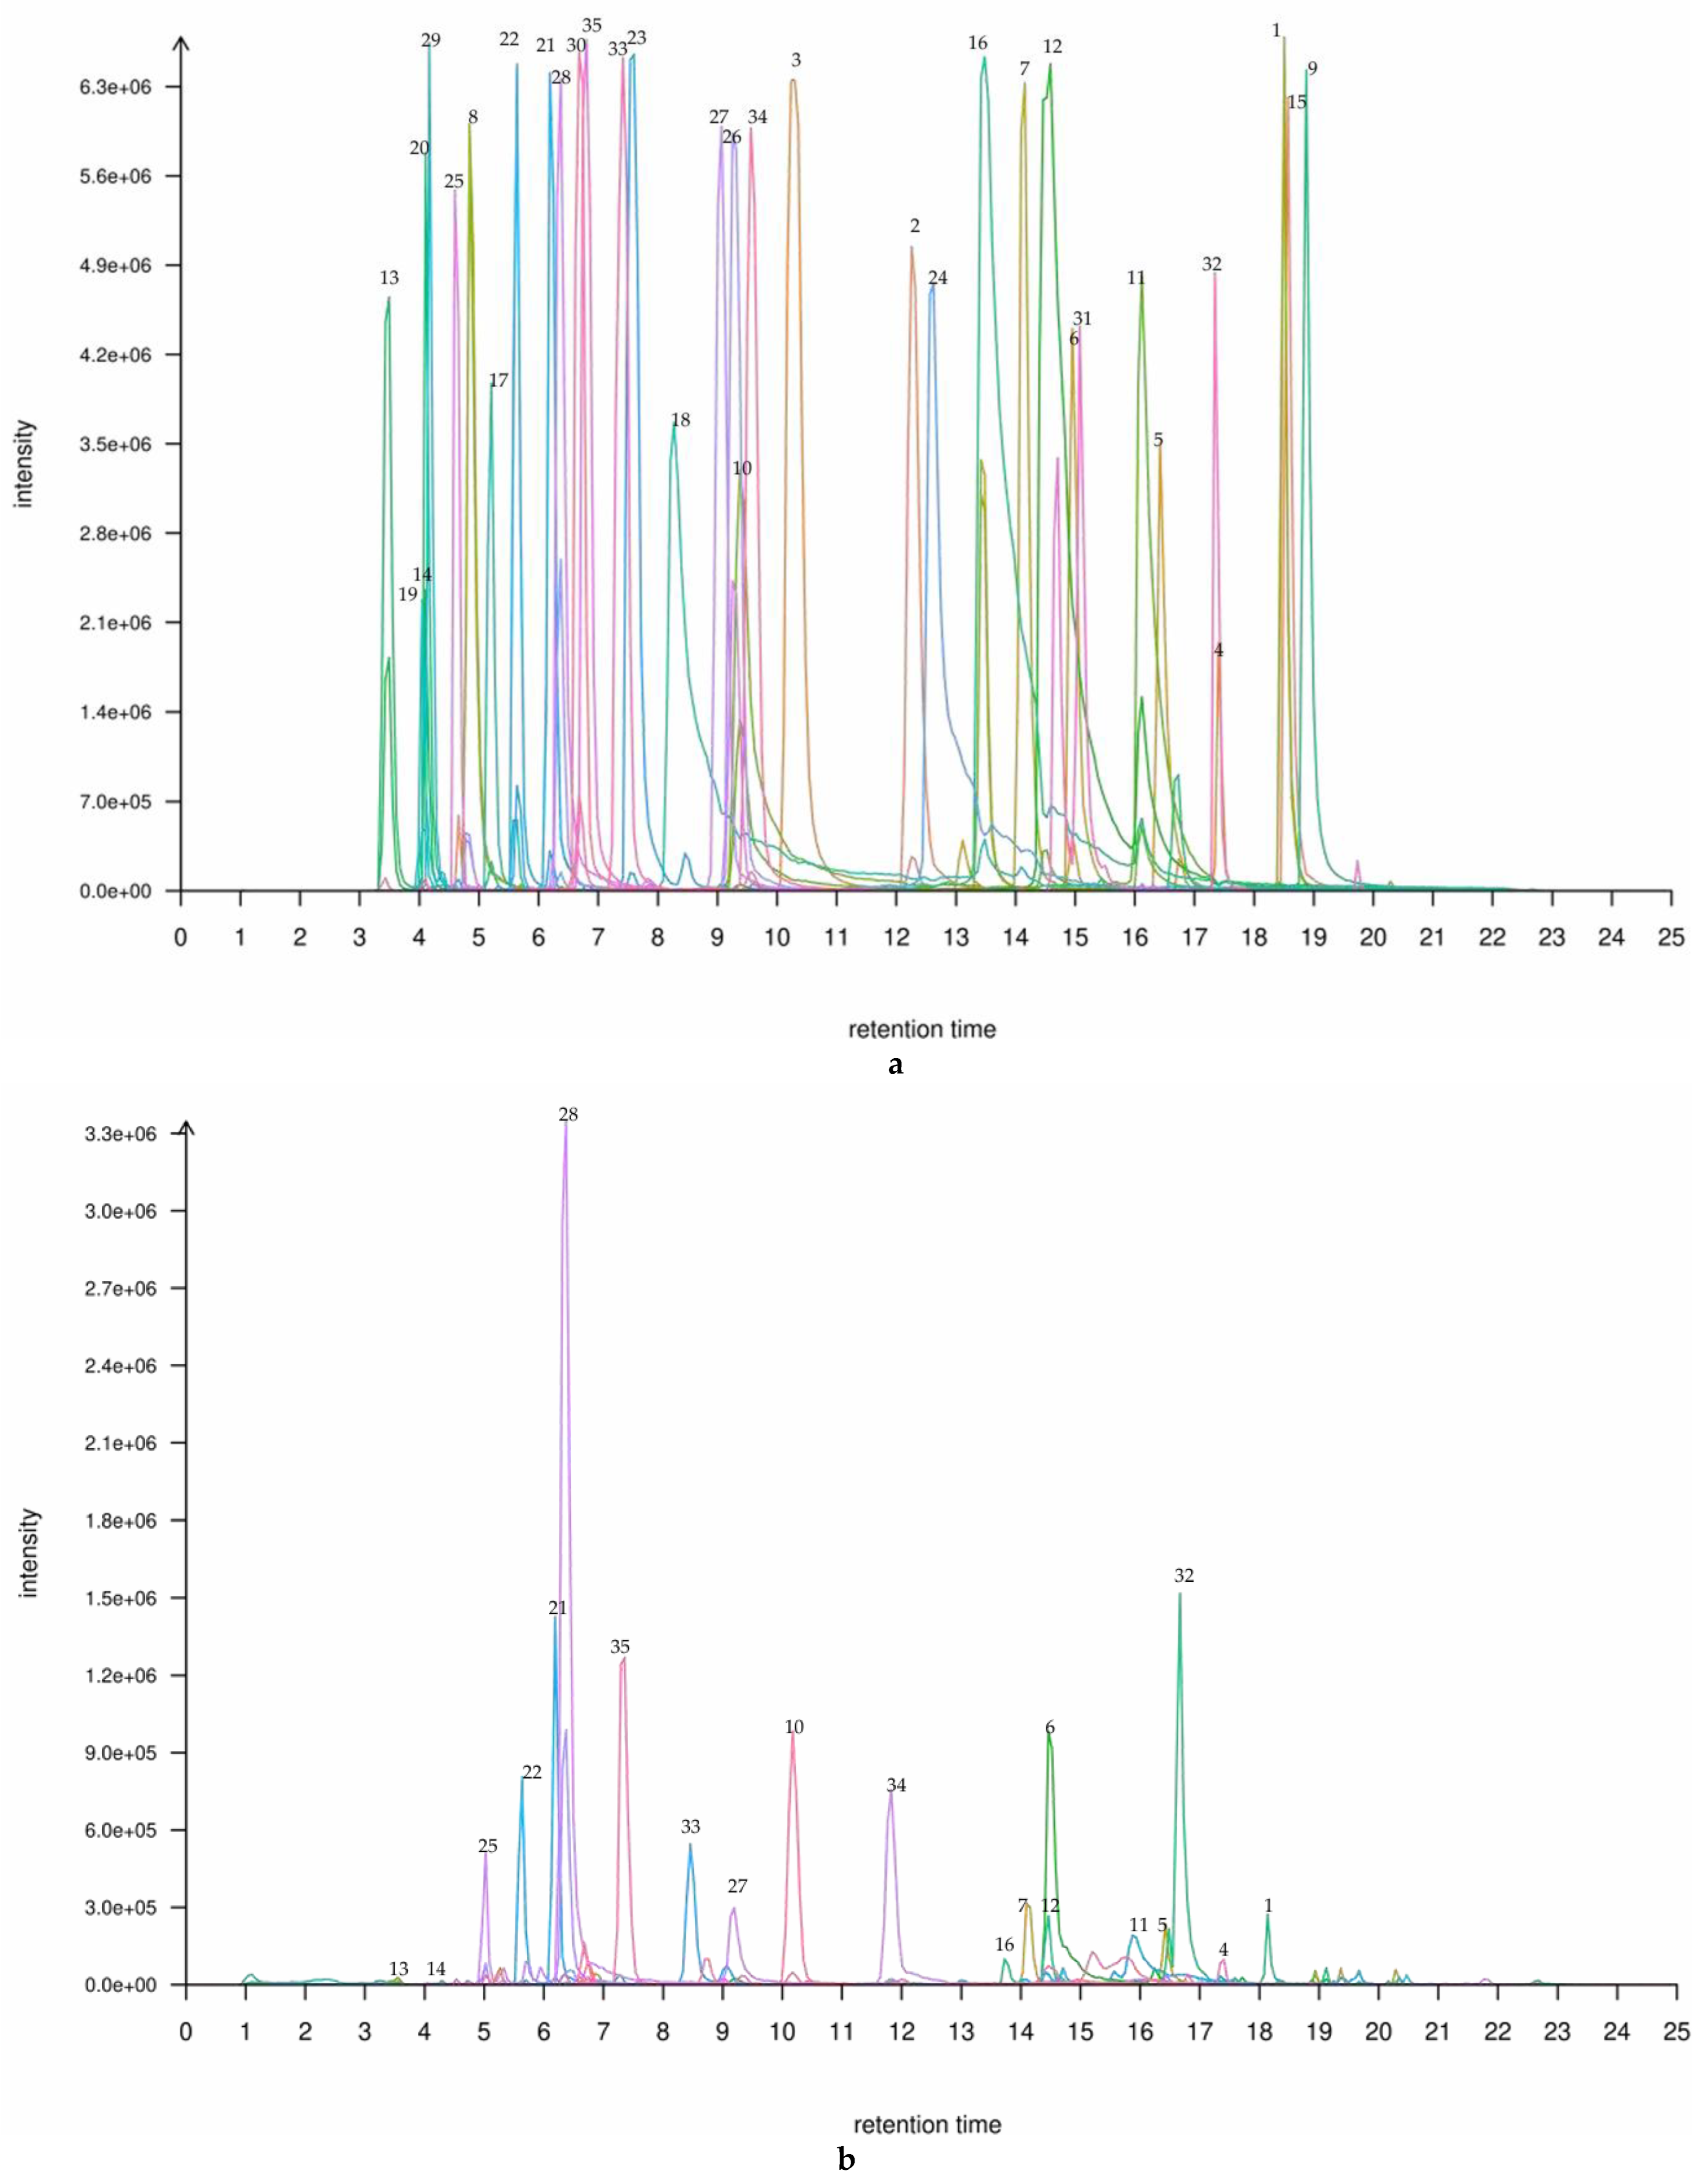
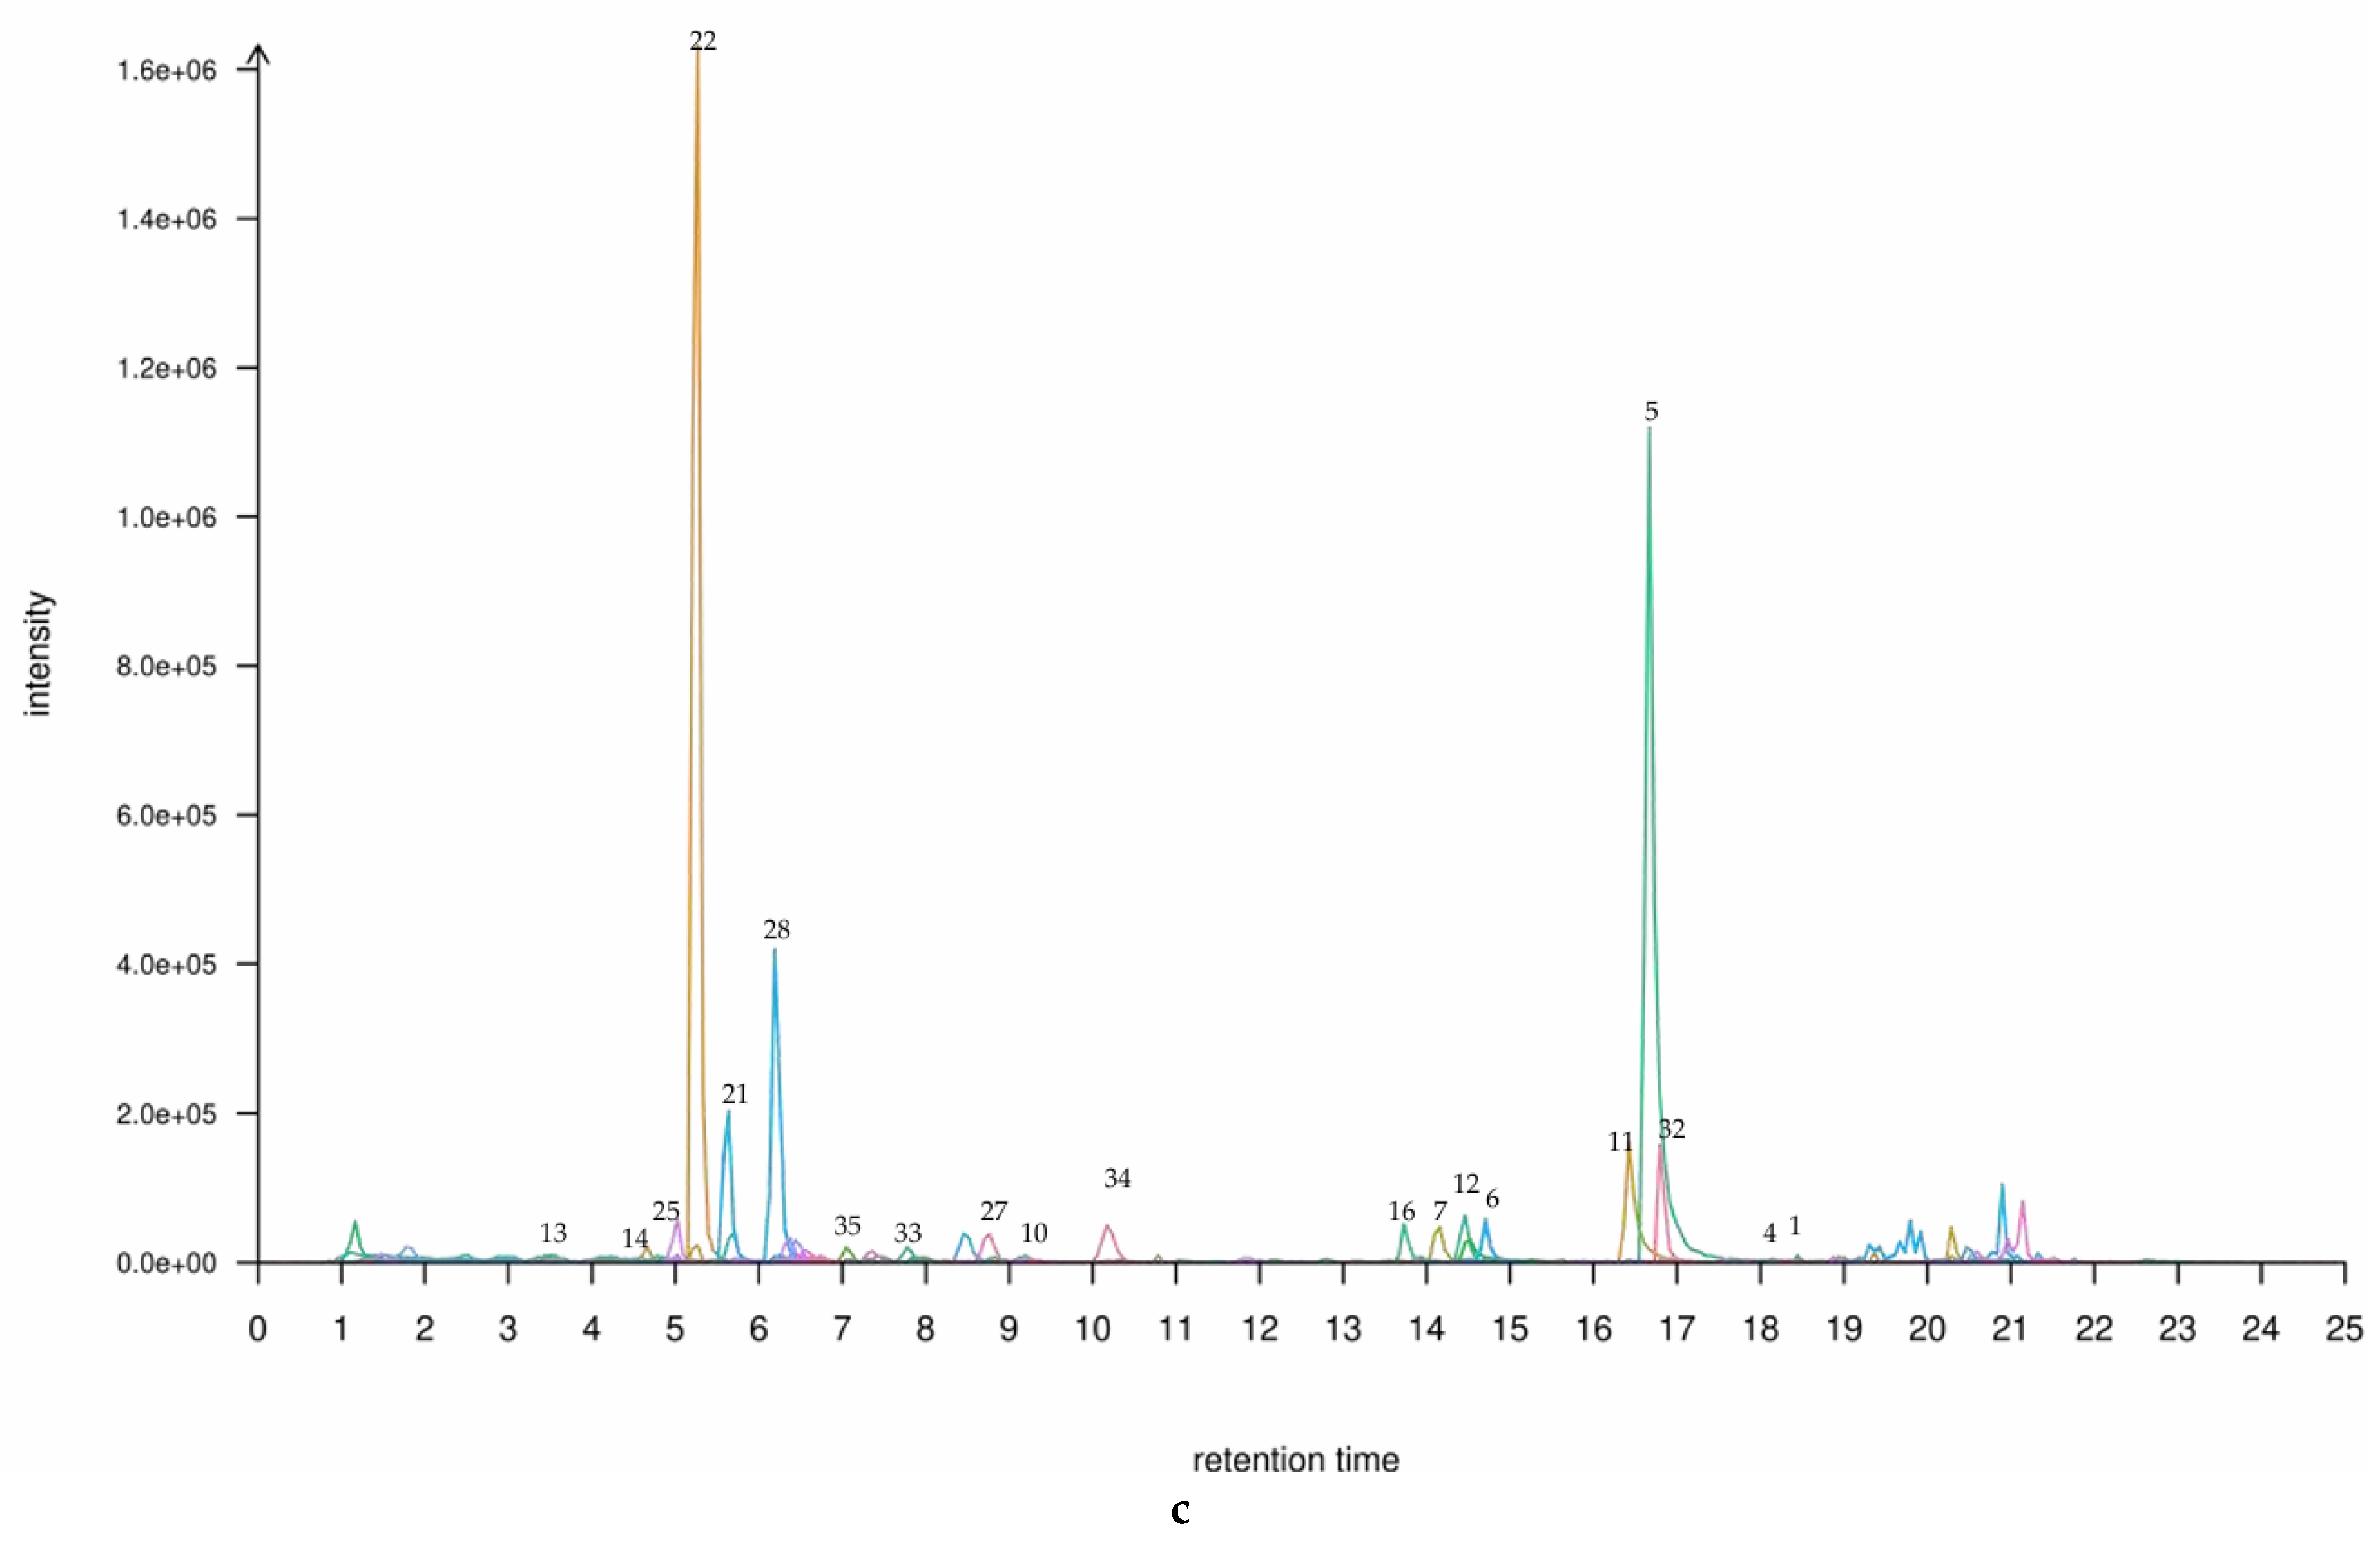
(a) A TIC plot of mixed labelling of 35 flavonoids in the leaf and shoot of P. amarus. (b) A TIC plot of 35 flavonoid compounds in the (b) leaf and (c) shoot of P. amarus. The numbered items are the 20 main flavonoids in the leaf and shoot, respectively. The flavonoid corresponding to each peak can be found in the Supplementary Materials. * ‘1’ is Chrysin, ’2’ is Daidzein, ‘3’ is Liquiritigenin, ‘4’ is Formononetin, ‘5’ is Apigenin, ‘6’ is Genistein, ‘7’ is Naringenin, ‘8’ is Glycitein, ‘9’ is Biochanin A, ‘10’ is Fisetin, ‘11’ is Kaempferol, ‘12’ is Luteolin, ‘13’ is Catechin, ‘14’ is L-Epicatechin, ‘15’ is Kaempferide, ‘16’ is Quercetin, ‘17’ is Taxifolin, ‘18’ is Myricetin, ‘19’ is Dihydromyricetin, ‘20’ is Puerarin, ‘21’ is Isovitexin, ‘22’ is Vitexin, ‘23’ is Genistin, ‘24’ is Baicalin, ‘25’ is Glycitin, ‘26’ is Astragalin, ‘27’ is Quercitrin, ‘28’ is Cynaroside, ‘29’ is Daidzin, ‘30’ is Quercetin 3-glucoside, ‘31’ is Silybin,’32’ is leariin, ‘33’ is Naringin, ‘34’ is Diosmin, and ‘35’ is Rutin.
Figure 1.
(a) A TIC plot of mixed labelling of 35 flavonoids in the leaf and shoot of P. amarus. (b) A TIC plot of 35 flavonoid compounds in the (b) leaf and (c) shoot of P. amarus. The numbered items are the 20 main flavonoids in the leaf and shoot, respectively. The flavonoid corresponding to each peak can be found in the Supplementary Materials. * ‘1’ is Chrysin, ’2’ is Daidzein, ‘3’ is Liquiritigenin, ‘4’ is Formononetin, ‘5’ is Apigenin, ‘6’ is Genistein, ‘7’ is Naringenin, ‘8’ is Glycitein, ‘9’ is Biochanin A, ‘10’ is Fisetin, ‘11’ is Kaempferol, ‘12’ is Luteolin, ‘13’ is Catechin, ‘14’ is L-Epicatechin, ‘15’ is Kaempferide, ‘16’ is Quercetin, ‘17’ is Taxifolin, ‘18’ is Myricetin, ‘19’ is Dihydromyricetin, ‘20’ is Puerarin, ‘21’ is Isovitexin, ‘22’ is Vitexin, ‘23’ is Genistin, ‘24’ is Baicalin, ‘25’ is Glycitin, ‘26’ is Astragalin, ‘27’ is Quercitrin, ‘28’ is Cynaroside, ‘29’ is Daidzin, ‘30’ is Quercetin 3-glucoside, ‘31’ is Silybin,’32’ is leariin, ‘33’ is Naringin, ‘34’ is Diosmin, and ‘35’ is Rutin.
3.1.2. Standard Curve and Limit of Quantification
Each working standard solution was tested separately, the linear range was investigated, and the standard curve was plotted. The linear regression equations obtained for each substance are shown in Table 1, and the correlation coefficients were all greater than 0.99.
3.2. Results and Analyses of Quality Assessment (QA) and Quality Control (QC)
3.2.1. QA Results and Analyses
In this study, unsupervised principal component analysis (PCA) was used to assess the quality of data from six P. amarus leaves and six P. amarus shoots (Figure 2). Calculations were made using the Hotelling T2 multivariate test, followed by ellipse plots of 95% confidence intervals. If the points representing the samples fall outside the ellipse plot, the data are poor-quality and cannot be used for subsequent metabolomics analyses. As shown in the figure, the data from the samples in this study can be used for subsequent analyses.
3.2.2. QC Results and Analyses
Immediately after quality assessment, quality control was performed. The relative standard deviation (RSD) is usually used to test the precision of the data and the accuracy of the instrument. If the RSD value is less than or equal to 15%, it proves that the method has good stability as well as reproducibility and the data obtained are reliable. As shown in Table 2, the stability of each type of flavonoid compounds was less than 15%, indicating that the method based on LC-MS/MS for the determination of 35 flavonoid compounds in the leaves and shoots of bitter bamboo was stable and reliable, and the data were reliable and could be used for subsequent analysis.
3.2.3. Standardized Results and Analysis
In the process of flavonoid determination, the content of flavonoid compounds detected in the 12 leaf and shoot samples of P. amarus and P. amarus may vary greatly, and the importance of metabolites with a high mean and standard deviation will tend to be higher than that of metabolites with a low mean and standard deviation; therefore, in order to make all metabolites have the same mean and standard deviation and to allow for subsequent PCA, OPLS-DA, and other analyses, the dry weight content of the flavonoid compounds in the 12 samples was standardized and corrected, with the units of measurement of μg/g (Figure 3). It can be seen from the figure that the flavonoid compound contents were at one level after standardization correction.
The leaves and shoots of P. amarus were collected in the summer morning of April 2023 in Yibin City, Sichuan Province, China, with 12 samples taken from ten-year-old plants of the same species. "Concentration" refers to the non-standardized data, while "Normalized concentration" refers to the standardized data. The distribution of the content is shown using a box plot, which from left to right corresponds to outliers, minima, lower quartiles, medians, upper quartiles, maxima, and outliers. The distributions before and after standardization are shown on the left and right, respectively. The principle of data standardization starts with the null hypothesis, assuming no difference between the two groups. The samples from both groups are then combined, and resampling is performed without replacement to redistribute them into two new groups. The test statistic is calculated for each resampling iteration, and this process is repeated to generate the permutation distribution. Statistical inference is then conducted based on this distribution.
3.2.4. Identification and Analysis of Flavonoids in P. amarus Leaves and Shoots
Figure 4 with Supplementary Material 1 shows Chrysin, Formononetin, Fisetin, Genistein, Kaempferide, Diosmin, Quercetin, Quercetin 3-glucoside, L-Epicatechin, Catechin, Naringenin, Apigenin, Rutin, Glycitin, Icariin, Vitexin, Luteolin, Isovitexin, Naringin, and Cynaroside. Cynaroside is the most abundant in P. amarus leaves, while Isovitexin is the most abundant in P. amarus shoots, and there are more flavonoids in the leaves than shoots of P. amarus, including Naringenin, Luteolin, Isovitexin, Vitexin, Cynaroside, Naringin, Rutin, and Icariin. The flavonoids that are contained in the shoots but not the leaves of P. amarus include Catechin and Glycitin, among which there is more L-Epicatechin than that in the leaves.
The stacked percentage barchart compares the proportion of each category's value relative to the total. This type of chart displays data in two-dimensional vertical stacked rectangles, where each segment represents a percentage of the whole. A 100% stacked column chart illustrates the relative percentage contribution of each category to the total. It presents values as vertically stacked rectangles, with each segment scaled to reflect its share of the aggregate. The horizontal coordinates represent the samples, sorted according to the order of grouping, and the different grouped samples are marked with different colours. Vertical coordinates represent the percentage content of the individual flavonoid compounds, and the bar order corresponding to the flavonoid compounds from the top corresponds to the legend to the right. The average flavonoid contents in the leaves and shoots of P. amarus are 190.07 and 22.30 μg/g, respectively.
3.2.5. Structural Similarity Analysis of Flavonoid Compositions in P. amarus Leaves and Shoots
In order to study the similarity in flavonoid structures in P. amarus leaves and shoots, we performed cluster analysis based on the content of flavonoids in the samples, which can help us find the structural differences in flavonoids between the two kinds. If the samples of different subgroups cluster to different positions, the compositional structure of flavonoids between subgroups are more different. As shown in Figure 5, we selected 20 flavonoid compounds with high content in P. amarus leaves and shoots for heat map clustering. The clustering results showed that these 20 flavonoid compounds were divided into two branches, which indicated that the structural differences of these 20 flavonoid compounds between subgroups were large.
The vertical and horizontal axes represent the flavonoid compounds and the samples, respectively, including grouping information. The clustering tree on the left shows the similarity clustering of flavonoid compounds across the samples, the heatmap in the middle represents the content of flavonoid compounds, and the scale on the right shows the relationship between the colour and the content of flavonoid compounds. Positive values indicate positive correlations, negative values represent negative correlations, and darker colours signify stronger correlations. The clustering results indicate that these 20 flavonoid compounds are divided into two major groups. This is likely related to metabolic pathways, as shown in the figure below.
From the two metabolic pathway diagrams, it can be seen that there are differences in the metabolic pathways between the two groups. Formononetin, L-Epicatechin, Glycitin, and Catechin are primarily metabolized through the Cinnamoyl-CoA pathway, while the other group of flavonoids mainly undergoes reactions around Narigenin. co6562, c00540, etc., represent the codes in the KEGG database.
3.2.6. Differential Analysis of Flavonoids in P. amarus leaves and Shoots
We used Orthogonal Partial Least Squares-Discriminant Analysis (OPLS-DA) to predict the presence of significantly different metabolites of flavonoids in P. amarus leaves and shoots. OPLS-DA is a regression modelling method from multiple dependent variables to multiple independent variables. It is a supervised discriminant analysis statistical method and can be used to screen for differential metabolites between different groups in metabolomics data analysis. Through OPLS-DA, each metabolite can obtain a VIP value, and the larger the VIP value, the greater the contribution of the substance to distinguish between the two groups, so we usually take the VIP value as one of the important indicators when selecting differential metabolites. OPLS-DA has the advantage of using only one component of the metabolomic data (the factor component) to predict the grouping, while all the other components are used to describe the (unrelated) variance that is orthogonal to this component (the predictor component). There are two principal components in the OPLS-DA model, R2Y = 0.999 and Q2 = 0.731. As shown in Figure 6, the flavonoid compounds in both P. amarus leaves and shoots are concentrated in the 95% confidence elliptical region, so there are significant differences between the two different parts of P. amarus.
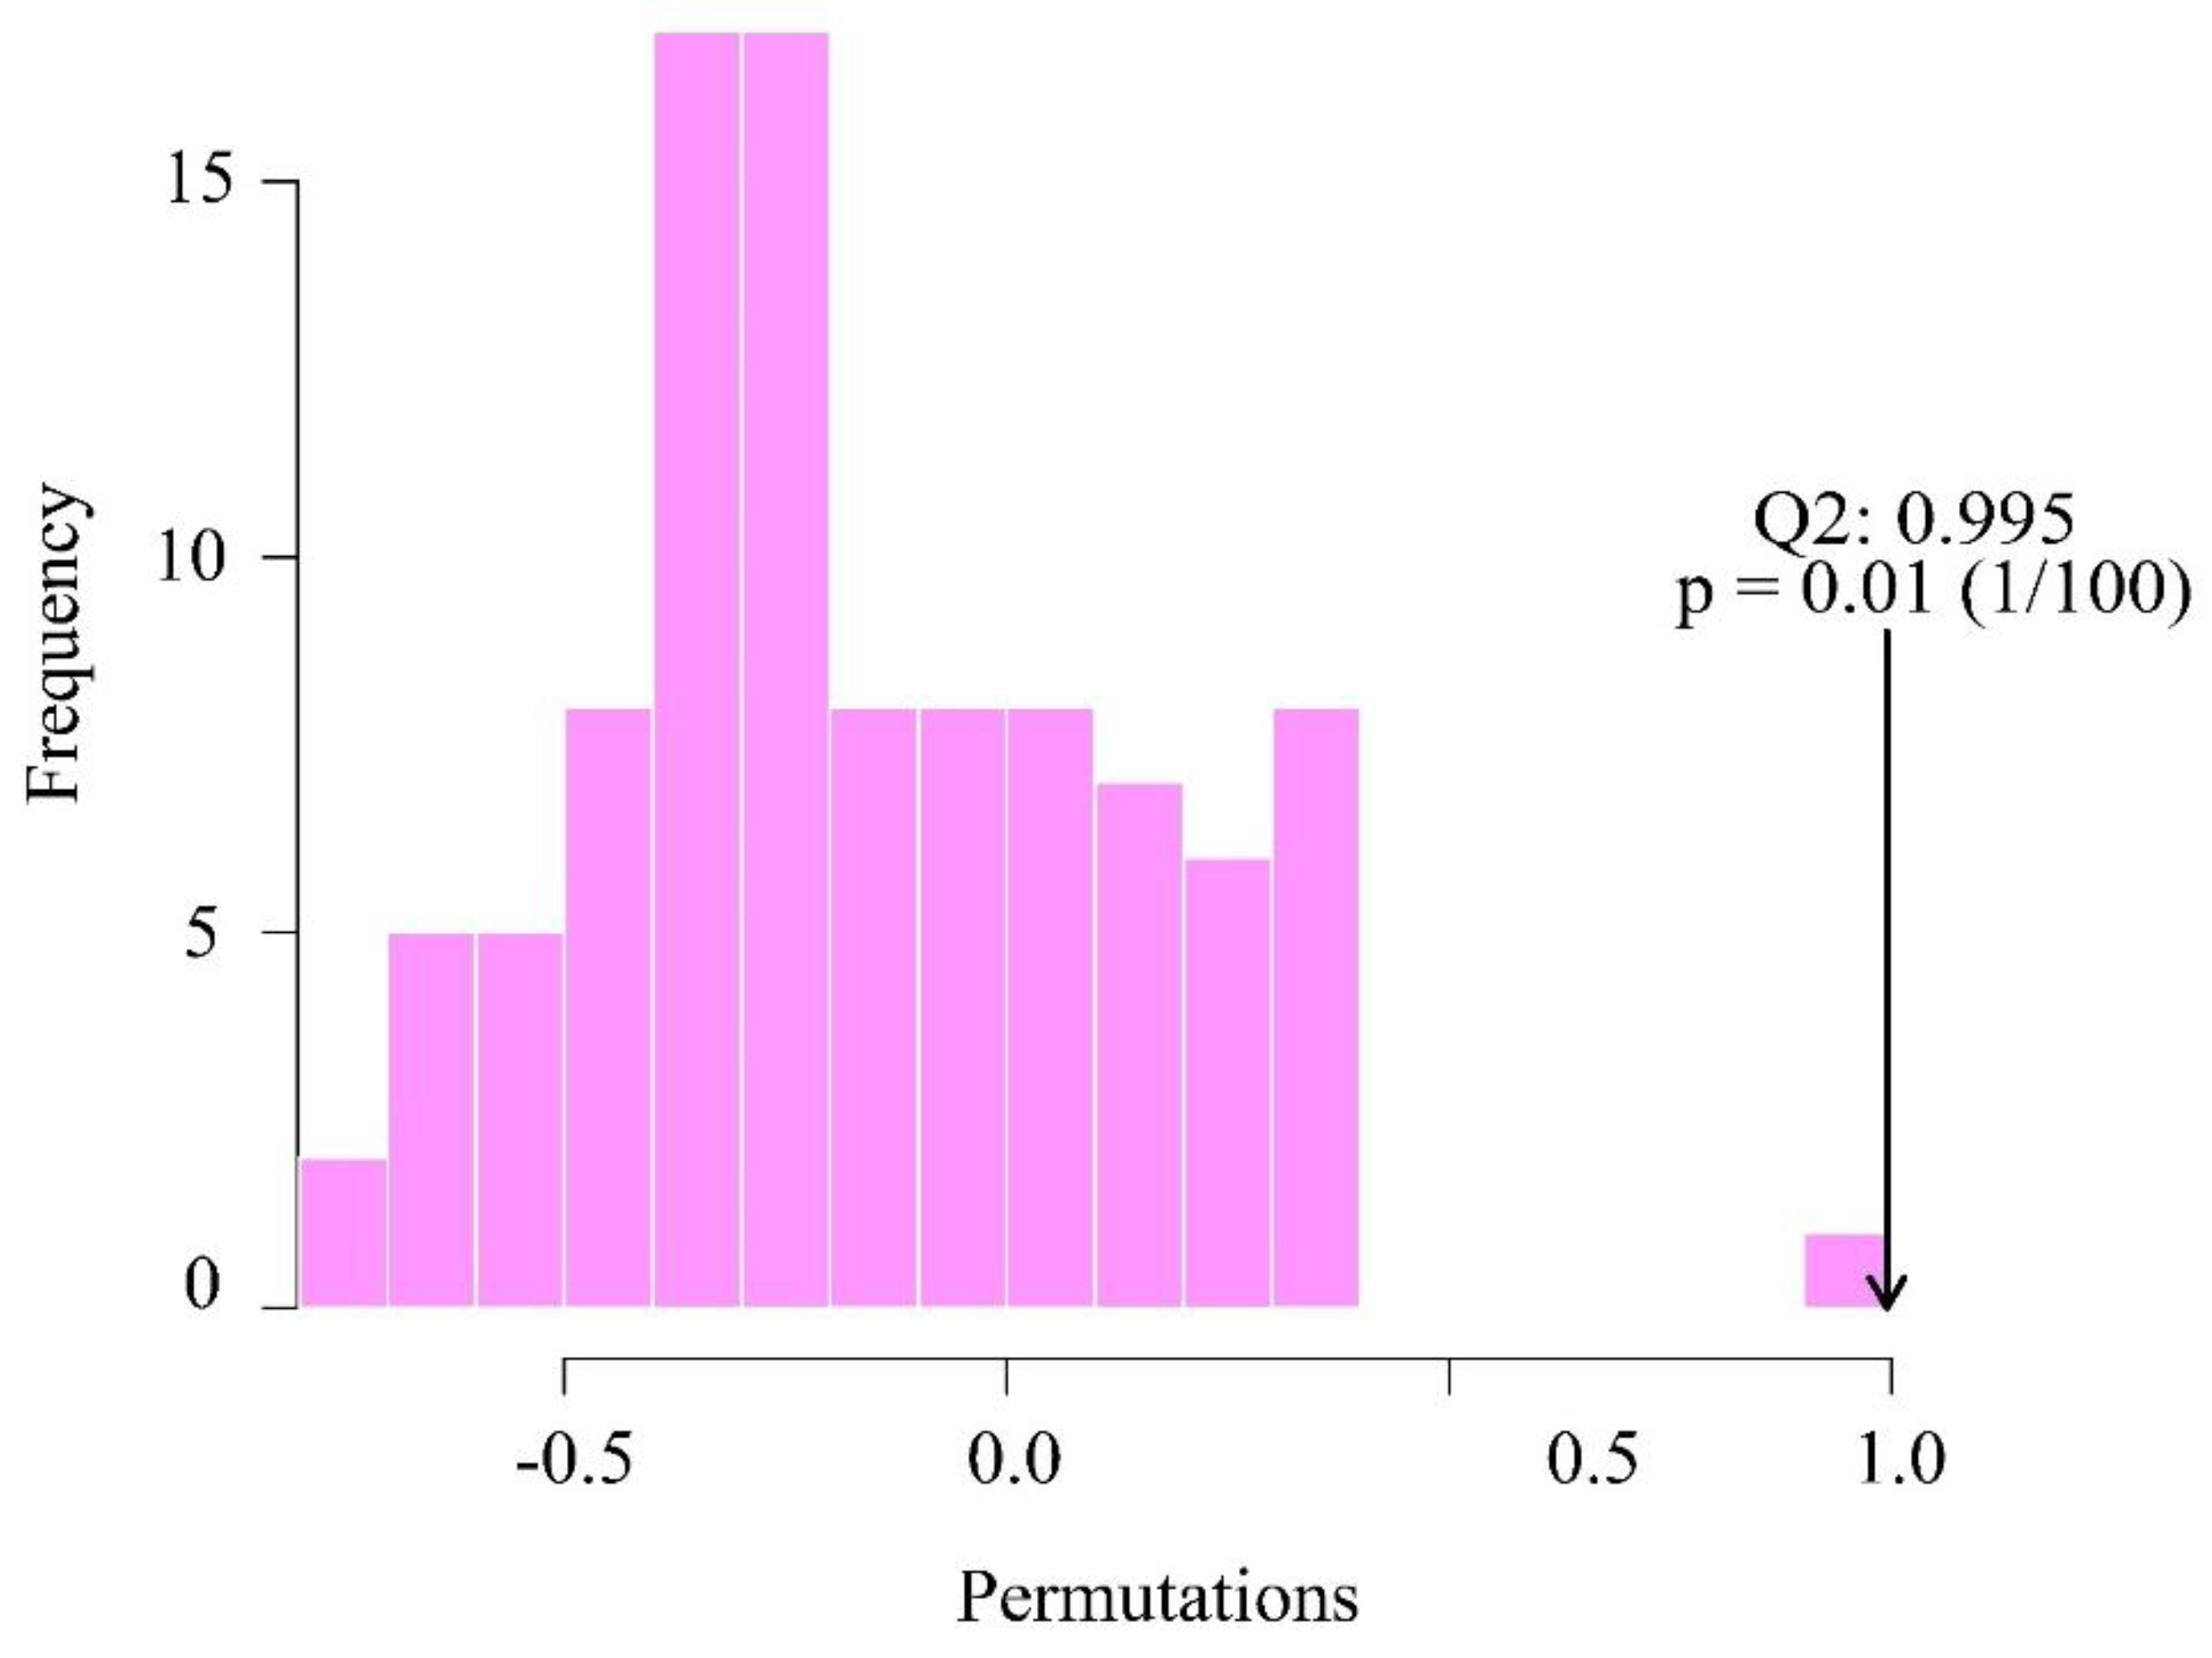
In the OPLS-DA's replacement test, we use Q2 (cum) as the test statistic and use the replacement method to find the random distribution of Q2 (cum). As shown in Figure 7, the position indicated by the arrow is located on the right side, indicating that it is significant and the predictive power of the model is significant; in addition, flavonoid compounds are significantly different between the P. amarus leaves and shoots.
Figure 9.
Test statistic (Q2) distribution and p value of OPLS-DA replacement test. *The distribution is the replacement stochastic distribution of Q2, and the arrow points to the actual observed model Q2.
Figure 9.
Test statistic (Q2) distribution and p value of OPLS-DA replacement test. *The distribution is the replacement stochastic distribution of Q2, and the arrow points to the actual observed model Q2.
3.2.7. Screening of Characterized Flavonoids in P. amarus leaves and Shoots
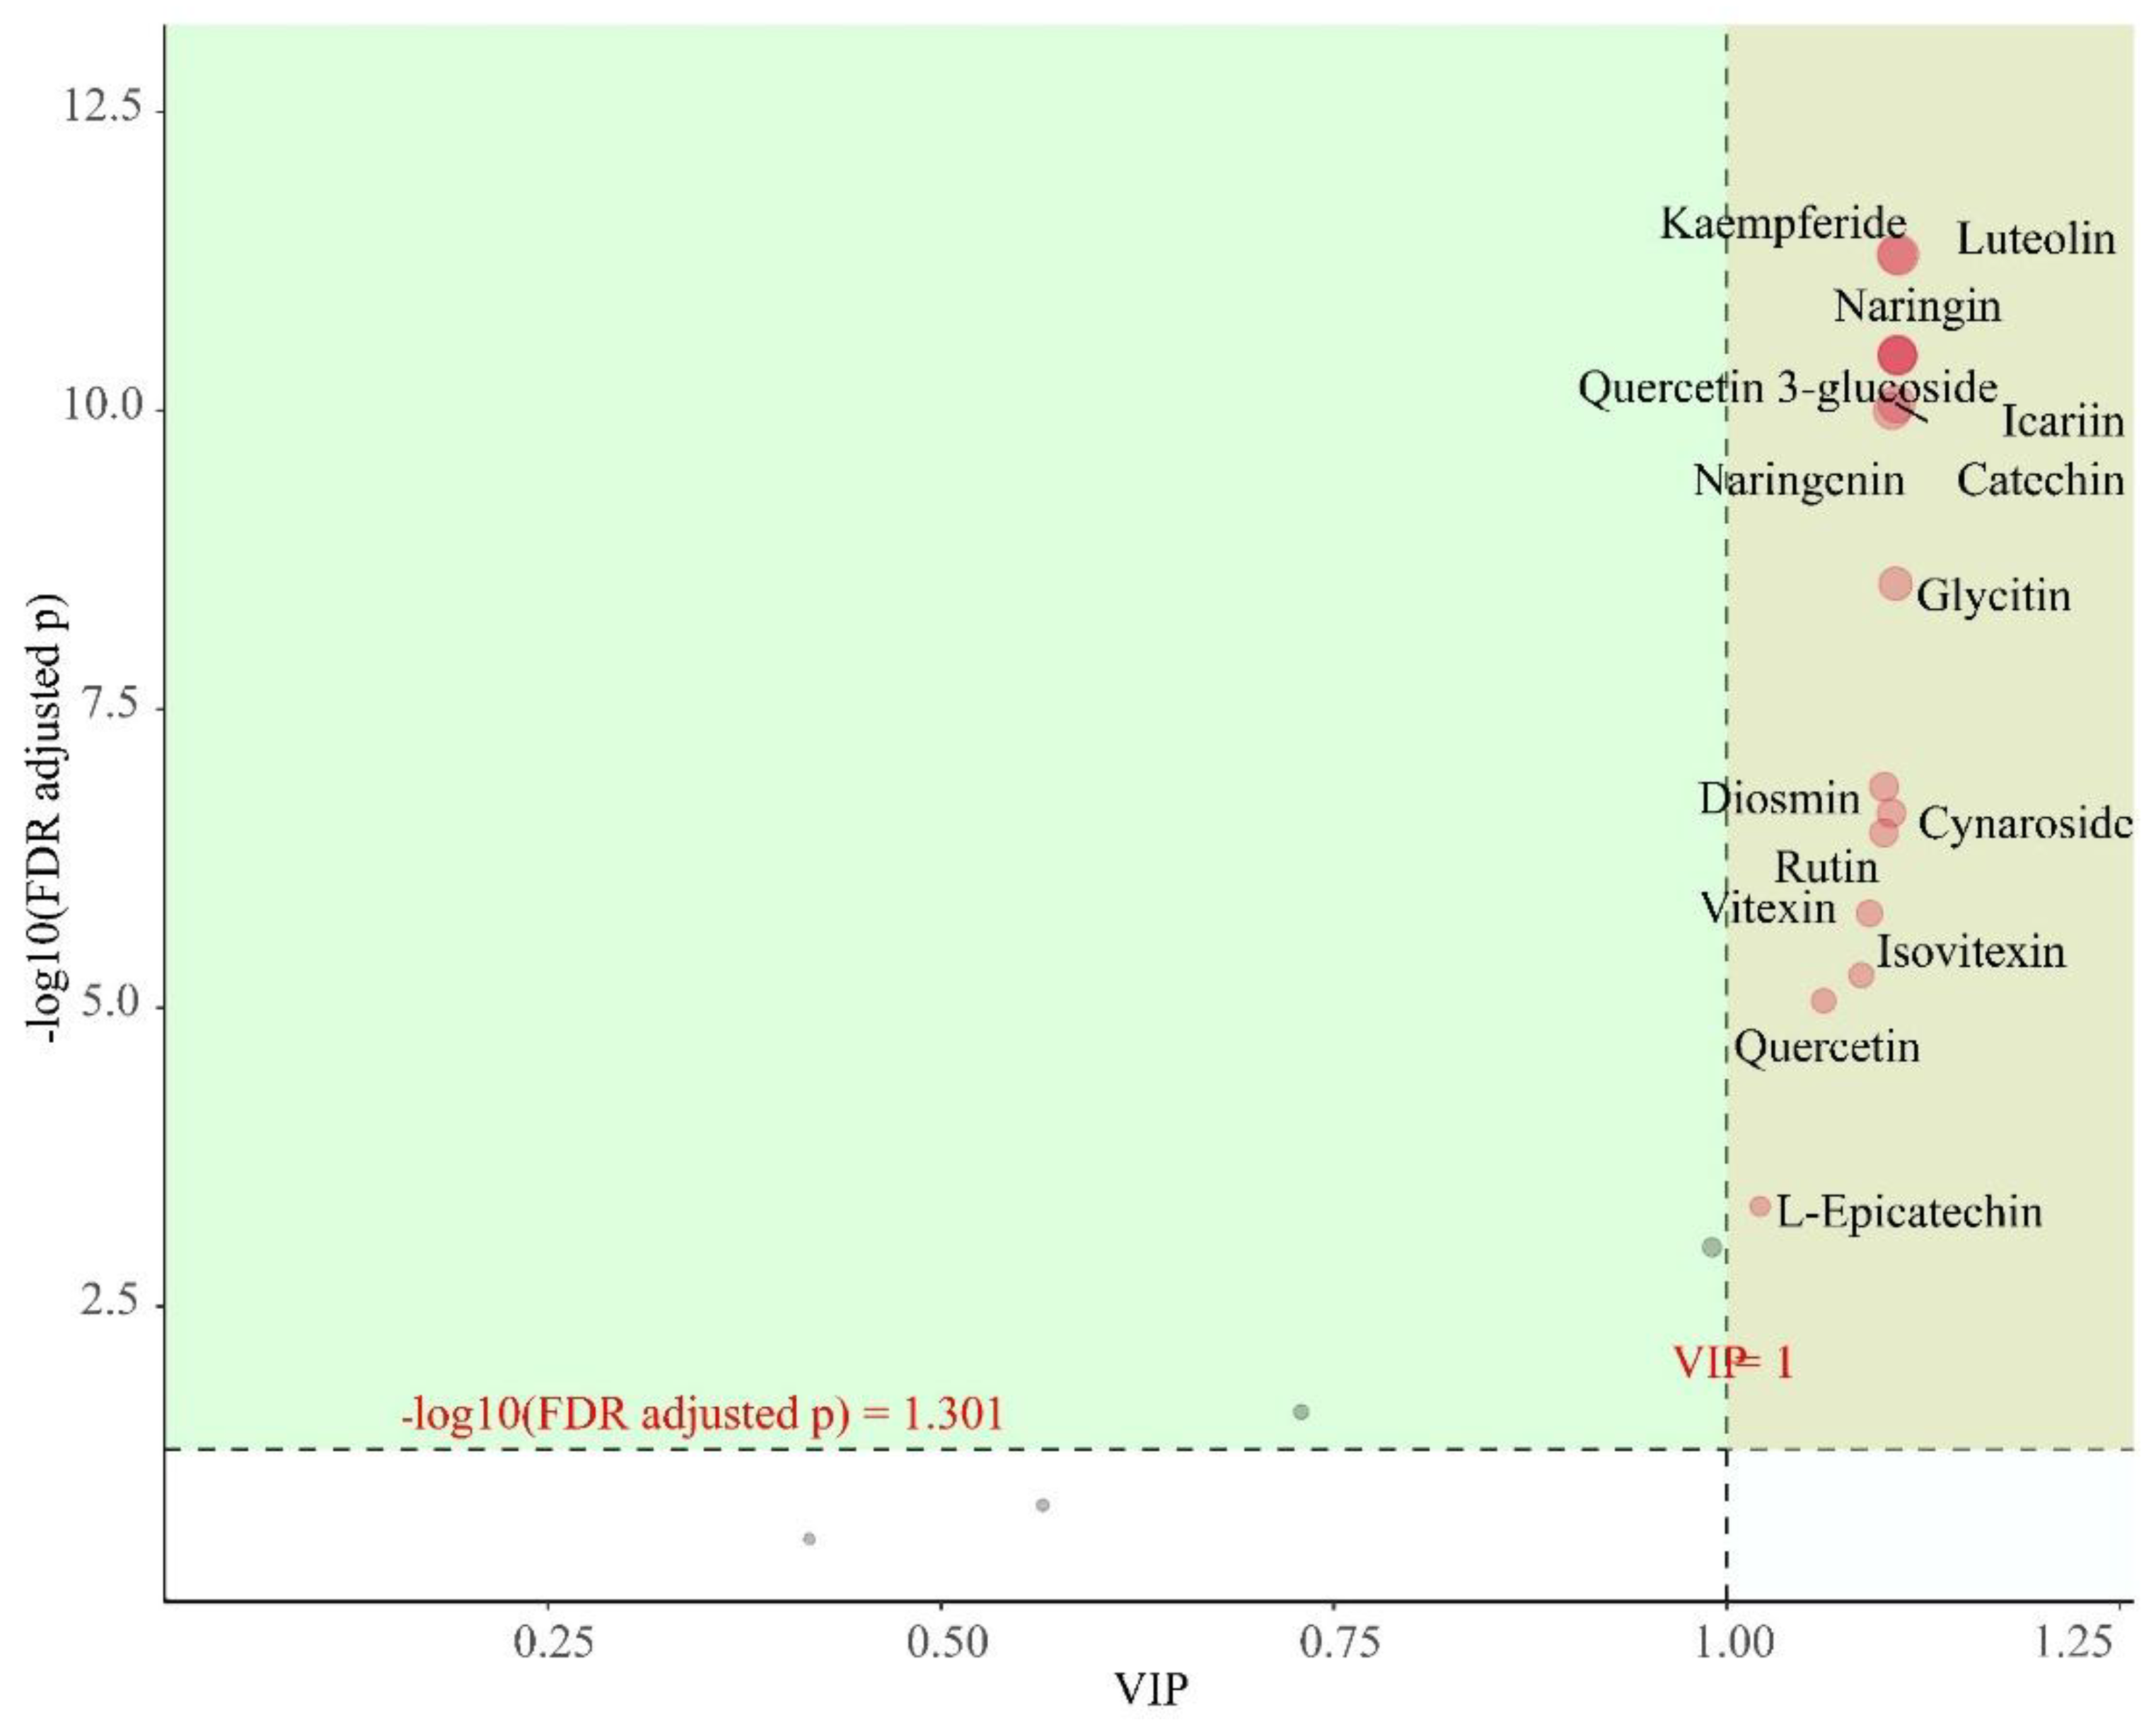
As shown in Figure 8, when the screening conditions were VIP > 1 and p < 0.05, a total of 15 differential flavonoids were screened in the 12 samples, including Kaempferide, Diosmin, Quercetin, Quercitrin 3-glucoside, L-Epicatechin, Catechin, Naringenin, Rutin, Glycitin, Icariin, Vitexin, Isovitexin, Luteolin, Naringin, and Cynaroside. These flavonoids have significant differences between subgroups and are also characteristic flavonoids that deserve our attention.
Figure 10.
Importance diagram of flavonoids for OPLS-DA. * Each point represents a flavonoid compound; the horizontal coordinate is the value of VIP and the vertical coordinate is the FDR-corrected p-value (log10 transformation).
Figure 10.
Importance diagram of flavonoids for OPLS-DA. * Each point represents a flavonoid compound; the horizontal coordinate is the value of VIP and the vertical coordinate is the FDR-corrected p-value (log10 transformation).
3.2.8. Correlation Analysis of flavonoids in P. amarus Leaves and Shoots
The correlations of the top 20 flavonoids were further calculated, as shown in Figure 11, where a darker red colour indicates a stronger positive correlation and a darker green colour indicates a stronger negative correlation. According to the correlation clustering heat map, it can be seen that the 20 flavonoids are mainly classified into two large groups: Formononetin, L-Epicatechin, Glycitin, and Catechin represent one group, and Chrysin, Fisetin, Genistin, Kaempferide, Diosmin, Quercitrin 3-glucoside, Quercetin, Naringenin, Apigenin, Rutin, Icariin, Vitexin, Isovitexin, Quercitrin, Cynaroside, and Luteolin represent the other. These two groups of flavonoid compounds are negatively correlated between groups and positively correlated within groups.
The correlation coefficients are indicated by colour, with positive correlations showing red and negative correlations showing green. Positive values indicate positive correlations, negative values represent negative correlations, and darker colours signify stronger correlations. The strength of the correlation is shown on the scale on the right. The correlation cluster diagram analysis shows that the 20 flavonoids are mainly divided into two groups. Formononetin, L-Epicatechin, Glycitin, and Catechin are in the same branch, and the other 16 flavonoids are in the other branch, so they are divided into two groups. Formononetin, L-Epicatechin, Glycitin, and Catechin are in one group, while Chrysin, Fisetin, Genistin, Kaempferide, Diosmin, Quercitrin 3-glucoside, Quercetin, Naringenin, Apigenin, Rutin, Icariin, Vitexin, Isovitexin, Quercitrin, Cynaroside, and Luteolin are divided into another group.
4. Discussion
Flavonoids are important active components as well as secondary metabolites in the leaves and shoots of P. amarus, and modern pharmacological studies have shown that flavonoids are one of the important biologically active components with a variety of beneficial functions for our human health such as preventing cardiovascular and cerebral vascular diseases, suppressing cough, inhibiting fungi, protecting the liver, and also acting as antioxidants, thereby reducing and inhibiting free radicals [56]. A large number of studies have shown that flavonoids are widely present in the roots, stems, leaves, and flowers of plants, such as Hemerocallis citrina [51], Platostoma palustre [57], and Prunella vulgaris [58]. Compared to Xiao Yisong et al. [9], Guo Jing et al. [10], Wang Hongbing et al. [11], Wei Qi et al. [12], and Li et al. [13], who studied the flavonoids of P. amarus, our study found 12 new flavonoids, including Chrysin, Formononetin, Fisetin, Genistein, Diosmin, Quercitrin 3-glucoside, L-Epicatechin, Catechin, Naringenin, Glycitin, Icariin, and Naringin. Compared with the flavonoids in the close relatives of P. amarus, the flavonoids they both contained were Quercetin, Luteolin, Rutin, Apigenin, Vitexin, and Isovitexin. Orientine and Isoorientin were common in the close relatives of P. amarus, but P. amarus was not found to contain these two common flavonoids in this study. Kaempferol and kaempferol 3-O-α-L-rhamnopyranosyl-7-O-α-L-rhamnopyranoside were contained in the close relatives of P. amarus, and Kaempferide were detected in P. amarus.
In this study, when targeted metabolomics analyses of the leaves and shoots of P. amarus were performed with good reproducibility of the three samples from each group, flavonoid metabolites in the leaves and shoots of P. amarus were clustered into two different clusters, and fewer flavonoid metabolites were involved in the shoots than in the leaves of P. amarus; these missing flavonoids may be specific to P. amarus leaves [51]. In another study on rice, the accumulation of most flavonoids in the roots was the lowest among the different tissues [59], which is similar to the results of our study. In this study, the different flavonoid contents in different parts of the plant may be related to the pathway of synthesis between flavonoids, and the pathway also affects the correlation between flavonoids. The main influences on the regulation of flavonoid synthesis in plants are light [37], temperature [38], water [39], salt stress [39], UV radiation [40], other environmental factors and biological factors [39], and regulatory genes [39]. These factors up- or downregulate the synthesis of flavonoid compounds, thus affecting the inconsistency of flavonoid content and species between different parts.
In this study, according to the difference in the content of different parts, Cynaroside was the most abundant in P. amarus leaves, while Isovitexin was the most abundant in P. amarus shoots, and the flavonoids inside the P. amarus leaves included Naringenin, Luteolin, Isovitexin, Vitexin, Cynaroside, Naringin, Rutin, and Icariin, which represent more varieties than in the P. amarus shoots. However, P. amarus shoots contain Glycitin and Catechin that are not found in P. amarus leaves, of which L-Epicatechin is more abundant than that in P. amarus leaves. Sun et al. [60] used hyperlipidemic rats to conduct experiments and found that Cynaroside and Luteolin had the function of improving blood lipids and hepatic steatosis. Tao et al. [61] found that Isovitexin and Vitexin could promote the development of Caenorhabditis elegans by inhibiting the insulin receptor, and the results showed that the two flavonoid compounds could prolong the lifespan and improve the health of Caenorhabditis elegans, suggesting that Isovitexin and Vitexin may have potential anti-ageing and health-promoting effects. Stabrauskiene et al. [62] investigated the mechanism of action of Naringin and Naringenin and their potential anticancer activities. The experimental results showed that Naringin and Naringenin could inhibit the growth and spread of tumour cells by regulating multiple signalling pathways, and had anticancer potential, with this conclusion suggesting that these two compounds might become important candidates for future anticancer drug development and were worthy of further in-depth study of their application prospects in cancer therapy. A large number of studies have found that Rutin can contribute very importantly to human health through a variety of pathways, such as resisting cancer for humans by directly inhibiting the proliferation of tumour cells, inducing the apoptosis of tumour cells, and inhibiting tumour cell invasion and metastasis. Rutin also regulates a variety of signalling pathways, such as PI3K/Akt, MAPK, and NF-κB, which can affect the growth and survival of tumour cells [63]. Bi et al. [64] showed that Icariin has significant anti-inflammatory effects, inhibiting inflammatory responses and reducing the symptoms of inflammation-related diseases, in addition to exhibiting immunomodulatory abilities, helping balance the function of the immune system, modulating immune cell activity, and having potential therapeutic effects on autoimmune diseases. Cesar et al. [65] found that L-Epicatechin and Catechin could play an important role in the treatment of snake-venom-induced haemostatic disorders. These two flavonoid compounds have anticoagulant and anti-inflammatory effects, which can attenuate snake-venom-induced coagulation abnormality and inflammatory response, and help restore normal haemostatic function. Chen et al. [66] found that Glycitin could exert their protective effects by inhibiting the activation of the effects of NF-κB and MAPK pathways, reducing inflammatory responses and cellular damage. All these studies suggest that flavonoid compounds may play a critical and indispensable role in various parts of plants [51].
In this study, based on the screening of flavonoids from the leaves and shoots of P. amarus for characteristic metabolites, 15 characteristic metabolites such as Kaempferide, Diosmin, Quercitrin 3-glucoside, Quercetin, L-Epicatechin, Catechin, Naringenin, Rutin, Glycitin, Icariin, Vitexin, Isovitexin, Naringin, Luteolin, and Cynaroside were identified. Comparison with the results of the differences in the content of different parts of the plant showed four more flavonoid compounds such as Kaempferide, Diosmin, Quercetin, and Quercitrin 3-glucoside. Chandrababu et al. [67] found that Kaempferide showed anticancer activity against hepatocellular carcinoma in vivo and in vitro, which is potentially of therapeutic value. The results of Geshnigani et al. [68] showed that Diosmin's prophylactic application could reduce the extent of renal damage caused by gentamicin and reduce inflammation and oxidative stress in renal tissues, thereby protecting renal function. Numerous studies have shown that Quercetin plays antioxidant, anti-inflammatory, antifungal, and antibacterial roles in plants, which helps plants fight against the stress and damage of the external environment. In addition, Quercetin is involved in the regulation of physiological processes, such as growth and development, pigment synthesis, and immune response in plants [69]. Zhang Xiaomeng et al. [70] found that Quercitrin 3-glucoside can reduce the frequency and extent of diarrhea, help regulate intestinal function, reduce water loss, and improve diarrhea symptoms. All of these studies have shown the potential for diversity in the chemical or pharmacological composition of flavonoid compounds from different parts of the plant [71], and this information is very useful for the food industry, medicine, and health [51].
5. Conclusions
In our study, flavonoids were investigated in six samples of P. amarus leaves and six samples of P. amarus shoots using targeted metabolomics based on LC-MS/MS, using 35 flavonoid standards to compare flavonoids in the leaves and shoots of P. amarus, and 12 additional flavonoids were found in these leaves and shoots in comparison with previous research. Significant differences in composition and structure were observed between these flavonoids, and 15 characterized differential metabolites were screened. There were significant differences in the flavonoid contents between the two different parts of the leaves and the shoots of P. amarus, and the contents of flavonoids in the leaves were higher than those in the shoots. Moreover, less flavonoids were distributed in the shoots than in the leaf parts. Our work is the first to use targeted metabolomics to analyze the flavonoids in two different parts of P. amarus, which lays a foundation for the subsequent directional separation and identification of flavonoids in P. amarus. The correlation cluster diagram analysis shows that the 20 flavonoids are mainly divided into two groups: Catechin, L-Epicatechin, Formononetin, and Glycitin, with the others divided into another group. Therefore, through the study of the flavonoid metabolism pathway, the reasons for dividing it into two groups were analyzed, which laid a foundation for further research on flavonoid metabolism in P. amarus. Thus, this study provides a scientific basis for further research on the different uses of different parts of the plant.
References
- Jiang,Z. Bamboo and Rattan in the World. Bamboo and Rattan 2007,189.
- Shi, J.Y.; Ma, L.S.; Zhou, D.Q.; Zhou, Z.H.; Pu, Z.Y.; Yao, J.; Be Zhang, Q.X.; Jin, X.B. The history and current situation of resources and development trend of the cultivated bamboos in China. Acta Horticulturae 2014,71-78. [CrossRef]
- Wei, Q. Chemical Components and Biological Activites of Pleioblastus Nakai Leaves. Chinese Academy of Forestry 2013,43,97-103.
- Tao, H. List of famous doctors. 1986, 126.
- Li, F; Li, Q; Gao, D; Feng, C; Gao, J. Research developm ent on the iso lation and purification of natural flavonoid. Jiangsu Condiment and Subsidiary Food 2008, 25, 6.
- Serafini, M.; Peluso, I.; Raguzzini, A. Flavonoids as anti-inflammatory agents. Proceedings of the Nutrition Society 2010, 69, 273-278.
- Yi, Y.; Sun, Y.; Wang, D.; Li, X.; Wu, X.; Pan, Y.; Zhang, L. [Advances in liquid chromatography-mass spectrometry analysis of several important secondary metabolites in plant metabolomics]. Chinese Journal of Biotechnology 2022, 38, 3674–3681. [CrossRef]
- Zhao, S; Dong, J; Liu, J; Jia, Z; Yan, X; Yu, Y;Chen, Y; Li, Y; Xiao, H. Study on the Separation of Flavonoids from Astragalus membranaceus by Supercritical Fluid Chromatography. Journal of Instrumental Analysis 2021, 40, 1311-1317.
- Xiao, Y; Zhang, T; Hou, J. Liquid chromatography-mass spectrometry analysis of flavonoids in Pleioblastus amarus leaves. Journal of Ningbo University of Technology 2001, 13, 125-127+177.
- Guo, J; Wang, H; Shen, Z; Zhang, T; Yuan, X; Ding, Y. Analysis of antioxidant effective components in three kinds of bamboo leaves. Chinese Traditional Patent Medicine 2019, 41, 2688-2694.
- Wang, H; Yao, H; Gu, W; Qin, G. Chemical Constituents from the Leaves of Pleioblastus amarus (keng) keng f. Chinese Traditional and Herbal Drugs 2004, 24-25.
- Wei, Q; Yue, Y; Tang, F; Sun, J; Wang, S; Yu, J. Chemical Constituents from the Leaves of Pleioblastus amarus (keng) keng f. Natural Product Research and Development 2014, 26, 38-42.
- Li, X.; Tao, W.; Xun, H.; Yao, X.; Wang, J.; Sun, J.; Yue, Y.; Tang, F. Simultaneous Determination of Flavonoids from Bamboo Leaf Extracts Using Liquid Chromatography-Tandem Mass Spectrometry. Rev. Bras. de Farm. 2021, 31, 347–352. [CrossRef]
- Hua, M; Chen, J; Bi, W; Kong, J; Hu, Y; Li, Y; Yang, Y; Wang, J. Determination of Total Flavonoids and Vitexin, Isovitexin, Orientin, Isoorientin in Cluster Bamboo by High-performance Liquid Chromatography. Journal of West China Forestry Science 2018, 47, 86-90+95.
- Xie, J.; Lin, Y.-S.; Shi, X.-J.; Zhu, X.-Y.; Su, W.-K.; Wang, P. Mechanochemical-assisted extraction of flavonoids from bamboo (Phyllostachys edulis) leaves. Ind. Crop. Prod. 2013, 43, 276–282. [CrossRef]
- Zhou, J. Pilot scale study on extraction and purification of Phyllostachys edulis leaf flavonoid in Chishui City in Guizhou province. Guizhou University 2022, 32.
- Zhang, C. Technics on Extraction and Purification of FlavoneC-glycosides from Phyllostachys edulis Leaves. Chinese Academy of Forestry 2014, 12.
- Ding, J. Extraction and Separation of Flavonoids from Bambusa surrectaand Its Antibacterial activity. Wuhan Polytechnic University 2015, 32.
- Sun, A.D. A new natural food preservative produced from bamboo leaf flavonoids. China National Intellectual Property Administration 2009, 2.
- Sun, W; Li, X; Li, N; Meng, D. Chemicalof the extraction of bambo0constituentsleaves from Phyllostachys nigra(Lodd.ex Lindl.) Munro var.henonis (Mitf.) Stepf.ex Rendle. Journal of Shenyang Pharmaceutical University 2008, 25, 39-43.
- Zhang, Y.; Jiao, J.; Liu, C.; Wu, X.; Zhang, Y. Isolation and purification of four flavone C-glycosides from antioxidant of bamboo leaves by macroporous resin column chromatography and preparative high-performance liquid chromatography. Food Chem. 2007. [CrossRef]
- Tang, H; Zheng, W; Chen, Z. Cmponent Study on Flavonoids From Leaves of Dendrocalamus Latiflorus. Chinese Agricultural Science Bulletin Vol 2005, 114-118.
- An, R; Yuan, T; Guo, X. Quantification and Antioxidant Activity of Flavonoids in Bamboo Leaves Extract of Bambusa. Chemistry and Industry of Forest Products 2023, 43, 97-103.
- Guo, X.F.; Yue, Y.D.; Tang, F.; Wang, J.; Yao, X.; Sun, J. Simultaneous Determination of Seven Flavonoids in Dan Bamboo P hyllostachys glauca McC lure Leaf Extract and in Commercial Products by HPLC-DAD. Journal of Food Biochemistry 2013, 37, 748-757.
- Wei, Q; Yue, Y; Tang, F; Sun, J. Comparison of Flavonoids in the Leaves of Three Genera of Bamboo. Scientia Silvae Sinicae 2013, 49.
- Chen, D. Qualitative and quantitative research for the main flavonoids in bamboo leaves of Phyllostachys. Chinese Academy of Forestry 2021, 33.
- Cui, J. Flavonoids and Volatile Components from Indocalams Leaves. Chinese Academy of Forestry, 2012, 22.
- Li, H.; Sun, J; Zhang, J; Shou, D. Determination of orientin, isoorientin, isovitexin in Bamboo Leaf from different sources by HPLC. Chinese Traditional Patent Medicine 2004, 38-40.
- Yuan, T. Qualitative study of flavonoids in the Bambusa chungii and Bambusa textiles leaves extract using mass spectrometry. Chinese academy of forestry 2023, 37.
- Wang, J.; Yue, Y.-D.; Tang, F.; Sun, J. TLC Screening for Antioxidant Activity of Extracts from Fifteen Bamboo Species and Identification of Antioxidant Flavone Glycosides from Leaves of Bambusa. textilis McClure. Molecules 2012, 17, 12297–12311. [CrossRef]
- Sun G. Studies on Chemical Constituents and Biological Activites of Bambusa pervariabilis McClure Leaves. Chinese Academy of Forestry 2011, 22.
- Zhou, Y. Analysis of Flavonoids in Bamboo Leaf by High performance liquid chromatography. Journal Of Analytical Chemistry 1996, 216-219.
- Zhao, Y; Yang, X; Zhao, X; Zhong, Y. Research Progress on Regulation of Plant Flavonoids Biosynthesis. Science and Technology of Food Industry 2021, 42, 454-463.
- Xing, W; Jin, X. Recent Advances of MYB Transcription Factors Involved in the Regulation of Flavonoid Biosynthesis. Molecular Plant Breeding 2015, 13, 689-696.
- Zhang, J.-Y.; Long, Y.-Q.; Zeng, J.; Fu, X.-S.; He, J.-W.; Zhou, R.-B.; Liu, X.-D. [Transcriptional regulation mechanism of differential accumulation of flavonoids in different varieties of Lonicera macranthoides based on metabonomics and transcriptomics]. China Journal of Chinese Materia Medica 2024, 49, 2666–2679. [CrossRef]
- Zeng, J.; Long, Y.-Q.; Li, C.; Zeng, M.; Yang, M.; Zhou, X.-R.; Liu, X.-D.; Zhou, R.-B. [Cloning and function analysis of chalcone isomerase gene and chalcone synthase gene in Lonicera macranthoides]. China Journal of Chinese Materia Medica 2022, 47, 2419–2429. [CrossRef]
- Azuma, A.; Yakushiji, H.; Koshita, Y.; Kobayashi, S. Flavonoid biosynthesis-related genes in grape skin are differentially regulated by temperature and light conditions. Planta 2012, 236, 1067–1080. [CrossRef]
- Chen, S; Cui, C; Wang, H; Cao, Z; Li, X; Sun, J. Effects of Different Temperature on Growth and Physiological Biochemical.
- Compositions of Nitzschia palea. Current Biotechnology 2012, 2, 48-51.
- Zhou, M; Shen, Y; Zhu, L; Ai, X; Zeng, J; Yang, H. Research Progress on Biosynthesis, Accumulation and Regulation of Flavonoids in Plants. Food Research And Development 2016, 37, 216-221.
- Hao, G.; Du, X.; Zhao, F.; Shi, R.; Wang, J. Role of nitric oxide in UV-B-induced activation of PAL and stimulation of flavonoid biosynthesis in Ginkgo biloba callus. Plant Cell, Tissue Organ Cult. (PCTOC) 2009, 97, 175–185. [CrossRef]
- Jiang, M,; Gao, Q; Wang, D. Application of metabonomics technology based on liquid chromatographmass spectrometer in chemical components of traditional Chinese medicine. China Medical Herald 2020, 17, 133-136.
- Wan, L. Ultrasound-assisted extraction and purification offavonoidsfrom mulberry leaves and inhibition of xanthine oxide enzyme. Nanchang University 2020, 31.
- Liao, S.; Ren, Q.; Yang, C.; Zhang, T.; Li, J.; Wang, X.; Qu, X.; Zhang, X.; Zhou, Z.; Zhang, Z.; et al. Liquid Chromatography–Tandem Mass Spectrometry Determination and Pharmacokinetic Analysis of Amentoflavone and Its Conjugated Metabolites in Rats. J. Agric. Food Chem. 2015, 63, 1957–1966. [CrossRef]
- Dong, L; Liu, J; Li, L; Chen, X; Dan, W; Zhong, D. Simultaneous determination of flavonol glycoside and its major metabolites by LC-MS/MS in rat plasma. Acta Pharmaceutica Sinica 2018, 53, 1345-1351.
- Fu, C; Cui, X; Pei, X ; Du, C; Yan, Y. Simultaneous determination of six chemical components in Ziziphi Spinosae Folium by LC-MS/MS. Journal of Shanxi Medical University 2020, 51, 666-673.
- Zhan, J. Pharmacokinetics of main metabolites of Epimedium extract in rats. Guangzhou University of Chinese Medicine, 2019, 23.
- Zhang, X; Duan, J; Qian, D. Identification of flavonoids from Eupatorium lindeyanum and compound Yemazhui capsules by LC-MS/MS. Journal of China Pharmaceutical Universit 2008, 39, 147-150.
- Jiang, X; Fang, A; Du, W; Ruan, C.LC-MS/MS detection of flavonoids in Xanthoceras sorbifolum Bunge kernel from different origins. China Oils And Fats 2023, 48, 133-140.
- Fraga, C.G.; Clowers, B.H.; Moore, R.J.; Zink, E.M. Signature-discovery approach for sample matching of a nerve-agent precursor using liquid chromatography− mass spectrometry, XCMS, and chemometrics. Analytical chemistry 2010, 82, 4165-4173.
- Han, J.S.; Lee, S.; Kim, H.Y.; Lee, C.H. MS-Based Metabolite Profiling of Aboveground and Root Components of Zingiber mioga and Officinale. Molecules 2015, 20, 16170–16185. [CrossRef]
- Lv, H.; Guo, S. Comparative analysis of flavonoid metabolites from different parts of Hemerocallis citrina. BMC Plant Biol. 2023, 23, 1–10. [CrossRef]
- Lei, Z.; Sumner, B.W.; Bhatia, A.; Sarma, S.J.; Sumner, L.W. UHPLC-MS analyses of plant flavonoids. Current protocols in plant biology 2019, 4, e20085.
- Wang, T.; Xiao, J.; Hou, H.; Li, P.; Yuan, Z.; Xu, H.; Liu, R.; Li, Q.; Bi, K. Development of an ultra-fast liquid chromatography–tandem mass spectrometry method for simultaneous determination of seven flavonoids in rat plasma: Application to a comparative pharmacokinetic investigation of Ginkgo biloba extract and single pure ginkgo flavonoids after oral administration. J. Chromatogr. B 2017, 1060, 173–181. [CrossRef]
- de Villiers, A.; Venter, P.; Pasch, H. Recent advances and trends in the liquid-chromatography–mass spectrometry analysis of flavonoids. J. Chromatogr. A 2016, 1430, 16–78. [CrossRef]
- Chong, J.; Xia, J. MetaboAnalystR: An R package for flexible and reproducible analysis of metabolomics data. Bioinformatics 2018, 34, 4313–4314. [CrossRef]
- Karak, P. Biological activities of flavonoids: An overview. Int. J. Pharm. Sci. Res 2019, 10, 1567-1574.
- Du, Y; Ma, S; Wu, Y; Xu, Y; Huang, X; Zhong, J. Determination and Analysis of Polysaccharide and Flavonoid Content of Different Parts of Mesona chinensis and Research on Hydroponics. Chinese Journal of Tropical Agriculture 2023, 43, 39-48.
- Wang, Y; Wang, Y; Du, Z; Li, J; Chen, S. Research progress on chemical composition and pharmacological effects of different parts of Prunella valgaris and predictive analysis on quality marker. Chinese Archives of Traditional Chinese Medicine 2014, 1-33.
- Dong, X.; Chen, W.; Wang, W.; Zhang, H.; Liu, X.; Luo, J. Comprehensive profiling and natural variation of flavonoids in rice. J. Integr. Plant Biol. 2014, 56, 876–886. [CrossRef]
- Sun, J.; Wang, Z.; Chen, L.; Sun, G. Hypolipidemic Effects and Preliminary Mechanism of Chrysanthemum Flavonoids, Its Main Components Luteolin and Luteoloside in Hyperlipidemia Rats. Antioxidants 2021, 10, 1309. [CrossRef]
- Tao, M.; Li, R.; Zhang, Z.; Wu, T.; Xu, T.; Zogona, D.; Huang, Y.; Pan, S.; Xu, X. Vitexin and Isovitexin Act through Inhibition of Insulin Receptor to Promote Longevity and Fitness in Caenorhabditis elegans. Mol. Nutr. Food Res. 2022, 66, e2100845. [CrossRef]
- Stabrauskiene, J.; Kopustinskiene, D.M.; Lazauskas, R.; Bernatoniene, J. Naringin and Naringenin: Their Mechanisms of Action and the Potential Anticancer Activities. Biomedicines 2022, 10, 1686. [CrossRef]
- Imani, A.; Maleki, N.; Bohlouli, S.; Kouhsoltani, M.; Sharifi, S.; Dizaj, S.M. Molecular mechanisms of anticancer effect of rutin. Phytotherapy Res. 2020, 35, 2500–2513. [CrossRef]
- Bi, Z.; Zhang, W.; Yan, X. Anti-inflammatory and immunoregulatory effects of icariin and icaritin. Biomed. Pharmacother. 2022, 151, 113180. [CrossRef]
- Cesar, P.H.S.; Trento, M.V.C.; Konig, I.F.M.; Marcussi, S. Catechin and epicatechin as an adjuvant in the therapy of hemostasis disorders induced by snake venoms. J. Biochem. Mol. Toxicol. 2020, 34, e22604. [CrossRef]
- Chen, Y.; Guo, S.; Jiang, K.; Wang, Y.; Yang, M.; Guo, M. Glycitin alleviates lipopolysaccharide-induced acute lung injury via inhibiting NF-κB and MAPKs pathway activation in mice. Int. Immunopharmacol. 2019, 75, 105749. [CrossRef]
- Chandrababu, G.; Varkey, M.; Devan, A.R.; Anjaly, M.V.; Unni, A.R.; Nath, L.R. Kaempferide exhibits an anticancer effect against hepatocellular carcinoma in vitro and in vivo. Naunyn-Schmiedeberg's Arch. Pharmacol. 2023, 396, 2461–2467. [CrossRef]
- Geshnigani, S.S.H.; Mahdavinia, M.; Kalantar, M.; Goudarzi, M.; Khorsandi, L.; Kalantar, H. Diosmin prophylaxis reduces gentamicin-induced kidney damage in rats. Naunyn-Schmiedeberg's Arch. Pharmacol. 2022, 396, 63–71. [CrossRef]
- Singh, P.; Arif, Y.; Bajguz, A.; Hayat, S. The role of quercetin in plants. Plant Physiology and Biochemistry 2021, 166, 10-19.
- Zhang, X; Guo, L; Yang, F; Hu, W; Sheng, Z. Study on Anti-diarrhea Effect of Isoquercitrin. Chinese Journal of Veterinary Medicine 2023, 59, 138-143.
- Chen, W.; Balan, P.; Popovich, D.G. Comparison of Ginsenoside Components of Various Tissues of New Zealand Forest-Grown Asian Ginseng (Panax Ginseng) and American Ginseng (Panax Quinquefolium L.). Biomolecules 2020, 10, 372. [CrossRef]
Figure 2.
Plots of PCA scores of (a) leaf and (b) shoot samples of P. amarus, with each point in the figure representing a sample.
Figure 2.
Plots of PCA scores of (a) leaf and (b) shoot samples of P. amarus, with each point in the figure representing a sample.
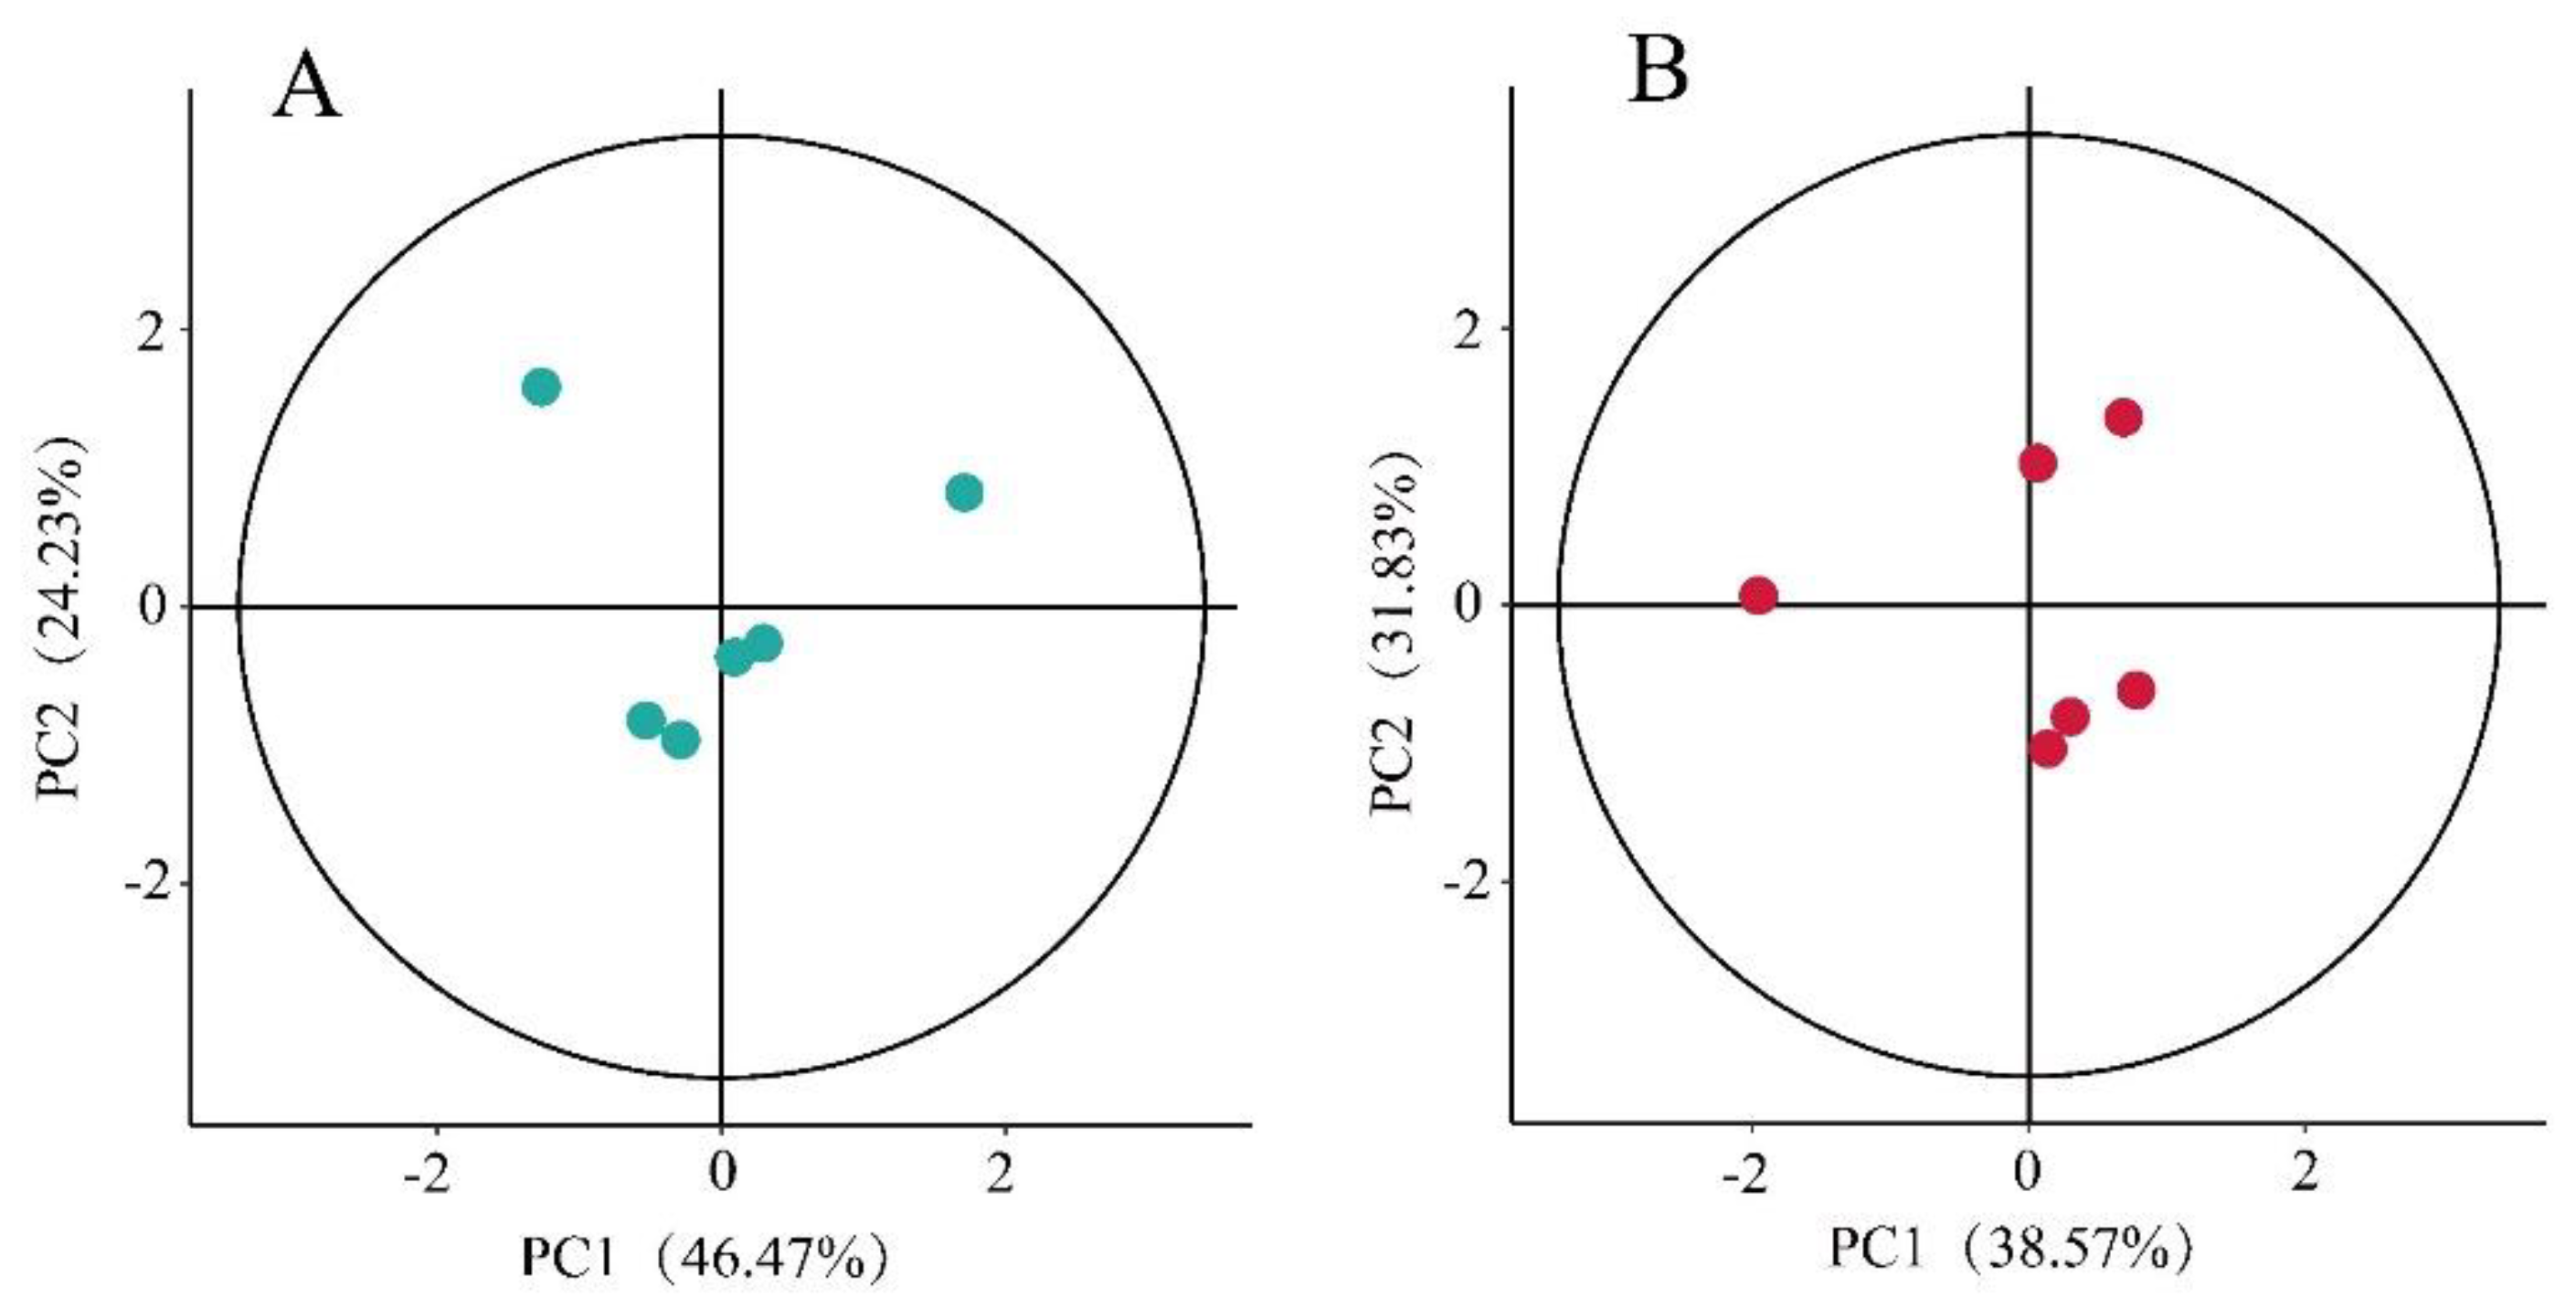
Figure 3.
Distribution of flavonoids of leaves and shoots of P. amarus before and after standardized correction.
Figure 3.
Distribution of flavonoids of leaves and shoots of P. amarus before and after standardized correction.
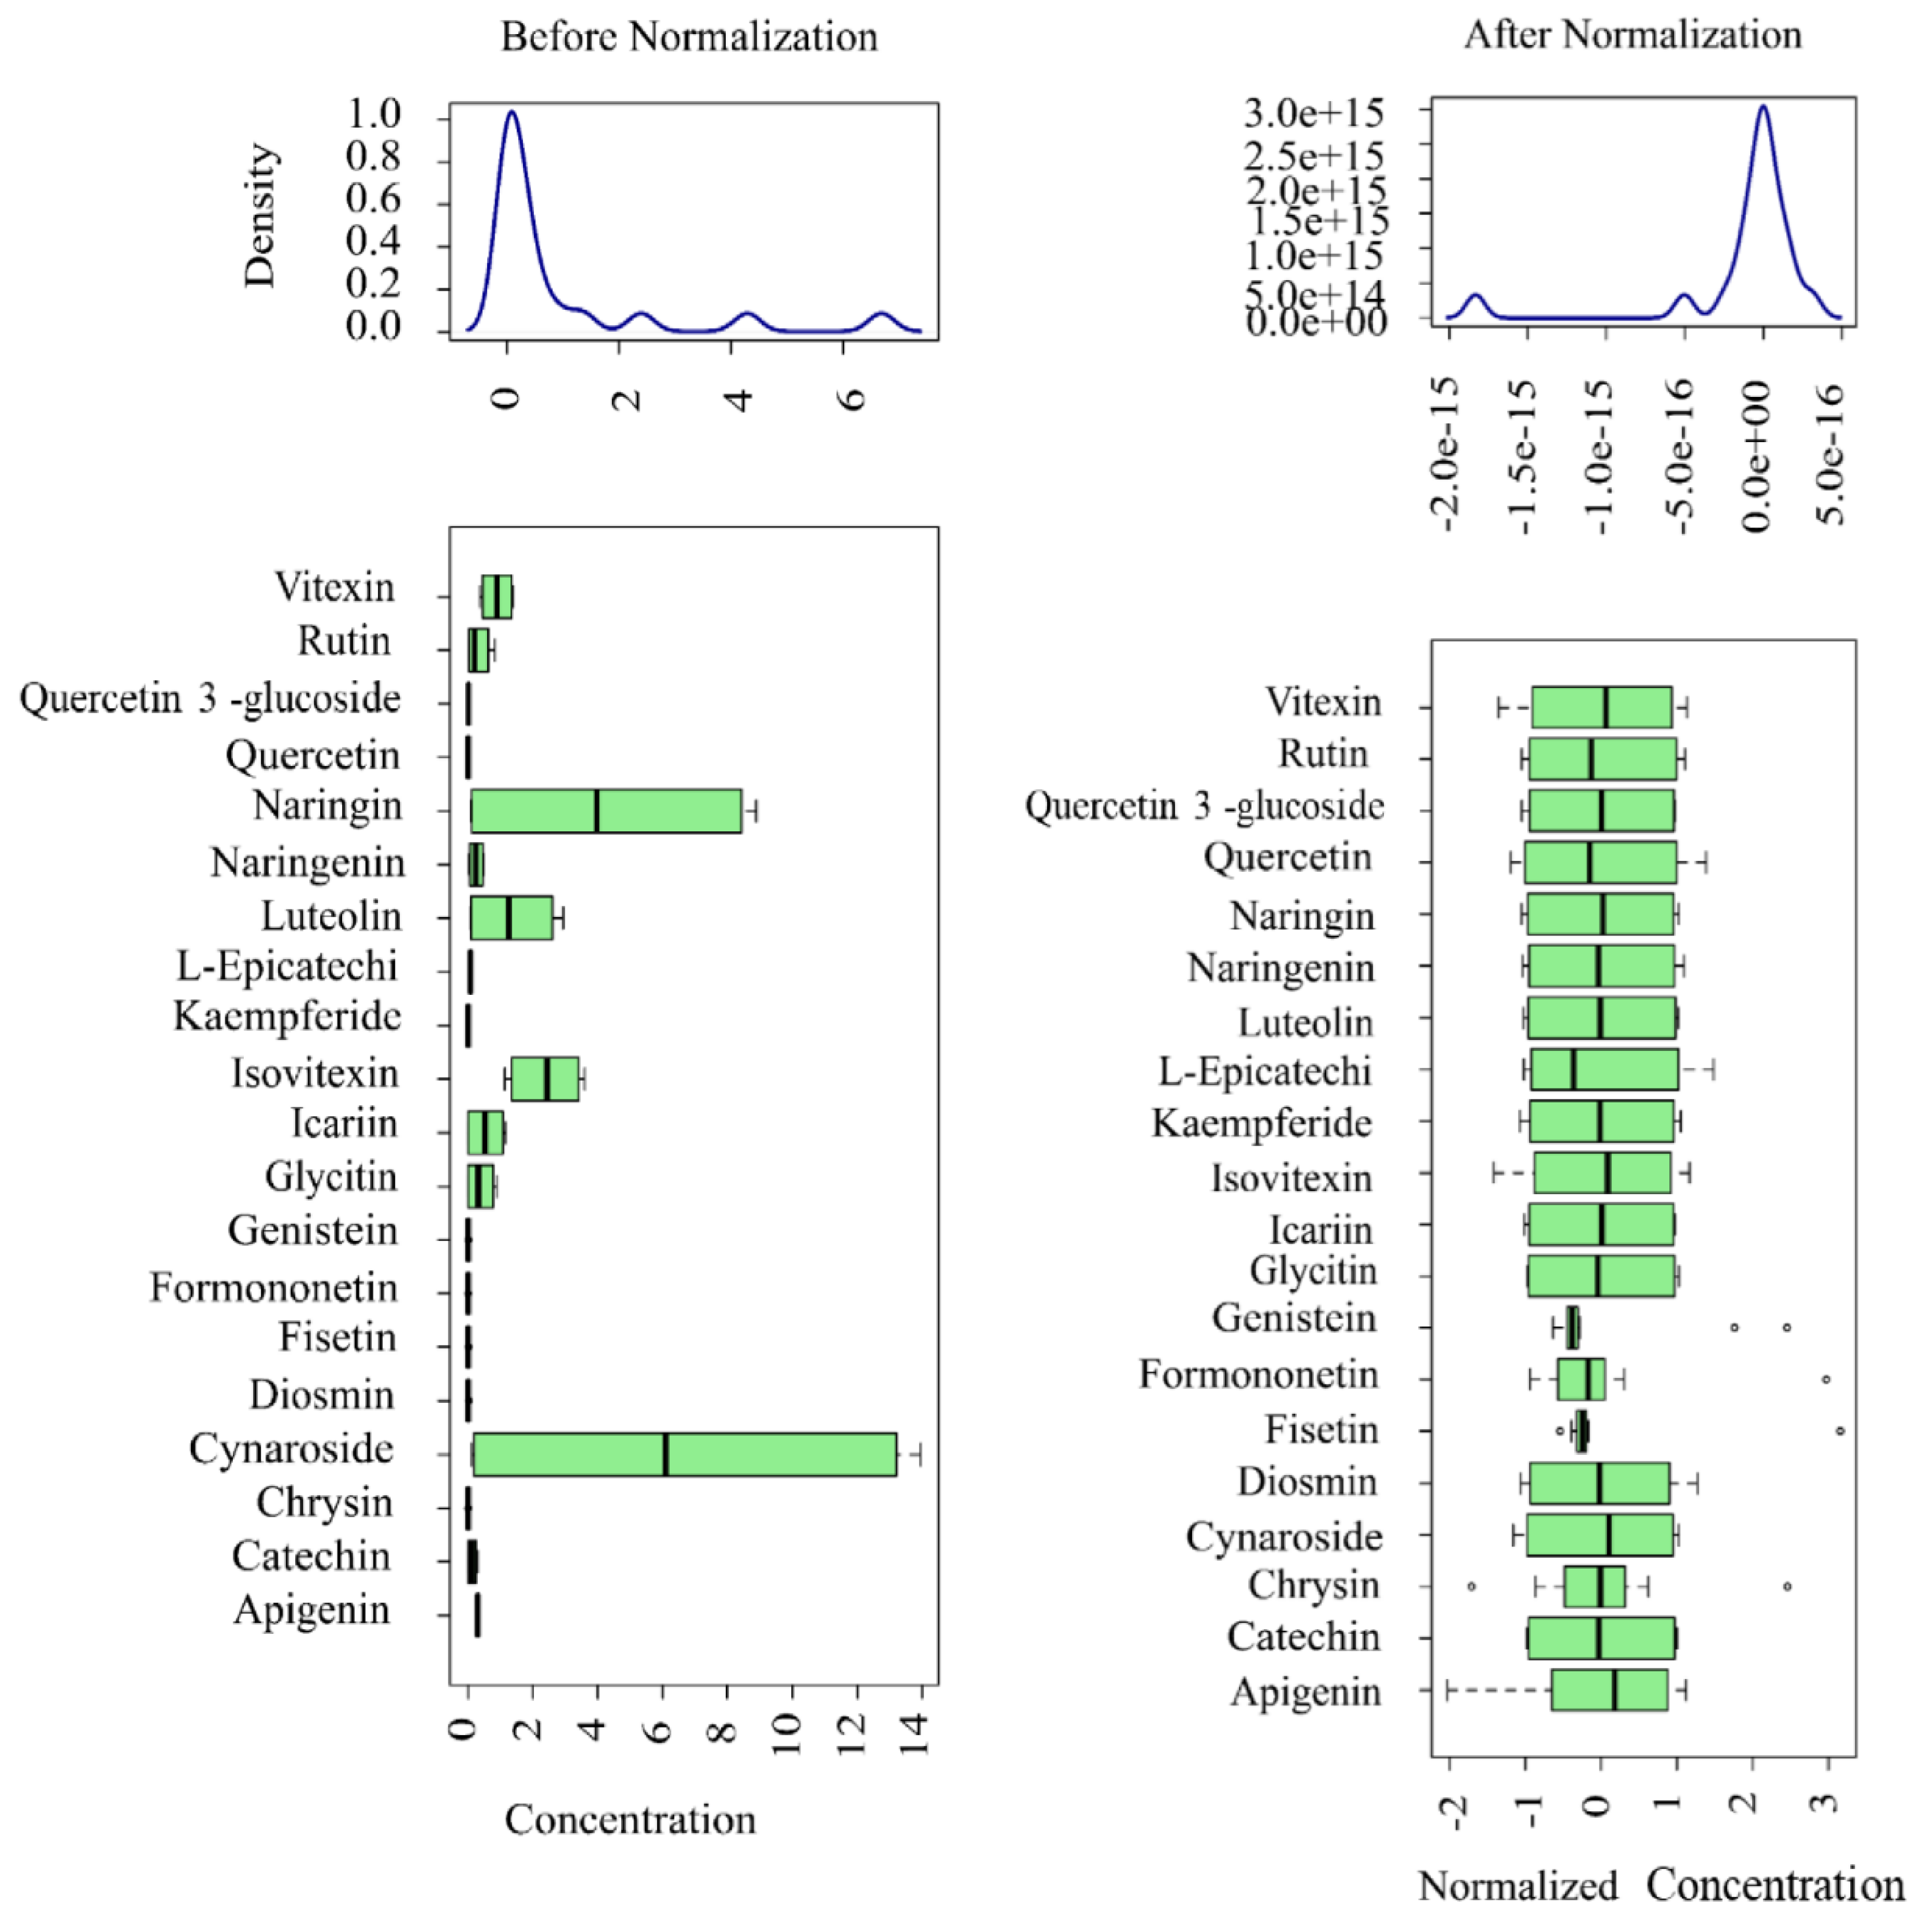
Figure 4.
A percentage stacked barplot of the top 20 flavonoids of the leaves and shoots of P. amarus.
Figure 4.
A percentage stacked barplot of the top 20 flavonoids of the leaves and shoots of P. amarus.
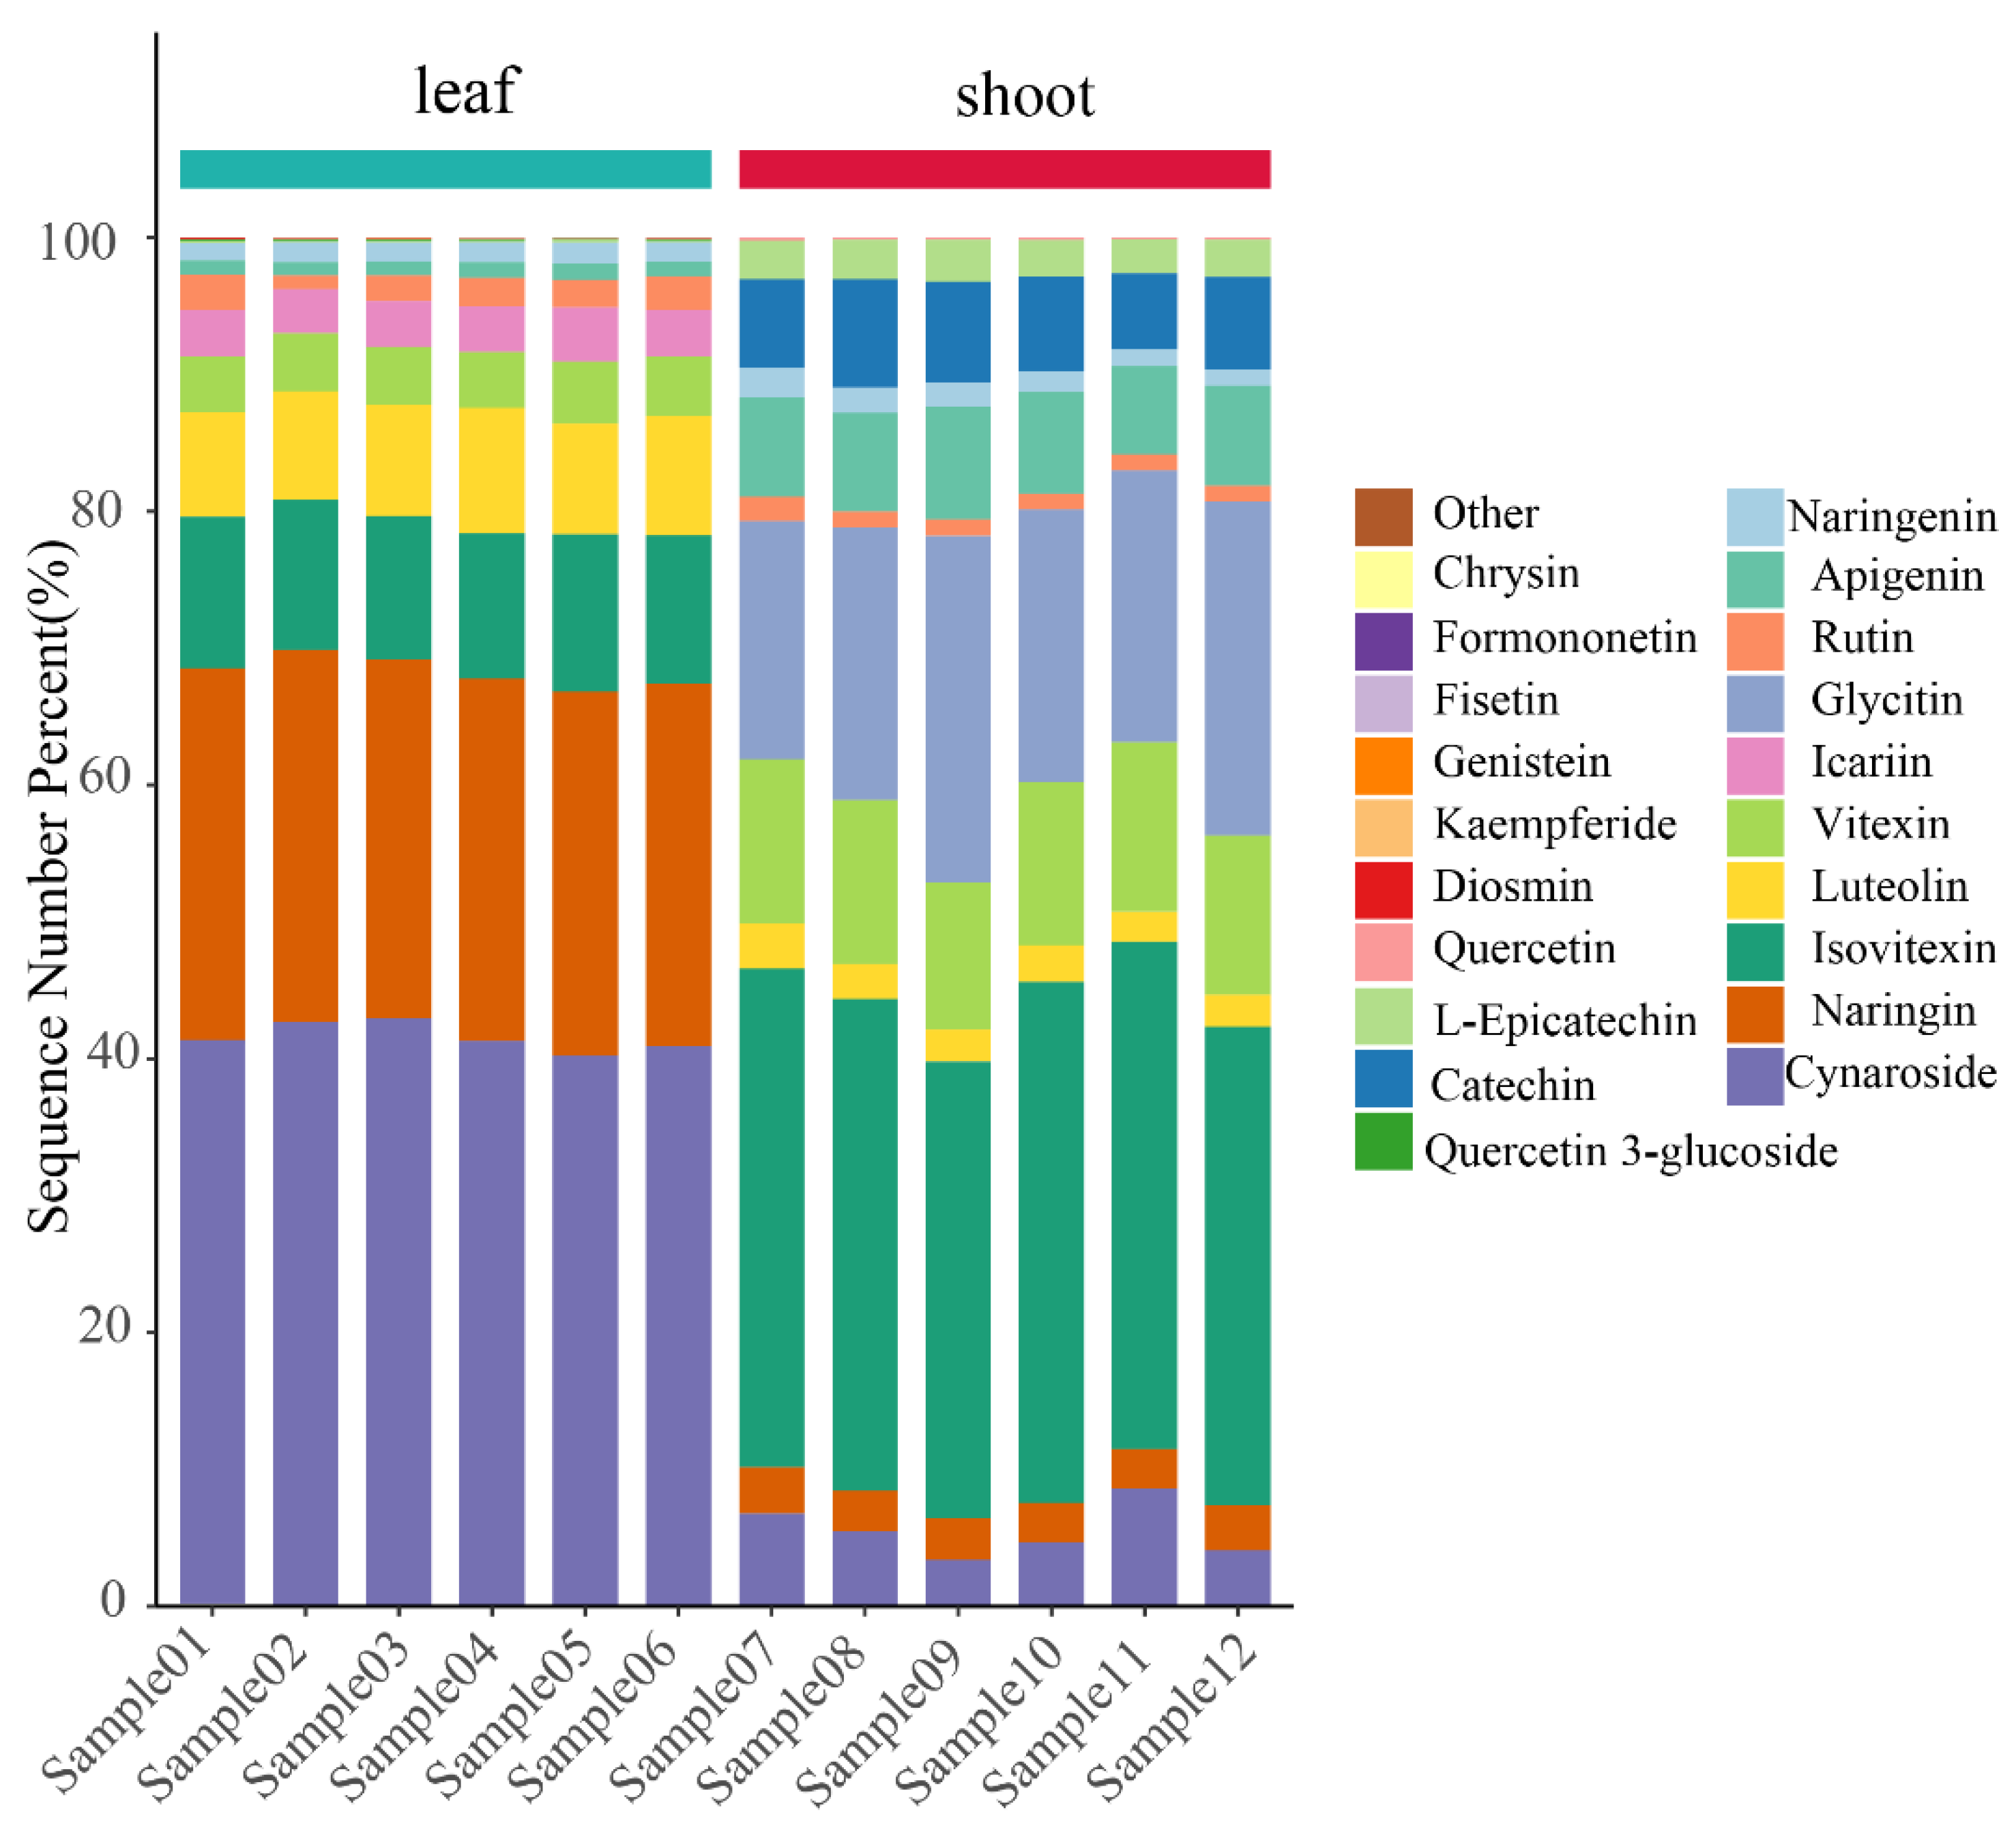
Figure 5.
Heatmap clustering of structural similarity of flavonoids of leaves and shoots of P. amarus.
Figure 5.
Heatmap clustering of structural similarity of flavonoids of leaves and shoots of P. amarus.
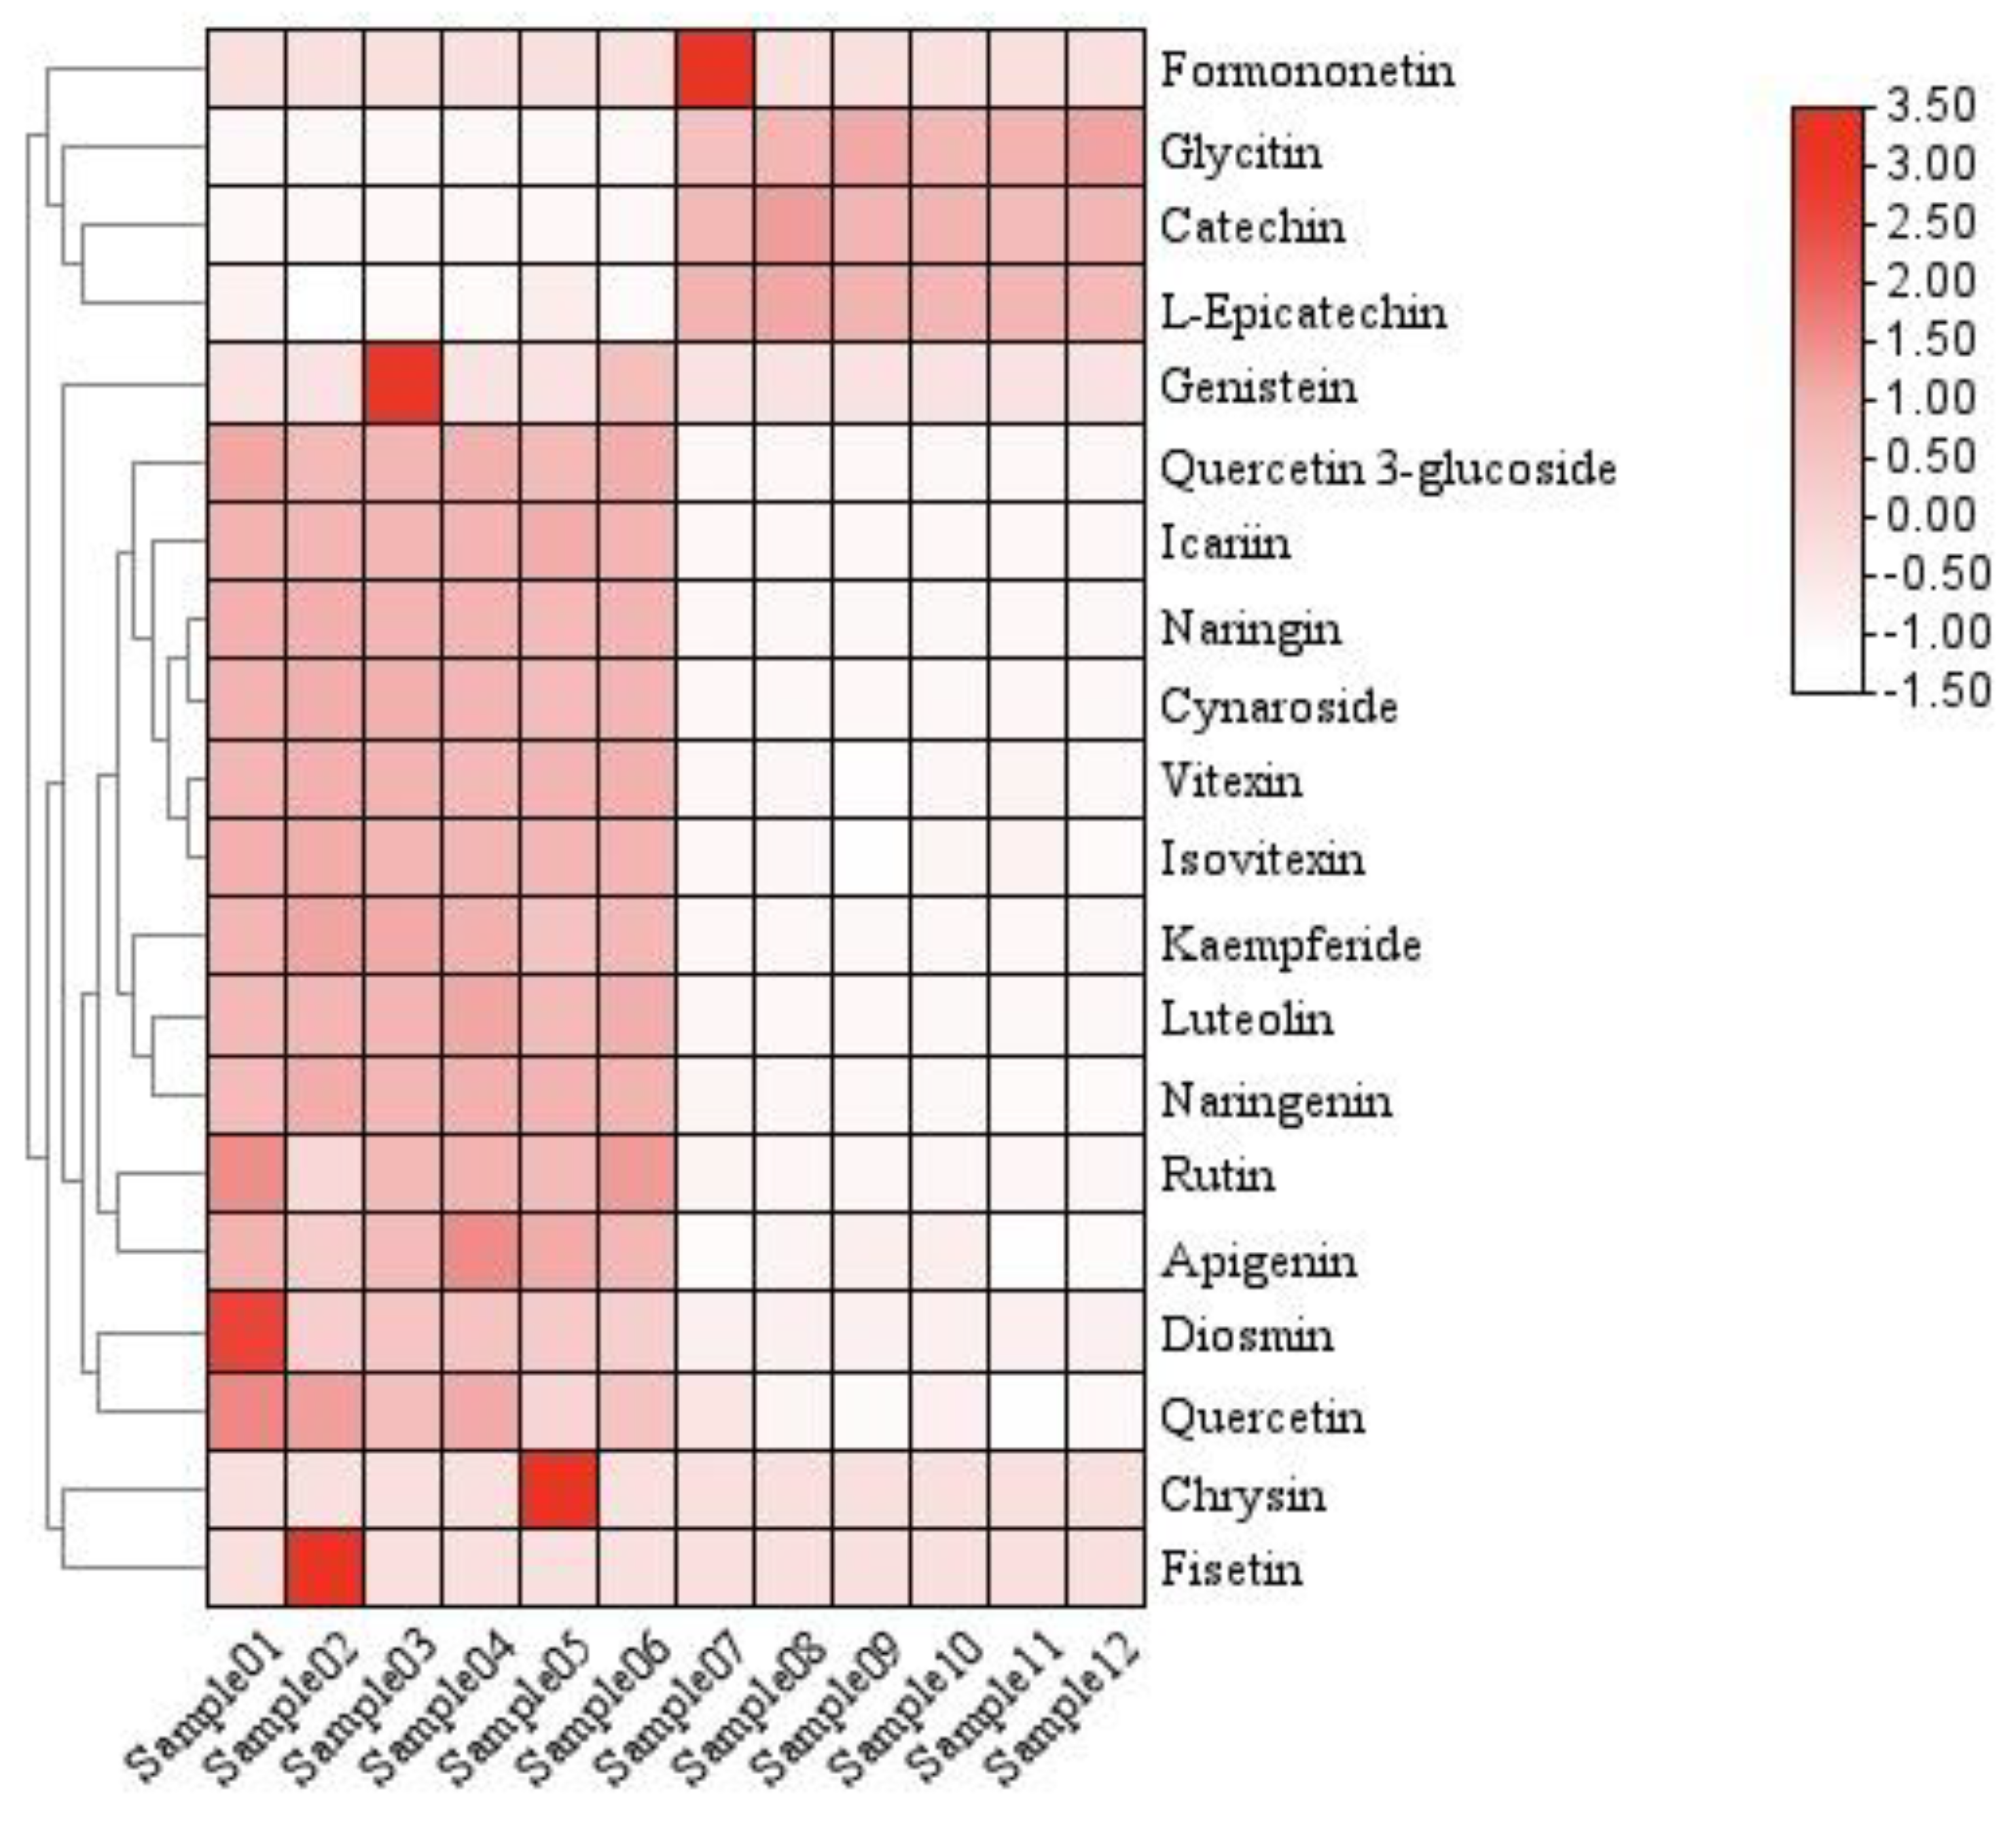
Figure 6.
The main metabolic pathways of Formononetin, L-Epicatechin, Glycitin, and Catechin.
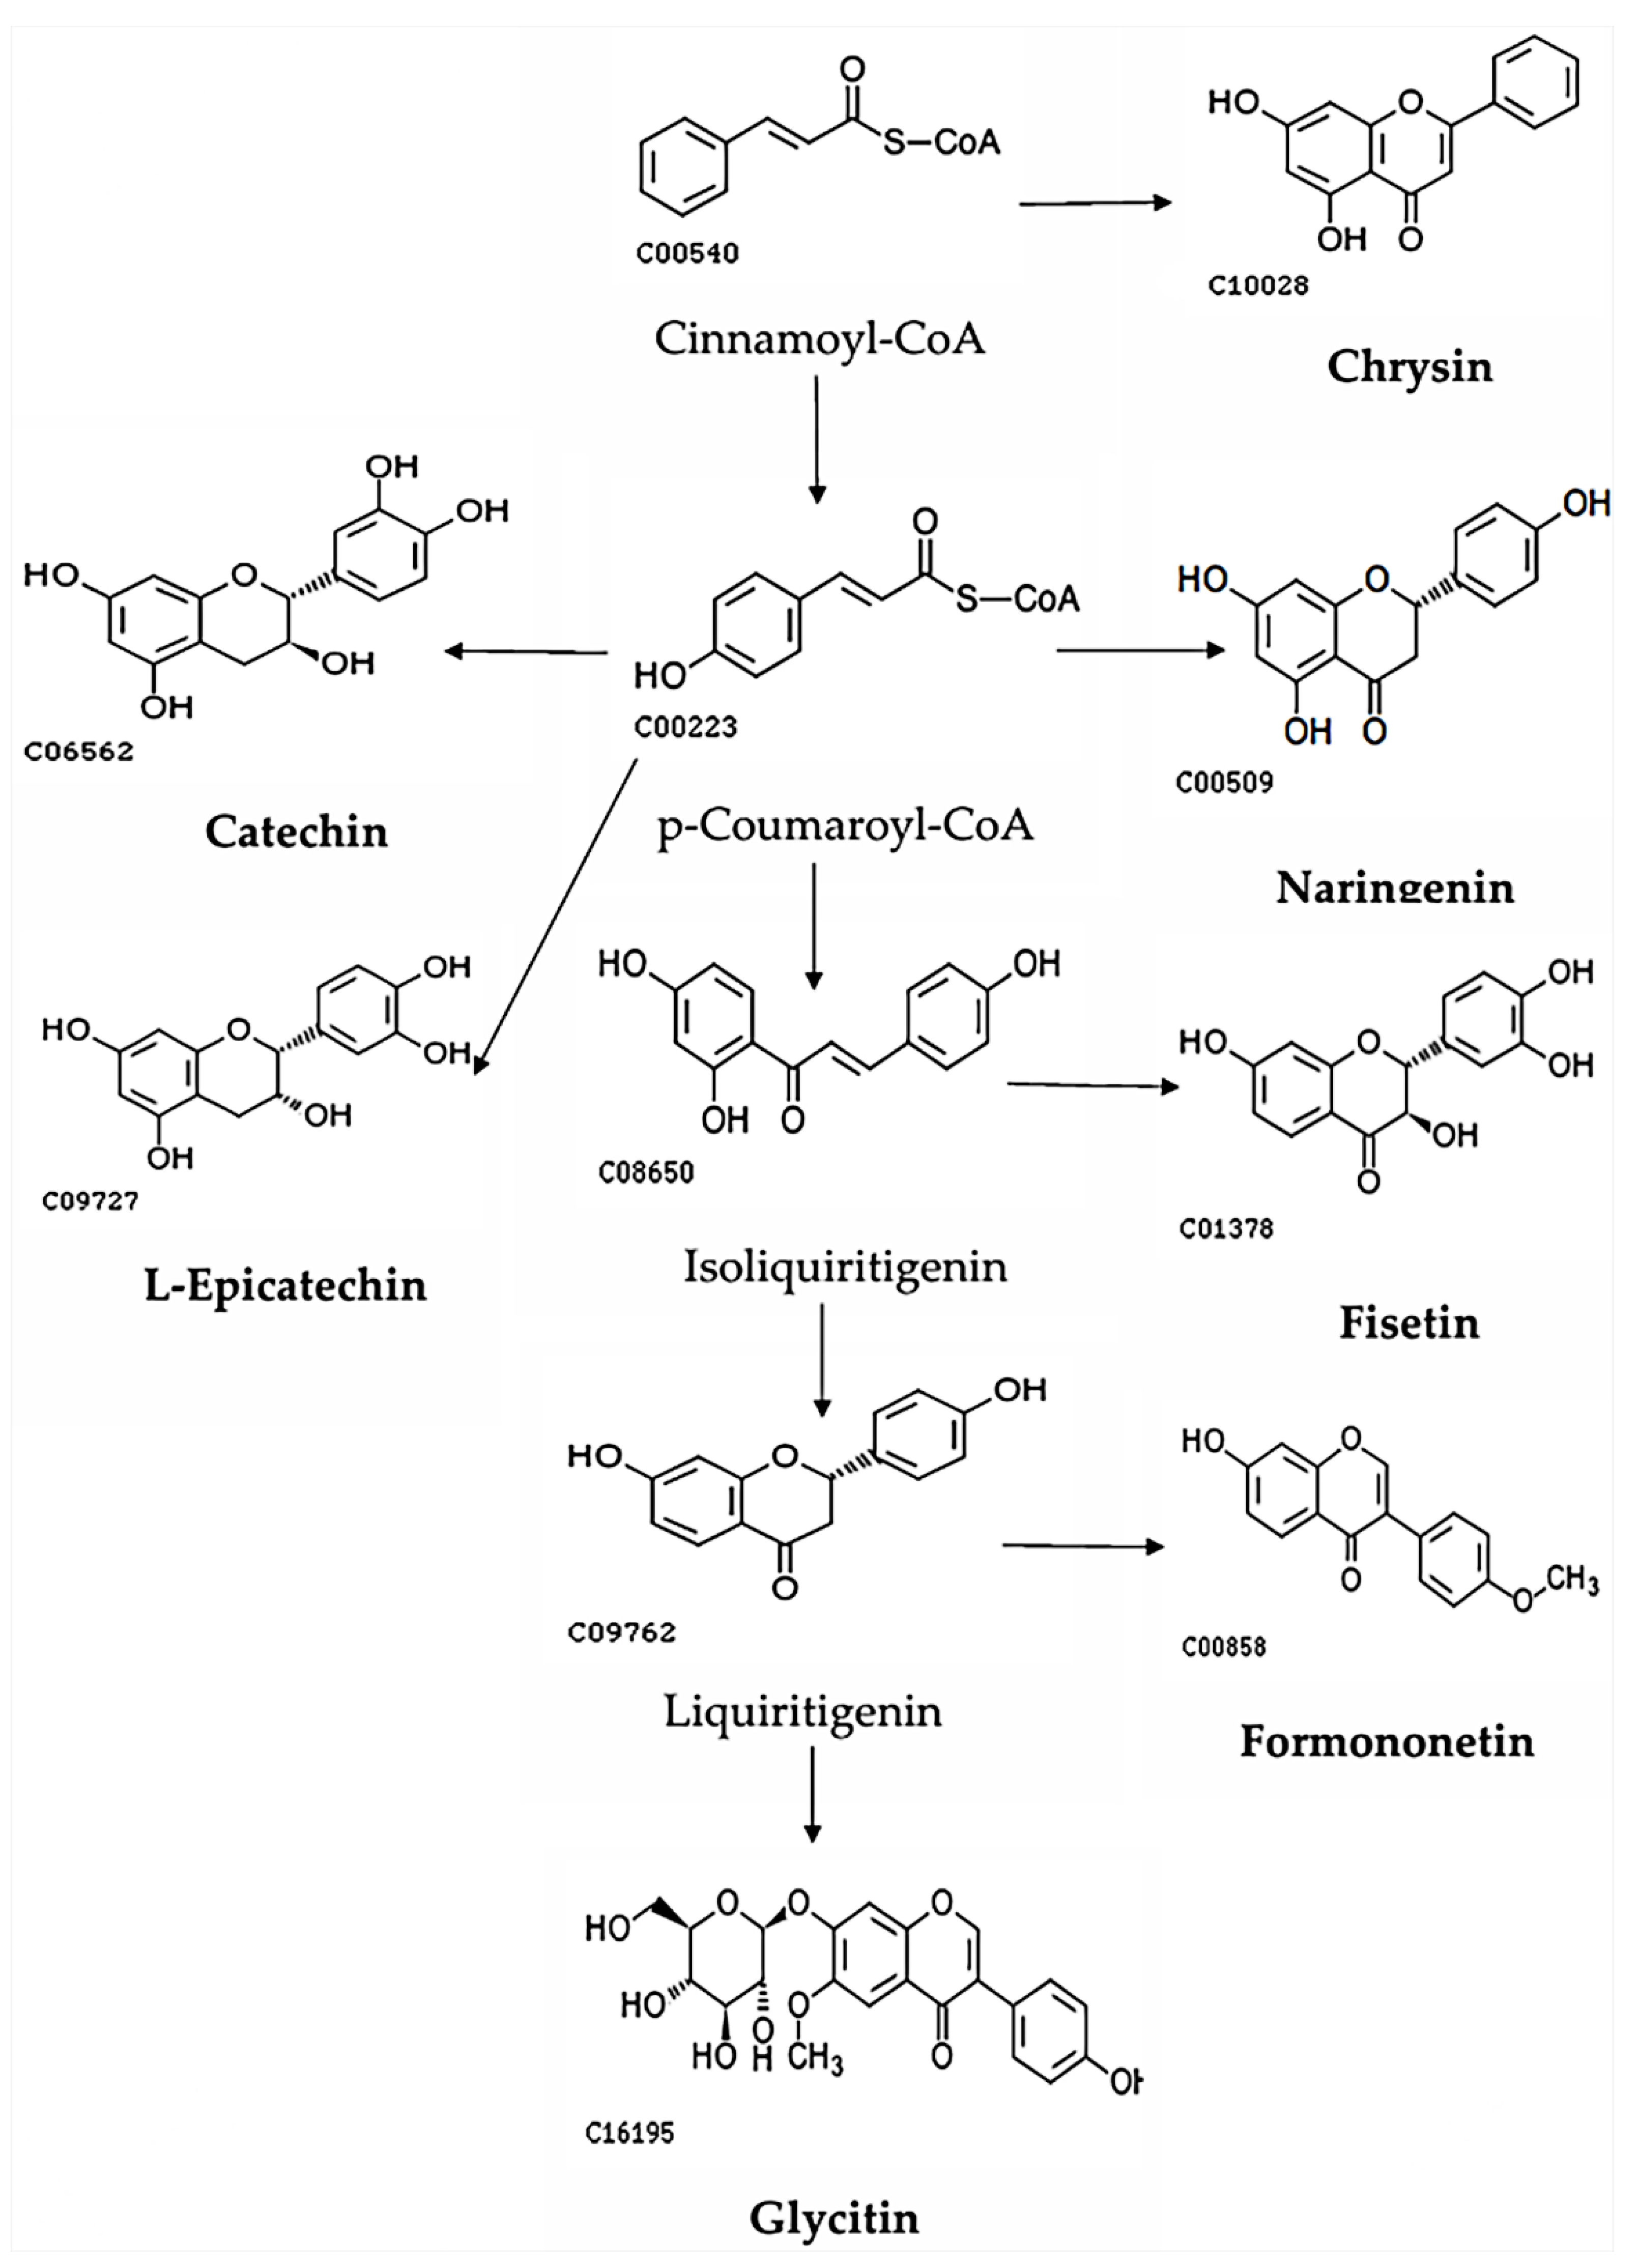
Figure 7.
The metabolic pathways of the other group of flavonoids.
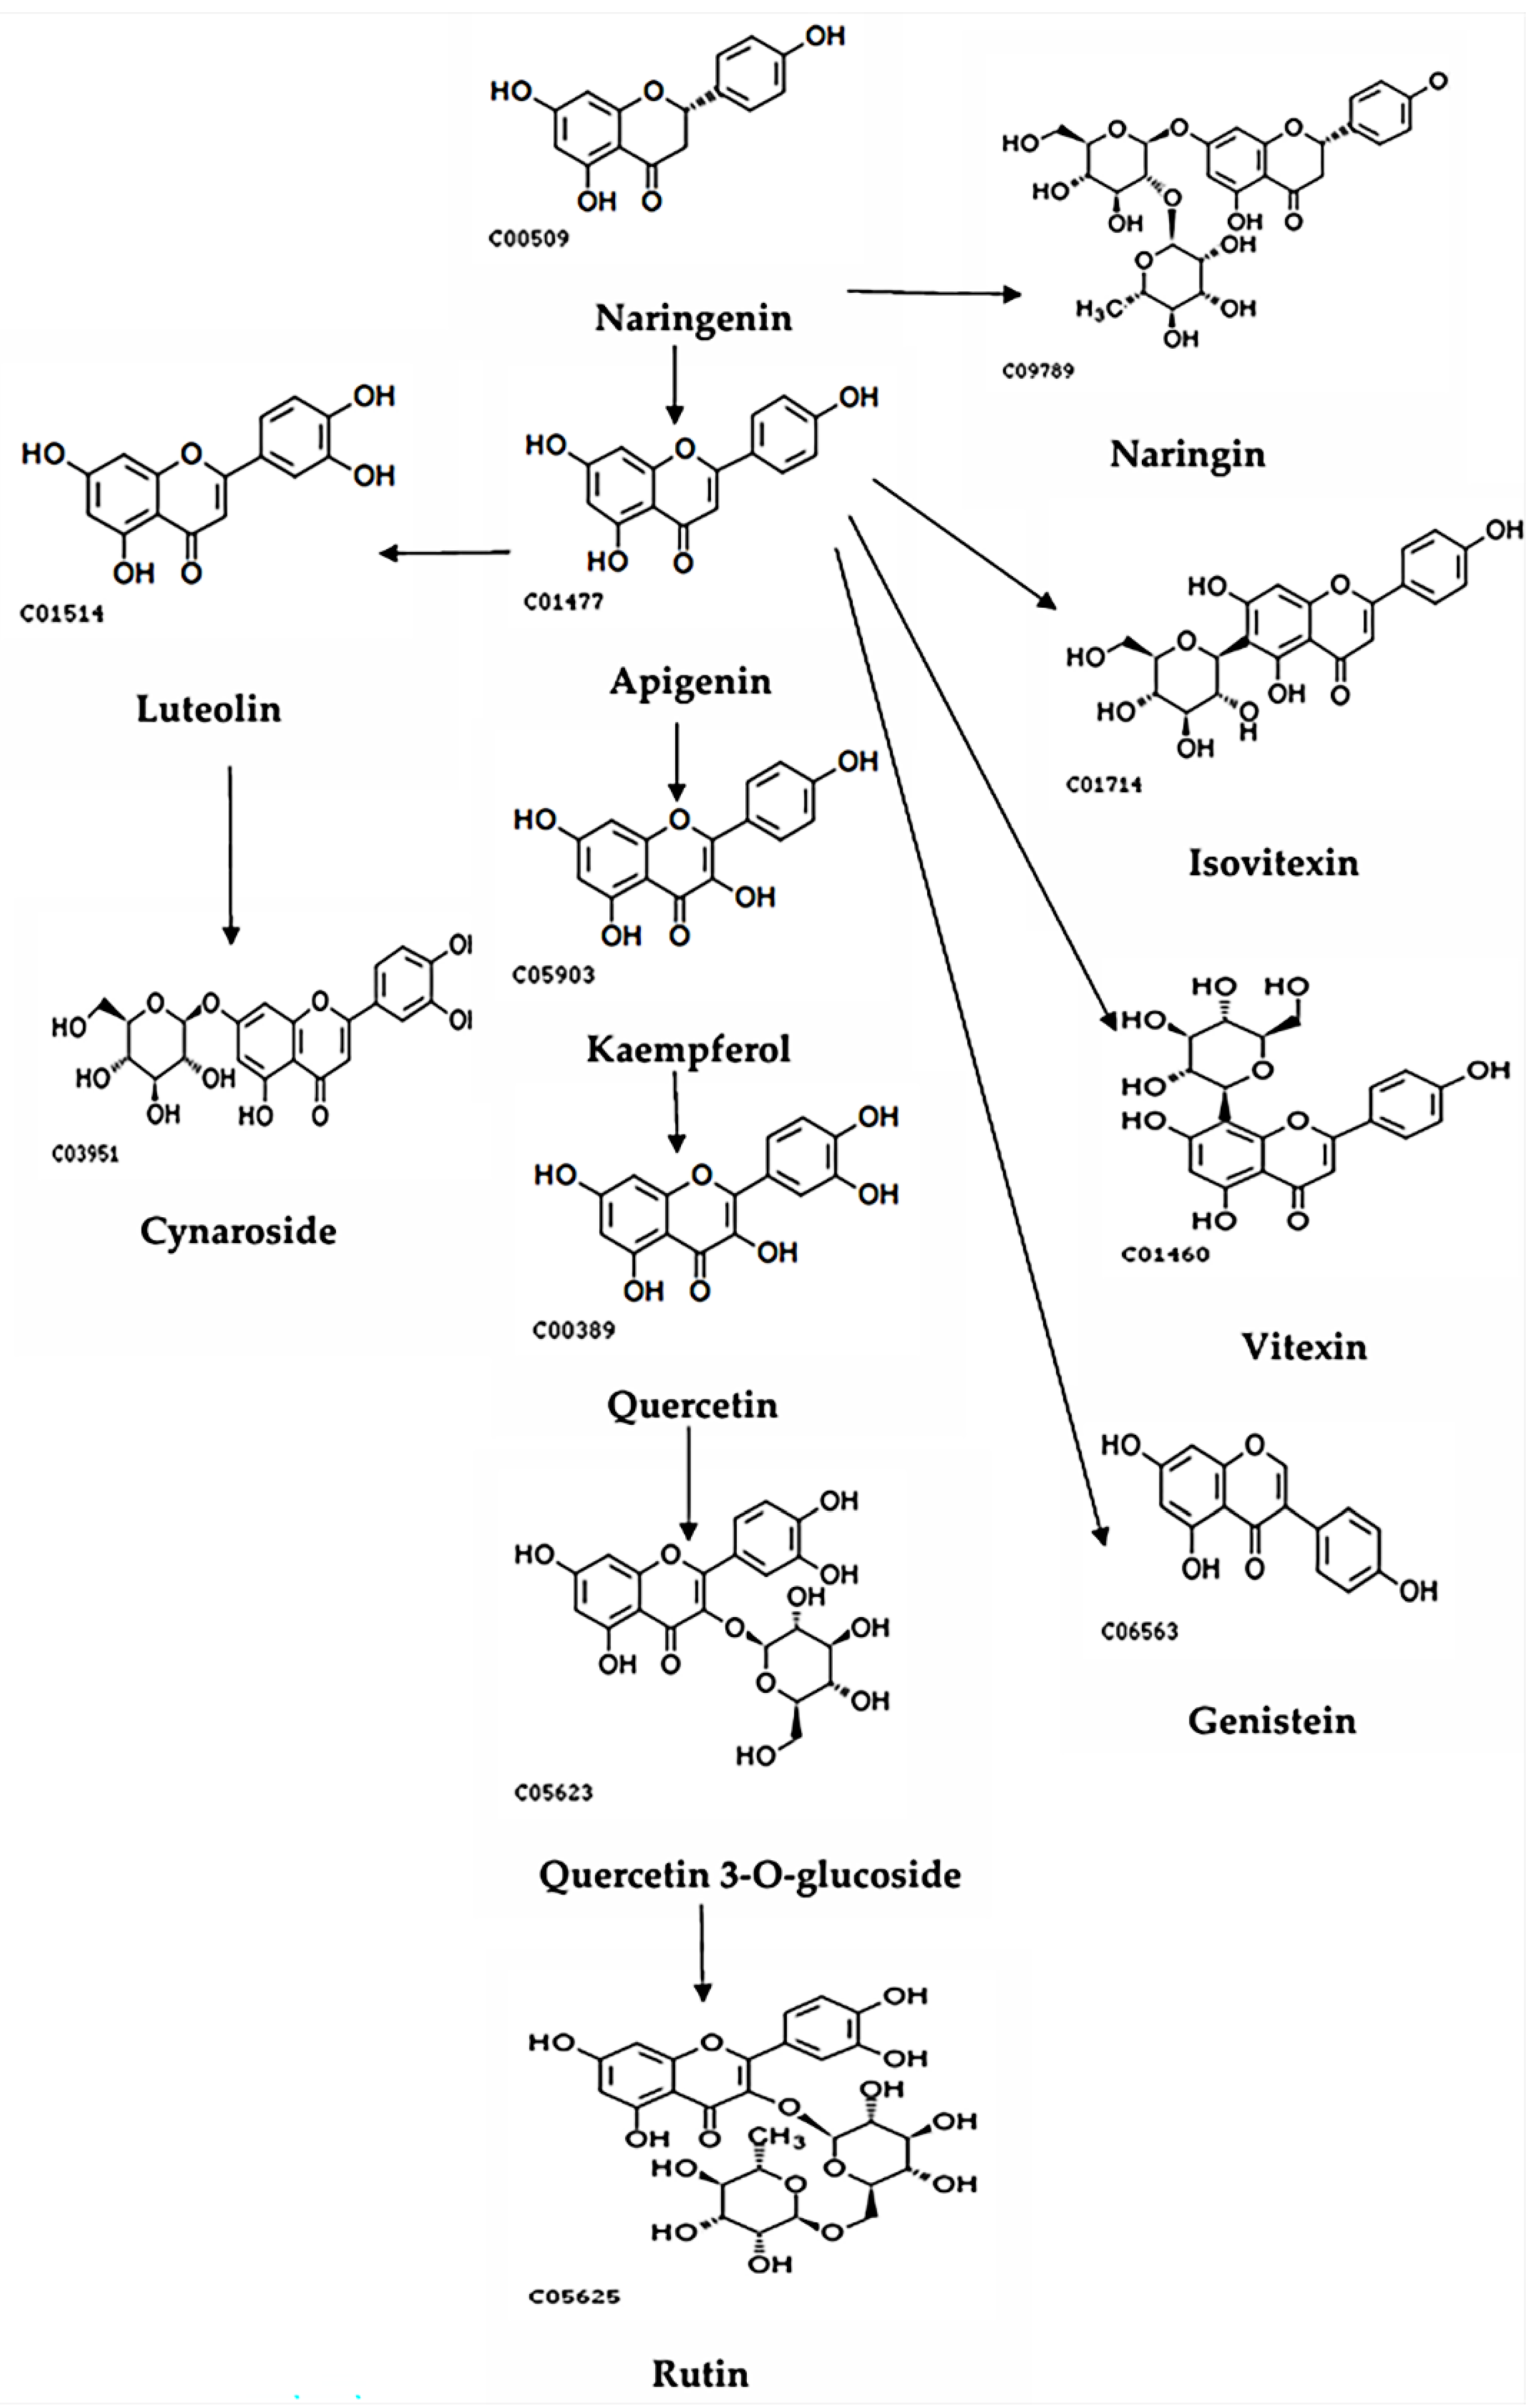
Figure 8.
OPLS-DA score chart of flavonoids of P. amarus leaves and shoots. *Each point corresponds to one sample, and the horizontal and vertical coordinates are the values of the two factors with the best discriminatory effect (score means the values of the two factors). The different colours represent different groupings, and the area marked by the ellipses is the 95% confidence region.
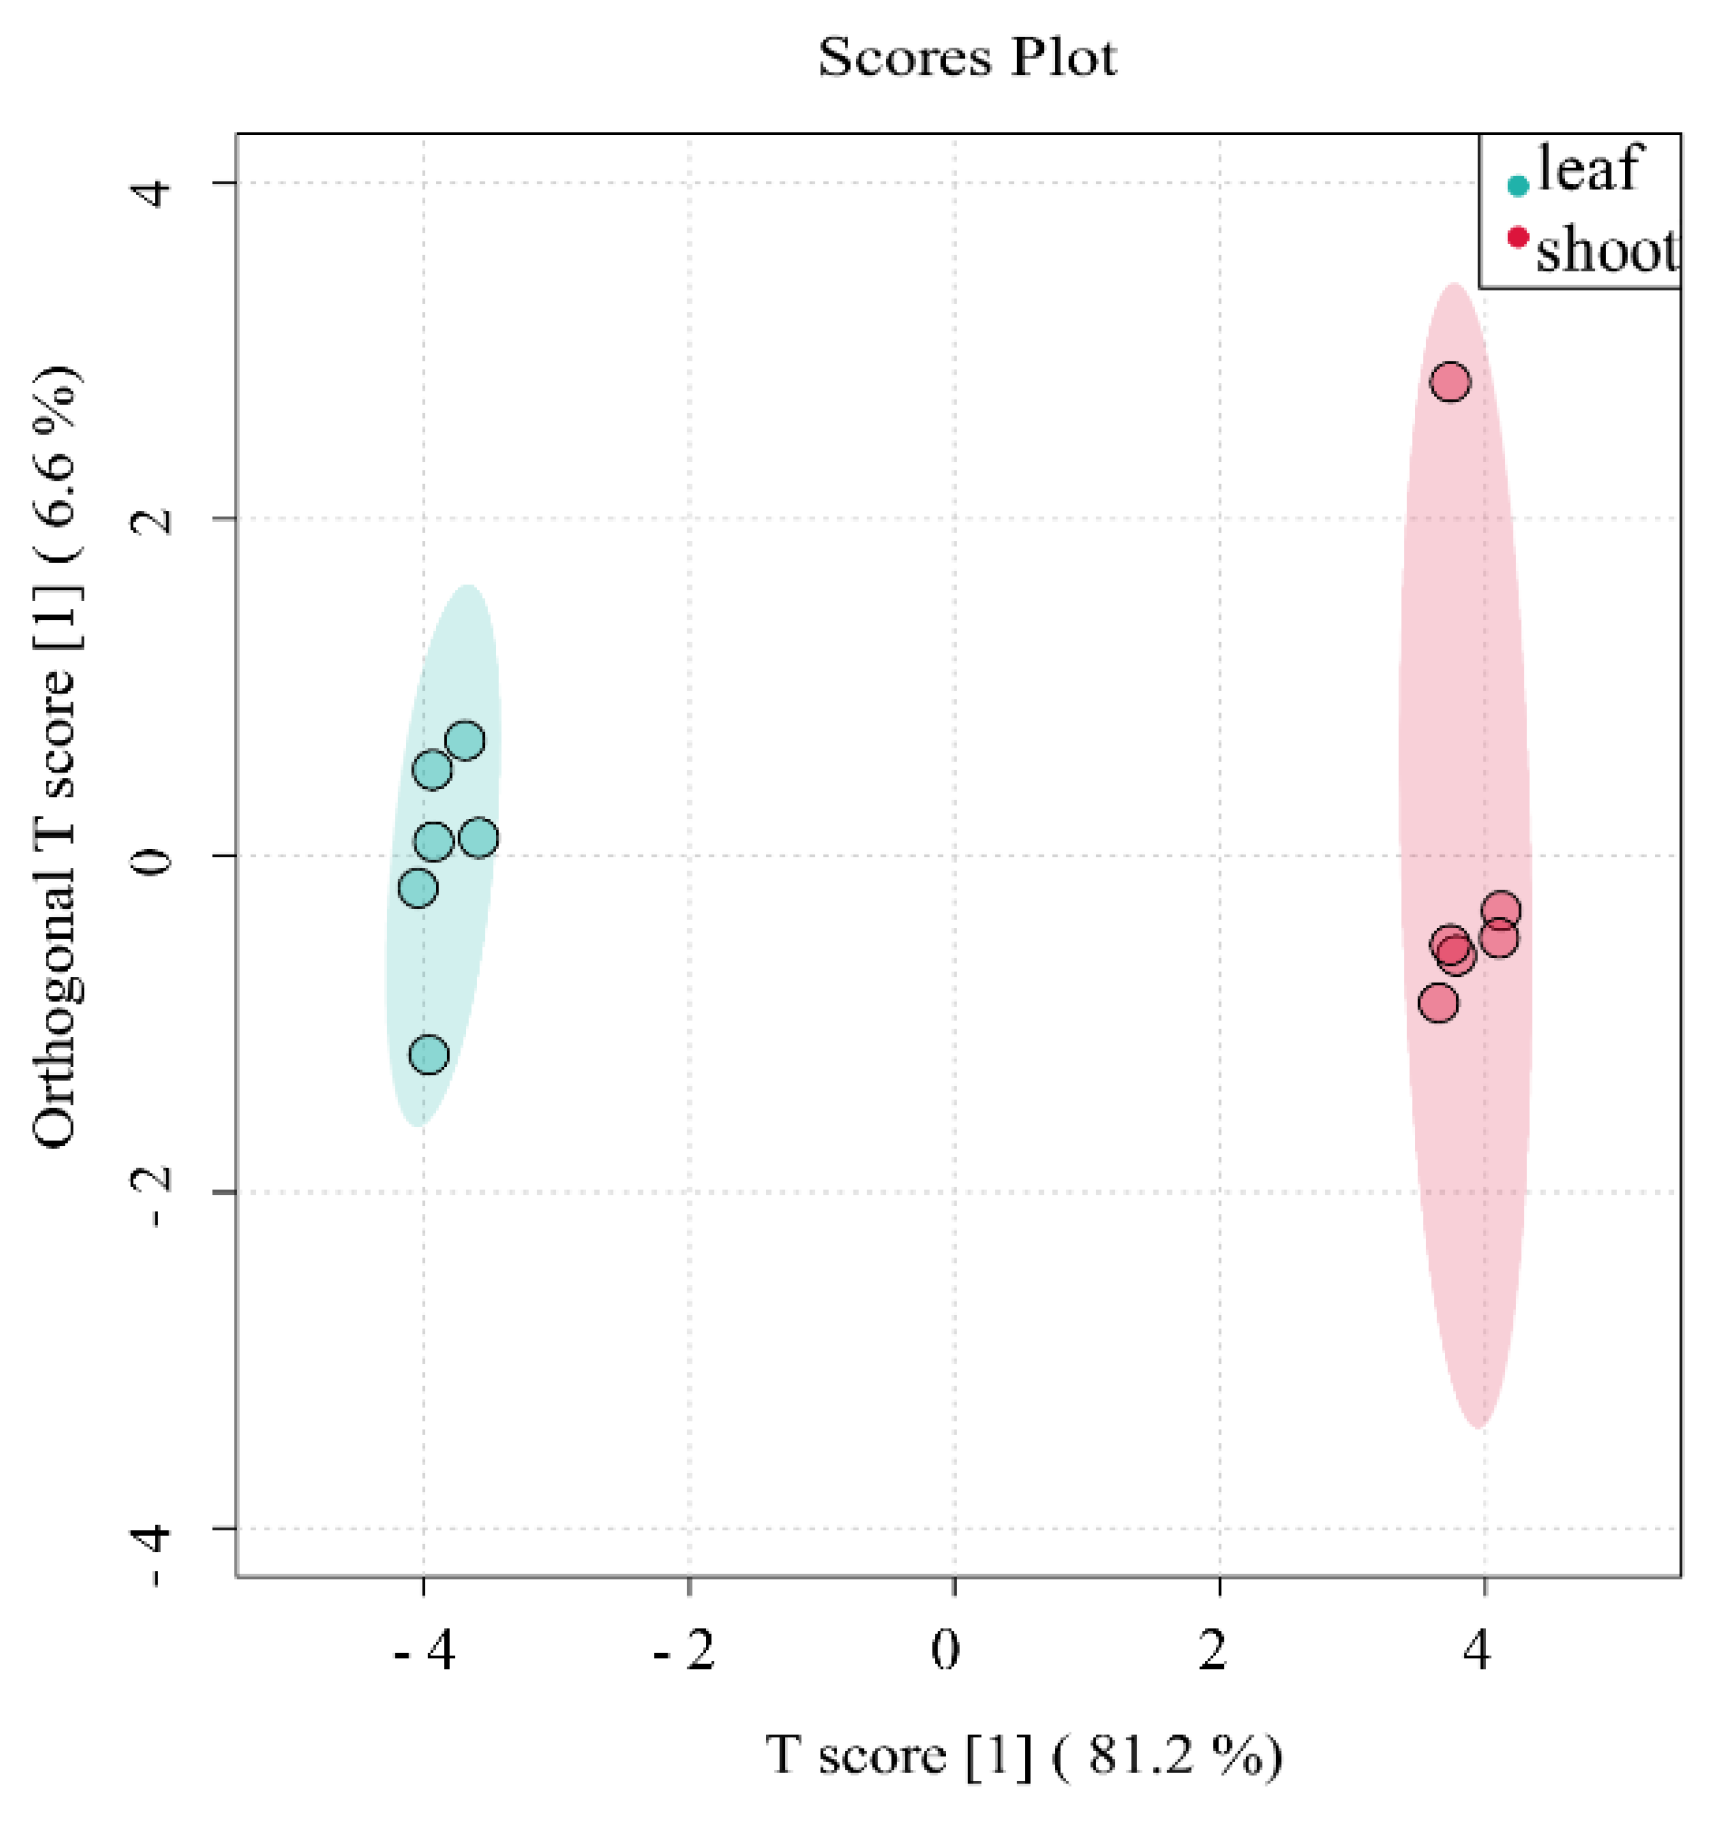
Figure 11.
Correlation clustering of the top 20 flavonoids of the leaves and shoots of P. amarus.
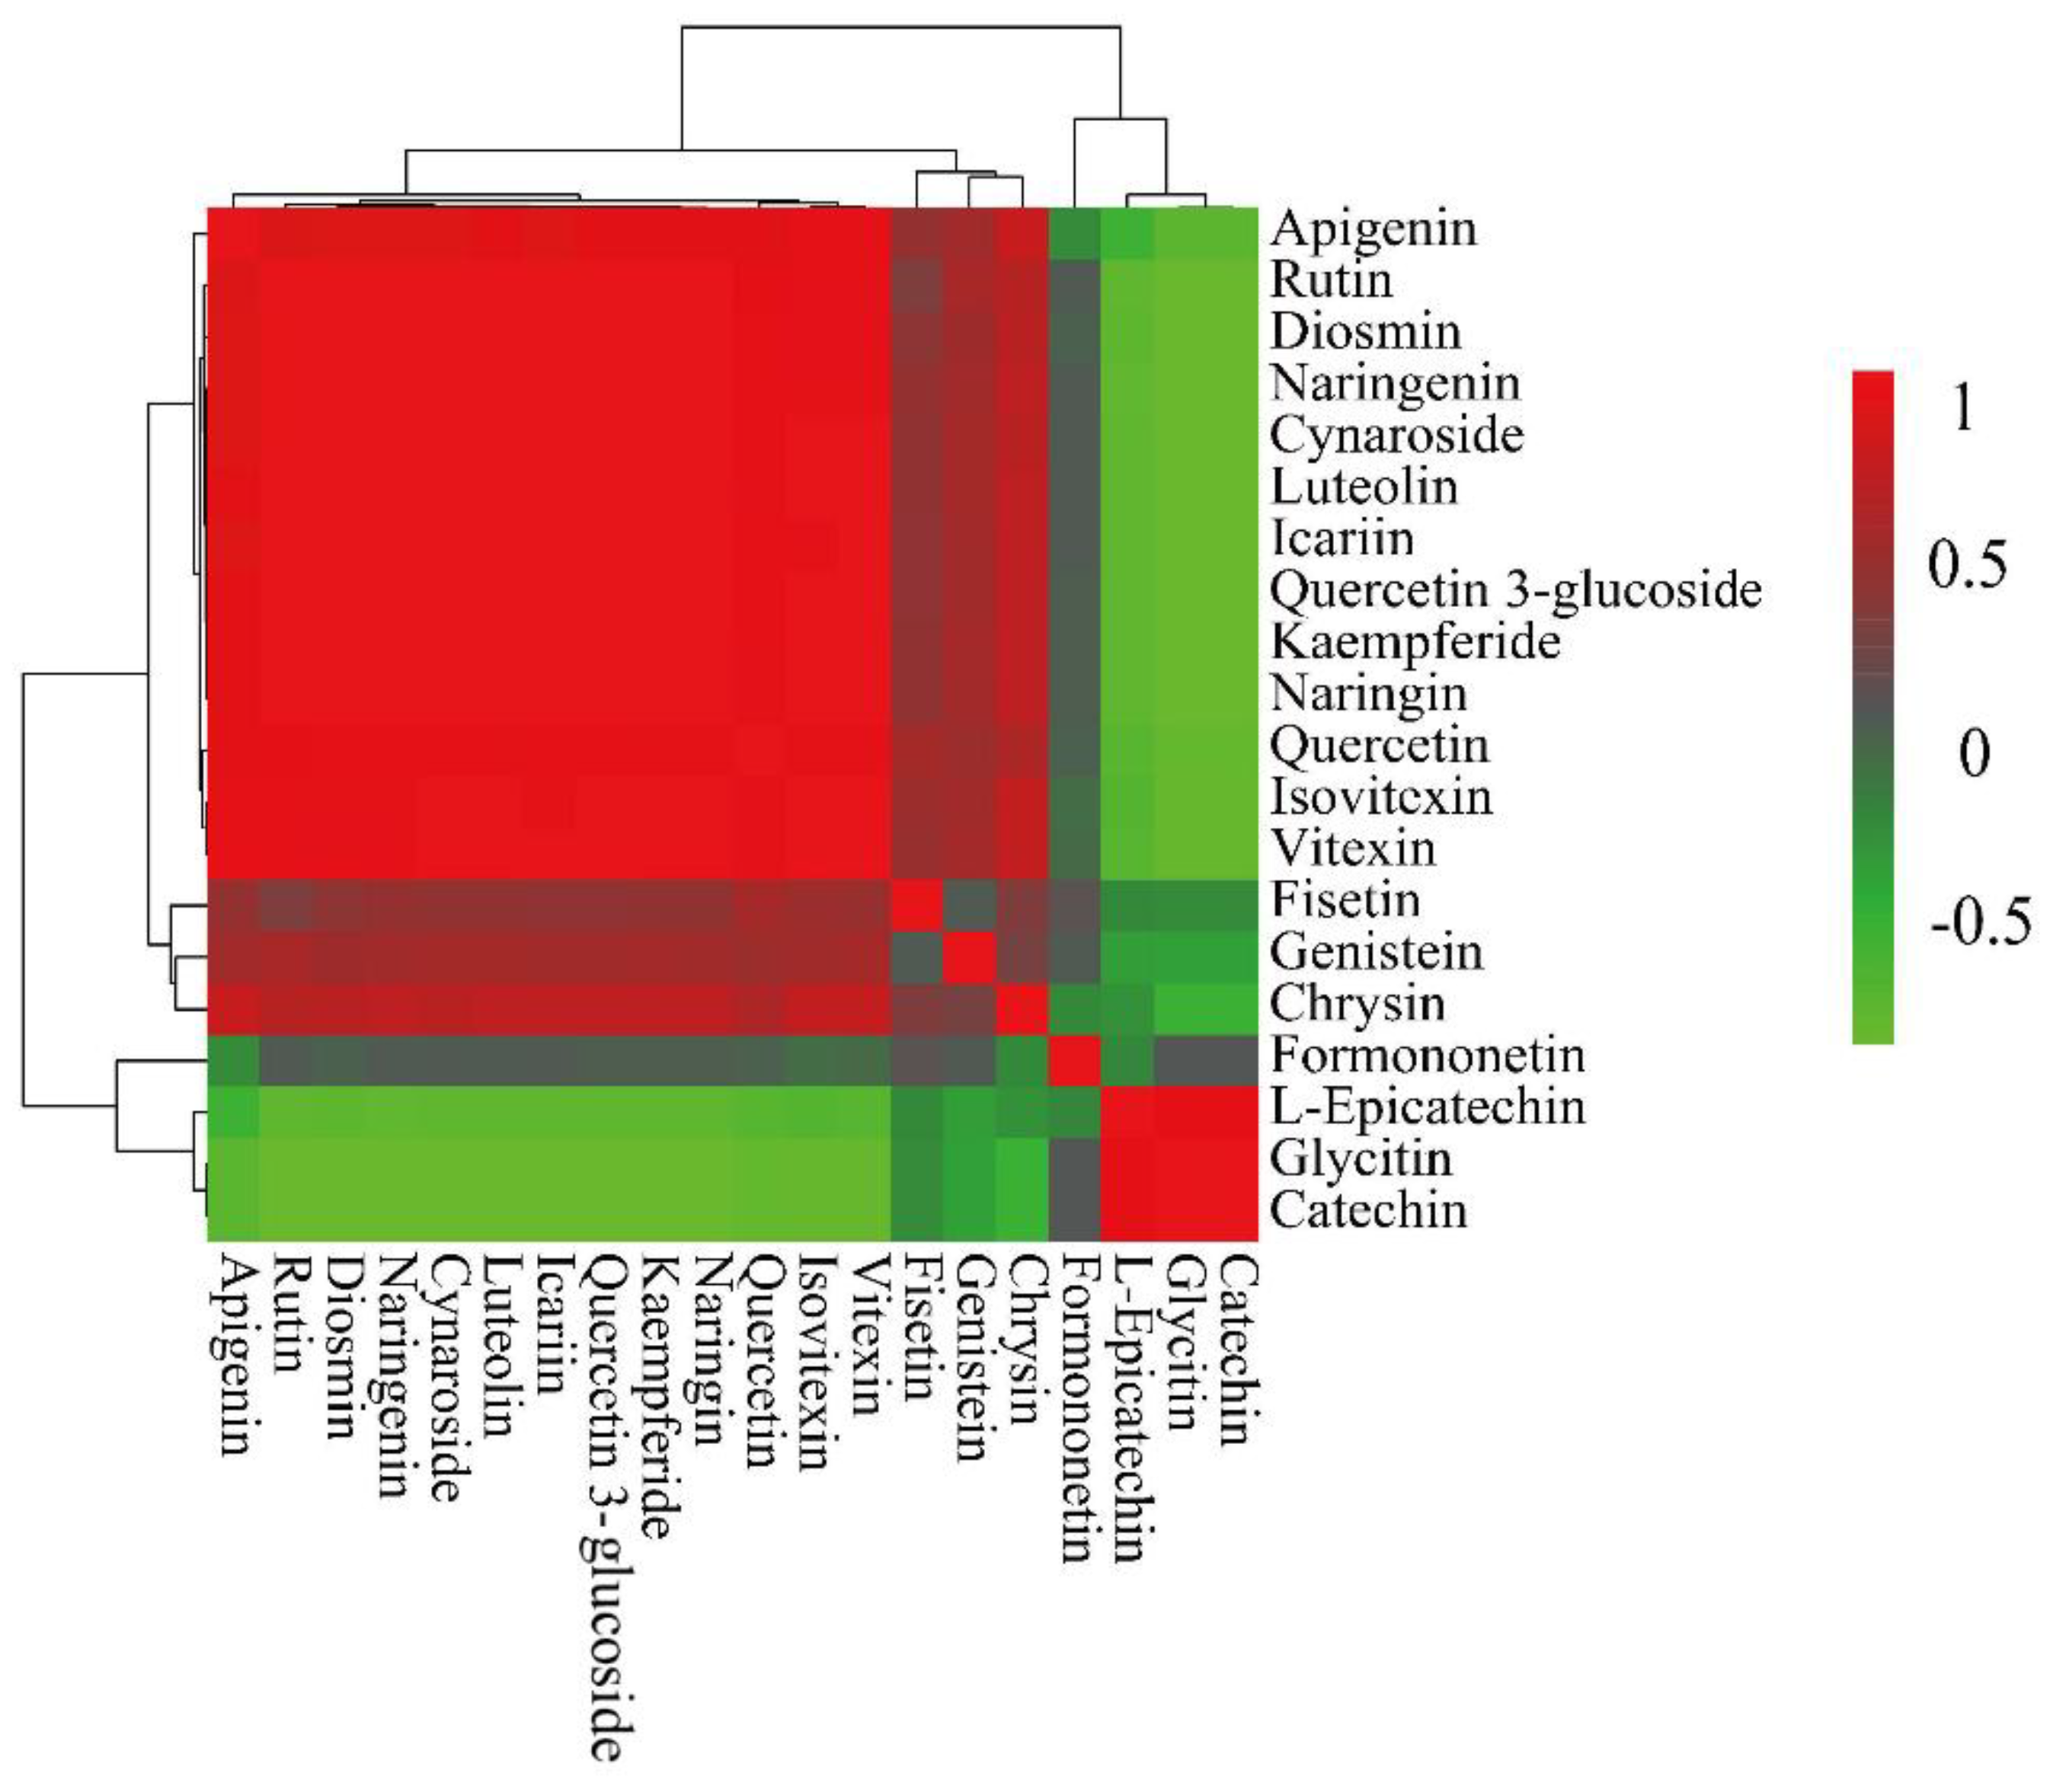

Table 1.
The homologous species of P. amarus have the same flavonoids as those found in P. amarus.
| Species name | Materials and Methods | Flavonoids of dry weight (μg/g) |
|---|---|---|
| Dendrocalamus bambusoides Mei Hua et al. [14] | Leaves; HPLC | Vitexin, Isovitexin, Orientin, and Isoorientin |
| Phyllostachys edulis Xie et al. [15] | Leaves; an efficient mechanochemical-assisted extraction | Vitexin, Isovitexin, and Isoorientin |
| Phyllostachys edulis Jianfei Zhou [16] and Chunjuan Zhang [17] | Leaves; HPLC | Vitexin, Isovitexin, Orientin, and Isoorientin |
| Bambusa surrecta Jiefeng Ding et al. [18] | Stem; HPLC | Rutin (0.162), Kaempferitrin (0.401), Hyperin (0.927), Kaempferol-3-O-β-D-glucosyl(1-2)rhamnoside (0.456), and Kaempferol (0.601) |
| Bambusa surrecta Jianfen Li et al. [19] | Stem; HPLC | Vitexin, Isovitexin, Orientin, Isoorientin, 3',5'-di-O-methyltricetin, Kaempferol, Quercetin, Luteolin - 6 - C – rutoside, Luteolin - 7 - O –glucoside, and 3',5'-di-O-methyltricetin - 7 - O –glucoside |
| Phyllostachys nigra Wuxing Sun et al. [20] | Leaves; repeated silica gel column chromatography, preparative thin-layer chromatography | 3',5'-di-O-methyltricetin,3',5'-di-O-methyltricetin - 7 - O -β- D - glucoside, Vitexin, 3',5'-di-O-methyltricetin - 7 - O - neohespeidoside, Orientin, and Isoorientin |
| Phyllostachys nigra Zhang et al. [21] | Leaves; macroporous resin adsorption–desorption separation | Vitexin, Isovitexin, Orientin, and Isoorientin |
| Dendrocalamus latiflorus Haoguo Tang et al. [22] | Leaves; nature and spectroscopy | Vitexin, Rutin, and Kaempferol |
| Bambusa textilis Rongmiao An et al. [23] | Leaves; HPLC | Vitexin (3.99), Isovitexin (122.23), Orientin (4.87), Isoorientin (78.94), and Cynaroside (17.54) |
| Phyllostachys glauca Guo et al. [24] | Leaves; HPLC | Vitexin, Isovitexin, Orientin, Isoorientin, Luteolin, and 3',5'-di-O-methyltriceti |
| Bambusa textilis$ Qi Wei et al. [25] | Leaves; HPTLC | Vitexin (10.00), Isovitexin (5.00), Orientin (10.00), Isoorientin (12.65), and 3',5'-di-O-methyltricetin (6.00) |
| Phyllostachys edulis $Dandan Chen et al. [26] | Leaves; HPLC | Vitexin (4.42), Isovitexin (22.32), Orientin (2.28), Isoorientin (14.76), and Cynaroside (2.78) |
| Indocalams Latifolius $Jian Cui et al. [27] | Leaves; HPTLC | Vitexin, Isovitexin, Orientin, Isoorientin, Quercetin, and 3',5'-di-O-methyltricetin |
| Phyllostachys reticulata$ Hongyu Li et al. [28] | Leaves; HPLC | Orientin, Isovitexin, and Isoorientin |
| Bambusa chungii, Bambusa textilis $Ting Yuan et al. [29] | Leaves; ultra-high-performance liquid chromatography | Luteolin and Apigenin |
| Bambusa textilis $Jin Wang et al. [30] | Leaves; ultraviolet spectroscopy | Vitexin, Isovitexin, Orientin, and Isoorientin |
| Bambusa pervariabilis $Sun Gu et al. [31] | Leaves; column chromatographic separations | Luteolin, Apigenin, 3',5'-di-O-methyltricetin, and Quercetin |
| Indocalams tessellatus $Hongyao Zhou et al. [32] | Leaves; HPLC | Luteolin and Quercetin |
Table 2.
Linear regression equation and limit of quantification for flavonoid standards.
| Name | Retention time (min) | Linear equation (math.) | Correlation coefficient (r) | Linear range (ng/mL) | Limit of quantification (ng/mL) |
|---|---|---|---|---|---|
| Chrysin | 18.57 | y=2.1e+005 x+1.04e+004 | 0.9919 | 0.2-100 | 0.2 |
| Daidzein | 12.27 | y= 5.47e+004x+5.37e+003 | 0.9958 | 0.8-400 | 0.8 |
| Liquiritigenin | 10.28 | y= 1.74e+005x+1.54e+004 | 0.9905 | 0.4-400 | 0.4 |
| Formononetin | 17.41 | y= 2.43e+005x+3.74e+003 | 0.9905 | 0.02-40 | 0.02 |
| Apigenin | 16.43 | y= 1.35e+005x+3.74e+003 | 0.9953 | 0.1-200 | 0.1 |
| Genistein | 14.96 | y= 5.19e+004x±238 | 0.9957 | 0.4-400 | 0.4 |
| Naringenin | 14.14 | y=1.72e+005x+1.35e+004 | 0.9951 | 0.2-200 | 0.2 |
| Glycitein | 4.85 | y= 6.6e+005x+1.35e+004 | 0.9942 | 0.2-12.5 | 0.2 |
| Biochanin A | 18.51 | y= 1.48e+006x+7.88e+003 | 0.9922 | 0.02-20 | 0.02 |
| Fisetin | 9.399 | y=1.84e+004x±5.83e+003 | 0.9907 | 0.8-4000 | 0.8 |
| Kaempferol | 16.13 | y= 2.44e+004x+4.96e+003 | 0.9943 | 2-2000 | 2 |
| Luteolin | 14.51 | y= 1.23e+005x+1.52e+004 | 0.9942 | 1-1000 | 1 |
| Catechin | 3.473 | y= 2.99e+0.03x+ 896 | 0.9945 | 2-4000 | 2 |
| L-Epicatechin | 4.11 | y= 1.65e+004x+6.04e+003 | 0.996 | 2-500 | 2 |
| Kaempferide | 18.88 | y= 2.2e+005x+239 | 0.994 | 0.1-200 | 0.1 |
| Quercetin | 13.48 | y= 7.81e+004x±1.31e+004 | 0.9945 | 1-2000 | 1 |
| Taxifolin | 5.202 | y= 2.68e+004x+3.25e+003 | 0.995 | 0.4-800 | 0.4 |
| Myricetin | 8.279 | y= 1.09e+004x±6.81e+004 | 0.991 | 10-10000 | 10 |
| Dihydromyricetin | 4.054 | y= 6.52e+0.03x + 0.419 | 0.9954 | 0.8-1600 | 0.8 |
| Puerarin | 4.17 | y= 1.31e+005x+2.01e+003 | 0.9929 | 0.2-100 | 0.2 |
| lsovitexin | 6.206 | y= 6.46e+004x+4.32e+003 | 0.9966 | 0.4-400 | 0.4 |
| Vitexin | 5.635 | y= 9.91e+004x+6.64e+003 | 0.9929 | 0.2-400 | 0.2 |
| Genistin | 7.564 | y= 1.51e+005x+1.39e+004 | 0.9914 | 0.4-400 | 0.4 |
| Baicalin | 12.6 | y= 1.38e+004x±2.29e+003 | 0.9947 | 2-10000 | 2 |
| Glycitin | 4.825 | y = 196x + 648 | 0.9923 | 20-5000 | 20 |
| Astragalin | 9.293 | y= 6.62e+004x+6.26e+003 | 0.9931 | 0.5-1000 | 0.5 |
| Quercitrin | 9.062 | y= 5.18e+004x+1.93e+003 | 0.9973 | 0.5-1000 | 0.5 |
| Cynaroside | 6.365 | y= 6.72e+004x+1.93e+003 | 0.9952 | 0.4-800 | 0.4 |
| Daidzin | 4.612 | y= 3.29e+004x+ 885 | 0.9909 | 0.5-1000 | 0.5 |
| Quercetin 3-glucoside | 6.797 | y= 7.11e+0.04x+7.24e+003 | 0.9917 | 0.5-1000 | 0.5 |
| Silybin | 15.08 | y= 5.58e+004x+5.04e+003 | 0.9915 | 0.5-1000 | 0.5 |
| Leariin | 17.35 | y= 1.67e+004x+1.74e+003 | 0.993 | 1-1000 | 1 |
| Naringin | 7.417 | y= 3.58e+004x+7.59e+003 | 0.9915 | 1-2000 | 1 |
| Diosmin | 9.572 | y= 7.99e+004x+6.1e+003 | 0.9916 | 0.4-800 | 0.4 |
| Rutin | 6.688 | y= 3.9e+004x+3.55e+003 | 0.9965 | 1-1000 | 1 |
Table 3.
Stability of flavonoids in QC samples.
| Number | Flavonoids | RSD% |
|---|---|---|
| 1 | Chrysin | 2.9524 |
| 2 | Daidzein | 1.3886 |
| 3 | Liquiritigenin | 1.9186 |
| 4 | Formononetin | 0.8529 |
| 5 | Apigenin | 0.8258 |
| 6 | Genistein | 2.2615 |
| 7 | Naringenin | 3.5393 |
| 8 | Glycitein | 1.4077 |
| 9 | Biochanin A | 2.5031 |
| 10 | Fisetin | 0.8905 |
| 11 | Kaempferol | 1.2342 |
| 12 | Luteolin | 3.6766 |
| 13 | Catechin | 2.1821 |
| 14 | L-Epicatechin | 1.9818 |
| 15 | Kaempferide | 4.6315 |
| 16 | Quercetin | 2.3907 |
| 17 | Taxifolin | 1.0088 |
| 18 | Myricetin | 1.9631 |
| 19 | Dihydromyricetin | 1.8401 |
| 20 | Puerarin | 1.6731 |
| 21 | lsovitexin | 1.6845 |
| 22 | Vitexin | 1.0481 |
| 23 | Genistin | 2.8451 |
| 24 | Baicalin | 4.1295 |
| 25 | Glycitin | 2.6372 |
| 26 | Astragalin | 3.5077 |
| 27 | Quercitrin | 3.4076 |
| 28 | Cynaroside | 1.7142 |
| 29 | Daidzin | 1.8017 |
| 30 | Quercetin 3-glucoside | 1.9121 |
| 31 | Silybin | 1.461 |
| 32 | Icariin | 1.3189 |
| 33 | Naringin | 2.3597 |
| 34 | Diosmin | 2.5593 |
| 35 | Rutin | 2.2953 |
Disclaimer/Publisher’s Note: The statements, opinions and data contained in all publications are solely those of the individual author(s) and contributor(s) and not of MDPI and/or the editor(s). MDPI and/or the editor(s) disclaim responsibility for any injury to people or property resulting from any ideas, methods, instructions or products referred to in the content. |
© 2025 by the authors. Licensee MDPI, Basel, Switzerland. This article is an open access article distributed under the terms and conditions of the Creative Commons Attribution (CC BY) license (http://creativecommons.org/licenses/by/4.0/).
Copyright: This open access article is published under a Creative Commons CC BY 4.0 license, which permit the free download, distribution, and reuse, provided that the author and preprint are cited in any reuse.


