Submitted:
23 May 2025
Posted:
27 May 2025
You are already at the latest version
Abstract
This paper proposes a user risk classification model that combines dynamic graph neural networks with a self-supervised pretraining mechanism. The model is designed to address the dual challenges of dynamic user behavior and label scarcity in financial scenarios. First, a time-series graph is constructed to represent user transaction behaviors across different time slices. A dynamic graph convolution module is then applied to extract evolutionary features. Next, a node-level contrastive self-supervised task is designed. By constructing positive and negative node pairs, the model adaptively optimizes the representation space. This enhances the discriminative power of node embeddings during the unsupervised stage. Finally, the pretrained node representations are fed into a multi-layer perceptron for the downstream risk classification task. An empirical analysis is conducted on a publicly available credit card fraud detection dataset. The results show that the proposed model outperforms existing dynamic graph models in terms of accuracy, recall, and F1-score. It demonstrates a stronger ability in identifying high-risk user behavior, validating the effectiveness and robustness of the approach.
Keywords:
dynamic graph neural network
; self-supervised learning
; contrastive learning
1. Introduction
With the continuous advancement of global financial digitalization, credit cards—one of the most frequently used financial service tools—have placed user risk assessment at the core of financial risk control systems [1]. Credit card user behavior data is highly dynamic and complex. Traditional static modeling methods show clear limitations in capturing changes in user risk and fail to reflect the evolution of risk status effectively. Meanwhile, with the rapid growth of user volume and transaction scale, financial institutions urgently need more generalizable and robust classification models. These models are crucial for improving risk control efficiency and reducing economic losses caused by fraudulent activities. Therefore, exploring more flexible and expressive risk modeling approaches holds both theoretical significance and practical value [2].
In recent years, Graph Neural Networks (GNNs) have achieved remarkable success in domains such as social network analysis, recommendation systems, and financial graph modeling, owing to their ability to handle non-Euclidean structured data. However, most existing studies focus on static graph structures and neglect the fact that user behaviors and their relationships evolve over time. In financial risk modeling scenarios, credit status, transaction behavior, and interactions among users exhibit strong temporal dynamics. Dynamic Graph Neural Networks (DGNNs) incorporate the time dimension and can capture hidden patterns in the evolution of node attributes and graph structures. This makes them more expressive and particularly suited to modeling temporal changes and behavioral dependencies in user risk. Introducing DGNNs into credit card user risk modeling is expected to improve the model's ability to represent latent risk features and enhance classification performance [3].
On the other hand, current financial risk control models heavily rely on large volumes of labeled training data. In practice, obtaining high-quality risk labels is costly and inefficient, especially when user historical data is incomplete or subject to latency. Self-supervised learning provides a promising solution. It learns data representations without requiring manual labels by designing pretext tasks. Through pretraining on unlabeled data, models can learn general and semantically rich representations. These representations offer good initialization for downstream classification tasks and help alleviate the challenge of label scarcity. When combined with dynamic graph structures, the self-supervised mechanism can extract latent relational features and structural evolution patterns while preserving temporal dynamics. This provides more informative support for risk modeling.
Overall, DGNNs and self-supervised learning are highly complementary in modeling dynamic structured data and enhancing representational capacity. Their integration in credit card user risk modeling can leverage temporal behavioral information to sensitively track changes in risk trends. At the same time, self-supervised pretraining improves the model's initial representation and downstream performance even under limited label conditions. This fusion paradigm enhances both the accuracy and robustness of risk identification. It also provides a more forward-looking modeling tool for risk management in high-frequency financial scenarios [4,5].
This study focuses on building a user risk classification model that integrates DGNNs with a self-supervised pretraining mechanism. The goal is to improve the timeliness and accuracy of credit card user risk identification. The model aims to provide financial institutions with a more intelligent, interpretable, and scalable solution for risk monitoring and management in complex environments. The research not only holds theoretical importance but also offers practical insights and technical support for modeling dynamic financial graphs, designing self-supervised learning mechanisms, and applying them in real-world scenarios.
2. Method
This study uses dynamic graph neural networks as the basis to construct a time series graph modeling framework for credit card user risk identification. The overall model architecture is shown in Figure 1.
As shown in Figure 1, the overall architecture of the model proposed in this paper combines dynamic graph neural networks with self-supervised pre-training mechanisms to achieve accurate identification of credit card user risks. The model first constructs the user's behavior at different times into a dynamic graph sequence, and extracts the temporal structure features through the dynamic graph convolution module to obtain the node representation vector. Subsequently, the self-supervised pre-training task is designed using a contrastive learning strategy to maximize the representation similarity of the same node at different times or perspectives, and generate a contrastive loss function to enhance the representation ability. After the pre-training is completed, the node embedding will be input into the downstream discrimination module, and risk classification prediction will be performed through a multi-layer perceptron (MLP) to achieve the final user risk discrimination goal. This method combines the temporal structure perception ability of dynamic graphs with the representation generalization ability of self-supervised learning, providing an effective modeling paradigm for financial risk modeling.
Assume that the entire credit card transaction system can be modeled as a series of time-evolving graphs in time interval , where represents the user set at time t, represents the relationship edge between users, and represents node attributes, such as the user's transaction amount, transaction time, transaction category and other behavioral characteristics. In order to capture the evolution of the graph structure over time, a graph-level temporal encoding mechanism is introduced, and the features of the graph data of continuous time slices are extracted through a dynamic graph convolution unit. The update formula is:
Where represents the node embedding representation at time t, is the adjacency matrix of the graph, W and U are trainable weight matrices, and is a nonlinear activation function. This dynamic propagation mechanism allows the model to capture static structural features while integrating evolutionary signals in the time series to obtain a more timely risk representation.
In order to alleviate the problem of label scarcity and improve the generalization ability of the model, this study introduces a self-supervised pre-training strategy and designs a graph structure-aware pre-training task. Specifically, the structural perturbation and time-series slicing of the dynamic graph are used to generate positive and negative sample pairs, and pre-training is performed through a contrastive learning loss function. Let represent the embedding vector of node i at time t, is its positive sample (such as adjacent time slices or similar structure nodes), and is the negative sample. The self-supervised contrast loss function is defined as:
Where represents the cosine similarity function, is the temperature parameter, and is the number of negative samples. By minimizing this loss, the model can learn the potential structural similarity between node representations under unsupervised conditions, thereby improving the initial representation ability and stability of subsequent discrimination tasks.
After the pre-training is completed, the obtained node embedding is input into the downstream discriminant model for user risk classification. Specifically, a multi-layer perceptron is introduced as a risk prediction module, and the output is defined as:
Where represents the risk prediction result of node i. The final training objective function is composed of the discriminant loss and the self-supervision loss, which is defined as:
is the cross entropy loss, which measures the deviation between the predicted result and the true label, and is the balance coefficient, which is used to adjust the weight of the supervised and self-supervised losses. This fusion modeling strategy not only retains the information expression ability of dynamic graph structure changes, but also effectively utilizes the potential semantic information contained in a large amount of unlabeled data, thereby improving the discriminative performance and stability of the overall model.
3. Experiment
3.1. Datasets
The experimental dataset used in this study is the publicly available “Credit Card Fraud Detection” dataset from Kaggle. It contains real credit card transaction records provided by a European financial institution. The dataset includes 284,807 transactions over a two-day period. Among them, 492 are confirmed fraud cases, while the rest are legitimate transactions. The dataset is highly imbalanced, with fraudulent transactions accounting for only 0.172%. This poses a challenge for risk identification models but also offers a valuable benchmark for evaluating model performance under sparse risk conditions.
The dataset used in this study contains a total of 31 features. Among them, the first 28 features are anonymized variables obtained through Principal Component Analysis (PCA), a dimensionality reduction technique applied to protect sensitive user information while retaining key variance components. The remaining three features include the timestamp of each transaction, the transaction amount, and the label field indicating the transaction class. Specifically, the “Class” field is a binary variable, where the value of 1 denotes a confirmed fraudulent transaction, while 0 corresponds to a legitimate, non-fraudulent transaction. Although the majority of the features have been anonymized, the dataset preserves essential properties relevant to temporal behavior analysis, such as the sequential structure of transactions and the associated transaction amount information. These preserved aspects of the data make it suitable for use in a dynamic graph-based modeling framework, where temporal dependencies and behavior evolution play a critical role in accurately identifying risk.
To align the data with the modeling requirements of dynamic graph neural networks, the raw transaction records are first organized chronologically. Based on this temporal ordering, user transaction graphs are constructed within consecutive, non-overlapping time windows. In each time slice, nodes in the graph represent users who were active during that period, while edges are established between nodes by measuring behavioral or attribute-based similarities across their transactions, such as amount, frequency, or transaction type proximity. This edge construction allows for dynamic associations between users to be captured effectively. By comparing the structure of graphs and the changes in node representations across sequential time slices, the model can effectively capture the evolving nature of user risk. This temporal sensitivity is essential for detecting shifts in user behavior that may indicate an increased likelihood of fraudulent activity, thereby enhancing the model's capability to identify and track dynamic patterns of financial risk over time.
3.2. Experimental Results
This paper first gives the comparative test results of the model in this paper and other models. The experimental results are shown in Table 1.
As shown in Table 1, the proposed model outperforms other dynamic graph modeling methods across all evaluation metrics, demonstrating strong classification ability and effective risk identification. In terms of accuracy (Acc), the model achieves 0.987, which is significantly higher than the second-best GCN-GRU (0.975) and DySAT (0.936). This indicates that the model has a clear advantage in overall risk detection accuracy.
The model also performs well in recall, reaching 0.962, outperforming all other methods. It shows stronger sensitivity in identifying high-risk samples. The improvement in recall suggests that the model is effective in reducing missed detections, making it suitable for credit card scenarios with strict risk control requirements. In contrast, although DySAT incorporates a self-attention mechanism in its architecture, its recall (0.872) remains lower than that of the proposed method. This highlights the advantage of combining temporal modeling with self-supervised strategies in dynamic graphs for this task.
F1-score, as a balanced metric between precision and recall, further confirms the effectiveness of the proposed model. It reaches 0.914, the highest among all compared methods. This demonstrates that the model maintains strong overall performance under imbalanced data conditions. The results show that integrating dynamic graph neural networks with a self-supervised pretraining framework effectively captures temporal dynamics and structural information. By enhancing representation learning, the model improves risk discrimination capability and shows good generalization and application potential.
Furthermore, this paper gives the impact of different time window division strategies on the dynamic graph modeling effect, and the experimental results are shown in Figure 2.
As observed in Figure 2, different time window segmentation strategies have a significant impact on the performance of dynamic graph modeling. When using a 1-hour time window, the model achieves peak values across all three evaluation metrics: accuracy (0.987), recall (0.962), and F1-score (0.914). This indicates that this temporal granularity strikes a good balance between temporal dependency and structural stability in modeling graph evolution and behavioral features. As a result, it enhances the model's ability to identify risk.
As the time window increases gradually from 5 minutes to 1 hour, model performance shows an overall upward trend. This may be because overly short time windows result in sparse graph structures, making it difficult for graph neural networks to capture higher-order relationships between nodes. In contrast, longer time windows allow the accumulation of more transaction data, leading to more complete dynamic graphs. This improves both the model's representational capacity and classification accuracy.
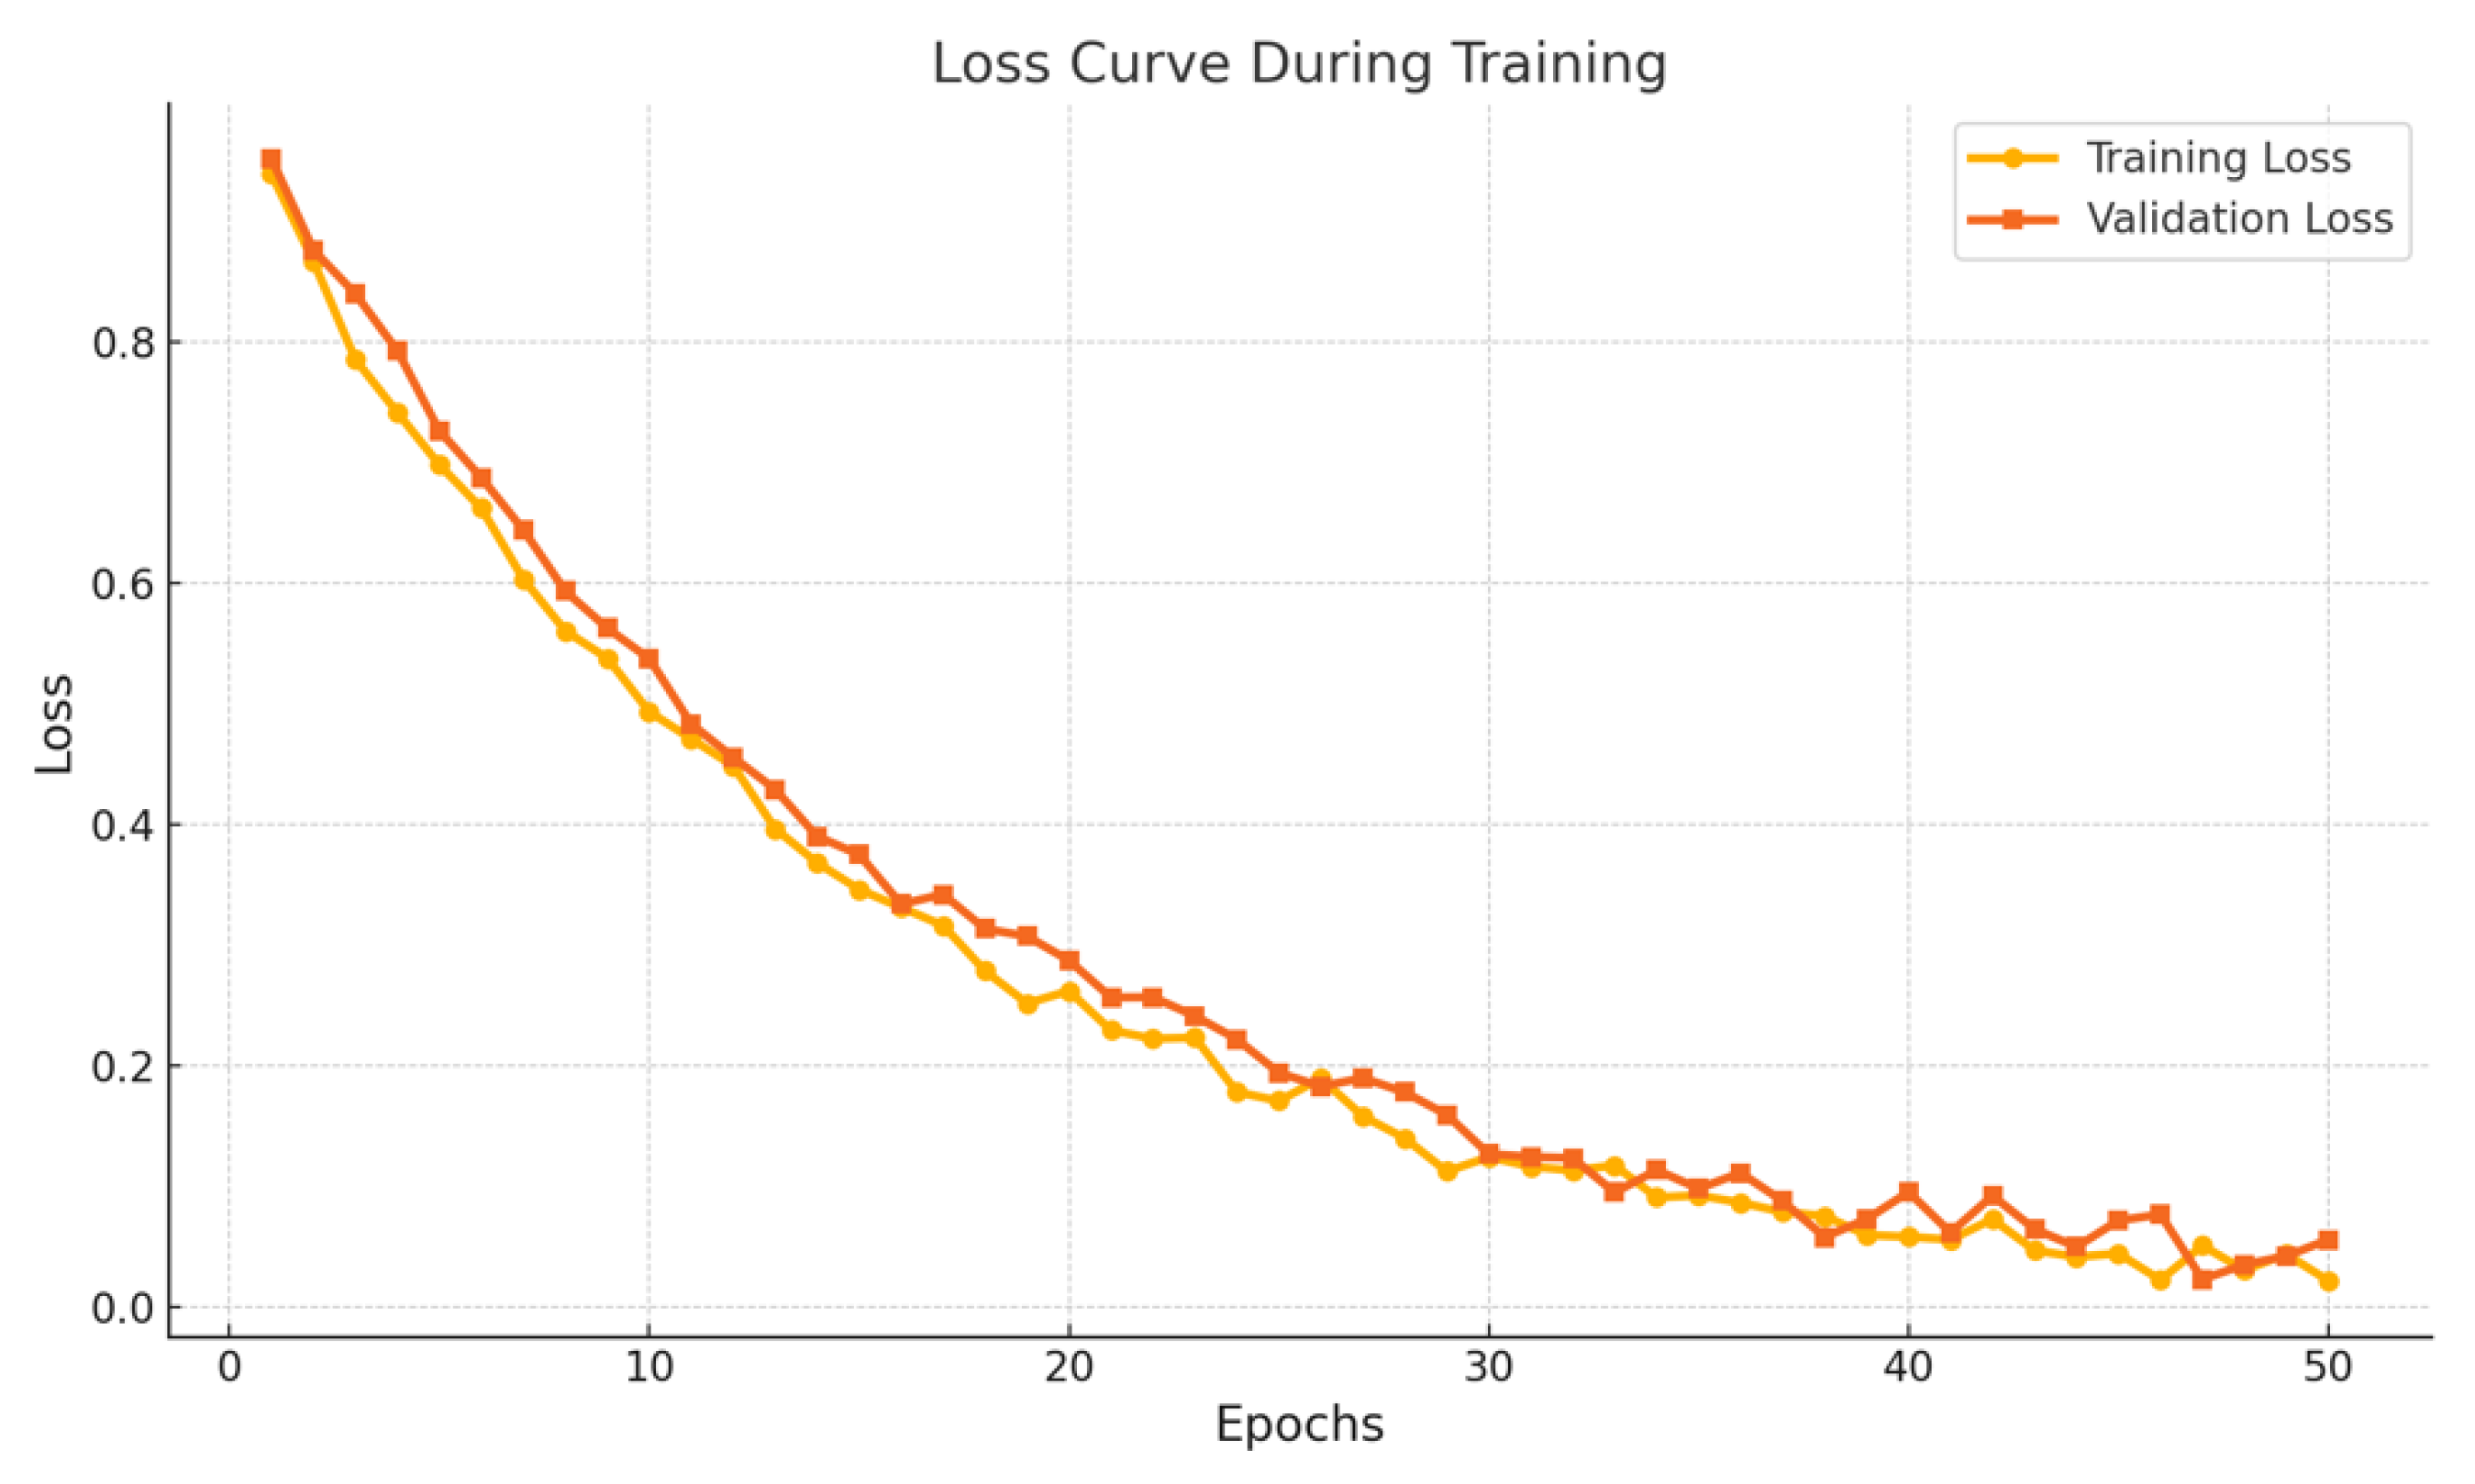
However, when the time window is further extended to 2 hours and 4 hours, the model’s performance begins to decline, especially in recall and F1-score. This performance drop may suggest that overly long aggregation intervals dilute the temporal resolution, resulting in delayed response to changes in user behavior. In the 4-hour case, the risk signal becomes less timely, which can hinder the early detection of fraudulent activity and lead to longer identification delays. Finally, this paper gives a loss function drop graph, as shown in Figure 3.
As shown in Figure 3, the model demonstrates good convergence and stability during training. Both the training loss and validation loss follow a consistent and smooth downward trend. This indicates that the model effectively learns deep relational features within the dynamic graph structure through iterative optimization. The two curves remain close throughout the training process, with no signs of significant overfitting or underfitting. This suggests that the model generalizes well between the training and validation sets.
It is worth noting that during the first 20 epochs, the loss decreases rapidly, indicating high learning efficiency in the early phase. In the later stages, the loss curves gradually stabilize, suggesting that the model has reached convergence. This result confirms the effectiveness of the proposed self-supervised pretraining strategy and dynamic graph modeling framework in optimizing risk classification tasks with stable training performance.
4. Conclusion
This study addresses the task of credit card user risk modeling by proposing a classification model that integrates dynamic graph neural networks with a self-supervised pretraining mechanism. The goal is to enhance risk identification under highly dynamic and sparse data conditions. By constructing time-series graph structures and introducing a contrastive learning strategy, the model captures deep temporal features of user behavior evolution. It also enables the learning of discriminative representations without labeled data, overcoming the limitations of traditional supervised learning in financial risk control scenarios.
Experimental results show that the proposed method outperforms existing dynamic graph modeling approaches across multiple evaluation metrics, with significant improvements in accuracy and recall. An analysis of different time window segmentation strategies further confirms the critical role of temporal granularity in dynamic graph-based risk classification. In addition, the continuous decline of the loss function during training indicates good convergence and stability, providing both theoretical and empirical support for the model's practicality. The proposed framework offers flexibility and scalability, making it applicable to various dynamic graph scenarios, including financial transaction graphs and social behavior graphs. It provides new insights into applying graph neural networks to financial risk control. The introduction of the self-supervised pretraining mechanism enhances model robustness and generalization. It maintains strong performance even under highly imbalanced data conditions, demonstrating promising application potential. Future research may further explore hierarchical and multimodal aspects of graph structure modeling [9]. For example, heterogeneous graph neural networks could be introduced to integrate multi-source data [10], or graph attention mechanisms could be employed to improve the precision of local risk behavior identification [11]. More complex self-supervised task designs and incremental learning strategies could also be investigated to meet the demands of real-time and evolving risk detection. These directions lay a foundation for building intelligent and high-precision financial risk control systems.
References
- Zhang, Xin, et al. "Robust Graph Neural Networks for Stability Analysis in Dynamic Networks." 2024 3rd International Conference on Cloud Computing, Big Data Application and Software Engineering (CBASE). IEEE, 2024.
- Duan, Yifan, et al. Cat-gnn: Enhancing credit card fraud detection via causal temporal graph neural networks. arXiv preprint. arXiv:2402.14708 (2024).
- Tang, Hao, et al. "Enabling graph neural networks for semi-supervised risk prediction in online credit loan services." ACM Transactions on Intelligent Systems and Technology 15.1 (2024): 1-24.
- Shi, Yong, et al. "Improved credit risk prediction based on an integrated graph representation learning approach with graph transformation." European Journal of Operational Research 315.2 (2024): 786-801.
- Zhu, Yuhao, and Desheng Wu. "P2P credit risk management with KG-GNN: A knowledge graph and graph neural network-based approach." Journal of the Operational Research Society (2024): 1-15.
- Wan, Fei, and Ping Li. "A novel money laundering prediction model based on a dynamic graph convolutional neural network and long short-term memory." Symmetry 16.3 (2024): 378.
- Zhang, Jia-wei, et al. "Credit Risk Evaluating Framework with Heterogeneous Information: Integrating Three-Way Decision and Graph-Sage." Wen-hui and Wang, Xiao-kang and Wang, Ya-nan, Credit Risk Evaluating Framework with Heterogeneous Information: Integrating Three-Way Decision and Graph-Sage.
- Wang, Cheng. "Associations Dynamic Evolution: Evolving Graph Transformer." Anti-Fraud Engineering for Digital Finance: Behavioral Modeling Paradigm. Singapore: Springer Nature Singapore, 2023. 189-207.
- Lin, Z., Liang, B., Long, Y., Dang, Y., Yang, M., Zhang, M., & Xu, R. (2022, October). Modeling intra-and inter-modal relations: Hierarchical graph contrastive learning for multimodal sentiment analysis. In Proceedings of the 29th international conference on computational linguistics (Vol. 29, No. 1, pp. 7124-7135). Association for Computational Linguistics.
- Li, X., Wang, J., Tan, J., Ji, S., & Jia, H. (2022). A graph neural network-based stock forecasting method utilizing multi-source heterogeneous data fusion. Multimedia tools and applications, 81(30), 43753-43775.
- Liu, X., Li, Y., Dai, C., & Zhang, H. (2024). A hierarchical attention-based feature selection and fusion method for credit risk assessment. Future Generation Computer Systems, 160, 537-546.
Figure 1.
Overall model architecture.
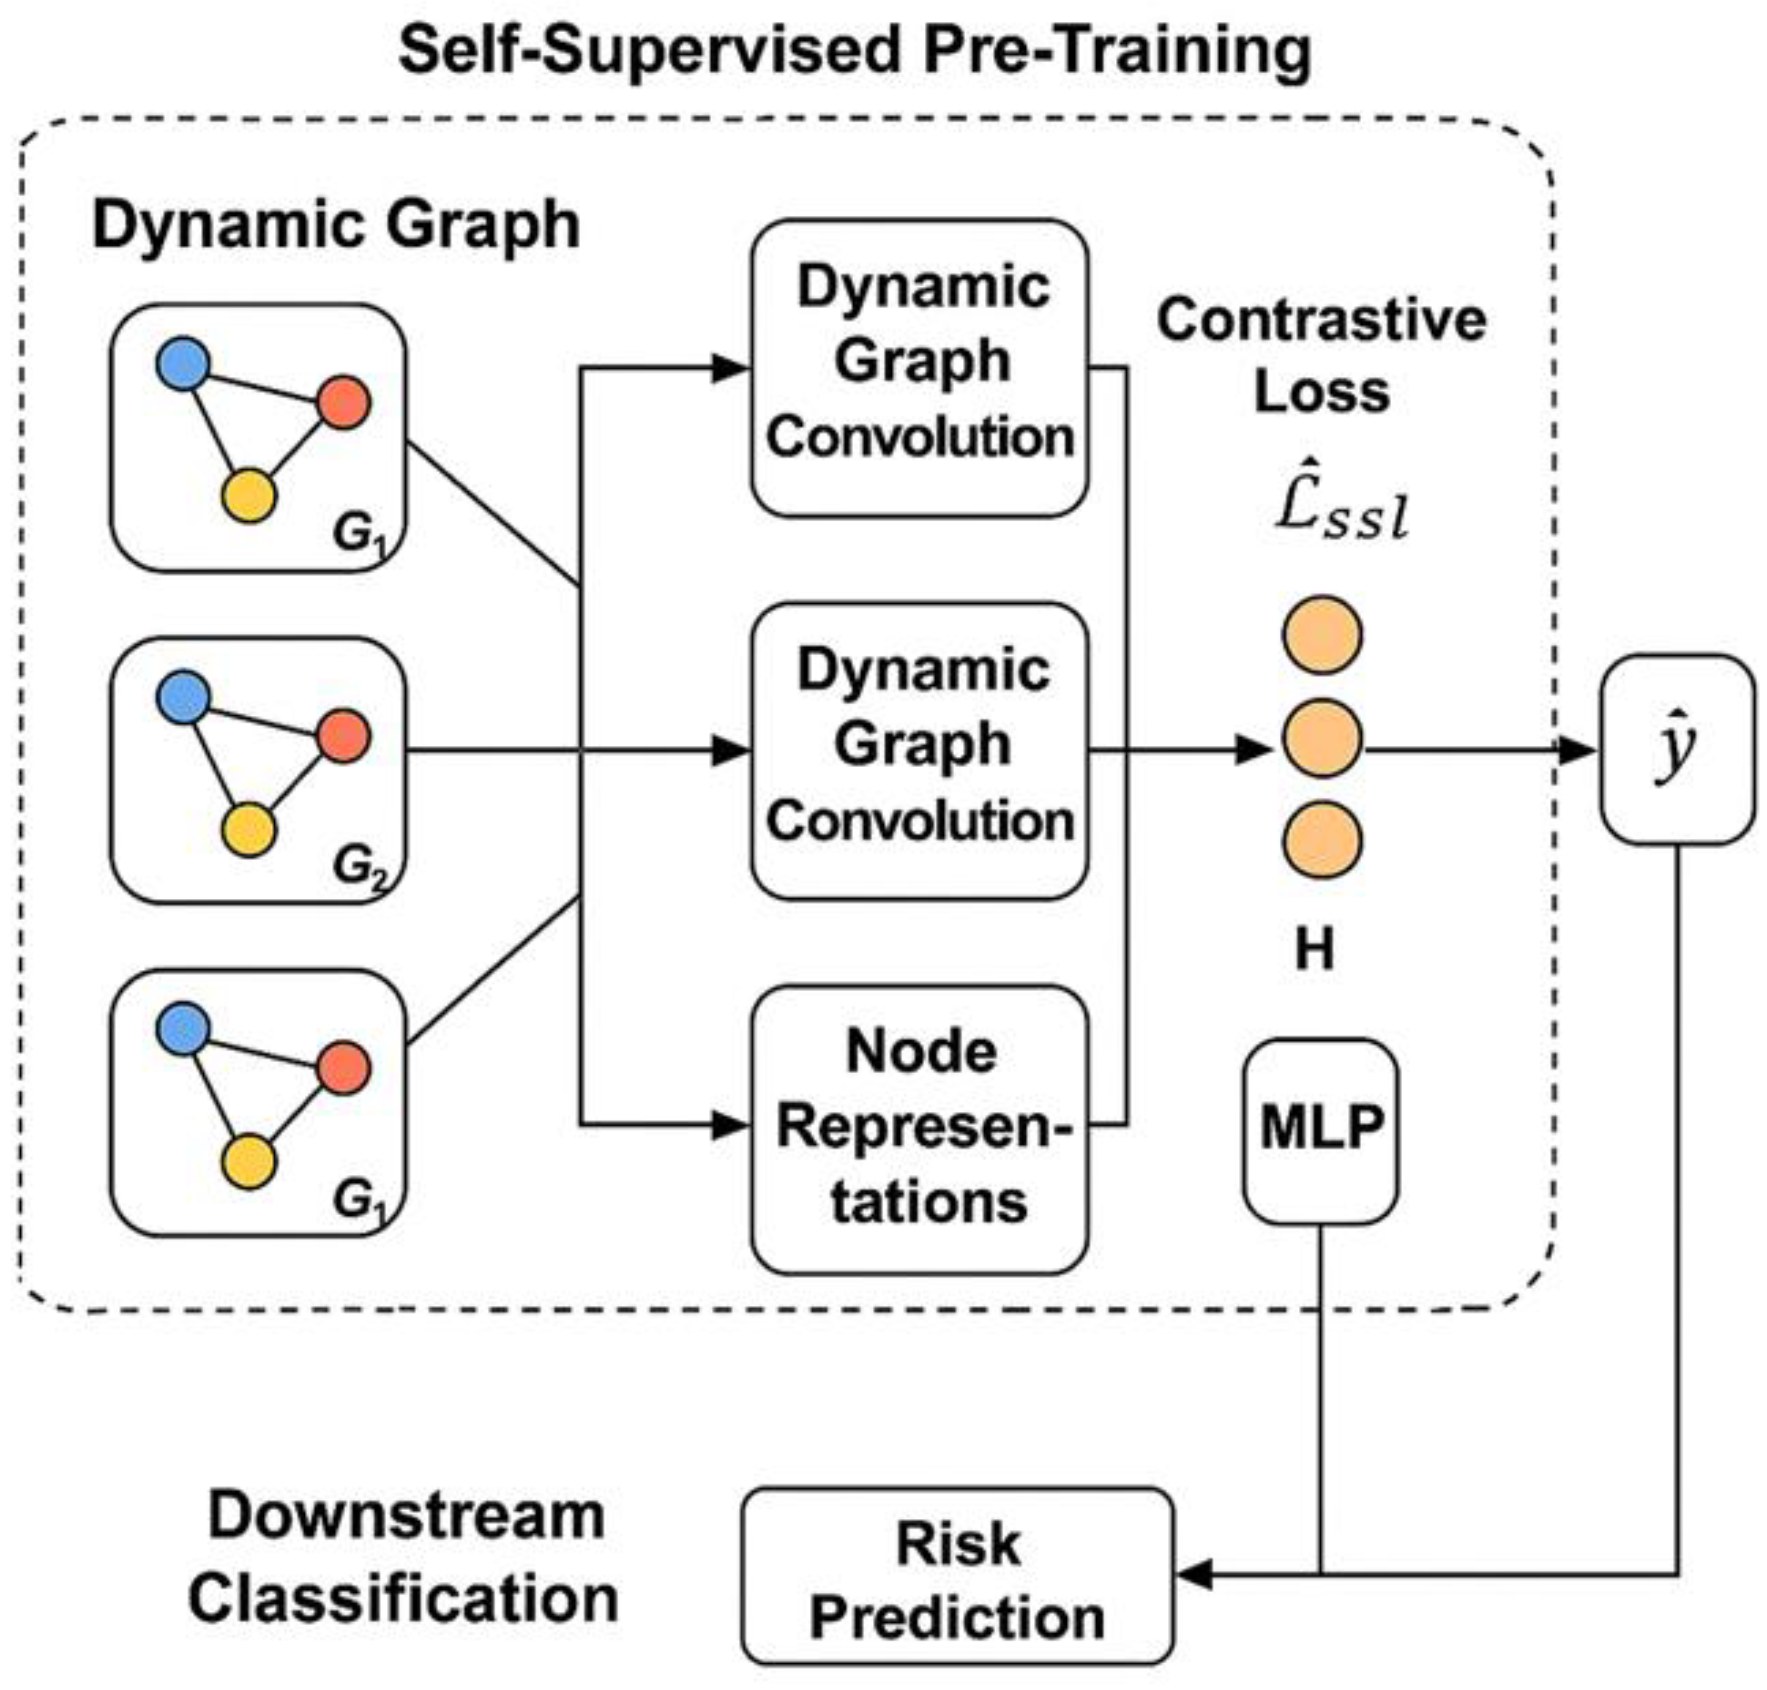
Figure 2.
The impact of different time window division strategies on dynamic graph modeling.
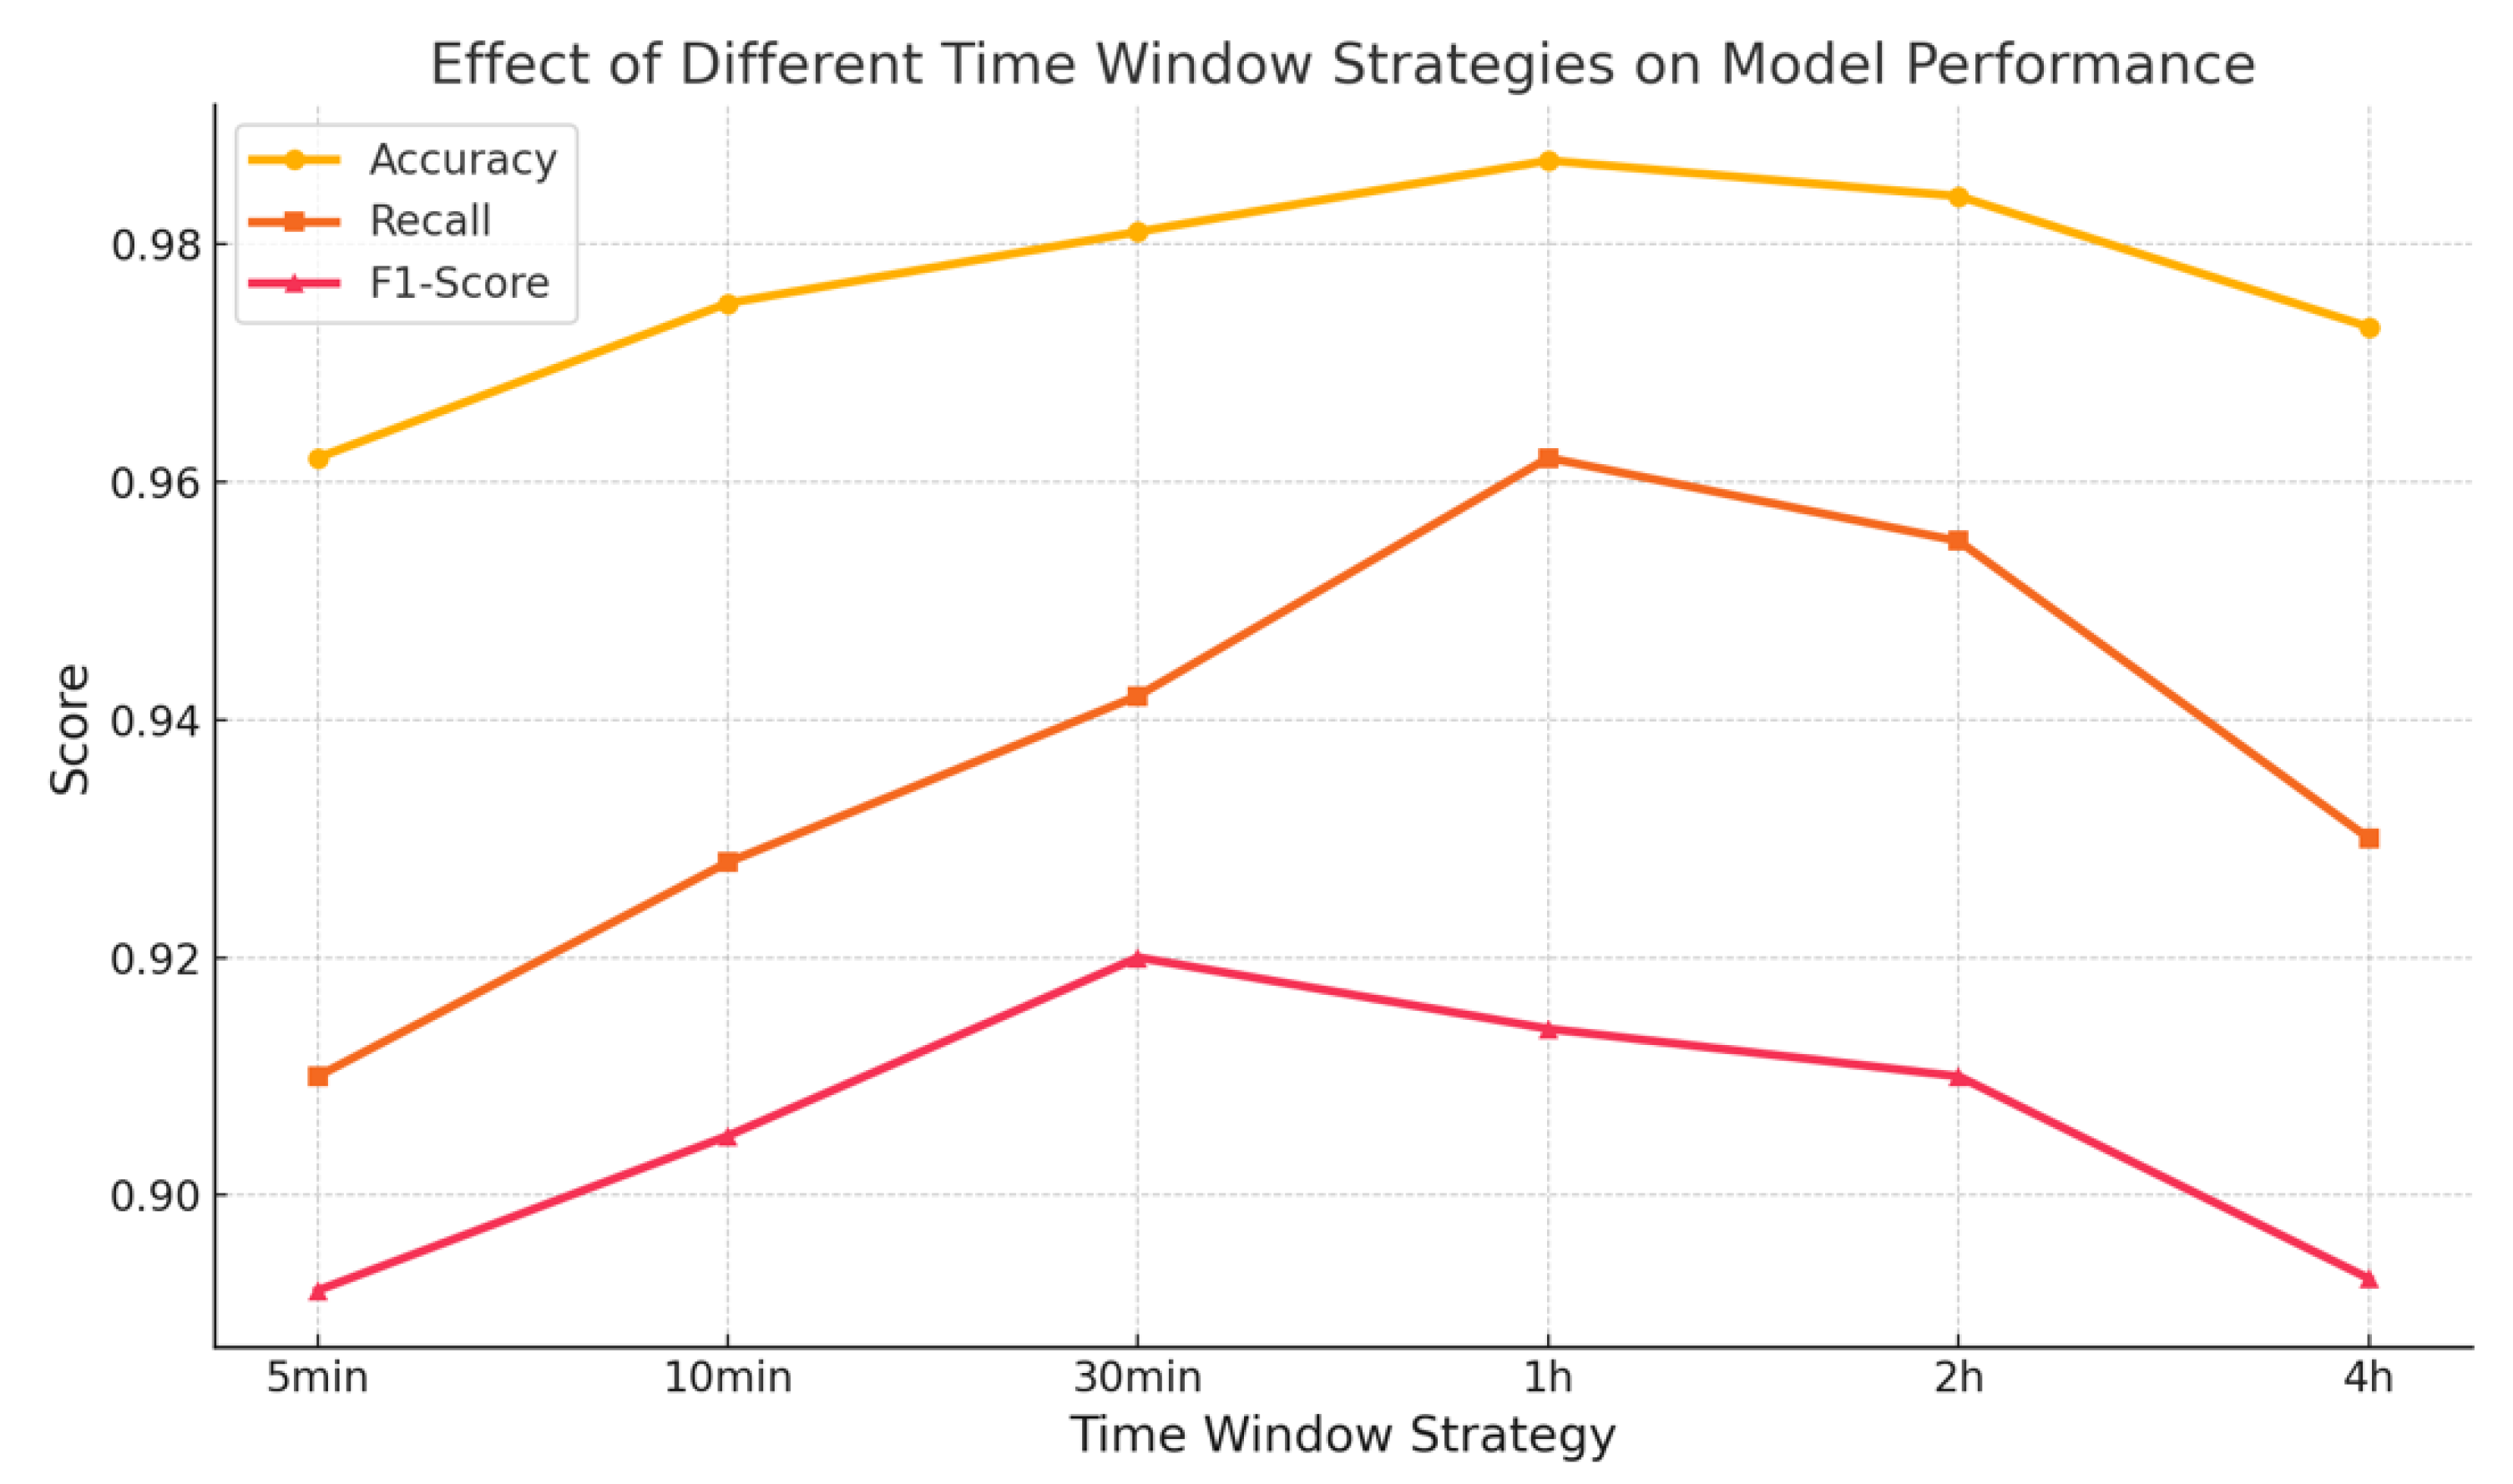
Figure 3.
Loss function drop graph.

Disclaimer/Publisher’s Note: The statements, opinions and data contained in all publications are solely those of the individual author(s) and contributor(s) and not of MDPI and/or the editor(s). MDPI and/or the editor(s) disclaim responsibility for any injury to people or property resulting from any ideas, methods, instructions or products referred to in the content. |
© 2025 by the authors. Licensee MDPI, Basel, Switzerland. This article is an open access article distributed under the terms and conditions of the Creative Commons Attribution (CC BY) license (http://creativecommons.org/licenses/by/4.0/).
Copyright: This open access article is published under a Creative Commons CC BY 4.0 license, which permit the free download, distribution, and reuse, provided that the author and preprint are cited in any reuse.


