Submitted:
21 May 2025
Posted:
22 May 2025
You are already at the latest version
Abstract
Rheumatoid Arthritis (RA) is a complex autoimmune disease and early prediction is important for clinical intervention. Nevertheless, existing works have limitations in terms of accuracy and generalization. In this study, we developed an AI-optimized biostatistical model (AIOBM) for accurate prediction risk of RA. The model is a classic Cox proportional hazard model and logistic regression architecture, supplemented by deep learning architecture with a multilayer transformation module, as well as a GNN to model the potential biological correlation of feature network among patients and attention mechanism to select key factors. At the optimization level, we formulated a new learning problem and developed a multi-objective evolutionary algorithm to optimize the joint accuracy and interpretability of a model, encode biostatistical priors as regularization terms into the learning objective so as to drive the model to learn decision paths consistent with medical principles. The whole model is comprised of four modules: feature embedding module (dealing with the multi-modal medical data), cross-representation module (leveraging the Transformer to discover the interaction patterns), GNN inference module, and risk prediction module, constituting a hybrid system with high interpretability and stable predictions. experimental results demonstrate that AIOBM outperforms the state-of-the-art algorithms for real clinical RA data.
Keywords:
rheumatoid arthritis
; risk prediction
; biostatistical modeling
; graph neural network
; multi-objective optimization
1. Introduction
Rheumatoid Arthritis (RA) is a frequently occurring chronic autoimmune disease, and it is characterized by chronic inflammation of the synovium, where irreversible damage to joint cartilage and bone structures leads to dysfunction of multiple system in the body. The etiopathogenesis of RA is multifactorial including genetic predisposition, alterations of the immune system and environmental influences. Despite the fact that a great progress has been achieved on the treatments, such as biologics, there is still a difficult diagnosis in clinical practice because early stage AOSD patients frequently do not have typical symptoms in the early stage of disease that leads to low early recognition rates and high misdiagnosis rates [1]. Nevertheless, the precise prediction for the risk of RA onset is a major question to be answered in the rheumatological field. Conventional risk prediction models of RA primarily focus on clinical factors, such as C-reactive protein (CRP), rheumatoid factor (RF) and anti-citrullinated peptide antibodies (anti-CCP).
Rheumatoid arthritis is a common chronic autoimmune disease characterized by a persistent inflammatory response to the synovium of the joints, which often leads to irreversible damage and dysfunction of joint structures if left untreated. The pathogenesis is complex, involving the interaction of genetic, immune, environmental and metabolic factors, and the lack of typical symptoms in the early stage of the disease makes it easy to delay diagnosis. Although the traditional risk prediction methods based on linear regression and Cox proportional hazards model have been widely used in clinical practice, it is difficult to fully capture the clinical characteristics of high heterogeneity, strong nonlinearity, and complex temporal correlation, especially in the face of multimodal electronic medical record data, long-term follow-up indicators, and implicit pathological structure associations, which show limited modeling ability and insufficient prediction accuracy.
While these approaches can recapitulate the immune inflammatory state to a certain degree, they bear challenge in fully delineating the dynamic interplaying between genetic, epigenetic, metabolic, and environmental exposure determinants. Especially in the latency period of the disease, these unidimensional modeling approaches can predict neither sensitive nor timely. The advent of artificial intelligence (AI) technology, in particular utilizing machine learning (ML) and deep learning (DL) models, provides new thoughts on the RA risk model development. In contrast to conventional techniques, AI can manage massive and structural complex, multi-modal datasets in medical level and capture the high-order non-linear relations between the variables resorting to automatic information processing through modeling. That we are making effective use of AI to identify possible biomarkers from data, model individual risk curves and investigate pathways of disease progression in rheumatology [2].
Indeed, previous work has already examined large-scale gene expression data for RA and applied the machine learning algorithms such as feature selection and embedding learning to identify transcriptomic features that are most relevant to RA. Such approaches may not only support disease identification and classification, but also go on to predict the type of disease and response to treatment, i.e. disease severity and treatment response. On the other hand, there existed literatures which performed recognition for medical images by deep neural networks, like utilizing MRI images and ultrasound images to find the early evidences for synovial thickening and bone erosion, so as to achieve higher sensitivity and reproducibility in imaging evaluation [3].
In recent years, with the wide application of deep learning technology in the medical and health field, Transformer and Graph Neural Network (GNN) have been gradually used for complex clinical tasks due to their advantages in sequence modeling and structure learning. Transformer is good at modeling long-term dependencies, which can fully explore the temporal dynamic characteristics in the evolution of patients' disease course. GNN can characterize non-Euclidean relationships between variables, which is suitable for constructing heterogeneous graph structures such as disease-index-treatment.
Another benefit is the inclusion of diverse non-genetic factors including history of smoking, lifestyle (such as dietary habit, physical activity) and environmental factors such as pollution exposure into lifestyle variables, as allowed by AI technology for risk assessment of RA. Through incorporation of these factors into the model, personal risk profiles can be achieved and risk accumulation pathways can be projected, making accurate forecasts truly personalized. It is difficult for conventional statistical models to perform this multi-dimensional and multi-time-scale information fusion [4]. However, the utilization of AI models in the risk prediction of RA is still full of difficulties. One of the main concerns is the understanding of the models, known as the "black box" problem. Clinicians may face challenges to directly link the decision-making basis with AI model results, and the latter’s credibility and clinical application may be affected.
In the recent years, “explainable AI” techniques have been increasingly developed by the researchers to improve the transparency and the clinical interpretability of the model prediction, for example, attention visualization, feature attribution, and decision path tracing. Furthermore, the promotion will be determined by the generalization ability of AI models [5]. A large number of current studies are based on single center or small populations with significant racial, regional, and living background bias.
2. Related Work
During the last decades, studied on prediction for RA risk have continuously evolved, and the achievements in various aspects of the progress have provided a promising theoretical framework and practical basis for the AI-based biostatistical modeling. Koduri and Solomon (2023) [6] investigated RA-related interstitial lung disease (RA-ILD), and suggested using pulmonary function such FVC and DLco as predictors of 5-year mortality rate among RA-ILD patients. The present study established a risk predicting model using factors of age, sex, and pulmonary complications and showed a good predictive value. This finding reflects the nonlinear associations of clinical covariates with the survival end point and provides a reference for integrating the Cox survival analysis.
Momtazmanesh et al. (2022) [7] in a recent systematic review on AI in RA, suggested that supplementing traditional Leiden prediction rules with the 12-gene risk score can also improve the prediction of progression of underto untreated arthritis to RA, again with improved AUC. This gives the theoretical support for our introduced multimodal fusion feature and AI optimization mechanism, and also indicates the promising of integrating gene expression data with classic biostatistical model. Yuan et al. (2022) [8] have investigated the causal pathway from CRP to RA with AAS by utilizing genetic epidemiological analysis, and reported that CRP exerted a partially mediating effect. We use this finding as a motivation to explore the genetic predictive mechanisms of the inflammatory markers in our modeling and in doing so, introduce biological priors by including biologically-based regularization terms to improve the biologically plausible and interpretable predictive models.
With respect to cardiovascular comorbidities, Ormseth et al. (2021) [9] have reported that a plasma miRNAs even has superiority over the classic risk factors in prediction of coronary artery atherosclerosis in RA patients, suggesting the additional value of molecular level information. This gives us a technical trend to connect the high-dimensional molecular omics data and describe the established mapping between its and the clinical risk. Rohrich et al. (2021) [10] demonstrated that the real CVD risk of young and female patients with RA is frequently underestimated by traditional CVD risk prediction systems, highlighting the drawbacks of traditional models in terms of population diversity. To handle such an issue, our approach utilizes a structure inference module in the graph to more closely model the similarities of patients as well as the differences in group structure.
Additionally, Chen et al. (2022) [11] systematically summarized risk factors for progressive RA-ILD, and found that UIP patterns on imaging, male sex, and high RF-IgA are the most significant unfavorable prognostic factors. This study highlights the correlation between imaging traits and immune markers, which also supports the design idea of the cross-modeling module of the Transformer in this work. Qiu et al. (2024) [12] demonstrated that the predicted values of pulmonary function indices, especially forced vital capacity (FVC) and pulmonary diffusion capacity (DLco), were highly correlated with mortality in RA-ILD patients. In particular, reduced FVC predicted value is positively associated with a high risk of death.
3. Methodologies
3.1. Representation and Interaction Module
In actual clinical data, patient characteristics may come from multiple modalities, including laboratory test data (such as C-reactive protein), quantitative indicators of genomic expression imaging, disease course records, etc. In order to unify the representation of these heterogeneous information, we design a multi-layer embedding network to map different modalities to the same high-dimensional space. Let the -th modal feature of patient th be , and the total modal number is . First, use an independent linear projection for each modality, as Equation 1:
Then, by splicing and fusing all modal embeddings, a unified representation is obtained, as in Equation 2:
This multimodal fusion design ensures that the model has the ability to extract feature interrelationships from multiple clinical sources, and improves the stability and expressiveness of representations through standardization and nonlinear transformation. In order to further capture the high-order interaction between modalities and variables, we introduce the Transformer architecture into the embedding space, and use the multi-head attention mechanism to model the global dependence of the input representation. For the embedding vector , the interactive representation is calculated by multi-head attention, as in Equations 3, 4, 5, 6, 7:
where , are the number of heads and is the output projection matrix. This section allows the model to adaptively identify the impact of modal combinations and variable interactions on predictions, enhancing the model's modeling capabilities and reducing the need for manual cross-item design.
In order to optimize the dual goals of the AIOBM model between prediction accuracy and interpretability, we constructed a set of multi-objective evolutionary algorithms based on NSGA-II. The algorithm initializes the weight vector by Latin Hypercube Sampling (LHS) to enhance population diversity, combines simulated binary crossover (SBX) and polynomial mutation operator to complete population iteration, and adopts the Pareto front selection mechanism of crowded distance ranking to achieve balanced screening of multi-objective solution sets, so as to improve the optimization efficiency and stability of the model in the high-dimensional medical feature space.
3.2. Risk Estimation and Optimization Module
In RA prediction, there is not only the static classification problem of "whether or not is diseased", but also the time dependence of "how long to be sick". Therefore, we use a dual-pathway modeling framework: one pathway is used to logistically predict the current disease probability, and the other pathway uses the Cox model to deal with survival time dependence. The logistic paths are represented by Equations 8 and 9:
The Cox path is represented by Equations 10 and 11:
These two pathways work together to learn the risk distribution and individual-specific risk dynamics to form a panoramic model for RA prediction.
Considering that RA patients may have population commonalities in clinical characteristics, we designed a graph neural network based on similarity graphs to model the "patient-patient" structured information propagation path.
Construct an undirected graph , where each node represents a patient, each edge represents the feature similarity, and the edge weight is defined as Equation 12:
Apply the Graph Attention Network (GAT) propagation mechanism to the graph structure to update the representation of each node, as shown in Equations 13 and 14:
This graph reasoning process enables each patient to disseminate and share structured information within the group, thereby enhancing the semantic hierarchy and discriminative ability of individual embedding.
4. Experiments
4.1. Experimental Setup
We chose the Arthritis Net real-world data set provided by Zurich University of Applied Sciences, which is drawn from the Swiss Clinical Quality Management Foundation (SCQM). The dataset covers a large number of X-ray images of left hands of RA patients together with their included bone erosion scores. Therefore, a high clinical representativeness was achieved and the dataset itself has a significant value. The dataset includes 10 joint sites within the hands, and collected more than 100,000 cropped images with accurate annotation by applying the Ratingen scoring system, and therefore can be used for multiple predictive tasks. We preprocessed the images via standardizing, grayscale normalization with training stability and generalization ability of the model by data augmentation including rotation and mirroring before they were utilized. In addition, to further enhance the clinical utility of the dataset, we integrated the image data with corresponding demographic and clinical metadata, including patient age, disease duration, serological markers, and treatment history when available.
To further evaluate the overall performance of our proposed AIOBM model in risk prediction of rheumatoid arthritis, we chose four typical comparison approaches:
- Logistic Regression (LR) (as a classic linear model) has good interpretability, and we use it to forecast based on the statistical features of erosion score;
- Convolutional Neural Network (CNN-Baseline) adopts a shallow convolutional neural network to end-to-end model X-ray images, working as a basic control for deep learning image processing;
- Attention-Guided CNN (AG-CNN) introduces an attention mechanism to improve the discovery of lesion areas, and enhance the model’s sensitivity to slight bone erosion;
- Graph-based Patient Similarity Network (GPSN) enhances the modeling capability for structural information by establishing a patient similarity graph and applying graph convolution for inference.
4.2. Experimental Analysis
We adopt accuracy to describe the ratio of all correct predictions in models. From Figure 1, we observe that as the feature selection grows, the rise of the classification accuracy is universal, but the magnitude of rise and the asymptotic level are fiercely different. LR performs worst in low dimension as its linear assumption has potential difficulty in capturing complex signals, CNN-Baseline and AG-CNN has a very closed performance in middle and low dimensions, but AG-CNN with attention structure can slightly outperform in recognizing subtle bone erosion features. GPSN has been keeping stable improvement benefiting from the graph structure with which structural information is good for the model to tell the difference, while AIOBM always wins no matter it is the low (≤50) or high (≥100) dimension.
Furthermore, C-index is used to assess the accuracy of the model in predicting the progression time of the RA-ILD or bone erosion, which is an important basis for the effectiveness measurement of the survival analysis path.
As can be seen in Figure 2, with the increase of learning rate from c = to , the prediction consistency performance of each model improves continuously, but the increasing ranges are different: traditional LR and CNN-Baseline are less sensitive for learning rates since their C-indexes rapidly increase at the beginning but grow very slowly afterwards; AG-CNN and GPSN are relatively consistent around the medium learning rate (c ≈ ), indicating that attention mechanism and graph structural information have better generalization ability in the hyperparameter space; while our proposed AIOBM consistently holds the best C-index over the entire spectrum of learning rates and also exhibits the steepest curve slope, indicating that the model is able to make a good use of large learning rates for highly efficient training and have a quite significant advantage.
As can be seen from Figure 3, the fusion model (Fusion, Ours) is significantly better than other modal combinations in the two dimensions of classification accuracy (Accuracy) and consistency index (C-index), not only with the highest median, but also the most concentrated distribution, showing good stability and generalization ability. The use of X-ray images or gene expression alone has certain advantages in some aspects, the former is more sensitive to bone erosion, and the latter is more sensitive to potential immune risks. However, the lack of structural features (No Structure) will lead to insufficient information interaction and deterioration of overall prediction performance.
In the dual-path risk prediction architecture, we do not directly assign fixed weights to the Cox and Logistic branches, but perform dynamic balance optimization by sharing the underlying representation and introducing the weight factors and into the loss function.
Table 1 follows that when λ takes various values the Brier score of AIOBM is relatively smaller than other baselines, and the smallest Brier score (0.10) reaches at λ=0.1. This suggests that a modest level of regularization allows the model to trade-off avoidance of over-fitting against the preservation of useful signals. But their more robust ideal values of λ tend to converge to learned but not proper λ, and their best Brier scores which are the best performance values are still worse than those of AIOBM. When λ is too large (e.g., 10.0), the errors of all the models sharply increase, which is especially evident for the traditional linear models and the shallow CNNs, suggesting that too heavy a regularization may dilute the model’s expression.
5. Conclusions
In conclusion, the present study contributes to the clinical issue of the risk prediction in rheumatoid arthritis (RA) by using a new AIOBM to combine the multimodal representation learning, Transformer cross-feature interaction, graph-based network inference and dual-pathway Cox-Logistic modeling style. AIOBM achieved significant improvement over the baseline methods in terms of classification accuracy, C-index and Brier score, demonstrating the effectiveness of combined cross-modal learning and multi-objective optimization. The experimental results indicate that the model has not only better predictive ability, but also stronger interpretability and hyperparameter stability, which means that it could be a reliable tool for the early diagnosis and personalized intervention of RA. Continued research may broaden to multi-task learning of more disease progression markers, augment clinical decision support with explainable AI technology, and ongoing validation in larger scale, multi-center real-world data to facilitate AI-driven precision medicine in rheumatology in clinical practice.
References
- Chang, S. H., Paudel, M. L., McDermott, G. C., Zhang, Q., Fukui, S., Kim, M., ... & Sparks, J. A. (2025, April). Development of a prediction model for progression of rheumatoid arthritis-associated interstitial lung disease using serologic and clinical factors: The prospective KORAIL cohort. In Seminars in Arthritis and Rheumatism (p. 152729). WB Saunders. [CrossRef]
- Hensvold, A., & Klareskog, L. (2021). Towards prevention of autoimmune diseases: the example of rheumatoid arthritis. European Journal of Immunology, 51(8), 1921-1933. [CrossRef]
- Humphries, S. M., Adegunsoye, A., Demoruelle, M. K., Kam, M. L. W., Amigues, I., Bang, T. J., ... & Solomon, J. J. (2025). Quantitative CT Scan Analysis in Rheumatoid Arthritis-Related Interstitial Lung Disease. Chest, 167(5), 1428-1439. [CrossRef]
- Kronzer, V. L., Huang, W., Dellaripa, P. F., Huang, S., Feathers, V., Lu, B., ... & Sparks, J. A. (2021). Lifestyle and clinical risk factors for incident rheumatoid arthritis-associated interstitial lung disease. The Journal of rheumatology, 48(5), 656-663. [CrossRef]
- Chen, L., Wu, B., Mo, L., Chen, H., Zhao, Y., Tan, T., ... & Tang, Y. (2024). Associations between biological ageing and the risk of, genetic susceptibility to, and life expectancy associated with rheumatoid arthritis: a secondary analysis of two observational studies. The Lancet Healthy Longevity, 5(1), e45-e55. [CrossRef]
- Koduri, G., & Solomon, J. J. (2023). Identification, monitoring, and management of rheumatoid arthritis–associated interstitial lung disease. Arthritis & Rheumatology, 75(12), 2067-2077.
- Momtazmanesh, S., Nowroozi, A., & Rezaei, N. (2022). Artificial intelligence in rheumatoid arthritis: current status and future perspectives: a state-of-the-art review. Rheumatology and therapy, 9(5), 1249-1304. [CrossRef]
- Yuan, J., Xiong, X., Zhang, B., Feng, Q., Zhang, J., Wang, W., & Tang, J. (2022). Genetically predicted C-reactive protein mediates the association between rheumatoid arthritis and atlantoaxial subluxation. Frontiers in Endocrinology, 13, 1054206. [CrossRef]
- Ormseth, M. J., Solus, J. F., Sheng, Q., Chen, S. C., Ye, F., Wu, Q., ... & Stein, C. M. (2021). Plasma miRNAs improve the prediction of coronary atherosclerosis in patients with rheumatoid arthritis. Clinical rheumatology, 40, 2211-2219. [CrossRef]
- Rohrich, D. C., van de Wetering, E. H., Rennings, A. J., Arts, E. E., Meek, I. L., den Broeder, A. A., ... & Popa, C. D. (2021). Younger age and female gender are determinants of underestimated cardiovascular risk in rheumatoid arthritis patients: a prospective cohort study. Arthritis Research & Therapy, 23, 1-7. [CrossRef]
- Chen, N., Diao, C. Y., Gao, J., & Zhao, D. B. (2022, August). Risk factors for the progression of rheumatoid arthritis-related interstitial lung disease: clinical features, biomarkers, and treatment options. In Seminars in arthritis and rheumatism (Vol. 55, p. 152004). WB Saunders. [CrossRef]
- Qiu, M., Jiang, J., Nian, X., Wang, Y., Yu, P., Song, J., & Zou, S. (2021). Factors associated with mortality in rheumatoid arthritis-associated interstitial lung disease: a systematic review and meta-analysis. Respiratory research, 22, 1-13. [CrossRef]
Figure 1.
Model Accuracy Comparison Across Feature Set Size.
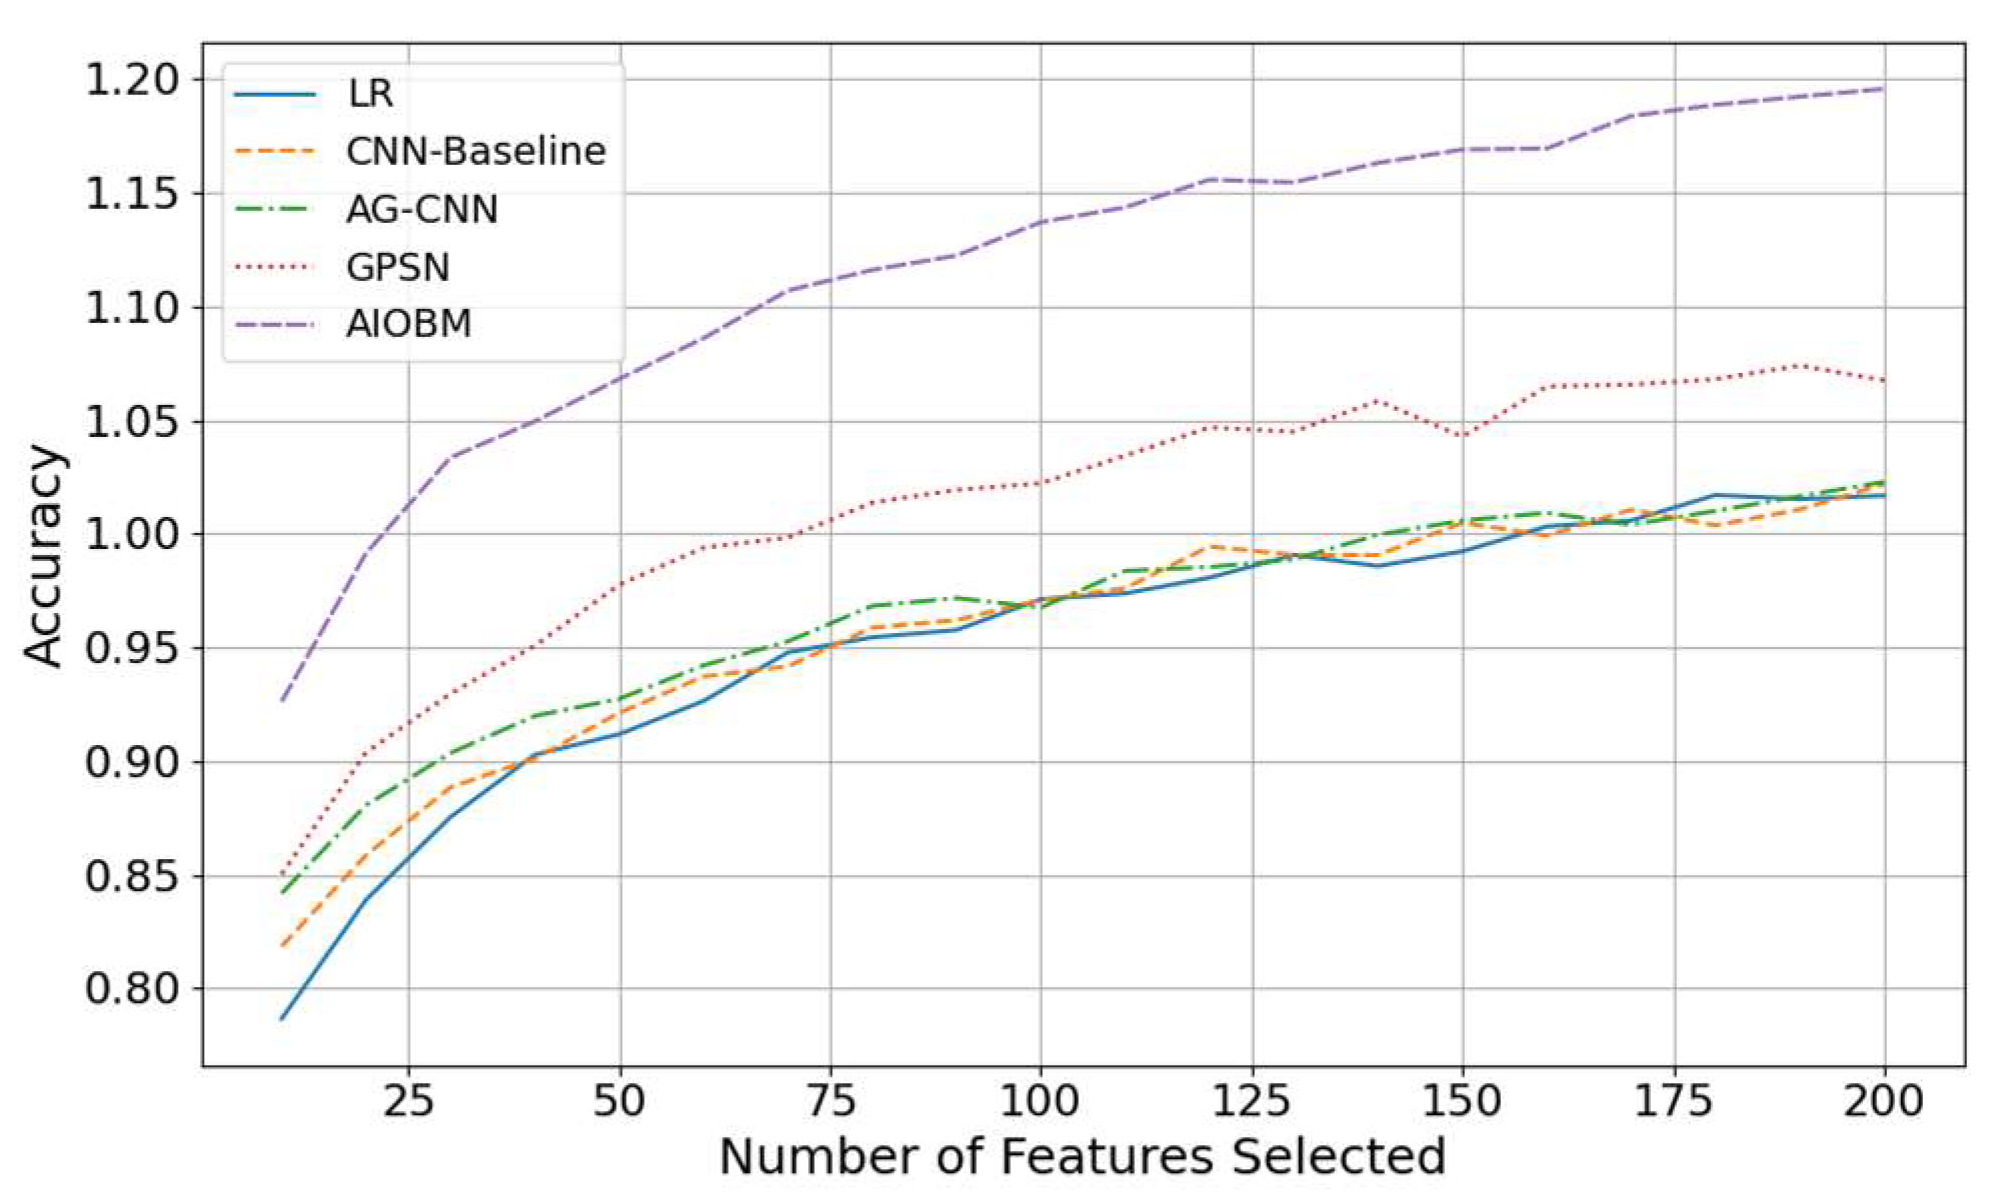
Figure 2.
Model C-index With Learning Rate.
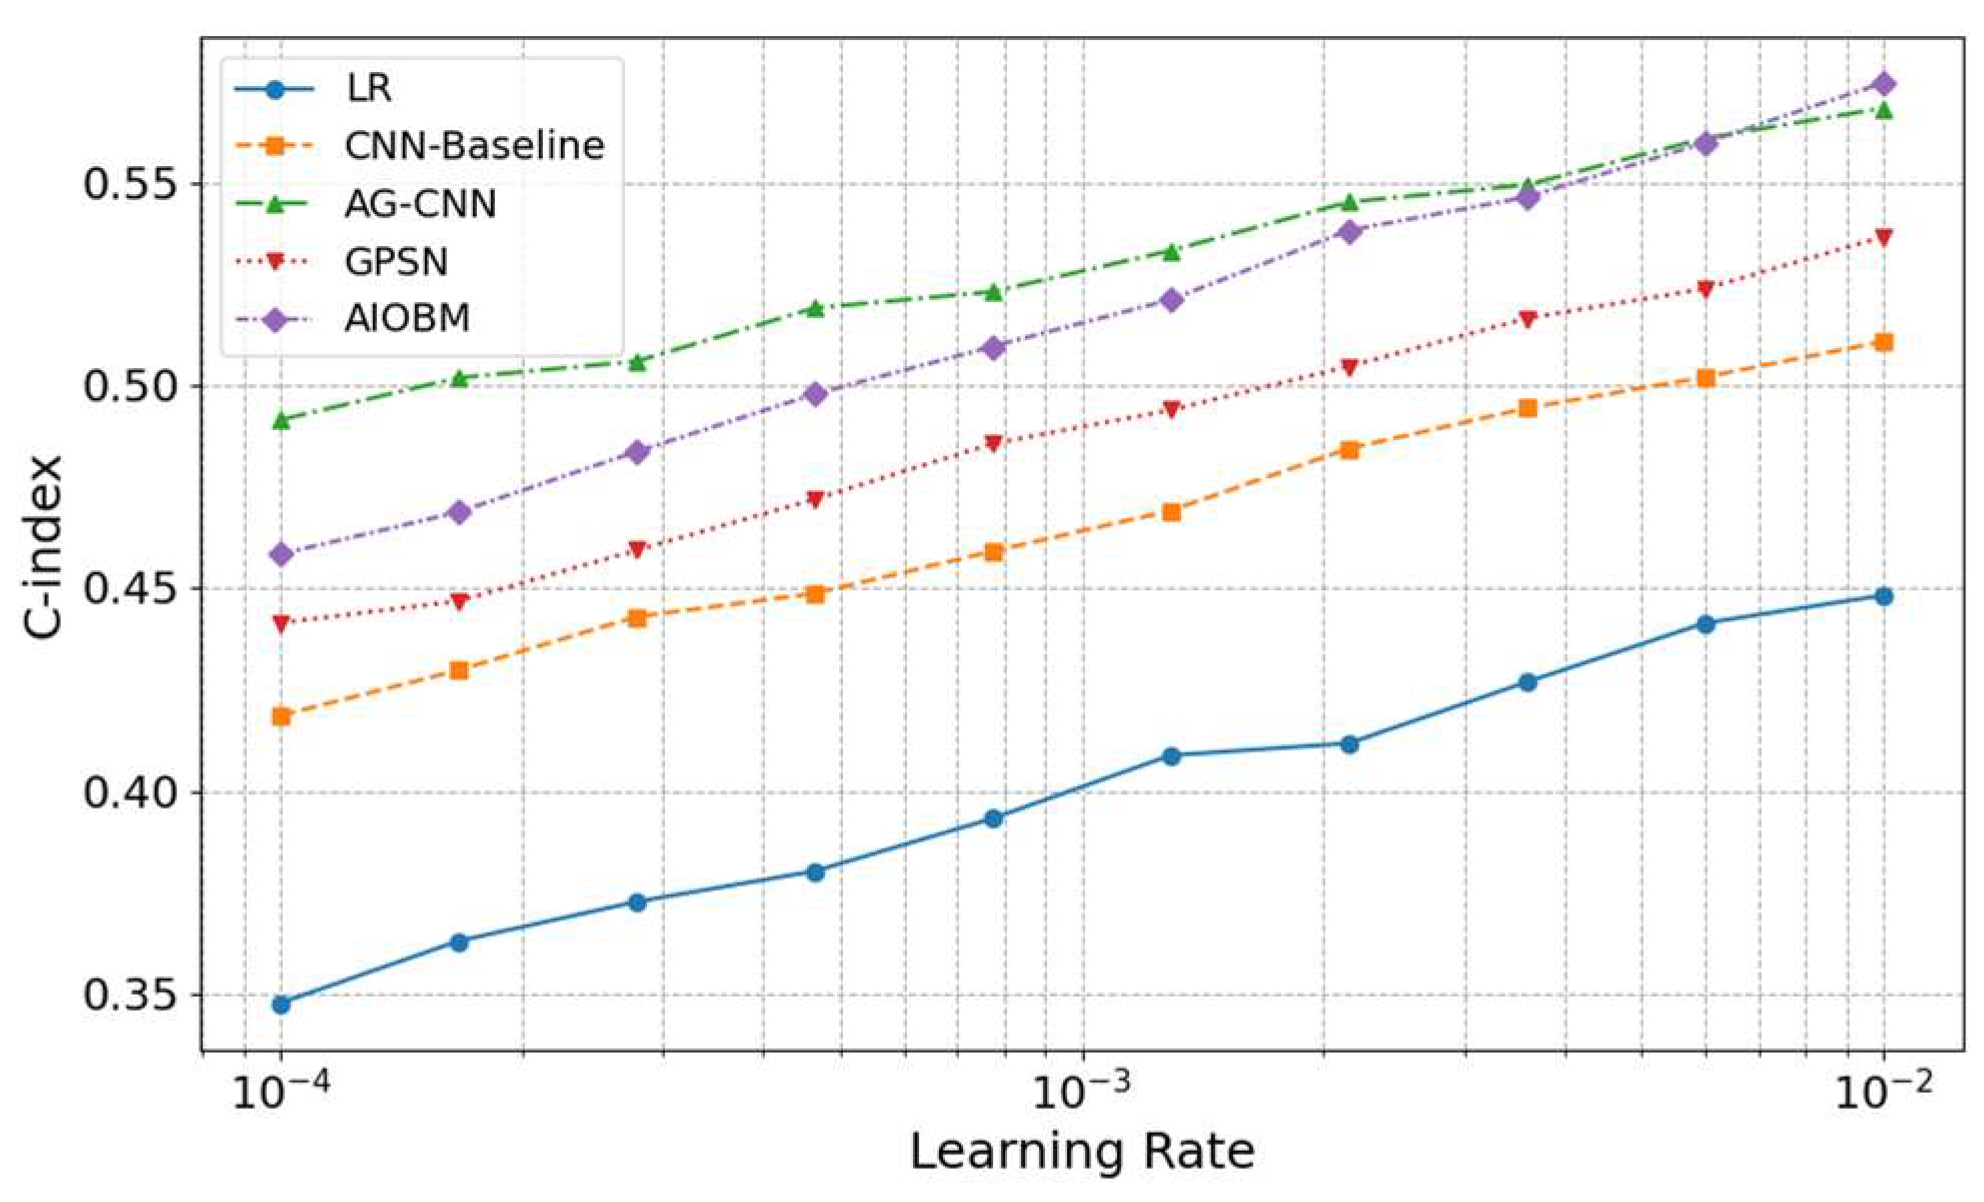
Figure 3.
Performance Comparison Across Ablation Modalities.
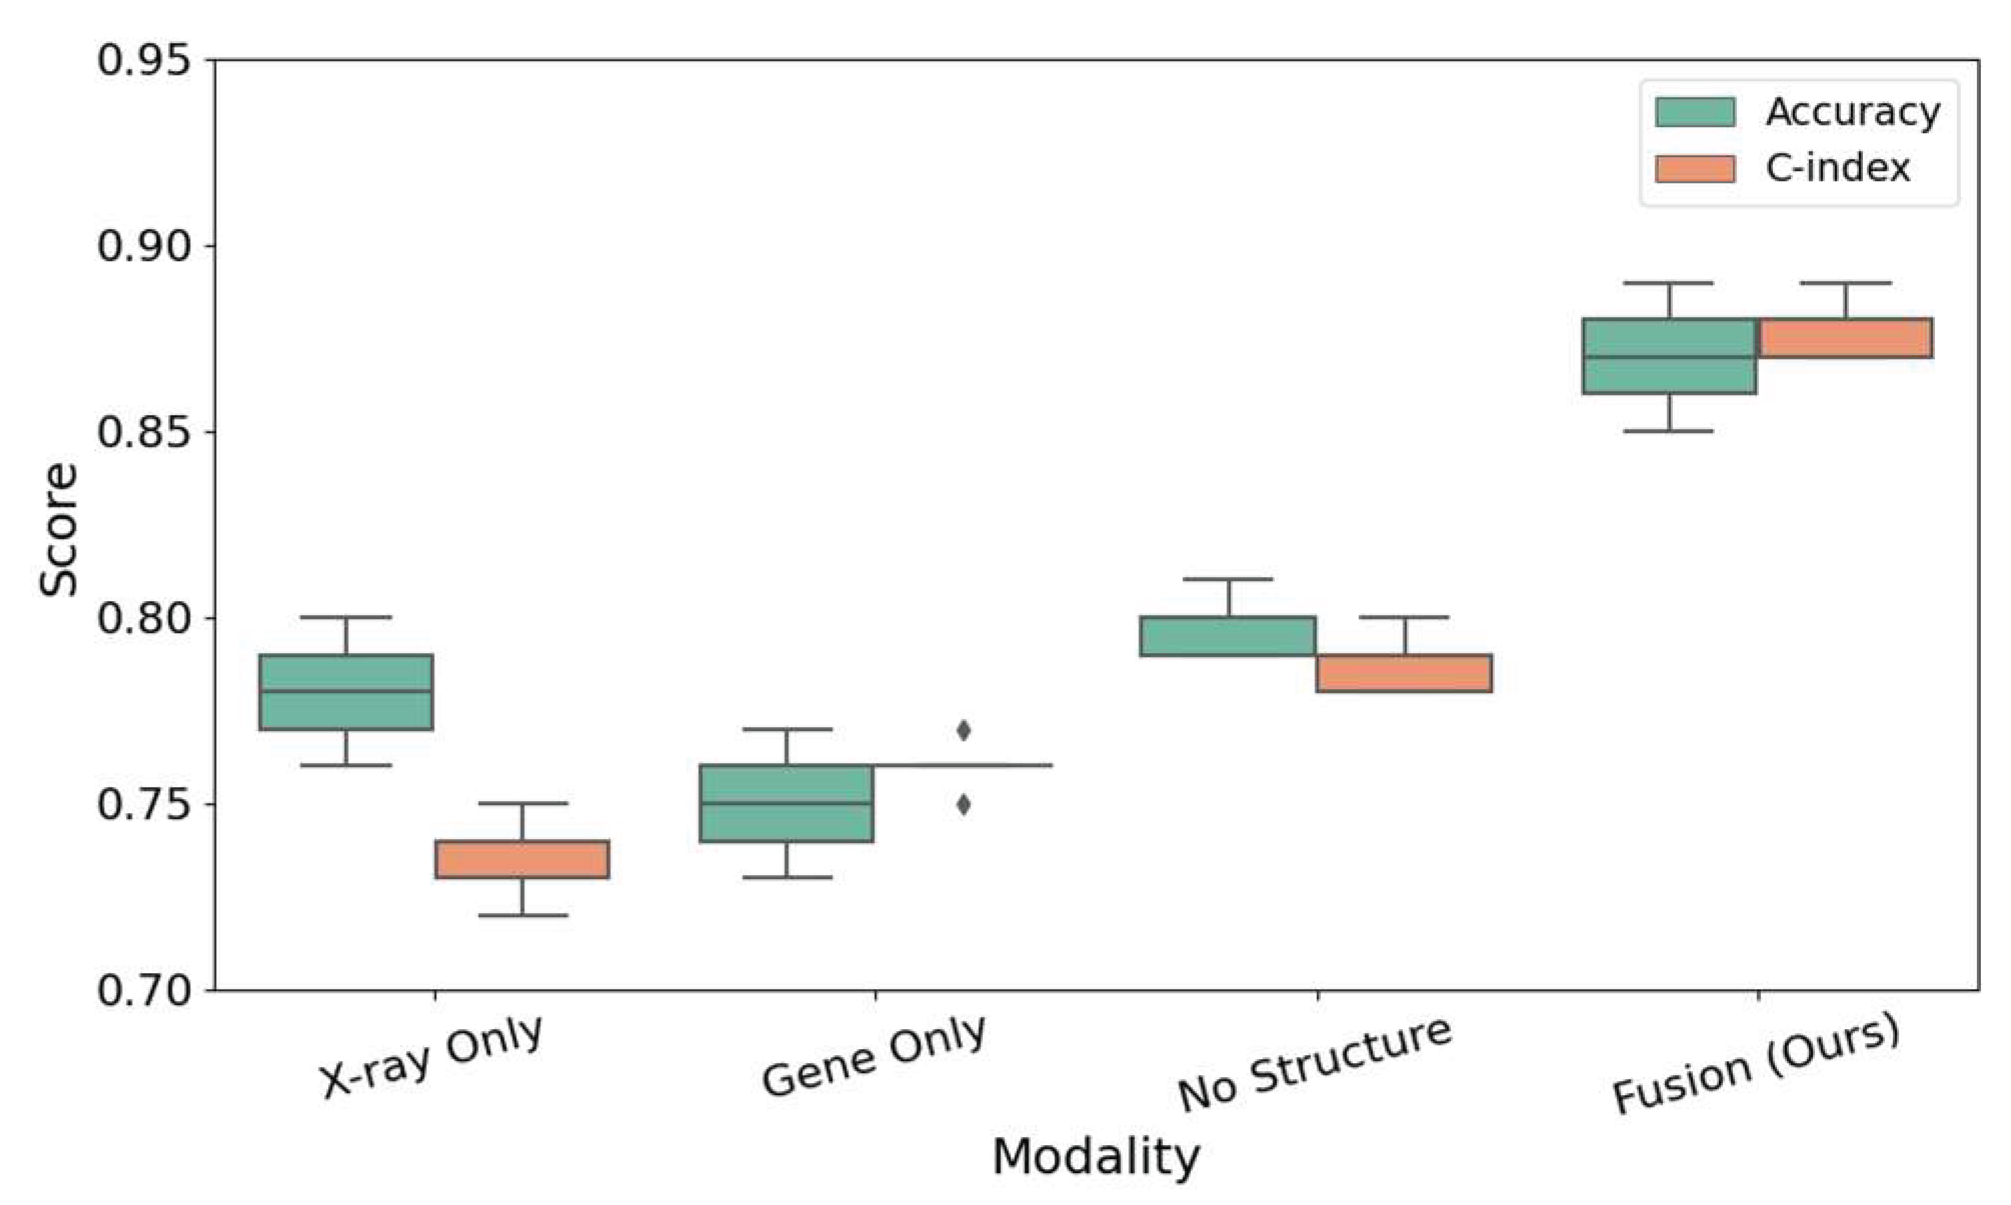

Table 1.
Comparison of Brier Scores under Regularization Coefficient (Regularization Strength).
| Value of | LR | CNN-Baseline | AG-CNN | GPSN | AIOBM |
| 0.01 | 0.19 | 0.17 | 0.15 | 0.16 | 0.11 |
| 0.1 | 0.18 | 0.16 | 0.14 | 0.15 | 0.10 |
| 1.0 | 0.20 | 0.18 | 0.16 | 0.17 | 0.12 |
| 10.0 | 0.22 | 0.20 | 0.18 | 0.19 | 0.14 |
Disclaimer/Publisher’s Note: The statements, opinions and data contained in all publications are solely those of the individual author(s) and contributor(s) and not of MDPI and/or the editor(s). MDPI and/or the editor(s) disclaim responsibility for any injury to people or property resulting from any ideas, methods, instructions or products referred to in the content. |
© 2025 by the authors. Licensee MDPI, Basel, Switzerland. This article is an open access article distributed under the terms and conditions of the Creative Commons Attribution (CC BY) license (http://creativecommons.org/licenses/by/4.0/).
Copyright: This open access article is published under a Creative Commons CC BY 4.0 license, which permit the free download, distribution, and reuse, provided that the author and preprint are cited in any reuse.


