
Submitted:
20 May 2025
Posted:
22 May 2025
You are already at the latest version
Abstract
Poliovirus represents an oncolytic agent human glioblastoma - one of the most aggressive types of cancer. Since interference of viruses with metabolic and redox pathways is often linked to their pathogenesis, drugs targeting metabolic enzymes are regarded as potential enhancers of oncolysis. Our goal was to reveal imprint of poliovirus on metabolism of glioblastoma cells lines and to assess dependence of the virus on these pathways. Using GC-MS, HPLC and Seahorse techniques, we show that poliovirus interferes with amino acid, purine and polyamine metabolism, mitochondrial respiration and glycolysis. However, many of these changes are cell line- and culture medium-dependent. Inhibitors of metabolic enzymes affected neither poliovirus replication nor cytopathogenic effect with the exception of inhibitors of polyamine biosynthesis and pyruvate import into mitochondria that exhibited antiviral activity. We also demonstrate that poliovirus does not interfere with production of superoxide anions or with levels of H2O2 showing absence of oxidative stress during the infection. So, poliovirus pathogenesis is not associated with alterations of cell metabolism or redox status, and pharmacological inhibitors of metabolic enzymes cannot be used to boost its oncolytic activity.
Keywords:
oncolytic viruses
; glioblastoma
; poliovirus
; polyamines
; metabolism
; seahorse
; respiration
; Plasmax
1. Introduction
Glioblastoma multiforme (GBM) is one of the most aggressive types of malignant brain tumors, which affects many people today. GBM accounts for 54% of all gliomas and 16% of all brain tumors [1]. In developed countries rates of its occurrence range from 2.05 to 3.69 per 100 persons [2]. This tumor is characterized by spontaneous occurrence and extremely low patient survival: 10 months without treatment and 15–16 months with therapy, which indicates an extremely unfavorable prognosis [3,4]. Standard treatment approaches for patients with glioblastoma include surgical removal of tumor tissue, radiation therapy, and immunotherapy [5,6,7].
One of the promising approaches for treatment of cancer and glioblastomas in particular is the usage of oncolytic viruses [8,9]. The mechanism of action of such viruses combines direct lysis of tumor cells and the recruitment of the immune system. Currently, there are four viruses approved for clinical practice [10], and many others undergoing clinical trials (for example, [11]). Enteroviruses such as coxsackie viruses, reoviruses, vesicular stomatitis virus present a group of oncolytic viruses that display promising oncolytic activity [12]. Poliovirus, an RNA virus of the Picornaviridae family with a diameter of about 30 nm, is currently being actively studied as an oncolytic. It enters cells through interaction with the CD155 receptor, which is overexpressed on the surface of tumor cells making them more sensitive to this oncolytic agent [13]. Noteworthy that not only wild-type poliovirus can be used as oncolytic agents but also its genetically-engineered variants such as PVSRIPO [14].
Many viral infections are known to perturb metabolic and redox status of host cells by enhancing aerobic glycolysis, glutaminolysis, and fatty acid synthesis [15,16,17]. Such changes ensure efficient biosynthesis of components of lipid membranes required for enveloped viruses, provide the viral particle with the necessary components of surface glycoproteins, and supply ATP by rapid production during glycolysis [18,19]. Many viruses also interfere with polyamine, cholesterol and nucleotide metabolism to ensure efficient replication [20,21,22,23,24]. So, metabolic enzymes can act as targets for the development of antiviral agents [17,20,25,26,27]. Indeed, there are examples of clinical trials of their inhibitors used for the treatment of viral infections (for example, [28]). Many chronic and acute viral infectious also trigger oxidative stress which contributes to their pathogenesis [29,30,31]. In case of chronic hepatitis viruses, antioxidants demonstrate ability to suppress inflammation and the development of fibrosis [29].
However, there are almost no data on possible impact of poliovirus on cell metabolism and dependence of its replication on specific metabolic pathways of host cells. The very few reports suggest that poliovirus replication is suppressed when the cells are maintained on poor nutrient media, while the addition of glucose restores virus titer [32]. It has also been demonstrated that poliovirus increases phosphatidylcholine production in infected cells, and knockdown of cellular acyl-CoA synthase leads to inhibition of its replication [33,34].
So, the first goal of this study was to reveal imprint of poliovirus on metabolic and redox pathways of host cells and to identify targets for antiviral agents among metabolic enzymes. And since we previously demonstrated that oncolytic activity of coxsackievirus towards glioma cells can be enhanced by pharmacological inhibitor of glycolysis [35], the second goal was to assess if this approach can be applied to oncolytic activity of poliovirus.
2. Results
2.1. Kinetics of Poliovirus Replication in Glioblastoma Cells Maintained in Various Media
In order to study impact of poliovirus on metabolism of GMB cells, it was important to establish when the virus infects most cells but does not yet affect their viability. So, our first task was to evaluate time course of poliovirus infection in GBM cells cultured either in a conventional nutrient medium (DMEM) or in a plasma-like Plasmax medium that does not affect cell metabolism itself [36]. We chose two GBM cell lines, namely U-251 MG and DBTRG-05MG that were maintained either in DMEM supplemented with 10% FBS or Plasmax with 2.5% FBS for at least 6 days, as described previously [37]. It is noteworthy that medium choice affected cells morphology (Figure S1). Then the cells were infected with type 2 poliovirus at different multiplicities of infection (MOI), and its replication was monitored by assessment of 50% tissue culture infectious dose (TCID50) as well as by immunofluorescence. We observed an increase in the infectious titer starting from 6 hours post-infection (Figure 1a, Figure S2), which correlates with similar duration of enterovirus life cycle [38]. In classical DMEM poliovirus replication was more efficient in U-251 MG cells than in DBTRG-05MG cells (Figure S2a,b, Figure 1a). In contrast, no such difference was visible, when the cells were maintained in Plasmax medium (Figure S2c,d, Figure 1a), albeit in U-251 MG cells significantly less cells were stained positive to the infection (Figure 1b) . Nevertheless, in all cases the replication reached plateau by 24 h.p.i. At this time point PV-induced cell death was minor at MOI 1 in case of U-251 MG cells (Figure S3) or at MOI 3 in case of DBTRG-05MG (Figure S4) cells, so we selected 24 h.p.i and the respective MOI for subsequent analysis.
To confirm the successful infection, we performed immunostaining of cells using antibodies to poliovirus (Figure 1b, Figure S5). Indeed, 24 hours post-infection almost all cells maintained in DMEM were infected by the virus. Pronounced toxicity in these experiments was noticeable starting from MOI 3 in U-251 MG cells or from MOI 10 in DBTRG-05MG cells (Figure S2). Cultivation of U-251 MG cells in Plasmax medium resulted in a decrease in infection rates, whereas for DBTRG-05MG cells we observed the opposite effect. So, we confirmed selection of 24 h.p.i. as the time point for further experiments.
2.2. Changes in Metabolism of Biogenic Polyamines During Poliovirus Infection Are Dispensable for Virus Replication
Since biogenic polyamines are the ubiquitous compounds indispensable for replication of various DNA and RNA viruses [39,40], one of our goals was to characterize impact of poliovirus on their metabolism. Polyamine levels were quantified by HPLC with pre-column derivatization. Poliovirus infection caused a pronounced decrease in spermine and spermidine levels in U-251 MG (Figure 2a) and moderate decrease in DBTRG-05MG cells (Figure 2b) cultured in DMEM. Both cell lines, when cultured in Plasmax, demonstrated accumulation of spermine upon infection, with a decrease in spermidine in case of DBTRG-05MG cells (Figure 2c,d). To summarize, impact of poliovirus on polyamine metabolism depended on choice of culture medium.
To unveil the importance of polyamines for poliovirus replication and cytopathogenic effect in GBM cells, we used pharmacological and experimental compounds that inhibit or induce polyamine-metabolizing enzymes. They included i) difluoromethylornithine (DFMO, Eflornothine® - an irreversible inhibitor of cellular ornithine decarboxylase (ODC), ii) SAM486a (Sardomozide - an inhibitor of S-adenosylmethionine decarboxylase, AMD1), iii) N1,N4-bis(2,3-butadienyl)-1,4-butanediamine (MDL 72.527, an inhibitor of spermine oxidase and acetylpolyamine oxidase that mediate polyamine catabolism), iv) N1,N11-diethylnorspermine (DENSpm) that induces spermidine/spermine-N1-acetyltransferase (SSAT, polyamine catabolism), as well as inhibitors od spermidine and spermine synthases or polyamine-dependent post-translational modification (hypusination) of the eIF5a translation factor (listed in Table 1). We assessed if these compounds protected cells from virus cytopathogenic effect (antiviral activity) or enhanced cell death (increased oncolytic activity). As the cell cycle of poliovirus is very short, we added the compounds 24 hours prior infection and kept their concentration during the whole experiment. Most of the compounds did not affect cell viability (Figure 3, Figure S6) showing that poliovirus replication is not dependent on polyamine metabolism. The exceptions were DFMO that blocks the rate-limiting step of polyamine metabolism (Figure 3a) and deferiprone (DFP, Figure S6a): these compounds partially prevented death of U-251 MG cells. However, the effect of DFP was likely non-specific, as another compound that targets the same hypusination pathway (GC7) was inactive (Figure S6c). Antiviral activity of DFMO was not confirmed in DBTRG-05MG cell line (Figure 3a), however it could be explained by lower rates of infection. So, poliovirus replication in GBM cells does not rely on most polyamine-metabolizing enzymes.
2.3. Poliovirus Interferes with Central Carbon Metabolism in a Cell Line-Specific Manner
The next step was the evaluation of imprint of poliovirus replication on central carbon metabolism. This was carried out by GC-MS which allows quantification of all proteinogenic amino acids except arginine, glycolysis and TCA cycle intermediates as well as some nucleic bases and nucleosides. These experiments were carried out in the same two glioma cell lines maintained in DMEM or Plasmax media. The results are presented on Figure 4. In U-251 MG cells in DMEM, poliovirus induced increase in most metabolites. The highest upregulation was observed for dihydroxyacetone phosphate (DHAP), a precursor of triglycerides, as well as for purines. These changes suggested upregulation of the respective pathways. However, some of these changes disappeared upon substitution of DMEM with Plasmax, with the exception of increased levels of branched amino acids (Val, Leu, Ile), Tyr, Cys and Asp, triglycerol precursors (DHAP, glycerol-3-phosphate), most glycolysis intermediates, guanine, adenosine and inosine. PV infection in U-251 MG cells in Plasmax also resulted in a strong decrease in Ala, Phe and Pro. In DBTRG-05MG cells the imprint of the virus was different, as most metabolite levels were decreased compared to mock-infected cells. Search for similar changes between two cell lines maintained in a physiological Plasmax medium identified accumulation of His, Leu, Ile, pyruvate, DHAP and cytosine.
Next, we attempted to reveal genes of glycolysis and triglyceride synthesis that could be responsible for the changes observed in U-251 MG cells. We did not find any impact of poliovirus on expression of any of the genes with the exception of AGPS that is downstream of DHAP (Figure 5). Its induction could not account for accumulation of this metabolite. We would also like to note tendency for statistical significance in case of FASN and TPI mRNA levels (fatty acid synthase and triose phosphate isomerase, responsible for the conversion of DHAP).
2.4. Poliovirus Infection Induces Accumulation of Lipid Droplets in GBM Cells
As DHAP and glycerol-3-phosphate are precursors of triglycerides, we assessed levels of neutral lipids by BODIPY 493/503 dye. Four hours post-infection we observed an increase in BODIPY 493/503 fluorescence (Figure 6), which may indicate the accumulation of lipids and their increased biosynthesis during the first cycle of viral replication. The most pronounced effect was in U-251 MG cells which ensured higher levels of virus replication. Upon subsequent incubation of cells with the virus, however, fluorescence levels substantially decreased.
2.5. Metabolic Changes in Glioblastoma Cells by Poliovirus Are Not Mediated by Interferon Production
As RNA viruses trigger interferon production and concomitant response, we evaluated if metabolic changes were mediated by this antiviral cytokine. The glioma cells were treated with the recombinant IFN α-2b (IFN α-2b activity was verified using real-time PCR, Figure S7) and subjected to metabolic analysis by GC-MS. Interferon induced down-regulation of most metabolites in both cell lines (Figure 7). Clearly, there was no correlation between the effect of cytokine and the virus.
2.6. Poliovirus Suppresses Glycolysis and Mitochondrial Respiration
Our next step was the measurement of glycolytic and respiratory activities of infected cells to analyze effect of poliovirus on these two ATP-producing pathways. It was carried out by Seahorse technology which is the gold standard in the field. The results demonstrate that poliovirus suppresses glycolysis in U-251 MG cells in DMEM (Figure 8a) and in DBTRG-05MG cells in Plasmax (Figure 8b). The virus also inhibited basal and maximal respiration in U-251 MG cells in both media (Figure 8c), whereas in the second cell line no changes were observed (Figure 8d). So, the effects of poliovirus infection are cell line-specific.
2.7. Import of Pyruvate into Mitochondria Is Essential for Poliovirus Replication
Our next step was the assessment of poliovirus replication on central carbon metabolism using the inhibitors of mitochondrial pyruvate carrier (UK5099), pyruvate/lactate monocarboxylate transporters (MCT), and fatty acid synthesis (AcSS). The experiment was carried out as described above for the inhibitors of polyamine metabolism. The results, shown on Figure 9, demonstrate that poliovirus replication is not dependent on pyruvate or lactate export from cell or fatty acid biosynthesis, but requires import of pyruvate from cytoplasm to mitochondria (panel a).
2.8. Poliovirus Infection Does Not Trigger Oxidative Stress
Since various viruses were shown to trigger oxidative stress, our final goal was to reveal of poliovirus also affects production of reactive oxygen species. Superoxide anion production was quantified by dihydroethidium (DHE) using FACS, while levels of hydrogen peroxide were assessed by ratiometric genetically-encoded HyPer7-LifeAct sensor and confocal microscopy. The results demonstrate that poliovirus replication does not affect production of superoxide (Figure 10). Levels of H2O2 were also unaltered, as no changes in HyPER7 fluorescence 488/405 ratio was registered in infected cells (Figure 11). Finally, we quantified expression of genes regulated by the Nrf2 transcription factor which is the master regulator of antioxidant defense [41]. Interestingly, expression of these genes was decreased in infected U-251 MG cells but induced in DBTRG-05MG cells suggesting cell specific effect of the virus on Nrf2/ARE pathway (Figure 12).
3. Discussion
Oncolytic viruses have a high potential in anticancer therapy [42]. Currently there are four viruses approved for clinical usage. They include Talimogene laherparepvec (T-VEC, Imlygic) for the treatment of melanoma [43], Oncorine (H101) against head and neck cancer and esophagus cancer [44], Rigvir (ECHO-7) against melanoma [45], and Delytact (Teserpaturev/G47Δ) for the treatment of certain solid cancers, e.g. malignant glioma [46]. Many other oncolytic agents are currently in clinical trials (as exemplified by recent papers [47,48]). Anti-GBM potential is attributed to a wide array of natural or engineered viruses including members of pox- [49], herpes [50], adeno- [51], paramyxo- [52], and flavi- [53,54] viruses. Our group expanded this list with enteroviruses including coxsackieviruses and polioviruses [35,55]. Here we aimed to explore one of the options of enhancing oncolytic activity of poliovirus against GBM.
It is well established that different viruses reprogram metabolic and redox pathways of host cells to ensure efficient replication and virion production [16,56,57]. Many of such changes are strongly associated with the development of infection-associated pathologies. As many compounds that target metabolic enzymes are used as drugs for the treatment of cancer or autoimmune disease (such as metformin, methotrexate, sulfasalazine, mycophenolic acid etc.) [58,59], their repurposing as enhancers of oncolysis is attractive. Indeed, we previously reported enhancement of oncolytic activity of coxsakievirus type 5 by 2-deoxyglucose which targets upstream stages of glycolysis [35]. However, such studies require understanding how a particular oncolytic virus depends on cell metabolism and interferes with it, as such drugs can also interfere with replication of the virus thus decreasing its efficacy.
Investigation of cell metabolism is hampered by imprint of standard culture media such as DMEM and RPMI on cell metabolism [36,60]. Therefore, one of the approaches in metabolomics is the usage of modern media that resemble human plasma (i.e. HPLM and Plasmax [61,62]. Emerging reports show that choice of culture media may affect efficacy of drugs [63,64,65]. So, here we analyzed imprint of poliovirus on cell metabolism in classical (DMEM) and physiological (Plasmax) media. We showed that choice of culture media affects rates of poliovirus infection: Plasmax suppressed virus replication in U-251 MG cells but upregulated in DBTRG-05MG cells. Together with our previous data on absence of Plasmax effect on PV replication in RD cells [37], the effect of media on replication of viruses is cell line-specific. Moreover, this report is the first example of enhanced replication of viruses in Plasmax, as many other infections including hepatitis C virus, SARS-CoV-2 and influenza virus had significantly lower rates of infection, when cells were maintained in Plasmax [37].
We also show here that poliovirus interferes with polyamine metabolism in a cell line-specific manner. Biogenic polyamines are positively charged aliphatic molecules present in all types of human cells in millimolar and submillimolar concentrations that are critical for their growth and differentiation [66,67,68,69]. Their levels are increased in tumors, making drugs that suppress their biosynthesis or enhance catabolism as promising anticancer drugs [70]. Indeed, DFMO (Eflornithine®) demonstrated very promising results in clinical trials of treatment of neuroblastoma including relapsed cases [71,72,73], leading to its approval by FDA under Iwilfin trademark [74]. As polyamines have been discussed in the context of glioblastoma [75,76], DFMO has also been investigated as a component of anti-GBM therapy [77,78]. Eflornithine has also been investigated as a component of treatment of human African trypanosomiasis [79]. So, it is not surprising that DFMO and other regulators of polyamine metabolism have been evaluated as antiviral agents. To date, DFMO has demonstrated activity against filoviruses [80], herpesviruses [81,82], alphaviruses [83,84], coronaviruses [26,85], flaviviruses [20,85], bunyaviruses [85], rhabdoviruses [85], hepadnaviruses [86], picornaviruses [85] including coxsakievirus B3 and poliovirus [85]. The activity against the latter was shown by Mounce et al in Vero E6 cells [85]. It correlates with moderate reduction of PV replication in U-251 MG cells shown here. However, we did not reveal antiviral effect for DENSpm, MDL72.527, SAM486a or GC7, that were previously been described as antiviral agents against coxsakievirus, Zika and Chikungunya virus, hepatitis C virus [20,27,80,85,87,88]. So, poliovirus is less dependent on polyamine metabolism that other infections, at least when replicating in GMB cells. Exact function of polyamines in PV life cycle remains unknown. In case of other infections, polyamines were shown to be incorporated into virions to support their infectivity (shown for bunyaviruses and herpes simplex virus [40,89]) or prevent formation of defective virions (described for bunyaviruses [27]), to maintain cholesterol metabolism and promote its incorporation into viral particles (shown for Rift Valley Fever virus and coxsakievirus [90,91]), and to confer permissiveness of cells to viruses (shown for coxsakievirus [92]). However, cell background and mechanism of entry of a particular virus may affect its sensitivity to polyamine depletion.
Impact of viruses on polyamine metabolism has been studied less extensively that role of polyamines for their replication. A reduction of polyamine levels has been shown for hepatitis C virus [20], chronic coxsakievirus infection [22], Kaposi's sarcoma-associated virus [81] and SARS-CoV-2 [93]. Here we demonstrate similar reduction of spermine in GMB cells lines that were cultured in classical DMEM medium. Noteworthy that spermine is the major polyamine in these cells when DMEM was used, whereas replacement of DMEM with Plasmax leads to substantial rise in levels of spermidine. This indicates that culture medium also affects polyamine metabolism.
Our study also revealed that imprint of poliovirus infection on cell metabolism is cell line-dependent and is affected by culture medium. Increase in levels of amino acids and nucleic bases/nucleosides may indicates reprogramming of cell metabolism to enhanced synthesis of building blocks that are essential for virion production. It is well-known fact that addition of glutamine and glucose to the medium of cultured cells enhances assembly and release of viral particles [94]. Accumulation of intermediates of glycolysis can indicate suppression of this pathway. Indeed, Seahorse assay revealed that poliovirus down-regulates glycolysis as well as mitochondrial respiration. It is tempting to assume that suppression of both these ATP-producing pathways contributes to cytopathic effect of the virus. A very pronounced accumulation of DHAP shown here can also be a marker of decreased cell viability [95,96,97] rather than a marker of increased biosynthesis of triglycerides. Indeed, we failed to reveal accumulation of lipid droplets with the exception of a very early time point.
Finally, we revealed no indication of oxidative stress in GMB cells lines during poliovirus infection. This is contrary to the effect of human immunodeficiency virus (HIV) [98], hepatitis B and C viruses [29], herpes viruses [99] and a variety of acute respiratory infections [31] including SARS-CoV-2 [100]. Oxidative stress has also been described for such enteroviruses as Enterovirus 71 [101,102] and coxsakievirus [103]. However, in the latter case increased ROS production, demonstrated in vivo, could have resulted from indirect events such as inflammatory response.
Finally, it is known that accumulation of such metabolites as succinate, fumarate, 2-hydroxyglutarate (referred to as oncometabolites) is associated with the development of certain types of cancer. These metabolites act as signaling molecules, activating prooncogenic signaling pathways, promoting epigenetic changes and conferring resistance to apoptosis [104]. This is especially important for gliomas, as many of such tumors have mutations in isocitrate dehydrogenase (IDH) 1/2 genes leading to production of 2-hydroxyglutarate [6]. So, investigation of imprint of oncolytic viruses on metabolism of cells should in future be examined in the contexts of IDH1/2 mutations.
4. Materials and Methods
4.1. Materials
(Dimethylamino)naphthalene-1-sulfonyl chloride (dansyl chloride), 1,6-diaminohexane, 1,7-diaminoheptane and O-methylhydroxylamine and 4′,6-diamidino-2-phenylindole (DAPI) were purchased from Sigma-Aldrich (Darmshtadt, Germany). MSTFA (N-methyl-N-(trimethylsilyl)trifluoroacetamide) was purchased from MedChemExpress (Monmouth Junction, NJ, USA). BODIPY 493/503 dye (4,4-difluoro-1,3,5,7,8-pentamethyl-4-bora-3a,4a-diaza-s-indacene) was from ThermoFisher Scientific (Logan, MA, USA). The metabolic inhibitors used and their vendors are listed in Table 1. All oligonucleotides were synthesized by Evrogen (Moscow, Russia).
4.2. Cell Cultivation
The DBTRG-05MG (CRL-2020) and HEK293T (CRL-3216) cell lines were obtained from American Tissue Culture Collection (ATCC). Human glioblastoma U-251 MG cells were obtained from the collection of the laboratory of cell proliferation EIMB RAS. Authentication of these cells lines was confirmed by STR analysis (“Gordiz” company, Moscow, Russia). HEK293TΔIFNR1 cell line was described earlier [105]. All cultures were routinely checked for mycoplasma contamination using the MycoReport test (Evrogen, Moscow, Russia).
The cells, cryopreserved in fetal bovine serum (FBS, Biosera, Cholet, France) with 10% DMSO, were seeded and maintained in DMEM (ServiceBio, China) supplemented with 10% FBS, 2 mM glutamine, 50 U/mL penicillin and 50 µg/mL streptomycin at 37 °C in a humid atmosphere with 5% CO2. They were splitted every 2-3 days using 0.05% trypsin-EDTA solution (PanEco, Moscow, Russia). Alternatively, U-251 MG and DBTRG-5MG cells were maintained in Plasmax medium [61] under similar conditions, with cultivation for at least 6 days in this medium prior experiments.
4.3. Virus
The Sabin vaccine strain of poliovirus type 2 (PV), obtained from the collection of the laboratory of cell proliferation EIMB RAS, was used in this work. The virus was propagated in HEK293T with subsequent production of viral stock with a titer of 109 virus particles/mL.
4.4. Cell Morphology Analysis
Twenty-four hours prior to infection with the virus, cells were seeded on 6 cm Petri dishes at 1.5 × 10⁶ cell/well density, 6-well plates at 0.5 × 10⁶ cell/well density or on 96-well plates at 2 × 10⁴ cell/well density. Morphology before and after infection was visualized on a ZOE fluorescence microscope (BioRad, USA) in brightfield mode.
4.5. Replication Assay
To determine the rates of virus replication, cells were infected at MOI = 1, 3, and 10, and the virus was then collected from supernatants or cryo-lyzed cells at 2, 6, 12, and 24 hours post-infection. Virus titers were estimated by infecting HEK293T cells with serial dilutions of supernatants according to Reed and Muench [106]. Titration was estimated 72 h.p.i. by visual determination of CPE using microscopy.
4.6. RT-qPCR
The cells were seeded on 6-cm Petri dishes, infected with the virus in FBS-free medium at MOI = 1. Twenty-four hours later, the cells were harvested, RNA was isolated using the RNA extraction kit (Biolabmix, Novosibirsk, Russia) and subjected to recombinant DNAse (Roche, Basel, Switzerland) treatment. Reverse transcription was carried out using random hexamer primer and RevertaL enzyme (Amplisence, Moscow, Russia). PCR was performed using primers listed in Table 2. The standard reaction (10 μl) contained respective primers (0.8 µM each), cDNA equivalent to 10 ng of total RNA, and qPCRmix-HS SYBR (Evrogen, Moscow, Russia). The PCR thermal conditions for initial DNA denaturation were 55°C for 5 minutes and 95°C for 10 minutes, followed by 40 amplification cycles each of 95°C for 10 s and 57°C for 1 minute. Afterwards, DNA melting was performed to confirm amplification specificity. The results of RNA-qPCR were analyzed using the ΔΔCt approach.
4.7. Cell Viability Assays
Cells were seeded in 96-well plates (TPP, Trasadingen, Switzerland) at a density of 2 × 10⁴ cells/well. Twenty-four hours later, compounds were added followed by addition ofpoliovirus at multiplicities of infection (MOI) 0.00005-50 with 10-fold serial dilutions. As the control, untreated cells were infected with the virus at the same MOI. Cell viability was assessed twenty-four hours post-infection (unless otherwise stated) by treatment with 44 µM resazurin for 3 h and measurement of fluorescence 600 nm with excitation at 545 nm using a ClarioStar Plus microplate reader (BMG LabTech, Ortenberg, Germany).
4.8. Measurement of Glycolysis and Mitochondrial Respiration
Glycolysis and mitochondrial respiration were assessed by Seahorse technology on a XFe24 analyzer (Agilent Technologies, Santa-Clara, CA, USA) according to manufacturer’s instructions with slight modifications. Briefly, 24 h prior to analysis the cells were seeded via XF24 Cell Culture Microplate into (1.5 × 10⁵ cells/well) in DMEM or Plasmax media with four replicates. For the MitoStress test, 45 min before analysis the media was changed to DMEM or Plasmax lacking phenol red dye and bicarbonate and supplemented with 25 mM (DMEM) or 5.5 mM (Plasmax) glucose, 2 mM pyruvate and 2 mM glutamine, and the plate was kept at 37°C at normal atmosphere. To evaluate respiration-linked ATP production, maximum respiratory capacity, and non-mitochondrial respiration, ATP-synthase inhibitor oligomycin, uncoupler FCCP, and a mixture of complex I and III inhibitors rotenone and antimycin were added to final concentrations of 1 µM (oligomycin), 0.45 µM (FCCP), and 1 µM each (rotenone/antimycin). For each condition, three readings were performed at 3 min intervals.
In case of the GlycoStress test, 30 min prior to analysis, the medium was changed to DMEM or Plasmax lacking phenol red dye, bicarbonate and glucose and supplemented with 2 mM pyruvate and 2 mM glutamine. During the assay 5.5 and 25 mM glycose, 1 µM oligomycin and 50 mM 2-deoxyglucose were added to access basal glycolysis, maximal glycolytic capacity, and non-glycolytic acidification, respectively. The raw data were processed by Seahorse Wave Desktop software (Agilent Technologies).
4.9. Immunostaining
Cells were seeded in 48-well plates (TPP, Trasadingen, Switzerland) at a density of 1.2 × 10⁵ cells/well. Twenty-four hours later, poliovirus was added at MOI 10, 3, 1, or 0.1. After 24 or 48 hours, the medium was removed and the cells were washed with phosphate buffer saline (PBS). Next, the cells were fixed with paraformaldehyde (PFA) at room temperature, permeabilized with 0.5% Triton X-100, the cells were washed with PBS, and 3% BSA in PBS was added, the cells were incubated for 1 hour at 37°C. Primary mouse antibodies to poliovirus (Santa Crus Biotechnologies, Santa-Clara, CA, USA, #sc-80633) were diluted in 2% bovine serum albumin (BSA) in PBS, added to the wells, and incubated for 1 hour at 37°C. Then the cells were washed with PBS and incubated with FITC-conjugated secondary goat anti-mouse IgG (cat # S0007, Affinity Biosciences, Cincinnati, OH USA) in PBS containing 1% BSA for 1 hour at 37°C. After washing step, DAPI was added to the cells to 300 nM final concentration for 5 mins at RT. The results were visualized on a ZOE fluorescence microscope (BioRad, USA) in blue and green channels and processed in ImageJ (NIH, USA).
4.10. Liquid Chromatography
The cells were grown on 6-well plates. After removal of culture cell medium, cells washed up twice by 1 mL PBS on ice. Then 0.1 ml mQ was added per well and plate was subjected to three cycles of freezing (-196 ºC) and thawing at +4º C. After the final thaw, samples were transferred to 0.5 ml polyethylene tubes. Each well was washed up with additional 0.1 ml mQ, combined with the crude cell lysates and subjected to ultrasound treatment for 3 min at 0-4ºC. Debris was removed by centrifugation for 10 min at 14,000 g. Total protein content in supernatants was measured using Pierce™ BCA Protein Assay Kit (Thermo Scientific, USA) prior precipitation of protein by addition of 60% perchloric acid to the final 3% concentration with subsequent clarifying by centrifugation for 10 min at 14,000 g. The clarified lysates were lyophilized and kept at -80ºC prior to analysis.
Polyamines were quantified by high-pressure liquid chromatography (HPLC) with precolumn derivatization with dansyl chloride. The analysis was performed by dissolving dry samples in 100 µl of saturated at 20ºC Na2CO3 aqueous solution. A different ratio mixture of 1,6-diaminohexane and 1,7-diaminoheptane were used as an internal standard and hydrazine hydrate (2 µl) applied to quench the dansylation reaction.
The solution of the dansylated polyamines in toluene (after two-step extraction with 200 µl of toluene) was vacuum dried, the residue was dissolved in 200 µl of methanol and applied on a reversed phase column (Cosmosil C18-MS-II, 250 x 4.6 mm, 5 µm, 100 Å). The column was eluted (1 mL/min) with the gradient: 0 min—0% B; 5 min—0% B; 60 min—100% B; 65 min—100%B, 70 min—0% B, 75 min—0% B. System A—30% acetonitrile, 69.5% H2O, 0.5% propionic acid. System B—79.5% acetonitrile, 20% tetrahydrofuran, 0.5% propionic acid. Column temperature 40 ºC, pressure 80–120 bar, fluorescent detection: λex 340 nm, λem 530 nm (detector RF-20A, Shimadzu Scientific Instrument, Columbia, MD, USA).
4.11. Metabolite Quantification by Gas Chromatography-Mass Spectrometry
Metabolite quantification was performed by GC-MS method. The cells were grown on 6-cm dishes and infected with the virus at MOI 1, harvested using trypsin-EDTA solution and consequent centrifugation at 3600 rpm. After washing with PBS, each sample was divided to 1/10 for quantification of total protein, and 9/10 for metabolite analysis. The pellets were stored at -80○C prior further processing. Total protein was quantified with Micro BCA kit (Thermo Fischer Scientific, USA).
Metabolites were extracted according to Fiehn’s protocol [107]. Each pellet was resuspended by vortexing in 1 mL of a chilled mixture of acetonitrile : 2-propanol : water (3:3:2) supplemented with 3.4 µmol nor-valine and shacked for 20 mins at 4○C, vacuum-dried, dissolved in mixture of acetonitrile-water and again dried. Metabolites were derivatized with O-methylhydroxylamine, shacked for 1.5 h at 30○C, and later with MSTFA with 30 mins shacking at 37○C as described in [108]. Measurements were carried out on a gas chromatography-mass spectrometer coupled with a monoquadrupole mass spectrometric detector (Crystal 5000, Yoshkar-Ola, Russia). Samples (1 μl) were injected into a helium stream at a rate of 1 ml/min, electron ionization was performed at 20 meV. Metabolites were separated on an HP-5 ms column (30 mm × 0.25 mm × 0.25 μm) (Agilent Technologies, California, USA). The injector, transfer line and ion source temperatures were set to 250°C, 290°C and 230°C, respectively. Raw spectra were analyzed by Chromatec Analytic Software (Yoshkar-Ola, Russia). Quantification of the compounds was performed in the single ion monitoring mode in each channel, determining for each metabolite a characteristic ion in a narrow range of retention times for a given compound. Retention times and masses were obtained by analyzing standards of the corresponding compounds, carried out using the same derivatization protocol, analytical parameters and instruments and are listed in Table S1. The concentration of each compound was calculated from the peak intensity using a calibration curve obtained under the same experimental conditions. The values were then normalized to the signal of nor-valine used as an internal standard, as well as to the corresponding values of these metabolites obtained from pooled control samples.
4.12. Interferon Cell Treatment
U-251 MG and DBTRG-05MG cells were treated with 1000 IU of interferon α-2b (Vector-Medica, Novosibirsk, Russia) and incubated under standard conditions in a cell incubator for 24 hours for subsequent GC-MS analysis and PCR verification. For this purpose, a commercial IFNα-2b lyophilizate containing 3x10⁶ IU was diluted in one ml of PBS and aliquoted in 50 μl aliquots that were stored at -20°C for no more than a month.
4.13. Staining of Neutral Lipids
Neutral lipids were quantified by staining using BODIPY 493/503 dye. Cells were plated in 12-well plates and infected with poliovirus at MOI 1 when subconfluency was achieved. After 24 h.p.i., the culture fluid was removed and the cells were washed with PBS, fixed in 4% PFA at room temperature for 20 min and washed with PBS again. Then 250 μg/ml BODIPY 493/503 in DMSO was added and the cells were incubated for 15 min in dark. The dye-containing solution was removed, the cells were washed again with PBS, treated with 300 nM DAPI solution for 5 minutes in a CO2-incubator, and washed again with PBS. Fluorescence was visualized using a ZOE fluorescent cell analyzer (BioRad, USA) and processed in ImageJ (NIH, USA).
4.14. Flow Cytometry
Production of reactive oxygen species was accessed using superoxide-sensitive fluorescent dihydroethidium (DHE) dye. The cells were stained as described earlier [109]. Intensity of fluorescence corresponding to specific product (2-hydroxyethidine) was measured by flow cytometry at 405/610 nm [109,110] on BD LSR Fortessa Cytometer (Becton Dickinson, Franklin Lakes, NJ, USA).
4.15. Sensors/Confocal Microscopy
Hydrogen peroxide levels were assessed by genetically-encoded HyPer7 sensor fused to β-actin (HyPer7-LifeAct) [111]. Its gene was amplified from the plasmid pLifeAct-HyPer7 kindly provided by prof. Belousov (Federal Center for Brain and Neurotechnologies, FMBA of Russia, Moscow, Russia), using oligonucleotides Hyp7Lifeact-Puro-F (5’-atgctagcgccaccatgggc-3’) and Hyp7Lifeact-Puro-R (5’-atgaattctcaatcgcagatgaagctaac-3’) and cloned into EcoRI site of a lentiviral pL4Puro vector. The lentivirus was assembled by transfection of the resulting pL4Puro-HyPer7-LifeAct plasmid mixed with pLP1, pLP2 and pVSV-G (Invitrogen, Carlsbad, CA, USA). The medium containing the lentiviral particles was harvested, filtered through a 0.22-µm filter and used for transduction of HEK293TΔIFNR1 cells with subsequent selection using puromycin similarly to described previously [112].
For H2O2 analysis, HEK293TΔIFNR1-HyPer7-Lifeact cells were seeded on 35 x 10 mm confocal Petri dishes with a glass insert (SPL LifeSciences, Republic of Korea). Subconfluent cells were infected with poliovirus at MOI 1 for 7 and 14 h. As a positive control, the cells were treated with 200 μM H2O2 5 min prior analysis. Microscopic imaging and ratiometric analysis were performed using a Nikon Ti2 Eclipse confocal microscope (Nikon Microscope Solutions, Amstelveen, North Holland) equipped with CFI Plan Apochromat Lambda D 10X objective lens. HyPER7 fluorescence was registered in 499-563 nm range after excitation either with 405 nm or 488 nm. The ratiometric index was calculated as a ratio of λex488/λex405 fluorescence.
4.16. Statistical Analysis
All data were obtained from at least three independent experiments. The data are presented as means ± standard deviation (SD). Statistical significance was determined by two-tailed unpaired t-test (pairwise comparison) or by two-way Analysis of Variance (ANOVA) followed by Tukey’s or Bonferroni post-hoc test using GraphPad Prism 9.5 (GraphPad Software, La Jolla, CA, USA). A p-value of ≤0.05 was considered as significant.
5. Conclusions
To sum up, we have shown that poliovirus reprograms metabolism of glioblastoma cells, but most changes are dispensable for virus replication and oncolytic activity. It implies that oncolytic potential of poliovirus against GBM cannot be enhanced by pharmacologic inhibitors of metabolic enzymes. Moreover, Eflornithine that inhibits biosynthesis of biogenic polyamines can decrease efficacy of oncolysis by poliovirus, as it interferes with replication of the latter. Finally, we demonstrate that choice of cell culture media critically affects cell metabolism and imprint of viral infections.
Supplementary Materials
The following supporting information can be downloaded at the website of this paper posted on Preprints.org.
Author Contributions
For research articles with several authors, a short paragraph specifying their individual contributions must be provided. The following statements should be used “Conceptualization, M.Z., A.L. and A.I.; methodology, D.Y., A.L. and A.I.; formal analysis, M.Z., D.Y., O.I., A.F., A.L. and A.I.; investigation, M.Z., D.Y., O.I., E.D., M.G., A.F., R.F., V.S., D.G. and A.L.; resources, D.Y., P.C., A.L. and A.I.; data curation, M.Z., D.Y., A.F., P.C., A.L. and A.I.; writing—original draft preparation, M.Z., D.Y., A.L. and A.I.; writing—review and editing, M.Z., D.Y., O.I., E.D., M.G., A.F., R.F., V.S., D.G., P.C., A.L. and A.I.; visualization, M.Z., A.F. D.G. and A.I..; supervision, A.L. and A.I.; project administration, A.L. and A.I.; funding acquisition, A.F. and A.L. All authors have read and agreed to the published version of the manuscript.
Funding
This research was funded by Russian science foundation (grant #23-74-10102), while metabolomics analysis was supported by grant #24-74-10092)
Data Availability Statement
The raw data supporting the conclusions of this article will be made available by the authors on request.
Conflicts of Interest
The authors declare no conflict of interest.
References
- Ostrom, Q.T.; Gittleman, H.; Farah, P.; Ondracek, A.; Chen, Y.; Wolinsky, Y.; Stroup, N.E.; Kruchko, C.; Barnholtz-Sloan, J.S. CBTRUS Statistical Report: Primary Brain and Central Nervous System Tumors Diagnosed in the United States in 2006-2010. Neuro Oncol 2013, 15 Suppl 2, ii1-56. [Google Scholar] [CrossRef]
- Tamimi, A.F.; Juweid, M. Epidemiology and Outcome of Glioblastoma. In Glioblastoma; De Vleeschouwer, S., Ed.; Codon Publications: Brisbane (AU), 2017; ISBN 978-0-9944381-2-6. [Google Scholar]
- Ahmadloo, N.; Kani, A.-A.; Mohammadianpanah, M.; Nasrolahi, H.; Omidvari, S.; Mosalaei, A.; Ansari, M. Treatment Outcome and Prognostic Factors of Adult Glioblastoma Multiforme. Journal of the Egyptian National Cancer Institute 2013, 25, 21–30. [Google Scholar] [CrossRef] [PubMed]
- Liu, Y.; Zhou, F.; Ali, H.; Lathia, J.D.; Chen, P. Immunotherapy for Glioblastoma: Current State, Challenges, and Future Perspectives. Cell Mol Immunol 2024, 21, 1354–1375. [Google Scholar] [CrossRef] [PubMed]
- Fernandes, C.; Costa, A.; Osório, L.; Lago, R.C.; Linhares, P.; Carvalho, B.; Caeiro, C. Current Standards of Care in Glioblastoma Therapy. In Glioblastoma; De Vleeschouwer, S., Ed.; Codon Publications: Brisbane (AU), 2017; ISBN 978-0-9944381-2-6. [Google Scholar]
- Weller, M.; van den Bent, M.; Preusser, M.; Le Rhun, E.; Tonn, J.C.; Minniti, G.; Bendszus, M.; Balana, C.; Chinot, O.; Dirven, L.; et al. EANO Guidelines on the Diagnosis and Treatment of Diffuse Gliomas of Adulthood. Nat Rev Clin Oncol 2021, 18, 170–186. [Google Scholar] [CrossRef]
- Stupp, R.; Mason, W.P.; van den Bent, M.J.; Weller, M.; Fisher, B.; Taphoorn, M.J.B.; Belanger, K.; Brandes, A.A.; Marosi, C.; Bogdahn, U.; et al. Radiotherapy plus Concomitant and Adjuvant Temozolomide for Glioblastoma. N Engl J Med 2005, 352, 987–996. [Google Scholar] [CrossRef]
- Gesundheit, B.; Ben-David, E.; Posen, Y.; Ellis, R.; Wollmann, G.; Schneider, E.M.; Aigner, K.; Brauns, L.; Nesselhut, T.; Ackva, I.; et al. Effective Treatment of Glioblastoma Multiforme With Oncolytic Virotherapy: A Case-Series. Front. Oncol. 2020, 10. [Google Scholar] [CrossRef]
- Alwithenani, A.; Hengswat, P.; Chiocca, E.A. Oncolytic Viruses as Cancer Therapeutics: From Mechanistic Insights to Clinical Translation. Mol Ther 2025, 33, 2217–2228. [Google Scholar] [CrossRef] [PubMed]
- Alekseeva, O.N.; Hoa, L.T.; Vorobyev, P.O.; Kochetkov, D.V.; Gumennaya, Y.D.; Naberezhnaya, E.R.; Chuvashov, D.O.; Ivanov, A.V.; Chumakov, P.M.; Lipatova, A.V. Receptors and Host Factors for Enterovirus Infection: Implications for Cancer Therapy. Cancers 2024, 16, 3139. [Google Scholar] [CrossRef]
- Shen, Y.; Bai, X.; Zhang, Q.; Liang, X.; Jin, X.; Zhao, Z.; Song, W.; Tan, Q.; Zhao, R.; Jia, W.; et al. Oncolytic Virus VG161 in Refractory Hepatocellular Carcinoma. Nature 2025, 641, 503–511. [Google Scholar] [CrossRef]
- Lawler, S.E.; Speranza, M.-C.; Cho, C.-F.; Chiocca, E.A. Oncolytic Viruses in Cancer Treatment: A Review. JAMA Oncology 2017, 3, 841–849. [Google Scholar] [CrossRef]
- Sosnovtseva, A.O.; Lipatova, A.V.; Grinenko, N.F.; Baklaushev, V.P.; Chumakov, P.M.; Chekhonin, V.P. Sensitivity of C6 Glioma Cells Carrying the Human Poliovirus Receptor to Oncolytic Polioviruses. Bull Exp Biol Med 2016, 161, 821–825. [Google Scholar] [CrossRef] [PubMed]
- Brown, M.C.; Dobrikova, E.Y.; Dobrikov, M.I.; Walton, R.W.; Gemberling, S.L.; Nair, S.K.; Desjardins, A.; Sampson, J.H.; Friedman, H.S.; Friedman, A.H.; et al. Oncolytic Polio Virotherapy of Cancer. [CrossRef]
- Sanchez, E.L.; Lagunoff, M. Viral Activation of Cellular Metabolism. Virology 2015, 479–480, 609–618. [Google Scholar] [CrossRef]
- Gaballah, A.; Bartosch, B. An Update on the Metabolic Landscape of Oncogenic Viruses. Cancers (Basel) 2022, 14, 5742. [Google Scholar] [CrossRef]
- Lévy, P.; Bartosch, B. Metabolic Reprogramming: A Hallmark of Viral Oncogenesis. Oncogene 2016, 35, 4155–4164. [Google Scholar] [CrossRef]
- Lange, P.T.; Lagunoff, M.; Tarakanova, V.L. Chewing the Fat: The Conserved Ability of DNA Viruses to Hijack Cellular Lipid Metabolism. Viruses 2019, 11, 119. [Google Scholar] [CrossRef]
- Chan, R.B.; Tanner, L.; Wenk, M.R. Implications for Lipids during Replication of Enveloped Viruses. Chemistry and Physics of Lipids 2010, 163, 449–459. [Google Scholar] [CrossRef] [PubMed]
- Zakirova, N.F.; Khomich, O.A.; Smirnova, O.A.; Molle, J.; Duponchel, S.; Yanvarev, D.V.; Valuev-Elliston, V.T.; Monnier, L.; Grigorov, B.; Ivanova, O.N.; et al. Hepatitis C Virus Dysregulates Polyamine and Proline Metabolism and Perturbs the Urea Cycle. Cells 2024, 13, 1036. [Google Scholar] [CrossRef]
- Cruz-Pulido, Y.E.; LoMascolo, N.J.; May, D.; Hatahet, J.; Thomas, C.E.; Chu, A.K.W.; Stacey, S.P.; Guzman, M. del M.V.; Aubert, G.; Mounce, B.C. Polyamines Mediate Cellular Energetics and Lipid Metabolism through Mitochondrial Respiration to Facilitate Virus Replication. PLOS Pathogens 2024, 20, e1012711. [Google Scholar] [CrossRef] [PubMed]
- Mastrodomenico, V.; LoMascolo, N.J.; Firpo, M.R.; Villanueva Guzman, M.D.M.; Zaporowski, A.; Mounce, B.C. Persistent Coxsackievirus B3 Infection in Pancreatic Ductal Cells In Vitro Downregulates Cellular Polyamine Metabolism. mSphere 2023, 8, e0003623. [Google Scholar] [CrossRef]
- Wan, Q.; Tavakoli, L.; Wang, T.-Y.; Tucker, A.J.; Zhou, R.; Liu, Q.; Feng, S.; Choi, D.; He, Z.; Gack, M.U.; et al. Hijacking of Nucleotide Biosynthesis and Deamidation-Mediated Glycolysis by an Oncogenic Herpesvirus. Nat Commun 2024, 15, 1442. [Google Scholar] [CrossRef]
- Zhu, Y.; Li, T.; Ramos da Silva, S.; Lee, J.-J.; Lu, C.; Eoh, H.; Jung, J.U.; Gao, S.-J. A Critical Role of Glutamine and Asparagine γ-Nitrogen in Nucleotide Biosynthesis in Cancer Cells Hijacked by an Oncogenic Virus. mBio 2017, 8, e01179-17. [Google Scholar] [CrossRef] [PubMed]
- Verrier, E.R.; Weiss, A.; Bach, C.; Heydmann, L.; Turon-Lagot, V.; Kopp, A.; El Saghire, H.; Crouchet, E.; Pessaux, P.; Garcia, T.; et al. Combined Small Molecule and Loss-of-Function Screen Uncovers Estrogen Receptor Alpha and CAD as Host Factors for HDV Infection and Antiviral Targets. Gut 2020, 69, 158–167. [Google Scholar] [CrossRef] [PubMed]
- Firpo, M.R.; Mastrodomenico, V.; Hawkins, G.M.; Prot, M.; Levillayer, L.; Gallagher, T.; Simon-Loriere, E.; Mounce, B.C. Targeting Polyamines Inhibits Coronavirus Infection by Reducing Cellular Attachment and Entry. ACS Infect Dis 2021, 7, 1423–1432. [Google Scholar] [CrossRef]
- Mastrodomenico, V.; Esin, J.J.; Graham, M.L.; Tate, P.M.; Hawkins, G.M.; Sandler, Z.J.; Rademacher, D.J.; Kicmal, T.M.; Dial, C.N.; Mounce, B.C. Polyamine Depletion Inhibits Bunyavirus Infection via Generation of Noninfectious Interfering Virions. J Virol 2019, 93, e00530-19. [Google Scholar] [CrossRef]
- Bhatt, A.N.; Shenoy, S.; Munjal, S.; Chinnadurai, V.; Agarwal, A.; Vinoth Kumar, A.; Shanavas, A.; Kanwar, R.; Chandna, S. 2-Deoxy-D-Glucose as an Adjunct to Standard of Care in the Medical Management of COVID-19: A Proof-of-Concept and Dose-Ranging Randomised Phase II Clinical Trial. BMC Infect Dis 2022, 22, 669. [Google Scholar] [CrossRef]
- Ivanov, A.V.; Valuev-Elliston, V.T.; Tyurina, D.A.; Ivanova, O.N.; Kochetkov, S.N.; Bartosch, B.; Isaguliants, M.G. Oxidative Stress, a Trigger of Hepatitis C and B Virus-Induced Liver Carcinogenesis. Oncotarget 2016, 8, 3895–3932. [Google Scholar] [CrossRef] [PubMed]
- Ivanov, A.V.; Valuev-Elliston, V.T.; Ivanova, O.N.; Kochetkov, S.N.; Starodubova, E.S.; Bartosch, B.; Isaguliants, M.G. Oxidative Stress during HIV Infection: Mechanisms and Consequences. [CrossRef]
- Khomich, O.A.; Kochetkov, S.N.; Bartosch, B.; Ivanov, A.V. Redox Biology of Respiratory Viral Infections. Viruses 2018, 10, 392. [Google Scholar] [CrossRef]
- Eagle, H.; Habel, K. THE NUTRITIONAL REQUIREMENTS FOR THE PROPAGATION OF POLIOMYELITIS VIRUS BY THE HELA CELL. Journal of Experimental Medicine 1956, 104, 271–287. [Google Scholar] [CrossRef]
- Mosser, A.G.; Caliguiri, L.A.; Tamm, I. Incorporation of Lipid Precursors into Cytoplasmic Membranes of Poliovirus-Infected HeLa Cells. Virology 1972, 47, 39–47. [Google Scholar] [CrossRef]
- Nchoutmboube, J.; Viktorova, E.; Scott, A.; Ford, L.; Pei, Z.; Watkins, P.; Ernst, R.; Belov, G. Increased Long Chain Acyl-Coa Synthetase Activity and Fatty Acid Import Is Linked to Membrane Synthesis for Development of Picornavirus Replication Organelles. PLoS pathogens 2013, 9, e1003401. [Google Scholar] [CrossRef]
- Vorobyev, P.O.; Kochetkov, D.V.; Chumakov, P.M.; Zakirova, N.F.; Zotova-Nefedorova, S.I.; Vasilenko, K.V.; Alekseeva, O.N.; Kochetkov, S.N.; Bartosch, B.; Lipatova, A.V.; et al. 2-Deoxyglucose, an Inhibitor of Glycolysis, Enhances the Oncolytic Effect of Coxsackievirus. Cancers 2022, 14, 5611. [Google Scholar] [CrossRef] [PubMed]
- Golikov, M.V.; Bartosch, B.; Smirnova, O.A.; Ivanova, O.N.; Ivanov, A.V. Plasma-Like Culture Medium for the Study of Viruses. mBio 2022. [Google Scholar] [CrossRef] [PubMed]
- Golikov, M.V.; Karpenko, I.L.; Lipatova, A.V.; Ivanova, O.N.; Fedyakina, I.T.; Larichev, V.F.; Zakirova, N.F.; Leonova, O.G.; Popenko, V.I.; Bartosch, B.; et al. Cultivation of Cells in a Physiological Plasmax Medium Increases Mitochondrial Respiratory Capacity and Reduces Replication Levels of RNA Viruses. Antioxidants 2022, 11, 97. [Google Scholar] [CrossRef] [PubMed]
- Limpens, R.W.A.L.; van der Schaar, H.M.; Kumar, D.; Koster, A.J.; Snijder, E.J.; van Kuppeveld, F.J.M.; Bárcena, M. The Transformation of Enterovirus Replication Structures: A Three-Dimensional Study of Single- and Double-Membrane Compartments. mBio 2011, 2. [Google Scholar] [CrossRef]
- Mounce, B.C.; Olsen, M.E.; Vignuzzi, M.; Connor, J.H. Polyamines and Their Role in Virus Infection. Microbiol Mol Biol Rev 2017, 81, e00029-17. [Google Scholar] [CrossRef]
- Mastrodomenico, V.; Esin, J.J.; Qazi, S.; Khomutov, M.A.; Ivanov, A.V.; Mukhopadhyay, S.; Mounce, B.C. Virion-Associated Polyamines Transmit with Bunyaviruses to Maintain Infectivity and Promote Entry. ACS Infect. Dis. 2020, 6, 2490–2501. [Google Scholar] [CrossRef]
- Aleksunes, L.M.; Manautou, J.E. Emerging Role of Nrf2 in Protecting against Hepatic and Gastrointestinal Disease. Toxicol Pathol 2007, 35, 459–473. [Google Scholar] [CrossRef]
- Prestwich, R.J.; Errington, F.; Harrington, K.J.; Pandha, H.S.; Selby, P.; Melcher, A. Oncolytic Viruses: Do They Have a Role in Anti-Cancer Therapy? Clin Med Oncol 2008, 2, 83–96. [Google Scholar] [CrossRef]
- Andtbacka, R.H.I.; Kaufman, H.L.; Collichio, F.; Amatruda, T.; Senzer, N.; Chesney, J.; Delman, K.A.; Spitler, L.E.; Puzanov, I.; Agarwala, S.S.; et al. Talimogene Laherparepvec Improves Durable Response Rate in Patients With Advanced Melanoma. J Clin Oncol 2015, 33, 2780–2788. [Google Scholar] [CrossRef]
- Xia, Z.-J.; Chang, J.-H.; Zhang, L.; Jiang, W.-Q.; Guan, Z.-Z.; Liu, J.-W.; Zhang, Y.; Hu, X.-H.; Wu, G.-H.; Wang, H.-Q.; et al. [Phase III randomized clinical trial of intratumoral injection of E1B gene-deleted adenovirus (H101) combined with cisplatin-based chemotherapy in treating squamous cell cancer of head and neck or esophagus]. Ai Zheng 2004, 23, 1666–1670. [Google Scholar]
- Alberts, P.; Tilgase, A.; Rasa, A.; Bandere, K.; Venskus, D. The Advent of Oncolytic Virotherapy in Oncology: The Rigvir® Story. European Journal of Pharmacology 2018, 837, 117–126. [Google Scholar] [CrossRef] [PubMed]
- Frampton, J.E. Teserpaturev/G47Δ: First Approval. BioDrugs 2022, 36, 667–672. [Google Scholar] [CrossRef] [PubMed]
- Romanishin, A.; Vasilev, A.; Khasanshin, E.; Evtekhov, A.; Pusynin, E.; Rubina, K.; Kakotkin, V.; Agapov, M.; Semina, E. Oncolytic Viral Therapy for Gliomas: Advances in the Mechanisms and Approaches to Delivery. Virology 2024, 593, 110033. [Google Scholar] [CrossRef]
- Du, W.; Na, J.; Zhong, L.; Zhang, P. Advances in Preclinical and Clinical Studies of Oncolytic Virus Combination Therapy. Front Oncol 2025, 15, 1545542. [Google Scholar] [CrossRef]
- Burton, C.; Das, A.; McDonald, D.; Vandergrift, W.A.; Patel, S.J.; Cachia, D.; Bartee, E. Oncolytic Myxoma Virus Synergizes with Standard of Care for Treatment of Glioblastoma Multiforme. Oncolytic Virother 2018, 7, 107–116. [Google Scholar] [CrossRef] [PubMed]
- Fan, J.; Jiang, H.; Cheng, L.; Ma, B.; Liu, R. Oncolytic Herpes Simplex Virus and Temozolomide Synergistically Inhibit Breast Cancer Cell Tumorigenesis in Vitro and in Vivo. Oncol Lett 2021, 21, 99. [Google Scholar] [CrossRef]
- Romanenko, M.V.; Dolgova, E.V.; Osipov, I.D.; Ritter, G.S.; Sizova, M.S.; Proskurina, A.S.; Efremov, Y.R.; Bayborodin, S.I.; Potter, E.A.; Taranov, O.S.; et al. Oncolytic Effect of Adenoviruses Serotypes 5 and 6 Against U87 Glioblastoma Cancer Stem Cells. Anticancer Research 2019, 39, 6073–6086. [Google Scholar] [CrossRef]
- Cuoco, J.A.; Rogers, C.M.; Mittal, S. The Oncolytic Newcastle Disease Virus as an Effective Immunotherapeutic Strategy against Glioblastoma. 2021. [Google Scholar] [CrossRef]
- Chen, Q.; Wu, J.; Ye, Q.; Ma, F.; Zhu, Q.; Wu, Y.; Shan, C.; Xie, X.; Li, D.; Zhan, X.; et al. Treatment of Human Glioblastoma with a Live Attenuated Zika Virus Vaccine Candidate. mBio 2018, 9. [Google Scholar] [CrossRef]
- Zhu, Z.; Gorman, M.J.; McKenzie, L.D.; Chai, J.N.; Hubert, C.G.; Prager, B.C.; Fernandez, E.; Richner, J.M.; Zhang, R.; Shan, C.; et al. Zika Virus Has Oncolytic Activity against Glioblastoma Stem Cells. Journal of Experimental Medicine 2017, 214, 2843–2857. [Google Scholar] [CrossRef]
- Lipatova, A.V.; Soboleva, A.V.; Gorshkov, V.A.; Bubis, J.A.; Solovyeva, E.M.; Krasnov, G.S.; Kochetkov, D.V.; Vorobyev, P.O.; Ilina, I.Y.; Moshkovskii, S.A.; et al. Multi-Omics Analysis of Glioblastoma Cells’ Sensitivity to Oncolytic Viruses. Cancers 2021, 13, 5268. [Google Scholar] [CrossRef] [PubMed]
- Allen, C.N.S.; Arjona, S.P.; Santerre, M.; Sawaya, B.E. Hallmarks of Metabolic Reprogramming and Their Role in Viral Pathogenesis. Viruses 2022, 14, 602. [Google Scholar] [CrossRef] [PubMed]
- Amatore, D.; Sgarbanti, R.; Aquilano, K.; Baldelli, S.; Limongi, D.; Civitelli, L.; Nencioni, L.; Garaci, E.; Ciriolo, M.R.; Palamara, A.T. Influenza Virus Replication in Lung Epithelial Cells Depends on Redox-sensitive Pathways Activated by NOX4-derived ROS. [CrossRef]
- Vancura, A.; Bu, P.; Bhagwat, M.; Zeng, J.; Vancurova, I. Metformin as an Anticancer Agent. Trends in Pharmacological Sciences 2018, 39, 867–878. [Google Scholar] [CrossRef]
- Benjanuwattra, J.; Chaiyawat, P.; Pruksakorn, D.; Koonrungsesomboon, N. Therapeutic Potential and Molecular Mechanisms of Mycophenolic Acid as an Anticancer Agent. European Journal of Pharmacology 2020, 887, 173580. [Google Scholar] [CrossRef] [PubMed]
- Cantor, J.R. The Rise of Physiologic Media. Trends in Cell Biology 2019, 29, 854–861. [Google Scholar] [CrossRef]
- Voorde, J.V.; Ackermann, T.; Pfetzer, N.; Sumpton, D.; Mackay, G.; Kalna, G.; Nixon, C.; Blyth, K.; Gottlieb, E.; Tardito, S. Improving the Metabolic Fidelity of Cancer Models with a Physiological Cell Culture Medium. Science Advances 2019. [Google Scholar] [CrossRef]
- Cantor, J.R.; Abu-Remaileh, M.; Kanarek, N.; Freinkman, E.; Gao, X.; Louissaint, A.; Lewis, C.A.; Sabatini, D.M. Physiologic Medium Rewires Cellular Metabolism and Reveals Uric Acid as an Endogenous Inhibitor of UMP Synthase. Cell 2017, 169, 258–272.e17. [Google Scholar] [CrossRef]
- Rawat, V.; DeLear, P.; Prashanth, P.; Ozgurses, M.E.; Tebeje, A.; Burns, P.A.; Conger, K.O.; Solís, C.; Hasnain, Y.; Novikova, A.; et al. Drug Screening in Human Physiologic Medium Identifies Uric Acid as an Inhibitor of Rigosertib Efficacy. JCI Insight 2024, 9, e174329. [Google Scholar] [CrossRef]
- Flickinger, K.M.; Wilson, K.M.; Rossiter, N.J.; Hunger, A.L.; Vishwasrao, P.V.; Lee, T.D.; Fritz, C.A.M.; Richards, R.M.; Hall, M.D.; Cantor, J.R. Conditional Lethality Profiling Reveals Anticancer Mechanisms of Action and Drug-Nutrient Interactions. Science Advances 2024. [Google Scholar] [CrossRef]
- Khadka, S.; Arthur, K.; Barekatain, Y.; Behr, E.; Washington, M.; Ackroyd, J.; Crowley, K.; Suriyamongkol, P.; Lin, Y.-H.; Pham, C.-D.; et al. Impaired Anaplerosis Is a Major Contributor to Glycolysis Inhibitor Toxicity in Glioma. Cancer Metab 2021, 9, 27. [Google Scholar] [CrossRef]
- Lee, M.-J.; Chen, Y.; Huang, Y.-P.; Hsu, Y.-C.; Chiang, L.-H.; Chen, T.-Y.; Wang, G.-J. Exogenous Polyamines Promote Osteogenic Differentiation by Reciprocally Regulating Osteogenic and Adipogenic Gene Expression. J Cell Biochem 2013, 114, 2718–2728. [Google Scholar] [CrossRef] [PubMed]
- Quemener, V.; Blanchard, Y.; Lescoat, D.; Havouis, R.; Moulinoux, J.P. Depletion in Nuclear Spermine during Human Spermatogenesis, a Natural Process of Cell Differentiation. Am J Physiol 1992, 263, C343–347. [Google Scholar] [CrossRef]
- Pegg, A.E. Mammalian Polyamine Metabolism and Function. IUBMB Life 2009, 61, 880–894. [Google Scholar] [CrossRef] [PubMed]
- Nishimura, K.; Murozumi, K.; Shirahata, A.; Park, M.H.; Kashiwagi, K.; Igarashi, K. Independent Roles of eIF5A and Polyamines in Cell Proliferation. Biochem J 2005, 385, 779–785. [Google Scholar] [CrossRef] [PubMed]
- Casero, R.A.; Murray Stewart, T.; Pegg, A.E. Polyamine Metabolism and Cancer: Treatments, Challenges and Opportunities. Nat Rev Cancer 2018, 18, 681–695. [Google Scholar] [CrossRef]
- Lewis, E.C.; Kraveka, J.M.; Ferguson, W.; Eslin, D.; Brown, V.I.; Bergendahl, G.; Roberts, W.; Wada, R.K.; Oesterheld, J.; Mitchell, D.; et al. A Subset Analysis of a Phase II Trial Evaluating the Use of DFMO as Maintenance Therapy for High-Risk Neuroblastoma. Int J Cancer 2020, 147, 3152–3159. [Google Scholar] [CrossRef]
- Sholler, G.L.S.; Ferguson, W.; Bergendahl, G.; Bond, J.P.; Neville, K.; Eslin, D.; Brown, V.; Roberts, W.; Wada, R.K.; Oesterheld, J.; et al. Maintenance DFMO Increases Survival in High Risk Neuroblastoma. Sci Rep 2018, 8, 14445. [Google Scholar] [CrossRef]
- Saulnier Sholler, G.L.; Gerner, E.W.; Bergendahl, G.; MacArthur, R.B.; VanderWerff, A.; Ashikaga, T.; Bond, J.P.; Ferguson, W.; Roberts, W.; Wada, R.K.; et al. A Phase I Trial of DFMO Targeting Polyamine Addiction in Patients with Relapsed/Refractory Neuroblastoma. PLoS One 2015, 10, e0127246. [Google Scholar] [CrossRef]
- Duke, E.S.; Bradford, D.; Sinha, A.K.; Mishra-Kalyani, P.S.; Lerro, C.C.; Rivera, D.; Wearne, E.; Miller, C.P.; Leighton, J.; Sabit, H.; et al. US Food and Drug Administration Approval Summary: Eflornithine for High-Risk Neuroblastoma After Prior Multiagent, Multimodality Therapy. J Clin Oncol 2024, 42, 3047–3057. [Google Scholar] [CrossRef]
- Romão, L.; do Canto, V.P.; Netz, P.A.; Moura-Neto, V.; Pinto, Â.C.; Follmer, C. Conjugation with Polyamines Enhances the Antitumor Activity of Naphthoquinones against Human Glioblastoma Cells. Anti-Cancer Drugs 2018, 29, 520. [Google Scholar] [CrossRef]
- Redgate, E.S.; Boggs, S.; Grudziak, A.; Deutsch, M. Polyamines in Brain Tumor Therapy. J Neuro-Oncol 1995, 25, 167–179. [Google Scholar] [CrossRef] [PubMed]
- A, A.G.; D, L.G.; Vassileios, R.; Vasiliki, G.; P, K.A. Difluoromethylornithine in Cancer: New Advances. Future Oncology 2017. [Google Scholar] [CrossRef]
- McBenedict, B.; Hauwanga, W.N.; Pogodina, A.; Singh, G.; Thomas, A.; Ibrahim, A.M.A.; Johnny, C.; Pessôa, B.L.; McBenedict, B.; Hauwanga, W.N.; et al. Approaches in Adult Glioblastoma Treatment: A Systematic Review of Emerging Therapies. Cureus 2024, 16. [Google Scholar] [CrossRef] [PubMed]
- Kuemmerle, A.; Schmid, C.; Bernhard, S.; Kande, V.; Mutombo, W.; Ilunga, M.; Lumpungu, I.; Mutanda, S.; Nganzobo, P.; Tete, D.N.; et al. Effectiveness of Nifurtimox Eflornithine Combination Therapy (NECT) in T. b. Gambiense Second Stage Sleeping Sickness Patients in the Democratic Republic of Congo: Report from a Field Study. PLoS Negl Trop Dis 2021, 15, e0009903. [Google Scholar] [CrossRef]
- Olsen, M.E.; Filone, C.M.; Rozelle, D.; Mire, C.E.; Agans, K.N.; Hensley, L.; Connor, J.H. Polyamines and Hypusination Are Required for Ebolavirus Gene Expression and Replication. mBio 2016, 7, e00882-16. [Google Scholar] [CrossRef] [PubMed]
- Fiches, G.N.; Wu, Z.; Zhou, D.; Biswas, A.; Li, T.-W.; Kong, W.; Jean, M.; Santoso, N.G.; Zhu, J. Polyamine Biosynthesis and eIF5A Hypusination Are Modulated by the DNA Tumor Virus KSHV and Promote KSHV Viral Infection. PLoS Pathog 2022, 18, e1010503. [Google Scholar] [CrossRef]
- Gibson, W.; van Breemen, R.; Fields, A.; LaFemina, R.; Irmiere, A. D,L-Alpha-Difluoromethylornithine Inhibits Human Cytomegalovirus Replication. J Virol 1984, 50, 145–154. [Google Scholar] [CrossRef]
- Rojas-Luna, L.; Posadas-Modragón, A.; Avila-Trejo, A.M.; Alcántara-Farfán, V.; Rodríguez-Páez, L.I.; Santiago-Cruz, J.A.; Pastor-Alonso, M.O.; Aguilar-Faisal, J.L. Inhibition of Chikungunya Virus Replication by N-ω-Chloroacetyl-L-Ornithine in C6/36, Vero Cells and Human Fibroblast BJ. Antiviral Therapy 2023. [Google Scholar] [CrossRef]
- Mounce, B.C.; Cesaro, T.; Vlajnić, L.; Vidiņa, A.; Vallet, T.; Weger-Lucarelli, J.; Passoni, G.; Stapleford, K.A.; Levraud, J.-P.; Vignuzzi, M. Chikungunya Virus Overcomes Polyamine Depletion by Mutation of nsP1 and the Opal Stop Codon To Confer Enhanced Replication and Fitness. J Virol 2017, 91, e00344-17. [Google Scholar] [CrossRef]
- Mounce, B.C.; Cesaro, T.; Moratorio, G.; Hooikaas, P.J.; Yakovleva, A.; Werneke, S.W.; Smith, E.C.; Poirier, E.Z.; Simon-Loriere, E.; Prot, M.; et al. Inhibition of Polyamine Biosynthesis Is a Broad-Spectrum Strategy against RNA Viruses. Journal of Virology 2016, 90, 9683–9692. [Google Scholar] [CrossRef]
- Mao, B.; Wang, Z.; Pi, S.; Long, Q.; Chen, K.; Cui, J.; Huang, A.; Hu, Y. Difluoromethylornithine, a Decarboxylase 1 Inhibitor, Suppresses Hepatitis B Virus Replication by Reducing HBc Protein Levels. Front Cell Infect Microbiol 2020, 10, 158. [Google Scholar] [CrossRef] [PubMed]
- Mounce, B.C.; Poirier, E.Z.; Passoni, G.; Simon-Loriere, E.; Cesaro, T.; Prot, M.; Stapleford, K.A.; Moratorio, G.; Sakuntabhai, A.; Levraud, J.-P.; et al. Interferon-Induced Spermidine-Spermine Acetyltransferase and Polyamine Depletion Restrict Zika and Chikungunya Viruses. Cell Host Microbe 2016, 20, 167–177. [Google Scholar] [CrossRef] [PubMed]
- Olsen, M.E.; Cressey, T.N.; Mühlberger, E.; Connor, J.H. Differential Mechanisms for the Involvement of Polyamines and Hypusinated eIF5A in Ebola Virus Gene Expression. J Virol 2018, 92, e01260-18. [Google Scholar] [CrossRef] [PubMed]
- Gibson, W.; Roizman, B. Compartmentalization of Spermine and Spermidine in the Herpes Simplex Virion. Proc Natl Acad Sci U S A 1971, 68, 2818–2821. [Google Scholar] [CrossRef]
- Mastrodomenico, V.; LoMascolo, N.J.; Cruz-Pulido, Y.E.; Cunha, C.R.; Mounce, B.C. Polyamine-Linked Cholesterol Incorporation in Rift Valley Fever Virus Particles Promotes Infectivity. ACS Infect Dis 2022, 8, 1439–1448. [Google Scholar] [CrossRef]
- Firpo, M.R.; LoMascolo, N.J.; Petit, M.J.; Shah, P.S.; Mounce, B.C. Polyamines and eIF5A Hypusination Facilitate SREBP2 Synthesis and Cholesterol Production Leading to Enhanced Enterovirus Attachment and Infection. PLoS Pathog 2023, 19, e1011317. [Google Scholar] [CrossRef]
- Kicmal, T.M.; Tate, P.M.; Dial, C.N.; Esin, J.J.; Mounce, B.C. Polyamine Depletion Abrogates Enterovirus Cellular Attachment. Journal of Virology 2019, 93, e01054-19. [Google Scholar] [CrossRef]
- Gassen, N.C.; Papies, J.; Bajaj, T.; Emanuel, J.; Dethloff, F.; Chua, R.L.; Trimpert, J.; Heinemann, N.; Niemeyer, C.; Weege, F.; et al. SARS-CoV-2-Mediated Dysregulation of Metabolism and Autophagy Uncovers Host-Targeting Antivirals. Nat Commun 2021, 12, 3818. [Google Scholar] [CrossRef]
- Darnell, J.E.; Eagle, H. Glucose and Glutamine in Poliovirus Production by HeLa Cells. Virology 1958, 6, 556–566. [Google Scholar] [CrossRef]
- Zhang, Z.; Hu, H.; Luo, Q.; Yang, K.; Zou, Z.; Shi, M.; Liang, W. Dihydroxyacetone Phosphate Accumulation Leads to Podocyte Pyroptosis in Diabetic Kidney Disease. J Cell Mol Med 2024, 28, e18073. [Google Scholar] [CrossRef]
- Hernandez, A.; Sonavane, M.; Smith, K.R.; Seiger, J.; Migaud, M.E.; Gassman, N.R. Dihydroxyacetone Suppresses mTOR Nutrient Signaling and Induces Mitochondrial Stress in Liver Cells. PLoS One 2022, 17, e0278516. [Google Scholar] [CrossRef] [PubMed]
- Smith, K.R.; Hayat, F.; Andrews, J.F.; Migaud, M.E.; Gassman, N.R. Dihydroxyacetone Exposure Alters NAD(P)H and Induces Mitochondrial Stress and Autophagy in HEK293T Cells. Chem Res Toxicol 2019, 32, 1722–1731. [Google Scholar] [CrossRef] [PubMed]
- Ivanov, A.V.; Bartosch, B.; Isaguliants, M.G. Oxidative Stress in Infection and Consequent Disease. Oxid Med Cell Longev 2017, 2017, 3496043. [Google Scholar] [CrossRef] [PubMed]
- Kavouras, J.H.; Prandovszky, E.; Valyi-Nagy, K.; Kovacs, S.K.; Tiwari, V.; Kovacs, M.; Shukla, D.; Valyi-Nagy, T. Herpes Simplex Virus Type 1 Infection Induces Oxidative Stress and the Release of Bioactive Lipid Peroxidation By-Products in Mouse P19N Neural Cell Cultures. J Neurovirol 2007, 13, 416–425. [Google Scholar] [CrossRef]
- Chernyak, B.V.; Popova, E.N.; Prikhodko, A.S.; Grebenchikov, O.A.; Zinovkina, L.A.; Zinovkin, R.A. COVID-19 and Oxidative Stress. Biochemistry (Mosc) 2020, 85, 1543–1553. [Google Scholar] [CrossRef]
- Tung, W.-H.; Hsieh, H.-L.; Lee, I.-T.; Yang, C.-M. Enterovirus 71 Induces Integrin Β1/EGFR-Rac1-Dependent Oxidative Stress in SK-N-SH Cells: Role of HO-1/CO in Viral Replication. J Cell Physiol 2011, 226, 3316–3329. [Google Scholar] [CrossRef]
- Cheng, M.-L.; Weng, S.-F.; Kuo, C.-H.; Ho, H.-Y. Enterovirus 71 Induces Mitochondrial Reactive Oxygen Species Generation That Is Required for Efficient Replication. PLoS One 2014, 9, e113234. [Google Scholar] [CrossRef]
- Xie, B.; Zhou, J.-F.; Lu, Q.; Li, C.-J.; Chen, P. Oxidative Stress in Patients with Acute Coxsackie Virus Myocarditis. Biomed Environ Sci 2002, 15, 48–57. [Google Scholar]
- Sciacovelli, M.; Frezza, C. Oncometabolites: Unconventional Triggers of Oncogenic Signalling Cascades. Free Radical Biology and Medicine 2016, 100, 175–181. [Google Scholar] [CrossRef]
- Le, T.H.; Lipatova, A.V.; Volskaya, M.A.; Tikhonova, O.A.; Chumakov, P.M. The State of The Jak/Stat Pathway Affects the Sensitivity of Tumor Cells to Oncolytic Enteroviruses. Mol Biol 2020, 54, 570–577. [Google Scholar] [CrossRef]
- Reed, L.J.; Muench, H. A SIMPLE METHOD OF ESTIMATING FIFTY PER CENT ENDPOINTS l’2.
- Fiehn, O. Metabolomics by Gas Chromatography-Mass Spectrometry: Combined Targeted and Untargeted Profiling. Curr Protoc Mol Biol 2016, 114, 30.4.1–30.4.32. [Google Scholar] [CrossRef] [PubMed]
- Ivanova, O.N.; Krasnov, G.S.; Snezhkina, A.V.; Kudryavtseva, A.V.; Fedorov, V.S.; Zakirova, N.F.; Golikov, M.V.; Kochetkov, S.N.; Bartosch, B.; Valuev-Elliston, V.T.; et al. Transcriptome Analysis of Redox Systems and Polyamine Metabolic Pathway in Hepatoma and Non-Tumor Hepatocyte-like Cells. Biomolecules 2023, 13, 714. [Google Scholar] [CrossRef] [PubMed]
- Ivanov, A.V.; Smirnova, O.A.; Petrushanko, I.Y.; Ivanova, O.N.; Karpenko, I.L.; Alekseeva, E.; Sominskaya, I.; Makarov, A.A.; Bartosch, B.; Kochetkov, S.N.; et al. HCV Core Protein Uses Multiple Mechanisms to Induce Oxidative Stress in Human Hepatoma Huh7 Cells. Viruses 2015, 7, 2745–2770. [Google Scholar] [CrossRef] [PubMed]
- Abubaker, A.A.; Vara, D.; Eggleston, I.; Canobbio, I.; Pula, G. A Novel Flow Cytometry Assay Using Dihydroethidium as Redox-Sensitive Probe Reveals NADPH Oxidase-Dependent Generation of Superoxide Anion in Human Platelets Exposed to Amyloid Peptide β. Platelets 2019, 30, 181–189. [Google Scholar] [CrossRef]
- Pak, V.V.; Ezeriņa, D.; Lyublinskaya, O.G.; Pedre, B.; Tyurin-Kuzmin, P.A.; Mishina, N.M.; Thauvin, M.; Young, D.; Wahni, K.; Gache, S.A.M.; et al. Ultrasensitive Genetically Encoded Indicator for Hydrogen Peroxide Identifies Roles for the Oxidant in Cell Migration and Mitochondrial Function. Cell Metabolism 2020, 31, 642–653.e6. [Google Scholar] [CrossRef]
- Smirnova, O.A.; Ivanova, O.N.; Fedyakina, I.T.; Yusubalieva, G.M.; Baklaushev, V.P.; Yanvarev, D.V.; Kechko, O.I.; Mitkevich, V.A.; Vorobyev, P.O.; Fedorov, V.S.; et al. SARS-CoV-2 Establishes a Productive Infection in Hepatoma and Glioblastoma Multiforme Cell Lines. Cancers 2023, 15, 632. [Google Scholar] [CrossRef]
Figure 1.
Levels of poliovirus infection in GBM cell lines at 24 hours post-infection (h.p.i.). U-251 MG or DBTRG-05MG cell lines maintained in DMEM or Plasmax media were infected with poliovirus at MOI 1 for 6 (a) and 24 hours (a,b), and virus infection was monitored by assessment of TCID50 (a) or by immunostaining (b) using primary antibodies to poliovirus and FITC-conjugated secondary antibodies. TCID50 values (a) are presented as means ± SD, *p≤0.05 by two-way ANOVA with the Tukey post-hoc test.
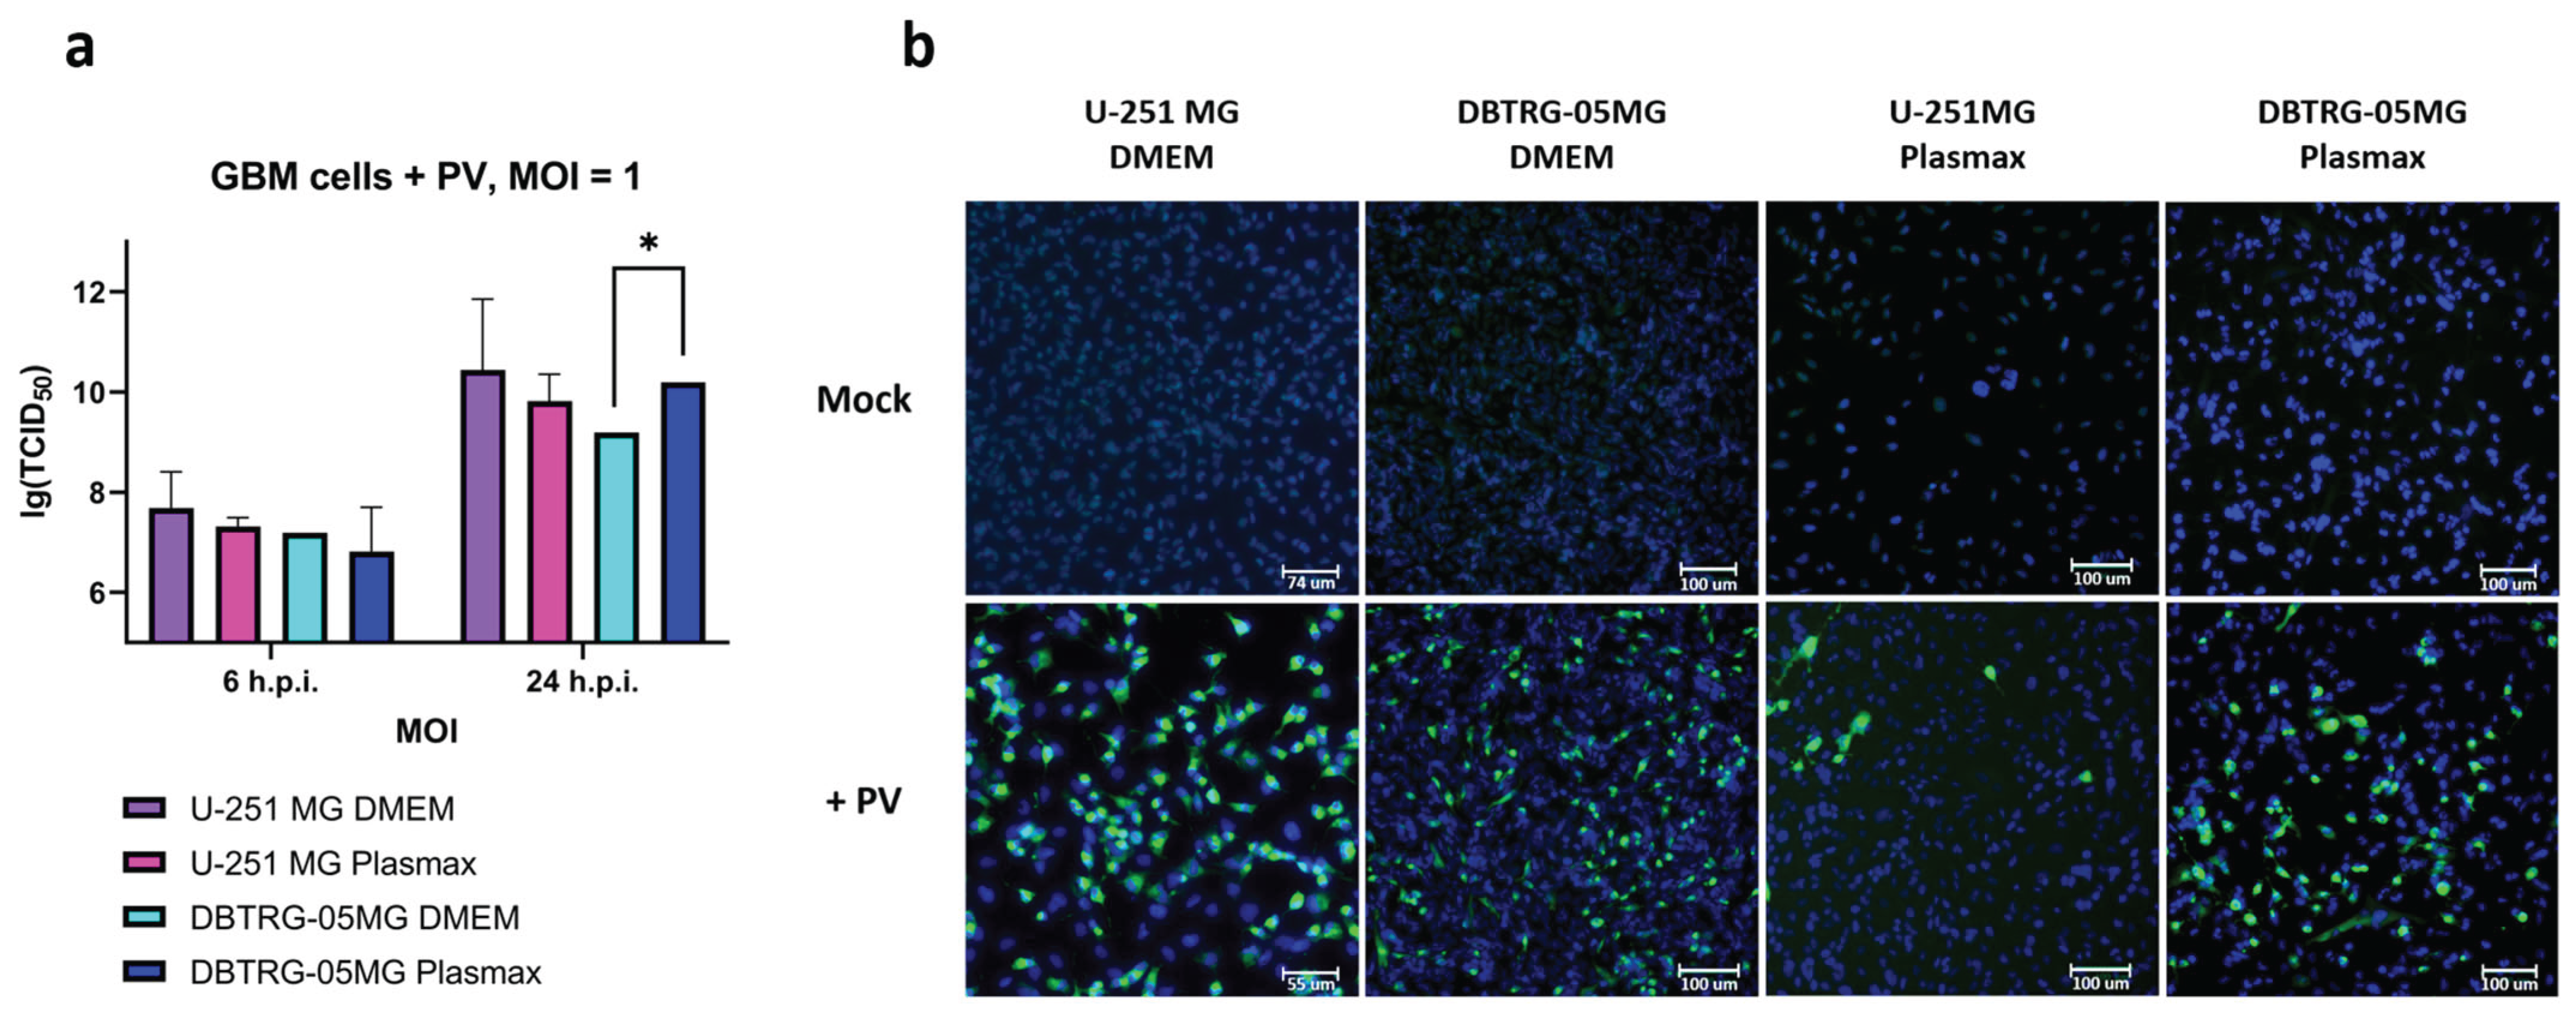
Figure 2.
Polyamine levels in GBM cells with and without poliovirus infection, expressed as nmol/mg, measured by high-performance liquid chromatography. Data are presented as mean ± SD, *p≤<0.05, **p≤0.01 based on two-way ANOVA with Bonferroni test adjustment.
Figure 2.
Polyamine levels in GBM cells with and without poliovirus infection, expressed as nmol/mg, measured by high-performance liquid chromatography. Data are presented as mean ± SD, *p≤<0.05, **p≤0.01 based on two-way ANOVA with Bonferroni test adjustment.
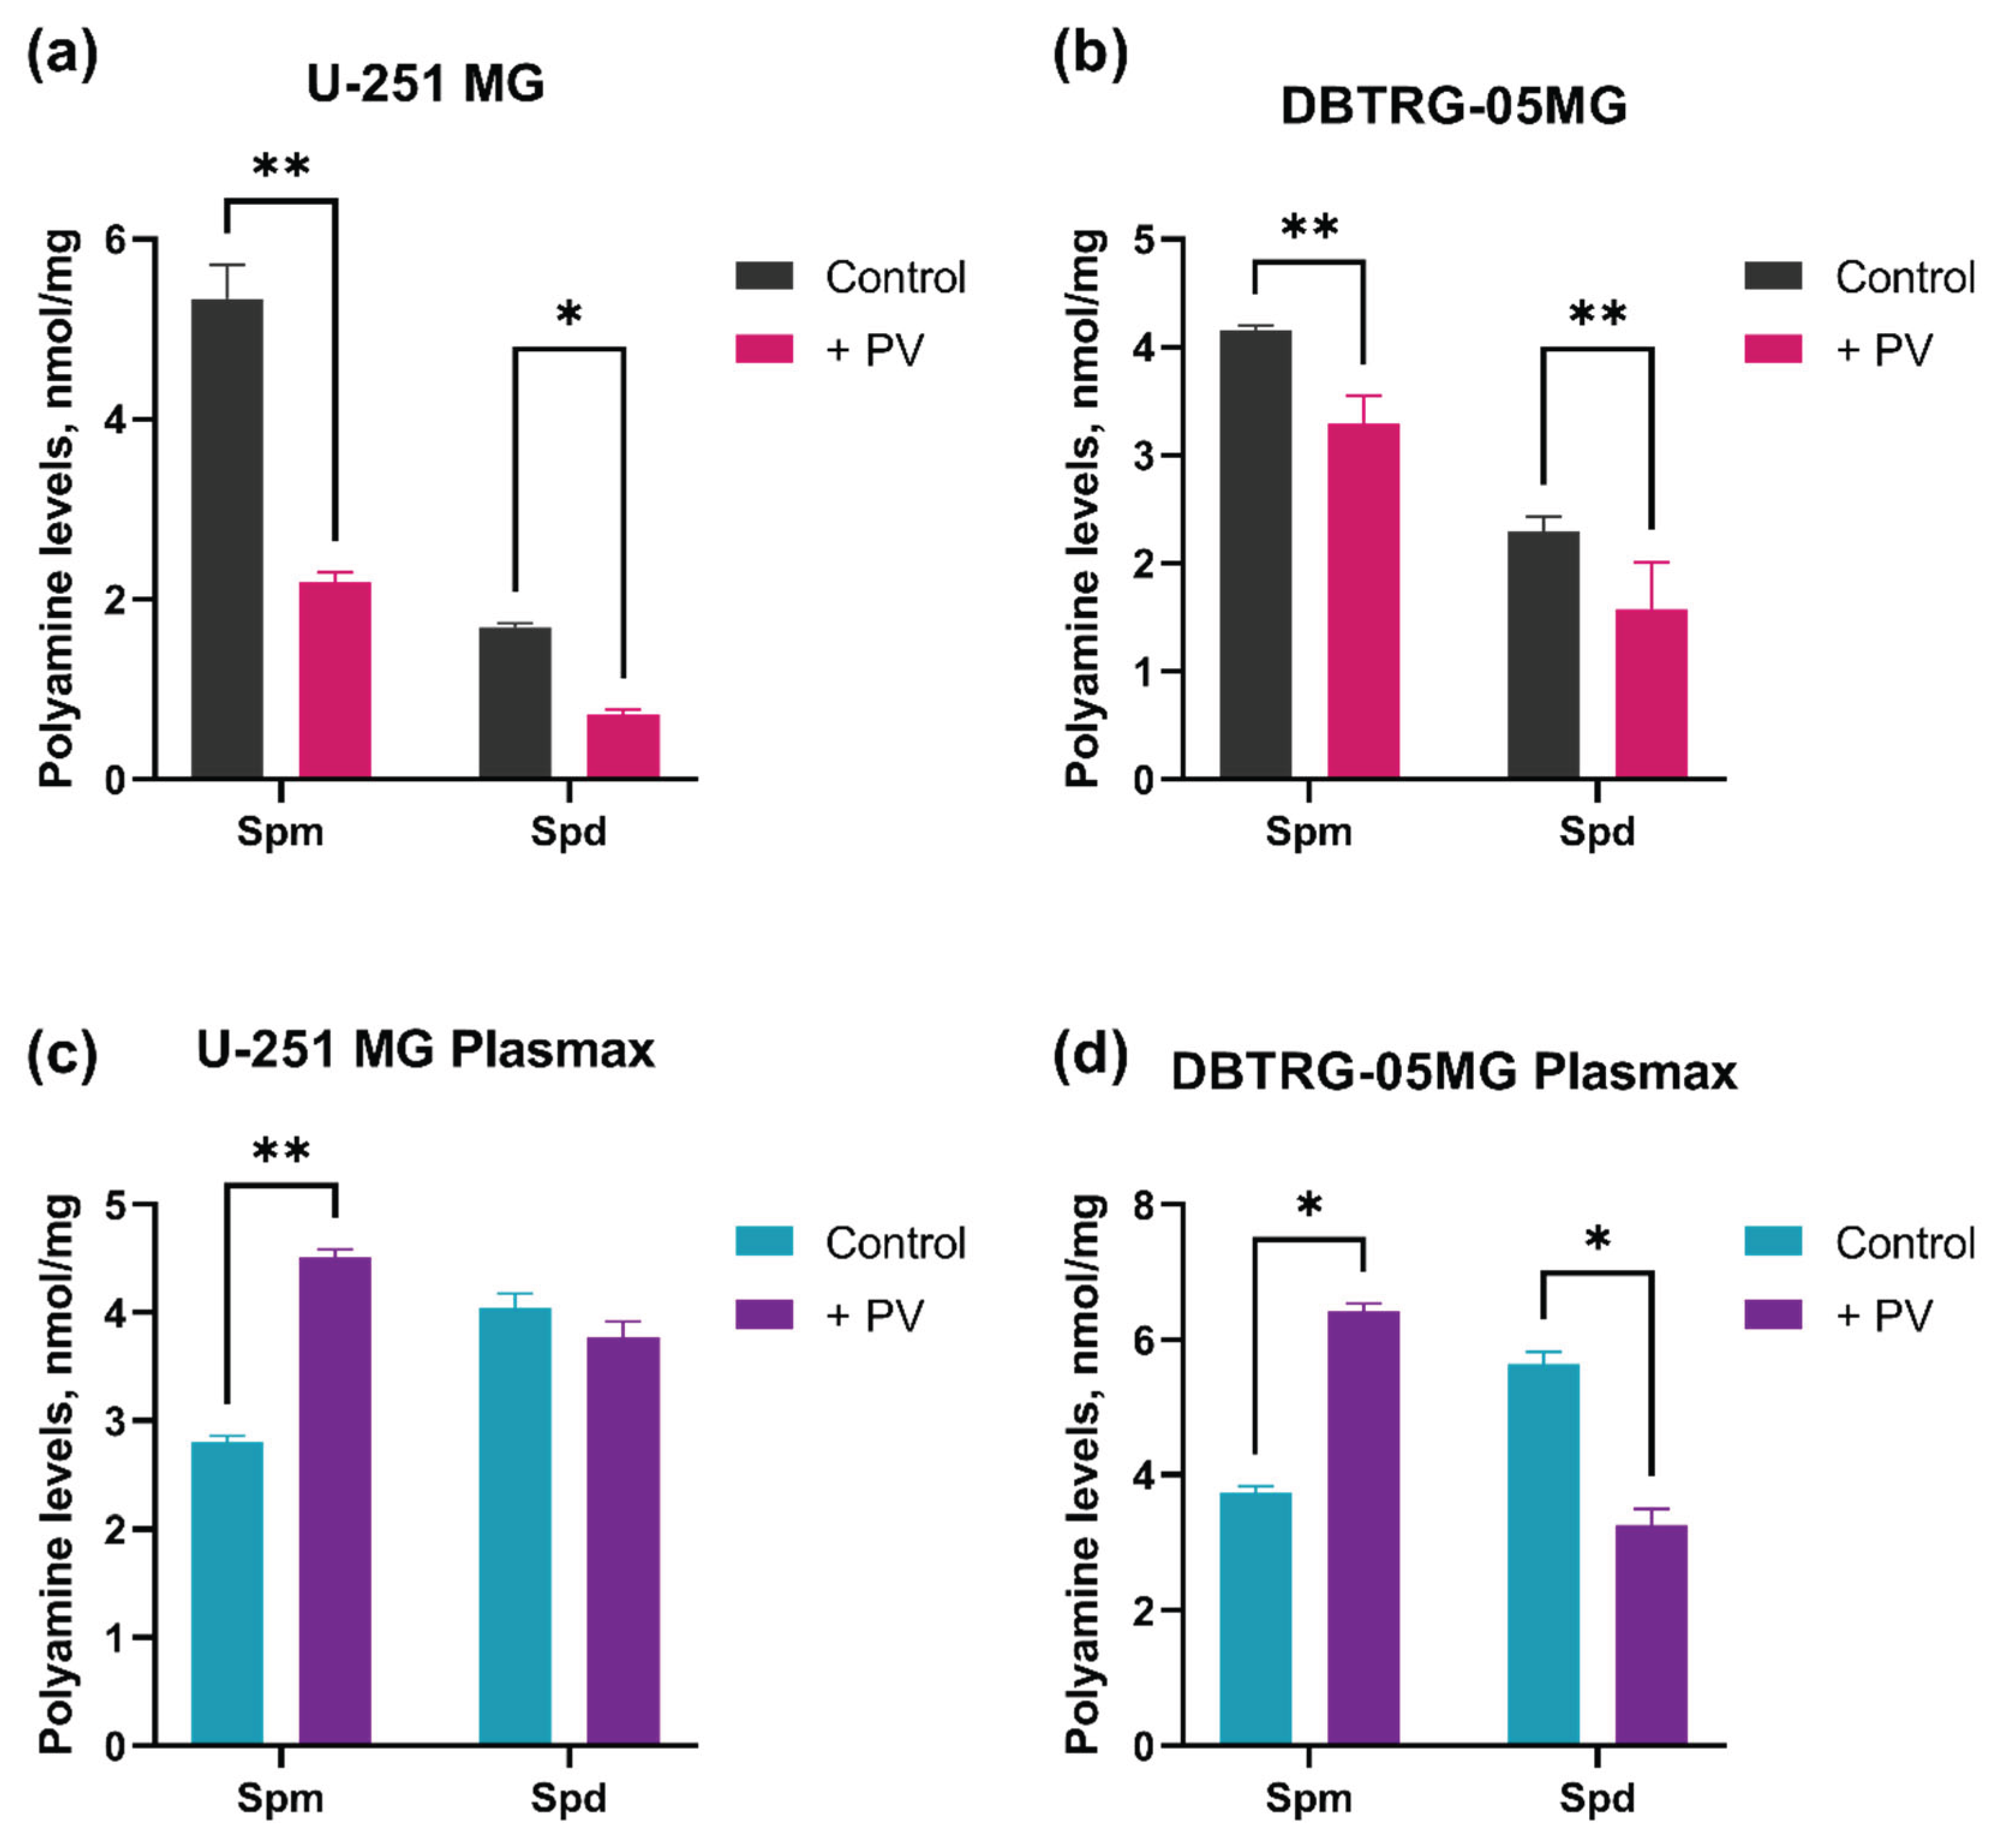
Figure 3.
Cytopathogenic effect of poliovirus-infected GMB cells treated with inhibitors or inducers of polyamine-metabolizing enzymes. U-251MG or DBTRG-05MG cells maintained in DMEM were pretreated with DFMO (a), DENSpm (b), MDL72.527 (c) or SAM486a (d), and infected with PV at different MOI in the presence of these compounds at the same concentrations. Cell viability was measured using resazurin assay. The values were normalized to the values of untreated mock-infected cells. The data are presented as mean ± SD.
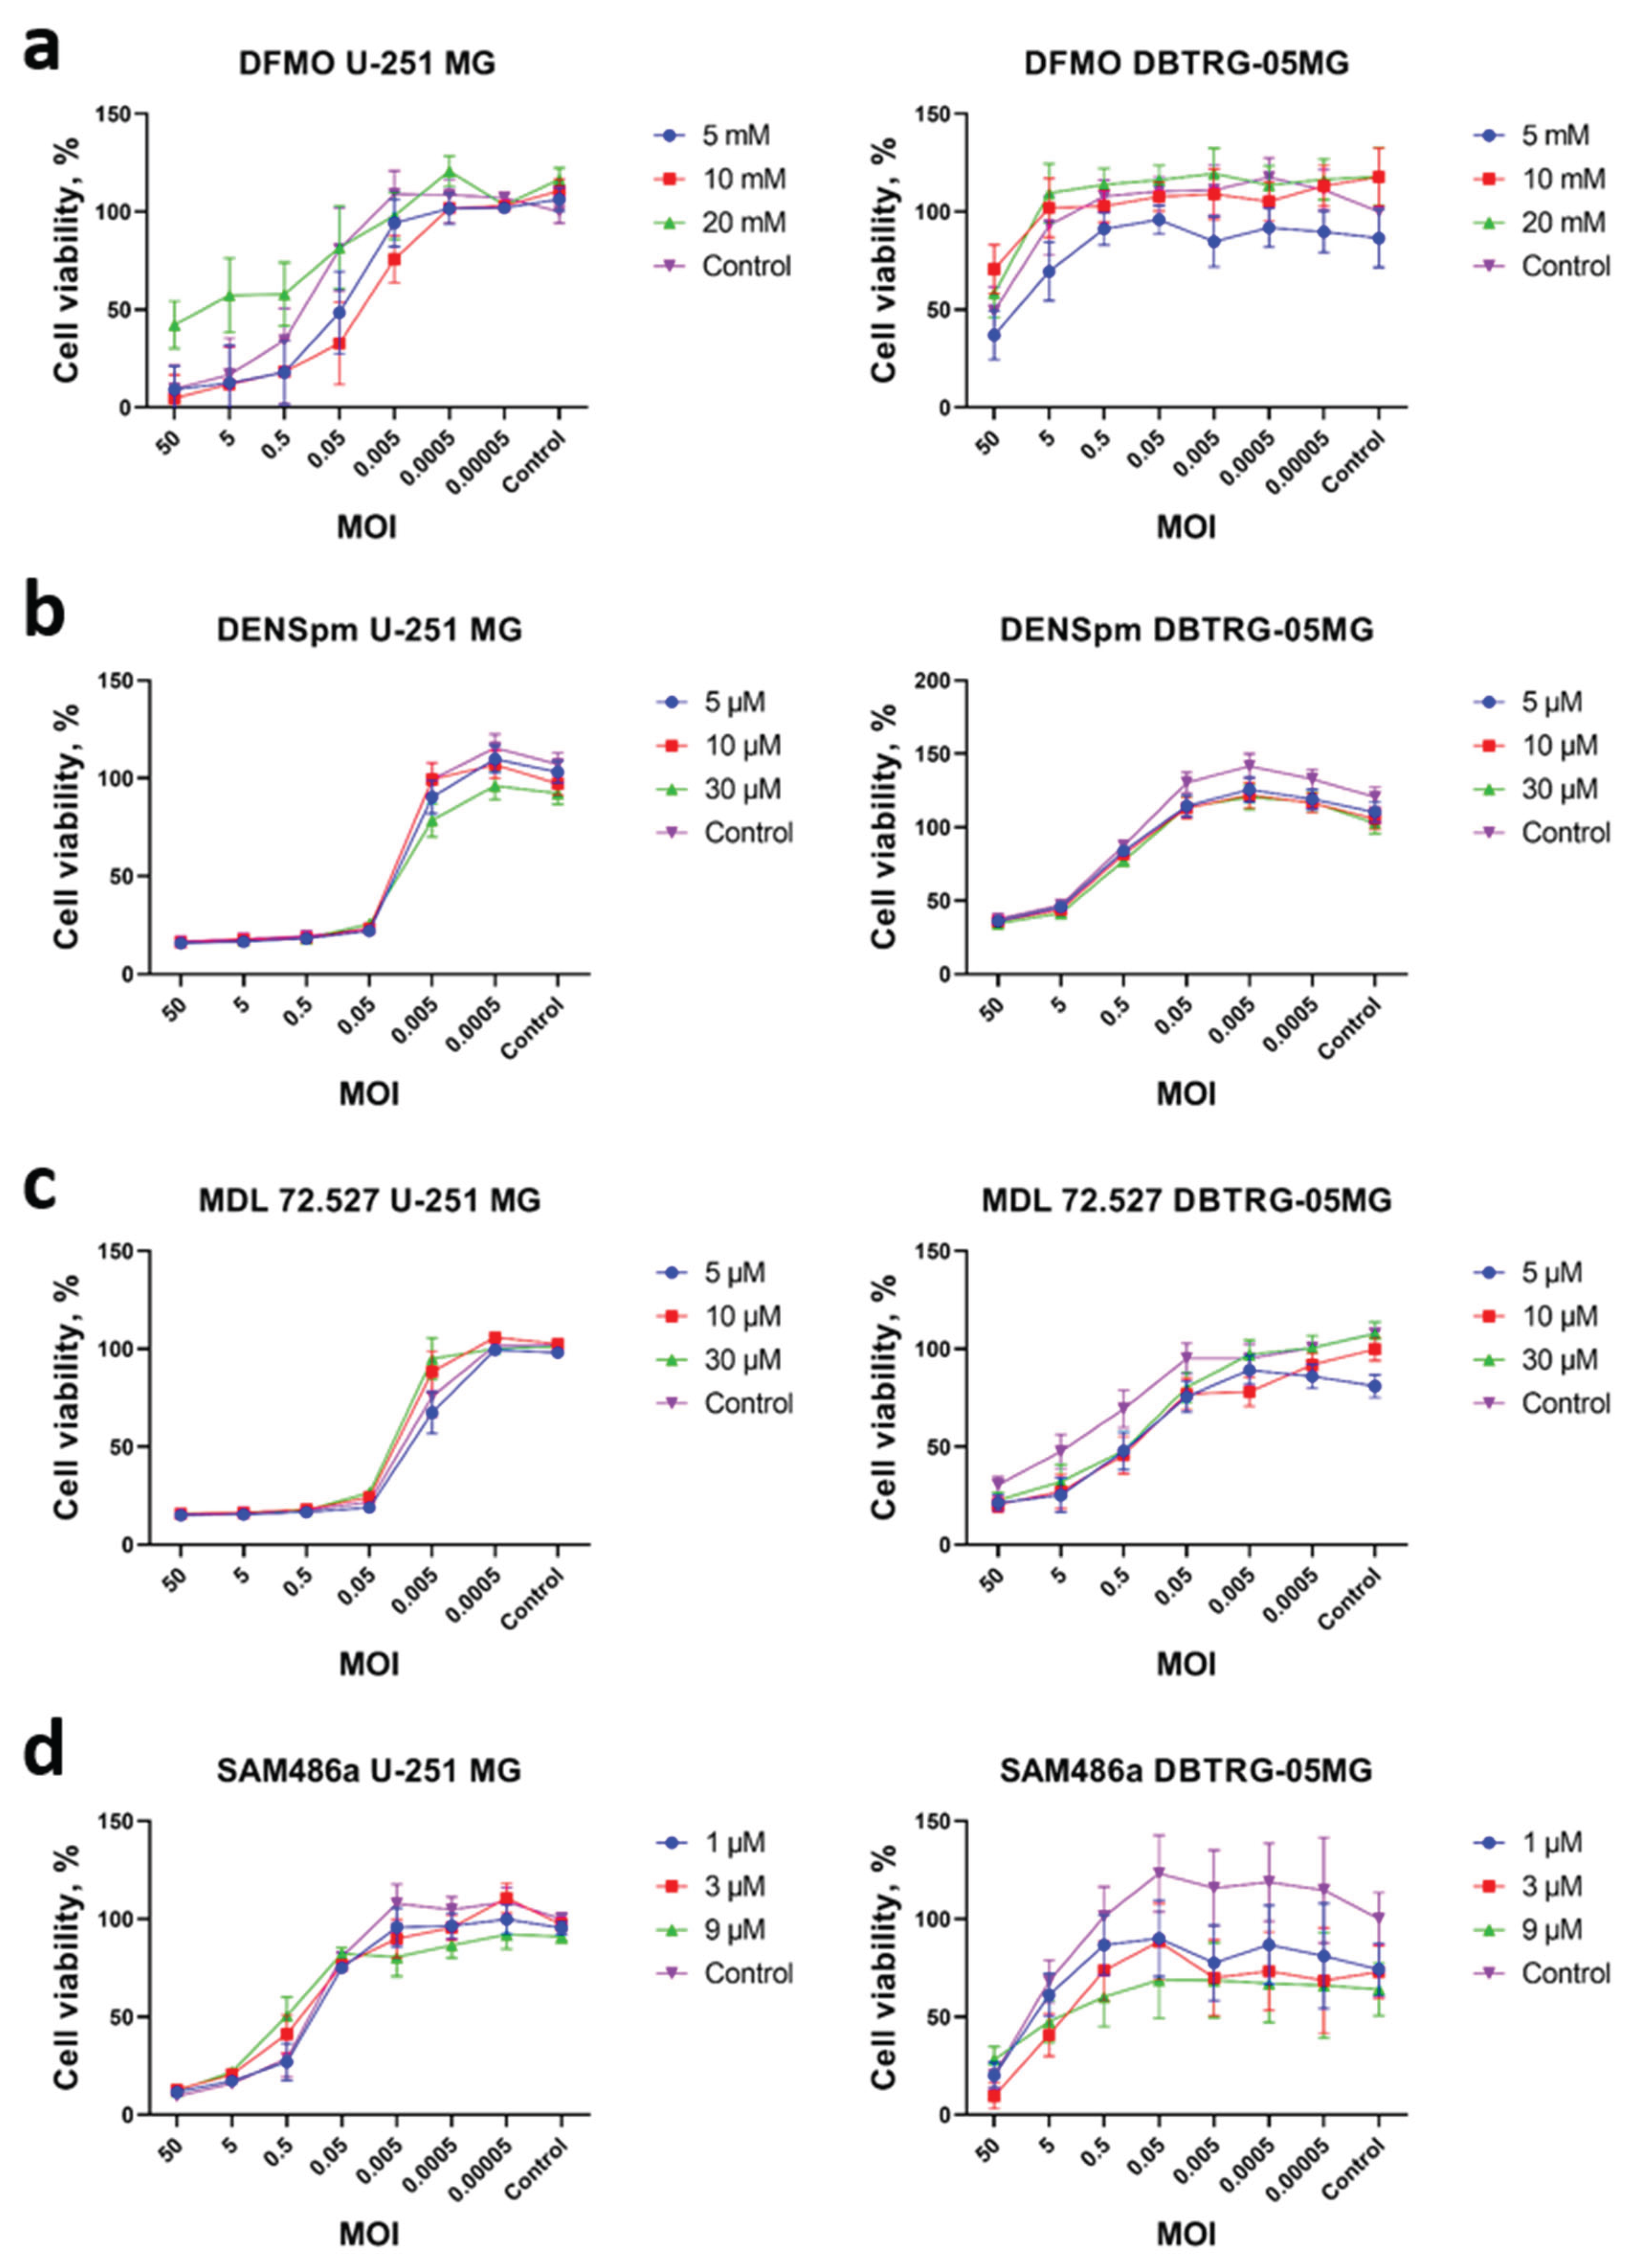
Figure 4.
Imprint of poliovirus on levels of polar metabolites of GMB cell lines. U-251 MG or DBTRG-05MG cells maintained in DMEM or Plasmax media were infected with PV at MOI 1, and metabolites levels were measured 24 h.p.i. by gas chromatography-mass spectrometry. The levels were normalized to levels in mock-infected cells maintained in the respective medium and expressed as log2 fold change (Log2FC).
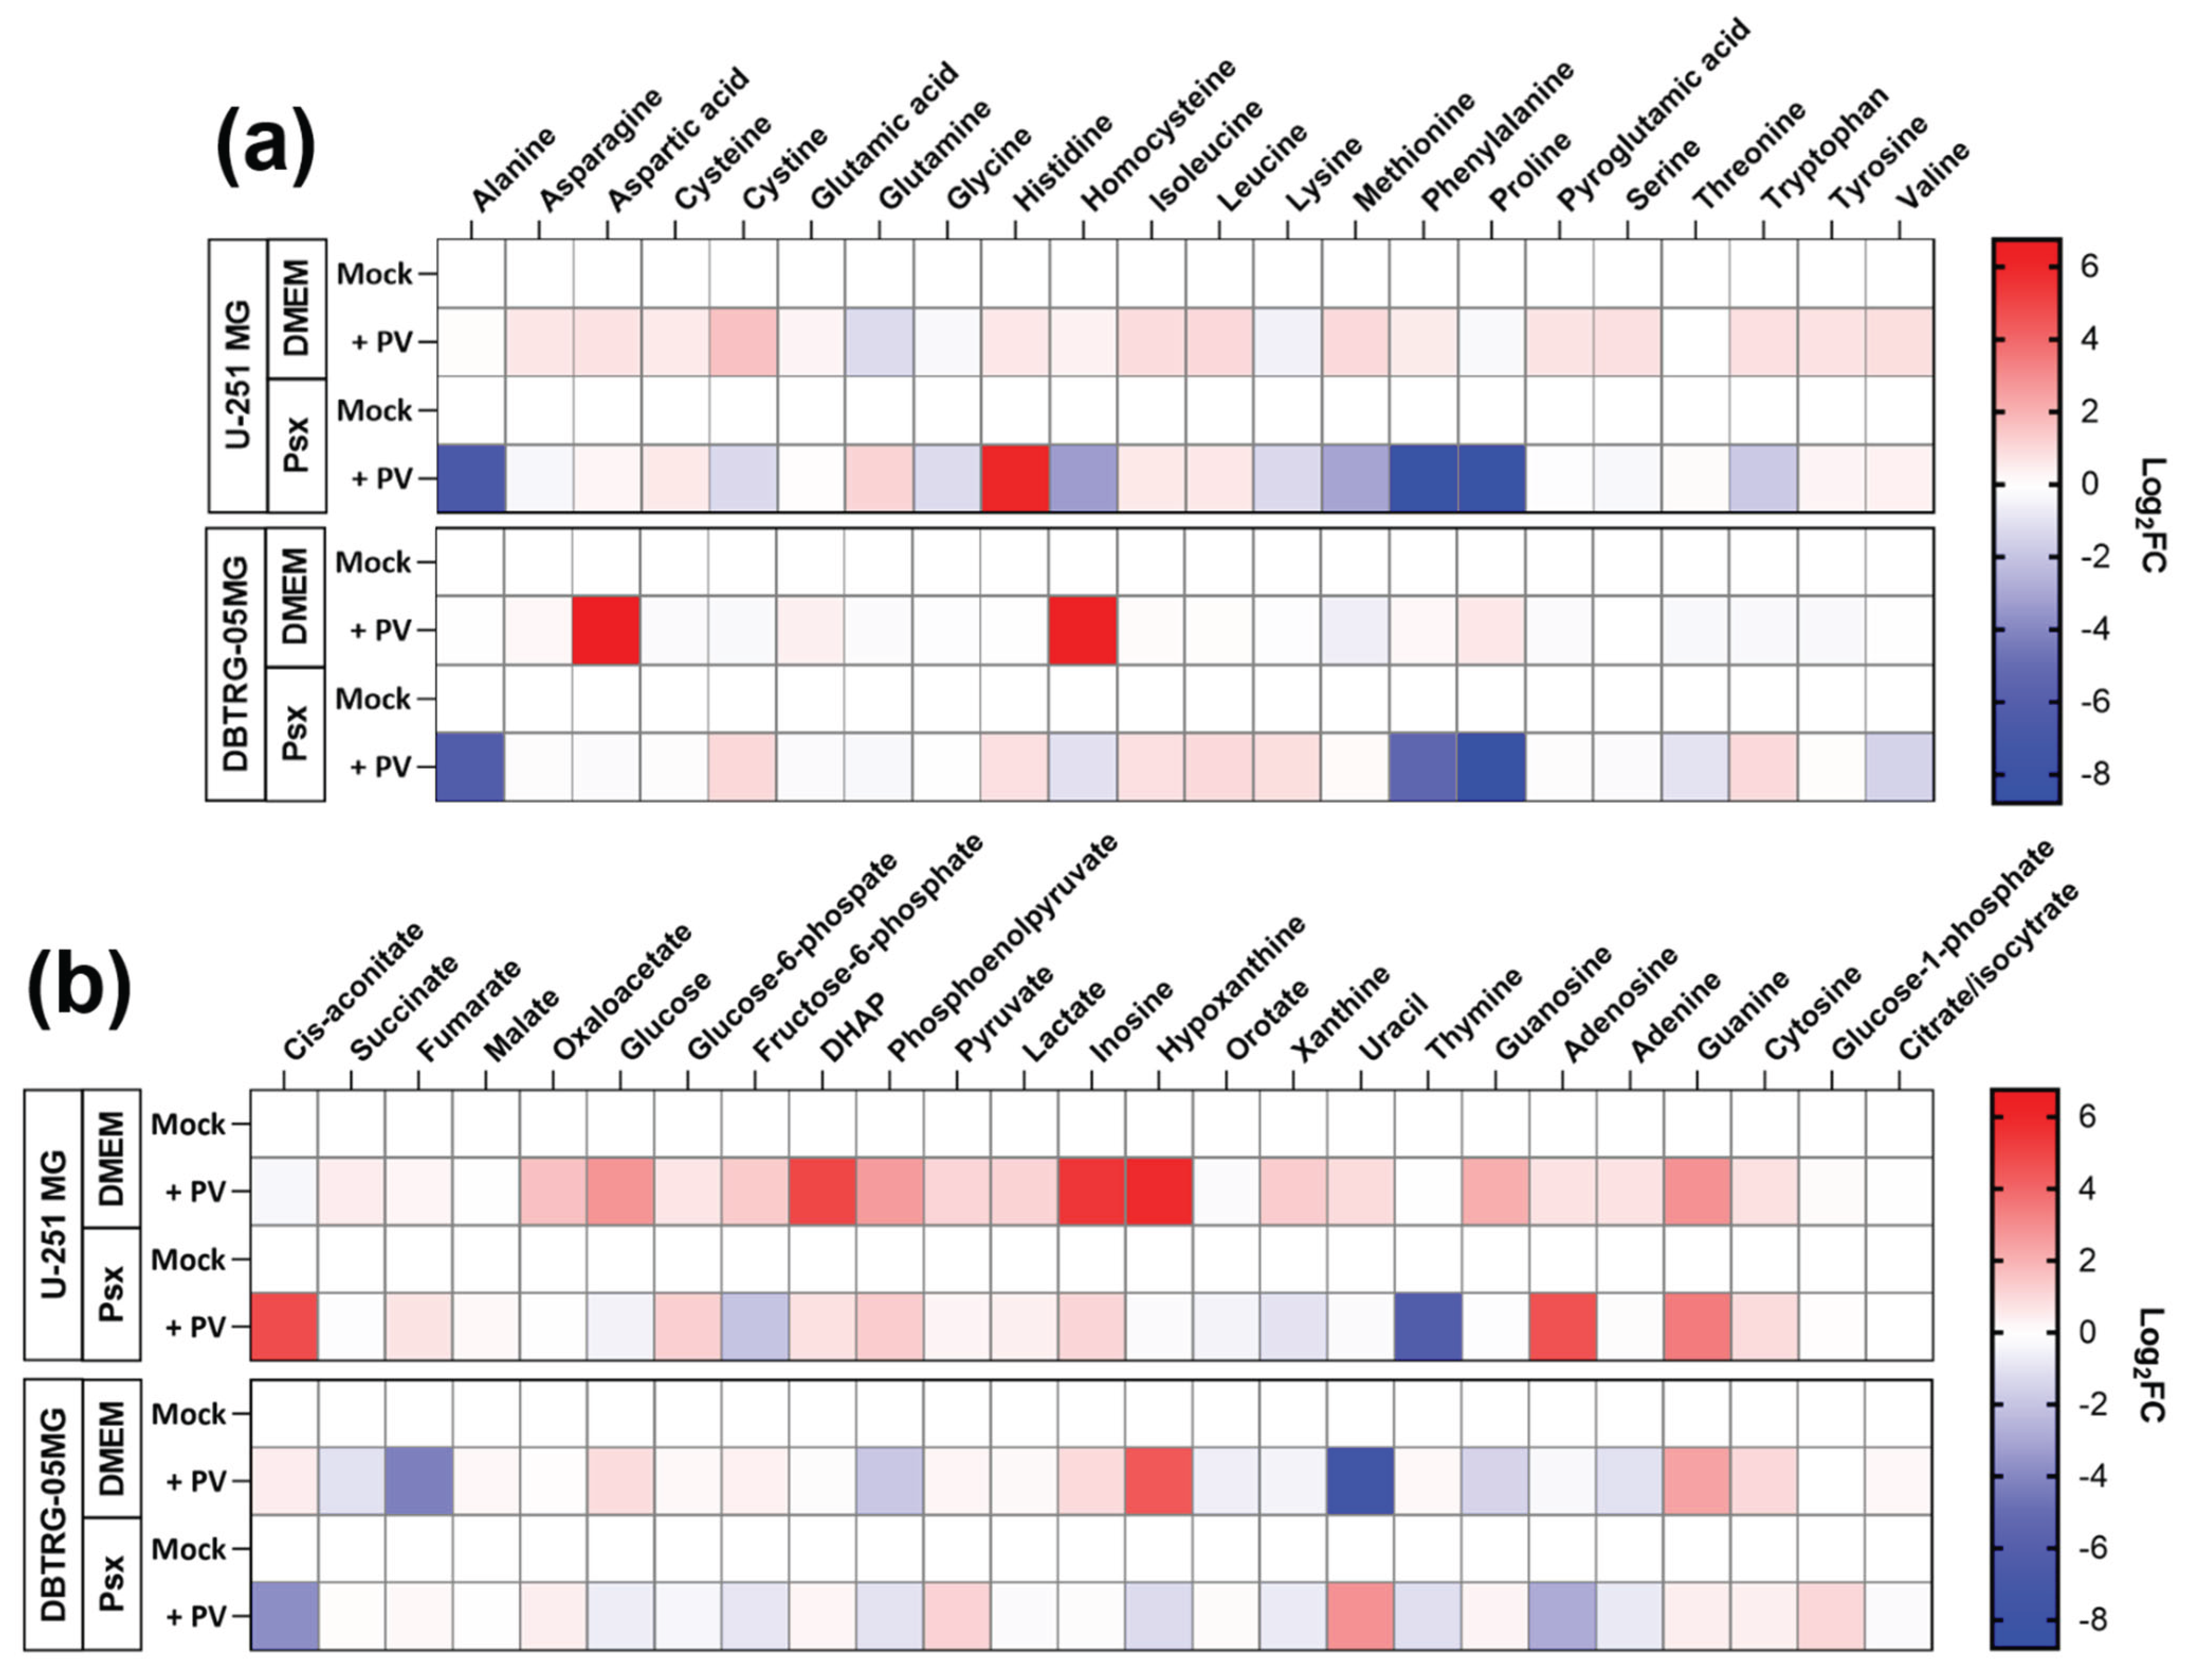
Figure 5.
Relative mRNA levels of genes responsible for the regulation of glycolysis and triglyceride biosynthesis in GBM cells. U-251 MG (a) or DBTRG-05MG (b) cells maintained in DMEM or Plasmax media were infected with PV at MOI 1, and mRNA levels were measured 24 h.p.i. by reverse transcription and real-time PCR analysis. The mRNA levels were normalized to mRNA of a β-glucuronidase and then to the values of mock-infected cells in DMEM. Data are presented as mean ± SD, *p ≤ 0.05 by ANOVA with the Tukey post-hoc test.
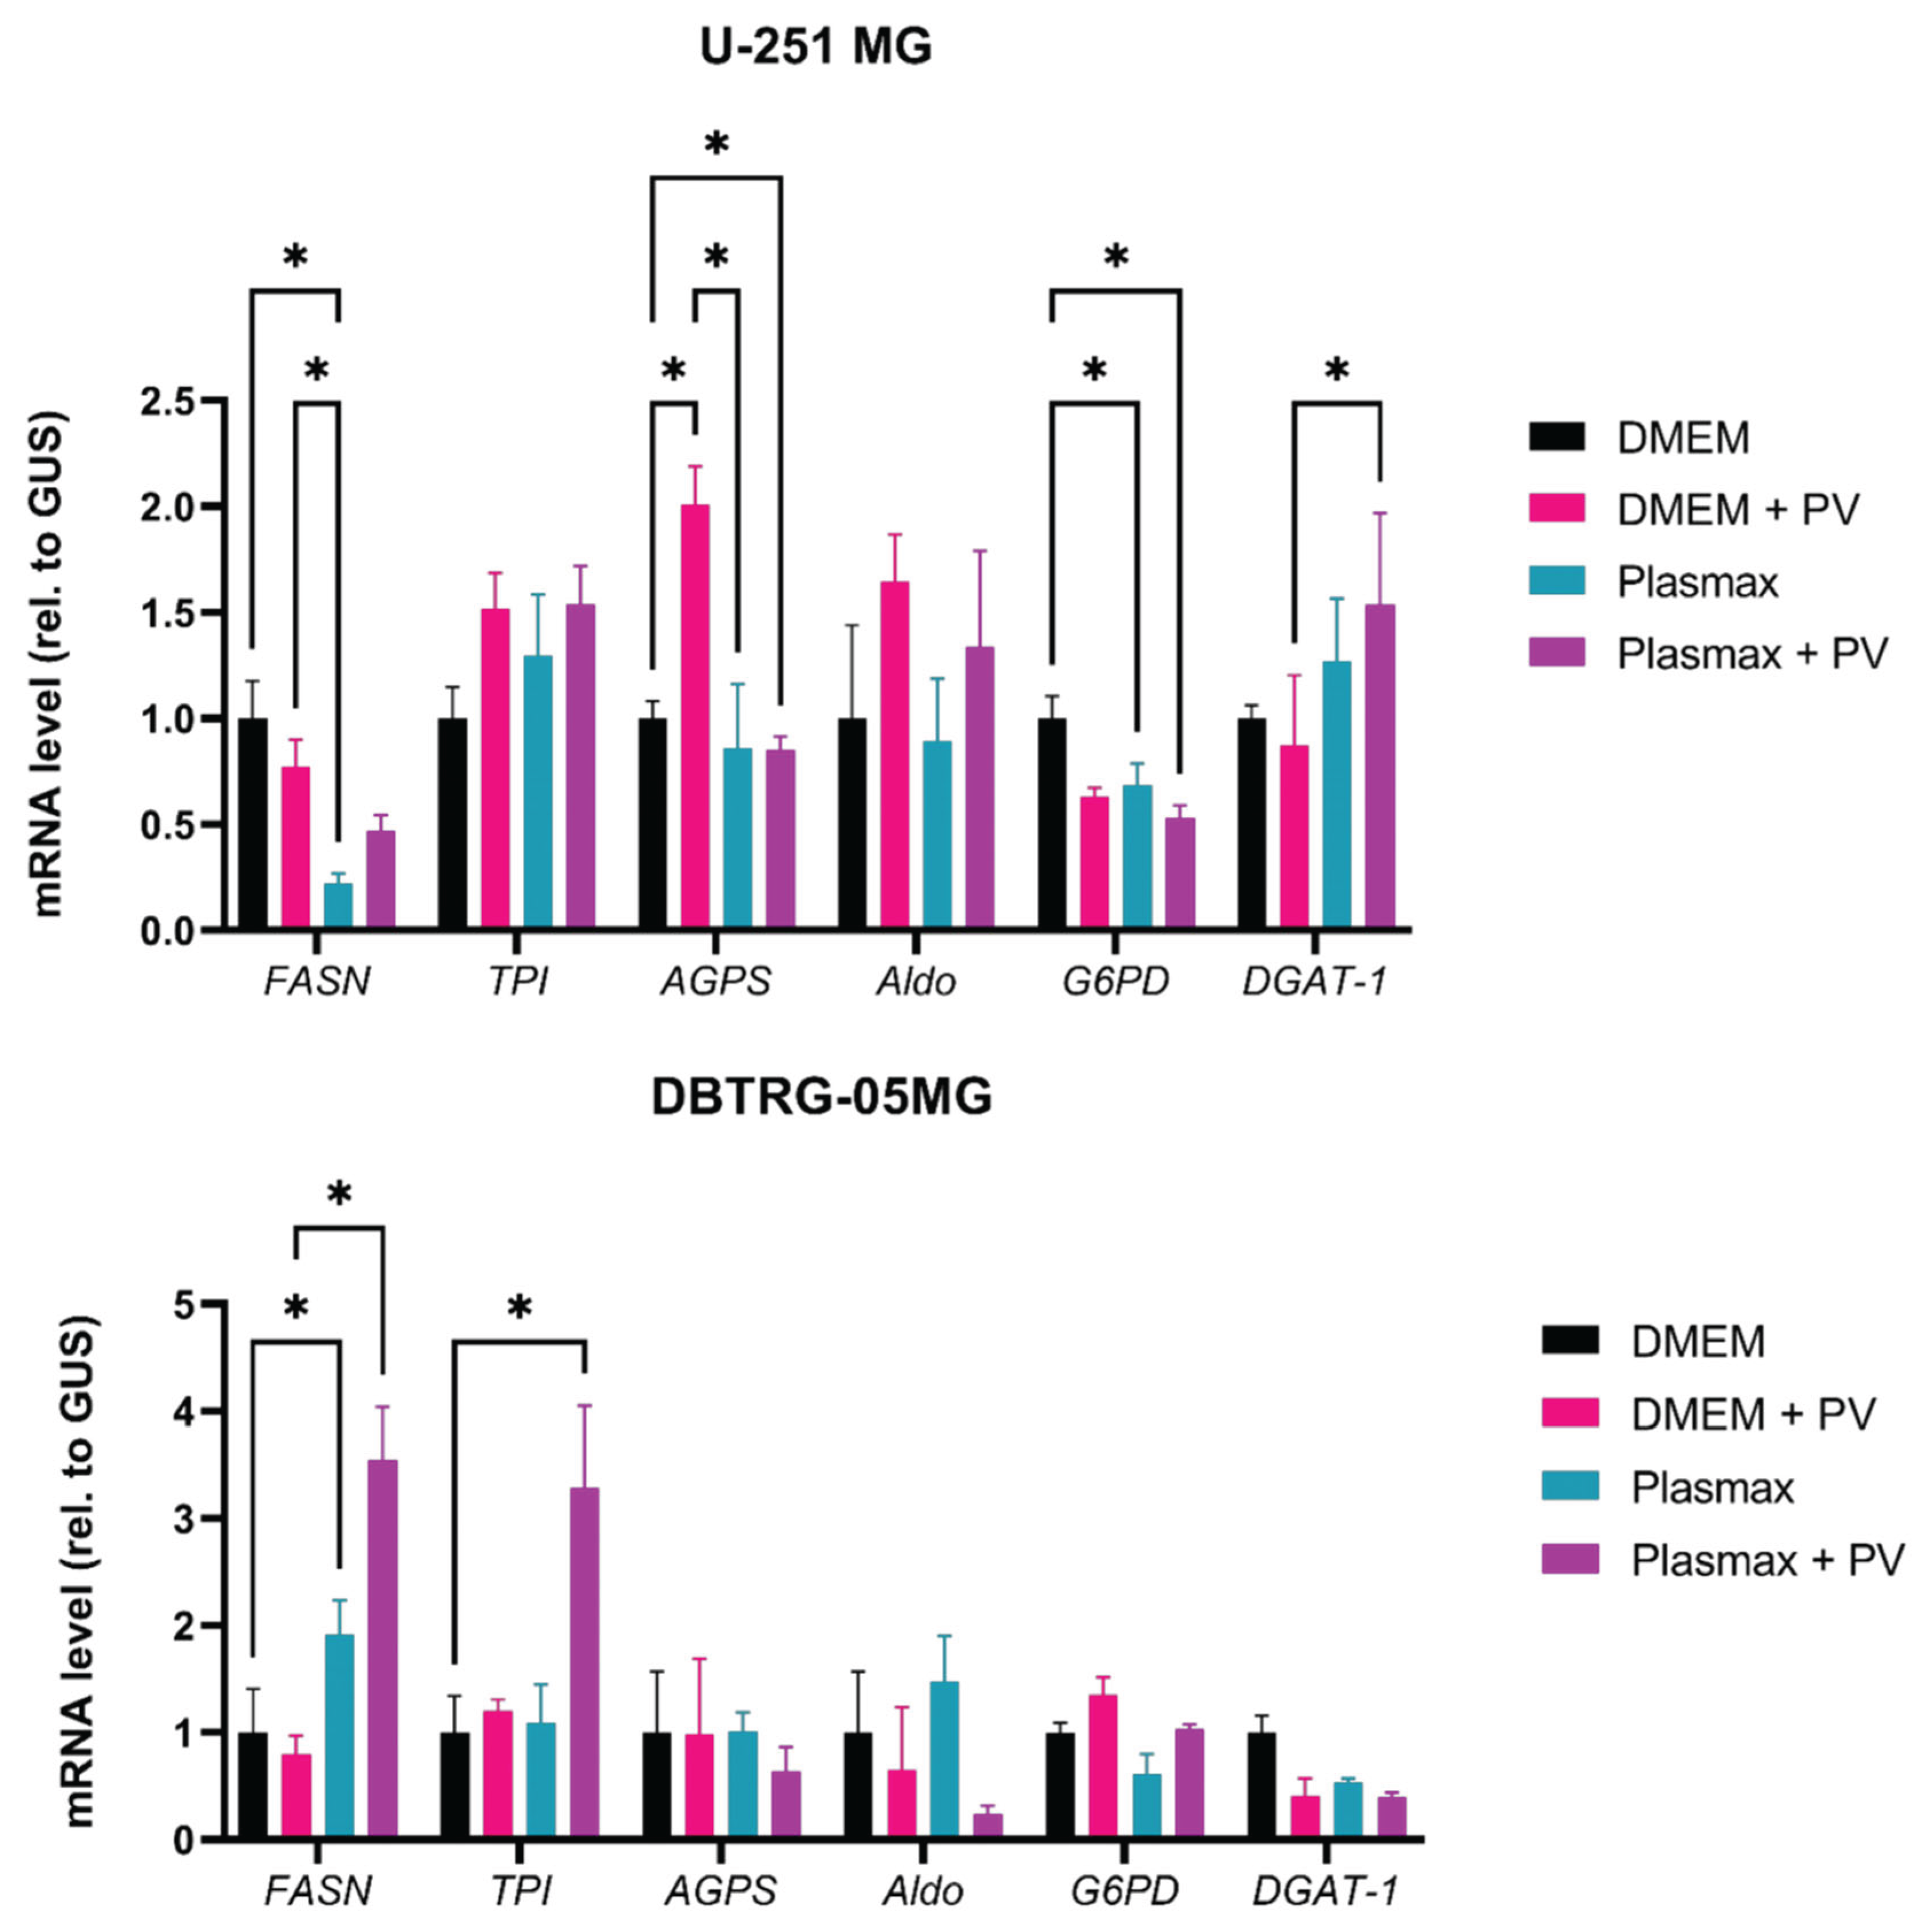
Figure 6.
Levels of neutral lipids in GBM cells during poliovirus infection. U-251 MG or DBTRG-05MG cells maintained in DMEM were infected with PV at MOI 1 and stained with BODIPY 493/503 (neutral lipids, green fluorescence) and DAPI (nuclei)at various time points. Fluorescence was visualized on ZOE Fluorescent Cell Imager.
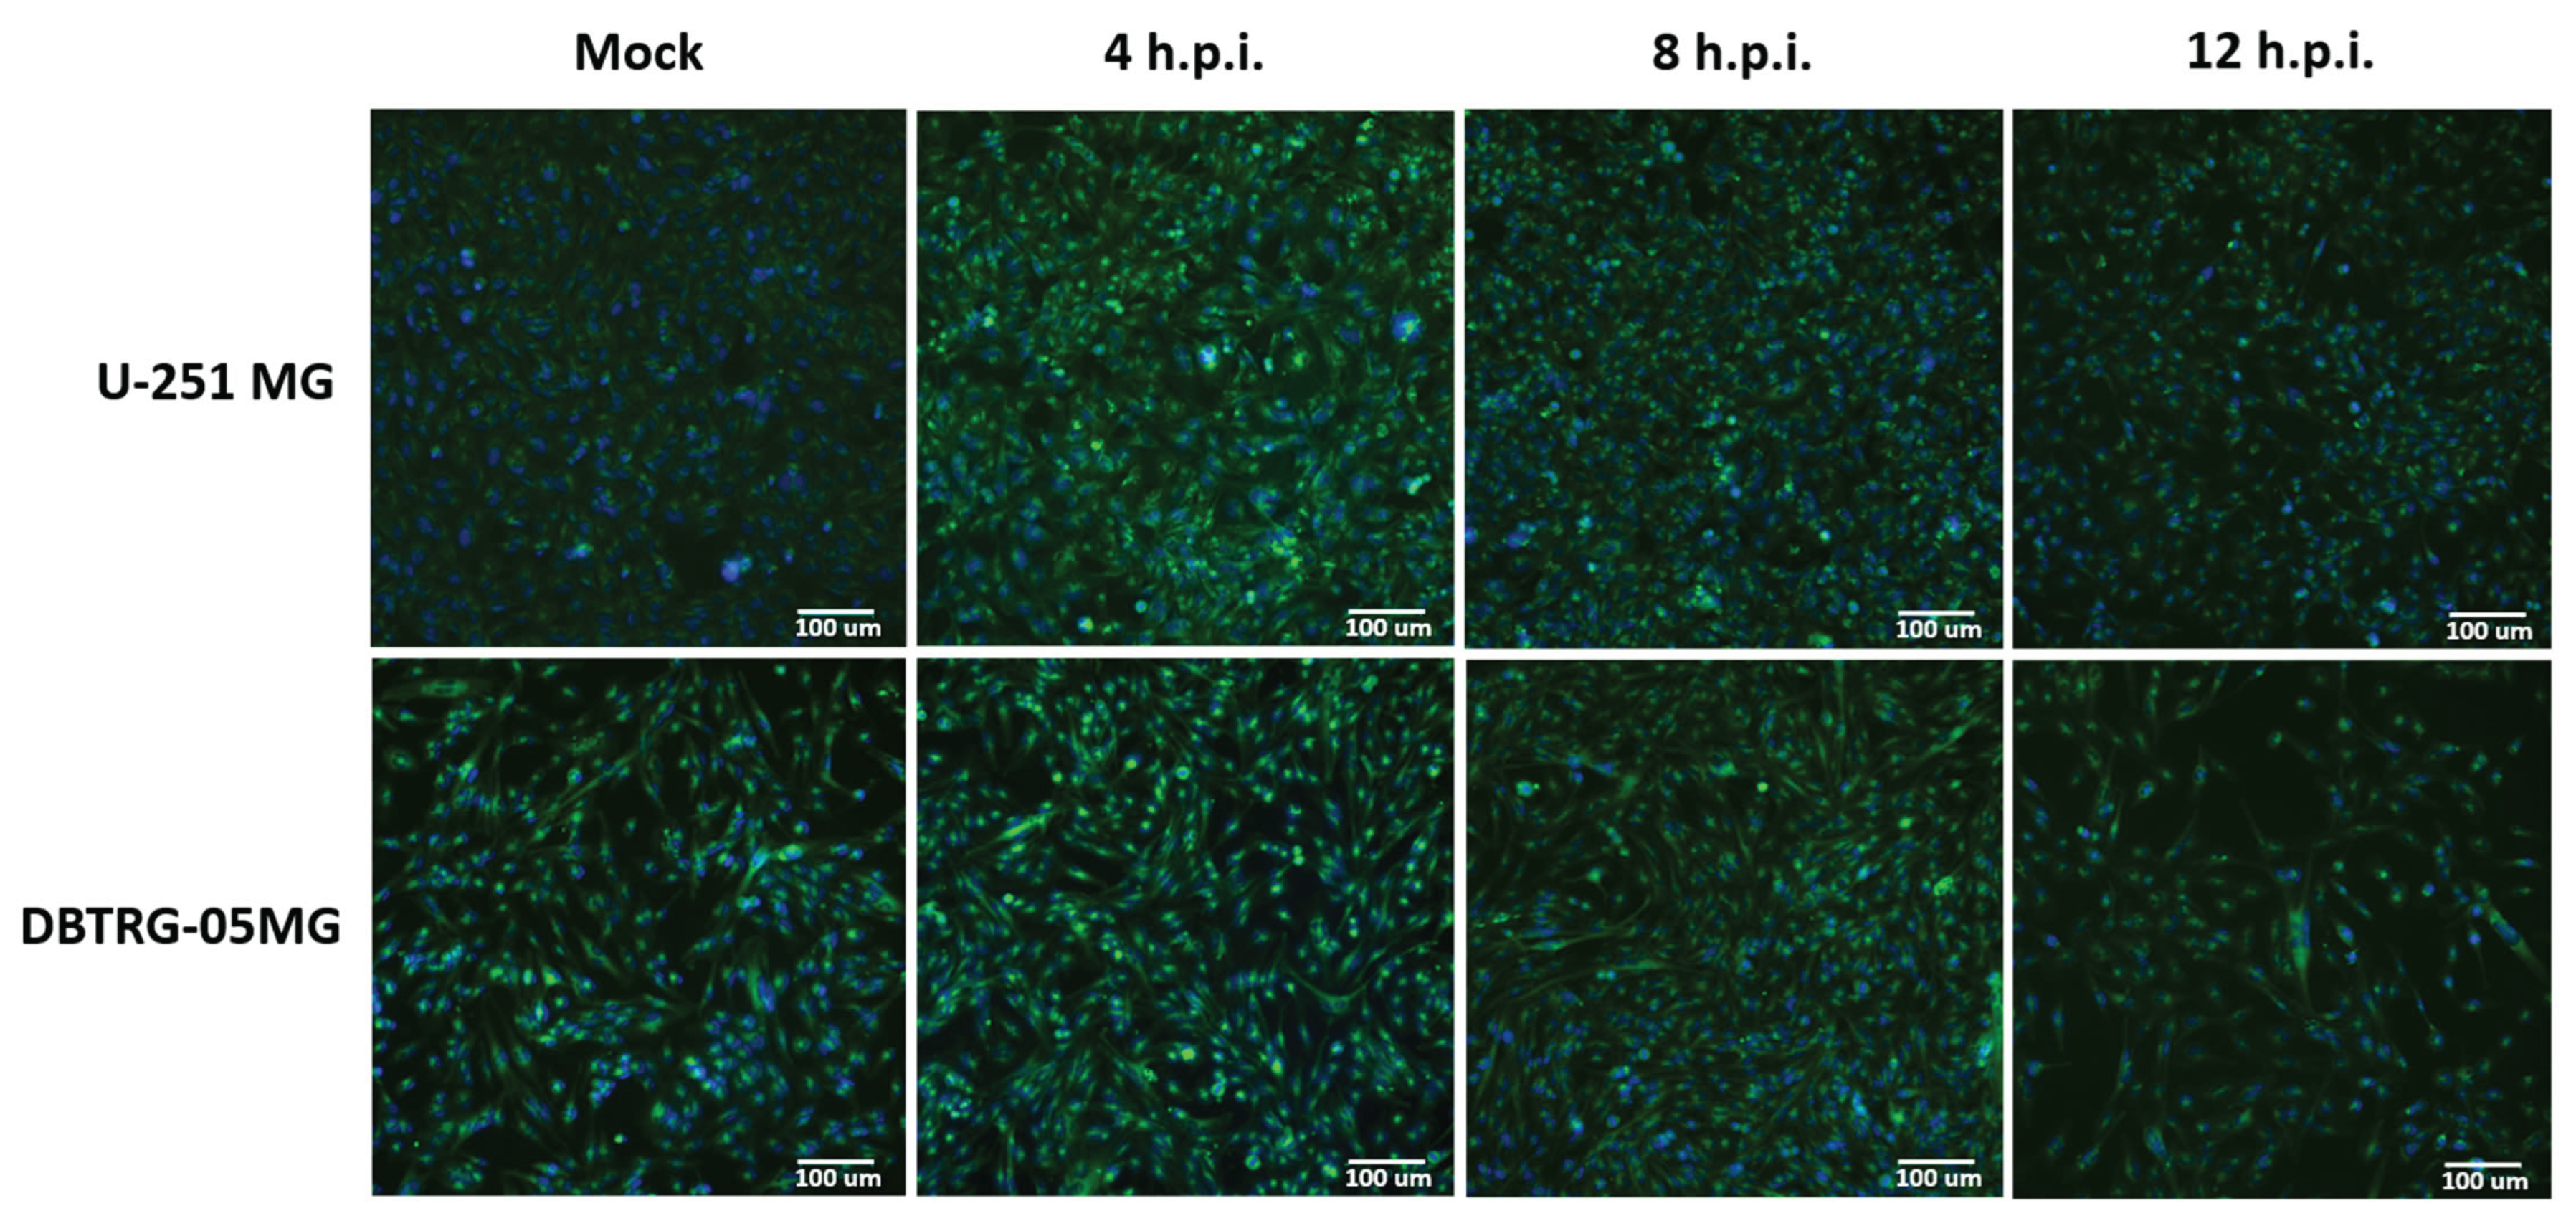
Figure 7.
Metabolic changes in GMB cells treated with the recombinant interferon α-2b. 251-MG or DBTRG-05MG cells maintained in DMEM medium were treated with IFN α-2b, and metabolites levels were measured 24 h.p.i. by gas chromatography-mass spectrometry. The levels were normalized to levels in untreated cells and expressed as log2 fold change (Log2FC).
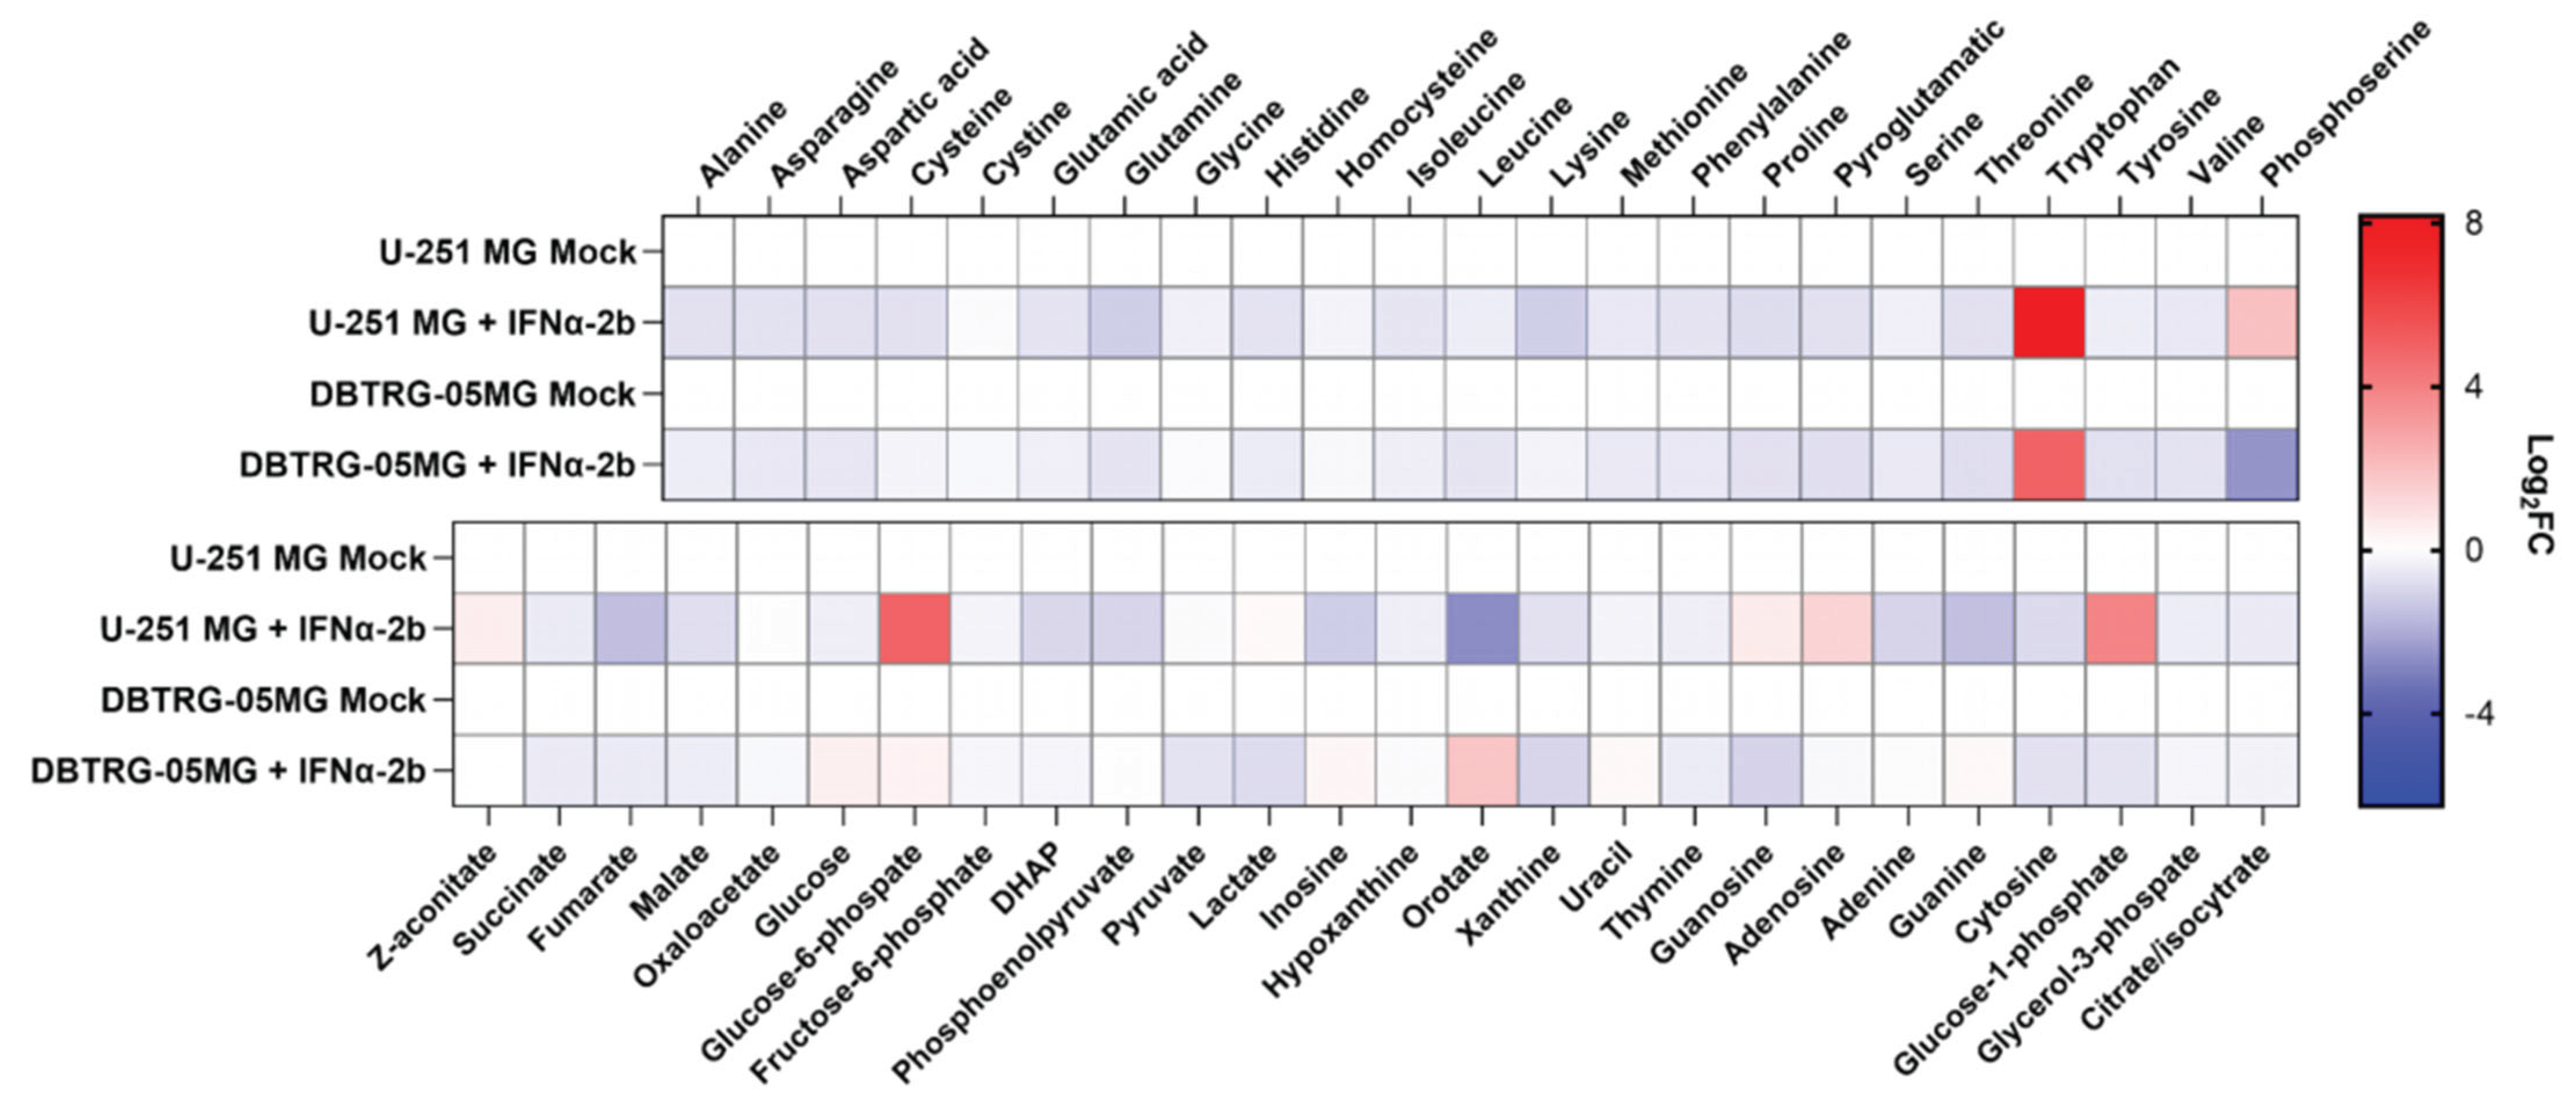
Figure 8.
Effect of poliovirus on glycolytic respiratory activity of GBM cell lines. U-251 MG (a,c) or DBTRG-05MG (b,d) cells maintained in DMEM or Plasmax media were infected with PV at MOI 1, and extracellular acidification (ECAR) reflecting glycolysis (a-b) and oxygen consumption rate (OCR) reflecting respiratory activity (c-d) were measured by Seahorse technology using GlycoStress and MitoStress kits. The results are presented as mean ± SD, n=5.
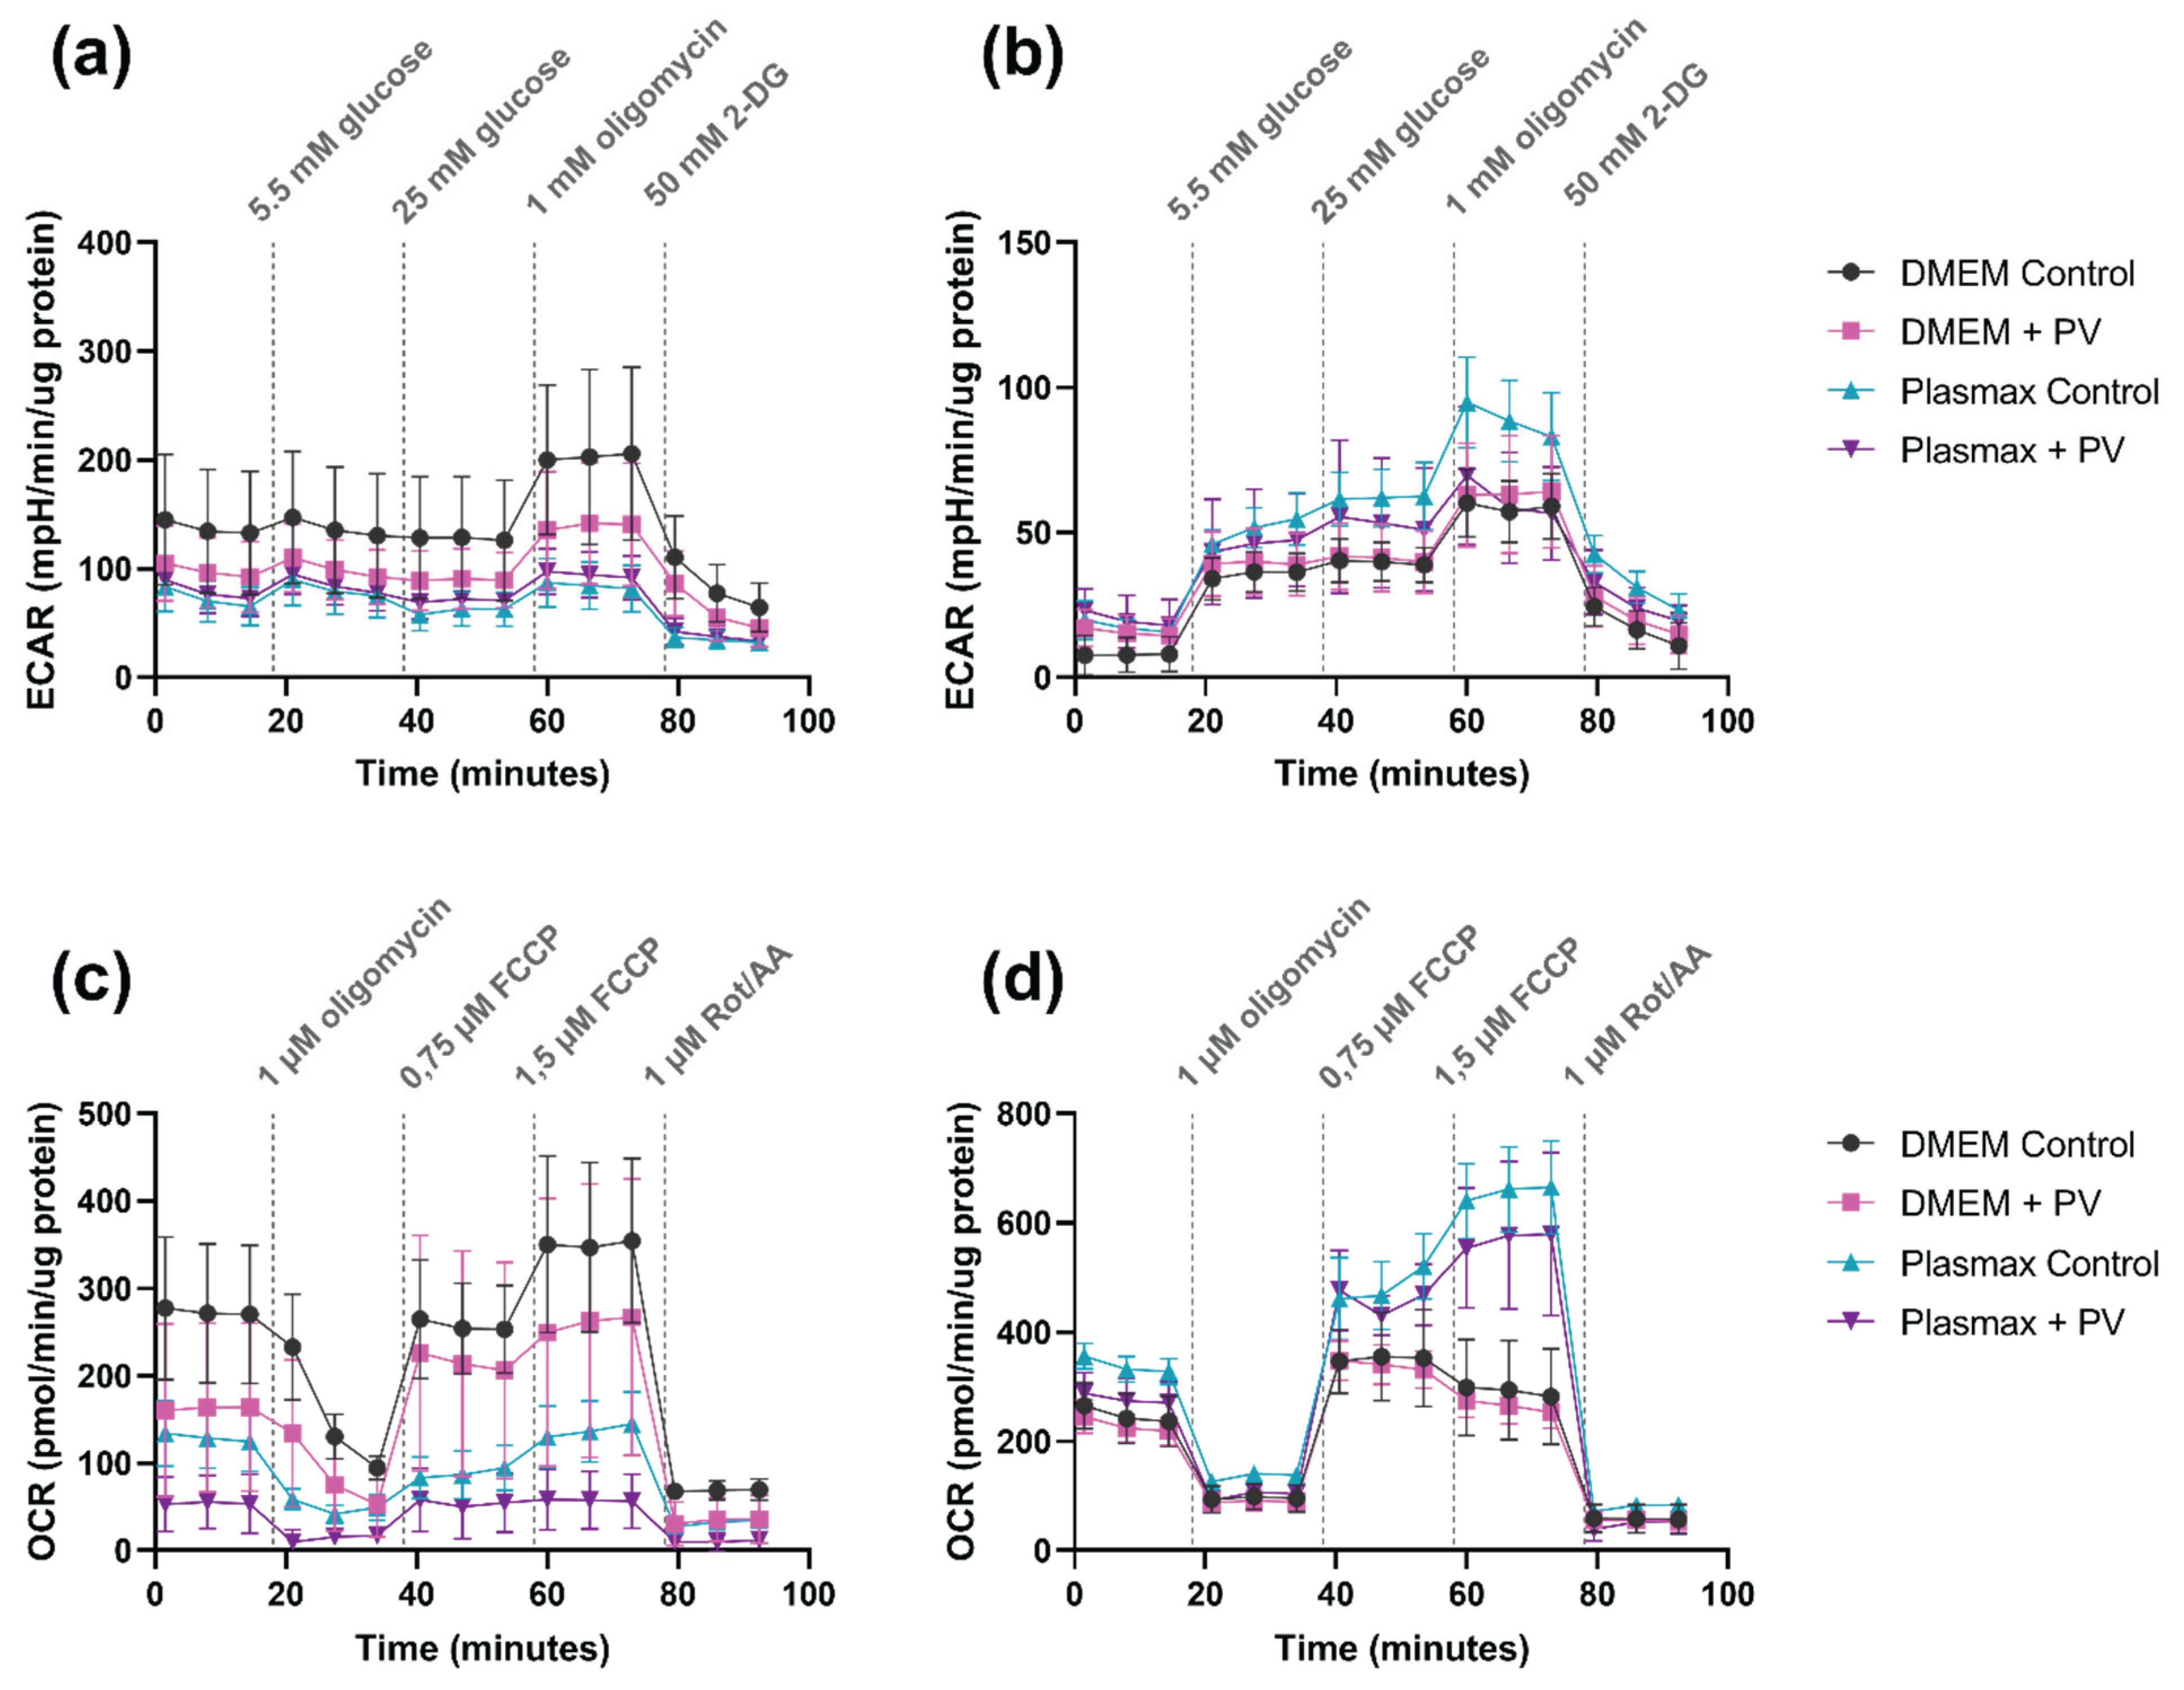
Figure 9.
Cytopathogenic effect of poliovirus-infected GMB cells treated with inhibitors of metabolic enzymes or transporters. U-251 MG (a-c) or DBTRG-05MG (d-f) cells maintained in DMEM were pretreated with UK5099 (a,d), AR-C155858 (b,e), or 5.33756.0001 (c,f), and infected with PV at different MOI in the presence of these compounds at the same concentrations. Cell viability was measured using resazurin assay. The values were normalized to the values of untreated mock-infected cells. The data are presented as mean ± SD.
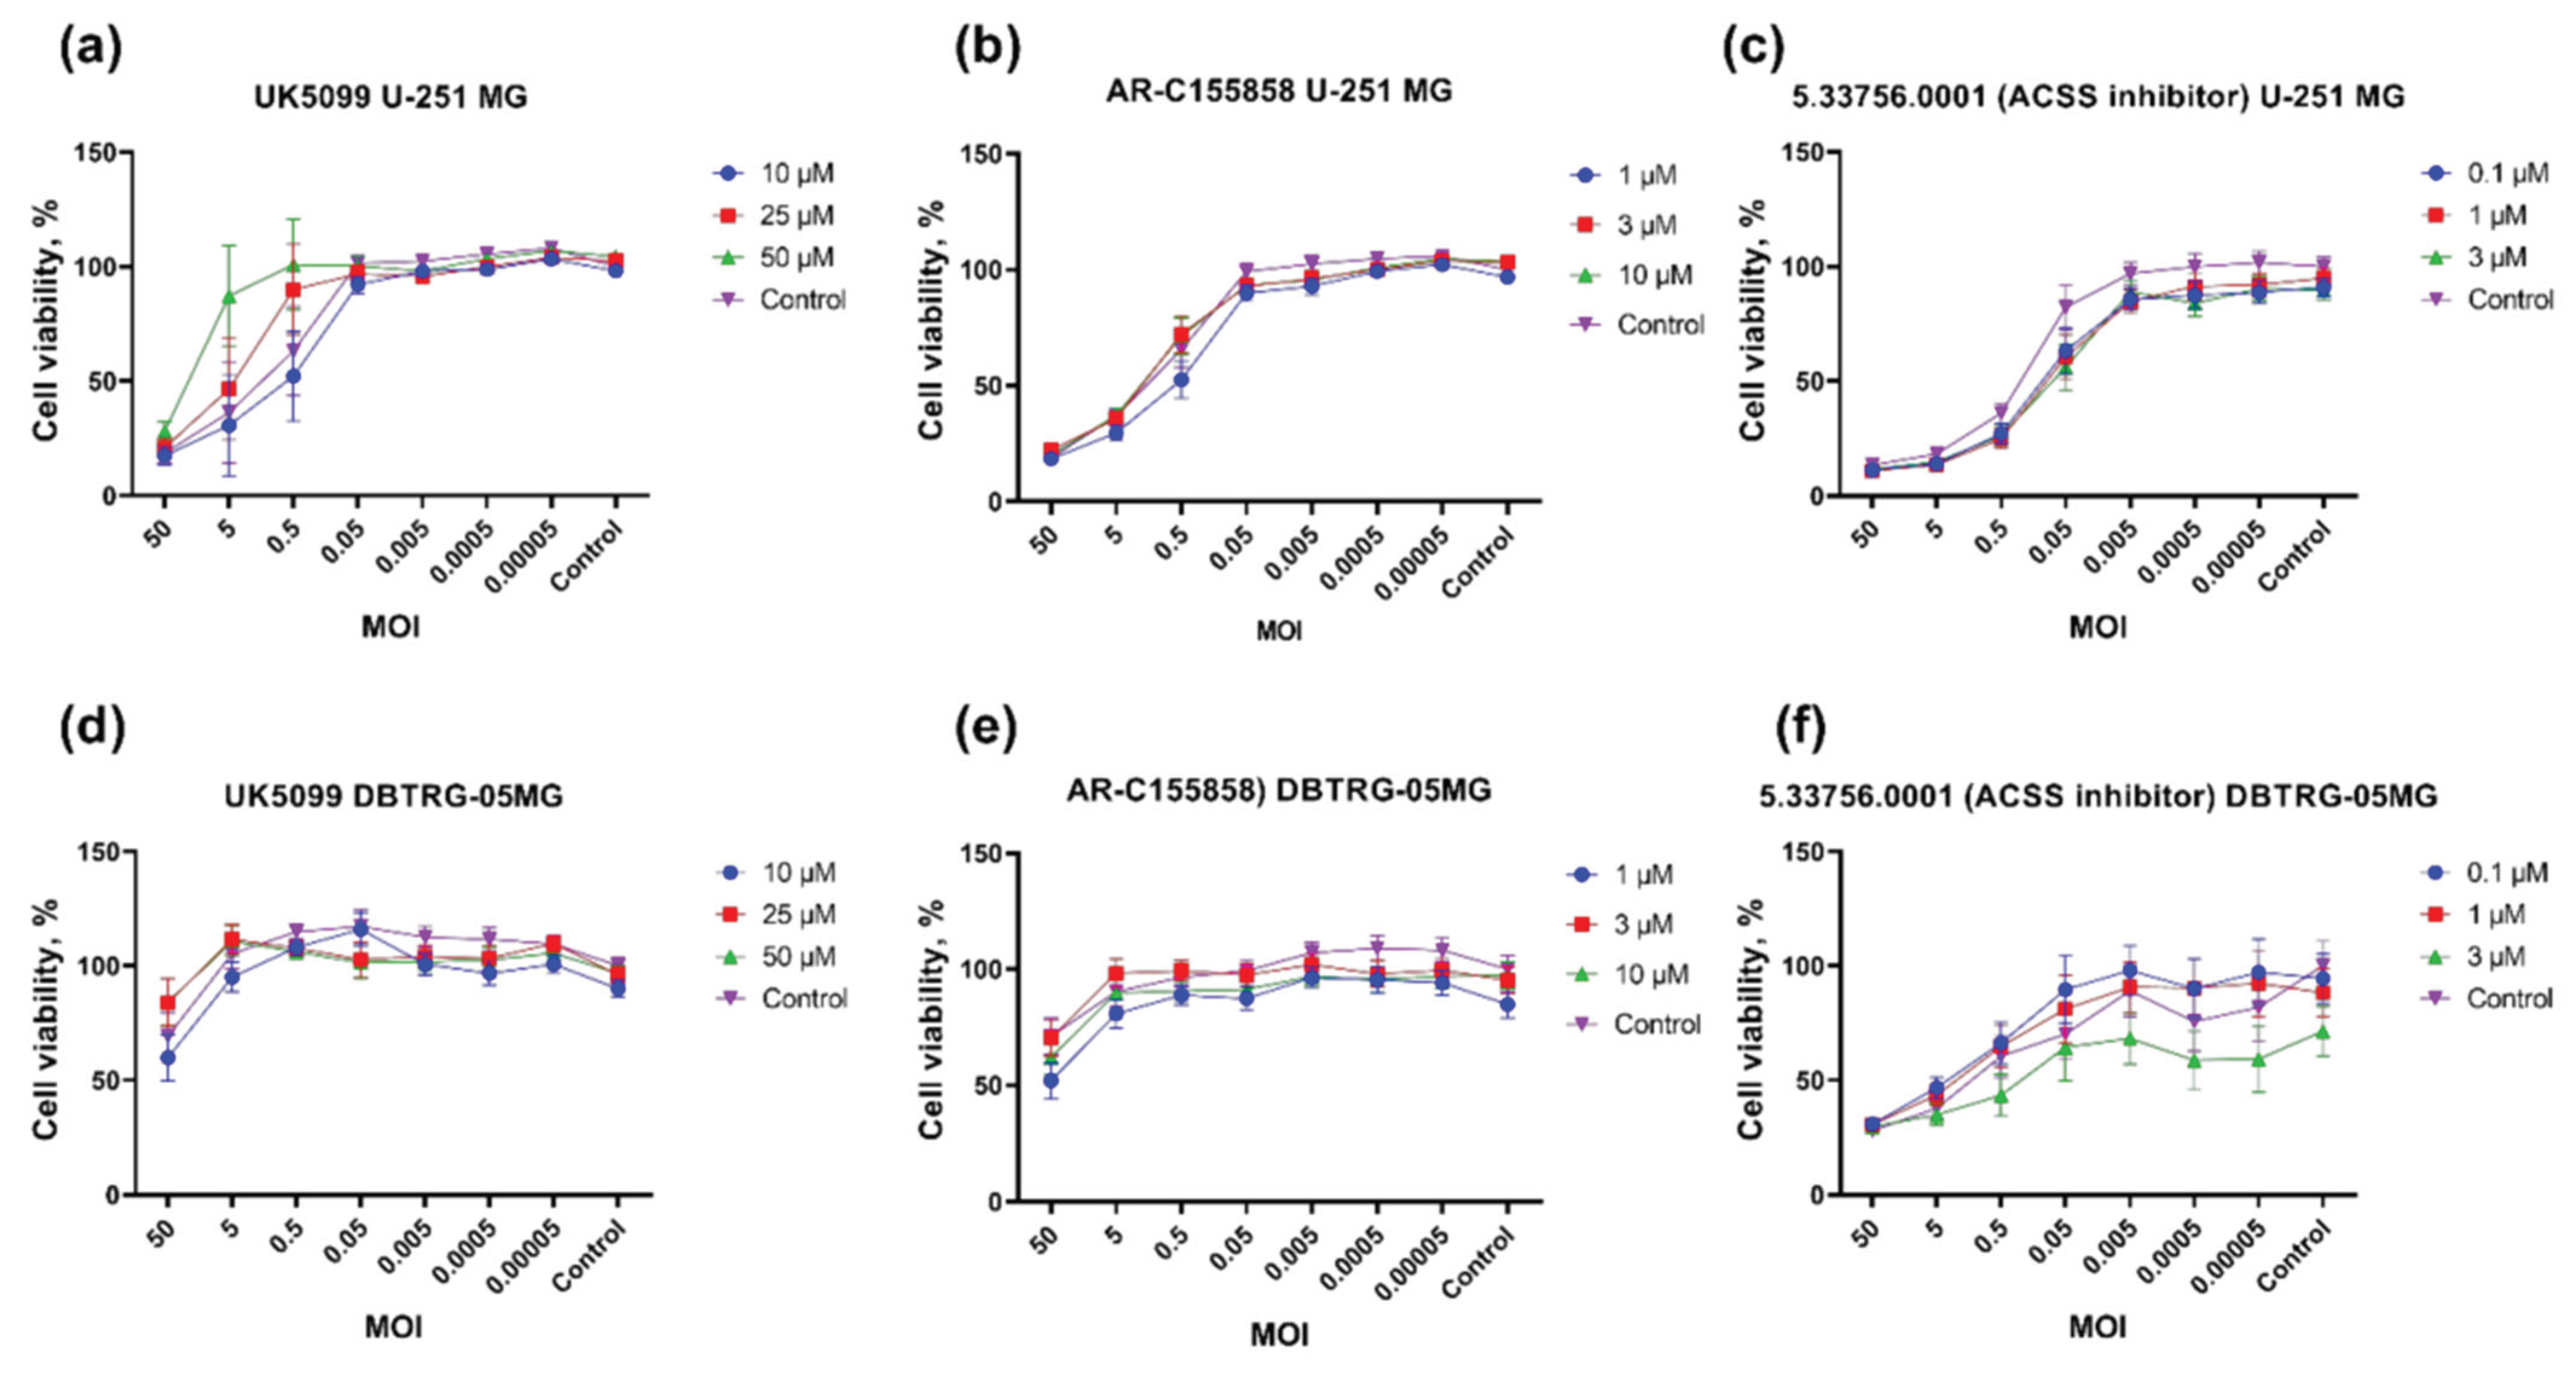
Figure 10.
Poliovirus infection does is not accompanied by increased production of superoxide anion. Superoxide production was assessed using dihydroethidium staining with subsequent measurement of fluorescence of the specific 2-hydroxyethidine product by flow cytometry. tBuOOH was used as a positive control. The data are presented as mean ± SD. *p ≤ 0.05 by ANOVA with the Tukey post-hoc test.
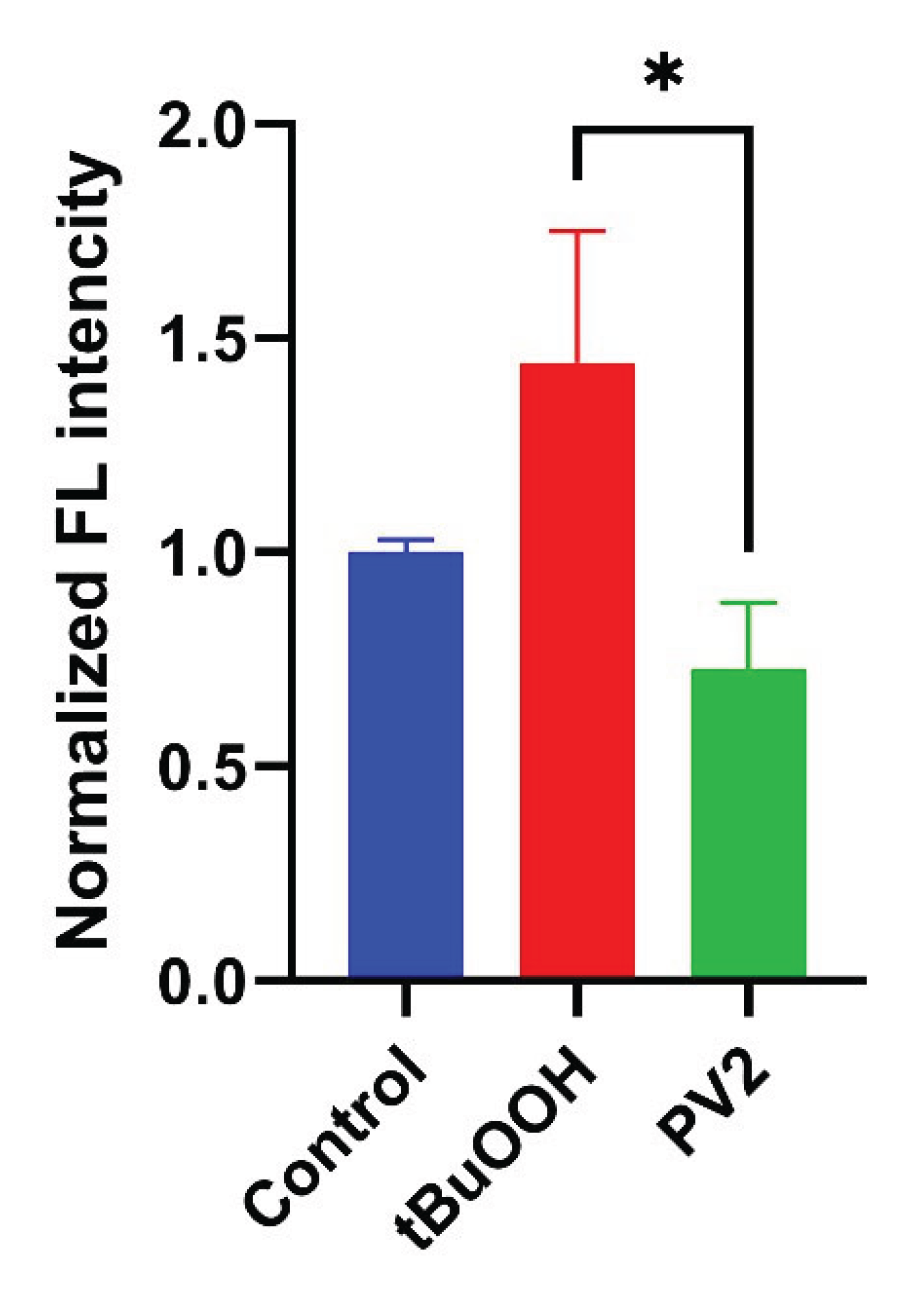
Figure 11.
Poliovirus infection does induce changes in hydrogen peroxide levels. H2O2 levels in HEK293TΔIFNR1 cells stably expressing genetically-encoded ratiometric HyPer7-Lifeact sensor were measured by confocal microscopy. The cells were infected with poliovirus at MOI = 1 for 14 hours, green fluorescence was quantified after excitation at 405 and 488 nm. As a positive control, the cells were treated with hydrogen peroxide 5 min prior analysis. Ratiometric analysis is presented as the ratio of excitation wavelengths 488/405.
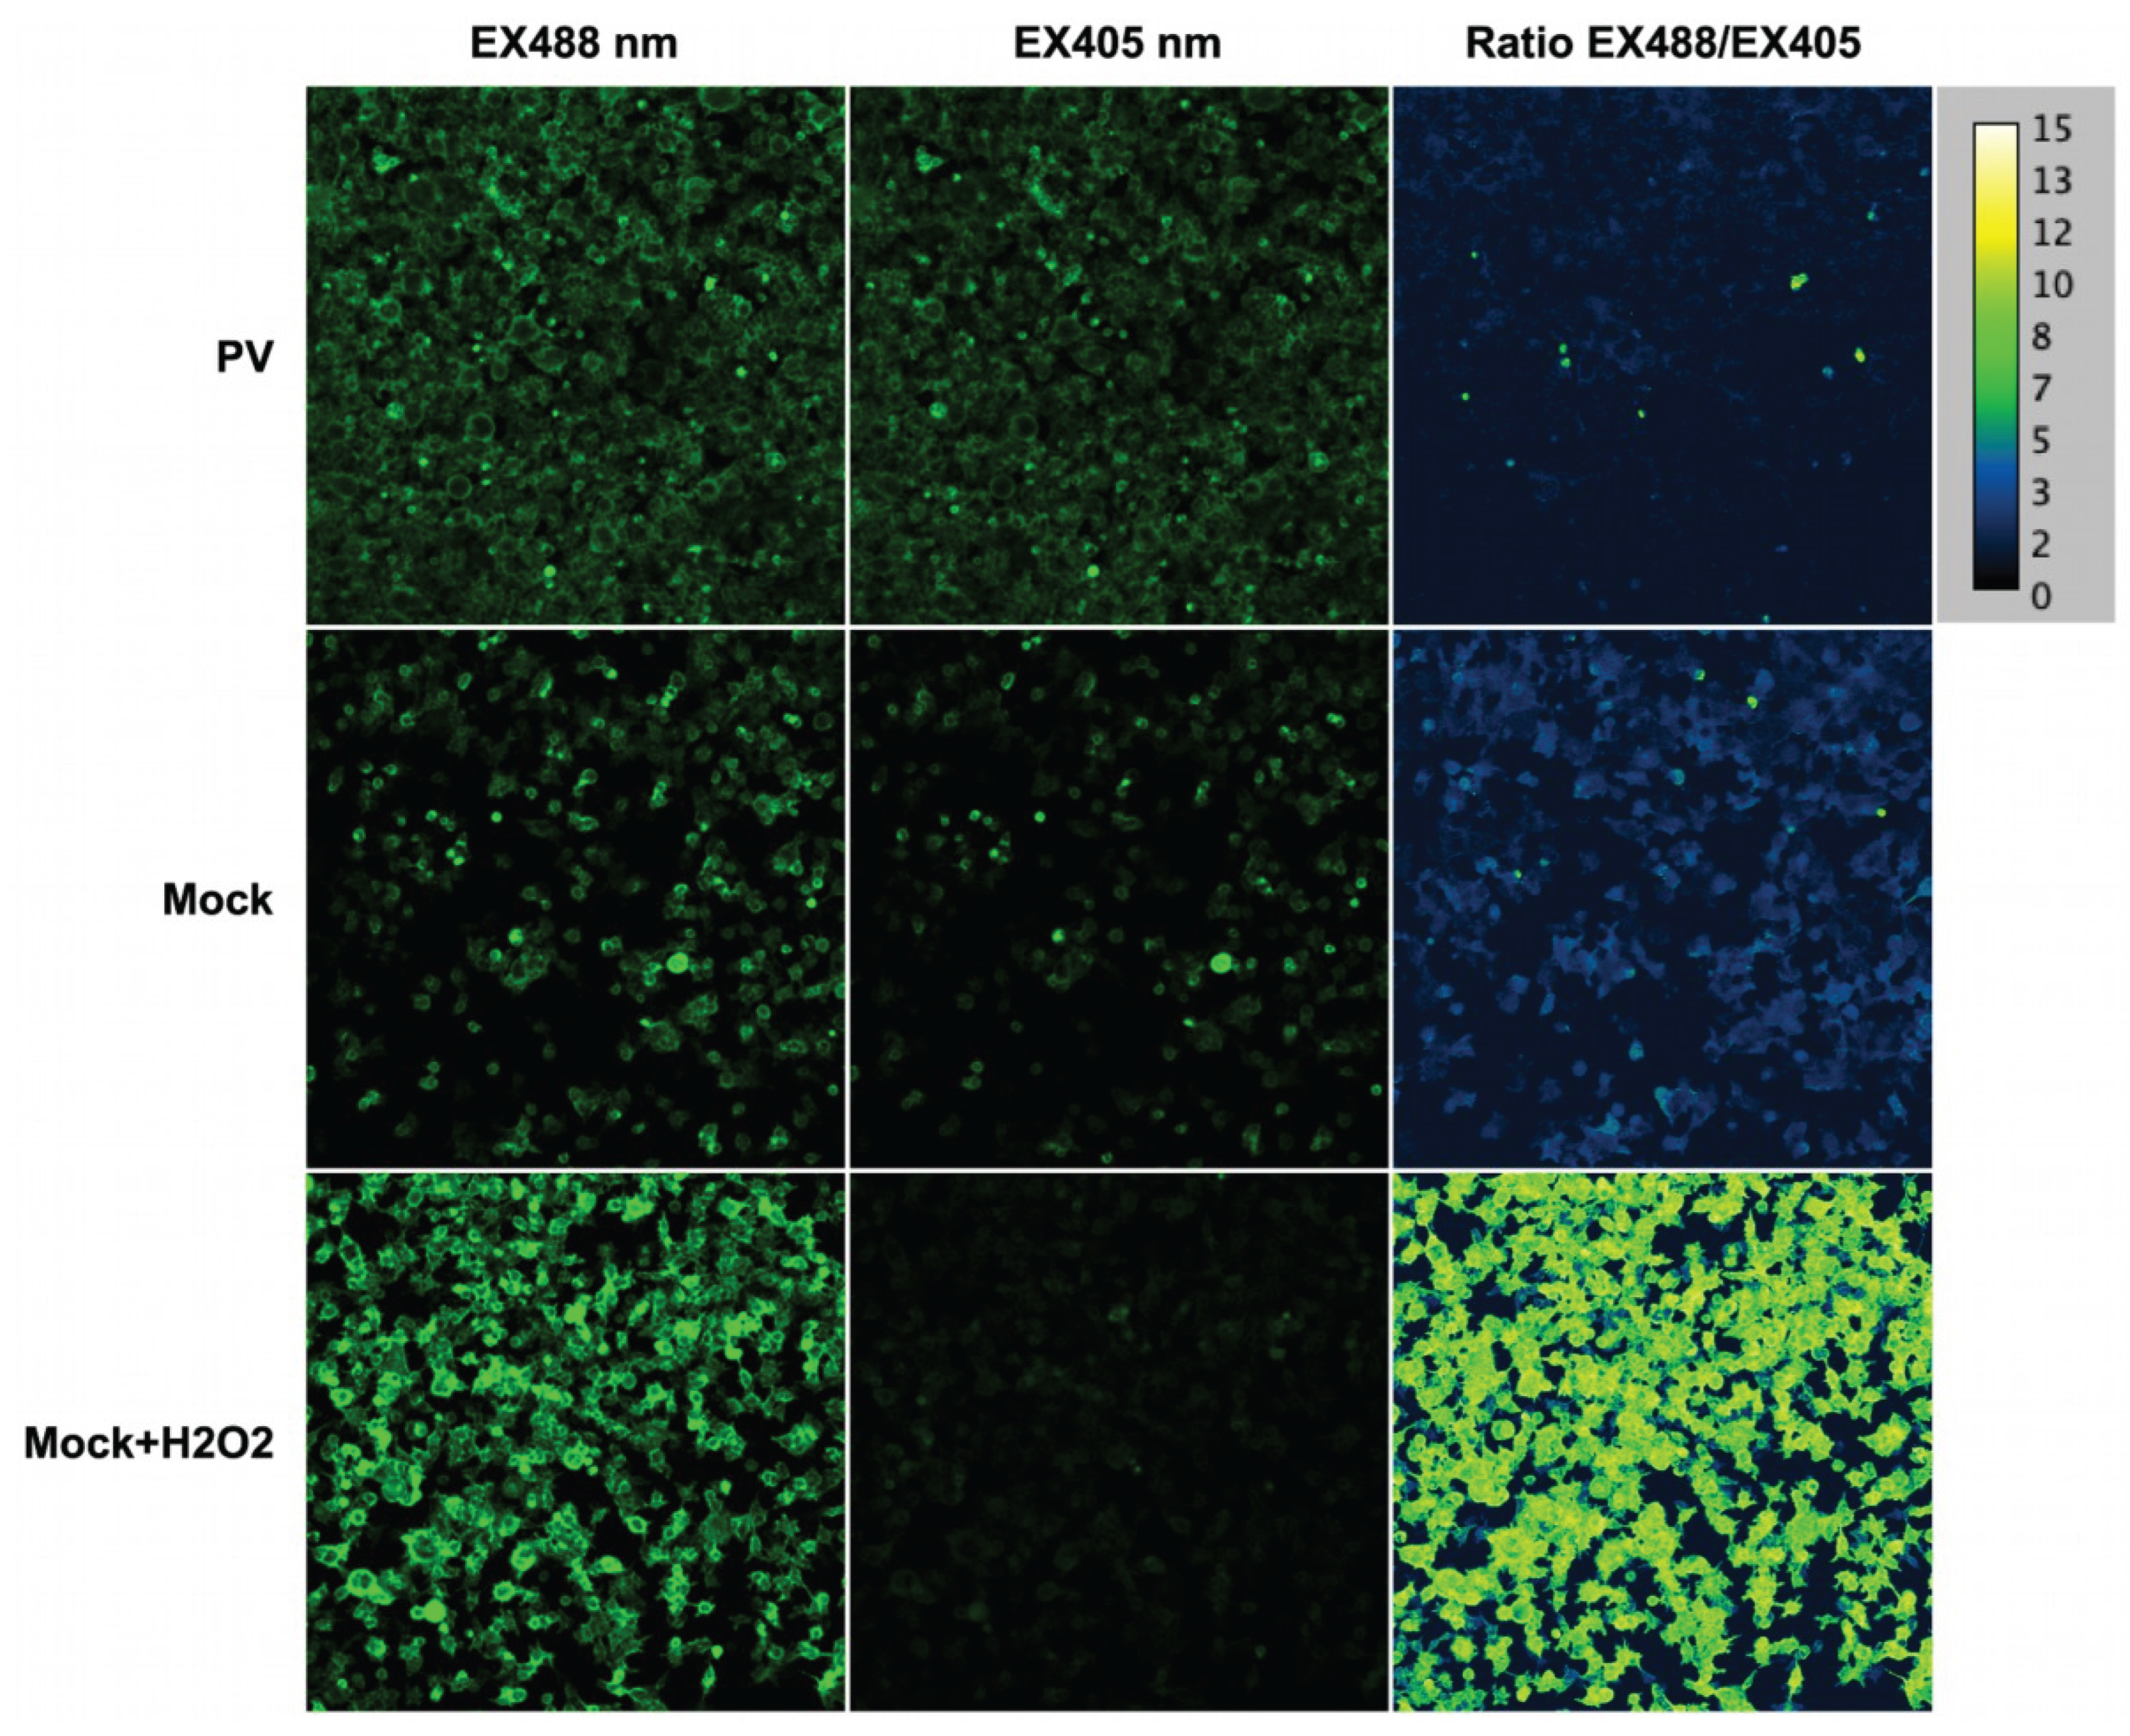
Figure 12.
Relative levels of mRNA of Nrf2/ARE pathway in GBM cells. U-251 MG (a) or DBTRG-05MG (b) cells maintained in DMEM or Plasmax media were infected with PV at MOI 1, and mRNA levels were measured 24 h.p.i. by reverse transcription and real-time PCR analysis. The mRNA levels were normalized to mRNA of a β-glucuronidase and then to the values of mock-infected cells in DMEM. Data are presented as mean ± SD, *p ≤ 0.05, **p≤0.01 by ANOVA with the Tukey post-hoc test.
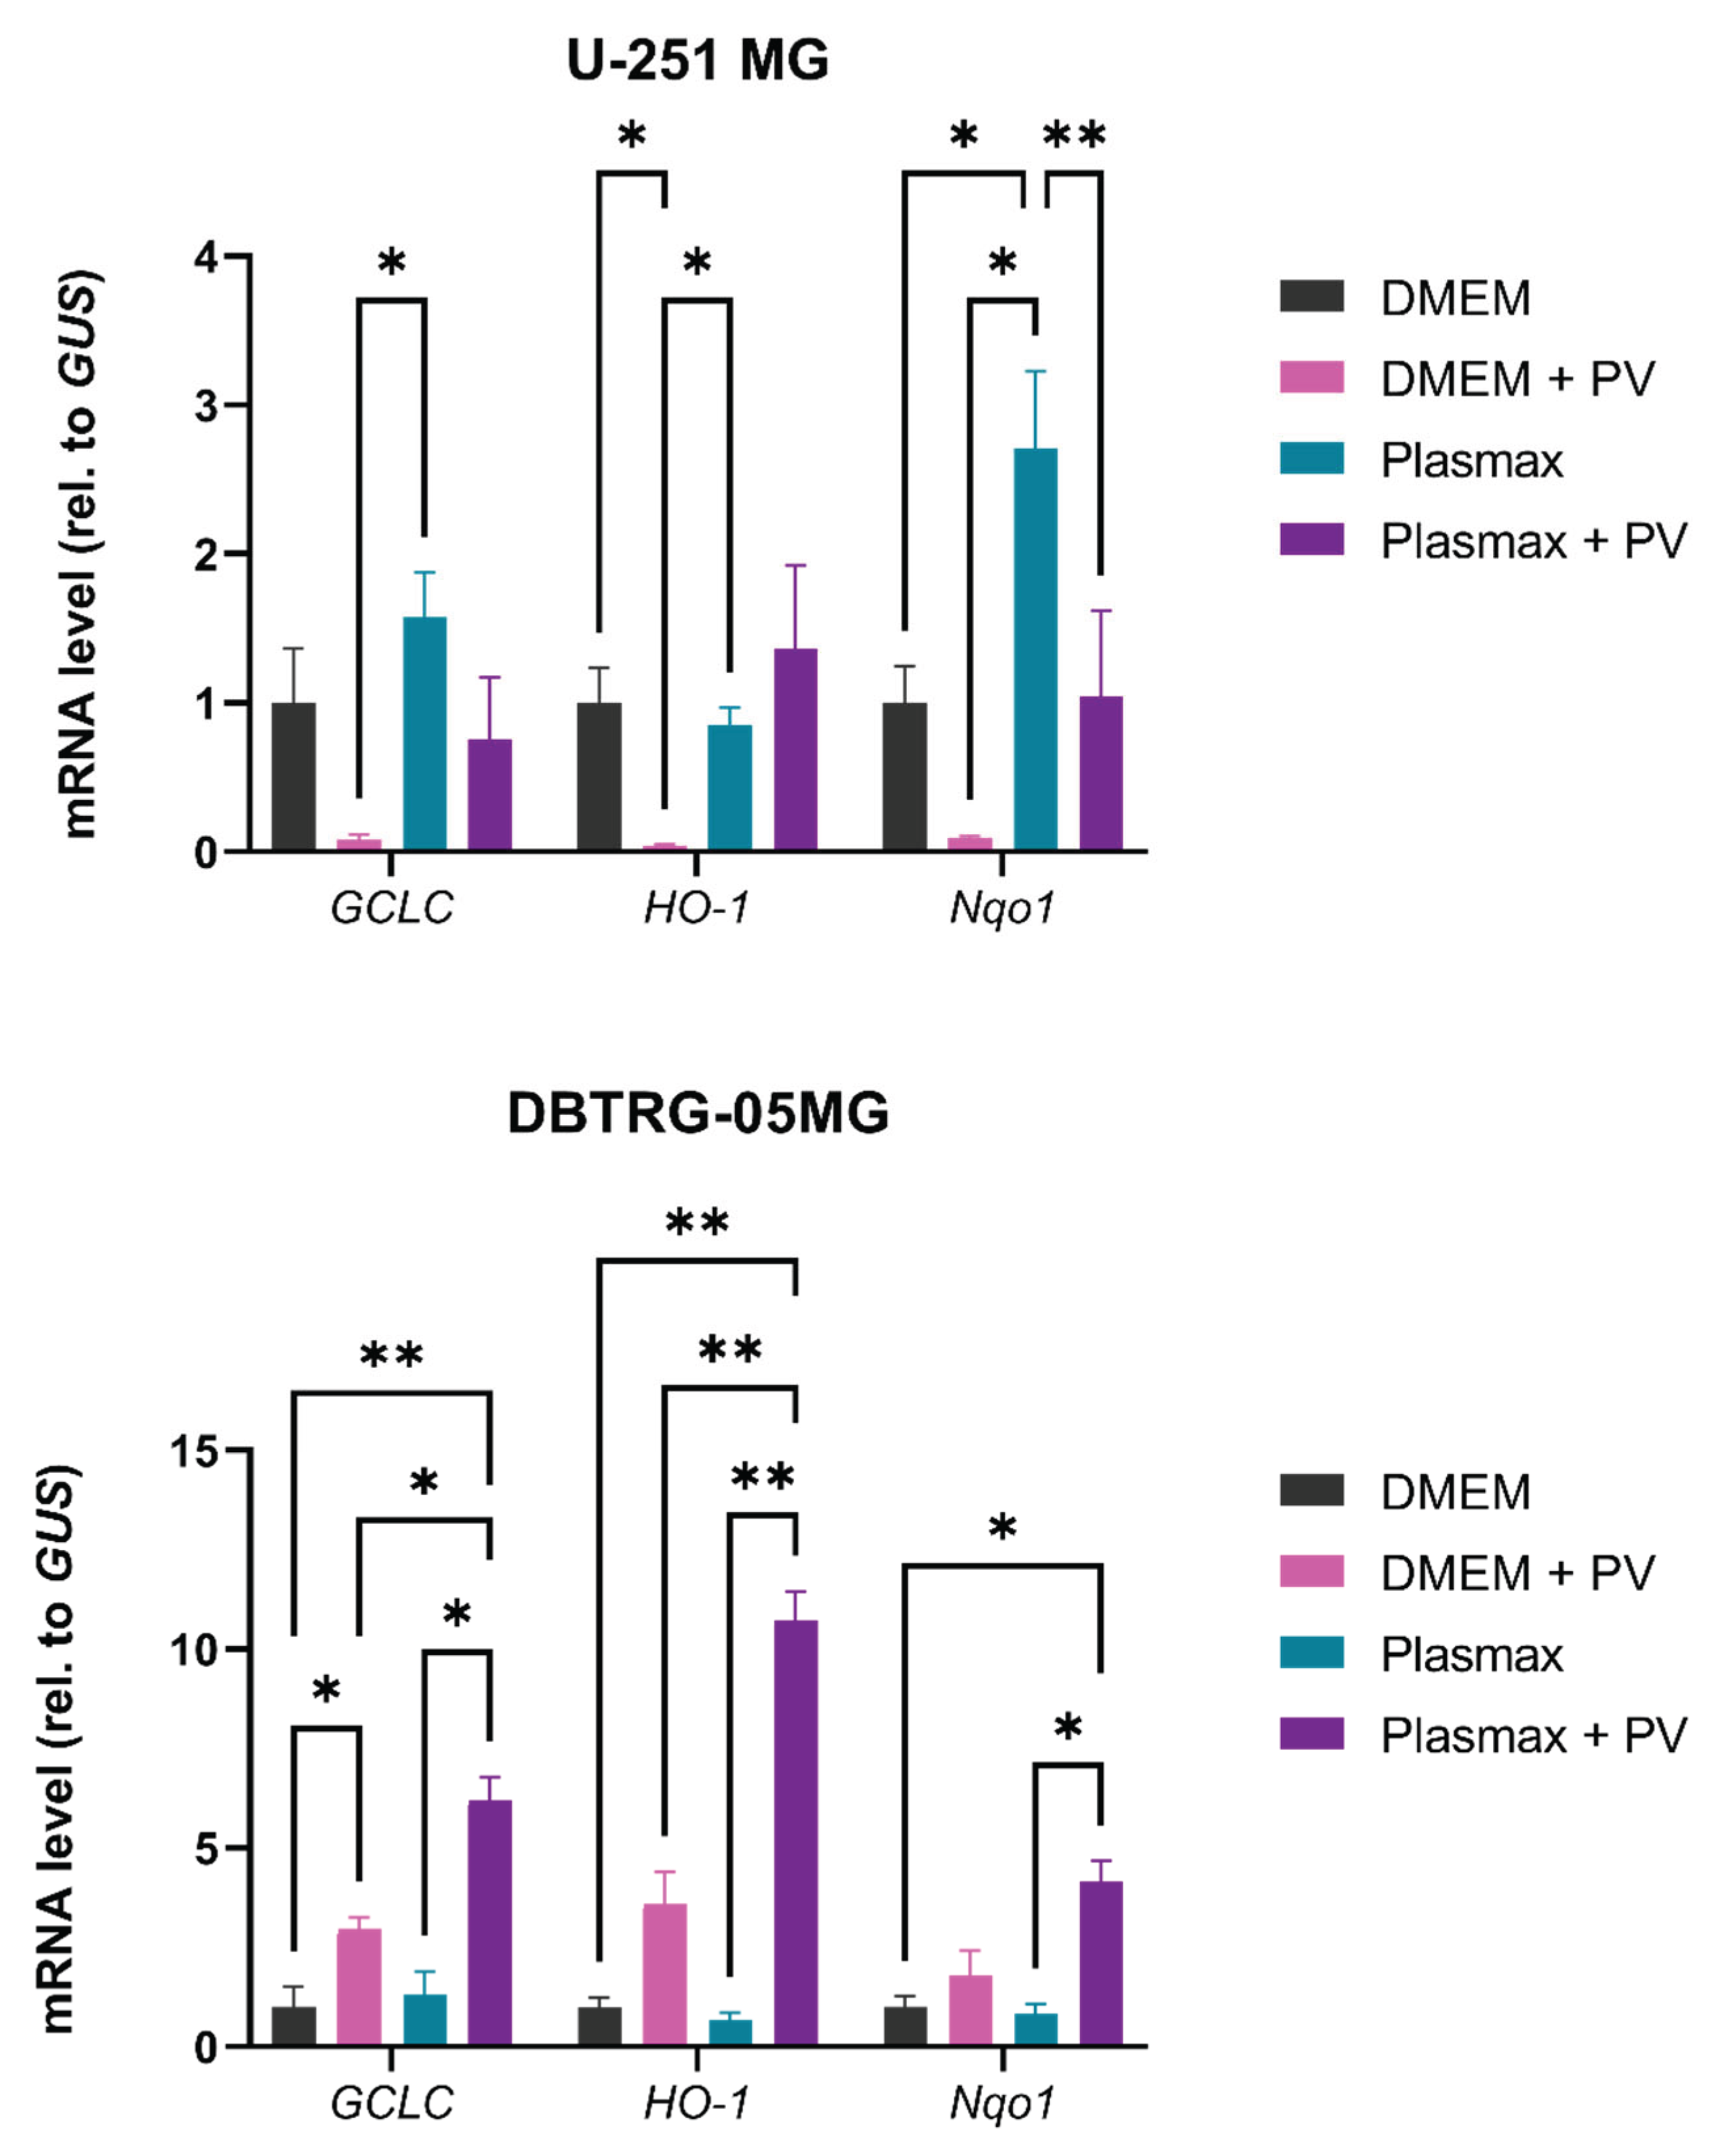

Table 1.
Metabolic inhibitors and pharmacological agents whose activity was tested in this work.
| Compound | Target | Metabolic pathway | Sourse |
|---|---|---|---|
| 5.33756.0001 | ACSS | Fatty acid biosynthesis | Sigma |
| APCHA | Spermine synthase (SMS) | Polyamine biosynthesis | Sigma |
| DFMO | Ornithine decarboxylase (ODC) | Polyamine biosynthesis | MedChemExpress |
| Deferiprone (DFP) | Hypusination (DOHH inhibitor) | eIF5a hypusination | Sigma |
| Diethylnorspermine (DENSpm) | Spermidine/spermine-N1-acetyltransferase (SSAT) | Inducer of polyamine catabolism | Santa-Cruz Biotechnologies |
| GC7 | Hypusination (DOHH inhibitor) | eIF5a hypusination | Santa-Cruz Biotechnologies |
| MCHA | Spermidine synthase (SRM) | Polyamine biosynthesis | Sigma |
| AR-C155858 | MCT1 and MCT2 inhibitor | Glycolysis | MedChemExpress |
| MDL72.527 | Polyamine oxidases (PAOX, SMOX) | Polyamine catabolism | Sigma |
| Sardomozide (SAM-486a) | AdoMetDC (ADM1) | Polyamine biosynthesis | MedChemExpress |
| UK-5099 (PF-1005023) | Inhibitor of the mitochondrial pyruvate carrier (MPC) | Link between glycolysis and TCA cycle | Sigma |
Table 2.
Sequences of primers used in the research.
| Name | 5'-3' Sequence | 3'-5' Sequence |
|---|---|---|
| AGPS | GCGCGAGCTACGGGTCTG | CTCTCCGCGCTTTGCACT |
| Aldo | GGCCCCACGATAGTGTGAAT | TCTCTAATGACCCCTGCCCT |
| DGAT | TATTGCGGCCAATGTCTTTGC | CACTGGAGTGATAGACTCAACCA |
| FASN | TACAAGCTGCGTGCCGCTGA | ACCCTCGATGACGTGGACGGAT |
| GCLC | GGATTTGGAAATGGGCAATTG | CTCAGATATACTGCAGGCTTGGAA |
| HO1 | CCAGCAACAAAGTGCAAGATTC | TCACATGGCATAAAGCCCTACAG |
| IGS15 | GCCGATCTTCTGGGTGATCTG | ATGGGCTGGGACCTGACG |
| MxA | GGTGGTCCCCAGTAATGTGG | CGTCAAGATTCCGATGGTCCT |
| Nqo1 | CCGTGGATCCCTTGCAGAGA | AGGACCCTTCCGGAGTAAGA |
| OAS-1 | ACAACCAGGTCAGCGTCAGAT | AGGTGGTAAAGGGTGGCTCC |
| TPI | AGCTCATCGGCACTCTGAAC | CCGGGCGAAGTCGATATAGG |
Disclaimer/Publisher’s Note: The statements, opinions and data contained in all publications are solely those of the individual author(s) and contributor(s) and not of MDPI and/or the editor(s). MDPI and/or the editor(s) disclaim responsibility for any injury to people or property resulting from any ideas, methods, instructions or products referred to in the content. |
© 2025 by the authors. Licensee MDPI, Basel, Switzerland. This article is an open access article distributed under the terms and conditions of the Creative Commons Attribution (CC BY) license (http://creativecommons.org/licenses/by/4.0/).
Copyright: This open access article is published under a Creative Commons CC BY 4.0 license, which permit the free download, distribution, and reuse, provided that the author and preprint are cited in any reuse.


