
Submitted:
20 May 2025
Posted:
20 May 2025
You are already at the latest version
Abstract
Interpreting diagnostic imaging and identifying relevant features in healthcare present significant challenges. For novices, the risk of misdiagnosis can be overwhelming, particularly in the absence of structured guidance and supervision. Furthermore, radiologists' expertise is not always accessible to trainees when needed. Consequently, explicit, structured guidance is essential to help novices interpret complex imaging data accurately and enhance their learning process. Therefore, developing an approach to transfer expert knowledge to novices would be invaluable, bridging the gap between theoretical understanding and practical skills in medical imaging. Eye-tracking has surged in popularity in recent years for analyzing medical images. Incorporating experts' eye-gaze patterns in an artificial intelligence (AI)- driven web tool offers an intuitive learning experience. Highlighting the regions of interest (ROI) can facilitate feedback and accelerate students' learning and clinical decision-making. Our multimodal approach integrates chest X-ray (CXR) images with expert eye-tracking fixation maps as auxiliary data, explicitly highlighting radiologists' visual attention during medical image assessment. We employ a unified core architecture to minimize the influence of noisy fixation data and avoid treating the imaging and eye-tracking modalities as independent contributors, thereby enhancing abnormality detection in CXRs. Gradient-weighted Class Activation Mapping (Grad-CAM) validates our model interpretability and influences radiologist decision-making, underscoring the framework's practical application in clinical contexts. Finally, we conducted a comprehensive evaluation of our model using both qualitative and quantitative analyses.
Keywords:
eye-gaze tracking
; deep learning
; explanation
; artificial intelligence in health
I. Introduction
Generally, eye-tracking reflects a person's attentional behaviour by measuring their eye movements. This technology facilitates in-depth analysis of how people perceive and respond to visual information through monitoring users' visual attention as they engage with stimuli. Over time, this technology has consistently demonstrated reliability and accuracy in capturing how they allocate their focus towards visual stimuli [1]. Eye-tracking systems have garnered increasing interest in analysing learners' concentration in an educational environment [2]. On the other hand, Deep learning (DL) network advancements have led to impressive results in medical image analysis over the past decade, and many researchers have been starting to analyze eye-tracking data (with its unique parameters, such as fixation, reflexive, and saccades) through these novel AI methodologies. Eye data benefits these models by enabling them to prioritize ROI, leading to better abnormality detection. This approach addresses a notable challenge in many medical imaging tasks, where the scarcity of large, annotated datasets limits the model’s ability to learn directly from extensive labeled examples. For instance, analysis of gaze data indicates that radiologists allocate more significant attention to specific areas indicative of abnormalities during verbal reporting of findings, as opposed to silently scrutinizing the image [3]. Despite their success, DL models are often considered “black boxes” due to their complex and unclear inference processes [4]. As the implementation of these models expands, there is a growing need to understand how they function, their potential applications, and their limitations in various contexts. Consequently, explainable artificial intelligence (XAI) has been introduced to address such models' critical need for transparency and interpretability [5]. Understanding how and why a model reaches a specific diagnosis fosters trust among medical professionals and ensures that AI systems can be used effectively in clinical settings. Traditional radiology education systems focus on expanding knowledge by relying on intense practice and visual interpretation skills over time. Subsequently, gaining hands-on understanding and conducting learning experiments takes years of training and practice to develop expertise [6]. Hence, incorporating experts’ eye-tracking data as a knowledge base and using an AI-based approach can help junior radiologists identify critical regions and make more informed diagnostic decisions. To address this challenge, we propose a novel Eye-Gaze Guided Framework designed to improve radiology training. Our framework incorporates expert radiologists' gaze patterns to guide trainees, highlighting crucial areas within diagnostic images. We used Grad-CAM explanation and expert feedback to evaluate our model, relying on qualitative and quantitative evaluation of the explanation. The overall model and the evaluation steps are illustrated in Figure 1.
A. Motivating Scenario
Relying on visual information is essential in medicine, from diagnostic reasoning in interpreting medical stimuli to processing and responding to visual input during complex procedures. Trainees have traditionally developed their skills and refined practice strategies through extensive experience and present information [7]. The findings by [8] suggest that experienced physicians quickly form a holistic impression of medical images and potential abnormalities, a level of insight trainees often lack.
Consequently, much research in medical education aims to enhance the visual learning experience to better support novices. The shift towards online and blended learning environments and incorporating online learning platforms and real-time feedback systems may help guide the development of educational interventions. Eye tracking is typically used as a research tool, and recent studies have leveraged this technology in education [9]. Eye tracking data in medical education provides a valuable data source and presents potential by investigating visual characteristics of experts’ eye movements, considering their eye movements as a proxy of higher cognitive function related to their domain expertise [10]. Therefore, finding an approach to transfer knowledge between experts and novices might help trainees tune up their gaze patterns and improve their clinical decision-making ability.
B. Contributions
- Eye Guided Framework: The Multimodal Fusion Framework integrates attention mechanisms to capture the most essential part of the stimuli. This model with a shared backbone prevents the impact of noisy fixation data and separates the processing of modalities to improve the performance of automatic abnormality detection in CXRs.
- Explanation Support for Transparency: We provide post-hoc feature attribution explanations to help radiology trainees understand lesion classification in chest X-rays.
- Evaluation of the Approach. We evaluate our approach to maintain robust performance under noisy conditions, which shows resilience to misaligned fixation maps. We further assess the interpretability of the model utilizing Grad-CAM, ensuring that the generated visual explanations correspond to the expert-annotated RoI. This alignment enhances the clinical reliability of the model's predictions.
II. Background and Related Work
A. Eye-Gaze Tracking in Radiology
Eye-tracking technology has been broadly explored to study human visual perception for over a decade, developing numerous methods to track eye movement for various applications. Typically, eye-tracking is applied in two main areas: interactive and diagnostic applications [11]. In an interactive context, users' eye movement data is an input method, whereas in a diagnostic context, it provides insights into their intentions and cognitive processes [1]. While AI advancements have enabled medical deep learning to use this prior knowledge in diagnostic tools, early studies indicate that eye-tracking technology can improve clinician interaction and AI systems [12,13]. Eye tracking studies in stimulus analysis primarily involve exploring where and how medical professionals examine different modalities of images. Eye movement parameters, such as fixation (the process where the eye remains stationary on a specific point to gather and process visual information), saccades (the rapid eye movements that shift the focus from one point to another quickly), and scanpath (sequence of eye fixation and saccadic that an individual follows while observing a visual scene), present valuable insights into diagnostic processes and expert-related decision-making for new training [14]. Eye tracking data impacts image interpretation, analysis, and diagnosis. Many studies have discussed utilizing eye-gaze data across diverse applications, including: i) Classification: Replicating different search strategies and exploring the potential to improve model performance and interpretability in different modalities [15,16,17]. ii) Data annotation: To highlight the expert's search patterns while labelling medical data, including images, text, and genetic information [18,19]. iii) Object detection and Segmentation: providing a unique supervision format for training DL/ML-based approaches and the object's precise location within an image [20] .iv) Workload and Skill: Focuses on understanding human factors in medical image interpretation and diagnosis, including fatigue and skill level effects on diagnostic accuracy [21].
B. Multimodal in Medical Data
Multimodal learning in medical applications accelerated in the mid-2010s when integrating various clinical data with various types of radiological imaging, e.g., CT scans and MRI, was shown to improve diagnostic precision. Early studies by Li et al. [22] exemplified this paradigm shift, utilizing multiple data sources to provide a more comprehensive analysis. More recently, different scenarios of medical imaging applications have been proposed to integrate eye-gaze tracking data into stimulus analysis. With increasing focus on multimodal deep learning models, the incorporation of eye-gaze tracking allows for a deeper understanding of human search patterns, enhancing the models' ability to analyze visual information effectively [23]. Drew [24] noted that experts rapidly identify potential lesions, utilize a wider functional field of vision, and draw on more conceptual knowledge than novices when detecting abnormalities. Ma et al. [25] used the radiologists' visual attention maps to enforce the model to concentrate on task-related objects or features rather than harmful shortcuts.
Furthermore, Wang et al. [26] indicates that radiologists' gaze patterns are strongly linked to diagnostic accuracy in mammogram lesion detection by proposing an attention-aware augmentation method that consistently improves the focusing contrast and highlighting the importance of where they focus and reducing errors in the evaluation phase.
Hsieh et al. [27] present a parallel framework that processes chest X-ray images and expert fixation masks through Convolutional Neural Network (CNN) models. This multimodal approach predicts abnormality classes, refines bounding boxes, and optionally generates binary masks for more precise lesion localization. Although analyzing the CXR images and heat map overlay causes noise in the model, we discuss in the method section that our approach can prevent it.
C. Explainable Artificial Intelligence
Several studies have discussed the details of the available Explainable Artificial Intelligence (XAI) approaches and have presented the genetic frameworks for XAI [28,29,30,31,32]. This section will discuss the studies on developing XAI methods with multimodal data containing eye-tracking information. At present, only a limited number of studies in multimodalities have focused on developing explainable systems despite the recognized significance of XAI systems. In medical imaging, various explanation approaches are visual-based explanations [33]. The core idea of these approaches is to present the information maintained through the model to analyze which part leads to the model prediction. Generally, these methods present attribution maps, which can be used to diagnose a supportive and transparent system. These saliency-based explanations can be categorized into perturbation-based, activation-based, and backpropagation-based techniques [34].
Perturbation-Based Techniques: These methods assess the importance of each input by modifying the image and observing the effect on the model’s output. Perturbation techniques can be applied broadly to classification and regression tasks if the distance between model outputs can be computed. These methods focus on understanding how changes to input features affect the neural activity and predictions of the model.
Activation-Based Techniques: These techniques leverage the feature maps generated in the last layer of a CNN network to explain the model’s predictions. By weighting each feature map and summing them, these methods create class activation maps (CAMs), highlighting areas of the image corresponding to a predicted class. The final activation map is upscaled to the size of the original image, often leading to a coarse resolution. CAMs help localize regions of interest by detecting neuronal activity associated with specific classes. Shallow CAMs capture finer details, while deeper CAMs identify broader object regions.
Backpropagation-Based Techniques: These methods propagate the output gradients back to the input image, creating a high-resolution saliency map highlighting which pixels most influence the model’s prediction. Gradients indicate how much each pixel affects the final decision, increasing or decreasing the predicted class score. These techniques focus on the impact of individual pixels and how changes affect neuron activity.
III. The Proposed Model
This work introduces an eye-guided multimodal fusion with shared parameters to facilitate interactive exploration and visualization techniques. Our system enables us to use the collected knowledge base on the expert's fixation map to quickly navigate to reading stimuli while receiving feedback. As shown in Figure 2, the framework of our proposed method consists of three main components. Firstly, after preprocessing raw CXR and the expert's fixation heatmap, the fusion of feature maps from both modalities enables the model to learn correlations between the eye-tracking heatmaps' spatial patterns and the X-ray images' visual features. Secondly, this framework has a unified core between CXR and fixation map to prevent the impact of noisy fixation data and to stop separate processing of modalities that assume both sources contribute independently to improved abnormality detection in CXRs. Finally, we evaluate the validation of the model's explanation interpretability through Grad-CAM, its usability, and its impact on radiologist decision-making.
A. Multimodal Input Data
The input image used in this framework consists of the CXR images. After collecting the raw eye gaze, we generate a related expert's fixation heatmap using the coordinated points. The eye-tracking heatmap data captures the CXR regions that received the most attention from the radiologist. Then, we applied pre-processing, such as resizing, cropping, and augmentation, including Gaussian Blur to provide a slight blur to avoid overfitting and colour jitter as a brightness and contrast augmentation.
Input data represented as:
where W and H represent the width and height of the image, the single channel corresponds to the grayscale chest X-ray data, and the three channels correspond to the RGB in heatmap overlay data.
B. Mode
Multi modal Data Processing: The model initially constructs a multichannel input by stacking the chest X-ray images and eye-tracking data along the channel dimension. This early fusion of feature maps from both modalities enables the model to capture and learn correlations between the eye-tracking heatmaps' spatial patterns and the X-ray images' visual features. This fusion allows the model to process both data types simultaneously.
Attention Heads: The attention mechanism helps the model focus on the most relevant regions of the input, acting like a filter and aligning the network with human decision-making, potentially improving performance. It processes the input, applies attention scores, and outputs the weighted feature maps. The attention head consists of two 1x1 convolutional layers. The first convolution reduces the feature map dimensions, applying ReLU for non-linearity, and the second convolution computes attention scores, followed by a sigmoid activation to normalize the attention weights to the [0,1] range, and finally, consider adding a dropout layer after attention-scores, as this can help prevent overfitting. The output is element-wise multiplied by the input to generate attended features. The attention head applies the following operations:
where W1 and b1 are the weights and biases of the first convolutional layer, and * denotes convolution. The second layer computes attention scores, followed by a sigmoid activation to constrain the attention weights to the range [0,1]:
W2 and b2 are the weights and biases of the second convolutional layer, representing the sigmoid function. Finally, the attended features are computed by element-wise multiplying the input feature maps with the attention weights. The attention weights A (weights) are element-wise multiplied by the original input feature map F (input) to produce the attended feature map:
Unified Backbone: We use a convolutional neural network model as a shared backbone network. The shared backbone module processes the attended features extracted from the attention head and outputs deep, high-level feature maps. These feature maps are then passed to the fully connected layer, which predicts six labels in the classification task. Since each image can have multiple labels, the fully connected (FC) layer produces independent predictions for each of the six labels. The attended input from the attention head is passed through the ResNet-50 backbone, which produces the high-level feature representation, denoted as:
where is the multimodal input (combining the X-ray and eye-tracking heatmap) and the backbone output, which contains the high-level features.
Fully Connected Layer: The final fully connected layer (FC) of the CNN backbone maps the high-dimensional feature vectorinto six output logits for multilabel classification:
where is the sigmoid function, producing probabilities for each class. The network then assigns a label to each class based on a predefined threshold (e.g., 0.5). For each of the six labels in multi-label classification, converted into probabilities using the sigmoid activation function:
where
C. Explanation
In the first step, the heatmap generation process involves capturing activations and gradients from the convolutional layer of the backbone model (here, we used the fourth layer). A forward hook is registered on the target layer to store the output activations and gradients. During the backward pass, gradients are accumulated concerning a specific target class, enabling a focused visualization. The captured gradients are pooled across spatial dimensions by averaging:
Here, is the score for the target classrefers to the activation at spatial location for the feature map, and Z is the total number of spatial locations These pooled gradients are used to weight the corresponding activations.
The weighted activations are averaged across channels to generate the initial heatmap:
A ReLU operation ensures that only positive values are retained to highlight the relevant areas. In the next step, we normalized and flipped vertically to correct orientation issues and match the original image dimensions to build consistent scaling for the heatmaps. Finally, we converted it to an RGB format using a colormap for visual clarity and generated an interpretable visual output.
IV. Experiments and Discussion
In this section, we discuss the experimental phase of our research and provide an overview of the key components that contribute to the study. We conclude with a comprehensive discussion that synthesizes our findings and offers a detailed interpretation of the results, aiming to provide a nuanced understanding of our research outcomes.
A. Dataset
Our experimental validation utilized the REFLaCX dataset (Reports and Eye-tracking Data for Localization of Abnormalities in CXR) [35], which is derived from the MIMIC-CXR dataset [36]. Eye-tracking data in REFLaCX was collected using an Eyelink 1000 Plus system (SR Research, Canada) at a 1,000 Hz resolution. The system tracked the radiologists’ pupil positions, and the fixation data were synchronized with timestamps from the dictations. Five radiologists provided manual labels for abnormalities and drew ellipses around localized findings over three phases. In the initial testing phase, radiologists reviewed a shared set of 59 CXRs. In the refinement phase, instructions were provided to standardize the labeling process, improving clarity and reliability. It also sets the stage for larger-scale data collection. Eventually, in the primary data collection phase, each radiologist independently reviewed around 500 CXRs. The final dataset was created, which contained eye-tracking data, transcription data, and manual annotations.
To qualify the approach, we focus on this dataset's most frequently occurring lesions, including pleural abnormality, consolidation, pulmonary edema, enlarged cardiac silhouette, atelectasis, and X-rays showing no specific disease findings. The pleural abnormality represents an abnormal condition of the pleura, the thin tissue that lines the chest cavity and surrounds the lungs. Pulmonary edema is a condition caused by excess fluid in the lungs. The fluid accumulates in the air sacs, making it difficult to breathe. An enlarged cardiac silhouette is evident when the heart appears more prominent than usual on imaging tests, such as a chest X-ray. Atelectasis is a partial or complete collapse of the lung, which can lead to shortness of breath and difficulty breathing. Finally, consolidation is filling alveolar airspaces with fluid (exudate, transudate, or blood), inflammatory cells, tissue, or other materials. Figure 3 represents CXRs for selected pulmonary conditions analyzed in our research, and Figure 4 shows the distribution of these selected lesion cases across different lung conditions.
B. Implementation Details
In this study, we tuned our model for 20 epochs. This value was selected based on an analysis of the training and validation loss curves, which showed that after 20 epochs, the model began to overfit, as indicated by a divergence between training loss (continuing to decrease) and validation loss (starting to increase). We employed an initial learning rate of 5e-5 and a weight decay of 1e-3. The Adam optimizer was utilized with a batch size of 32 for optimization. The images were cropped and resized to 224×224 pixels, aligning with the input requirements of the ResNet-50 architecture. The experiments leveraged open-source model weights pre-trained on ImageNet before fine-tuning on the REFLaCX datasets. The experimental setup involved computational resources from a local environment, where we trained and tested the model using the PyTorch framework. The training was conducted on an internal server with an NVIDIA RTX 6000 GPU and an Intel(R) Xeon(R) w7-3465X CPU. Initially, we divided the dataset into training, validation, and test sets using an 80/10/10 split, consistent with our division strategy. A random seed of 42 was used to guarantee reproducibility of the results.
C. Evaluation
In this section, we will describe the various evaluations we have conducted and the results obtained. We carried out two-phase evaluations of the Eye-Gaze Guided Fusion System, assessed the model's efficacy, and evaluated the explanations provided by Grad-CAM. A review conducted by clinical experts followed these evaluations.
Multimodal Fusion Performance: The effectiveness of the Eye-guided Fusion system was evaluated by comparing its performance across two configurations: (1) using only CXR images, and (2) combining CXR images with fixation maps as input. The comparison focused on the system's ability to detect abnormalities, measured using key metrics such as accuracy, AUC, precision, recall, and F1-score. To assess the system's practical reliability, robustness evaluations were conducted under varying conditions by introducing artificial noise into the fixation data, simulating potential misalignments or noise typical in real-world applications. This analysis aimed to determine the system’s capacity to maintain performance despite noisy or degraded inputs, reflecting its robustness for clinical deployment.
Ablation Study on Modality Contribution: The system's performance integrating CXR and fixation map modalities was assessed through an ablation study. This study compared the effectiveness of various input combinations. The results, summarized in Table I indicate that utilizing both modalities in Eye Fusion improved accuracy, AUC, and other important metrics. In this table, we used the average accuracy scores across all classes and metrics.
As shown in the confusion matrices in Figure 5, for most categories, such as Pulmonary Edema, Atelectasis, Consolidation, and Pleural Abnormality, the number of true positives is substantially higher than false positives and false negatives. Additionally, categories like Pulmonary Edema and Enlarged Cardiac Silhouette exhibit few false positives, indicating the model's precision and ability to avoid overpredictions. Furthermore, the low false negative rate in these categories reflects that the model captures true positives effectively.
Noise Robustness: Artificial noise was introduced into both models to measure how well the system and the explanation component handle noisy or misaligned data. In real-world settings, eye-tracking devices may not perfectly align with the displayed content or the target region of interest (e.g., an X-ray). Minor calibration errors, head movements, or device drift can cause slight shifts in fixation points. In practical applications, eye-tracking data often encounters challenges such as slight misalignment due to device calibration errors, minor head movements, or sensor drift. In this context, we used striped line noise, with 10% and 50%. A sample of this alignment is shown in Figure 6. This alignment helped test the model's robustness to minor misalignments that may occur in practice. As shown in Table II, the Eye-guided explanation system demonstrated better noise tolerance results than models without shared parameters, maintaining AUC values at increasing noise levels during testing.
2) Grad-CAM Explanation Evaluation: In this section, we will present the Intersection Over Union (IoU) performance evaluation of the explanation generated using the Grad-CAM.
Explanation Quality: The Grad-CAM heatmaps were compared to expert-labelled ROI and fixation maps. The overlap between the Grad-CAM activations and experts’ ROIs was measured in multiple classes using the mean Intersection over Union (mIoU) metric, which is defined as:
where N is the total number of classes, and is the Intersection over Union for class i . The results are illustrated in Table III.
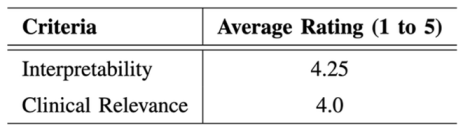
A radiologist with over 12 years of experience understanding radiological imaging evaluates the interpretability and clinical relevance of the Grad-CAM explanations. Evaluations were conducted using a 5-point Likert scale, focusing on clarity, clinical applicability, and diagnostic utility. The radiologist's repeated assessments across various imaging tasks provide quantitative ratings and in-depth qualitative feedback, highlighting the system's strengths and limitations in real-world settings. As the radiologist's familiarity with the Eye-guided system increased, there was a marked enhancement in workflow efficiency, evidenced by improvements in diagnostic speed, accuracy, and confidence. Notably, the analysis revealed a progressive alignment between the radiologist's preferred regions of interest and those identified by the system, further validating its clinical utility. The results of this evaluation are summarized in Table IV.
V. Conclusion
In this work, we highlight the influential role of radiologists’ eye-gaze data and propose an Eye-Gaze Guided Fusion framework. We quantitatively and qualitatively evaluate the capabilities of our model. Additionally, we show that incorporating eye-gaze data during model training can enhance the model’s reliability. We also explain that integrating experts' visual attention can effectively guide the model to focus on regions of interest (ROIs) within medical images.
A. Potential Impacts
Although the REFLaCX dataset, one of the most valuable resources, used five different radiologists for data preparation, each radiologist examined approximately 20% of the CXRs based on their strategy. However, there is still no public dataset where many experts work on the same images. This issue becomes prominent when different radiologists employ varying search strategies, particularly for images with no significant findings. As we realized, this could introduce bias in these cases.
B. Future Work
In the future, we will continue to optimize this proposed system by exploring multimodal approaches, mainly by integrating clinical reports alongside image and gaze data. This could further improve the model's understanding and interpretation of its predictions. Generating human-like explanations by simulating how an expert might describe their focus while analyzing an image could also help in potentially correcting biases. Meanwhile, developing a visual dashboard by showcasing a real-time interactive system will illustrate how radiologists can leverage the fusion of eye-tracking and X-ray data to improve diagnosis.
Acknowledgment
We sincerely thank all members of the Computational NeuroSurgery (CNS) Lab and Centre for Applied AI at Macquarie University members for their invaluable suggestions and support. All authors have reviewed and consented to the publication of this manuscript’s final version. Funding: This research received no external funding.
References
- K. Holmqvist, M. Nystr¨om, R. Andersson, R. Dewhurst, H. Jarodzka, and J. Van de Weijer, Eye tracking: A comprehensive guide to methods and measures. oup Oxford, 2011.
- H. L. O’Brien, P. Cairns, and M. Hall, “A practical approach to measuring user engagement with the refined user engagement scale (ues) and new ues short form,” International Journal of Human-Computer Studies, vol. 112, pp. 28–39, 2018. [CrossRef]
- C. Moreira, I. B. Nobre, S. C. Sousa, J. M. Pereira, and J. Jorge, “Improving x-ray diagnostics through eye-tracking and xr,” in 2022 IEEE Conference on Virtual Reality and 3D User Interfaces Abstracts and Workshops (VRW). IEEE, 2022, pp. 450–453.
- X. Chen, X. Wang, K. Zhang, K.-M. Fung, T. C. Thai, K. Moore, R. S. Mannel, H. Liu, B. Zheng, and Y. Qiu, “Recent advances and clinical applications of deep learning in medical image analysis,” Medical image analysis, vol. 79, p. 102444, 2022. [CrossRef]
- K. Borys, Y. A. Schmitt, M. Nauta, C. Seifert, N. Kr¨amer, C. M.Friedrich, and F. Nensa, “Explainable ai in medical imaging: An overview for clinical practitioners–beyond saliency-based xai approaches,” European journal of radiology, vol. 162, p. 110786, 2023.
- B. E. E. Mohajir, “Identifying learning style through eye tracking technology in adaptive learning systems,” International Journal of Electrical and Computer Engineering (IJECE), vol. 9, no. 5, pp. 4408–4416, 2019.
- N. Castner, S. Eivazi, K. Scheiter, and E. Kasneci, “Using eye tracking to evaluate and develop innovative teaching strategies for fostering image reading skills of novices in medical training,” Eye Tracking Enhanced Learning (ETEL2017), 2017.
- E. M. Kok and H. Jarodzka, “Before your very eyes: The value and limitations of eye tracking in medical education,” Medical education, vol. 51, no. 1, pp. 114–122, 2017. [CrossRef]
- H. Ashraf, M. H. Sodergren, N. Merali, G. Mylonas, H. Singh, and A. Darzi, “Eye-tracking technology in medical education: A systematic review,” Medical teacher, vol. 40, no. 1, pp. 62–69, 2018. [CrossRef]
- R. A. Newport, S. Liu, and A. Di Ieva, “Analyzing eye paths using fractals,” in The Fractal Geometry of the Brain. Springer, 2024, pp. 827–848.
- T. Duchowski, “A breadth-first survey of eye-tracking applications,” Behavior Research Methods, Instruments, & Computers, vol. 34, no. 4, pp. 455–470, 2002. [CrossRef]
- S. Wang, Z. Zhuang, X. Ouyang, L. Zhang, Z. Li, C. Ma, T. Liu, D. Shen, and Q. Wang, “Learning better contrastive view from radiologist’s gaze,” arXiv preprint arXiv:2305.08826, 2023.
- Ma, H. Jiang, W. Chen, Y. Li, Z. Wu, X. Yu, Z. Liu, L. Guo, D. Zhu, T. Zhang et al., “Eye-gaze guided multi-modal alignment for medical representation learning,” in The Thirty-eighth Annual Conference on Neural Information Processing Systems.
- S. Moradizeyveh, M. Tabassum, S. Liu, R. A. Newport, A. Beheshti, and A. Di Ieva, “When eye-tracking meets machine learning: A systematic review on applications in medical image analysis,” arXiv preprint arXiv:2403.07834, 2024.
- H. Zhu, S. Salcudean, and R. Rohling, “Gaze-guided class activation mapping: Leverage human visual attention for network attention in chest x-rays classification,” in Proceedings of the 15th International Symposium on Visual Information Communication and Interaction, 2022, pp.1–8.
- Ji, C. Du, Q. Zhang, S. Wang, C. Ma, J. Xie, Y. Zhou, H. He, and D. Shen, “Mammo-net: Integrating gaze supervision and interactive information in multi-view mammogram classification,” in International Conference on Medical Image Computing and Computer-Assisted Inter-vention. Springer, 2023, pp. 68–78.
- H. Zhu, R. Rohling, and S. Salcudean, “Jointly boosting saliency prediction and disease classification on chest x-ray images with multi-task unet,” in Annual Conference on Medical Image Understanding and Analysis. Springer, 2022, pp. 594–608.
- Teng, L. H. Lee, J. Lander, L. Drukker, A. T. Papageorghiou, and J. A. Noble, “Skill characterisation of sonographer gaze patterns during second trimester clinical fetal ultrasounds using time curves,” in 2022 Symposium on Eye Tracking Research and Applications, 2022, pp. 1–7.
- K. Mariam, O. M. Afzal, W. Hussain, M. U. Javed, A. Kiyani, N. Rajpoot, S. A. Khurram, and H. A. Khan, “On smart gaze-based annotation of histopathology images for training of deep convolutional neural networks,” IEEE Journal of Biomedical and Health Informatics, vol. 26, no. 7, pp. 3025–3036, 2022. [CrossRef]
- J. N. Stember, H. Celik, D. Gutman, N. Swinburne, R. Young, S. Eskreis-Winkler, A. Holodny, S. Jambawalikar, B. J. Wood, P. D. Chang et al., “Integrating eye tracking and speech recognition accurately annotates mr brain images for deep learning: proof of principle,” Radiology: Artificial Intelligence, vol. 3, no. 1, p. e200047, 2020. [CrossRef]
- I. Pershin, T. Mustafaev, D. Ibragimova, and B. Ibragimov, “Changes in radiologists’ gaze patterns against lung x-rays with different abnormalities: a randomized experiment,” Journal of Digital Imaging, vol. 36, no. 3, pp. 767–775, 2023. [CrossRef]
- W. Li, F. Jia, and Q. Hu, “Automatic segmentation of liver tumor in ct images with deep convolutional neural networks,” Journal of Computer and Communications, vol. 3, no. 11, pp. 146–151, 2015. [CrossRef]
- P. Peng, W. Fan, Y. Shen, W. Liu, X. Yang, Q. Zhang, X. Wei, and D. Zhou, “Eye gaze guided cross-modal alignment network for radiology report generation,” IEEE Journal of Biomedical and Health Informatics, 2024. [CrossRef]
- T. Drew, K. Evans, M. L.-H. V˜o, F. L. Jacobson, and J. M. Wolfe, “Informatics in radiology: what can you see in a single glance and how might this guide visual search in medical images?” Radiographics, vol. 33, no. 1, pp. 263–274, 2013.
- C. Ma, L. Zhao, Y. Chen, S. Wang, L. Guo, T. Zhang, D. Shen, X. Jiang, and T. Liu, “Eye-gaze-guided vision transformer for rectifying shortcut learning,” IEEE Transactions on Medical Imaging, vol. 42, no. 11, pp. 3384–3394, 2023. [CrossRef]
- S. Wang, Z. Zhuang, X. Ouyang, L. Zhang, Z. Li, C. Ma, T. Liu, D. Shen, and Q. Wang, “Learning better contrastive view from radiologist’s gaze,” arXiv preprint arXiv:2305.08826, 2023.
- C. Hsieh, A. Lu´ıs, J. Neves, I. B. Nobre, S. C. Sousa, C. Ouyang, J. Jorge, and C. Moreira, “Eyexnet: Enhancing abnormality detection and diagnosis via eye-tracking and x-ray fusion,” Machine Learning and Knowledge Extraction, vol. 6, no. 2, pp. 1055–1071, 2024.
- A. Adadi and M. Berrada, “Peeking Inside the Black-Box: A Survey on Explainable Artificial Intelligence (XAI),” IEEE Access, vol. 6, pp.52 138–52 160, 2018, conference Name: IEEE Access. [CrossRef]
- V. Carvalho, E. M. Pereira, and J. S. Cardoso. Machine Learning Interpretability: A Survey on Methods and Metrics. Electronics 2019, 8, 832. [CrossRef]
- R. Guidotti, A. Monreale, S. Ruggieri, F. Turini, D. Pedreschi, and F. Giannotti. A Survey Of Methods For Explaining Black Box Models. ACM Comput. Surv. 2018, 51, 1–42. [CrossRef]
- Miller, T. Explanation in artificial intelligence: Insights from the social sciences. Artif. Intell. 2019, 267, 1–38. [CrossRef]
- Tjoa and C. Guan, “A survey on explainable artificial intelligence (xai): Toward medical xai,” IEEE transactions on neural networks and learning systems, vol. 32, no. 11, pp. 4793–4813, 2020. [CrossRef]
- B. H. Van der Velden, H. J. Kuijf, K. G. Gilhuijs, and M. A. Viergever, “Explainable artificial intelligence (xai) in deep learning-based medical image analysis,” Medical Image Analysis, vol. 79, p. 102470, 2022. [CrossRef]
- Gomez, T.; Mouchère, H. Computing and evaluating saliency maps for image classification: a tutorial. J. Electron. Imaging 2023, 32, 020801. [CrossRef]
Figure 1.
The visual abstract of the eye gaze-guided framework includes the inputs, model, explanation, and evaluation phases.
Figure 1.
The visual abstract of the eye gaze-guided framework includes the inputs, model, explanation, and evaluation phases.
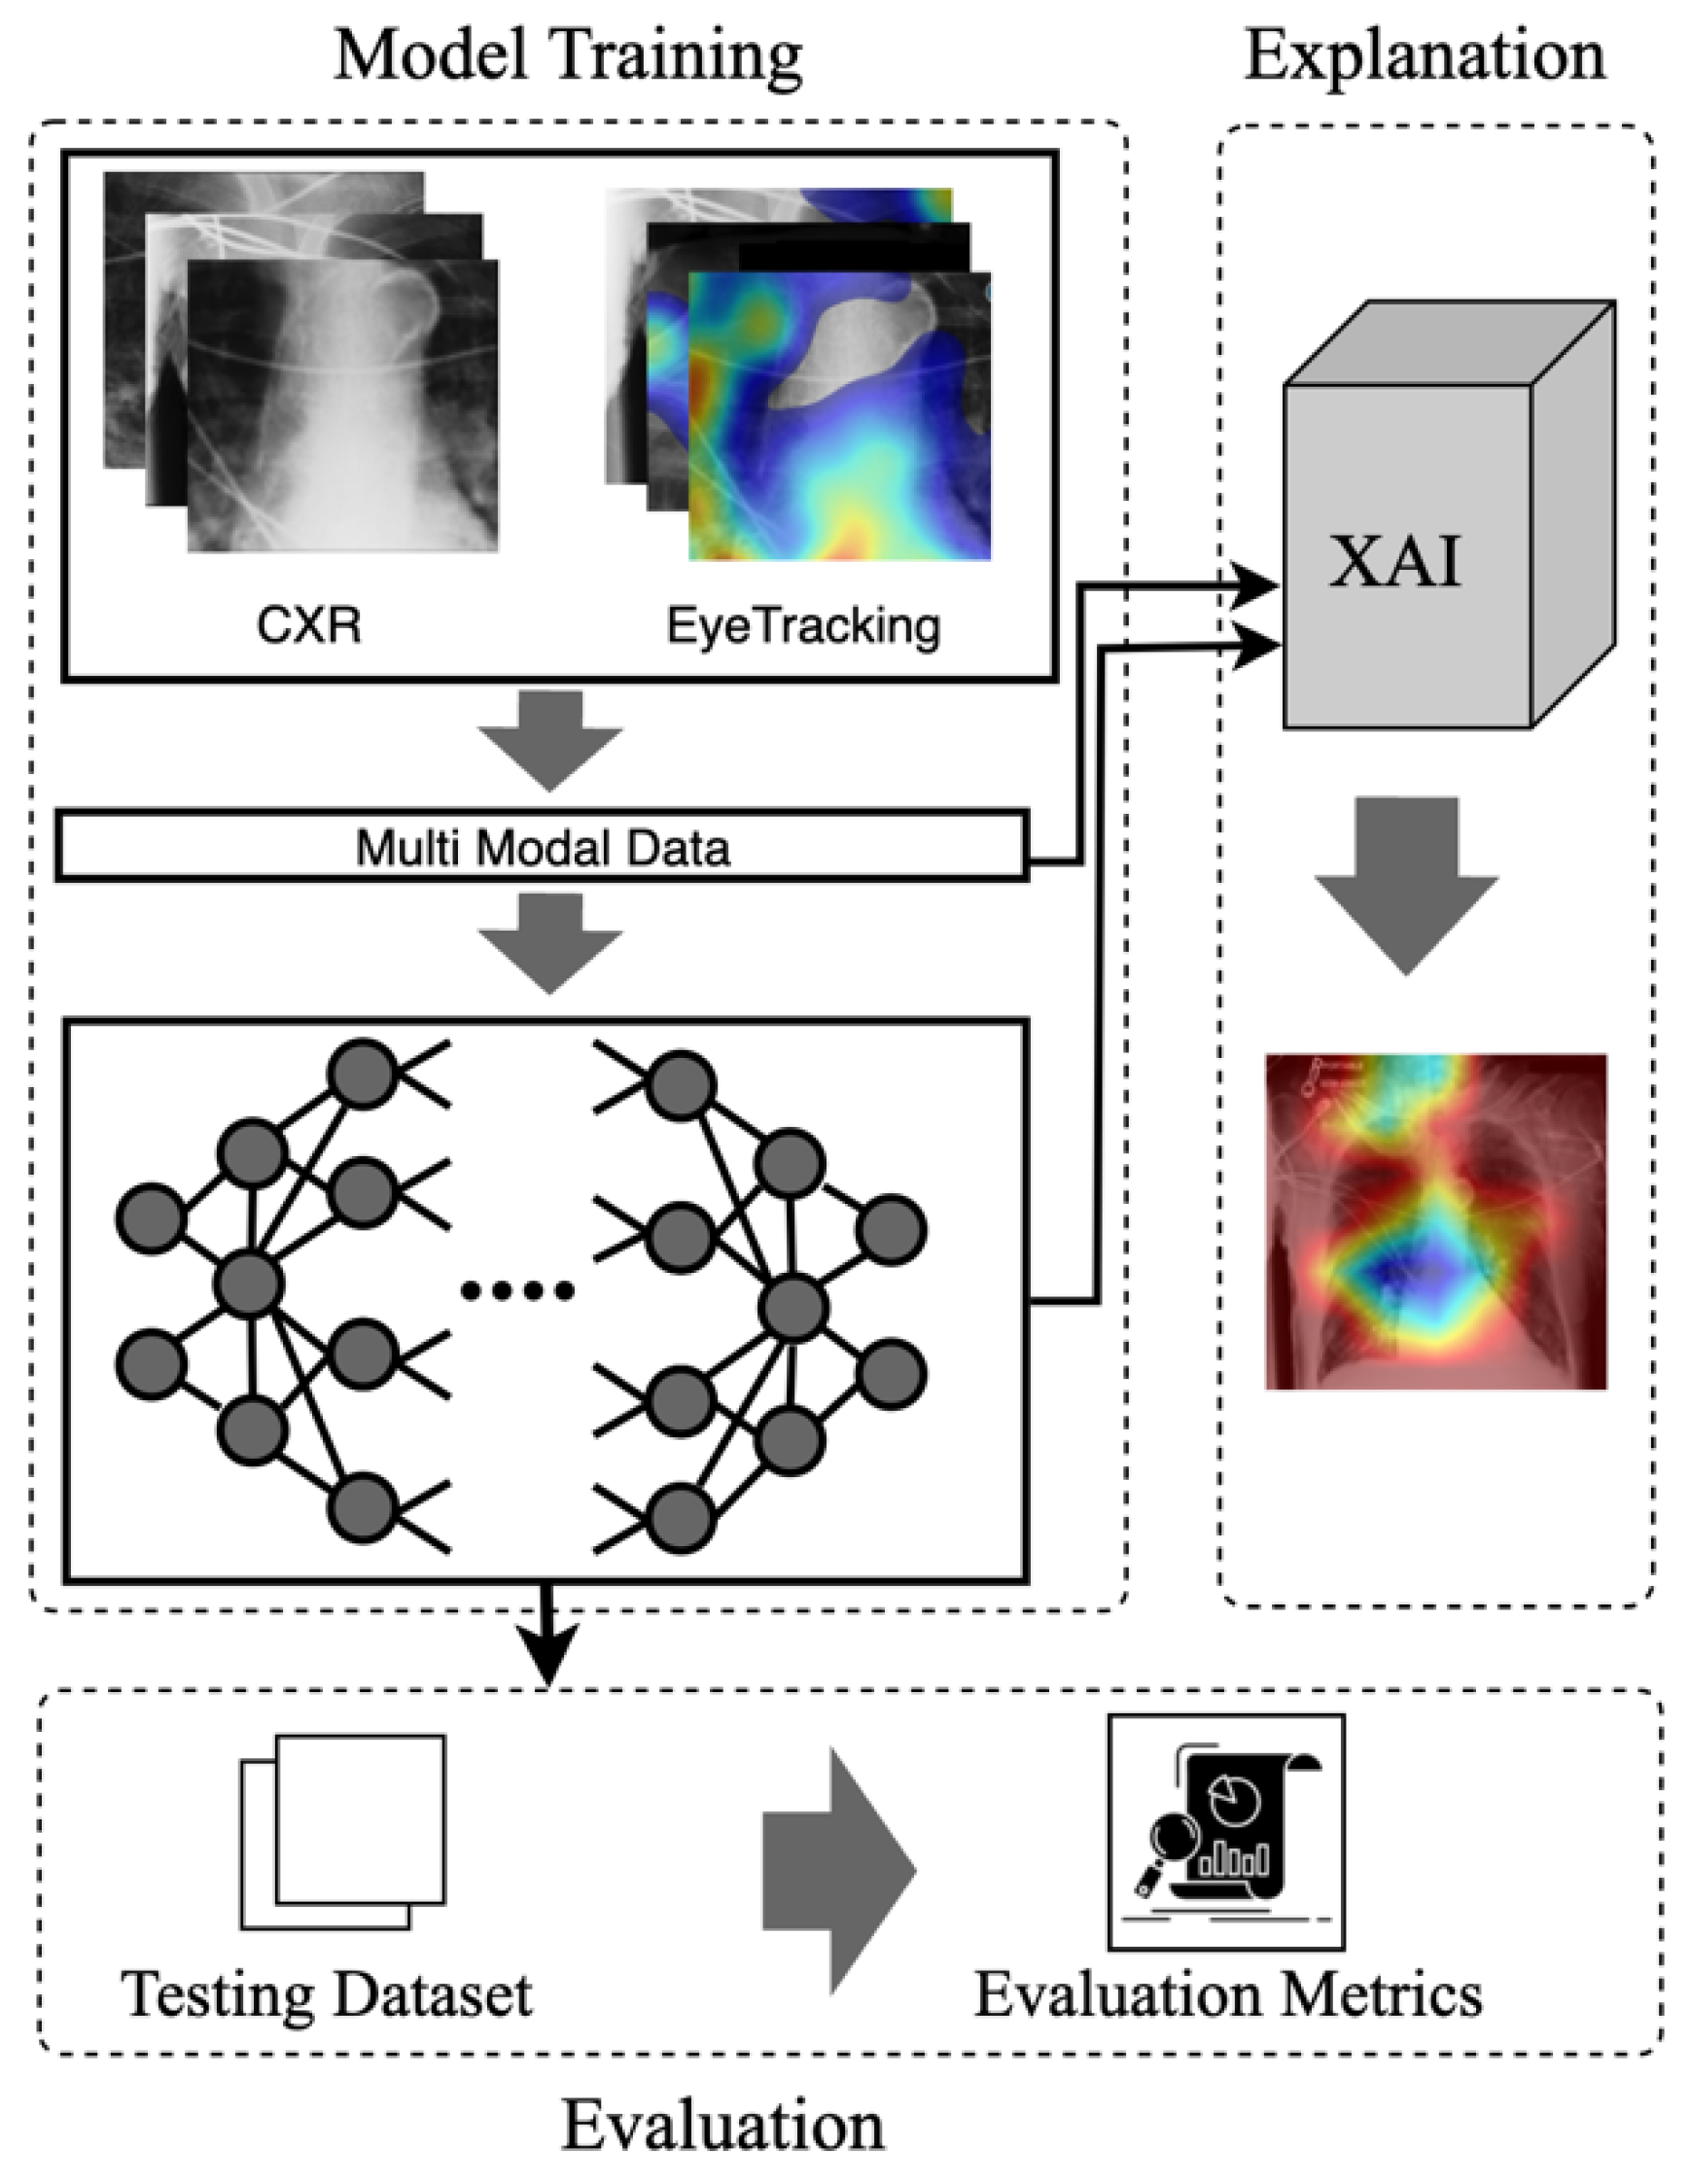
Figure 2.
An eye-guided architecture for multimodal learning to enhance abnormality detection in chest X-rays by incorporating radiologists' eye-tracking data as additional input. The framework fuses raw chest X-rays and heatmap overlays derived from eye fixation data, creating a multimodal input processed through an attention head to guide the model's focus. The unified backbone processes this guided input, followed by a fully connected layer and a sigmoid activation for multi-label lesion classification. The Explainable AI module (using Grad-CAM) provides post-hoc visualization to highlight critical regions influencing the model's predictions.

Figure 3.
Representative Chest X-ray Images for Different Pulmonary Conditions.
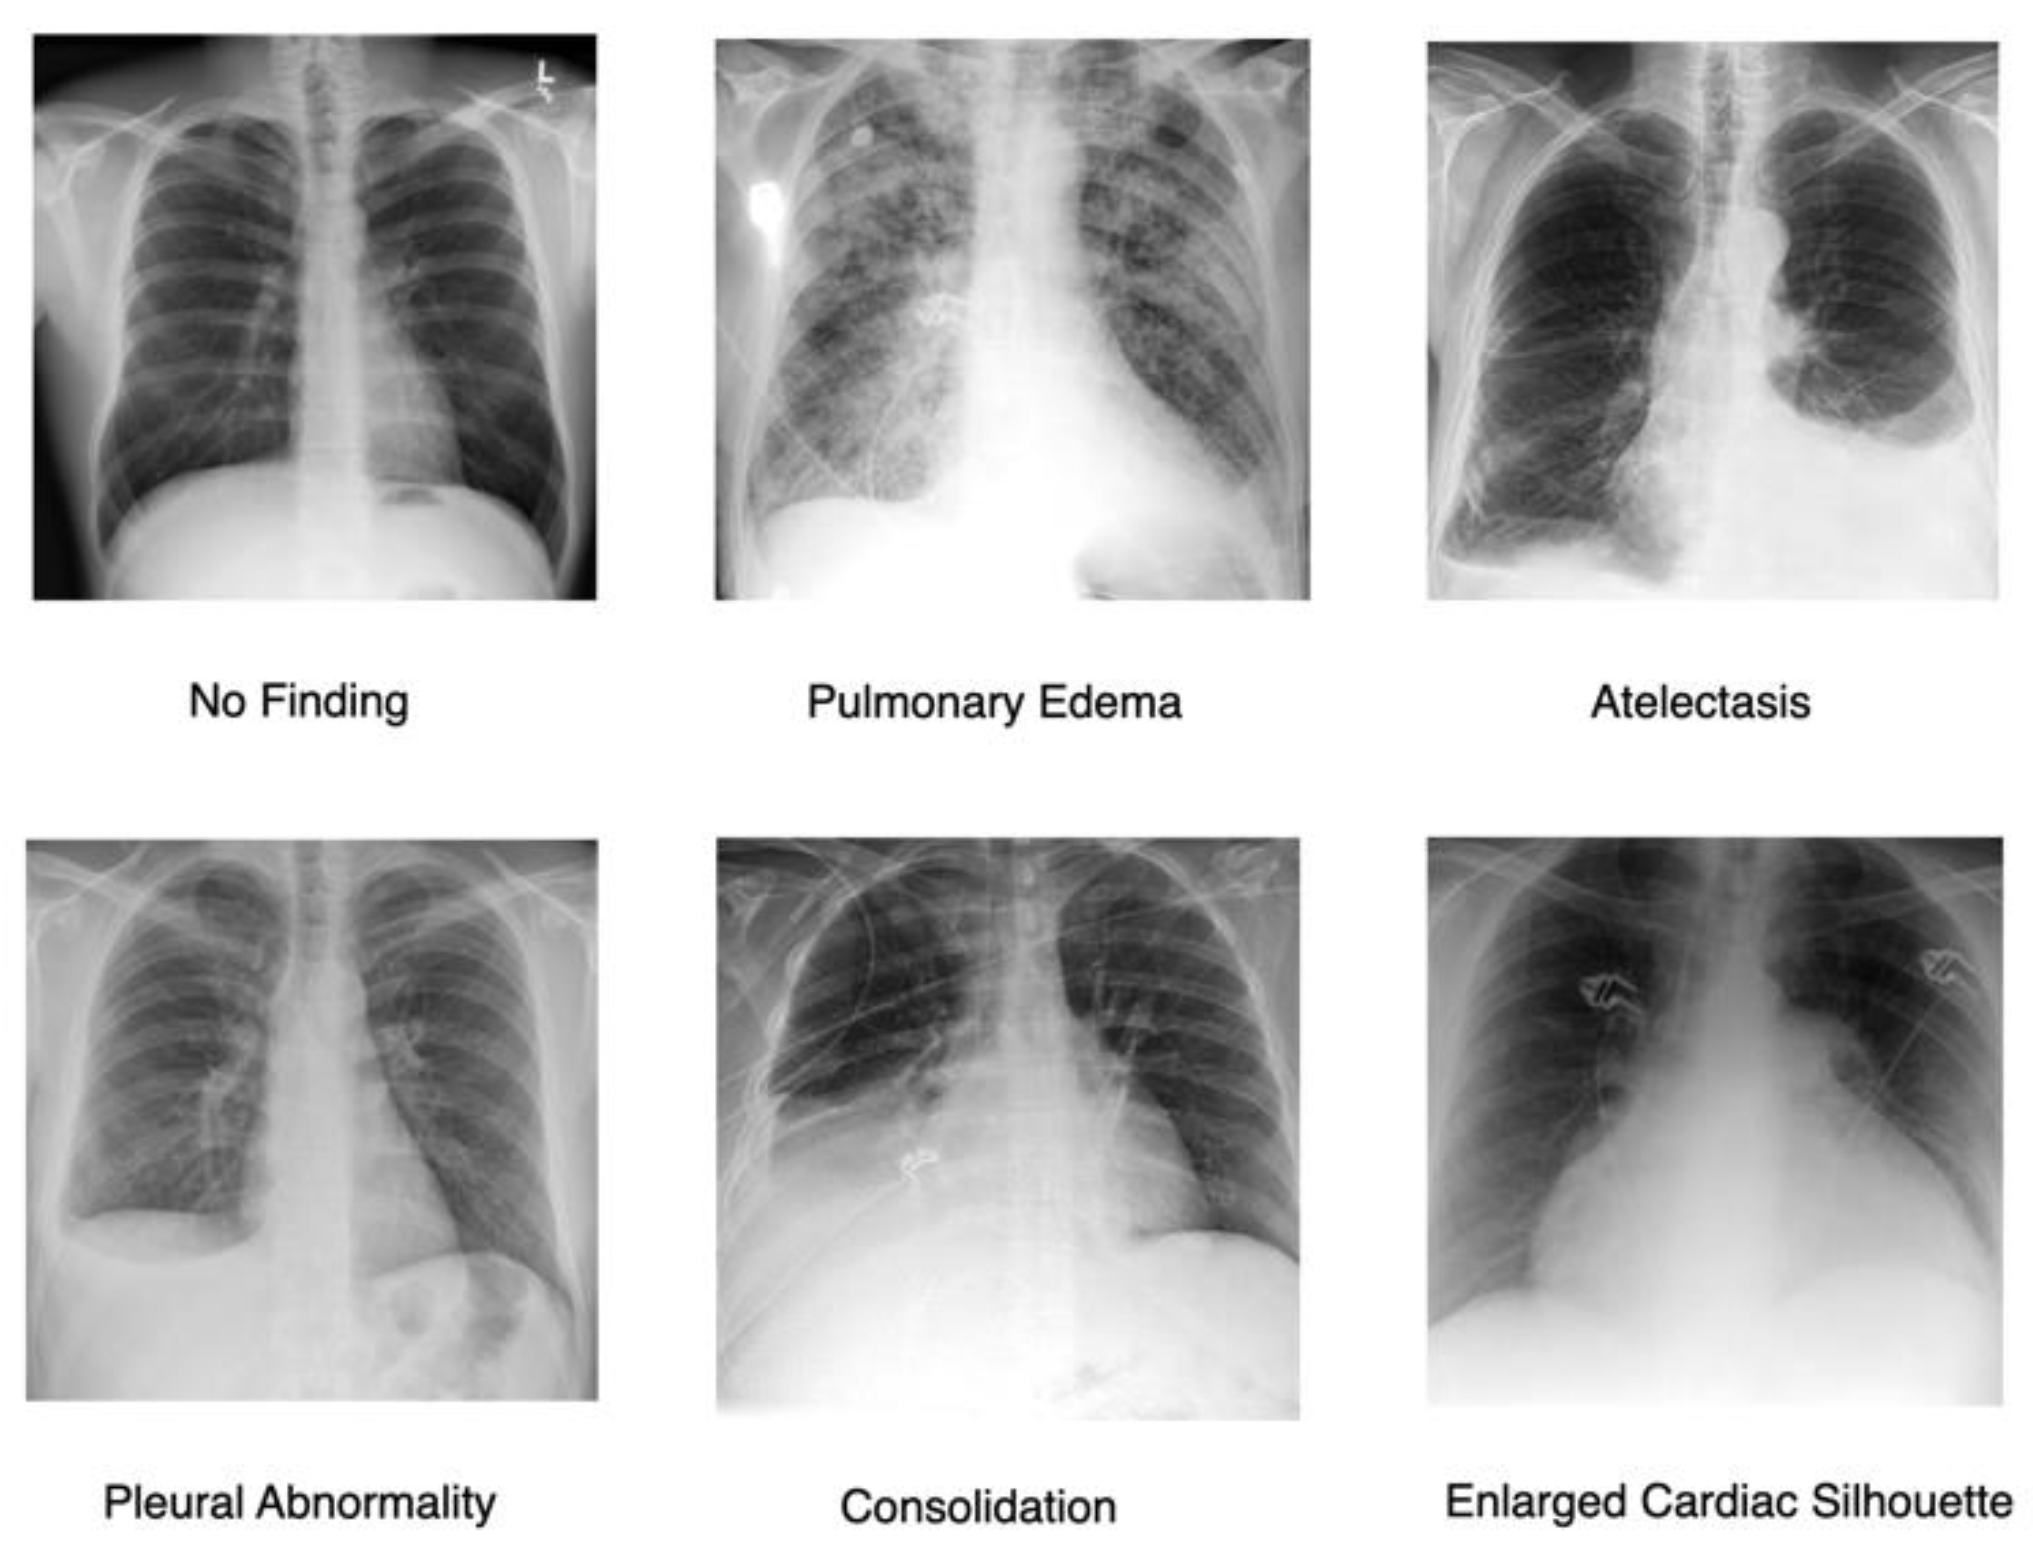
Figure 4.
Distribution of the selected most frequently occurring lesion cases across different lung conditions.
Figure 4.
Distribution of the selected most frequently occurring lesion cases across different lung conditions.
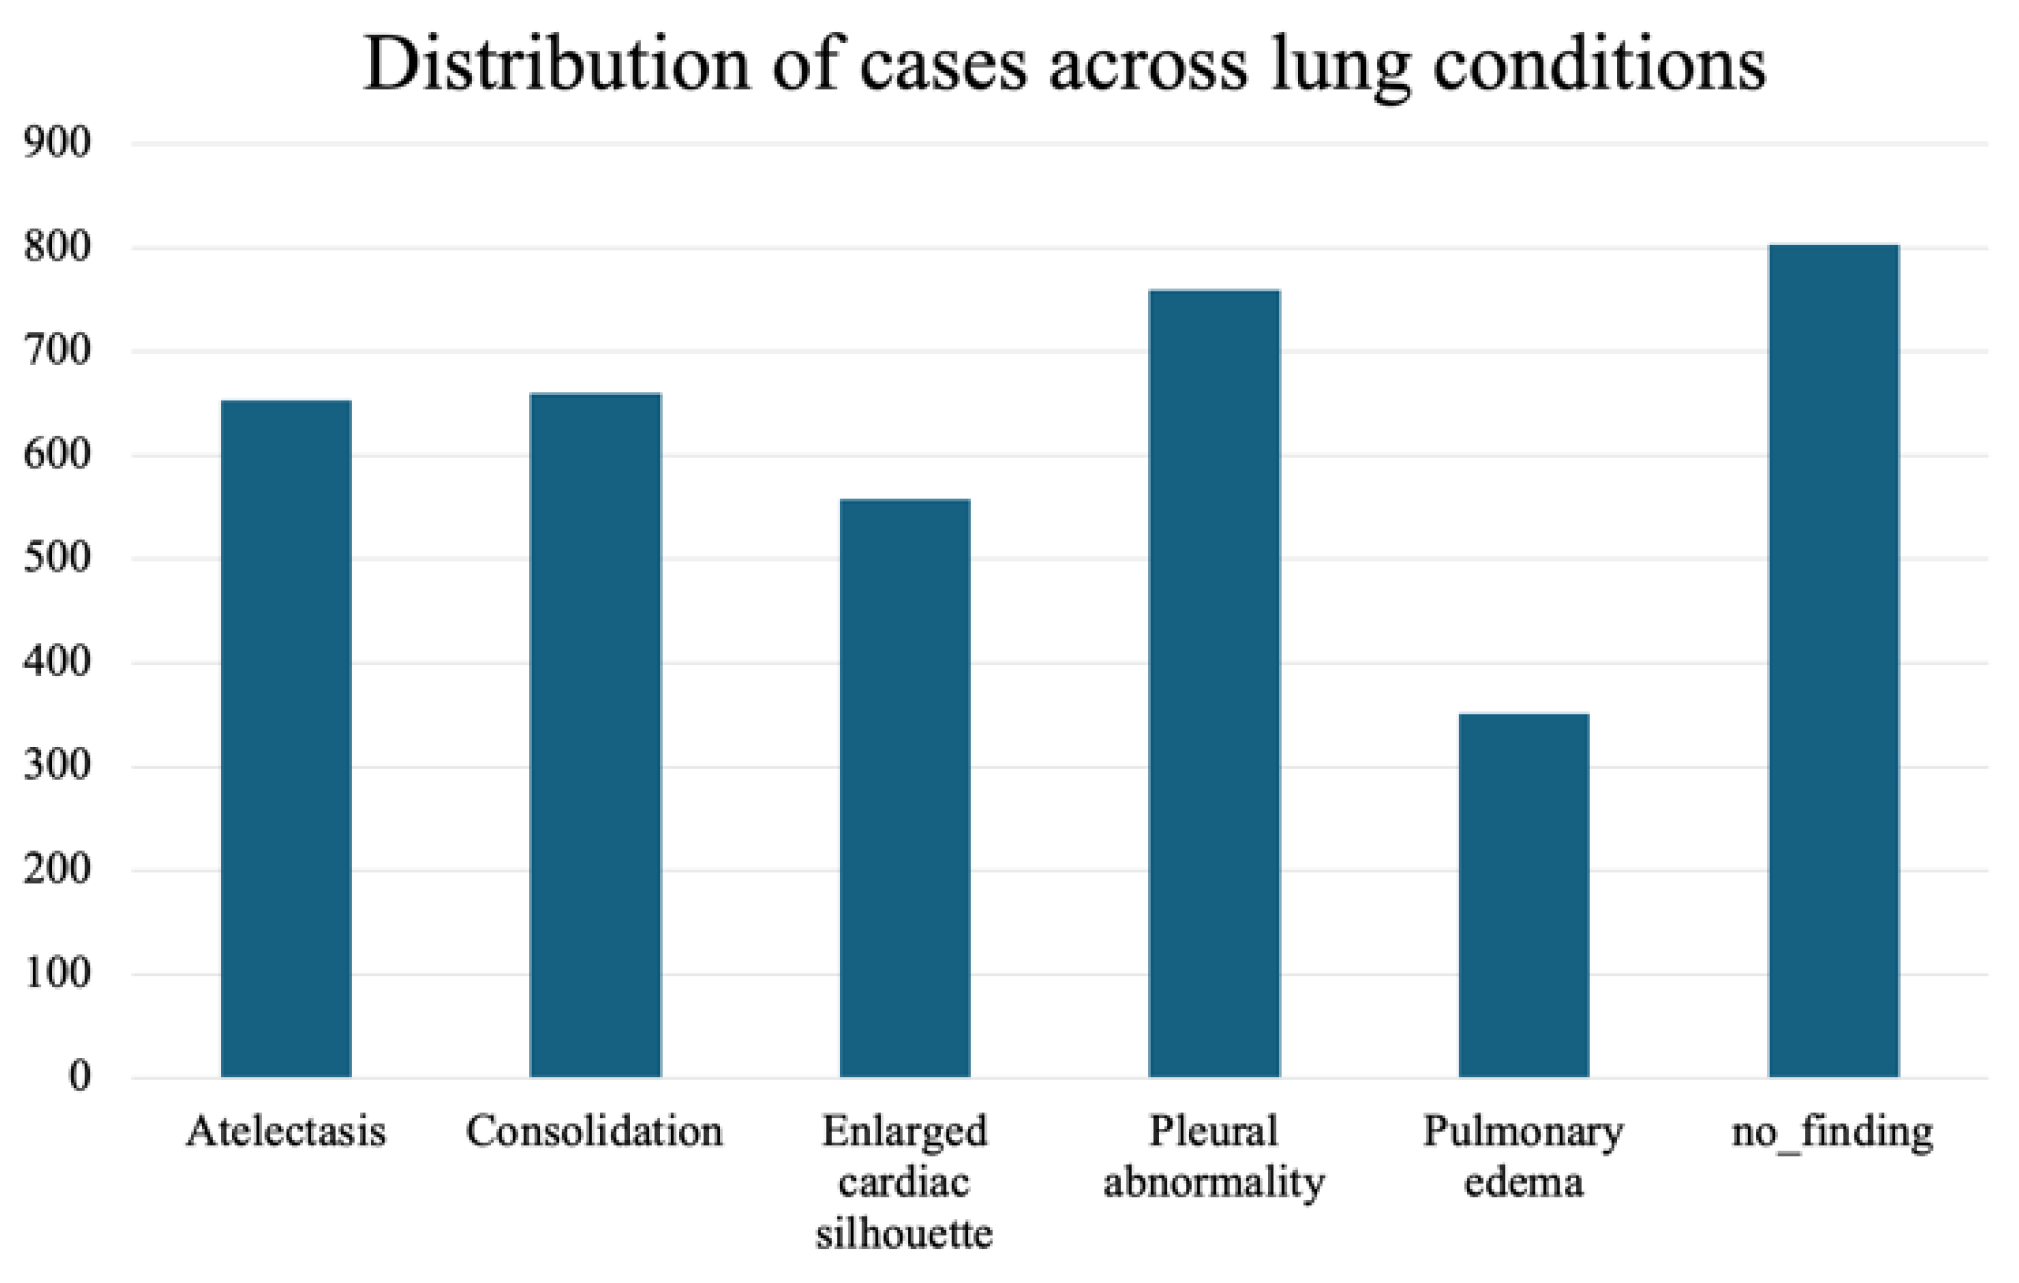
Figure 5.
Confusion matrices for multi-label classification across the medical conditions.
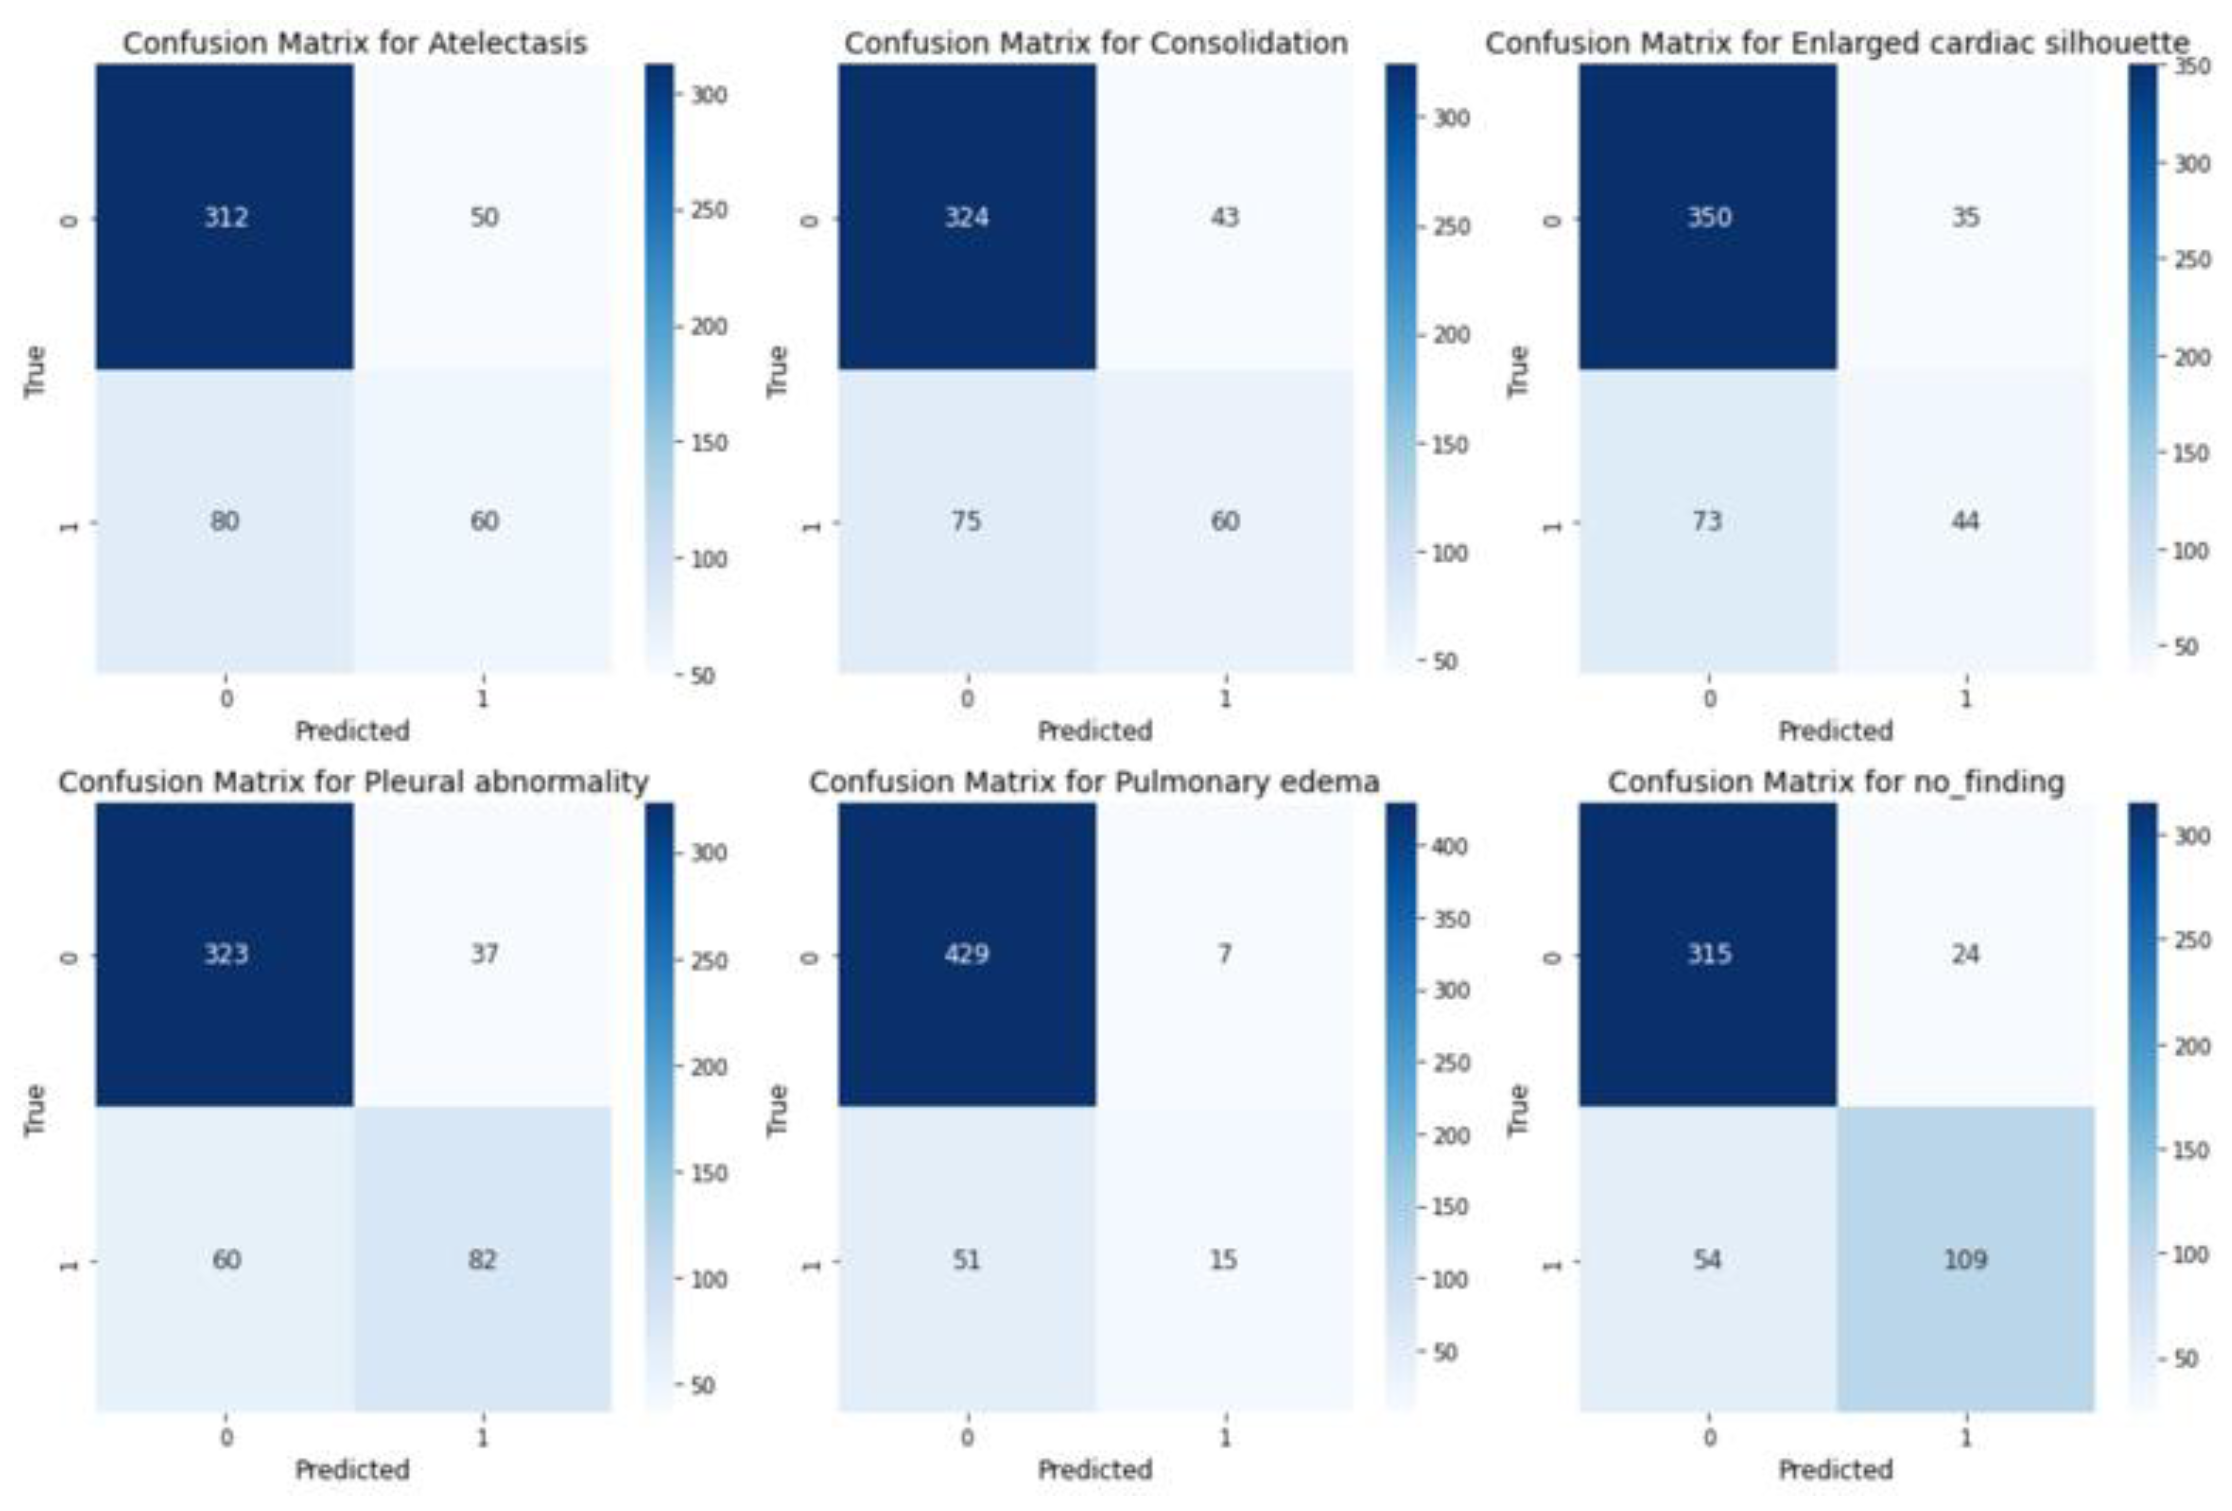
Figure 6.
Effect of Striped Noise on Fixation Map with Varying Noise Levels and Stripe Thickness.
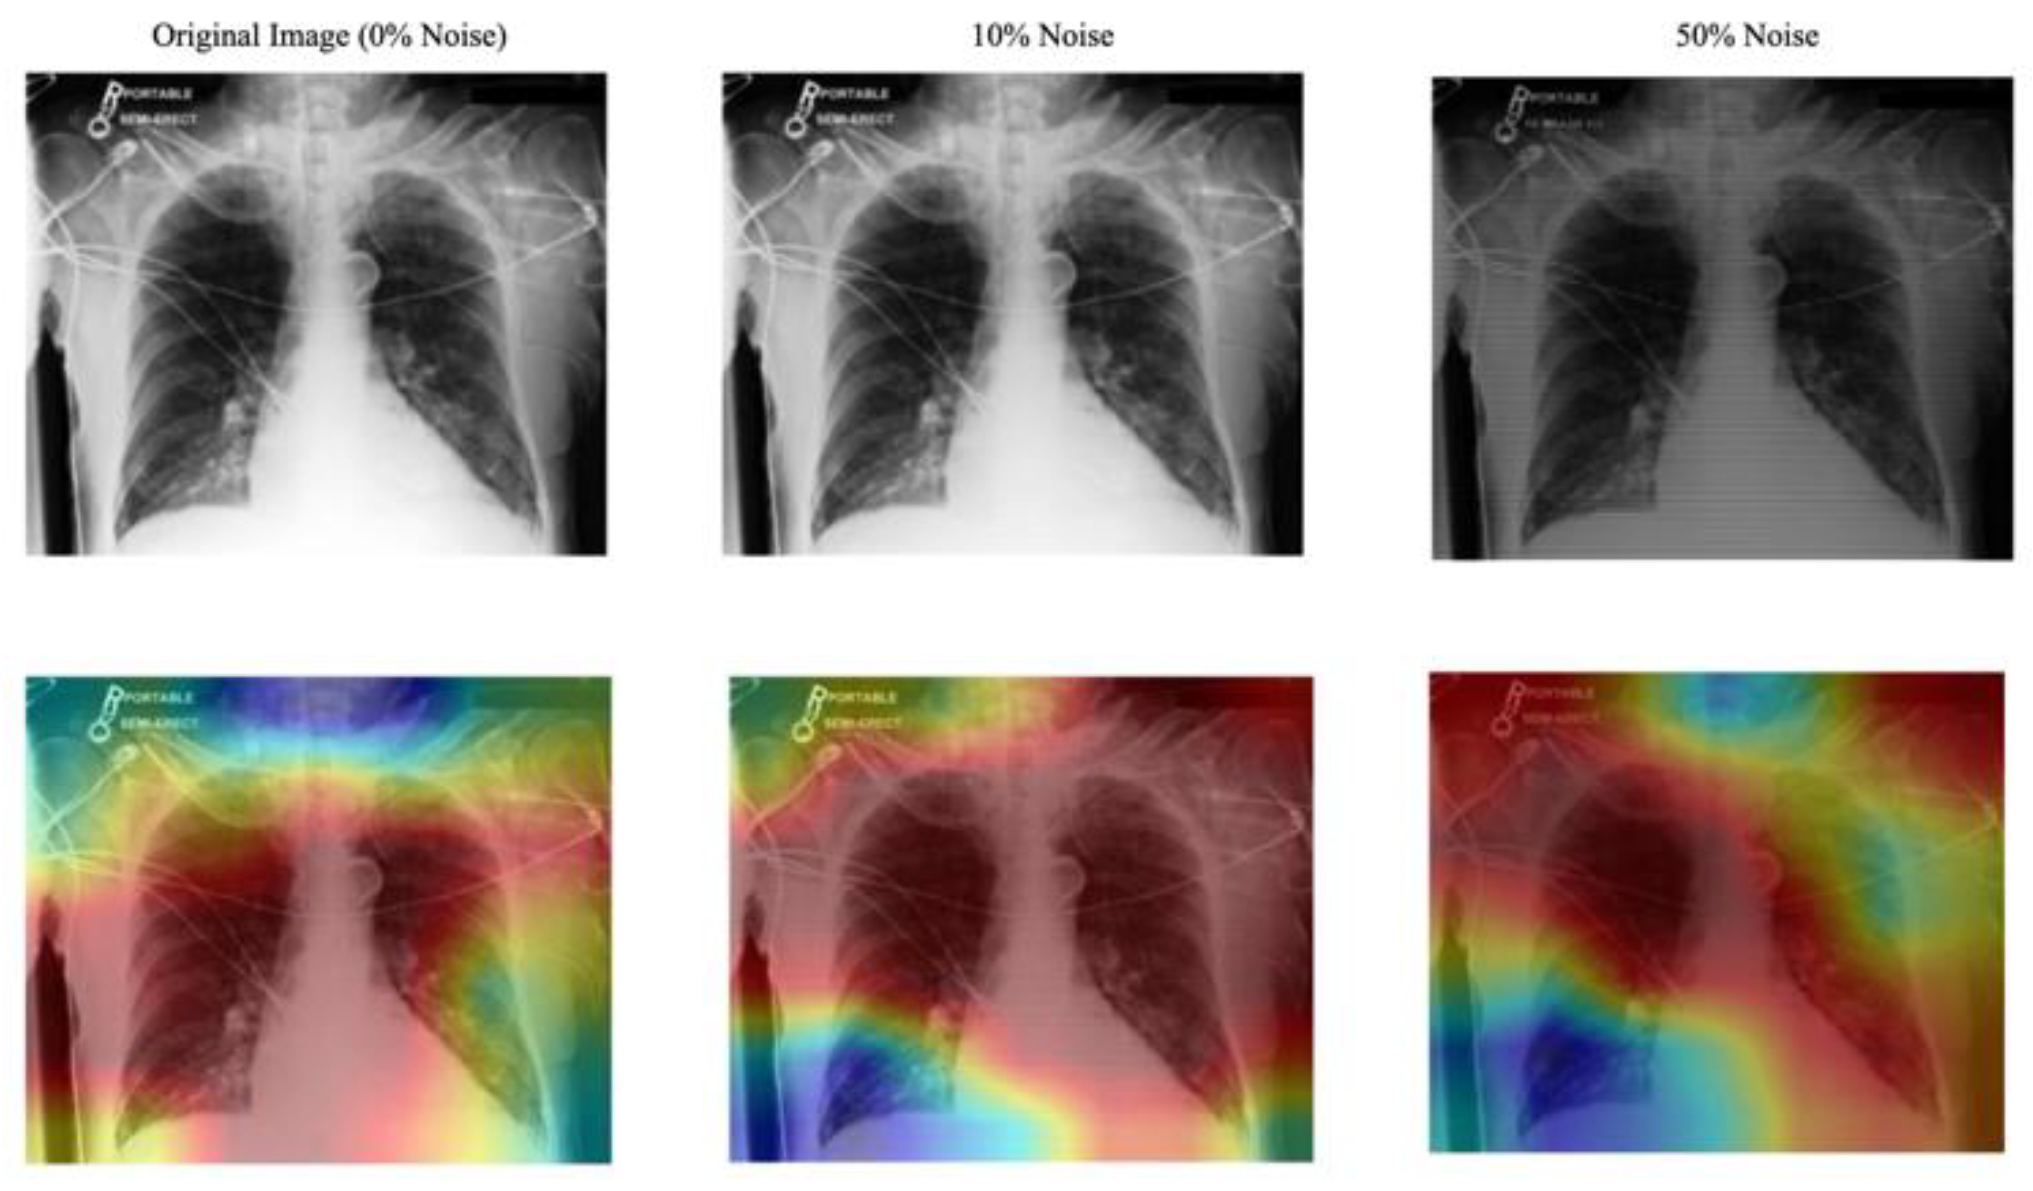

Table I.
Ablation study on efficacy comparison of different modalities.
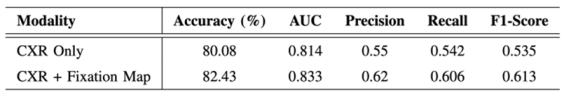
Table II.
Noise robustness of the gaze-guided system.
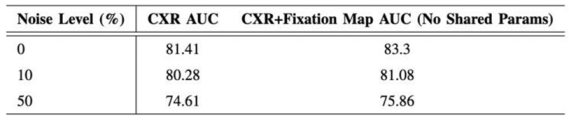
Table III.
Grad-cam explanation quality (IoU with expert ROI).
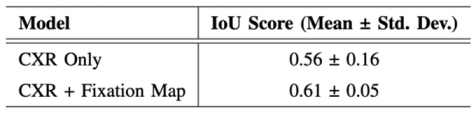
Table IV.
Expert review of the Grad-CAM explanation.
Disclaimer/Publisher’s Note: The statements, opinions and data contained in all publications are solely those of the individual author(s) and contributor(s) and not of MDPI and/or the editor(s). MDPI and/or the editor(s) disclaim responsibility for any injury to people or property resulting from any ideas, methods, instructions or products referred to in the content. |
© 2025 by the authors. Licensee MDPI, Basel, Switzerland. This article is an open access article distributed under the terms and conditions of the Creative Commons Attribution (CC BY) license (http://creativecommons.org/licenses/by/4.0/).
Copyright: This open access article is published under a Creative Commons CC BY 4.0 license, which permit the free download, distribution, and reuse, provided that the author and preprint are cited in any reuse.


