
Submitted:
20 May 2025
Posted:
20 May 2025
You are already at the latest version
Abstract
Researchers have conducted extensive investigations into how changes in wettability influence fluid flow within porous media. Much of the existing research has concentrated on flooding experiments and computational simulations. While these methods have proven effective in quantifying the impacts of wettability on multiphase flow and the resulting relative permeability, they often fall short of providing deeper analytical insights. Furthermore, many studies are constrained by the inherent limitations of simulation models, such as those based on the Lattice Boltzmann.Our research presents an analytical framework designed to quantify the effects of wettability changes by employing detailed geometrical analysis. Our approach involves examining how the flow path geometry is altered in response to variations in wettability. We focus on identifying key characteristics, including the size and shape of pore throats, which are critical for determining the permeability. Using the discovery, we analytically derive relative permeability curves, which advance the wettability effect on fluid flow behavior. Our method provides new insight into how wettability modifications affect fluid flow, which can be quantified based on its impact on the pore throat size and, hence, the permeability and the relative permeability.
Keywords:
wettability
; geometrical analysis
; pore throat size
Introduction
Wettability [1] is a fundamental property that significantly affects the behavior of fluids in porous media, influencing key processes such as fluid distribution, flow, and recovery [2]. Any rock typing [3,4,5,6,7,8,9,10,11,12,13] without wettability assignment to it makes the fluid flow unpredictable. The wettability effect continues to capillary pressure curves, also driven by the pore throat size [14,15,16,17,18]. Relative permeability curves are other fluid flow properties that wettability greatly impacts [19]. Traditional methods for quantifying the impact of wettability predominantly rely on two approaches: experimental flooding tests and simulation models [20]. While these methods have effectively highlighted the role of wettability in modifying relative permeability and overall fluid flow properties, they present several limitations [21,22,23,24]. Experimental tests often provide only a narrow scope of analytical insights, restricting the depth of understanding regarding wettability effects or quantifying them [1].
Additionally, the assumptions inherent in simulation models can lead to limitations [20,23] that influence the accuracy and dampen the applicability of the results obtained. To address these challenges, our research aims to develop a more robust framework by employing a geometrical analysis approach that analyzes the pore throat deformation due to changes in wettability; we use two extreme control points, completely water-wet and completely oil-wet. Because the pore throat size directly impacts permeability [21,22,24,25,26,27,28,29,30,31,32,33,34,35], the deformation changes the permeability that appears to the non-wetting fluid. This innovative technique assesses how wettability influences pore throat morphology and flow properties. Our research establishes a clear link between these morphological alterations (pore throat deformation due to wettability) and the resultant fluid flow characteristics (relative permeability) by examining the geometric changes in pore throats. Through this investigation, we seek to build relative permeability curves based on the wettability changes by taking two extreme points, water-wet and oil-wet, in porous media. In addition, this method enables the generation of infinite scenarios for teaching AI systems [7,21,24,36,37,38,39,40,41,42,43,44,45,46,47] by having rich data sets for machine learning [7,38,48,49,50,51,52,53] and computer vision.
Methodology
We incept our research with a water-wet system, characterized by grains that are 100% water-saturated and arranged in a triclinic crystal structure, where solely one phase (water) is present, as depicted in Figure 1. The interstitial space between these three spherical grains corresponds to the pore throat region of this porous medium, which can be quantified through geometric calculations.
When we convert the system to an oil-wet system, the water is no longer in contact with the grain; instead, it occupies the void between them, not the whole void, as shown in Figure 2.
The difference between the area of the pore throat in the water-wet and the oil-wet systems represents the change in the pore throat area, which affects the appearance permeability value for water in the oil-wet system, as shown in Figure 3.
Then, we perform the geometrical analysis of the representation of the pore throat area shown in Figure 4. The Large solid line with red triangle edges represents the water-wet pore throat system. In contrast, the small solid red line triangle represents the oil-wet. Noticing that the area of the pore throat is not triangular; instead, it is a concaved triangle.
Then, we measured the deformation of the pore throat of two edges, as shown in Figure 4. The analysis of the deformation rate for the two edges showed the same deformation, which is 0.463 or 46.3%. We did the calculation using Eq. 1:
Where: is the distance between the touch point of two grains and the water's edge that appears between the two grains in an oil-wet system, and is the distance between the water’s edge to the center of the pore throat.
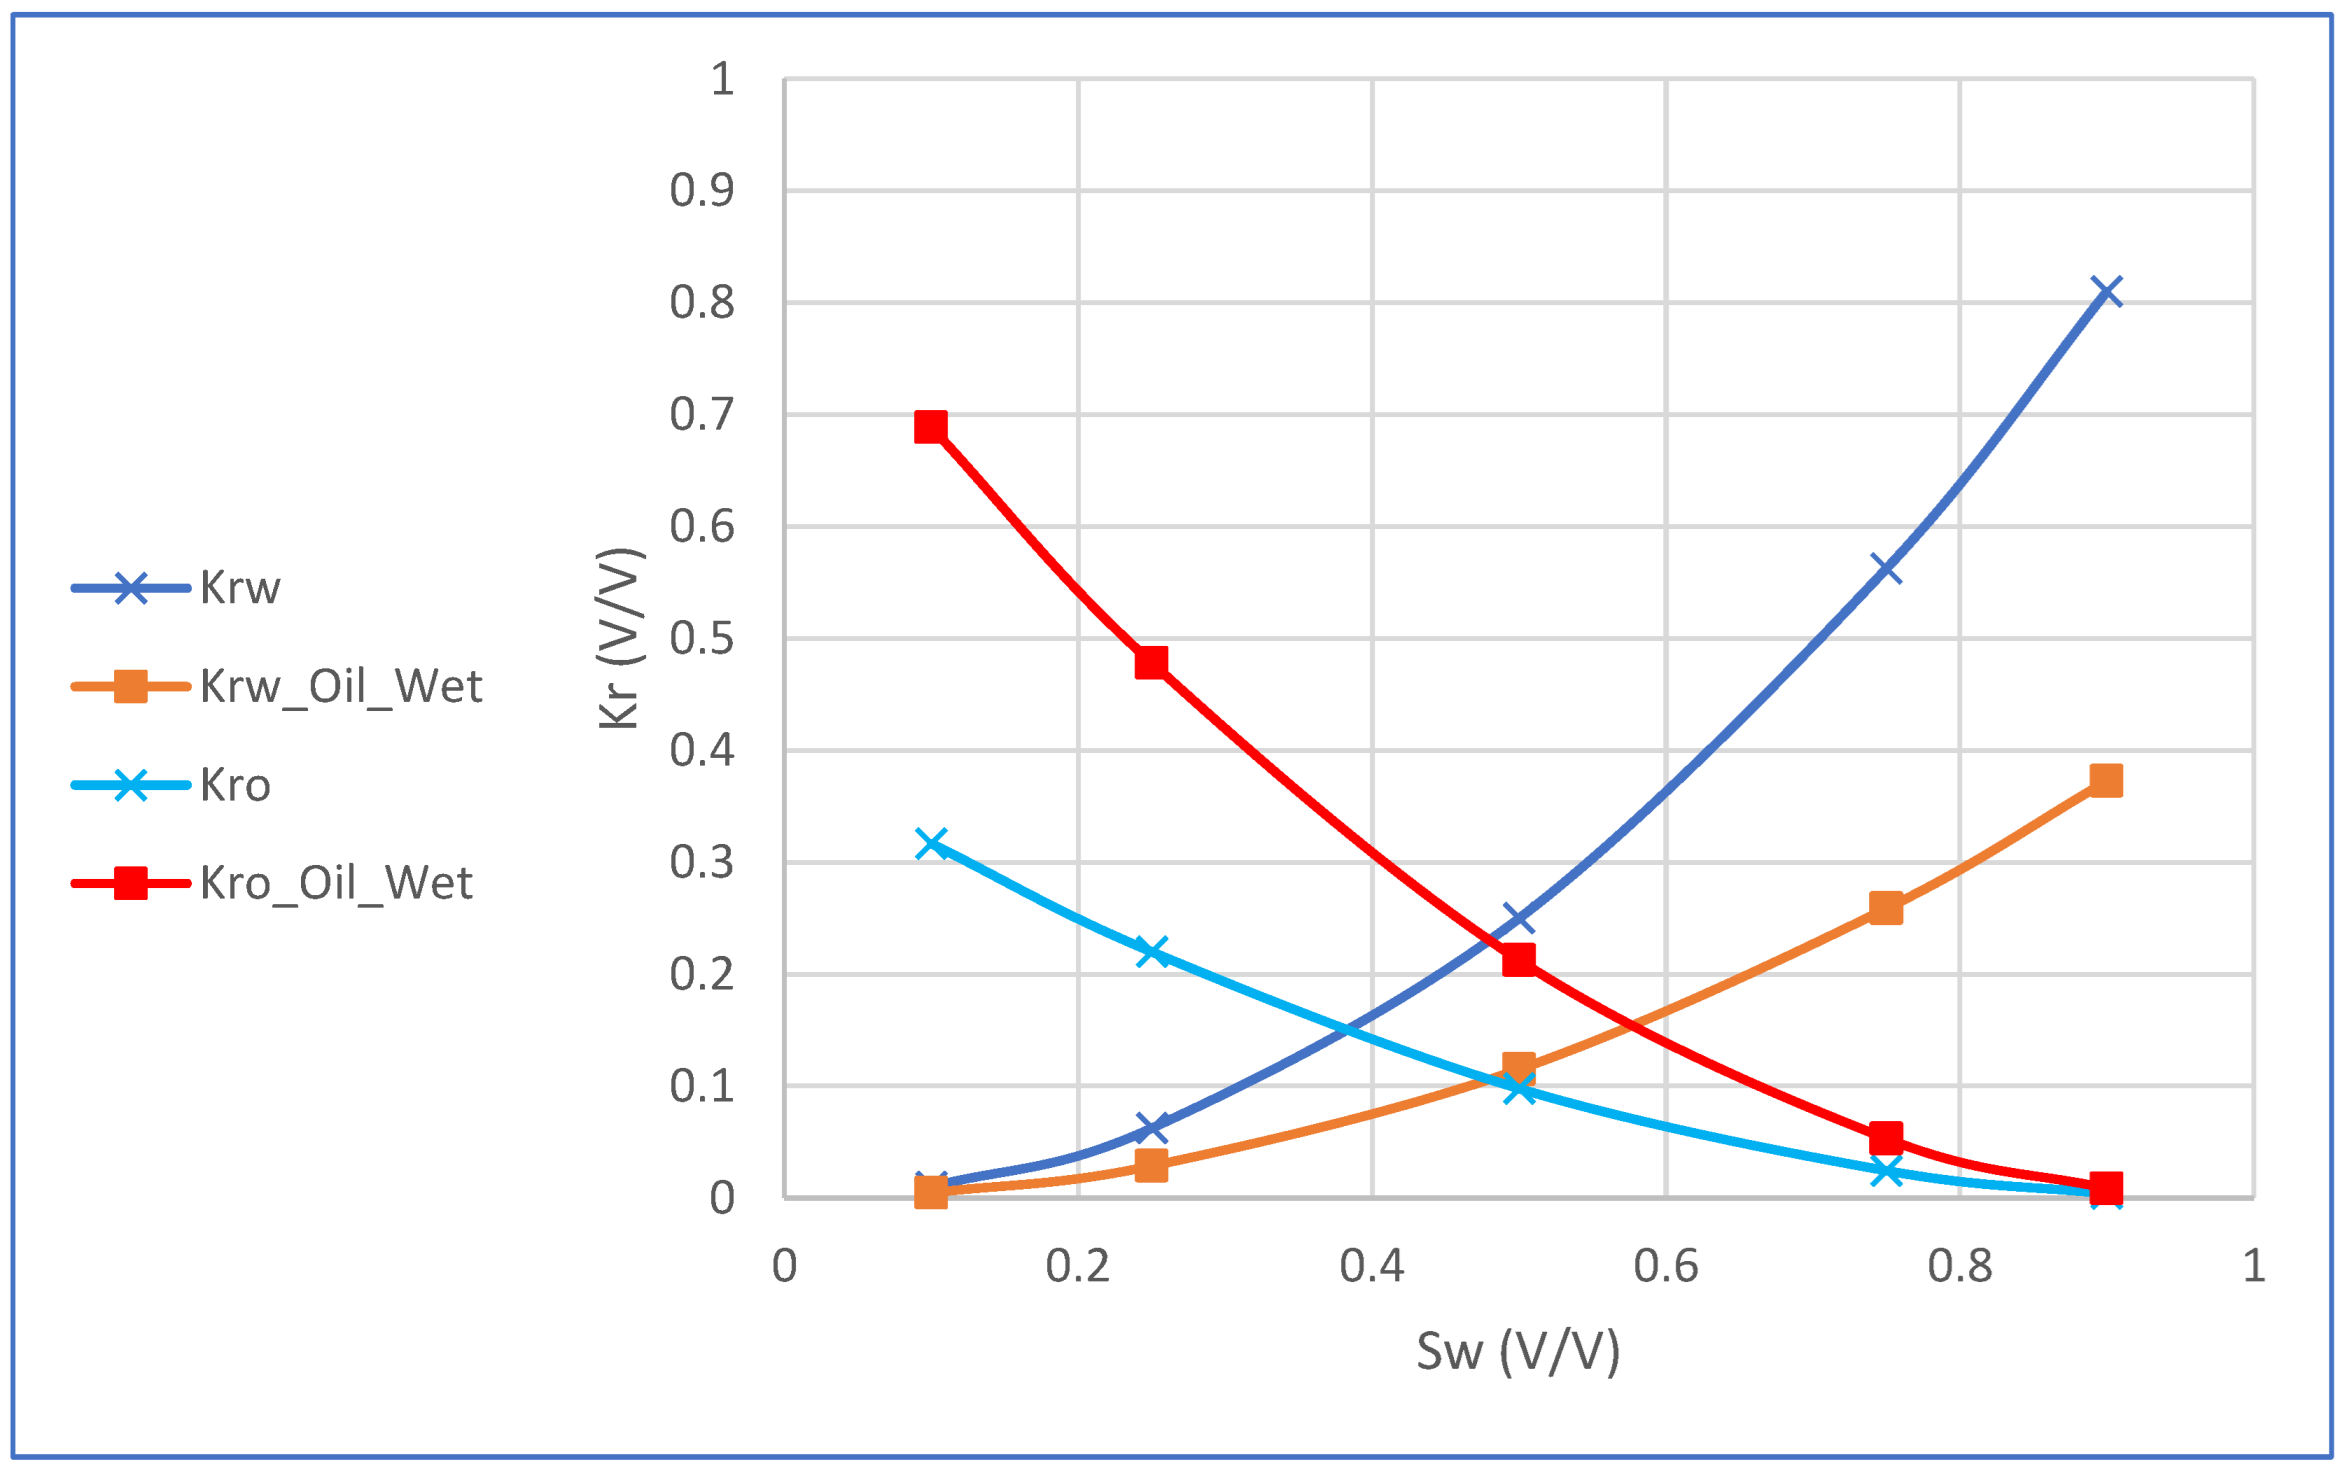
Then, as shown in Figure 6, we built two relative permeability curves for the water wet system: the water relative permeability Krw and the oil relative permeability Kro. Then, we use the new Pore Throat Deformation () to build the water and oil relative permeability curves in the oil-wet system, and the results are shown in Figure 7.
Conclusions
Our research presents a novel, simulation-free analytical approach to quantifying the effects of wettability alterations on porous media. Integrating geometrical analysis offers an efficient method for determining relative permeability curves and assessing fluid flow properties. In future research, we extend this methodology to more complex heterogeneous systems and three-phase flow conditions.
References
- Alfarisi, O., A. Raza, and T. Zhang, The Discovery of Calcite Intrinsic Wettability by the First-Ever Optical Illumination Inside Dark Fluid using IRIDW Apparatus. 2022.
- Alotaibi, M.B., R. Nasralla, and H.A. Nasr-El-Din. Wettability challenges in carbonate reservoirs. in SPE Improved Oil Recovery Symposium. 2010. OnePetro.
- Alfarisi, O., The Ultimate Route to Carbonate Rock Typing, in 2nd Brazilian Petroleum Conference. 2018: Brazil.
- Rushing, J.A., K.E. Newsham, and T.A. Blasingame. Rock typing: Keys to understanding productivity in tight gas sands. in SPE Unconventional Reservoirs Conference. 2008. OnePetro.
- Al-Farisi, O., et al. Revelation of carbonate rock typing—the resolved gap. in SPE/EAGE Reservoir Characterization & Simulation Conference. 2009. European Association of Geoscientists & Engineers.
- Tiab, D. and E.C. Donaldson, Petrophysics: theory and practice of measuring reservoir rock and fluid transport properties. 2015: Gulf professional publishing.
- Alfarisi, O., Expert Geoscience Machine of Physics-augmented Computer Vision for Digital Rock Typing, in iRIS-2020 International Rock Imaging Summit. 2020, RISIG: Qingdao.
- Alfarisi, O., Digital Rock Typing: Planetary Exploration Application with Computer Vision, in RISIG 2021. 2021, iRIS: UK.
- Alfarisi, O., et al., Digital Rock Typing DRT Algorithm Formulation with Optimal Supervised Semantic Segmentation. arXiv preprint arXiv:2112.15068, 2021.
- Al-Farisi, O., M. Sassi, and D. Ouzzane. Digital Rock Typing. in InterPore2021. 2021. UK.
- BinAbadat, E., et al. Complex carbonate rock typing and saturation modeling with highly-coupled geological description and petrophysical properties. in SPE Reservoir Characterisation and Simulation Conference and Exhibition. 2019. OnePetro.
- Al-Farisi, O., et al. Carbonate Rock Type Matrix RocMat, The Ultimate Rock Properties Catalogue. in International Conference on Offshore Mechanics and Arctic Engineering. 2013. American Society of Mechanical Engineers.
- Alfarisi, O., 3D AI Image Processing of Rock Morphology for Determining Reservoir Properties & Rock Classifications. 2019, http://pe.upc.edu.cn/2019/0619/c13947a210369/page.htm: UPC.
- Alfarisi, O., et al., The Understanding of Intertwined Physics: Discovering Capillary Pressure and Permeability Co-Determination. arXiv preprint arXiv:2112.12784, 2021.
- Alfarisi, O., et al., Morphology Decoder: Untangling Heterogeneous Porous Media Texture and Quantifying Permeability and Capillary Pressure by Semantic Segmentation. InterPore 2022, 2022.
- Ausbrooks, R., et al. Pore-size distributions in vuggy carbonates from core images, NMR, and capillary pressure. in SPE annual technical conference and exhibition. 1999. Society of Petroleum Engineers.
- Leverett, M., Capillary behavior in porous solids. Transactions of the AIME, 1941. 142(01): p. 152-169. [CrossRef]
- Zhang, Y., et al., Magnetic-actuated “capillary container” for versatile three-dimensional fluid interface manipulation. Science Advances, 2021. 7(34): p. eabi7498.
- Amyx, J., D. Bass, and R.L. Whiting, Petroleum reservoir engineering physical properties. 1960.
- Li, H., et al. Pore-scale lattice boltzmann simulation of oil-water flow in carbonate rock with variable wettability. in Abu Dhabi International Petroleum Exhibition and Conference. 2015. OnePetro.
- Alfarisi, O., et al., Morphology Decoder: A Machine Learning Guided 3D Vision Quantifying Heterogenous Rock Permeability for Planetary Surveillance and Robotic Functions. arXiv e-prints, 2021: p. arXiv: 2111.13460.
- Dernaika, M., et al., Digital and Conventional Techniques to Study Permeability Heterogeneity in Complex Carbonate Rocks. Petrophysics, 2018. 59(03): p. 373-396. [CrossRef]
- Zhao, Y.-l., et al., Lattice Boltzmann simulation of gas flow and permeability prediction in coal fracture networks. Journal of Natural Gas Science and Engineering, 2018. 53: p. 153-162. [CrossRef]
- Alfarisi, O., et al., Morphology Decoder to Predict Heterogeneous Rock Permeability with Machine Learning Guided 3D Vision. 2021, TechRxiv.
- Al Farisi, O., et al. Quantification of Fracture Permeability From Micro Resistivity Logs in Offshore Abu Dhabi Reservoir. in Abu Dhabi International Petroleum Exhibition and Conference. 2006. Society of Petroleum Engineers.
- Al-Farisi, O., et al. Electrical Resistivity and Gamma-Ray Logs: Two Physics for Two Permeability Estimation Approaches in Abu Dhabi Carbonates. in Abu Dhabi International Conference and Exhibition. 2004. Society of Petroleum Engineers.
- Al-Farisi, O., et al. Permeability Determination in Fractured & Non-Fractured Carbonate Reservoir; Using Innovative Multi Passes Analysis Approach of Basic Log Data. in SPE Reservoir Characterisation and Simulation Conference and Exhibition. 2011. Society of Petroleum Engineers.
- Alfarisi, O., et al., Morphology Decoder: Untangling Heterogeneous Porous Media Texture and Quantifying Permeability and Capillary Pressure by Semantic Segmentation.
- Beard, D. and P. Weyl, Influence of texture on porosity and permeability of unconsolidated sand. AAPG bulletin, 1973. 57(2): p. 349-369.
- Ghedan, S.G., T. Weldu, and O. Al-Farisi. Hybrid Log-Derived Permeability Prediction Model for a Heterogeneous Carbonate Reservoir with Tarmat Layers Considering Different Levels of Cutoffs. in Abu Dhabi International Petroleum Exhibition and Conference. 2010. Society of Petroleum Engineers.
- Li, H., et al. Pore-Scale Experimental and Numerical Study on Permeability Characterization of Abu Dhabi Offshore Carbonate Micromodel. in Abu Dhabi International Petroleum Exhibition & Conference. 2016. OnePetro.
- Li, J., et al., Permeability tensor and representative elementary volume of saturated cracked soil. Canadian Geotechnical Journal, 2009. 46(8): p. 928-942. [CrossRef]
- Saxena, N., et al., Estimating permeability from thin sections without reconstruction: Digital rock study of 3D properties from 2D images. Computers & Geosciences, 2017. 102: p. 79-99. [CrossRef]
- Teklu, T.W., S.G. Ghedan, and O. Al Farisi. Hybrid Artificial Intelligence and Conventional Empirical Approach for improved Prediction of Log-Derived Permeability of Heterogeneous Carbonate Reservoir. in SPE Production and Operations Conference and Exhibition. 2010. Society of Petroleum Engineers.
- Weldu, T., S. Ghedan, and O. Al-Farisi. Hybrid AI and conventional empirical model for improved prediction of log-derived permeability of heterogeneous carbonate reservoir. in Paper SPE 136127 Presented at the SPE Production and Operations Conference and Exhibition, Tunis, Tunisia. 2010.
- Al-Farisi, O., et al. Properties Quantification of Heterogeneous Media with 3D Vision Informed Machine Learning. in InterPore2020. 2020. Qingdao: InterPore.
- Al-Farisi, O., et al. Machine Learning for 3D Image Recognition to Determine Porosity and Lithology of Heterogeneous Carbonate Rock. in SPE Reservoir Characterisation and Simulation Conference and Exhibition. 2019. Society of Petroleum Engineers.
- Al-farisi, O.U.A.L., et al., Morphology decoder to predict heterogeneous rock permeability with machine learning guided 3d vision. 2024, Google Patents.
- Al-Jarrah, O.Y., et al., Efficient machine learning for big data: A review. Big Data Research, 2015. 2(3): p. 87-93. [CrossRef]
- Alfarisi, O., Physics-augmented Machine Learning Classification of 3D Vision Morphology for Digital Rock Typing. 2019, Khalifa University of Science.
- Alfarisi, O., Physics-augmented Machine Learning Classification of 3D Vision Morphology for Digital Rock Typing. 2022.
- Alfarisi, O., Z. Aung, and M. Sassi, Deducing of Optimal Machine Learning Algorithms for Heterogeneity. arXiv preprint arXiv:2111.05558, 2021.
- Alfarisi, O., et al., Heterogeneous Morphology Decoder: A Novel Machine Learning Guided Petrophysical Properties Determination, in MEOS/GEO 2023. 2023, MEOS/GEO: Bahrain.
- Alfarisi, O., et al., Machine Learning Guided 3D Image Recognition for Carbonate Pore and Mineral Volumes Determination. arXiv preprint arXiv:2111.04612, 2021.
- Arganda-Carreras, I., et al., Trainable Weka Segmentation: a machine learning tool for microscopy pixel classification. Bioinformatics, 2017. 33(15): p. 2424-2426. [CrossRef]
- Bergen, K.J., et al., Machine learning for data-driven discovery in solid Earth geoscience. Science, 2019. 363(6433): p. eaau0323. [CrossRef]
- Carpenter, C., Machine-Learning Image Recognition Enhances Rock Classification. JPT, 2020. 72(10). [CrossRef]
- Alfarisi, O., The AIRC - Artificial Intelligence Reservoir Characterization. 2020, UPC: http://pe.upc.edu.cn/_t1066/2020/0702/c13947a308346/page.htm.
- Alfarisi, O., Physics-augmented Machine Learning Classification of 3D Vision Morphology for Digital Rock Typing, in Interdisciplinary Engineering at the Dept. of Mechanical Engineering of Khalifa University in Collaboration with Massachusetts Institute of Technology MIT. 2022, Khlifa University and MIT: Thesis Commons.
- Kalule, R., et al. Quantifying Inter-Well Connectivity and Sweet-Spot Identification through Wavelet Analysis and Machine Learning Techniques. in Abu Dhabi International Petroleum Exhibition and Conference. 2024. SPE.
- Alfarisi, O., AI Fluid Flow AIFF for Understanding Porous Media Behavior from Micro to Reservoir Scale Aided by Machine Learning. 2023.
- Alfarisi, O., et al., 3D Geometrical Untangling of Heterogeneous Fabric Darcy’s Flow using the Morphology Decoder. 2022.
- Alfarisi, O., et al., 3D Adapted Random Forest Vision (3DARFV) for Untangling Heterogeneous-Fabric Exceeding Deep Learning Semantic Segmentation Efficiency at the Utmost Accuracy. arXiv preprint arXiv:2203.12469, 2022.
Figure 1.
In a water-wet system, three spherical grains are configured in a triclinic structure, where the area in between represents the pore throat.
Figure 1.
In a water-wet system, three spherical grains are configured in a triclinic structure, where the area in between represents the pore throat.
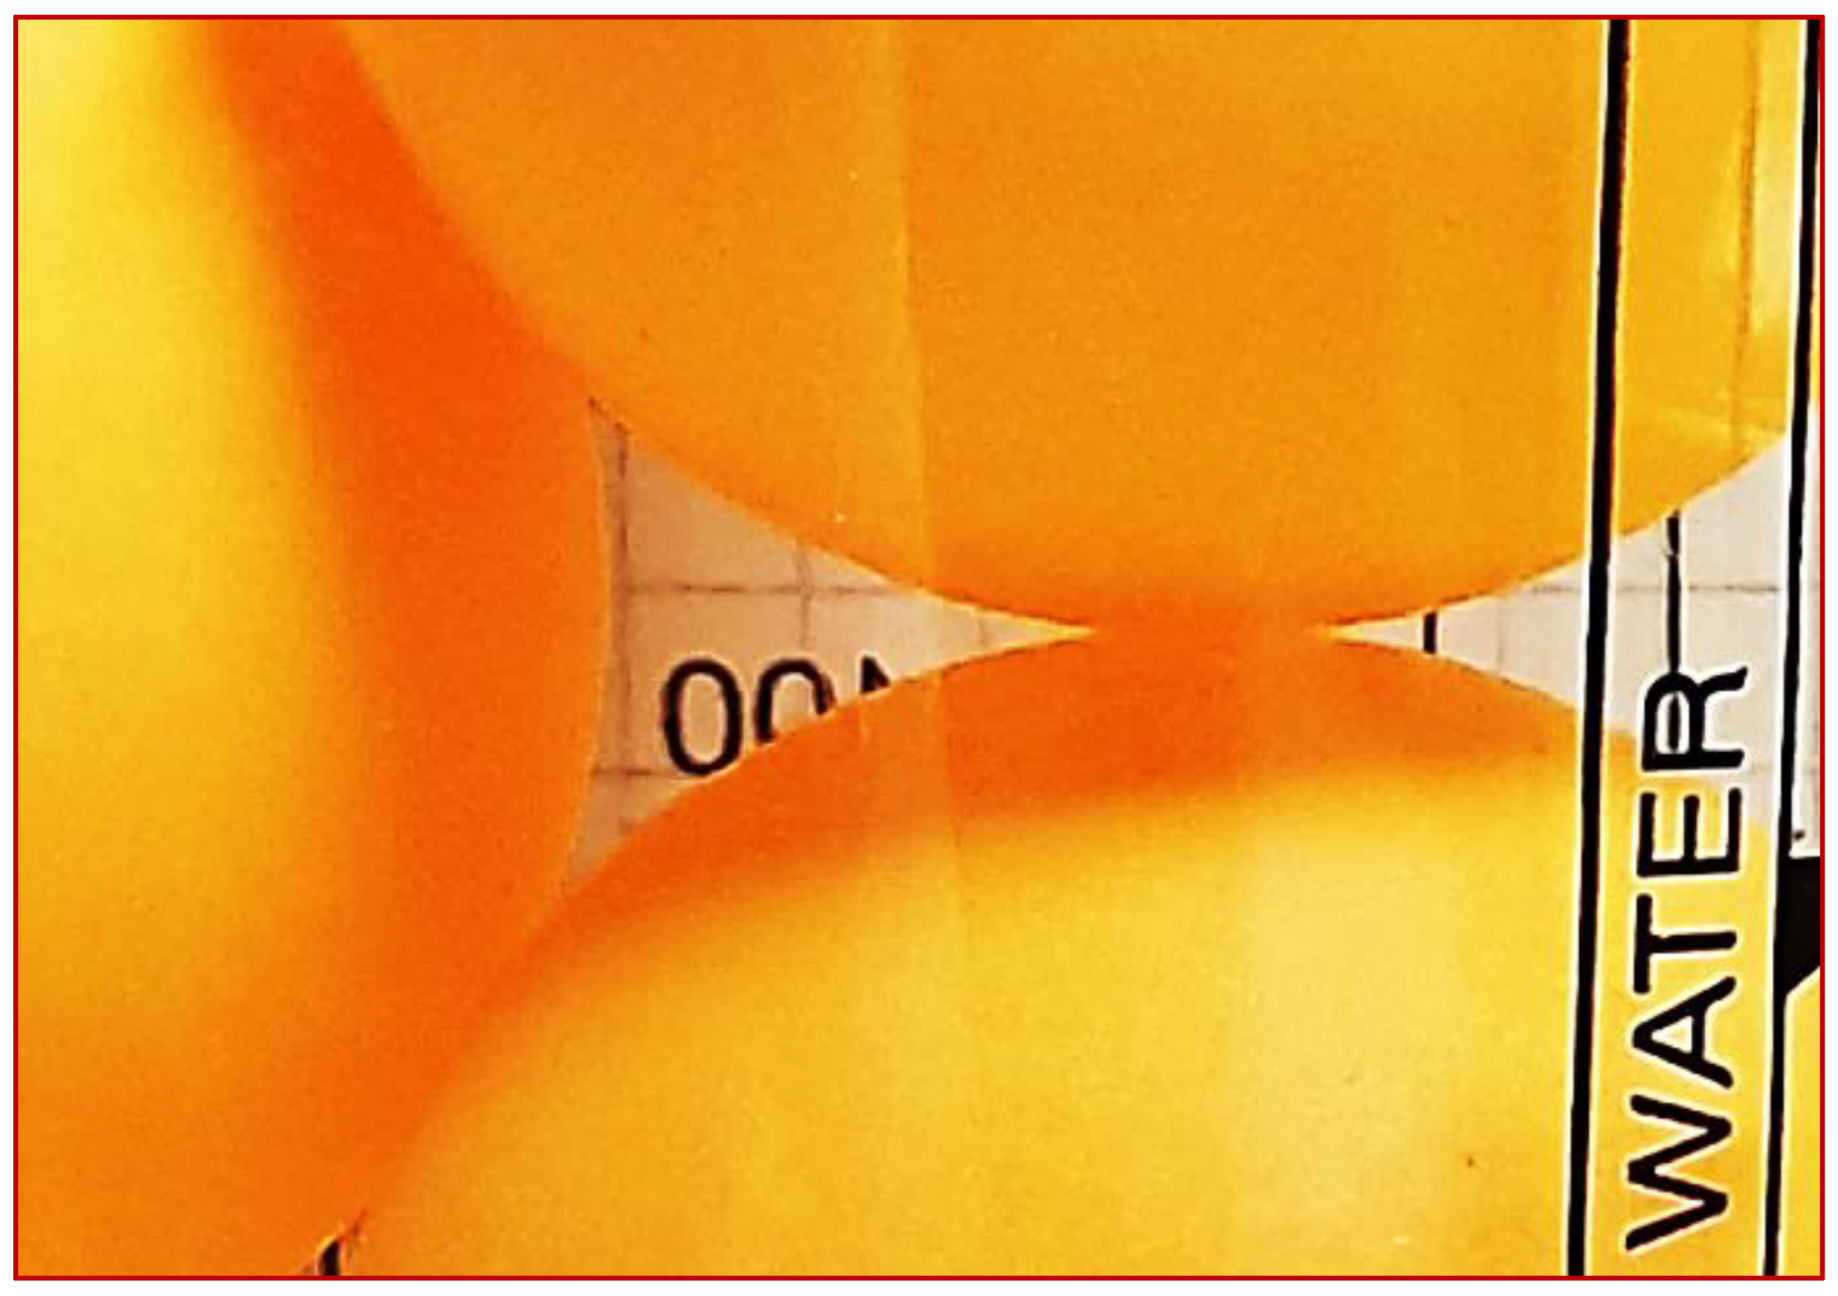
Figure 2.
Three spherical grains configured in a triclinic structure, where the area in between represents the deformed pore throat area due to being in an oil-wet system.
Figure 2.
Three spherical grains configured in a triclinic structure, where the area in between represents the deformed pore throat area due to being in an oil-wet system.
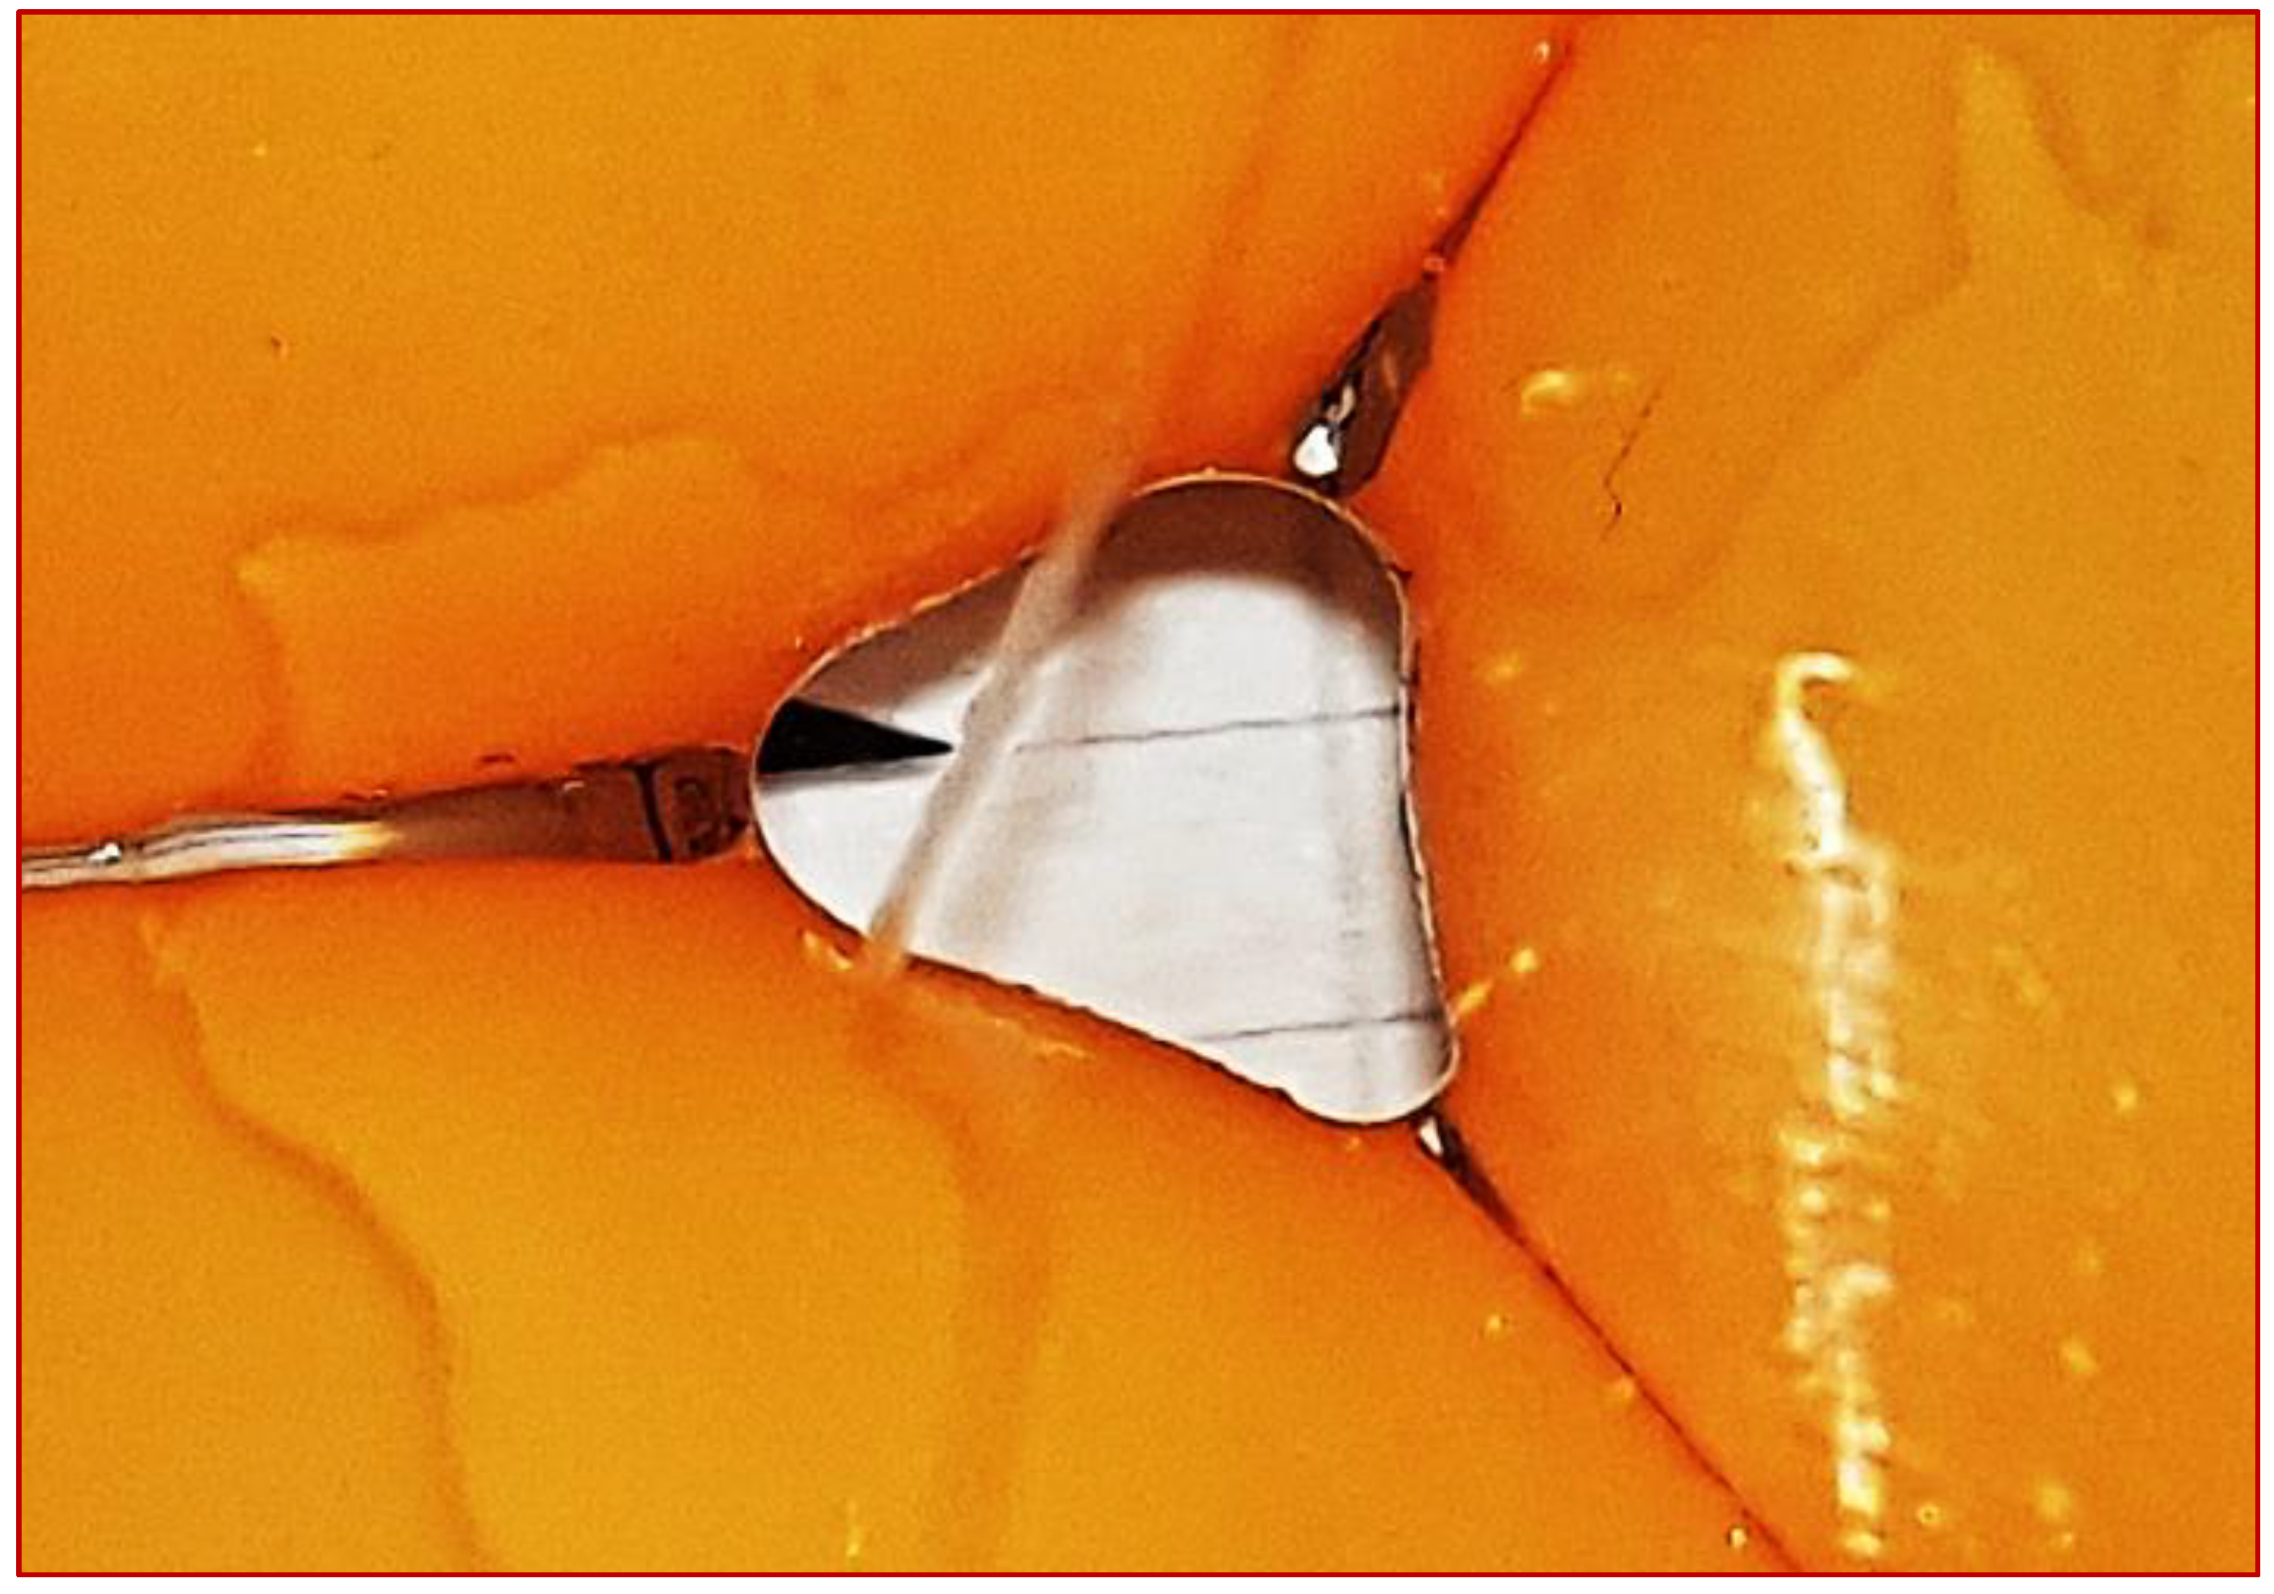
Figure 3.
The difference between the area of the pore throat in the water-wet and the oil-wet systems.
Figure 3.
The difference between the area of the pore throat in the water-wet and the oil-wet systems.
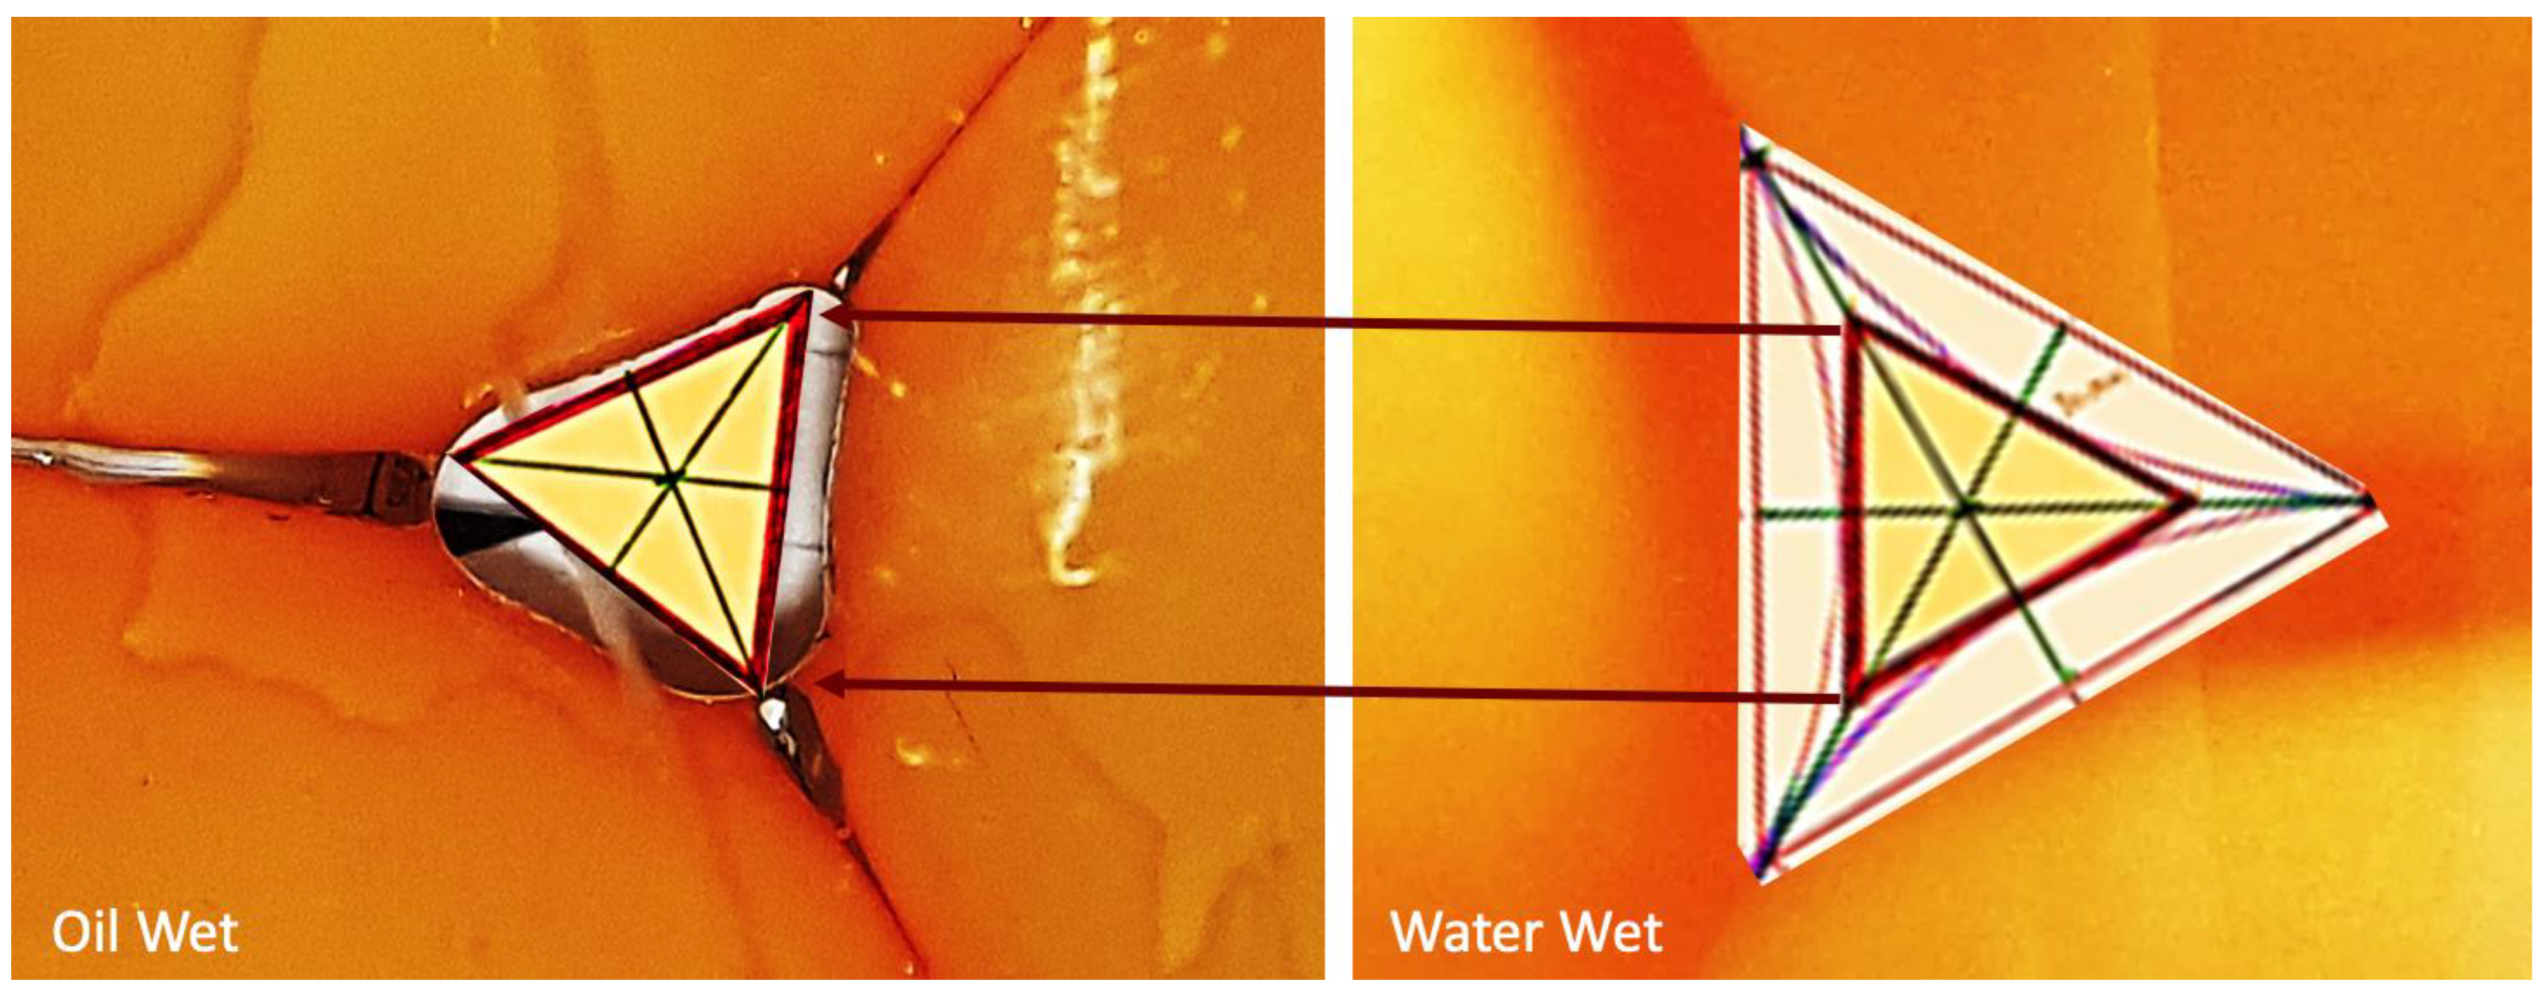
Figure 4.
The Large solid line with red triangle edges represents the water-wet pore throat system. In contrast, the small solid red line triangle represents the oil-wet.
Figure 4.
The Large solid line with red triangle edges represents the water-wet pore throat system. In contrast, the small solid red line triangle represents the oil-wet.
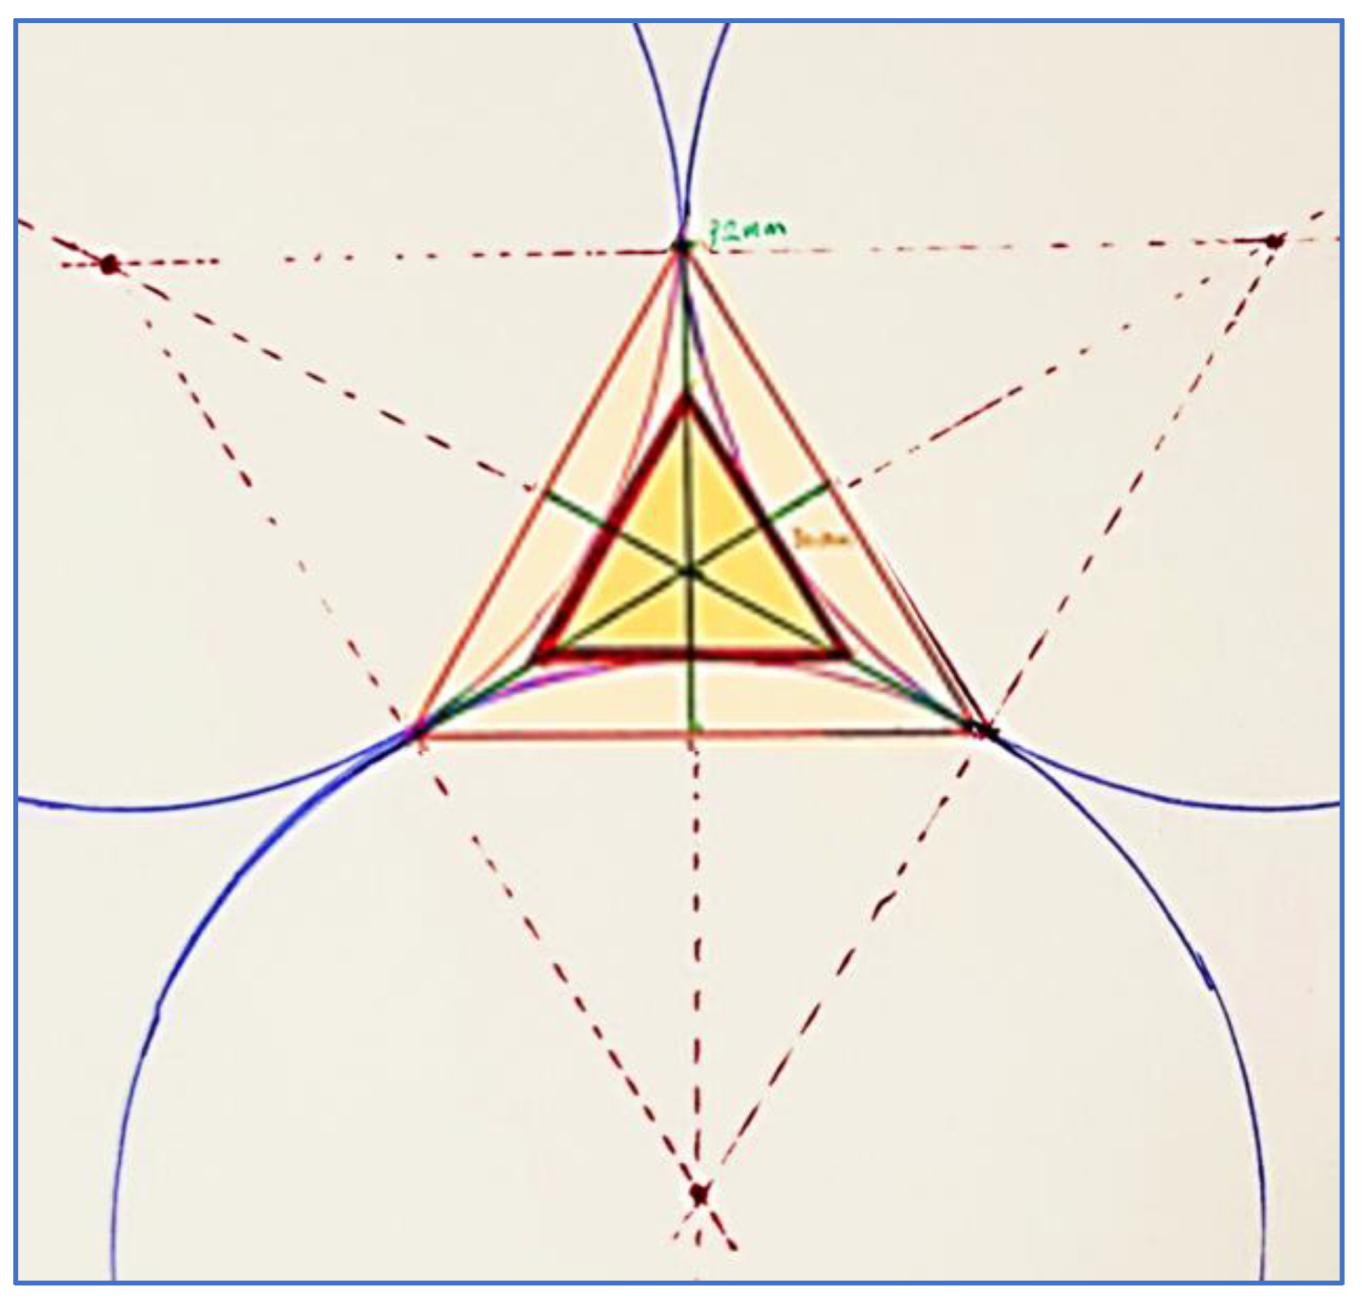
Figure 5.
Measuring the deformation of the pore throat using the geometrical analysis for two edges, the AB and the CD edges.
Figure 5.
Measuring the deformation of the pore throat using the geometrical analysis for two edges, the AB and the CD edges.
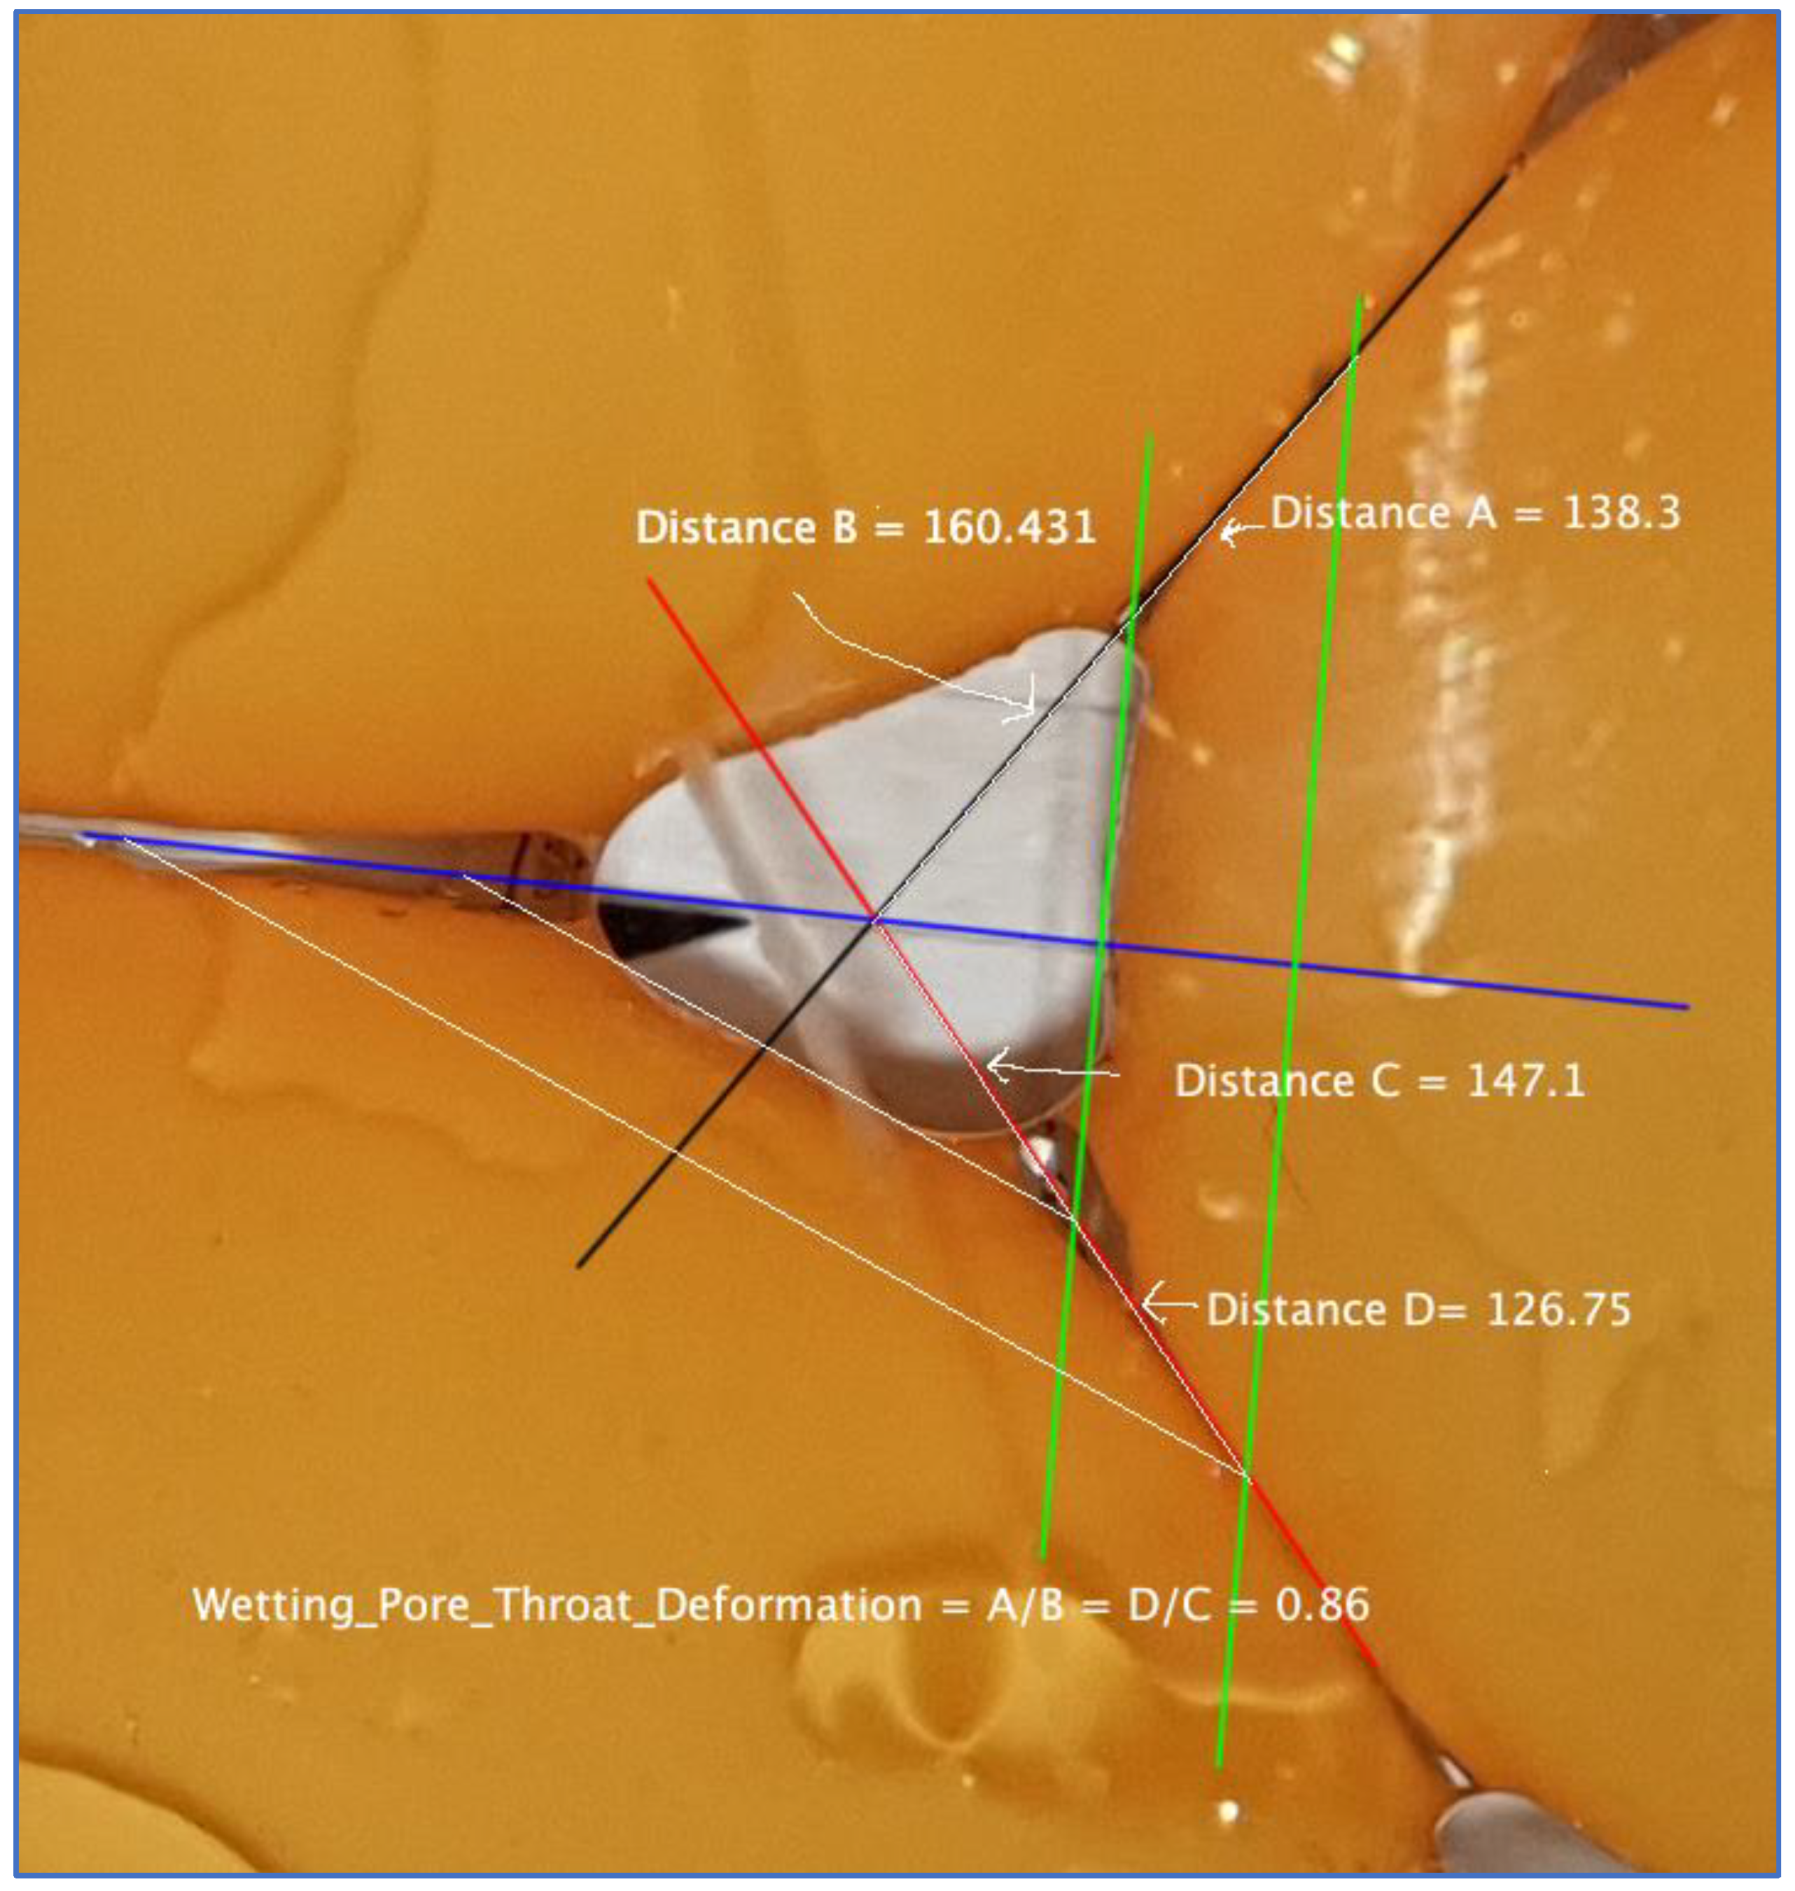
Figure 6.
Water and Oil Relative Permeability curves in a water-wet system for one rock type.
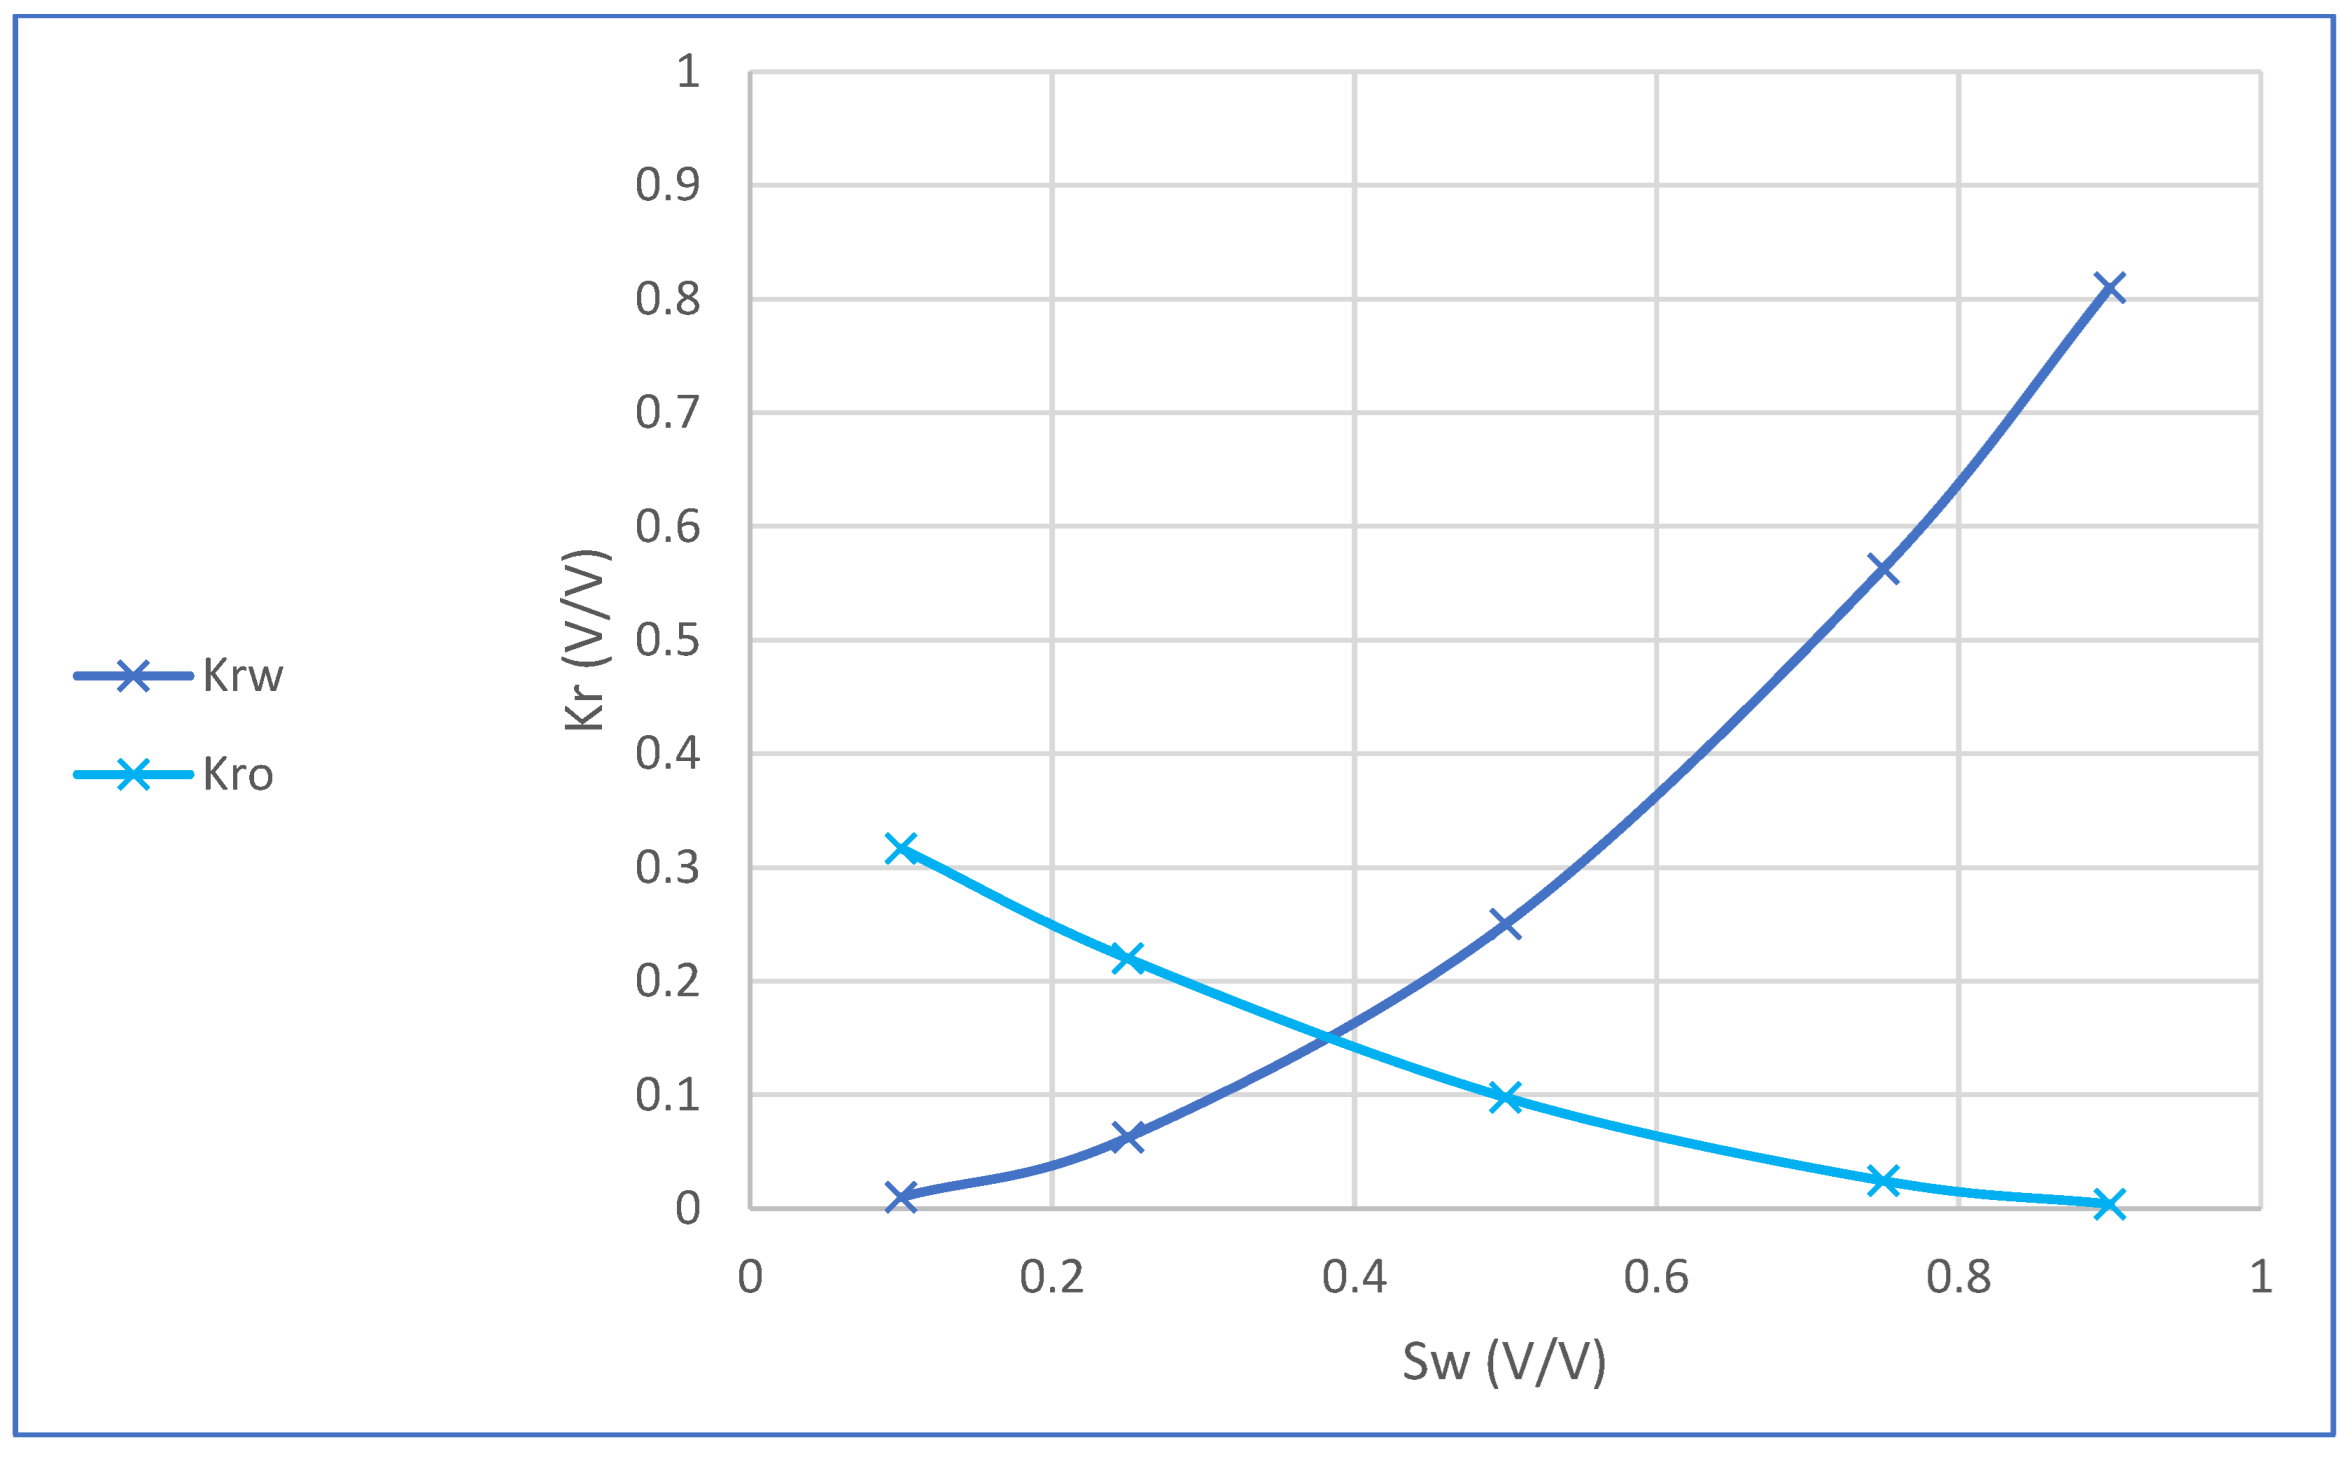
Figure 7.
Water and Oil Relative Permeability curves for one rock type in water-wet and oil-wet systems.
Figure 7.
Water and Oil Relative Permeability curves for one rock type in water-wet and oil-wet systems.
Disclaimer/Publisher’s Note: The statements, opinions and data contained in all publications are solely those of the individual author(s) and contributor(s) and not of MDPI and/or the editor(s). MDPI and/or the editor(s) disclaim responsibility for any injury to people or property resulting from any ideas, methods, instructions or products referred to in the content. |
© 2025 by the authors. Licensee MDPI, Basel, Switzerland. This article is an open access article distributed under the terms and conditions of the Creative Commons Attribution (CC BY) license (http://creativecommons.org/licenses/by/4.0/).
Copyright: This open access article is published under a Creative Commons CC BY 4.0 license, which permit the free download, distribution, and reuse, provided that the author and preprint are cited in any reuse.


