Submitted:
20 May 2025
Posted:
20 May 2025
You are already at the latest version
Abstract
Wellington, New Zealand, is highly vulnerable to disaster-induced food security crises due to its geography and geological characteristics, which can disrupt transportation and isolate the city following disasters. Urban agriculture has been proposed as a potential alternative food source in post-disaster scenarios. This study examined the potential of urban agriculture for enhancing post-disaster food security by calculating vegetable self-sufficiency rates. Specifically, it evaluated the capacity of current Wellington’s community gardens to meet post-disaster vegetable demand in terms of both weight and nutrient content. Data collection involved a mixed methodology approach of literature reviews, questionnaires, on-site observations and mapping, and high-resolution aerial imagery. Post-disaster food demand scenarios were developed based on different target populations. Results show that within a five-minute walking distance of existing community gardens, weight-based vegetable self-sufficiency was only 0.42% for the general population. This rate increased to 2.07% when specifically targeting only vulnerable populations, and to 10.41% when focusing solely on gardeners’ own households. However, at the city-wide level, the current capacity of community gardens to meet vegetable demand remained limited. Additionally, nutrient-based self-sufficiency was lower than weight-based self-sufficiency, emphasizing the greater challenge of achieving adequate nutrient levels. Beyond self-sufficiency, this study also addressed the role of UA in promoting food diversity and acceptability, as well as its social and psychological benefits. Findings indicate that community gardens contribute meaningfully to post-disaster food security for gardeners and nearby residents, particularly for vulnerable groups with elevated nutritional needs. While current self-sufficiency levels are low when considering only community gardens, the study suggests that Wellington has the potential to improve post-disaster food self-reliance by diversifying UA types and optimizing land use. Realizing this potential will require strategic interventions, including supportive policies, a conducive social environment, and diversification—such as the including private yards—all aimed at improving food access, availability, and nutritional quality during crises.
Keywords:
urban agriculture
; disaster
; food security
; self-sufficiency
; community garden
1. Introduction
1.1. Post-Disaster Food Security
One of the most pressing issues in this century is to ensure food security for the rapidly increasing population [1]. These challenges are further exacerbated during natural disasters, including earthquakes and those induced by climate change [2,3]. Food security is immediately threatened following disasters [4]. Food availability and access might be impacted by disruptions in production, distribution, affordability, and allocation [5]. These disruptions are often caused by damage to utilities and infrastructure [4,6]. For example, the 2011 Christchurch earthquake in New Zealand caused severe road damage due to liquefaction, leaving the affected population isolated and without access to local food for weeks [7]. Similarly, the 2023 severe weather events in New Zealand’s North Island resulted in widespread flooding and isolation, compelling many communities to rely on locally available food and supplies [8].
Furthermore, emergency food might be unfamiliar or unsuitable for the affected population [4]. A government report on the New Zealand 2023 severe weather events stated that evacuation centres were unable to meet the dietary needs of the elderly due to a lack of appropriate food options [8]. Vulnerable groups—including the elderly, children, and pregnant or lactating women—often require higher-quality, nutrient-rich food [9,10]. Many may already face food insecurity before a disaster, making it even more challenging to ensure their food security in the aftermath [9,10]. In contrast, the report observed that individuals who were more ‘self-reliant’ were less affected, as they had better access to food and water supplies [8], p. 142.
It is true that maintaining self-reliance pre, during, and post such events remains crucial, even if food support might be provided [11,12]. Recommendations for stockpiling emergency food at home are encouraged as part of the post-disaster emergency response in seismically susceptible countries like New Zealand and Japan [6,13]. These foods typically are non-perishable, whereas nutrient-rich and fresh products have much shorter shelf lives [6]. Relying on emergency food will pose threats to food nutritional value, leading to health and wellbeing problems caused by mononutrient intake [5,9]. A long-term monotonous diet will increase the risk of micronutrient deficiencies like anaemia (lacking iron) and scurvy (lacking Vitamin C), or even mortality [14].
Preparing food stock before disasters is essential, but a food security crisis may still arise. This underscores the importance of self-reliance by having multiple food sources as alternatives to ensure food security during emergencies.
1.2. Urban Agriculture in Enhancing Post-Disaster Food Security
Urban agriculture (UA) has been defined as cultivating plants and raising animals within and around city limits [15]. It encompasses a variety of forms, including home gardening, community-shared gardening, urban farms, and continuous productive urban landscapes [16,17,18]. UA has been recognized as a supplementary solution to enhance food security by providing safe, accessible, and locally produced food [19,20].
Historically, UA has been a positive response to various worldwide crises. During the USA depressions of the 1890s and 1930s, as well as World Wars I and II, UA provided food and offered hope to those in need [21]. Similarly, the recent 2020 COVID-19 pandemic has led to an increase in demand for urban food gardens [22]. In terms of post-disaster food security, UA is recognized for its various contributions in terms of:
- food availability: it promotes local food production sources in situations where external food sources are unavailable or constrained within affected areas [23]
- food access: it enhances affordable and familiar food by supplementing local food supplies [2]
- food utilisation: it provides fresh food with essential nutrients [9].
Examples could be observed from the 2010 and 2011 earthquakes in Christchurch, where local community gardens offered food to those experiencing shortages in availability and access during the initial phases of disaster recovery [24]. Similarly, following the 2010 earthquake in Haiti, local food security was bolstered by urban farms established prior to the earthquake [25].
1.3. Wellington as a Case Study
New Zealand is a nation susceptible to natural disasters, such as earthquakes, tsunamis, and climate-related hazards [26,27]. The failures in ensuring food security during the Christchurch and North Island disasters have revealed gaps in post-disaster food security within traditional disaster preparation systems [28]. Introducing UA as an alternative can help build a more resilient food system in disaster-prone urban environments in New Zealand [29,30].
Wellington, the capital city of New Zealand, is situated along active fault lines, which increases its vulnerability to earthquakes and tsunamis [31,32]. Earthquakes are expected to continue striking this city in the long term, yet preparedness remains insufficient [33,34]. The city’s geographic location—bounded by mountains and facing the sea—increases its risk of isolation following a major hazard event (Figure 1) [32,35]. The Wellington Earthquake National Initial Response Plan (WENIRP) is a post-earthquake management support plan, which primarily covers the first three to five days following a major earthquake [36]. It anticipates the worst-case scenario in which the city could be completely isolated for days [36]. According to WENIRP, even after external communication is restored, full recovery may take weeks to months. Wellington City currently relies on surrounding regional farms for its primary source of fresh food [37,38]. Its food distribution system depends heavily on two north–south land transport corridors within the region and maritime freight across the Cook Strait connecting the North and South Islands (Figure 1b) [39]. This dependence suggests that if Wellington’s road or port infrastructure is compromised by a major disaster, food availability could be at risk, forcing residents to rely more on local food sources. For instance, the 2016 Kaikōura earthquake caused damage to Wellington’s port, disrupting food supplies due to impaired freight transport [40].
On the other hand, UA has been a tradition in Wellington since the colonial period through the 1950s, with most residents cultivating food in their backyards [41]. However, this practice shifted towards flower gardening after the 1950s [41]. In the past decade, UA has experienced a resurgence in Wellington, particularly in community gardens [42,43,44]. Wellington City Council (WCC) incorporated UA into its sustainable food initiative, dedicating its website to promoting local food growing [45]. As of May 2024, 28 community gardens were listed on the WCC website [46]. Community gardens are usually open productive spaces maintained by local residents for a range of purposes, from individual allotments to urban farms [47]. According to WCC, community gardens must be open to the public and operate on a not-for-profit basis. While categorized under the broad term “community gardens”, this study identified that the 28 gardens actually fall into three distinct types of UA in Wellington City:
In this study the term “community garden” for Wellington City encompasses the three UA types listed above.
In New Zealand, although previous studies have explored the contributions of community gardens based on lessons from the Christchurch earthquakes, the focus has primarily been on the social and cultural benefits [7,23,24]. UA produce was mentioned as a post-disaster food source but has never been thoroughly examined [23,24]. This study proposes UA as an alternative emergency food source. The aim is to examine its role in food security in post-disaster Wellington City through the calculation of vegetable self-sufficiency, as demonstrated in previous relevant studies [9,30,49,50,51]. The focus on vegetable production is driven by its higher yields and more nutritional value compared with staple crops and animal products [52,53].
2. Materials and Methods
2.1. Study Design
The original study design aimed to explore the potential of all UA types in Wellington City. However, due to insufficient data on other UA types, only community gardens were considered. The method was to identify the extent to which post-disaster food demands could be met by the current UA supply from community gardens. UA’s potential was assessed by analysing and calculating self-sufficiency in two attributes:
- City-wide vegetable productivity (by weight).
- Nutrient provision from a single community garden.
The decision not to examine city-wide nutrient provision was due to the fact that only one garden provided yield data for individual crops—data essential for such analysis. As a result, nutrient provision could only be assessed for this garden.
The following formula was employed for self-sufficiency calculation [30]:
Based on the formula, the three variables (yield, area, and demand) are needed to quantify self-sufficiency rates. Surveys and literature reviews of previous published studies were used to obtain these data. Surveys included questionnaires, on-site observation and mapping, and high-resolution aerial photo mapping (Figure 2).
Of the 28 WCC listed gardens, 22 were included as targeted gardens because they primarily grow vegetables. Among them, one is an urban farm, 15 are communal gardens, and six are allotments. Additionally, one urban farm located within the Wellington Region, but outside the Wellington City boundary, was included as a reference garden due to its yield data availability.
2.2. Step 1: Surveys on Yield and Area
Step 1 involved surveys on collecting data of garden yield and area. Questionnaires were distributed to all targeted gardens via email or as hard copies during on-site visits from November 2023 to August 2024. These questionnaires requested information on garden sizes, yields, crops, maintenance, and other relevant details. Due to challenges in accessing certain information through the questionnaires alone, a review of previous studies and on-site visits were also conducted. Aerial photo analysis was employed as an auxiliary tool when the other methods were not feasible.
2.2.1. Yield Data
Obtaining urban farming yields has been widely acknowledged as a challenge due to limited empirical research and significant regional variability [41,54,55,56]. To collect yield from existing urban gardens, self-collected data through citizen science has been most used in previous studies [57,58,59]. This method collects self-reported yields or productivities from the targeted gardens through questionnaires, self-recording surveys, and/or interviews [60,61,62].
In this study, though the initial aim of the questionnaire was to collect yield or productivity data from the targeted gardens, only the single urban farm had recorded its harvest. This is because most urban gardeners do not track their yields or productivity. An attempt was made to implement harvest self-recording survey among the existing community gardeners. However, it failed due to the difficulty of recruiting sufficient participants, leading to an inadequate sample size.
Given yields vary across different types of UA, the available data from the single urban farm could not be generalized to other types of gardens. Therefore, two additional methods were conducted: review of previous published studies and conventional farming1 data [55,64].
One criterion for selecting previous studies was to collect first-hand yield data. These studies were categorized into three types of gardens according to the definitions and descriptions in these studies (Table 1):
- Allotments: includes home/private/backyard gardens due to their similarity to allotment yields, where individuals grow their own crops [65].
- Communal gardens: includes community gardens and shared gardens, as some studies define community gardens exclusively as shared productive spaces.
- Urban farms: includes gardens with hired staff and more intensive maintenance.
The bold numbers in Table 1 indicate the yield data used in this study. As shown in Table 1, the yield range varies significantly within each category. This variability arises from the limitations of citizen science data, which include inconsistencies in recording methods, participant variations, and limited sample sizes [58,60,67]. To enhance accuracy, the median yield was used as the reference data for each category. Conventional farming yields serve as a benchmark for low-intensity UA [71].
For allotment data in this study, New Zealand conventional farming data was found to be comparable to the median yield of allotments from previous studies (Table 1) and to yield data (2.9kg/m2) from a study on home gardens in Auckland, New Zealand [72]. Consequently, New Zealand conventional farming data was used to estimate allotment yields in this study.
For communal gardens, the yield was assumed to be 75% of conventional farming data, following similar studies [73,74]. This estimate was then compared with the median yield of communal gardens from previous studies, revealing similar figures.
For the only urban farm that provided productivity data, its average annual yield was comparable to the median yield figure from the literature review.
2.2.2. Land Area
The process of acquiring existing UA land area data included questionnaires, on-site mapping, and mapping through aerial photos [9,55,75]. Questionnaires were initially distributed for collecting garden area data. However, since most gardens lacked precise data on cultivated and total areas, on-site mapping was adopted. For the accessible gardens, maps were created based on the measurement of their cultivated and total land areas. Google Earth was utilized as an auxiliary tool [50] to map gardens that were either inaccessible or difficult to map on-site due to irregular shapes and steep terrains.
2.3. Step 2: Post-Disaster Food-Demand Scenarios
Food production in weight was calculated by multiplying yield and land area from Step 1, and then divided by post-disaster food demands. These demands were assessed based on two key factors: per capita vegetable intake and the targeted population. Two scales of demand were considered:
- City-wide vegetable demand by weight.
- Nutrient demand for the population surrounding the urban farm.
2.3.1. City-Wide Vegetable Demand
City-wide vegetable demands considered six different scenarios, as shown in Table 2. The displaced population estimates were based on WENIRP projections for earthquakes occurring during working hours (Ministry of Civil Defence & Emergency, 2018). Since data on pregnant or lactating individuals was unavailable, the vulnerable population only included the elderly and children (age under 15 or over 65).
Given the challenge of using only 22 community gardens to feed the entire population of Wellington City, zones within a five-minute walking distance (approximately 400 metres) from each garden were also considered. This distance aligns with standards for community service network planning [79,80]. Due to the unavailability of accurate population data within these zones, the population was estimated by multiplying the zone area by the corresponding population density. The specific zone area around each garden was defined and calculated using ArcGIS 3.2. The population density was determined based on census data at the Statistical Area 1 level, the smallest geographic unit containing detailed census data by age and gender [81].
The last scenario focused solely on the families of allotment gardeners as the target population, as it was difficult to estimate the number of participants involved in the other two UA types—communal gardens and urban farms. The six allotments contained 221 plot holders (gardeners), a number determined through inquiries with garden coordinators or by counting plots using Google Earth. The total target population was estimated by multiplying the number of plot holders by the average household size of 2.6 persons [82].
2.3.2. Nutrient demand for the population surrounding the urban farm
The nutrient demand was calculated based on the five-minute walking distance zone of the urban farm. Eight nutrients were selected based on two aspects: the major nutrients vegetables can provide and their importance to the vulnerable population [83,84]. Food production by weight was converted to nutrient values using Food Composition Tables to determine the contribution of various food sources to dietary nutrients [85,86]. As in Section 2.3.1, precise population data by age and gender within this zone was unavailable. Instead, the population was estimated by applying the overall population density of the zone to the age and gender distribution of the broader area around the urban farm [78].
2.4. Step 3: Calculation of Self-Sufficiency Rate
The annual average self-sufficiency rate was calculated using the formula provided in Section 2.1. For the city-wide calculation, self-sufficiency in vegetable weight was assessed across the 22 gardens for the six scenarios. For the urban farm, self-sufficiency in both vegetable weight and nutrients was evaluated for its surrounding residents. This study applied an average crop refuse rate of 20% to all produce [72]. Although previous studies reported refuse rates ranging from 20% to 30%, a lower rate was adopted here, as UA typically involves fewer steps from field to table, resulting in reduced produce loss compared to conventional farming [72,74,87,88].
3. Findings
Figure 3 shows the locations of the 22 targeted community gardens. Among these, 20 were visited at least once, while the remaining two were inaccessible due to inability to establish contact. A total of 20 questionnaires were completed. To gain a deeper understanding of the gardens, the first author participated in 11 garden working bee sessions, which also facilitated building strong connections with garden participants. Informal conversations were conducted with volunteers, plot holders, coordinators, and managers at each site. Additionally, discussions were held with WCC to better understand the broader context of community gardens.
3.1. Garden Current Situation
Of the 20 gardens that finished the questionnaire, 45% have been established for more than 10 years, while over 35% were founded after 2020. In terms of land ownership, over half are owned by WCC, with most of the remainder situated on other types of public land. Garden maintenance varies by type, with communal gardens typically managed by regular volunteers and occasional weekly working bees. Allotments are primarily maintained by plot holders according to their individual schedules. The urban farm is unique in employing staff, ensuring it is well-maintained throughout the week, with working bees held two to three times weekly. Maintenance generally occurs more frequently in summer than in winter due to the increased workload. Over three-quarters of the gardens share their produce with the community, food banks, or other organizations, while fewer than half retain their harvest for self-sustenance. The urban farm additionally sells vegetables through a community-supported agriculture (CSA) programme (not-for-profit), where members pay in advance for a season’s salad or vegetable produce.
As mentioned in Section 2.2.1, most gardens do not record their yield data. The only garden that does so is the urban farm. It had an average annual productivity of 2,400 kg, based on its recordings from 2021 to 2023, indicating a yield of 4 kg/m². This yield is comparable to the data from the reference urban farm outside Wellington City but within Wellington region, which had annual yields of 3.65 kg/m². However, for the other two UA types, despite the absence of accurate data, on-site observations suggest that many may have lower yields due to less intensive maintenance.
In terms of garden area, Table 3 shows that the current cultivation percentage ranged from 1% to 73%. Although the cultivation percentage varies significantly between each garden, communal gardens generally had the lowest average figure at 11%, while the urban farm had the highest at 36%, with allotments falling in the middle at 30%.
3.2. Post-Disaster Self-Sufficiency Rate
Table 4 presents the post-disaster vegetable self-sufficiency rates for Wellington City under the six scenarios outlined in Section 2.3. The annual average self-sufficiency rate of current community gardens in meeting the vegetable needs of the entire city population was 0.04%. While the rates for displaced and vulnerable populations are slightly higher, they remain very low. When focusing on residents within a five-minute walking distance from community gardens, the self-sufficiency rates rose to 0.42% for the general population and 2.07% for vulnerable groups. In contrast, when considering only the gardeners’ own post-disaster vegetable needs, the self-sufficiency rate reached 10.41%.
Only the urban farm had data for nutrient analysis, with the targeted population defined by a five-minute walking zone around the farm. The 2023 vegetable harvest from this garden totalled 1921 kg before accounting for crop refuse rate. Based on vegetable weight, the self-sufficiency rate for the entire population within this zone was 1.09%, and 6.72% for the vulnerable population (Table 5). This means 11 people could be sustained during a disaster. However, when calculating the average self-sufficiency nutrient rate, it dropped to 0.53% for the entire population and 1.88% for the vulnerable.
4. Discussion
This study found that while community gardens can offer a degree of self-reliance for the gardeners themselves, the overall vegetable self-sufficiency rate for Wellington City remains low when relying solely on these gardens. The following sections discuss the underlying reasons for this limited self-sufficiency, the current challenges facing UA in Wellington, its role in post-disaster context, and the limitations of this study.
4.1. Self-Sufficiency Rates Discussion and Comparisons with Other Studies
Table 6 presents a comparison of self-sufficiency rate to support city-wide population demands between this study and previous studies. Wellington City has a significantly lower self-sufficiency rate compared to other cities.
Although most of previous studies typically did not account for crop refuse in their calculations, this study did incorporate them. However, crop refuse was not a major factor influencing the low self-sufficiency rate observed in Wellington, as its inclusion had minimal impact on the overall results. Another possible reason for this discrepancy is the low utilization rate of the gardens. Observations during on-site visits indicated that most gardens allocate very little area for vegetable planting. Table 3 shows that Wellington’s community gardens have significantly lower utilization rates, with an average of 24%. In comparison, a study on community gardens in Paris and Montreal reported utilization rates of 55%–91% and 82%–96%, respectively [66]. According to consultations with WCC, there are no strict boundary definitions for community gardens, suggesting potential for spatial expansion. This implies that higher cultivation rates could be achieved through more efficient land use. However, even under hypothetical scenarios where 50% and 75% of the available garden area is cultivated, the city’s overall food self-sufficiency would only reach 0.07% and 0.11%, respectively. This suggests that low land utilization is not the primary factor limiting food self-sufficiency.
A comparison of garden numbers in Table 6 reveals a relatively limited number of gardens in Wellington City. While this study focused solely on community gardens, previous studies considered a broader range of UA types, such as backyard gardens and professional farms resulting in a greater number of gardens, and thus, higher self-sufficiency rates (Table 6) [9,51]. This study examined only 22 community gardens based on the WCC list, representing one-third of the gardens in the Leicester study and just 15% of those in the Nerima study. Consequently, only a small portion of Wellington’s land was evaluated for vegetable production, making it challenging to achieve a high level of self-sufficiency. Conversations with WCC revealed that the listed community gardens do not represent all community gardens in Wellington. Additional unlisted gardens exist; however, those numbers and locations are difficult to estimate. This indicates that the actual extent of community gardening activity may be underrepresented in official records, suggesting a potentially greater capacity and reach than currently documented.
When prioritizing the needs of the vulnerable within a five-minute walking distance of the 22 community gardens, the self-sufficiency rate reached 2.07%. This implies that, during disasters, 81 vulnerable individuals living near these gardens would have direct access to fresh vegetables. If the target population is limited to gardeners’ households, the rate increased to 10.41%. Although these figures remain lower than those reported in previous studies (32% for London, 16% for Ljubljana, and 27% for Milan [75]), the gap is significantly smaller than in scenarios assessing the entire population’s needs.
Focusing on the urban farm—the most productive site—the self-sufficiency rate for the nearby vulnerable population within a five-minute walking distance increased to 6.72%. However, when assessing nutrient self-sufficiency, the rate dropped to approximately 25% of the self-sufficiency in food weight (Table 5). This finding is consistent with a previous study, which indicated that achieving nutrient self-sufficiency is more challenging than attaining self-sufficiency based on food weight [9]. For the urban farm, when targeting the entire population within a five-minute walking zone, Vitamin A had the highest self-sufficient rate at 1.11%, while Vitamin B1 had the lowest at 0.16%. However, when focusing on the vulnerable population, the highest rate remained for Vitamin A at 5.18%, while the lowest was Calcium at 0.52%. This disparity indicates that in disaster planning, specific nutrient needs of vulnerable groups should receive special attention, as their requirements may differ from those of the general population.
The relatively higher self-sufficiency rates for populations surrounding the gardens suggest that community gardens may play a more critical role for nearby residents, or for the gardeners’ families. However, in general, the current community gardens in Wellington are not sufficient to enhance post-disaster food security for most Wellingtonians.
4.2. Current Challenges in UA and Lessons from Other Studies
In Wellington, community gardens were mostly initiated through grassroots efforts [91]. While WCC is supporting the existing community gardens in some aspects [92], this study reveals that most gardens are struggling with various challenges. The most significant issue is insufficient labour input, with over half of the surveyed gardens reporting this as a concern. Often, only a small group of people, sometimes just one person, regularly manages the gardens. They handle tasks such as maintenance, organizing working bees, managing websites and social media, and making financial decisions. Finding long-term volunteers with both interest and time for gardening has proven difficult. One garden coordinator expressed that if he were to leave the group, the garden might not survive.
The second major challenge is the inconsistent water supply, followed by inadequate funding, soil contamination, weed management, and limited space. Some gardens also mentioned natural constraints, including wind and insufficient sunlight due to sloped terrain. Issues related to water supply, soil quality, and space can be addressed through proactive interventions. For instance, some gardens have used raised planting beds or planting plots to avoid contaminated soil. One garden mentioned successfully modifying their shed to collect more rainwater for irrigation. However, issues such as soil treatment and contamination testing must be addressed as part of future UA development, which will require both technical and financial support.
The only urban farm demonstrated a better yield and management performance, attributed to its employed staff and consistent maintenance. Additionally, selling vegetables through a CSA programme contributed to financial stability. Indeed, gardens that sell their produce may achieve higher yields, suggesting that such engagement can foster greater motivation to enhance production [93].
Additionally, instability of land availability is not a negligible issue. One garden reported that it might be closed at any time due to the potential sale of the land. Compared with other cities (Table 6), the relatively lower population density gives Wellington potential to have more UA land. However, fragmented and unclear zoning planning policy, coupled with the absence of a targeted strategic direction for UA has hindered its development [43,91,94].
As an island country, Japan faces earthquake threats similar to those in New Zealand. The potential of UA in supporting post-disaster self-sufficiency in the Japan study is significantly higher (Table 6). This is likely due to greater UA engagement and government support [9,95]. The study by Sioen [9] highlighted high participation in UA in Tokyo’s Nerima Ward. The engagement was supported by local government initiatives that encouraged and financially backed UA activities. The Nerima municipality had a dedicated UA section that provided a platform that promoted various types and developments in UA. This included traditional urban gardens and hobby farms. These hobby farms have gained popularity for education, leisure, and livelihood, while also boosting self-sufficiency. Additionally, in terms of urban planning policies, the Productive Green Land Act, amended in 1992, aims to protect farming activities in cities [96]. This legislation also designates productive land in Tokyo as potential evacuation sites during disasters [97]. UA sites in Tokyo thus offer multiple functions [56]:
- Pre-disasters: improving diet and fostering community integration.
- Post-disaster: enhancing food security and serving as evacuation spots.
Cuba provides another notable example of using UA to enhance food security. The Cuban government has facilitated UA development by modifying laws to grant free access to public land for productive use [98]. Farming knowledge was disseminated through government-organized networks [99]. The food security crisis and the above measures have led to the high participation in UA initiatives in Cuba, resulting in a 90% self-sufficiency rate in vegetables and fruits [99,100].
While the challenges mentioned above do not encompass all types of UA in Wellington, they highlight key issues specific to UA in Wellington City. The examples of Japan and Cuba demonstrate that beyond grassroots enthusiasm, local policy and land-use support are crucial for UA’s successful development. Although the number of community gardens has grown in recent years, without sufficient policy, financial, and land-use support, as well as strong community engagement, UA is unlikely to provide food security in a post-disaster context in Wellington.
4.3. The Role of Urban Agriculture in Post-Disaster Wellington
In Wellington, community gardens have been proposed as a way to enhance resilience to natural hazards and mitigate risks that events such as earthquakes and flooding pose to urban food systems [101,102]. However, this study finds that they fall short of these goals in terms of supporting resilient food systems, as their current low self-sufficiency rates are inadequate to sustain the broader population during disasters.
Studies have shown that community gardens contribute significantly to social interactions during disasters [23]. For instance, after the earthquakes in Christchurch in 2010 and 2011, community gardens served as places for social exchange and became essential assets for enhancing community resilience during disasters [24]. Similarly, the observations from the current study indicate that community gardens in Wellington may provide more social benefits than food production.
Based on questionnaires, on-site observations, and conversations with gardeners and volunteers, participants in community gardens in Wellington have a range of motivations. Most view the gardens as spaces for socializing and relaxation, rather than as sources of food production. Many gardeners already have their own private yards and join community gardens to engage with their communities or to gain knowledge about gardening. For those without private yards, community gardens offer a chance to experience gardening and enjoy some fresh produce. Although gardens often share their harvest with volunteers, this is not the primary motivation for participation. Sixteen gardens reported sharing their harvests with the community or donating to charitable organizations like Soup Kitchen. For example, produce from gardens located within community centres are frequently shared in weekly community kitchens. Most gardens have strong ties to their communities, frequently hosting activities such as Matariki (Māori New Year) celebrations or outdoor lectures for school students. One garden, located next to a school, has an outdoor classroom where the coordinator has volunteered for over 10 years, teaching students about plant knowledge. This strong bond between the gardens and surrounding residents illustrates how community gardens in Wellington City contribute to strengthening social capital, a key element in disaster resilience [23].
Another benefit of Wellington community gardens is the remarkable diversity of food types. This study identified 95 different species of food grown in these gardens, including vegetables, fruits, herbs, and edible flowers. This figure does not account for varieties within the same species, suggesting that the actual diversity is even greater than reported. Accessing food through local alternative providers could significantly enhance overall diet quality and increase the variety of vegetables consumed [103]. This is particularly important during disasters, especially for vulnerable populations [9]. As mentioned in Section 1.1, post-disaster emergency food is usually mononutrient, as the primary goal is to restore energy levels in humans [104]. It has led to the majority of relief food supplies primarily consisting of carbohydrates. For example, in both the 1995 Hanshin-Awaji Earthquake and the 2004 Niigata Chūetsu Earthquake in Japan, emergency food supplies primarily consisted of carbohydrates like rice balls, bread, and instant noodles, while vegetables were scarce (Tsuboyama-Kasaoka & Purba, 2014). If people rely on emergency food for an extended period, it can cause physical health issues and even mental health disorders [9]. Based on suggestions from ‘Food and nutrition in emergencies’ [14], to increase nutrient intake during emergencies, incorporating fresh vegetables and fruits into relief food is recommended. If this demand cannot be fulfilled through external provisions, the affected population were encouraged to grow their own vegetables and fruits in the long term, if feasible. The diverse range of vegetables from Wellington’s community gardens offers a valuable variety and thus could enhance food security.
In addition to variety, local gardens also offer familiar and acceptable foods, which are particularly important during disasters for maintaining well-being and ensuring adequate food intake. During the 1999 earthquake in Athens, Greece, elderly individuals experienced reduced food intake because the provided food was often too hard or cold to swallow [104]. In the face of a disaster, which already presents considerable hardship, access to familiar food can offer both comfort and a sense of resilience [2]. This issue has been observed in traditional post-disaster food assistance, where the focus tends to be on the quantity of food rather than its quality, including factors such as warmth and acceptability [6].
However, as discussed in Section 4.1, the limited number of community gardens significantly restricts the overall potential of UA to contribute meaningfully to food security. Nevertheless, UA extends beyond community gardens alone. Integrating various types of UA, such as private yards, could significantly enhance its capacity to support food security, particularly in post-disaster contexts. A growing interest in home gardening was observed during the process of surveying the UA context in Wellington City. As suggested by a garden coordinator during an on-site visit, a network of community gardens and private yards could enhance community resilience. If implemented in Wellington, such a network could strengthen disaster preparedness by fostering community connections and providing an alternative source of fresh food. Based on this envisioned network, if only certain areas of residential zones2 are considered as private yards, they could cover an area of 28 km². Utilizing just 5% of this land for vegetable cultivation could supply 9.43% of the entire population or 30.42% of the vulnerable population during a disaster. This would enable 20,387 residents to access fresh vegetables in the event of severe disruptions, thereby reducing reliance on emergency food supplies. Furthermore, if more residential parcels are designated as private farming yards, along with more public spaces allocated for community gardens or allotments, the potential of UA in Wellington to support food security should not be underestimated.
Overall, the strong social bonds observed in the current Wellington community gardens highlights their potential social benefits. The well-established relationships between local residents and these gardens before disasters could play a crucial role in supporting the community recovery post-disaster [29,107]. To enhance UA’s potential as an accessible, acceptable, and nutritious food source, efforts should focus on expanding the variety of UA types and increasing its presence in diverse locations. Additionally, integrating UA into disaster management planning could enhance food security and resilience in times of crisis. In Wellington City, as part of post-disaster community-level preparation, community emergency hubs serve as places where individuals can seek assistance after a disaster [108]. Although these hubs do not store food, they list potential food sources, including community gardens. Many hubs are located in community centres, some of which already host community gardens. Although the current self-sufficiency rate of these gardens is too low to serve as a reliable food source, it presents an opportunity to envision the integration of community gardens with community emergency hubs. By strategically including UA gardens into disaster management planning, we could create not only an alternative source of fresh vegetables but also a familiar space where affected populations could support each another [56].
4.4. Limitations and Insights
There are several limitations of this study.
First, although it aimed to assess the current vegetable production potential, specific yield data from most gardens were unavailable. Only one garden provided its yield data, while yields for the other gardens were estimated using assumptions based on New Zealand’s conventional yields and prior UA studies. Since conventional yields are comparable to those of low-intensity UA, this approach ensured conservative estimates [71]. Also, the yields reported in the previous studies were based on either whole-year or harvest season records. As a result, actual harvests in some gardens may exceed the current estimates. However, more localized UA yield data are needed in future research to better assess its potential in Wellington.
Second, there were discrepancies in the population data. The data were not uniformly sourced from the same year due to availability issues. The 2023 New Zealand census provided total population figures, while the 2018 census offered detailed age and gender breakdowns. However, a comparison between the 2018 and 2023 data revealed little to no difference in the city-wide self-sufficiency rate calculation. Therefore, only the city-wide calculation used 2023 data, whereas the remainder used 2018 data due to the need for age and gender-specific population information. Future studies could enhance accuracy by using the latest available census data.
Third, this study considered only the elderly and young as vulnerable populations due to the unavailability of data on pregnant and lactating individuals. Given the elevated nutritional needs of all these groups, they should receive particular attention in disaster contexts [83]. Future research should further investigate data on vulnerable groups to achieve more precise conclusions.
Fourth, seasonality was not considered in this study due to the lack of related data. Seasonality could significantly impact results, as vegetable harvests vary by season. A study in Japan found that nutrient self-sufficiency was highest in winter and lowest in spring [9]. The impact in Wellington may differ. Future research could incorporate seasonality into calculations if more data becomes available.
During the development of this study, it became evident that existing UA data and academic research in New Zealand are insufficient for in-depth analysis. Consequently, this paper not only analysed the available data but also emphasized the methods used for its collection and evaluation. Field visits and direct engagement with gardeners and volunteers enabled the authors to build essential relationships, which proved foundational to the research process. While the study focused on quantitative data related to garden outputs, it became evident that building relationships with the gardeners was essential to obtaining meaningful insights. This experience demonstrated that in-person engagement provides richer understanding compared to remote methods like email surveys. Ultimately, this approach provided a deeper understanding of both the challenges and potential of existing community gardens in a post-disaster context.
5. Conclusions
This study examined the potential role of current UA practices in enhancing post-disaster food security in Wellington through self-sufficiency calculation in vegetable weight and nutrients. Due to data limitations, only existing community gardens were analysed. The findings indicate that these gardens contribute more significantly to food security for gardeners’ households and nearby vulnerable populations, with vegetable self-sufficiency rates of 10.41% and 2.07%, respectively. However, in comparison to previous studies, the overall self-sufficiency for the entire population was very low, standing at only 0.04%. While low cultivation rates contributed to this outcome, the primary limitation was the small number and variety of UA types included in this study. It is unrealistic to expect the limited number of community gardens to meet the entire population’s food needs. Furthermore, the potential of other UA types in Wellington, such as private yards, remains underexplored. Including private yards production in future research would likely result in a significantly higher self-sufficiency rate. This suggests that future studies should encompass a broader range of UA types to better evaluate their role in enhancing food security.
The nutrient analysis reveals that achieving nutrient self-sufficiency in vegetables is more challenging than that by weight. It also highlights that the nutritional needs of vulnerable individuals differ from those of the general population. Thus, it is essential to understand the distribution of the vulnerable population before disasters occur so their needs can be adequately addressed during such events.
Beyond self-sufficiency, the diversity of vegetables observed from the existing community gardens suggests the potential of more familiar and diverse food choices for affected populations during disasters. It would mitigate health issues caused by reliance on emergency food supplies with limited nutritional value [104]. Moreover, the social benefits of UA should not be overlooked. The observed strong bonds between current community gardens and surrounding residents are likely to be a key factor in disaster recovery [109].
Although many studies highlighted the benefits of UA as a food supply during disasters, few have thoroughly examined it. This study acknowledges that the current potential of UA to enhance food security in Wellington City is limited. However, the need for an alternative food supply remains crucial. As a city with multiple hazard potentials, the crisis of post-disaster food security looms over its residents [35,110]. The current low self-sufficiency in community gardens does not mean we should dismiss this option. Examples from Japan and Cuba demonstrate that UA has the potential to enhance food security as an alternative food source. What are needed for Wellington are more supportive government policies to promote UA.
This study has been limited by insufficient data on urban agriculture in local Wellington and the broader New Zealand context. The study highlighted the urgent need for further research in this area. At this time, the full potential of UA remains to be fully investigated.
Author Contributions
Conceptualization, Y.L., V.C. and F.C.; Methodology, Y.L., V.C. and F.C.; Software, Y.L.; Validation, Y.L.; Formal analysis, Y.L.; Investigation, Y.L.; Resources, Y.L.; Data curation, Y.L.; Writing—original draft, Y.L.; Writing—review & editing, V.C. and F.C.; visualization, Y.L.; Supervision, V.C. and F.C. All authors have read and agreed to the published version of the manuscript.
Funding
This research received no external funding.
Data Availability Statement
The original contributions presented in the study are included in the article, further inquiries can be directed to the corresponding author.
Acknowledgments
The lead author extend sincere gratitude to all participants who completed the questionnaire or engaged in conversations, whose contributions were instrumental to the completion of this study. Appreciation is also extended to the Wellington City Council for their assistance in data collection and for providing valuable contextual insights that supported the research. The authors gratefully acknowledge the financial support provided by Te Kura Waihanga Wellington School of Architecture for this research. The lead author also thanks Te Hiranga Rū QuakeCoRE, a New Zealand Tertiary Education Commission-funded Centre, for providing travel funding that made this work possible.
Conflicts of Interest
The authors declare no conflicts of interest.
| 1 | Conventional farming is a high-input, industrialised system that heavily relies on external resources and energy, often at the expense of environmental sustainability [63]. |
| 2 | This scenario considers only single-unit parcels (designed for one household) and vacant parcels (undeveloped) in residential zone, as these are the zones currently permitted for UA activities under Wellington’s district plan and are more likely to offer sufficient space for cultivation [105], [106]. |
References
- C. B. Barrett, “Overcoming Global Food Security Challenges through Science and Solidarity,” American J Agri Economics, vol. 103, no. 2, pp. 422–447, Mar. 2021. [CrossRef]
- A.A. Bradford, F. Hoekstra, and R. van Veenhuizen, “Linking Relief, Rehabilitation and Development: A role for urban agriculture?,” Urban Agriculture Magazine, no. 21, p. 8, 2009.
- Atta-ur-Rahman, G. A. Parvin, R. Shaw, and A. Surjan, “Cities, Vulnerability, and Climate Change,” in Urban Disasters and Resilience in Asia, Elsevier, 2016, pp. 35–47. [CrossRef]
- M. Peyravi, M. A. Marzaleh, and A. Khorram-Manesh, “Food Safety and Security,” in Handbook of Disaster and Emergency Management, 2nd ed., Sweden: Kompendiet, 2021, pp. 20–29.
- P. J. Ericksen, “Conceptualizing food systems for global environmental change research,” Global Environmental Change, vol. 18, no. 1, pp. 234–245, Feb. 2008. [CrossRef]
- T. Nakazawa and S. Beppu, “Mindset Change from Emergency Food to Disaster Preparation Food to Support Disaster Survivors,” Science and Technology Trends, vol. 44, pp. 36–54, 2012.
- T. Berno, “Social enterprise, sustainability and community in post-earthquake Christchurch: Exploring the role of local food systems in building resilience,” JEC, vol. 11, no. 1, pp. 149–165, Mar. 2017. [CrossRef]
- Minister for Emergency Management and Recovery, “Report of the Government Inquiry into the Response to the North Island Severe Weather Events,” Mar. 2024. Accessed: Jun. 24, 2024. [Online]. Available: https://www.dia.govt.nz/diawebsite.nsf/Files/Government-Inquiry-into-Severe-Weather-Events/$file/Report-of-the-Government-Inquiry-into-the-Response-to-the-North-Island-Severe-Weather-Events.pdf.
- G. Sioen, M. Sekiyama, T. Terada, and M. Yokohari, “Post-Disaster Food and Nutrition from Urban Agriculture: A Self-Sufficiency Analysis of Nerima Ward, Tokyo,” IJERPH, vol. 14, no. 7, p. 748. 2017. [CrossRef]
- T. Slater and S. J. Birchall, “Growing resilient: The potential of urban agriculture for increasing food security and improving earthquake recovery,” Cities, vol. 131, p. 103930, Dec. 2022. [CrossRef]
- F. Ranghieri and M. Ishiwatari, Eds., Learning from Megadisasters: Lessons from the Great East Japan Earthquake. The World Bank, 2014. [CrossRef]
- K. Wasley, “Pre-disaster Recovery Planning Lessons from Japan,” University of Otago, Dunedin, 2013.
- WREMO, “WREMO – What we do.” Accessed: Jun. 21, 2023. [Online]. Available: https://wremo.nz/.
- J. N. Pierre-Louis, “Food Security and Nutrition in Emergencies,” in Public Health Guide for Emergencies, Boston, MA: The Johns Hopkins and the International Federation of Red Cross and Red Crescent Societies, 2008, pp. 442–485.
- R. van Veenhuizen, Ed., Cities farming for the future: urban agriculture for green and productive cities. Silang, Philippines : Ottawa: RUAF Foundation, IDRC and IIRR, 2006.
- C. Eigenbrod and N. Gruda, “Urban vegetable for food security in cities. A review,” Agron. Sustain. Dev., vol. 35, no. 2, pp. 483–498, Apr. 2015. [CrossRef]
- FAO, Urban and peri-urban agriculture sourcebook– From production to food systems. Rome: FAO, 2022. [CrossRef]
- K. Bohn and A. Viljoen, “The Edible City: Envisioning the Continuous Productive Urban Landscape (CPUL),” field, vol. 4, no. 1, pp. 149–161, 2016.
- K. H. Clark and K. A. Nicholas, “Introducing urban food forestry: a multifunctional approach to increase food security and provide ecosystem services,” Landscape Ecol, vol. 28, no. 9, pp. 1649–1669, Nov. 2013. [CrossRef]
- R. Kortright and S. Wakefield, “Edible backyards: a qualitative study of household food growing and its contributions to food security,” Agric Hum Values, vol. 28, no. 1, pp. 39–53, Feb. 2011. [CrossRef]
- L. J. Lawson, “Garden for Victory! The American Victory Garden Campaign of World War II,” in Greening in the Red Zone, Dordrecht: Springer Netherlands, 2013.
- V. Schoen et al., “‘We Have Been Part of the Response’: The Effects of COVID-19 on Community and Allotment Gardens in the Global North,” Front. Sustain. Food Syst., vol. 5, p. 732641, Oct. 2021. [CrossRef]
- N. Shimpo, A. Wesener, and W. McWilliam, “How community gardens may contribute to community resilience following an earthquake,” Urban Forestry & Urban Greening, vol. 38, pp. 124–132, Feb. 2019. [CrossRef]
- A. Wesener, “Growing Resilient Cities Urban Community Gardens and Disaster Recovery after the 2010/11 Canterbury/Christchurch Earthquakes,” in Urban Resilience in a Global Context, Bielefeld: Transcript Verlag, 2020, pp. 77–100.
- FAO, “Food, agriculture and cities Challenges of food and nutrition security, agriculture and ecosystem management in an urbanizing world.” 2011. Accessed: Jan. 06, 2023. [Online]. Available: http://www.fao.org/file admin/templates/FCIT/PDF/FoodAgriCities_Oct2011.pdf.
- CDEM, “National Hazardscape Report,” Officials’ Committee for Domestic and External Security Coordination, Wellington, N.Z., 2007.
- E. McSaveney and S. Nathan, “Natural hazards – overview,” Te Ara – the Encyclopedia of New Zealand. Accessed: Jun. 24, 2024. [Online]. Available: https://teara.govt.nz/mi/natural-hazards-overview/print.
- Extreme Weather Research Platform, “Food systems security and disaster recovery.” Resilience to Nature’s Challenges National Science Challenge, New Zealand, 2024.
- A. Wesener, “Crisis and Green Urban Development: Urban Agriculture and Post-Earthquake Urban Resilience in Christchurch, New Zealand,” presented at the REAL CORP 2023, Ljubljana, Slovenia, 2023.
- Y. Liu, V. Chanse, and F. Chicca, “Enhancing Post-Disaster Food Security through Urban Agriculture in the Context of Climate Change,” Land, vol. 14, Apr. 2025. [CrossRef]
- Z. Lee, “Post-Disaster Recovery Efforts in Japan and New Zealand: What worked well? What hasn’t?,” University of Otago, Dunedin, New Zealand, 2019. Accessed: Feb. 02, 2023. [Online]. Available: https://ourarchive.otago.ac.nz/bitstream/handle/10523/10200/LeeZheng2019MPlan.pdf?sequence=1&isAllowed=y.
- WREMO, “Group Plan 2019–2024.” Wellington Region Civil Defence Emergency Management Group, 2019. Accessed: Sep. 25, 2024. [Online]. Available: https://www.wremo.nz/assets/Library/Strategies-Plans/Group-Plan-2019-2024.pdf.
- D. Johnston et al., “Community Understanding of, and Preparedness for, Earthquake and Tsunami Risk in Wellington, New Zealand,” in Cities at Risk, vol. 33, H. Joffe, T. Rossetto, and J. Adams, Eds., in Advances in Natural and Technological Hazards Research, vol. 33., Dordrecht: Springer Netherlands, 2013, pp. 131–148. [CrossRef]
- A.E. Wallis, “No Place Like Home: The Role of Place Attachment in Increasing Individual Preparedness for Natural Hazard Events,” VUW, Wellington, NZ, 2020. Accessed: Sep. 25, 2024. [Online]. Available: https://openaccess.wgtn.ac.nz/articles/thesis/No_place_like_home_The_role_of_place_attachment_in_increasing_individual_preparedness_for_natural_hazard_events/17151683?file=31713794.
- K. Duignan, “Edible Wellington Snapshot,” Wellington City Council, 2011.
- Ministry of Civil Defence & Emergency Management, Wellington Earthquake National Initial Response Plan: supporting plan, Version 2.0, December 2018. Wellington, New Zealand: Ministry of Civil Defence & Emergency Management, 2018.
- AECOM NZL, “Sustainable Food Opportunities for Wellington,” Wellington City Council, 2018.
- WCC, “Our City’s Food Future - Background document,” Wellington City Council, 2023.
- Wellington Regional Growth Framework., “Framework Report 2021,” 2021. Accessed: Jan. 18, 2025. [Online]. Available: https://wrgf.co.nz/wp-content/uploads/2021/08/1320-Wellington-Regional-Growth-Framework-Report-JULY-2021-FINAL-LR.
- M. Cubrinovski et al., “Wellington’s earthquake resilience: Lessons from the 2016 Kaikōura earthquake,” Earthquake Spectra, vol. 36, no. 3, pp. 1448–1484, Aug. 2020. [CrossRef]
- F. Chicca, E. Garcia, and B. Vale, “Sustainability, Resilience, and the Contribution of Private Urban Gardens,” Urban and Regional Planning, vol. 7(4), pp. 187–197. 2022. [CrossRef]
- N. Bakshi, L. Ellison, M. Fletcher, B. Vale, and A. Brown, “Beyond the Community Garden,” Centre for Building Performance Research, Victoria University of Wellington, 2020.
- WCC, “A Seed and A Wish-Urban Agriculture in Wellington,” 2014.
- J. A. (Tony) Binns and E. Nel, “The significance of urban agriculture in food security and sustainable livelihoods.” NZAID, 2013. [Online]. Available: https://www.mfat.govt.nz/assets/Aid-Prog-docs/Research/The-significance-of-urban-agriculture-in-food-security-and-sustainable-livelihoods.
- WCC, “Wellington’s sustainable food initiative.” Accessed: Sep. 25, 2024. [Online]. Available: https://wellington.govt.nz/climate-change-sustainability-environment/sustainable-living/sustainable-food-initiative.
- WCC, “Community garden listings,” Community garden locations. Accessed: Jun. 21, 2023. [Online]. Available: https://wellington.govt.
- L. Holland, “Diversity and connections in community gardens: a contribution to local sustainability,” Local Environment, vol. 9, no. 3, pp. 285–305, Jun. 2004. [CrossRef]
- Opitz, R. Berges, A. Piorr, and T. Krikser, “Contributing to food security in urban areas: differences between urban agriculture and peri-urban agriculture in the Global North,” Agric Hum Values, vol. 33, no. 2, pp. 341–358, Jun. 2016. [Google Scholar] [CrossRef]
- S. S. Grewal and P. S. Grewal, “Can cities become self-reliant in food?,” Cities, vol. 29, no. 1, pp. 1–11, Feb. 2012. [CrossRef]
- J. L. Edmondson, D. Z. Childs, M. C. Dobson, K. J. Gaston, P. H. Warren, and J. R. Leake, “Feeding a city – Leicester as a case study of the importance of allotments for horticultural production in the UK,” Science of The Total Environment, vol. 705, p. 135930, 2019. [CrossRef]
- M. CoDyre, E. D. G. Fraser, and K. Landman, “How does your garden grow? An empirical evaluation of the costs and potential of urban gardening,” Urban Forestry & Urban Greening, vol. 14, no. 1, pp. 72–79, 2015. [CrossRef]
- D. Haberman, L. Gillies, A. Canter, V. Rinner, L. Pancrazi, and F. Martellozzo, “The Potential of Urban Agriculture in Montréal: A Quantitative Assessment,” IJGI, vol. 3, no. 3, pp. 1101–1117, Sep. 2014. [CrossRef]
- F. Martellozzo, J.-S. Landry, D. Plouffe, V. Seufert, P. Rowhani, and N. Ramankutty, “Urban agriculture: a global analysis of the space constraint to meet urban vegetable demand,” Environ. Res. Lett., vol. 9, no. 6, p. 064025, May 2014. [CrossRef]
- N. J. Kennard and R. H. Bamford, Eds., “Urban Agriculture: Opportunities and Challenges for Sustainable Development,” in Zero Hunger, 1st ed., in Encyclopedia of the UN Sustainable Development Goals., Cham: Springer Cham, 2020, pp. 929–952. [CrossRef]
- A. Baldi, N. L. Gallo, and A. Lenzi, “Productive function of urban gardening: estimate of the yield and nutritional value of social gardens in Prato (Italy),” Renew. Agric. Food Syst., vol. 39, p. e4, 2024. [CrossRef]
- G. Sioen, T. Terada, M. Sekiyama, and M. Yokohari, “Resilience with Mixed Agricultural and Urban Land Uses in Tokyo, Japan,” Sustainability, vol. 10, no. 2, p. 435, Feb. 2018. [CrossRef]
- G. Csortan, J. Ward, and P. Roetman, “Productivity, resource efficiency and financial savings: An investigation of the current capabilities and potential of South Australian home food gardens,” PLoS ONE, vol. 15, no. 4, p. e0230232, Apr. 2020. [CrossRef]
- L. O. Diekmann, L. C. Gray, and G. A. Baker, “Growing ‘good food’: urban gardens, culturally acceptable produce and food security,” Renew. Agric. Food Syst., vol. 35, no. 2, pp. 169–181. 2018. [CrossRef]
- R. Mcdougall, R. Rader, and P. Kristiansen, “Urban agriculture could provide 15% of food supply to Sydney, Australia, under expanded land use scenarios,” Land Use Policy, vol. 94, p. 104554, May 2020. [CrossRef]
- S. J. Algert, A. Baameur, L. O. Diekmann, L. Gray, and D. Ortiz, “Vegetable Output, Cost Savings, and Nutritional Value of Low-Income Families’ Home Gardens in San Jose, CA,” Journal of Hunger & Environmental Nutrition, vol. 11, no. 3, pp. 328–336, Jul. 2016. [CrossRef]
- S. J. Conk and C. M. Porter, “Food Gardeners’ Productivity in Laramie, Wyoming: More Than a Hobby,” Am J Public Health, vol. 106, no. 5, pp. 854–856, May 2016. [CrossRef]
- E. Nicholls, A. Ely, L. Birkin, P. Basu, and D. Goulson, “The contribution of small-scale food production in urban areas to the sustainable development goals: a review and case study,” Sustain Sci, vol. 15, no. 6, pp. 1585–1599, Nov. 2020. [CrossRef]
- V. Aćin, M. Mirosavljević, D. Živančev, B. Jocković, L. Brbaklić, and G. Jaćimović, “Field management practices to produce nutritional and healthier main crops,” in Developing Sustainable and Health Promoting Cereals and Pseudocereals, Elsevier, 2023, pp. 137–173. [CrossRef]
- T. Weidner, A. Yang, and M. W. Hamm, “Consolidating the current knowledge on urban agriculture in productive urban food systems: Learnings, gaps and outlook,” Journal of Cleaner Production, vol. 209, pp. 1637–1655, Feb. 2019. [CrossRef]
- E. Duchemin, F. Wegmuller, and A.-M. Legault, “Urban agriculture: multi-dimensional tools for social development in poor neighbourhoods,” Field Actions Science Reports, vol. 1, 2009, Accessed: Apr. 04, 2023. [Online]. Available: http://journals.openedition.
- J. Pourias, E. Duchemin, and C. Aubry, “Products from Urban Collective Gardens: Food for Thought or for Consumption? Insights from Paris and Montreal,” JAFSCD, pp. 1–25, Feb. 2015. [CrossRef]
- M. Gittleman, K. Jordan, and E. Brelsford, “Using Citizen Science to Quantify Community Garden Crop Yields,” CATE, vol. 5, no. 1, pp. 1–14, 2012. [CrossRef]
- S. Caputo, V. Schoen, and C. Blythe, “Productivity and Efficiency of Community Gardens: Case Studies from the UK,” Land, vol. 12, no. 1, p. 238, Jan. 2023. [CrossRef]
- Tahara S., Yokohari M., Kurita H., and Terada T., “A quantitative assessment of agricultural production from allotment gardens-都市住民の農園における生産活動がもたらす農作物の生産量の推定とその評価,” Journal of the Japanese Institute of Landscape Architecture, vol. 74, no. 5, pp. 685–688, 2011.
- Y. Hara, A. Murakami, K. Tsuchiya, A. M. Palijon, and M. Yokohari, “A quantitative assessment of vegetable farming on vacant lots in an urban fringe area in Metro Manila: Can it sustain long-term local vegetable demand?,” Applied Geography, vol. 41, pp. 195–206, Jul. 2013. [CrossRef]
- V. Hume, D. M. Summers, and T. R. Cavagnaro, “Self-sufficiency through urban agriculture: Nice idea or plausible reality?,” Sustainable Cities and Society, vol. 68, p. 102770, May 2021. [CrossRef]
- S. Ghosh, “Measuring sustainability performance of local food production in home gardens,” Local Environment, vol. 19, no. 1, pp. 33–55, Jan. 2014. [CrossRef]
- R. MacRae, E. Gallant, S. Patel, M. Michalak, M. Bunch, and S. Schaffner, “Could Toronto provide 10% of its fresh vegetable requirements from within its own boundaries? Matching consumption requirements with growing spaces,” JAFSCD, pp. 105–127, Dec. 2010. [CrossRef]
- T. Weidner and A. Yang, “The potential of urban agriculture in combination with organic waste valorization: Assessment of resource flows and emissions for two european cities,” Journal of Cleaner Production, vol. 244, p. 118490, Jan. 2020. [CrossRef]
- M. Glavan et al., “The economic performance of urban gardening in three European cities – examples from Ljubljana, Milan and London,” Urban Forestry & Urban Greening, vol. 36, pp. 100–122, Dec. 2018. [CrossRef]
- Ministry of Health, Eating and Activity Guidelines for New Zealand Adults, Updated 2020. Wellington, New Zealand: Ministry of Health, 2020.
- Stats NZ, “Subnational population estimates (TA, subdivision), by age and sex, at 30 June 2018-2023 (2023 boundaries).” Accessed: Aug. 07, 2024. [Online]. Available: https://nzdotstat.stats.govt.nz/wbos/Index.aspx?DataSetCode=TABLECODE7981#.
- Stats NZ, “2018 Census Individual (part 1) total New Zealand by Statistical Area 1.” Accessed: Aug. 16, 2024. [Online]. Available: https://datafinder.stats.govt.nz/layer/104612-2018-census-individual-part-1-total-new-zealand-by-statistical-area-1/.
- D. I. Azmi, H. A. Karim, and M. Z. M. Amin, “Comparing the Walking Behaviour between Urban and Rural Residents,” Procedia - Social and Behavioral Sciences, vol. 68, pp. 406–416, Dec. 2012. [CrossRef]
- R. Daniels and C. Mulley, “Explaining walking distance to public transport: The dominance of public transport supply,” JTLU, vol. 6, no. 2, pp. 5–20, Aug. 2013. [CrossRef]
- Stats NZ, “Review of 2018 statistical geographies.” [Online]. Available: https://www.stats.govt.nz/consultations/review-of-2018-statistical-geographies/. 2018.
- WCC, “The State of Housing in Wellington City,” 2024. [Online]. Available: https://wellington.govt.nz/-/media/your-council/projects/files/state-of-housing/the-state-of-housing-infographic-report.pdf?la=en&hash=3FD8872E71A4D1D2B584E63FCC061508661B881A.
- NHMRC, Nutrient Reference Values for Australia and New Zealand. National Health and Medical Research Council, 2006.
- University of Otago and Ministry of Health, “A Focus on Nutrition: Key findings of the 2008/09 New Zealand Adult Nutrition Survey,” Ministry of Health, Wellington, 2011. Accessed: Oct. 07, 2024. [Online]. Available: http://www.moh.govt.nz.
- NZ Institute for Plant & Food Research Limited and Ministry of Health, The Concise New Zealand Food Composition Tables, 14th ed. 2021. Accessed: Apr. 07, 2024. [Online]. Available: https://www.foodcomposition.co.nz/downloads/concise-14-edition.pdf.
- Vegetables.co.nz, “Vegetable nutrition.” Accessed: Aug. 07, 2024. [Online]. Available: https://www.vegetables.co.nz/healthy-living/health/vegetable-nutrition/.
- K. J. A. Colasanti and M. W. Hamm, “Assessing the local food supply capacity of Detroit, Michigan,” Journal of Agriculture, Food Systems, and Community Development, vol. 1, no. 2, pp. 41–58, 2010. [CrossRef]
- C. Costello, Z. Oveysi, B. Dundar, and R. McGarvey, “Assessment of the Effect of Urban Agriculture on Achieving a Localized Food System Centered on Chicago, IL Using Robust Optimization,” Environ. Sci. Technol., vol. 55, no. 4, pp. 2684–2694, Feb. 2021. [CrossRef]
- U.S. Census Bureau, “QuickFacts: Cleveland city, Ohio.” Accessed: Jan. 18, 2025. [Online]. Available: https://www.census.gov/quickfacts/.
- Statistics Canada, “2021 Census of Population geographic summary.” Accessed: Aug. 13, 2023. [Online]. Available: https://www12.statcan.gc.ca/census-recensement/2021/search-recherche/productresults-resultatsproduits-eng.cfm?LANG=EGEOCODE=2021A00053523008#producttable. 2021.
- N. Bakshi, F. Chicca, A. Brown, and M. Fletcher, “Facilitating community gardening and urban agriculture-A systematic review of master planning strategies that bring about positive outcomes for the communal space,” Centre for Building Performance Research, Victoria University of Wellington, Wellington, 2019.
- WCC, “Stone Soup Funding Past Allocations,” 2024. Accessed: Aug. 08, 2024. [Online]. Available: https://wellington.govt.nz/community-support-and-resources/community-support/funding/council-funds/stone-soup-fund.
- E. Dorr, B. Goldstein, A. Horvath, C. Aubry, and B. Gabrielle, “Environmental impacts and resource use of urban agriculture: a systematic review and meta-analysis,” Environ. Res. Lett., vol. 16, no. 9, p. 093002, Sep. 2021. [CrossRef]
- C. Hanna and P. Wallace, “Planning the urban foodscape: policy and regulation of urban agriculture in Aotearoa New Zealand,” Kōtuitui: New Zealand Journal of Social Sciences Online, vol. 17, no. 3, pp. 313–335, Jul. 2022. [CrossRef]
- Y. Hara, T. McPhearson, Y. Sampei, and B. McGrath, “Assessing urban agriculture potential: a comparative study of Osaka, Japan and New York city, United States,” Sustain Sci, vol. 13, no. 4, pp. 937–952, Jul. 2018. [CrossRef]
- K. Hino, T. Yamazaki, A. Iida, K. Harada, and M. Yokohari, “Productive urban landscapes contribute to physical activity promotion among Tokyo residents,” Landscape and Urban Planning, vol. 230, p. 104634, Feb. 2023. [CrossRef]
- Tokyo Metropolitan Government, “Tokyo Metropolitan Government Greenery Initiative,” 2023.
- L. Enríquez, “Cuba’s new agricultural revolution: the transformation of food crop production in contemporary Cuba,” Food First Institute for Food and Development Policy., USA, Development Report No. 14, 2000. Accessed: Aug. 22, 2024. [Online]. Available: https://archive.foodfirst.org/wp-content/uploads/2013/12/DR14-Cubas-New-Agricultural-Revolution.pdf.
- Y. Rydin et al., “Shaping cities for health: complexity and the planning of urban environments in the 21st century,” The Lancet, vol. 379, no. 9831, pp. 2079–2108, Jun. 2012. [CrossRef]
- C. Clouse, “Urban Farming in Cuba,” in Urban Agriculture from the Ground Up, Princeton Architectural Press, 2014, pp. 33–69.
- Global Research, “Our City, Tomorrow Integrating sustainable food and green spaces workshop synthesis and analysis,” Wellington City Council, 2017.
- WCC, “Wellington Resilience Strategy.” 2017. Accessed: Feb. 08, 2024. [Online]. Available: https://resilientcitiesnetwork.org/downloadable_resources/Network/Wellington-Resilience-Strategy-English.pdf.
- J. L. Wilkins, T. J. Farrell, and A. Rangarajan, “Linking vegetable preferences, health and local food systems through community-supported agriculture,” Public Health Nutr., vol. 18, no. 13, pp. 2392–2401, Sep. 2015. [CrossRef]
- N. Tsuboyama-Kasaoka and M. B. Purba, “Nutrition and Earthquakes: Experience and Recommendations,” Asia Pacific Journal of Clinical Nutrition, vol. 23, no. 4, pp. 2014. [CrossRef]
- LINZ, “Rating Valuations Rules 2008.” LINZS, 2010. Accessed: Jan. 12, 2025. [Online]. Available: https://www.linz.govt.nz/sites/default/files/30300-Rating%2520Valuations%2520Rules%25202008-%2520version%2520date%25201%2520October%25202010%2520-%2520LINZS30300_0.pdf.
- WCC, “Wellington City 2024 District Plan: Appeals Version.” Accessed: Sep. 18, 2024. [Online]. Available: https://eplan.wellington.govt.nz/proposed/.
- J. Chan, B. DuBois, and K. G. Tidball, “Refuges of local resilience: Community gardens in post-Sandy New York City,” Urban Forestry & Urban Greening, vol. 14, no. 3, pp. 625–635. 2015. [CrossRef]
- WREMO, “Community Emergency Hubs.” Accessed: Aug. 20, 2024. [Online]. Available: https://www.wremo.
- R. Montgomery, A. Wesener, and F. Davies, “Bottom-Up Governance after a Natural Disaster: A Temporary PostEarthquake Community Garden in Central Christchurch, New Zealand,” Nordic Journal of Architectural Research, no. 3, pp. 143–173, 2016.
- I. Dawe, “Wellington Region Natural Hazards Management Strategy.” Greater Wellington Regional Council, 2019. [Online]. Available: https://archive.gw.govt.nz/assets/Uploads/Wellington-region-natural-hazards-management-strategyMay-2019.pdf.
Figure 1.
(a) Location of Wellington City; (b) Map of Wellington City and Wellington Region (by authors).
Figure 1.
(a) Location of Wellington City; (b) Map of Wellington City and Wellington Region (by authors).
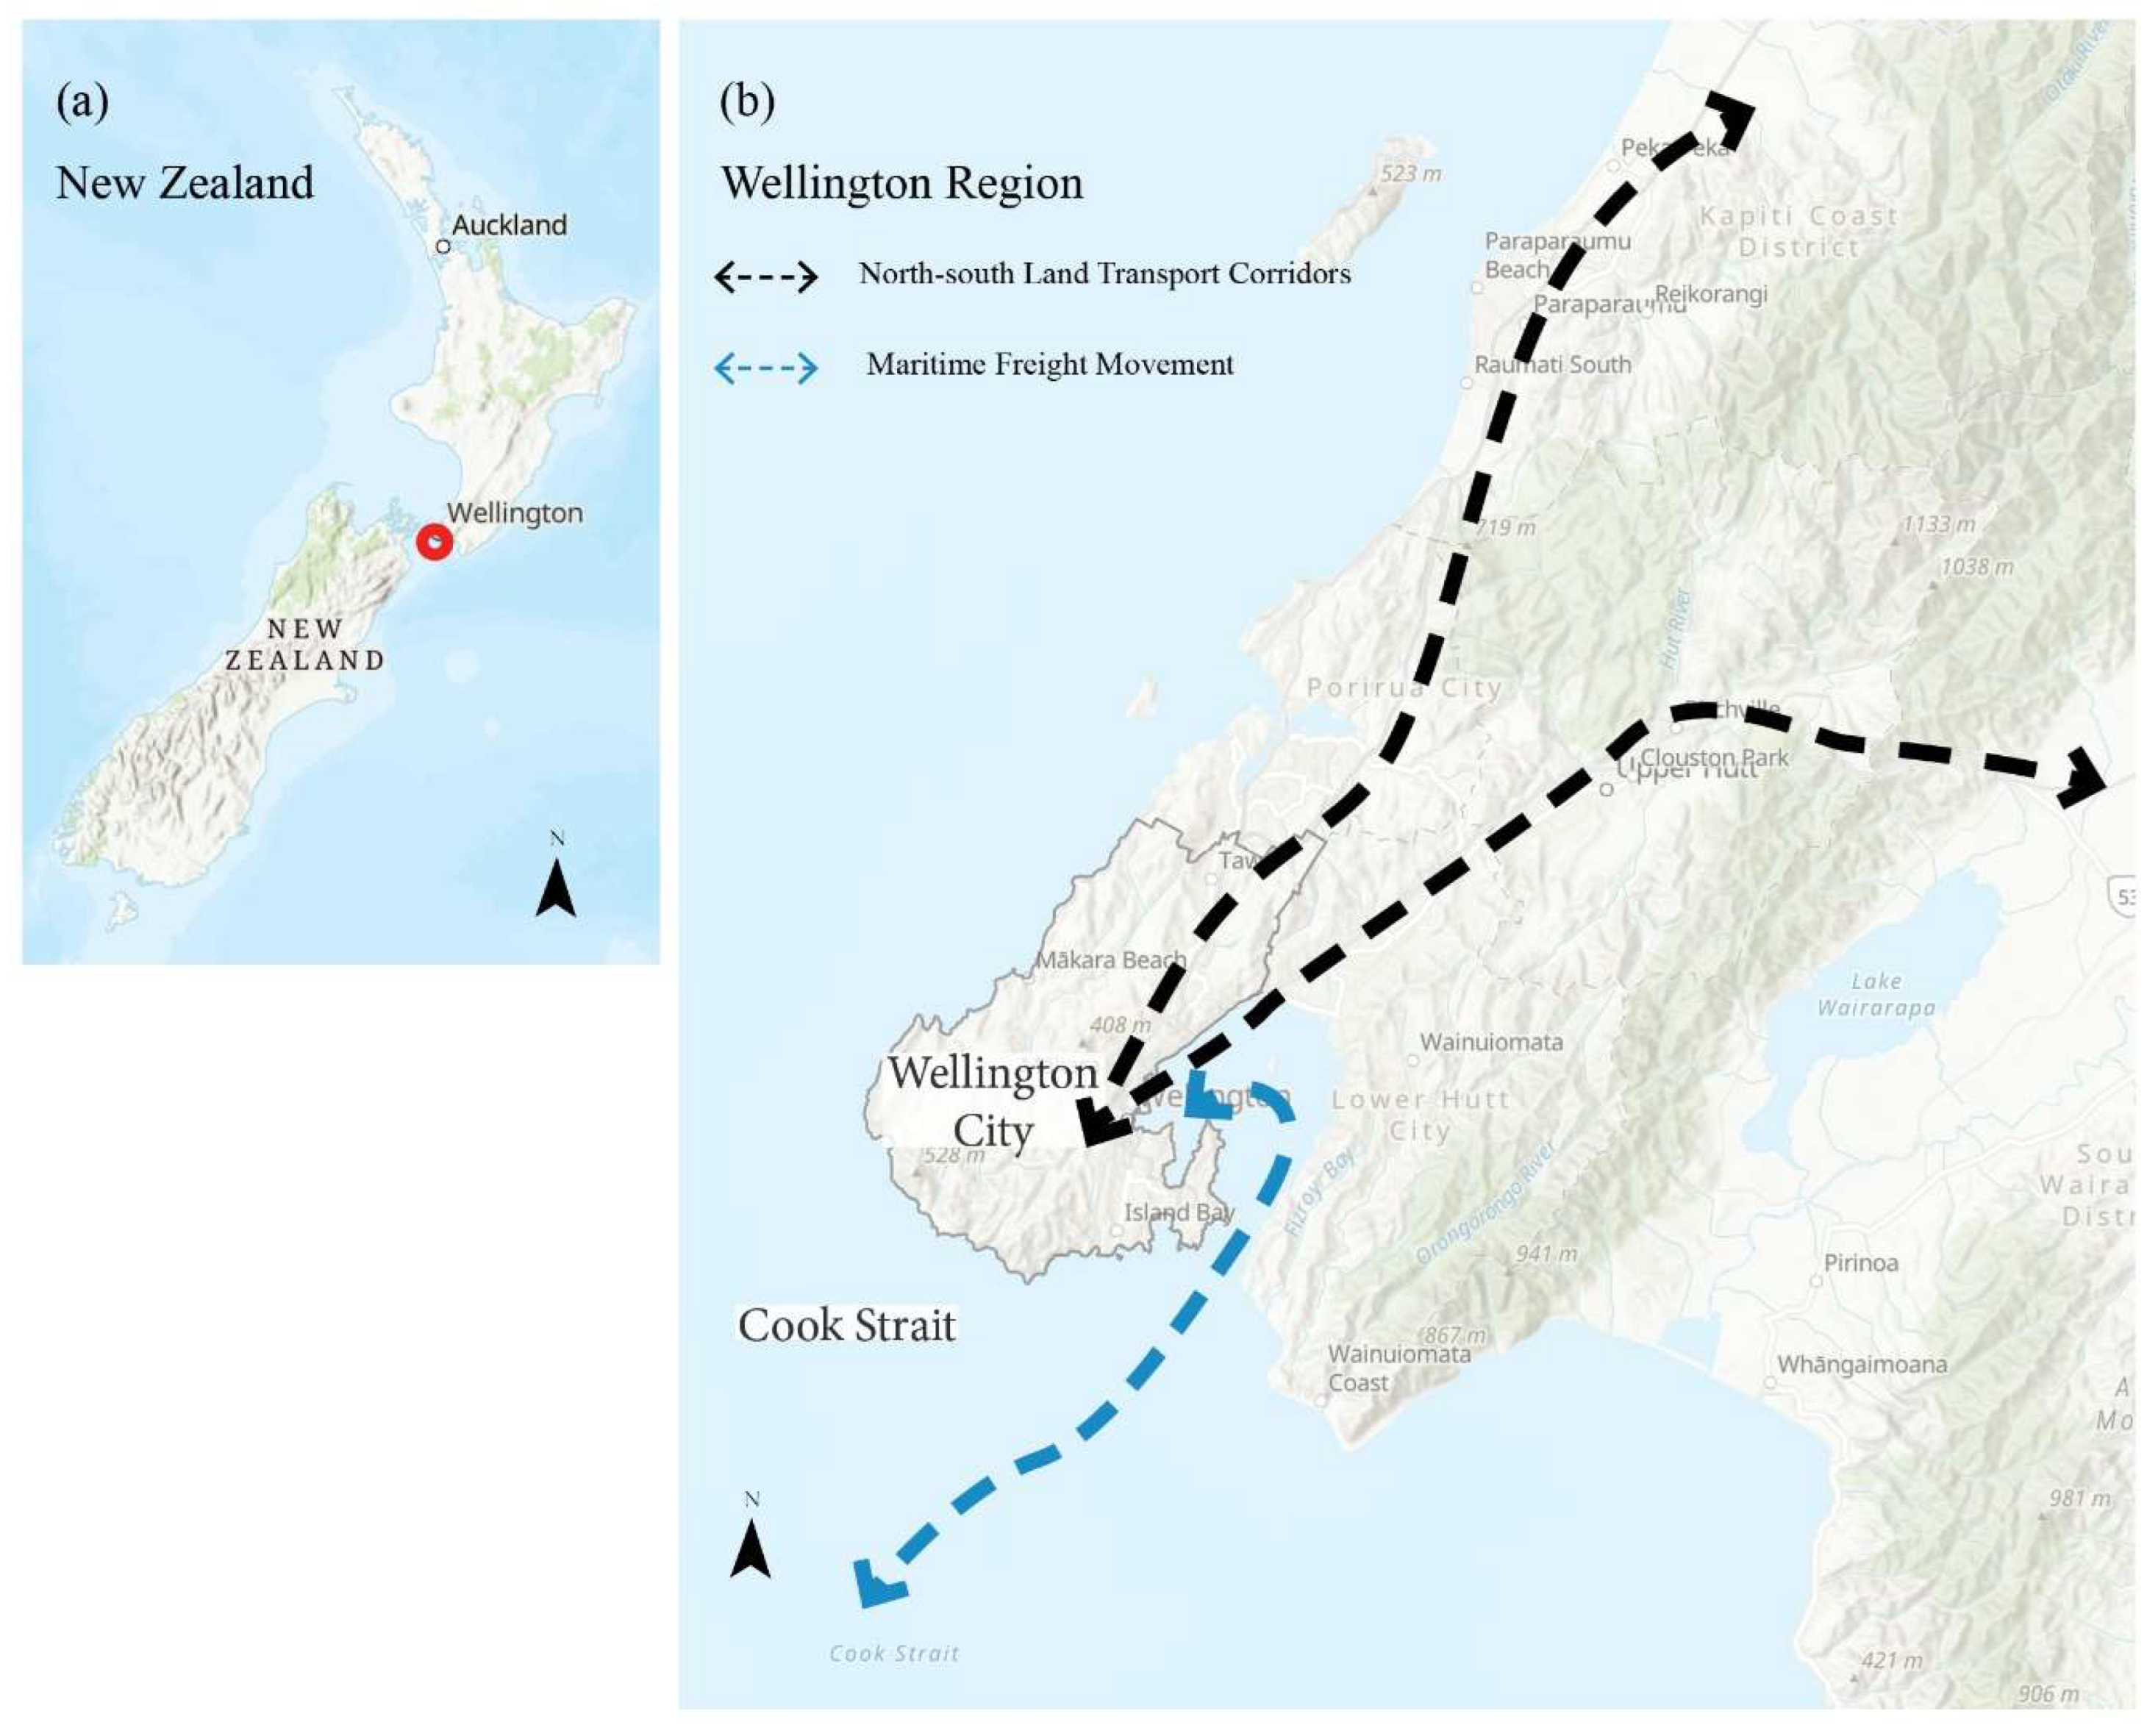
Figure 2.
Study design structure.
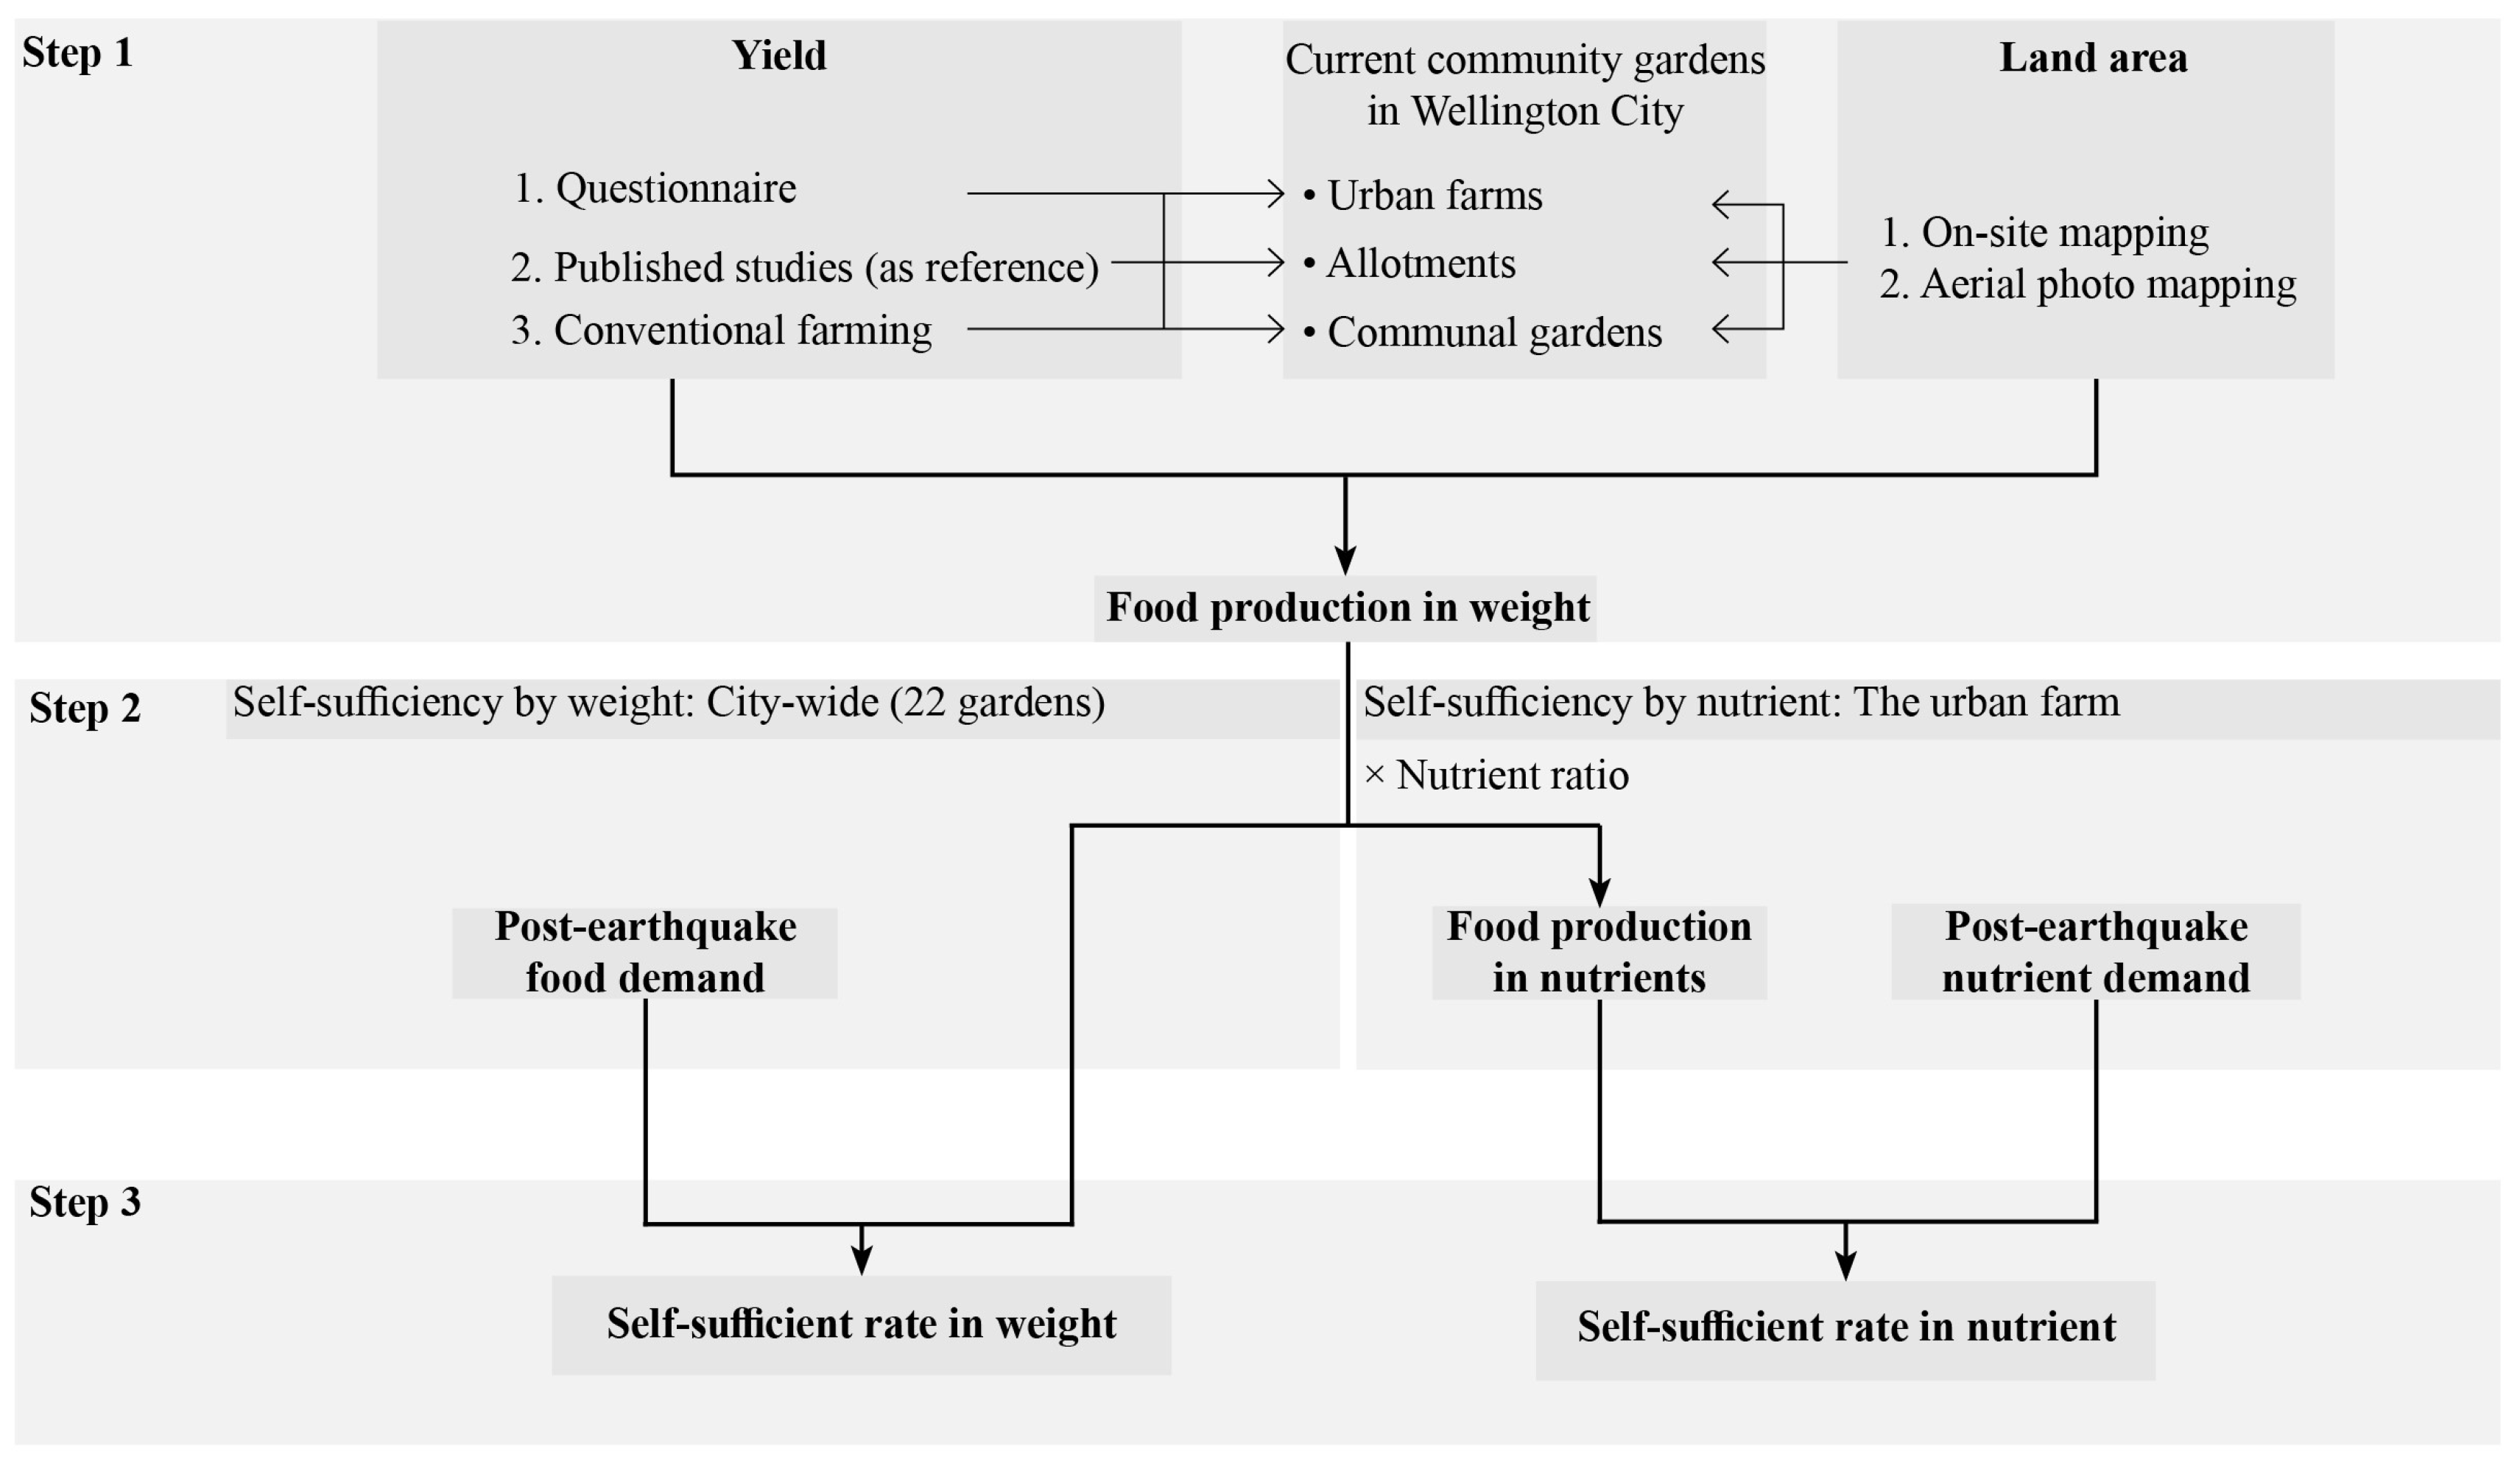
Figure 3.
Distribution of current community gardens in Wellington City.
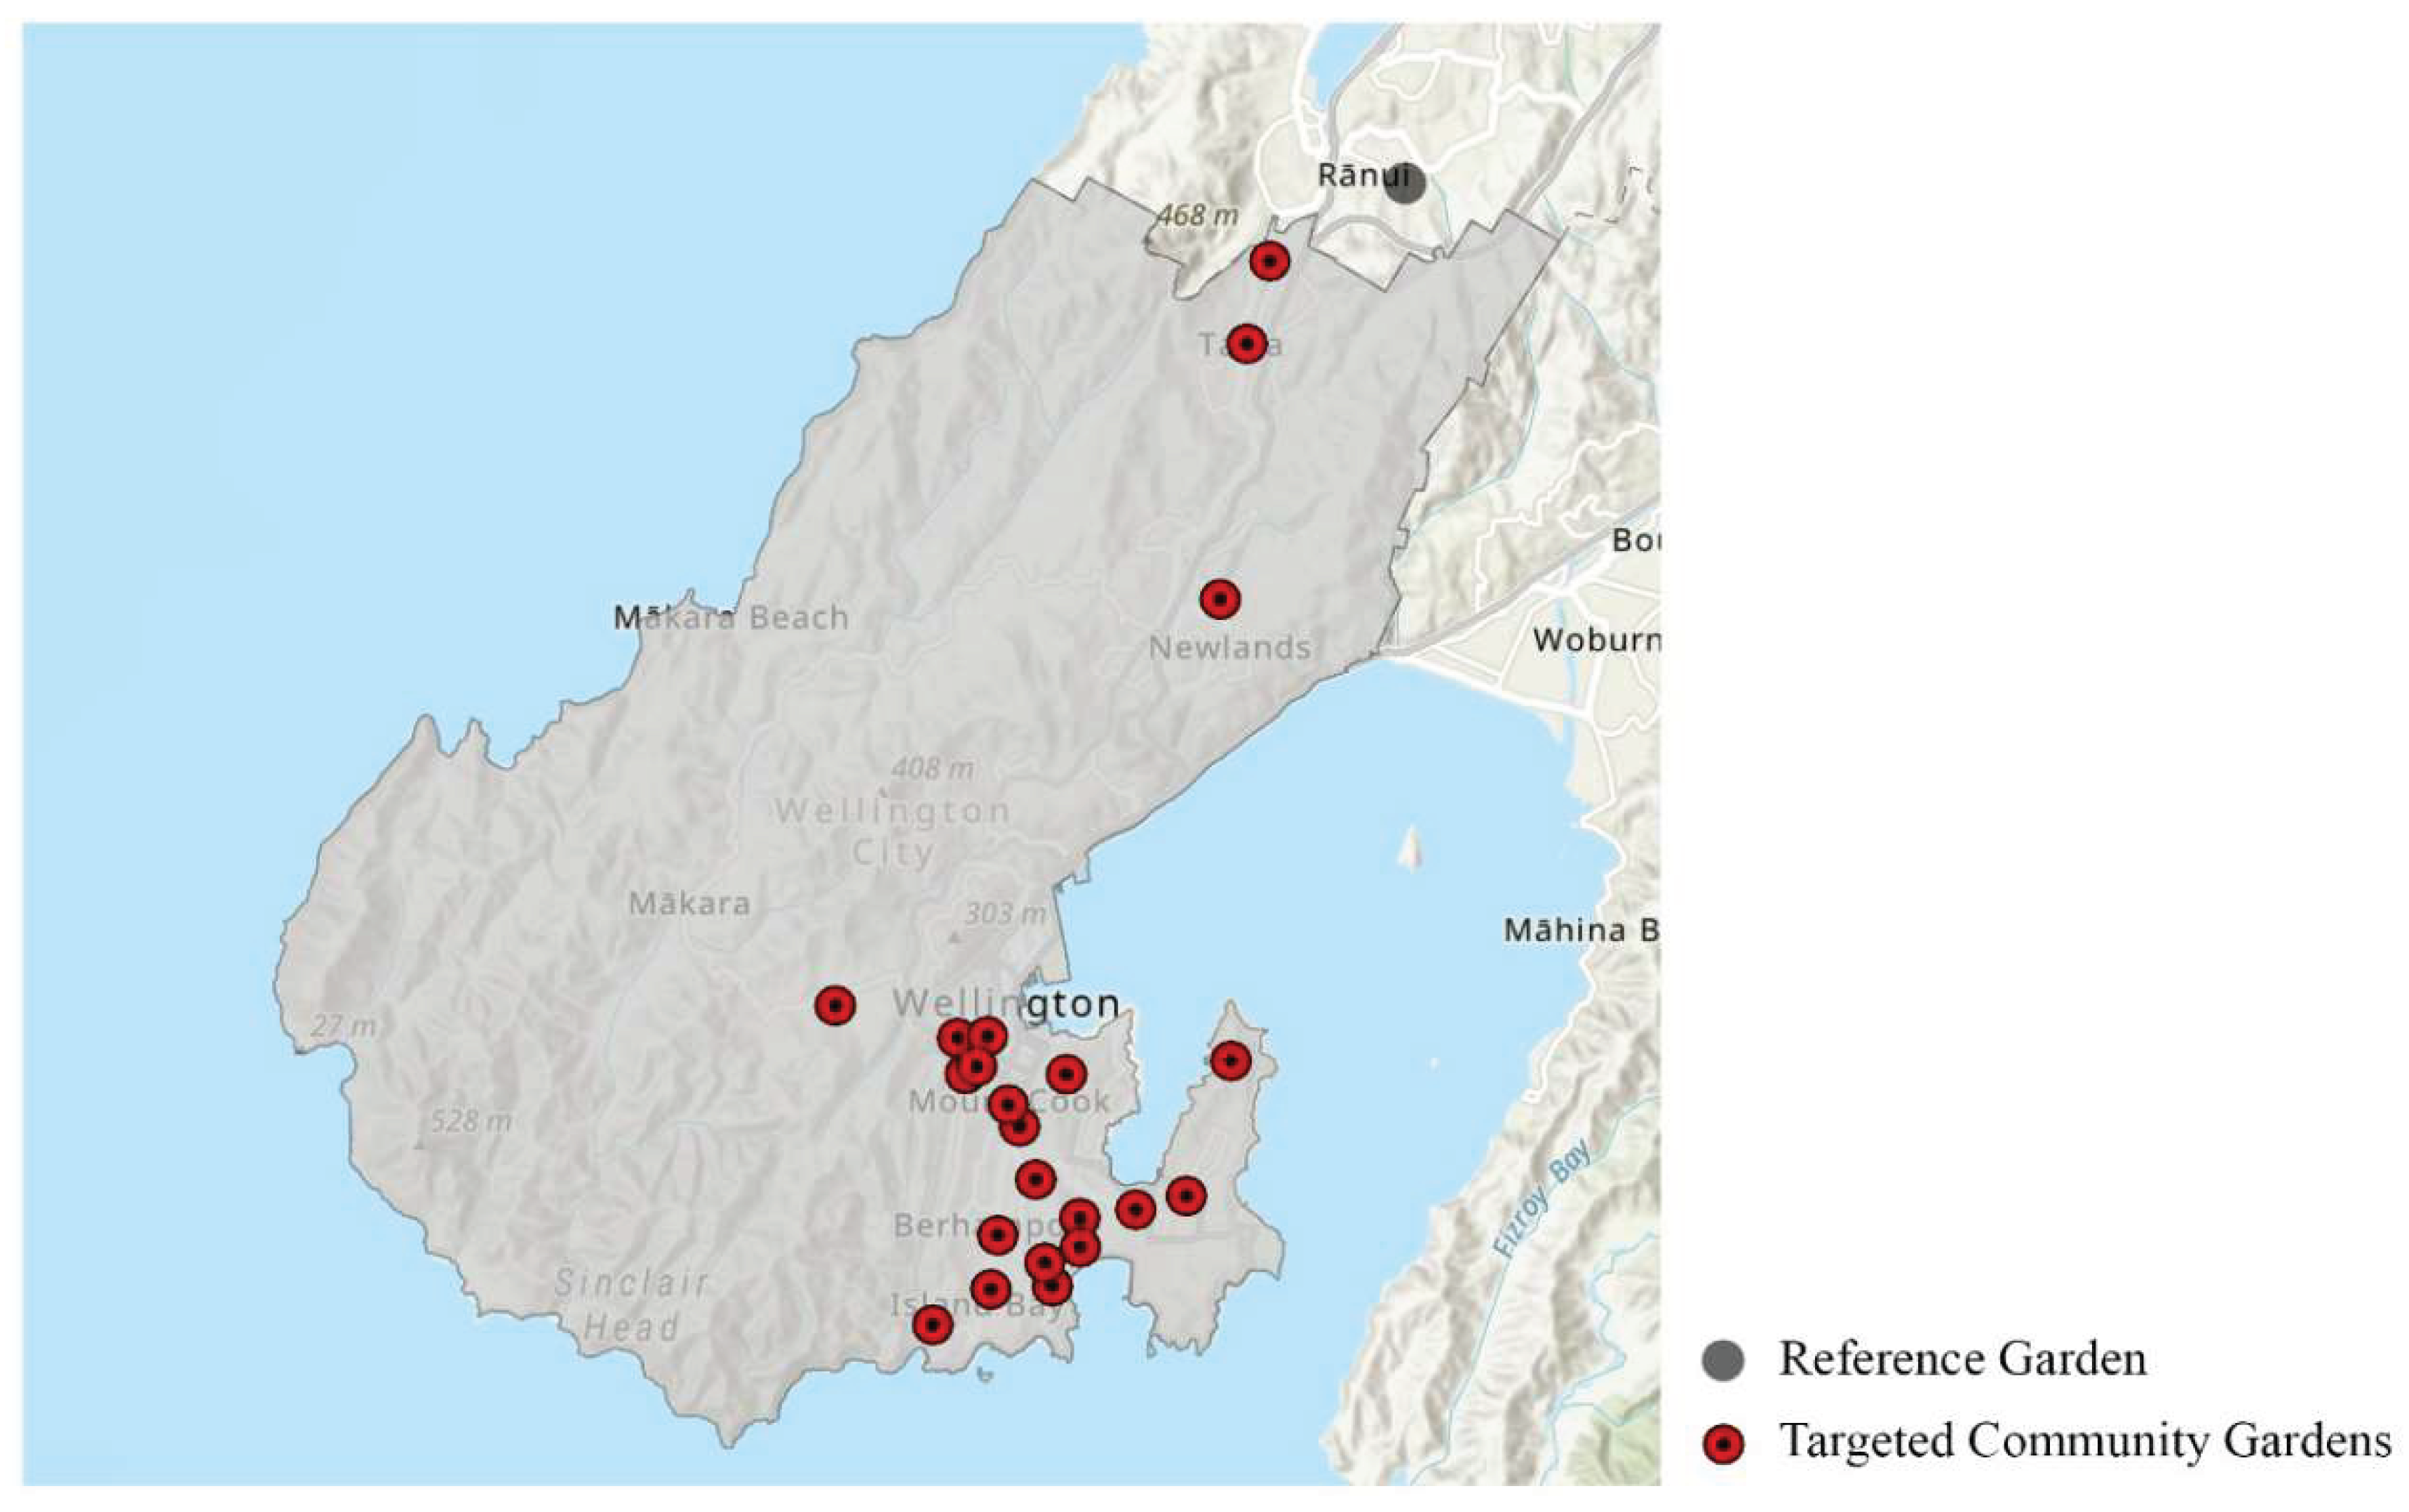

Table 1.
Comparisons of yield data between previous studies, conventional farming and current survey.
Table 1.
Comparisons of yield data between previous studies, conventional farming and current survey.
| Conventional farming data (FAOSTAT, 2022) | 2.5 (Kg/ m²) | ||
| Location | Allotment | Garden numbers | Yield (Kg/ m²) |
| South Australian [57] | Home gardens | 34 gardeners | 3.4 |
| Brighton and Hove, UK [62] | Allotment & Home gardens | 185 gardeners | 1.0 |
| Paris [66] | Family gardens | 7 gardeners | 1.2 |
| San Jose, California, USA [60] | Home gardens | 8 families | 6.0 |
| Laramie, Wyoming, USA [61] | Home gardens | 31 gardeners | 2.4 |
| Leicester, UK [50] | Allotments | 80 allotments | 2.3 |
| Guelph, Canada [51] | Backyard gardeners | 50 gardeners | 1.4 |
| Mean | 2.5 | ||
| Median | 2.3 | ||
| Allotment yield used for this study | 2.5 | ||
| Location | Communal gardens | Garden numbers | Yield (Kg/ m²) |
| Paris [66] | Shared gardens | 7 gardeners | 1.4 |
| Montreal [66] | Community gardens | 14 gardeners | 1.9 |
| New York, USA [67] | Community gardens (2010) | 67 gardens | 5.8 |
| Community gardens (2011) | 43 gardens | 1.6 | |
| UK [68] | Community gardens | 8 gardens/farms | 1.6 |
| Mean | 2.5 | ||
| Median | 1.6 | ||
| Communal garden yield used for this study | 1.9 | ||
| Location | Urban farms | Garden numbers | Yield (Kg/ m²) |
| Chiba & Tokyo, Japan [69] | Urban farms A | 5 farmers | 4.2 |
| Urban farms B | 5 farmers | 8.5 | |
| Manila, the Philippines [70] | Urban farms | 1 urban farm | 3.0 |
| Mean | 5.2 | ||
| Median | 4.2 | ||
| Urban farm yield from current survey | 4.0 | ||
| Urban farm yield used for this study | 4.0 | ||
Table 2.
City-wide demand analysis.
| City-wide food demand in weight | |||
| Minimum daily vegetable intake (g/ day/capita) | Sources | ||
| Vegetable demands | 375 | [76] | |
| Targeted population scenarios | |||
| 1 | Entire population | 216,200 | [77] |
| 2 | Displaced population | 67,000 | [36] |
| 3 | Vulnerable population | 54,300 | [77] |
| 4 | Population within 5-min walking distance of community gardens | 19,273 | [78] |
| 5 | Vulnerable population within 5-min walking distance of community gardens | 3916 | [78] |
| 6 | Gardeners’ families (allotments) | 559 | This study |
Table 3.
Current gardens area analysis.
| Garden No. | Total area (m²) | Cultivated area (m²) | Cultivation percentage |
| Communal gardens | |||
| 1 | 1085 | 85 | 8% |
| 2 | 312 | 229 | 73% |
| 4 | 160 | 11 | 7% |
| 6 | 100 | 14 | 14% |
| 9 | 408 | 34 | 8% |
| 11 | 87.5 | 13 | 14% |
| 15 | 957 | 23 | 2% |
| 16 | 180 | 16 | 9% |
| 17 | 512 | 131 | 26% |
| 18 | 313 | 98 | 31% |
| 20 | 78 | 27 | 35% |
| 21 | 414 | 31 | 7% |
| 22 | 1292 | 13 | 1% |
| 12 | 76 | 43 | 57% |
| 7 | 1291 | 41 | 3% |
| Total | 7265.5 | 809 | 11% |
| Allotment gardens | |||
| 3 | 3038 | 406 | 13% |
| 8 | 575 | 92 | 16% |
| 10 | 326 | 127 | 39% |
| 13 | 2582 | 563 | 22% |
| 14 | 3853 | 1405 | 36% |
| 19 | 2918 | 1420 | 49% |
| Total | 13,292 | 401 | 30% |
| Urban farm | |||
| 5 | 1683 | 606 | 36% |
| Total | 1683 | 606 | 36% |
| All community gardens | |||
| Total | 22,240.5 | 5429 | 24% |
Table 4.
City-wide self-sufficiency rate of Wellington community gardens.
| Post-disaster vegetable demand scenarios (City-wide) | Demands (Kg) | Annual productivity (Kg) | Self-sufficient rate | |
| 1 | Entire population | 29,592,375 | 11,120 | 0.04% |
| 2 | Displaced population | 9,170,625 | 11,120 | 0.12% |
| 3 | Vulnerable population | 7,432,313 | 11,120 | 0.15% |
| 4 | Population within 5-mins walking distance | 2,637,963 | 11,120 | 0.42% |
| 5 | Vulnerable population 5-mins walking distance | 535,980 | 11,120 | 2.07% |
| 6 | Gardeners’ families (allotments) | 76,513 | 7,963 | 10.41% |
Table 5.
Analysis of available nutrients, demands, and self-sufficiency rate of population within 5 minutes walking distance from the urban farm.
Table 5.
Analysis of available nutrients, demands, and self-sufficiency rate of population within 5 minutes walking distance from the urban farm.
| Nutrient | Vitamin A | Vitamin B1 | Vitamin B6 | Vitamin C | Calcium | Potassium | Fibre | Folic acid | Average nutrient self-sufficiency rate | Weight-based self-sufficiency rate |
| Available (Kg) | 0.00322 | 0.00068 | 0.00282 | 0.16580 | 0.73680 | 4.72801 | 31.78184 | 0.00070 | ||
| Demand for all (Kg) | 0.29087 | 0.41994 | 0.49426 | 16.51124 | 394.46450 | 1204.14995 | 9983.72273 | 0.14591 | ||
| Self-sufficiency rate for all | 1.11% | 0.16% | 0.57% | 1.00% | 0.19% | 0.39% | 0.32% | 0.48% | 0.53% | 1.09% |
| Demand for the vulnerable (Kg) | 0.06209 | 0.11925 | 0.14008 | 5.93423 | 142.98778 | 391.23190 | 3082.20431 | 0.03980 | ||
| Self-sufficiency rate for the vulnerable | 5.18% | 0.57% | 2.01% | 2.79% | 0.52% | 1.21% | 1.03% | 1.76% | 1.88% | 6.72% |
Table 6.
Self-sufficiency rate comparison.
| Studies | Garden numbers | Garden types | Urban population | Population Density (people/km²) | Self-sufficiency rate |
| Cleveland, USA, study [49,89] |
200 | Community gardens | 431,363 | 2142 | 1.70% |
| Nerima, Japan, study [9] |
1475 | Professional farms, hobby farms, & allotments | 721,709 | 15,019 | 6.18% |
| Leicester, UK, study [50,90] |
64 | Allotments | 330,000 | 4500 | 2.60% |
| Guelph, Canada, study [51] |
10,964 | Backyard gardens | 122,362 | 1644 | 2.00% |
| This study [77] |
22 | Community gardens (communal gardens, allotments, & urban farms) | 216,200 | 746 | 0.04% |
Disclaimer/Publisher’s Note: The statements, opinions and data contained in all publications are solely those of the individual author(s) and contributor(s) and not of MDPI and/or the editor(s). MDPI and/or the editor(s) disclaim responsibility for any injury to people or property resulting from any ideas, methods, instructions or products referred to in the content. |
© 2025 by the authors. Licensee MDPI, Basel, Switzerland. This article is an open access article distributed under the terms and conditions of the Creative Commons Attribution (CC BY) license (http://creativecommons.org/licenses/by/4.0/).
Copyright: This open access article is published under a Creative Commons CC BY 4.0 license, which permit the free download, distribution, and reuse, provided that the author and preprint are cited in any reuse.


