Submitted:
19 May 2025
Posted:
20 May 2025
You are already at the latest version
Abstract
Pancreatic β cells derived from human induced pluripotent stem cells (hiPSCs) represent a promising therapeutic avenue in regenerative medicine for diabetes treatment. However, current differentiation protocols lack the specificity and efficiency required to reliably produce fully functional β cells, limiting their clinical applicability. Epigenetic barriers, such as histone modifications, may hinder proper differentiation and the acquisition of essential maturation markers in these cells. In this study, we investigated the role of the histone demethylase KDM4A in the differentiation of insulin-producing pancreatic β cells from hiPSCs. KDM4A removes trimethyl groups from lysine residues H3K9 and H3K36, critical epigenetic marks associated with gene regulation. The results showed that Knockdown of KDM4A significantly reduced the expression of pancreatic differentiation genes, such as PDX1, NX6.1, and INS, compared to WT iPSCs differentiated under the same conditions. Similarly, glucose-stimulated insulin secretion was reduced by approximately 80%. These findings underscore the importance of histone demethylation in optimizing differentiation protocols for hiPSC-derived β cells. Our results provide preliminary insights into the epigenetic mechanisms governing β-cell maturation, laying the groundwork for further exploration of histone demethylases as potential targets to enhance regenerative medicine strategies for diabetes treatment.
Keywords:
induced pluripotent stem cells
; knock-down
; KDM4A
; pancreatic β-like cells
; differentiation
; insulin secretion cells
1. Introduction
Histone post-transcriptional modifications are now recognized as key regulators of gene expression, directly impacting the emergence and progression of conditions such as cancer, cardiovascular diseases, and diabetes [1,2,3,4,5]. Recent scientific advancements have highlighted proteins involved in histone modifications as potential therapeutic targets for developing drugs to treat a wide range of diseases [6,7]. Among the covalent histone variations, lysine methylation and demethylation on histone 3 (H3K9me) are modifications that profoundly impact chromatin functionality and gene expression [8].
Histone lysine demethylases (KDMs) are a family of transcriptional regulators that primarily remove methyl groups from lysine and arginine residues on histones 3 and 4 [9,10,11,12] . KDM4A proteins have been implicated in regulating genes associated with cell proliferation, genome stability, and pluripotency preservation in maternal stem cells [13]. Knockdown of KDM4A (KD-KDM4A) in cellular models has demonstrated a reduction in cell proliferation, making it a subject of interest in various cancers. Reduced expression of KDM4A has been associated with decreased proliferation, invasion, and migration in multiple tumors [11,14].
The patterns of histone methylation and their role in determining cell identity have posed significant challenges in reprogramming induced pluripotent stem cells (iPSCs) from somatic cells for use in regenerative medicine[15]. Numerous studies have shown that epigenetic barriers, including histone methylation patterns, and particularly the presence of H3K9me3 at pluripotency gene promoters, directly affect the rate of cellular reprogramming in vitro.[16,17] Therefore, removing the epigenetic mark H3K9me3 during reprogramming procedures is crucial to obtaining fully reprogrammed iPSC lines[18,19]. However, its role in the differentiation processes of somatic cells from iPSCs has been poorly studied and could be a focus of interest in regenerative medicine.
The difficulty in obtaining pancreatic b-cells from iPSC in an efficient and functionally mature way may be due to an alteration in the methylation pattern that would affect genes that harmonically regulate insulin secretion. A critical aspect in which demethylase activity is manifested was in cloning experiments in non-human primates, where an epigenetic barrier had to be overcome in experiments using SCNT (somatic cell nuclear transfer). This barrier was characterized by hypermethylation of H3K9me3, which prevented embryo development and was only overcome with histone demethylase family 4 (KDM4), which established the first cloned primates. [20,21,22]
Epigenetic barriers affecting the reprogramming of iPSCs from somatic cells might also be linked to difficulties in differentiation processes, commonly reported in in vitro studies. Given KDM4A’s association with cell survival and the preservation of cellular viability [23], its investigation and manipulation could facilitate the production of a more significant number of functional and mature pancreatic β cells, advancing this methodology toward consideration as a primary therapeutic strategy for disease management.
2. Materials and Methods
A. Material
The 20b iPSCs were acquired from the Harvard Stem Cell Institute (HSCI) (Boston, United States) and were maintained on vitronectin in mTeSR1™. The medium was changed daily, and the cells were passaged when they reached 85–90% confluency. Dulbecco’s phosphate-buffered saline w/o calcium and magnesium (DPBS; 14190250), L-Glutamine (25030081), heat-stable recombinant human basic bFGF (100-18BHS-100UG), heat-stable FGF10 (PHG0375), B27 supplement minus vitamin A (12587010), human Noggin recombinant protein (PHC1506), human EGF recombinant protein (PHG0311L), Dulbecco’s modified Eagle’s medium (DMEM), Glutamax™ Supplement, pyruvate (10569010), fetal bovine serum (FBS) (A5256701), Mammalian protein extraction reagent (M-PER 78501), Halt protease, phosphatase inhibitor cocktail, and Tween™ 20 Surfact-Amps™ detergent solution, EcoR1 (ER0271), and BShT1 (Age1) (ER1461) were obtained from ThermoFisher Scientific, United States; Vitronectin XF™ (07180), human/mouse recombinant activin A (78132), mTeSR1™ medium (85850) were obtained from StemCell Technologies™ (Canada); CHIR99021 (SML1046), L-Ascrobic acid (A4544), dorsomorphin (P5499), nicotinamide (N0636), retinoic acid (R2625), monothioglycerol (MTG6145), and penicillin/streptomycin (P4333) were obtained from Sigma-Aldrich, United States; SANT-1 (559303-5MG), Immobilon-P PVDF membrane (IPVH00010), and Luminata Crescendo Western HRP Substrate, chloroquine diphosphate salt (C6628), calcium chloride (C5670), HEPES Buffer (H4034), polybrene (TR-1003-G), and doxycycline hyclate (D5207) were obtained from Merck Millipore, Darmstadt, Germany; Bicinchoninic acid kit (BCA) (786-570) was acquired from GBioscience United States; Laemmli sample buffer 2X (161-0737) was acquired from Bio-Rad, United States; SURE2 Supercompetent cells (200152) were obtained from Agilent, United States; Ampicillin, sodium salt, irradiated (11593027), carbenicillin disodium salt (10177012), and puromycin dihydrochloride (A1113808) were obtained from Gibco™, United States; Monofas® DNA purification kit I (5010-21500) was obtained from GL Sciencies Inc, Tokyo, Japan; Lenti-X™ 293T cell line (632180) was obtained from Takara Bio, United States; Addgene-plasmid-pVSV-G (138479), addgene-plasmid-pRSV-Rev (12253), addgene-plasmid-pMDLg/pRRE (12251), and addgene-GFP shRNA tet pLKO puro (16037) were obtained from Addgene, United States; shKDM4A sequence were synthetized by Eurofins Genomic Tokyo, Japan. Primary antibodies against forkhead box A2 (FOXA2) (710730), SRY-box transcription factor 17 (SOX17) (PA5-72815), hepatocyte nuclear factor alpha (HNF4A) (PA5-82159), SRY-box transcription factor 9 (SOX9) (PA5-81966), pancreas associated transcription factor 1a (PTF1A) (PA5-112677), and Neurogenin 3 (NeuroG3) (703206), and goat anti-rabbit IgG (H+L) horseradish peroxidase-conjugated secondary antibody (G21234), Luria Broth Base (Miller’s LB Broth Base) (1295027), PureLink™ HiPure MaxiPrep kit (K210006), and Fluoromount-G™, with DAPI (00-4959-52) were obtained from Invitrogen, United States; Recombinant pancreatic and duodenal homeobox 1 (PDX1) (ab219207), and anti-NKX6.1 antibody (ab221549) were obtained from Abcam, United States; CoraLite® Plus 488-conjugated INS Monoclonal antibody (CL488-66198), and KDM4A polyclonal antibody (29977-1-AP) were acquired from Proteintech, United States; QuickExtract™ RNA extraction kit (QER090150) was obtained from Biosearch Technologies, United States, and OneScript® Plus Reverse Transcriptase (G237) was obtained from ABN (Canada).
B. Knockdown of KDM4A in iPSCs with shRNA:
The KDM4A knockdown efficiency was evaluated using three shRNA plasmids (shKDM4A1, shKDM4A2, and shKDM4A3) constructed with a GFP shRNA tet pLKO puro. The plasmids were delivered into 20b iPSCs via lentiviral transduction and cultured in mTeSR1™ for 48 h. After that, the medium was changed and supplemented with doxycycline (1 µg/mL) for 48 h, and then positive clones were selected using puromycin (1µg/mL) for another 48 h. The KDM4A expression was quantified by real-time PCR. Based on the mRNA expression, shKDM4A3 (Table 1) showed the highest inhibition effect of KDM4A (data not shown).
C. iPSCs Differentiation
Two differentiation assays into pancreatic βcells were performed during the present study. The first one was performed according to the methodology previously published [24]. The second one followed the same method with the variation that the differentiation medium was always supplemented with doxycycline at a concentration of (1 µg/mL) to guarantee the expression of our shKDM4A3 inserted in the cells during differentiation experiments.
D. RT-PCR and qPCR Analysis of Gene Expression
RT-PCR and qPCR were performed as previously described [24]. Total RNA was isolated using QuickExtract™ RNA extraction kit and then reverse transcribed into cDNA using OneScript® Plus Reverse Transcriptase following the manufacturer’s instruction. Quantitative PCR was performed on a CFX Opus 96 Real-Time PCR System (Bio-Rad, United States) by using Luna® Universal qPCR Master Mix (M3000S) (New England Biolabs, United States). The primer list used for qPCR is shown in Table 2. The amplification conditions were as follows: Denaturation at 95°C for 1 minute, followed by 40 cycles of denaturation at 95°C for 15 seconds, annealing at 60°C for 30 seconds, and extension at 72°C for 30 seconds. Expression data were normalized relative to the B-Actin transcript level. The fold change for each gene was calculated using the 2^-ΔΔCt method.
E. Immunofluorescence
After differentiation experiments, the cells were washed two times with DPBS buffer, followed by the addition of Krebs-Ringer buffer (krb) with 20 mM glucose to induce insulin expression. The cells were fixed in 2% paraformaldehyde for 10 min, washed two times with PBS 1X, permeabilized with 0,3% Triton X-100 for 10 min, washed two times with PBS 1X for 5 minutes, and then blocked with 2% BSA for 40 minutes. Then, they were incubated overnight in a wet chamber with a primary antibody (CoraLite® Plus 488-conjugated INS Monoclonal antibody). Finally, the cells were washed two times with PBS 1X for 5 minutes, and Fluoromount-G™, with DAPI (00-4959-52), was added to stain the nuclei at room temperature until the Fluoromount-G™ dried. Images were captured using a fluorescent microscope.
F. Western Blot
The western blot technique was performed as previously described [24] to determine the expression of characteristic proteins during pancreatic differentiation. Likewise, we determined the inhibition of KDM4A expression during each stage of differentiation following the same method.
G. Glucose-Stimulated Insulin Secretion (GSIS)
According to manufacturer instructions, insulin expression was determined using the Abcam Human Insulin ELISA kit (AB100578), United States. Briefly, Pancreatic beta-like cells (PβLC), Pancreatic beta-like cells KDM4A-KD (PβLC-KD), and INS 823/13 cell line were washed two times with DPBS buffer followed by an incubation with Krebs-Ringer buffer with 2.5 mM of glucose at 37°C for 1 hour. Next, the cells were washed two times with DPBS, followed by incubation with buffer Krebs-Ringer with 20 mM glucose at 37°C for 1 hour. Supernatants of low and high glucose were collected, and insulin levels were measured in triplicate in each case.
H. Statistical Analysis
All the experiments were carried out at least three times. Data were displayed as mean ± SD. A two-tailed, unpaired Student’s t-test was performed to assess statistical significance, and p < 0.05 was considered significant.
3. Results
3.1. Effect of shKDM4A on iPSCs self-Renewal and Growth Rate
We found that the shKDM4A-tet-puro-pKLO reduced the KDM4A expression in the iPSCs infected with the lentiviral particles. Quantitative PCR and western blot results (Figure 1 A, B) showed an inhibition in the protein and gene expression in all the experiments compared to untreated cells used as controls (HepG2 cell line and iPSCs). Also, the growth and expansion rate of the iPSCs infected with the shKDM4A was monitored during all the experiments to guarantee enough cell confluency to perform further experiments. We found that iPSCs-KDM4A-knockdown (iPSCs-KD) had a lower growth and expansion rate than iPSCs without shKDM4A infection (wild type) (data not shown). The results indicate that KDM4A plays a key role in the iPSC self-renewal and growth rate by influencing cell proliferation and cycle arrest [7].
3.2. Effect of shKDM4A on iPSCs Differentiation to Pancreatic ß-Like Cells (PßLC)
Two different differentiation assays were performed following the methodology previously reported [24,25]. During the first differentiation assay, iPSCs were infected with our shKDM4A by transfection with lentivirus particles to determine the effect that KDM4A knockdown would have during the differentiation process. During all the experiments, KDM4A inhibition was ensured through medium supplementation using doxycycline 1 µg/mL.
It is essential to highlight that although the iPSC colonies maintained their typical growth characteristics before the infection (defined borders, scarce cytoplasm, large nuclei, and aggregates growth), these morphological growth characteristics disappeared during the first 72 hours of experiments (Figure 2). Likewise, the growth rate and cell density were affected due to the knockdown of KDM4A, demonstrating that inhibition of the expression of this protein can influence the maintenance of pluripotency of iPSCs, as well as directly influence the morphological characteristics of the cells [13].
To further examine the effect of KDM4A protein knockdown on the process of pancreatic differentiation of iPSCs to pancreatic β cells, western blot (Figure 3) and qRT-PCR (Figure 4) assays were performed to evaluate the expression behavior of characteristic proteins and genes associated with the process.
The results shown in Figure 3 indicate that proteins involved in endodermal differentiation were expressed at each stage of the protocol. However, when comparing gene expression between wild-type iPSCs (iPSCs-WT) and KDM4A knockdown iPSCs (KDM4A-KD), both differentiated under the same conditions, we observed a significant reduction in gene expression related to the differentiation process in KDM4A-KD cells (Figure 4, dotted bars) compared to WT cells (Figure 4, line bars).
These findings suggest that knocking down KDM4A, a protein involved in histone demethylation, directly affects cell differentiation in vitro. The slower cell growth and reduced expression of pancreatic differentiation genes observed may indicate that proper epigenetic regulation, facilitated by KDM4A, is essential for successful differentiation [26,27].
The differences in gene expression between WT iPSCs and KDM4A-KD iPSCs are shown in Figure 4. Notably, throughout the assay, gene expression shown by KDM4A-KD iPSCs (dotted bar) was lower than that shown by WT iPSCs (line bar). However, the expression of proteins associated with the differentiation process (Figure 3) did not show an absence in the expression of any of the characteristic proteins, which is why it was considered that inhibiting the expression of the KDM4A protein would not influence pancreatic differentiation. However, when both cell groups obtained after 14 days of the protocol were analyzed (Figure 4E), we noticed the main differences at the gene expression level.
Notably, the most relevant differences in gene expression were observed at the expression level of crucial genetic markers of functional pancreatic β cells, such as pdx1, ngn3, and ins, which could indicate that the cells have not entirely differentiated into pancreatic β cells [28]. Likewise, when we examined the expression of essential genes at the pancreatic β cell maturation level, we found that differentiated KDM4A-KD iPSCs presented low levels of nkx6.1 expression compared to WT iPSCs.
The reduced expression of key pancreatic genes observed in PβLCs derived from KDM4A-KD iPSCs suggests that the knockdown of KDM4A disrupts the proper differentiation process. Although these cells express endodermal differentiation proteins (Figure 3) and pancreatic differentiation genes (Figure 4), their low gene expression may indicate inefficiencies in the protocol, cellular immaturity, or functional limitations, which could compromise their use in regenerative medicine[29]. Notably, the low expression of the critical pancreatic β-cell lineage marker ngn3 during the final differentiation stage (Stage 4) underscores this issue [30,31]. These findings suggest that KDM4A knockdown may promote hypermethylation processes, impairing lineage specification, particularly for pancreatic β-cell differentiation, and ultimately restricting their functionality and development [32].
3.3. PβLC KDM4A-KD Insulin Secretion
To evaluate the functionality of KDM4A-KD pancreatic β-like cells (PβLC-KD), glucose-stimulated insulin secretion (GSIS) and immunofluorescence (IF) assays were performed to assess the impact of KDM4A knockdown on their functional capacity. Insulin secretion was measured using a glucose challenge at two concentrations: low (2 mM) for basal insulin levels and high (20 mM) for stimulated secretion, with an ELISA test quantifying insulin level (Figure 5). The results revealed that while PβLC-KD cells responded to glucose, their insulin secretion levels were significantly lower (1.94 and 3.49 µIU/mL) compared to PβLC-WT (5.59 and 8.12 µIU/mL) and INS 823/13 cells (12.67 and 22.56 µIU/mL). This reduced functionality may be attributed to the low expression of key pancreatic β-cell genes, including pdx1, ngn3, and nkx6.1 (Figure 4E). These are critical for proper cell function and were negatively impacted by the differentiation methodology used in this assay [33].
We performed an immunofluorescence assay comparing PβLC-KD, PβLC, and insulin-producing cells to evaluate insulin expression and functionality. The results, shown in Figure 6, were obtained after exposing the differentiated cells (PβLC and PβLC-KD) and insulin-producing cells to 20 mM glucose for 1 hour, followed by insulin detection using specific antibodies. As depicted, INS823/13 cells (Figure 6D) exhibited the highest insulin production, followed by PβLC (Figure 6A) and PβLC-KD (Figure 6B). HepG2 cells served as a negative control for the assay.
The low insulin expression observed in PβLC-KD cells may be linked to changes in methylation patterns in the promoters of key pancreatic β-cell identity genes, such as pdx1, nkx6.1, and ngn3 [28,34]. Previous studies have suggested that hypermethylation of these promoter sequences can contribute to the development of type 2 diabetes mellitus (T2DM), highlighting the possibility that knockdown of proteins involved in histone demethylation could directly impair the production of functional insulin-producing cells, as evidenced in Figure 4, Figure 5 and Figure 6 of this study [35,36].
Moreover, the reduced expression of functional pancreatic β-cell genes (pdx1, nkx6.1, and ngn3; Figure 4E, dotted bar), the lower insulin secretion in response to glucose (Figure 5, PβLC-KD), and the diminished fluorescence in the immunofluorescence assay (Figure 6B) strongly suggest deficiencies in the pancreatic differentiation protocol. These results, when compared to PβLC-WT cells, provide clear indicators of the challenges associated with KDM4A knockdown during differentiation. [37,38,39].
These findings collectively demonstrate that the knockdown of the KDM4A protein negatively impacts the generation of functional pancreatic β-like cells capable of producing insulin in response to glucose and hinders the maturation of the differentiated cells.
4. Discussion
The present study evaluated the role of KDM4A knockdown (KD) in the differentiation of human iPSCs (iPSC-KD-KDM4A) into insulin-producing pancreatic β-cells. The results indicated that KDM4A KD directly affected the differentiation process, leading to a marked reduction in the expression of pivotal pancreatic-specific genes such as PDX1, NKX6.1, and INS. Although the expression of broader differentiation markers remained unaltered, the establishment of pancreatic identity was significantly compromised. Functional assessments further confirmed these findings, demonstrating a diminished insulin secretion capacity in response to glucose stimulation in the iPSC-KD-KDM4A.
The KDM family of proteins is directly related to maintaining specific methylation patterns in histone tails, allowing cells to preserve a precise identity [1,18,40,41]. Thus, this study’s results highlight the influence of KDM4A in regulating methylation patterns in iPSCs, how it influences the conservation of genes associated with proliferation, and the maintenance of the expression of pluripotency genes[13].
iPSC-KD-KDM4A develop morphological changes, which quickly resulted in a considerable loss of the structural features that differentiate iPSCs from any other type of somatic cell (Figure 1) (defined borders, scant cytoplasm, large nuclei, growth in aggregates) [18,42].
Generally, KDM4A expression is detectable in iPSCs (Figure 3 KDM4A) but is downregulated as cells differentiate. This allows the expression of genes associated with pancreatic differentiation by establishing specific methylation patterns in the promoters of pancreatic identity-associated genes such as pdx1, ins, nkx6.1, mafa, and ngn3 [43].
The results obtained in this experiment align with findings previously reported by Kaimala and collaborators [44,45], which suggested that the downregulation of proteins from the KDM family promotes endodermal development. However, our observations indicate that knockdown (KD) of the KDM4A protein directly affects the differentiation process. While no inhibition of protein expression was detected (Figure 3), a significant decrease in the expression of key pancreatic β-cell identity genes was observed (Figure 4). This reduction could directly impact subsequent maturation processes and limit the potential application of these cells in regenerative medicine.[44].
These results would further reinforce the difficulties faced by pancreatic differentiation protocols since inhibition of KDM4A expression would directly influence the correct cell differentiation process, resulting in cells lacking sufficient specificity [46]. Perhaps this absence of defined cell identity at the end of our protocol would cause transdifferentiating processes in the cells obtained, which would indicate that, although insulin expression in response to glucose has been observed (Figure 5), the cells could change their identity and thus lack the capacity for maturation or robust insulin expression at later stages [47].
Previous studies by Yang and co-workers [43] demonstrated that inhibition of lysine-specific histone demethylase 1A (LSD1/KDM1A) caused upregulation of differentiation genes. This favored high expression of endodermal differentiation-associated genes such as foxA2 and sox17, thus facilitating the initiation of their differentiation strategy.
This is important to ensure the establishment of the definitive endodermal lineage. Subsequently, those genes were downregulated, as we observed by qRT-PCR experiments [48]. Afterward, our results showed that iPSC-KD-KDM4A did not favor the expression of crucial pancreatic-β cell genes, as demonstrated in the qRT-PCR. Genes such as pdx1 and nkx6.1, ins, and ngn3, which play a fundamental role in developing and maintaining pancreatic identity [49], were downregulated at the end of our protocol (compared to the expression shown by differentiated WT cells). These results could indicate that inhibiting the expression of KDM4A could lead to hypermethylation processes in the promoters of these genes (pdx1, nkx6.1, ins, and ngn3), directly affecting pancreatic differentiation, causing that, although the cells appear differentiated, they are not entirely functional [50].
To determine the efficiency and functionality of the differentiated cells, PβLC-WT and PβLC-KD were subjected to a glucose challenge to assess their ability to secrete insulin in response to glucose concentrations [51,52]. Likewise, the immunofluorescence assay sought to observe insulin expression in the cells obtained and to compare with an insulin-expressing cell line. Our results (Figure 5) demonstrate that PβLC-WT and PβLC-KD express insulin in response to glucose. However, it is noteworthy that quantitative PCR results revealed a distinct differentiation profile between the two cell groups in our study. While the PβLC-WT differentiated by the protocol developed by our group showed a pancreatic differentiation profile through the upregulated expression of the characteristic genes of this process, the PβLC-KD showed a downregulated expression and even in some cases without differences (equal to Ctrl), which could indicate that there are no differences in gene expression. Therefore, we could affirm that the KD of the KDM4A protein based on the results obtained would not guarantee a wholly defined pancreatic-β cell identity [31,53,54].
Among the results obtained by our research group when performing the KO process of the KDM4A protein, it is interesting to note the low expression of the ngn3 marker, considered one of the crucial genes in the processes of differentiation and establishment of pancreatic identity (Figure 4E dotted bar). The expression of ngn3 is essential during in vitro protocols [55] [60]. It has been established as one of the principal transcription factors associated with endocrine differentiation, resulting in functionality and lineage specification. However, the low expression found by our group during the assay development could indicate that the differentiated cells would lack a pancreatic-β cell identity, which would affect maturation processes at later stages[30] [30]. This is why, perhaps, the results at the insulin expression level in response to glucose (Figure 5 and Figure 6) show a difference between PβLC-WT and PβLC-KO, which could indicate that the cells that received the mutation would be less functional and would lack the capacity to mature [56,57].
The methylation of genes such as pdx1, nkx6.1, and ngn3 has been associated with insulin resistance and subsequent development of type 2 diabetes mellitus (T2DM)[50], thus affecting the function and maturation of pancreatic-β cells. The results shown here could theoretically indicate that KDM4A protein KD would trigger hypermethylation of genes associated with pancreatic-β cells identity, such as ins, nkx6.1, ngn3, and pdx1, which would cause a low mRNA expression, which agrees with the results obtained by our group (Figure 4 dotted bar) and could be associated with low subsequent development of pancreatic-β cells [58]. However, it is necessary to perform studies in biological models to determine the functionality and maturation capacity of cells differentiated with the KDM4A protein knockdown and whether these cells could mature in later steps. Finally, it is possible to affirm that based on the results obtained by our group, we might consider that PβLC differentiated with KDM4A protein KD would not have the capacity to mature or be functional during in vivo experiments.
5. Conclusions
The KDM4A protein plays a critical role in maintaining the identity and pluripotency of iPSCs. Knockdown leads to a loss of pluripotency, evidenced by significant morphological changes and altered growth characteristics in vitro. Additionally, knockdown of KDM4A increased the expression of early endodermal developmental genes, such as foxA2 and sox17, during the initial stages of differentiation.
However, prolonged knockdown of KDM4A negatively impacted the expression of key pancreatic developmental genes, including pdx1, nkx6.1, ins, and ngn3. This suggests a failure in the differentiation process, potentially leading to reduced functionality and impaired maturation of the resulting cells. While these findings highlight the regulatory role of KDM4A in pancreatic β-cell differentiation, further studies using biological models are needed to evaluate the functionality and maturation capacity of the differentiated cells in vivo. Future experiments focusing on KDM4A overexpression are essential to determine whether it could enhance differentiation protocols and improve the yield of functional pancreatic β-cells with a higher maturation capacity. If knockdown experiments revealed specific repression effects during differentiation, it is plausible that KDM4A overexpression may help optimize laboratory methodologies for generating pancreatic β-cells, potentially advancing regenerative therapies for diabetes mellitus.
Author Contributions
Author contributions: Conceptualization, F.L., and F.A., and LM; methodology, F.A., and F.L.; formal analysis, F.L.; investigation, F.A., and L.M.; resources, F.A. and F.L.; data curation, F.L.; writing original draft preparation, F.A.; writing review and editing, F.L.; visualization, F.L.; supervision, F.L.; project administration, F.A., and F.L.; funding acquisition, F.A., and F.L. All authors have read and agreed to the published version of the manuscript.
Funding
This research was funded by Dirección General de Investigación (DIN) from Universidad de La Sabana, grant number MED 255-2019 and MED 292-2020.
Acknowledgments
The authors especially thank Yazmin Lopez for the help in the acquisition of the financial funding.
Conflicts of Interest
Declare conflicts of interest or state, “The authors declare no conflicts of interest.”
References
- Rosales, W.; Lizcano, F. The Histone Demethylase JMJD2A Modulates the Induction of Hypertrophy Markers in iPSC-Derived Cardiomyocytes. Front Genet 2018, 9, 14. [Google Scholar] [CrossRef] [PubMed]
- Guerra-Calderas, L.; Gonzalez-Barrios, R.; Herrera, L.A.; Cantu de Leon, D.; Soto-Reyes, E. The role of the histone demethylase KDM4A in cancer. Cancer Genet 2015, 208, 215–224. [Google Scholar] [CrossRef] [PubMed]
- Garcia, J.; Lizcano, F. Kdm4c is Recruited to Mitotic Chromosomes and Is Relevant for Chromosomal Stability, Cell Migration and Invasion of Triple Negative Breast Cancer Cells. Breast Cancer (Auckl) 2018, 12, 1178223418773075. [Google Scholar] [CrossRef]
- Quilichini, E.; Haumaitre, C. Implication of epigenetics in pancreas development and disease. Best Pract Res Clin Endocrinol Metab 2015, 29, 883–898. [Google Scholar] [CrossRef]
- Takahashi, K. Cellular reprogramming. Cold Spring Harb Perspect Biol 2014, 6. [Google Scholar] [CrossRef]
- Shi, Y.; Whetstine, J.R. Dynamic regulation of histone lysine methylation by demethylases. Mol Cell 2007, 25, 1–14. [Google Scholar] [CrossRef]
- Wu, Q.; Young, B.; Wang, Y.; Davidoff, A.M.; Rankovic, Z.; Yang, J. Recent Advances with KDM4 Inhibitors and Potential Applications. J Med Chem 2022, 65, 9564–9579. [Google Scholar] [CrossRef]
- Hou, H.; Yu, H. Structural insights into histone lysine demethylation. Curr Opin Struct Biol 2010, 20, 739–748. [Google Scholar] [CrossRef]
- Chen, Z.; Zang, J.; Whetstine, J.; Hong, X.; Davrazou, F.; Kutateladze, T.G.; Simpson, M.; Mao, Q.; Pan, C.H.; Dai, S.; et al. Structural insights into histone demethylation by JMJD2 family members. Cell 2006, 125, 691–702. [Google Scholar] [CrossRef]
- Black, J.C.; Van Rechem, C.; Whetstine, J.R. Histone lysine methylation dynamics: establishment, regulation, and biological impact. Mol Cell 2012, 48, 491–507. [Google Scholar] [CrossRef]
- Lee, D.H.; Kim, G.W.; Jeon, Y.H.; Yoo, J.; Lee, S.W.; Kwon, S.H. Advances in histone demethylase KDM4 as cancer therapeutic targets. FASEB J 2020, 34, 3461–3484. [Google Scholar] [CrossRef]
- Hancock, R.L.; Masson, N.; Dunne, K.; Flashman, E.; Kawamura, A. The Activity of JmjC Histone Lysine Demethylase KDM4A is Highly Sensitive to Oxygen Concentrations. ACS Chem Biol 2017, 12, 1011–1019. [Google Scholar] [CrossRef] [PubMed]
- Young, N.L.; Dere, R. Mechanistic insights into KDM4A driven genomic instability. Biochem Soc Trans 2021, 49, 93–105. [Google Scholar] [CrossRef]
- Berry, W.L.; Janknecht, R. KDM4/JMJD2 histone demethylases: epigenetic regulators in cancer cells. Cancer Res 2013, 73, 2936–2942. [Google Scholar] [CrossRef]
- Huang, C.; Wu, J.C. Epigenetic Modulations of Induced Pluripotent Stem Cells: Novel Therapies and Disease Models. Drug Discov Today Dis Models 2012, 9, e153–e160. [Google Scholar] [CrossRef]
- Ninova, M.; Fejes Toth, K.; Aravin, A.A. The control of gene expression and cell identity by H3K9 trimethylation. Development 2019, 146. [Google Scholar] [CrossRef]
- Chen, J.; Liu, H.; Liu, J.; Qi, J.; Wei, B.; Yang, J.; Liang, H.; Chen, Y.; Chen, J.; Wu, Y.; et al. H3K9 methylation is a barrier during somatic cell reprogramming into iPSCs. Nat Genet 2013, 45, 34–42. [Google Scholar] [CrossRef]
- Nicetto, D.; Zaret, K.S. Role of H3K9me3 heterochromatin in cell identity establishment and maintenance. Curr Opin Genet Dev 2019, 55, 1–10. [Google Scholar] [CrossRef]
- Pedersen, M.T.; Kooistra, S.M.; Radzisheuskaya, A.; Laugesen, A.; Johansen, J.V.; Hayward, D.G.; Nilsson, J.; Agger, K.; Helin, K. Continual removal of H3K9 promoter methylation by Jmjd2 demethylases is vital for ESC self-renewal and early development. EMBO J 2016, 35, 1550–1564. [Google Scholar] [CrossRef]
- Xie, R.; Everett, L.J.; Lim, H.W.; Patel, N.A.; Schug, J.; Kroon, E.; Kelly, O.G.; Wang, A.; D’Amour, K.A.; Robins, A.J.; et al. Dynamic chromatin remodeling mediated by polycomb proteins orchestrates pancreatic differentiation of human embryonic stem cells. Cell Stem Cell 2013, 12, 224–237. [Google Scholar] [CrossRef]
- Li, K.; Kong, Y.; Zhang, M.; Xie, F.; Liu, P.; Xu, S. Differentiation of pluripotent stem cells for regenerative medicine. Biochem Biophys Res Commun 2016, 471, 1–4. [Google Scholar] [CrossRef] [PubMed]
- Xie, Z.; Chang, C.; Huang, G.; Zhou, Z. The Role of Epigenetics in Type 1 Diabetes. Adv Exp Med Biol 2020, 1253, 223–257. [Google Scholar]
- Efrat, S. Epigenetic Memory: Lessons From iPS Cells Derived From Human beta Cells. Front Endocrinol (Lausanne) 2020, 11, 614234. [Google Scholar] [CrossRef]
- Arroyave, F.; Uscategui, Y.; Lizcano, F. From iPSCs to Pancreatic beta Cells: Unveiling Molecular Pathways and Enhancements with Vitamin C and Retinoic Acid in Diabetes Research. Int J Mol Sci 2024, 25. [Google Scholar] [CrossRef]
- Kim, K.; Doi, A.; Wen, B.; Ng, K.; Zhao, R.; Cahan, P.; Kim, J.; Aryee, M.J.; Ji, H.; Ehrlich, L.I.; et al. Epigenetic memory in induced pluripotent stem cells. Nature 2010, 467, 285–290. [Google Scholar] [CrossRef]
- Yang, Y.; Luan, Y.; Feng, Q.; Chen, X.; Qin, B.; Ren, K.D.; Luan, Y. Epigenetics and Beyond: Targeting Histone Methylation to Treat Type 2 Diabetes Mellitus. Front Pharmacol 2021, 12, 807413. [Google Scholar] [CrossRef]
- Labbe, R.M.; Holowatyj, A.; Yang, Z.Q. Histone lysine demethylase (KDM) subfamily 4: structures, functions and therapeutic potential. Am J Transl Res 2013, 6, 1–15. [Google Scholar]
- Sun, X.; Wang, L.; Obayomi, S.M.B.; Wei, Z. Epigenetic Regulation of beta Cell Identity and Dysfunction. Front Endocrinol (Lausanne) 2021, 12, 725131. [Google Scholar] [CrossRef]
- Silva, I.B.B.; Kimura, C.H.; Colantoni, V.P.; Sogayar, M.C. Stem cells differentiation into insulin-producing cells (IPCs): recent advances and current challenges. Stem Cell Res Ther 2022, 13, 309. [Google Scholar] [CrossRef]
- Manea, T.; Nelson, J.K.; Garrone, C.M.; Hansson, K.; Evans, I.; Behrens, A.; Sancho, R. USP7 controls NGN3 stability and pancreatic endocrine lineage development. Nat Commun 2023, 14, 2457. [Google Scholar] [CrossRef]
- Gu, G.; Dubauskaite, J.; Melton, D.A. Direct evidence for the pancreatic lineage: NGN3+ cells are islet progenitors and are distinct from duct progenitors. Development 2002, 129, 2447–2457. [Google Scholar] [CrossRef]
- Liu, J.; Banerjee, A.; Herring, C.A.; Attalla, J.; Hu, R.; Xu, Y.; Shao, Q.; Simmons, A.J.; Dadi, P.K.; Wang, S.; et al. Neurog3-Independent Methylation Is the Earliest Detectable Mark Distinguishing Pancreatic Progenitor Identity. Dev Cell 2019, 48, 49–63 e7. [Google Scholar] [CrossRef]
- Balboa, D.; Barsby, T.; Lithovius, V.; Saarimaki-Vire, J.; Omar-Hmeadi, M.; Dyachok, O.; Montaser, H.; Lund, P.E.; Yang, M.; Ibrahim, H.; et al. Functional, metabolic and transcriptional maturation of human pancreatic islets derived from stem cells. Nat Biotechnol 2022, 40, 1042–1055. [Google Scholar] [CrossRef]
- Parveen, N.; Dhawan, S. DNA Methylation Patterning and the Regulation of Beta Cell Homeostasis. Front Endocrinol (Lausanne) 2021, 12, 651258. [Google Scholar] [CrossRef]
- Fantuzzi, F.; Toivonen, S.; Schiavo, A.A.; Chae, H.; Tariq, M.; Sawatani, T.; Pachera, N.; Cai, Y.; Vinci, C.; Virgilio, E.; et al. In depth functional characterization of human induced pluripotent stem cell-derived beta cells in vitro and in vivo. Front Cell Dev Biol 2022, 10, 967765. [Google Scholar] [CrossRef]
- Siwakoti, P.; Rennie, C.; Huang, Y.; Li, J.J.; Tuch, B.E.; McClements, L.; Xu, X. Challenges with Cell-based Therapies for Type 1 Diabetes Mellitus. Stem Cell Rev Rep 2023, 19, 601–624. [Google Scholar] [CrossRef]
- Zhu, Y.; Liu, Q.; Zhou, Z.; Ikeda, Y. PDX1, Neurogenin-3, and MAFA: critical transcription regulators for beta cell development and regeneration. Stem Cell Res Ther 2017, 8, 240. [Google Scholar] [CrossRef]
- Memon, B.; Karam, M.; Al-Khawaga, S.; Abdelalim, E.M. Enhanced differentiation of human pluripotent stem cells into pancreatic progenitors co-expressing PDX1 and NKX6.1. Stem Cell Res Ther 2018, 9, 15. [Google Scholar] [CrossRef]
- Aigha, II; Abdelalim, E.M. NKX6.1 transcription factor: a crucial regulator of pancreatic beta cell development, identity, and proliferation. Stem Cell Res Ther 2020, 11, 459. [CrossRef]
- Mannar, V.; Boro, H.; Patel, D.; Agstam, S.; Dalvi, M.; Bundela, V. Epigenetics of the Pathogenesis and Complications of Type 2 Diabetes Mellitus. touchREV Endocrinol 2023, 19, 46–53. [Google Scholar] [CrossRef] [PubMed]
- Wu, L.; Wary, K.K.; Revskoy, S.; Gao, X.; Tsang, K.; Komarova, Y.A.; Rehman, J.; Malik, A.B. Histone Demethylases KDM4A and KDM4C Regulate Differentiation of Embryonic Stem Cells to Endothelial Cells. Stem Cell Reports 2015, 5, 10–21. [Google Scholar] [CrossRef] [PubMed]
- Martinez-Gamero, C.; Malla, S.; Aguilo, F. LSD1: Expanding Functions in Stem Cells and Differentiation. Cells 2021, 10. [Google Scholar] [CrossRef]
- Yang, X.F.; Zhou, S.Y.; Wang, C.; Huang, W.; Li, N.; He, F.; Li, F.R. Inhibition of LSD1 promotes the differentiation of human induced pluripotent stem cells into insulin-producing cells. Stem Cell Res Ther 2020, 11, 185. [Google Scholar] [CrossRef]
- Barsby, T.; Otonkoski, T. Maturation of beta cells: lessons from in vivo and in vitro models. Diabetologia 2022, 65, 917–930. [Google Scholar] [CrossRef]
- Kaimala, S.; Kumar, C.A.; Allouh, M.Z.; Ansari, S.A.; Emerald, B.S. Epigenetic modifications in pancreas development, diabetes, and therapeutics. Med Res Rev 2022, 42, 1343–1371. [Google Scholar] [CrossRef]
- Wesolowska-Andersen, A.; Jensen, R.R.; Alcantara, M.P.; Beer, N.L.; Duff, C.; Nylander, V.; Gosden, M.; Witty, L.; Bowden, R.; McCarthy, M.I.; et al. Analysis of Differentiation Protocols Defines a Common Pancreatic Progenitor Molecular Signature and Guides Refinement of Endocrine Differentiation. Stem Cell Reports 2020, 14, 138–153. [Google Scholar] [CrossRef]
- Son, J.; Accili, D. Reversing pancreatic beta-cell dedifferentiation in the treatment of type 2 diabetes. Exp Mol Med 2023, 55, 1652–1658. [Google Scholar] [CrossRef]
- Lee, K.; Cho, H.; Rickert, R.W.; Li, Q.V.; Pulecio, J.; Leslie, C.S.; Huangfu, D. FOXA2 Is Required for Enhancer Priming during Pancreatic Differentiation. Cell Rep 2019, 28, 382–393 e7. [Google Scholar] [CrossRef]
- Fujimoto, K.; Polonsky, K.S. Pdx1 and other factors that regulate pancreatic beta-cell survival. Diabetes Obes Metab 2009, 11 (Suppl. 4), 30–37. [Google Scholar] [CrossRef]
- Chen, A.C.H.; Lee, Y.L.; Fong, S.W.; Wong, C.C.Y.; Ng, E.H.Y.; Yeung, W.S.B. Hyperglycemia impedes definitive endoderm differentiation of human embryonic stem cells by modulating histone methylation patterns. Cell Tissue Res 2017, 368, 563–578. [Google Scholar] [CrossRef]
- Millman, J.R.; Xie, C.; Van Dervort, A.; Gurtler, M.; Pagliuca, F.W.; Melton, D.A. Generation of stem cell-derived beta-cells from patients with type 1 diabetes. Nat Commun 2016, 7, 11463. [Google Scholar] [CrossRef] [PubMed]
- Pagliuca, F.W.; Millman, J.R.; Gurtler, M.; Segel, M.; Van Dervort, A.; Ryu, J.H.; Peterson, Q.P.; Greiner, D.; Melton, D.A. Generation of functional human pancreatic beta cells in vitro. Cell 2014, 159, 428–439. [Google Scholar] [CrossRef]
- Bastidas-Ponce, A.; Roscioni, S.S.; Burtscher, I.; Bader, E.; Sterr, M.; Bakhti, M.; Lickert, H. Foxa2 and Pdx1 cooperatively regulate postnatal maturation of pancreatic beta-cells. Mol Metab 2017, 6, 524–534. [Google Scholar] [CrossRef]
- Taylor, B.L.; Liu, F.F.; Sander, M. Nkx6.1 is essential for maintaining the functional state of pancreatic beta cells. Cell Rep 2013, 4, 1262–1275. [Google Scholar] [CrossRef]
- Kimura-Nakajima, C.; Sakaguchi, K.; Hatano, Y.; Matsumoto, M.; Okazaki, Y.; Tanaka, K.; Yamane, T.; Oishi, Y.; Kamimoto, K.; Iwatsuki, K. Ngn3-Positive Cells Arise from Pancreatic Duct Cells. Int J Mol Sci 2021, 22. [Google Scholar] [CrossRef]
- Jiang, W.J.; Peng, Y.C.; Yang, K.M. Cellular signaling pathways regulating beta-cell proliferation as a promising therapeutic target in the treatment of diabetes. Exp Ther Med 2018, 16, 3275–3285. [Google Scholar]
- Campbell, J.E.; Newgard, C.B. Mechanisms controlling pancreatic islet cell function in insulin secretion. Nat Rev Mol Cell Biol 2021, 22, 142–158. [Google Scholar] [CrossRef]
- Har-Zahav, A.; Lixandru, D.; Cheishvili, D.; Matei, I.V.; Florea, I.R.; Aspritoiu, V.M.; Blus-Kadosh, I.; Meivar-Levy, I.; Serban, A.M.; Popescu, I.; et al. The role of DNA demethylation in liver to pancreas transdifferentiation. Stem Cell Res Ther 2022, 13, 476. [Google Scholar] [CrossRef]
Figure 1.
Expression of the KDM4A protein after lentiviral infection. A. qPCR results of the knockdown of the protein. Expression data are normalized to the Ctrl (b-actin, transcript level). Each experiment was performed in triplicate. Bars under the same symbol (*) are statistically different under the two-tailed, unpaired Student’s t-test compared to the Ctrl expression level. * p > 0.05. B. KDM4A protein knockdown during the differentiation protocol. Proteins were extracted at the end of each differentiation stage and detected using specific KDM4A antibodies. HepG2 and iPSCs WT (wild type) were used as controls. Abbreviations: S0-KD: Stage 0 knockdown; S1-KD: Stage 1 knockdown; S2-KD: Stage 2 knockdown; S3-KD: Stage 3 knockdown; S4-KD: Stage 4 knockdown; KDM4A-KD: Histone lysine demethylase 4A knockdown.
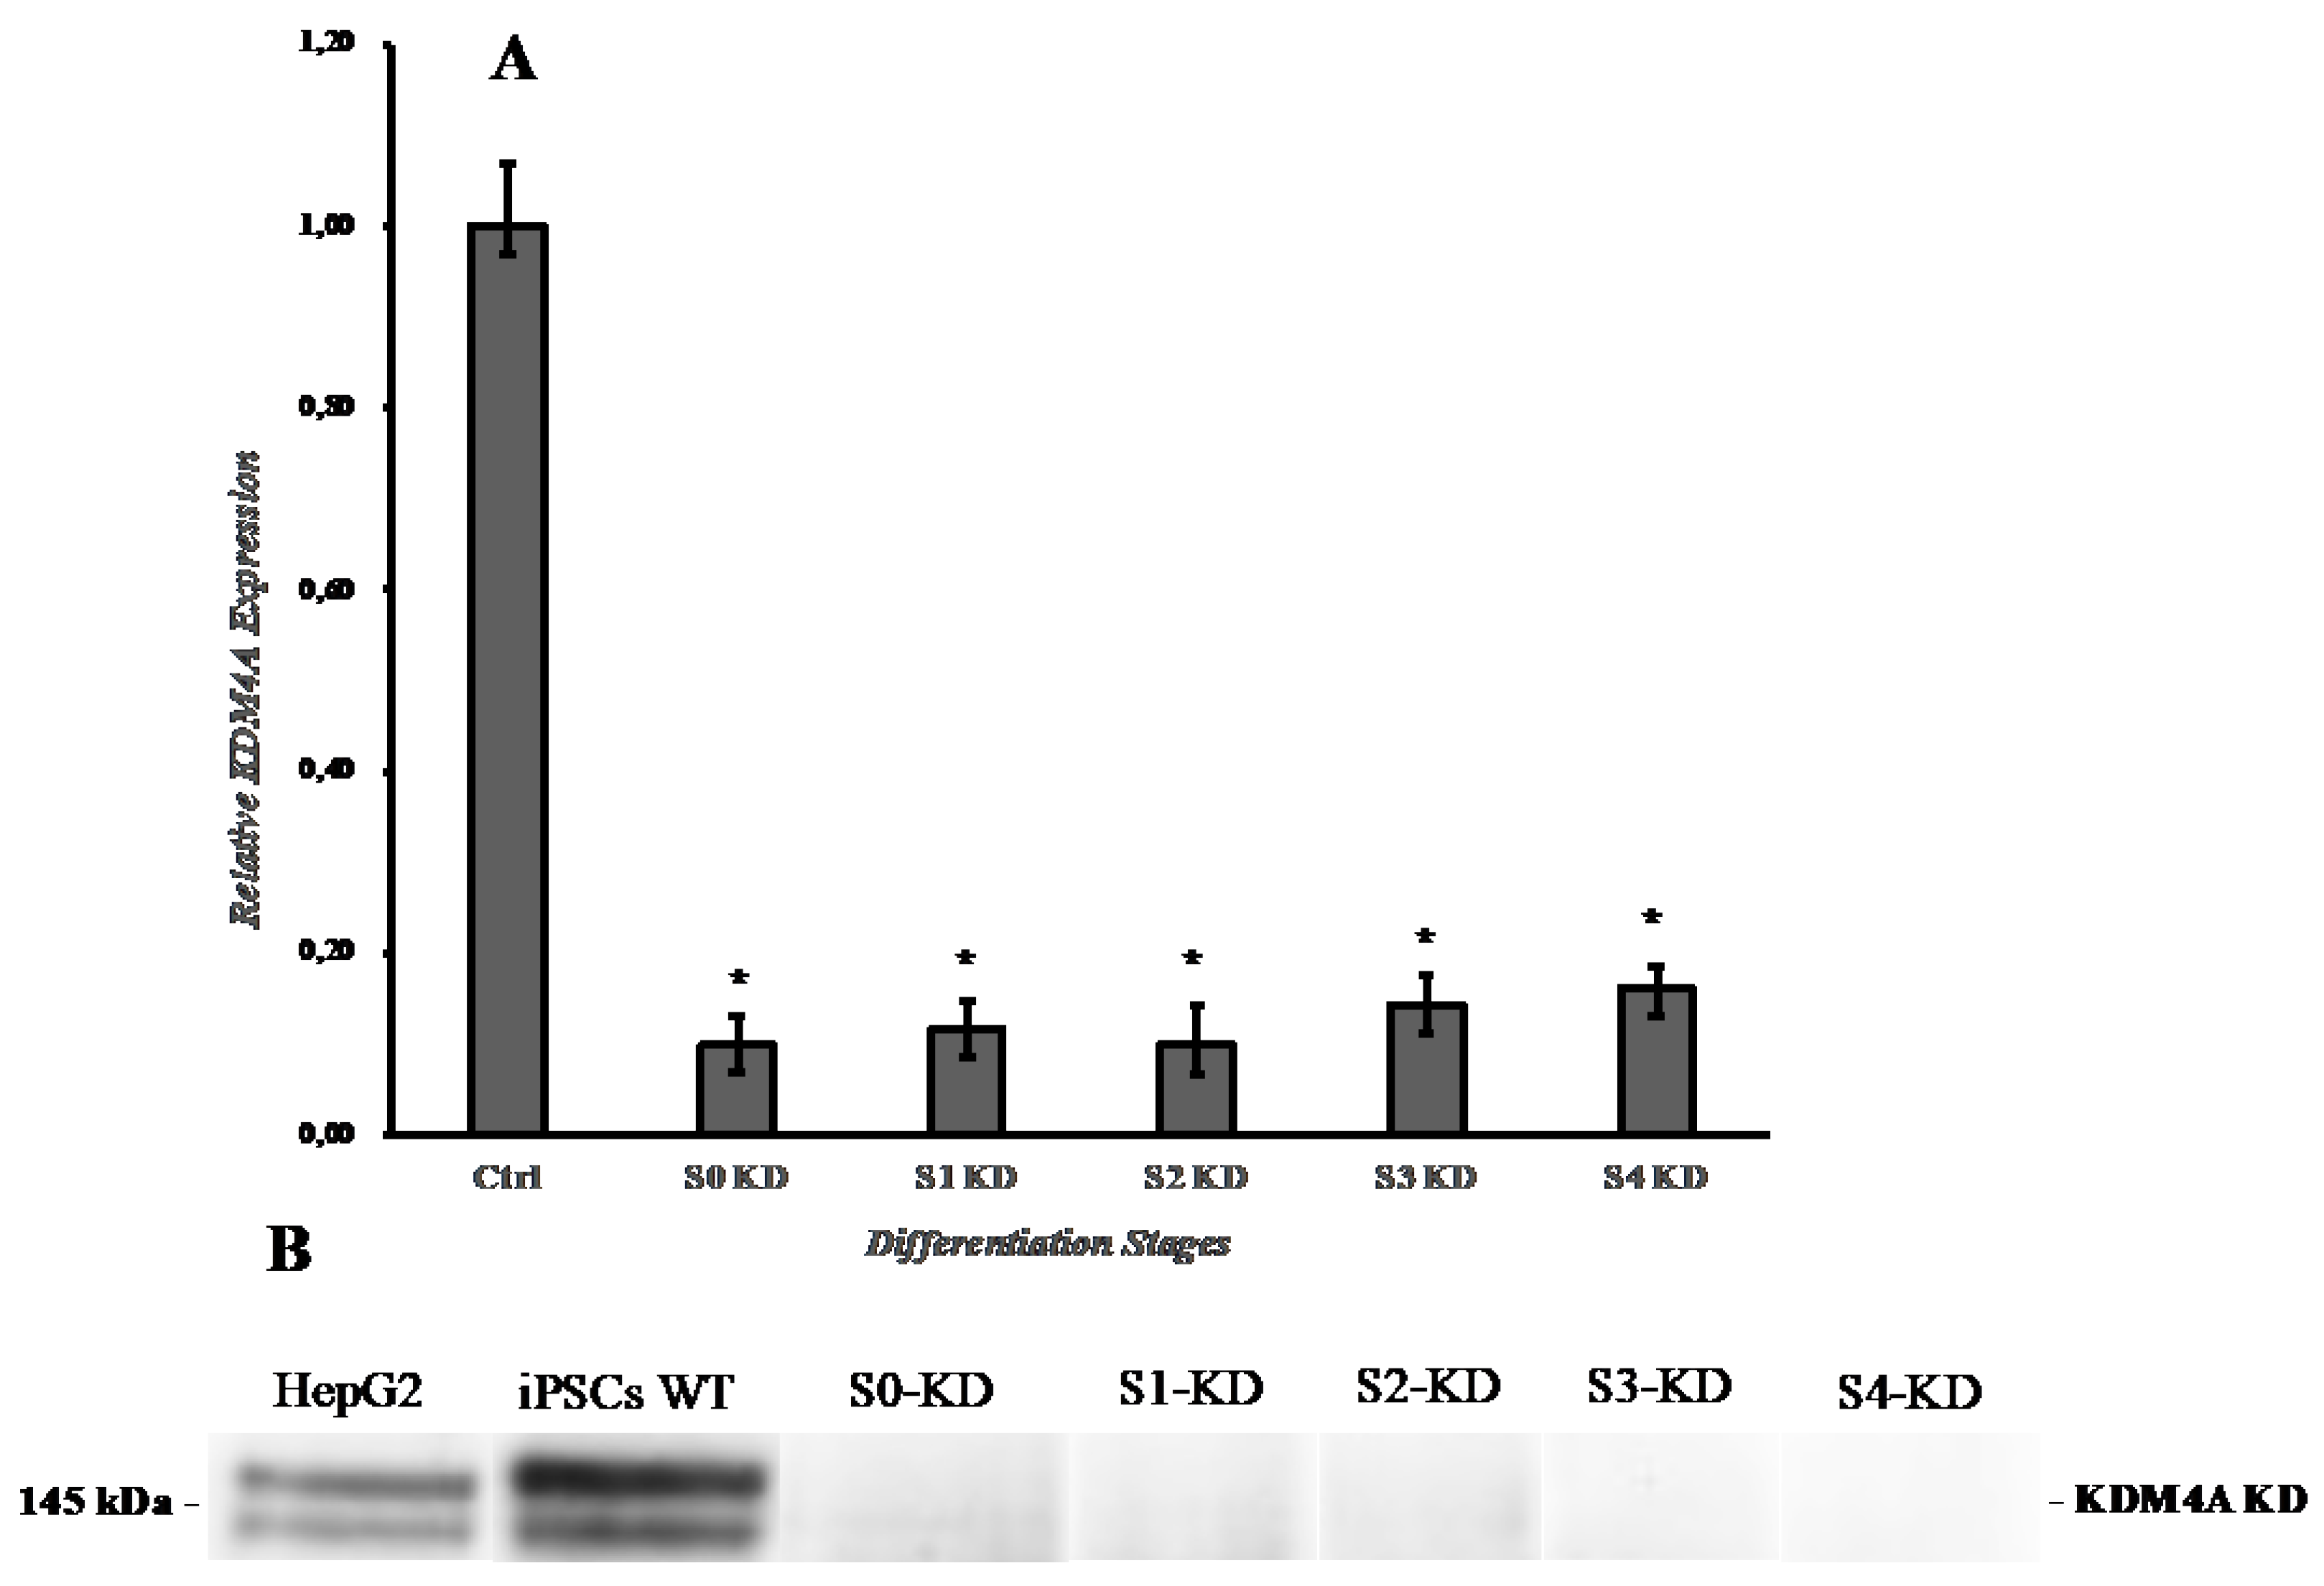
Figure 2.
Schematic representation of the differentiation process of the iPSCs KDM4A knockdown (iPSCs-KD) to pancreatic β-like cells (PβLCs). iPSCs were cultured in a 12-well plate coated with vitronectin XF™ in a sequential protocol for 13 days. The mTeSR1™ was supplemented with different cofactors and small molecules. Images were captured with a phase contrast microscope (ZEISS AX10). Abbreviations: DE: Definitive endoderm; PG: Pancreatic gut tube; PP: Pancreatic progenitor; EP: Endocrine progenitor; PβLC: Pancreatic beta-like cell; d: days. Black bar 50 µm.
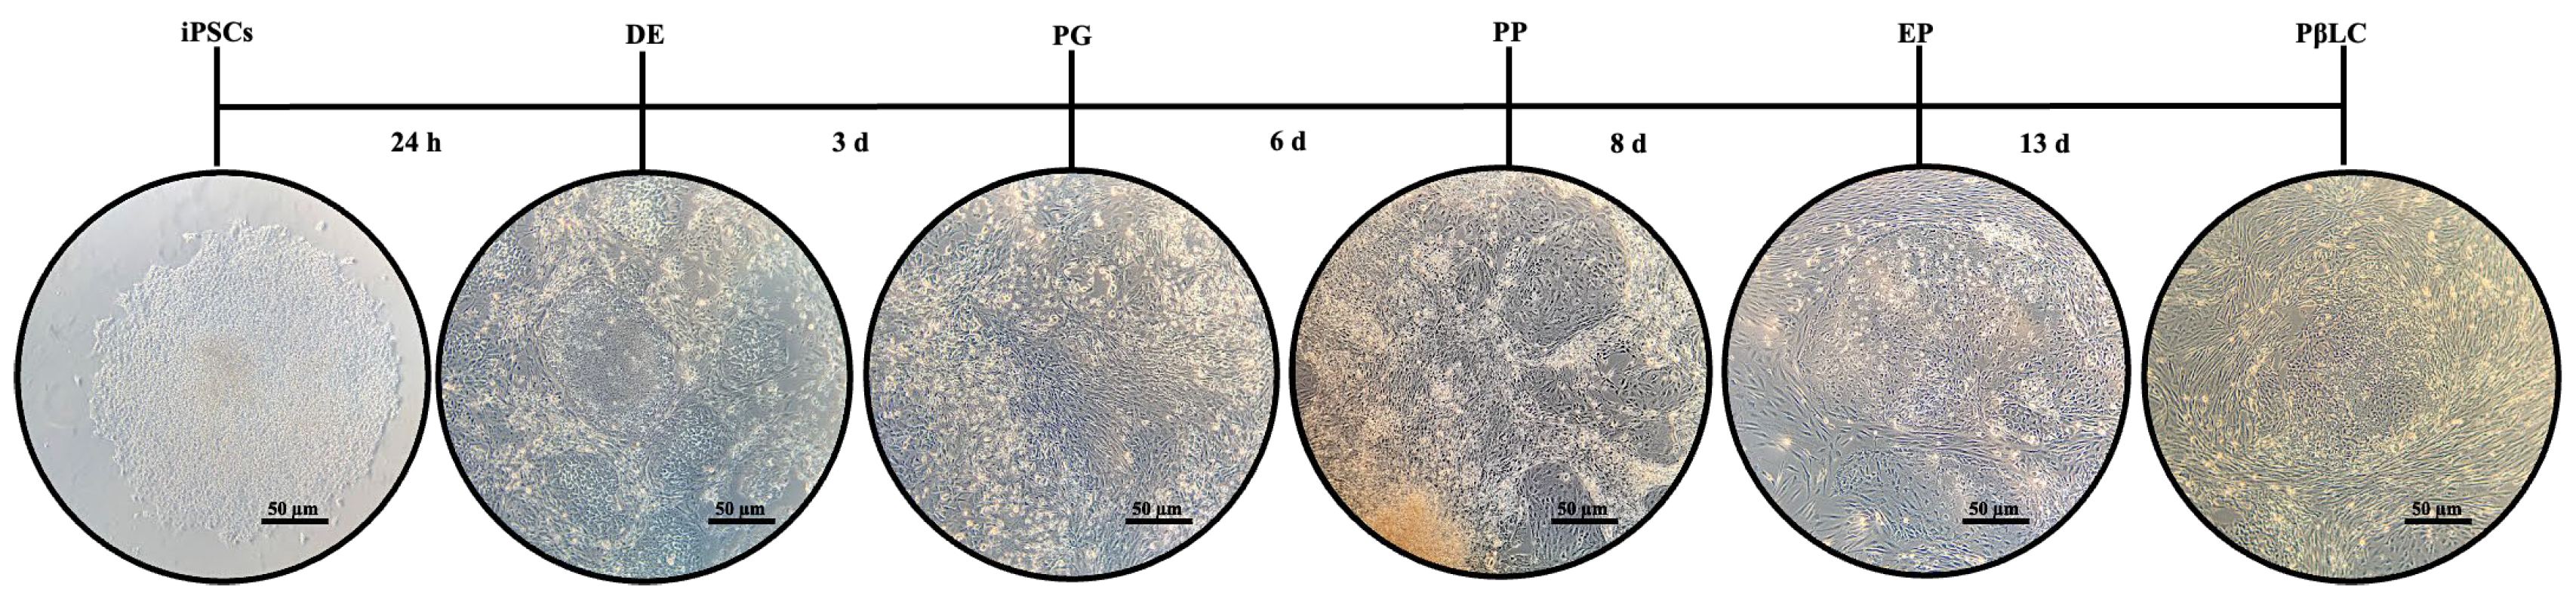
Figure 3.
Western blot result of the differentiation process. The figure represents all the proteins detected during different differentiation stages of the iPSCs KDM4A-KD. Proteins are detected individually at each differentiation stage. A HepG2 cell line was used as the control for the experiment. The approximate molecular weight of the protein (kDa) is shown. SOX17 44 kDa; FOXA2 49 kDa; HNF4A 52 kDa; PDX1 40 kDa; SOX9 63 kDa; PTF1A 42 kDa; NKX6.1 50 kDa. S0: Stage 0; S1: Stage 1; S2: Stage 2; S3: Stage 3; S4: Stage 4.
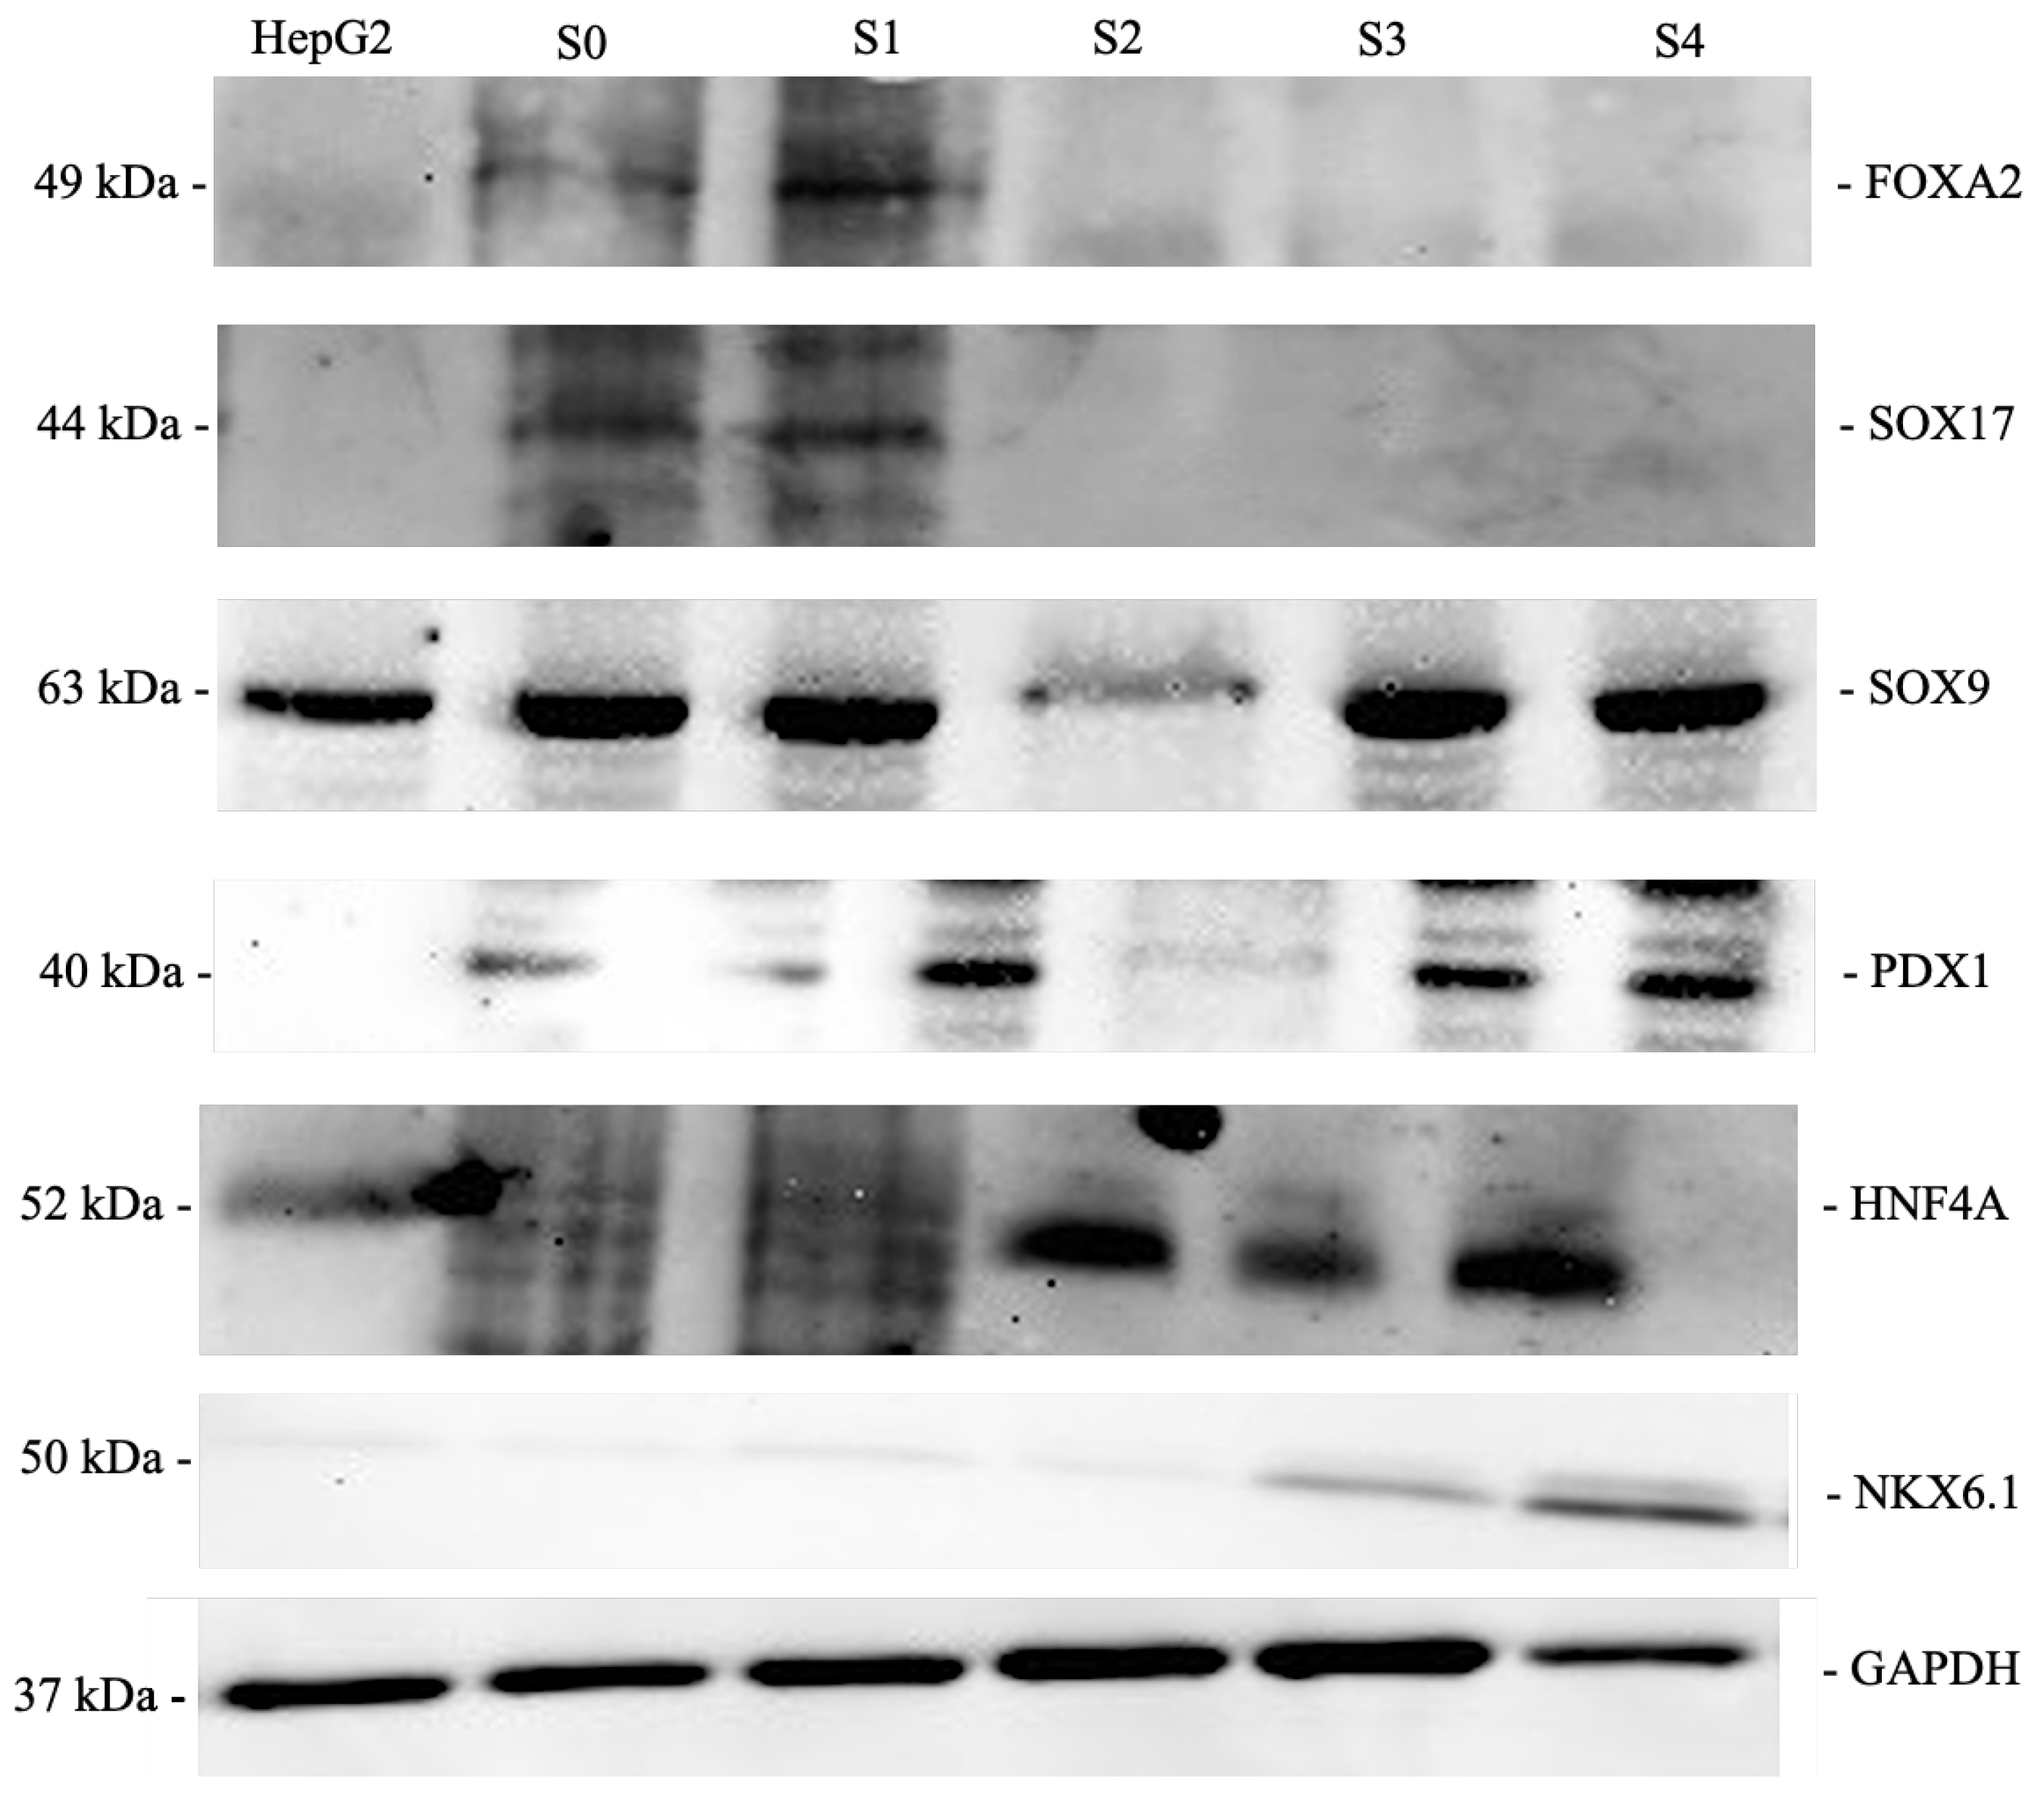
Figure 4.
Gene expression during differentiation. Line bars represent gene expression in WT iPSCs throughout the differentiation protocol, while dotted bars represent gene expression in KDM4A-KD iPSCs. Expression levels were normalized to the control (β-actin transcript). Each experiment was performed in triplicate. Bars marked with the same symbol (*) indicate a statistically significant difference compared to the control group (two-tailed, unpaired Student’s t-test, *p < 0.05). Bars marked with the same symbol (**) indicate a statistically significant difference between the two groups (WT and KDM4A-KD, two-tailed, unpaired Student’s t-test, **p < 0.05). A. Stage 0 (DE); B. Stage 1 Gene expression (PG); C. Stage 2 Gene expression (PP); D. Stage 3 Gene expression (EP); E. Stage 4 Gene expression (PβLC). foxA2: Forkhead box A2; sox17: SRY-box transcription factor 17; hnf4A: Hepatocyte nuclear factor 4 alpha; pdx1: Pancreatic and duodenal homeobox 1; sox9: SRY-box transcription factor 9; nkx6.1: Nk6 homeobox 1 protein; ngn 3: Neurogenin-3; ins: Insulin; ptf1A: Pancreas associated transcription factor 1A; sst: Somatostatin; cgc: Glucagon.
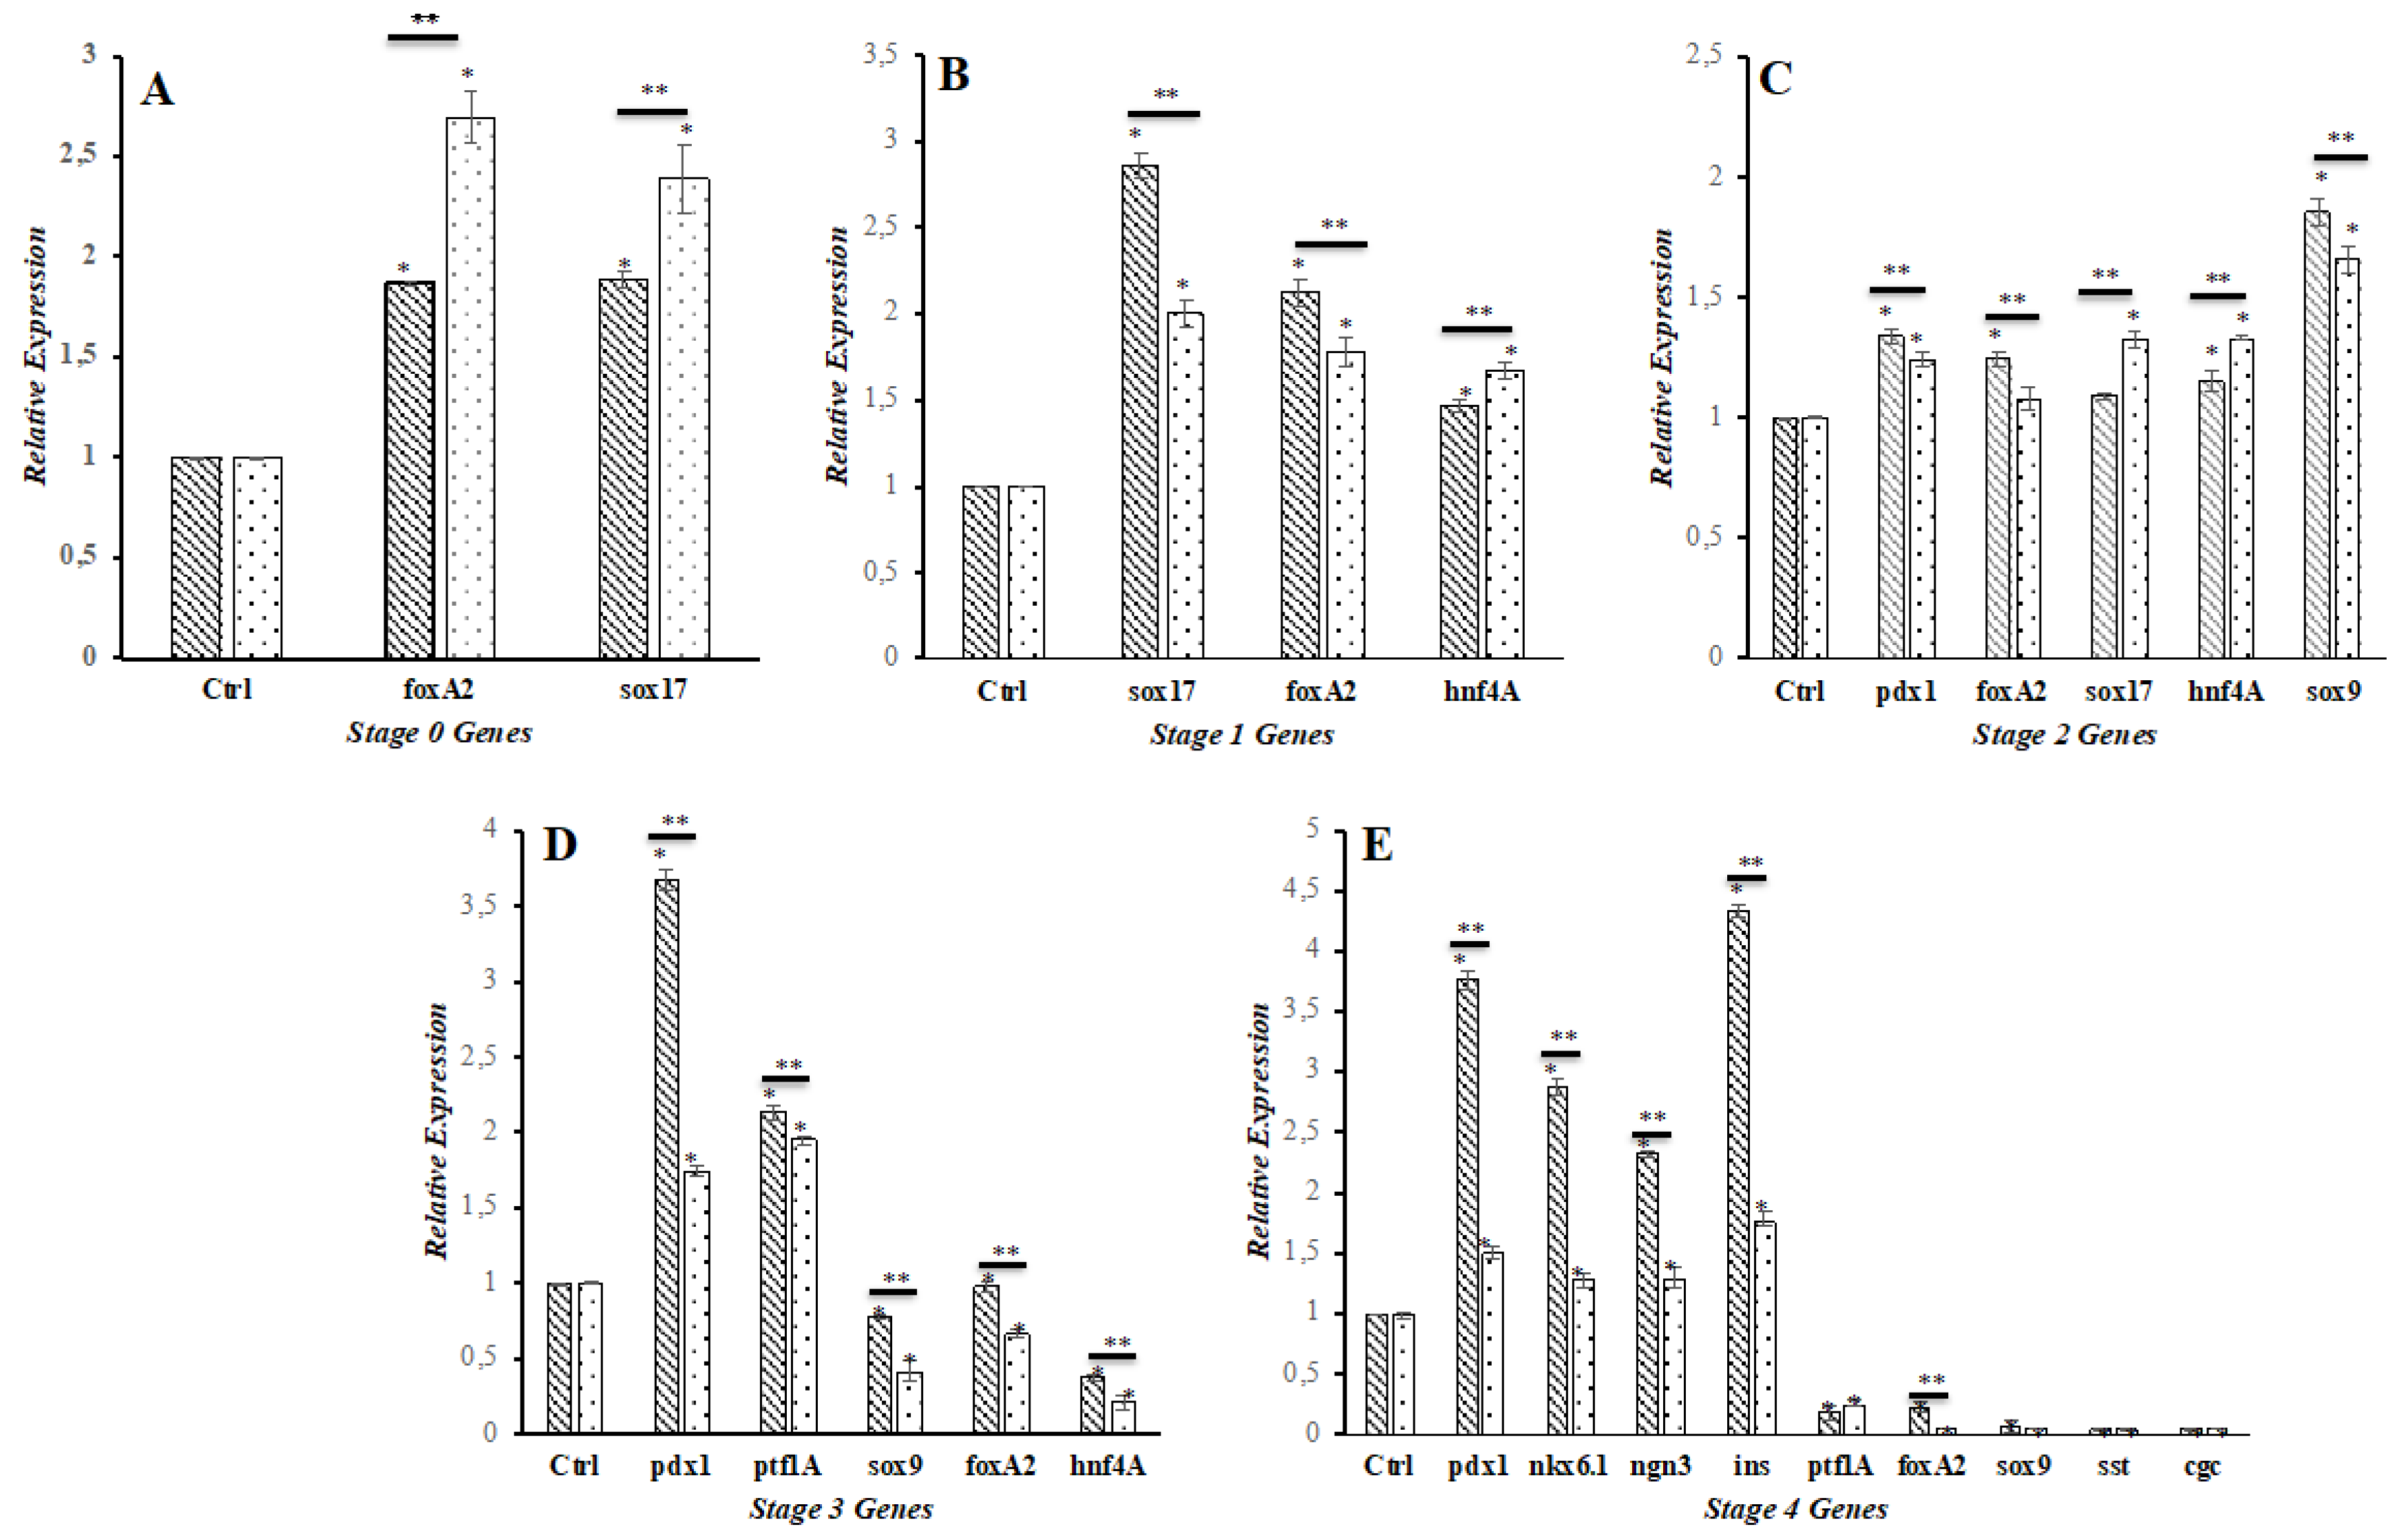
Figure 5.
ELISA measurements of human insulin. Basal insulin was measured one-hour post-treatment with 2 mM glucose (close Barr). Stimulated insulin was measured one-hour post-treatment with 20 mM glucose (open Barr). All measurements were performed by triplicate. PβLC-KD: pancreatic β-like cells KDM4A-KD; PβLC: pancreatic β-like cells; Insulin-secreting cells (INS823/13); iPSC WT: Induced pluripotent cells without differentiation. HEK293T: Human embryonic kidney cells.
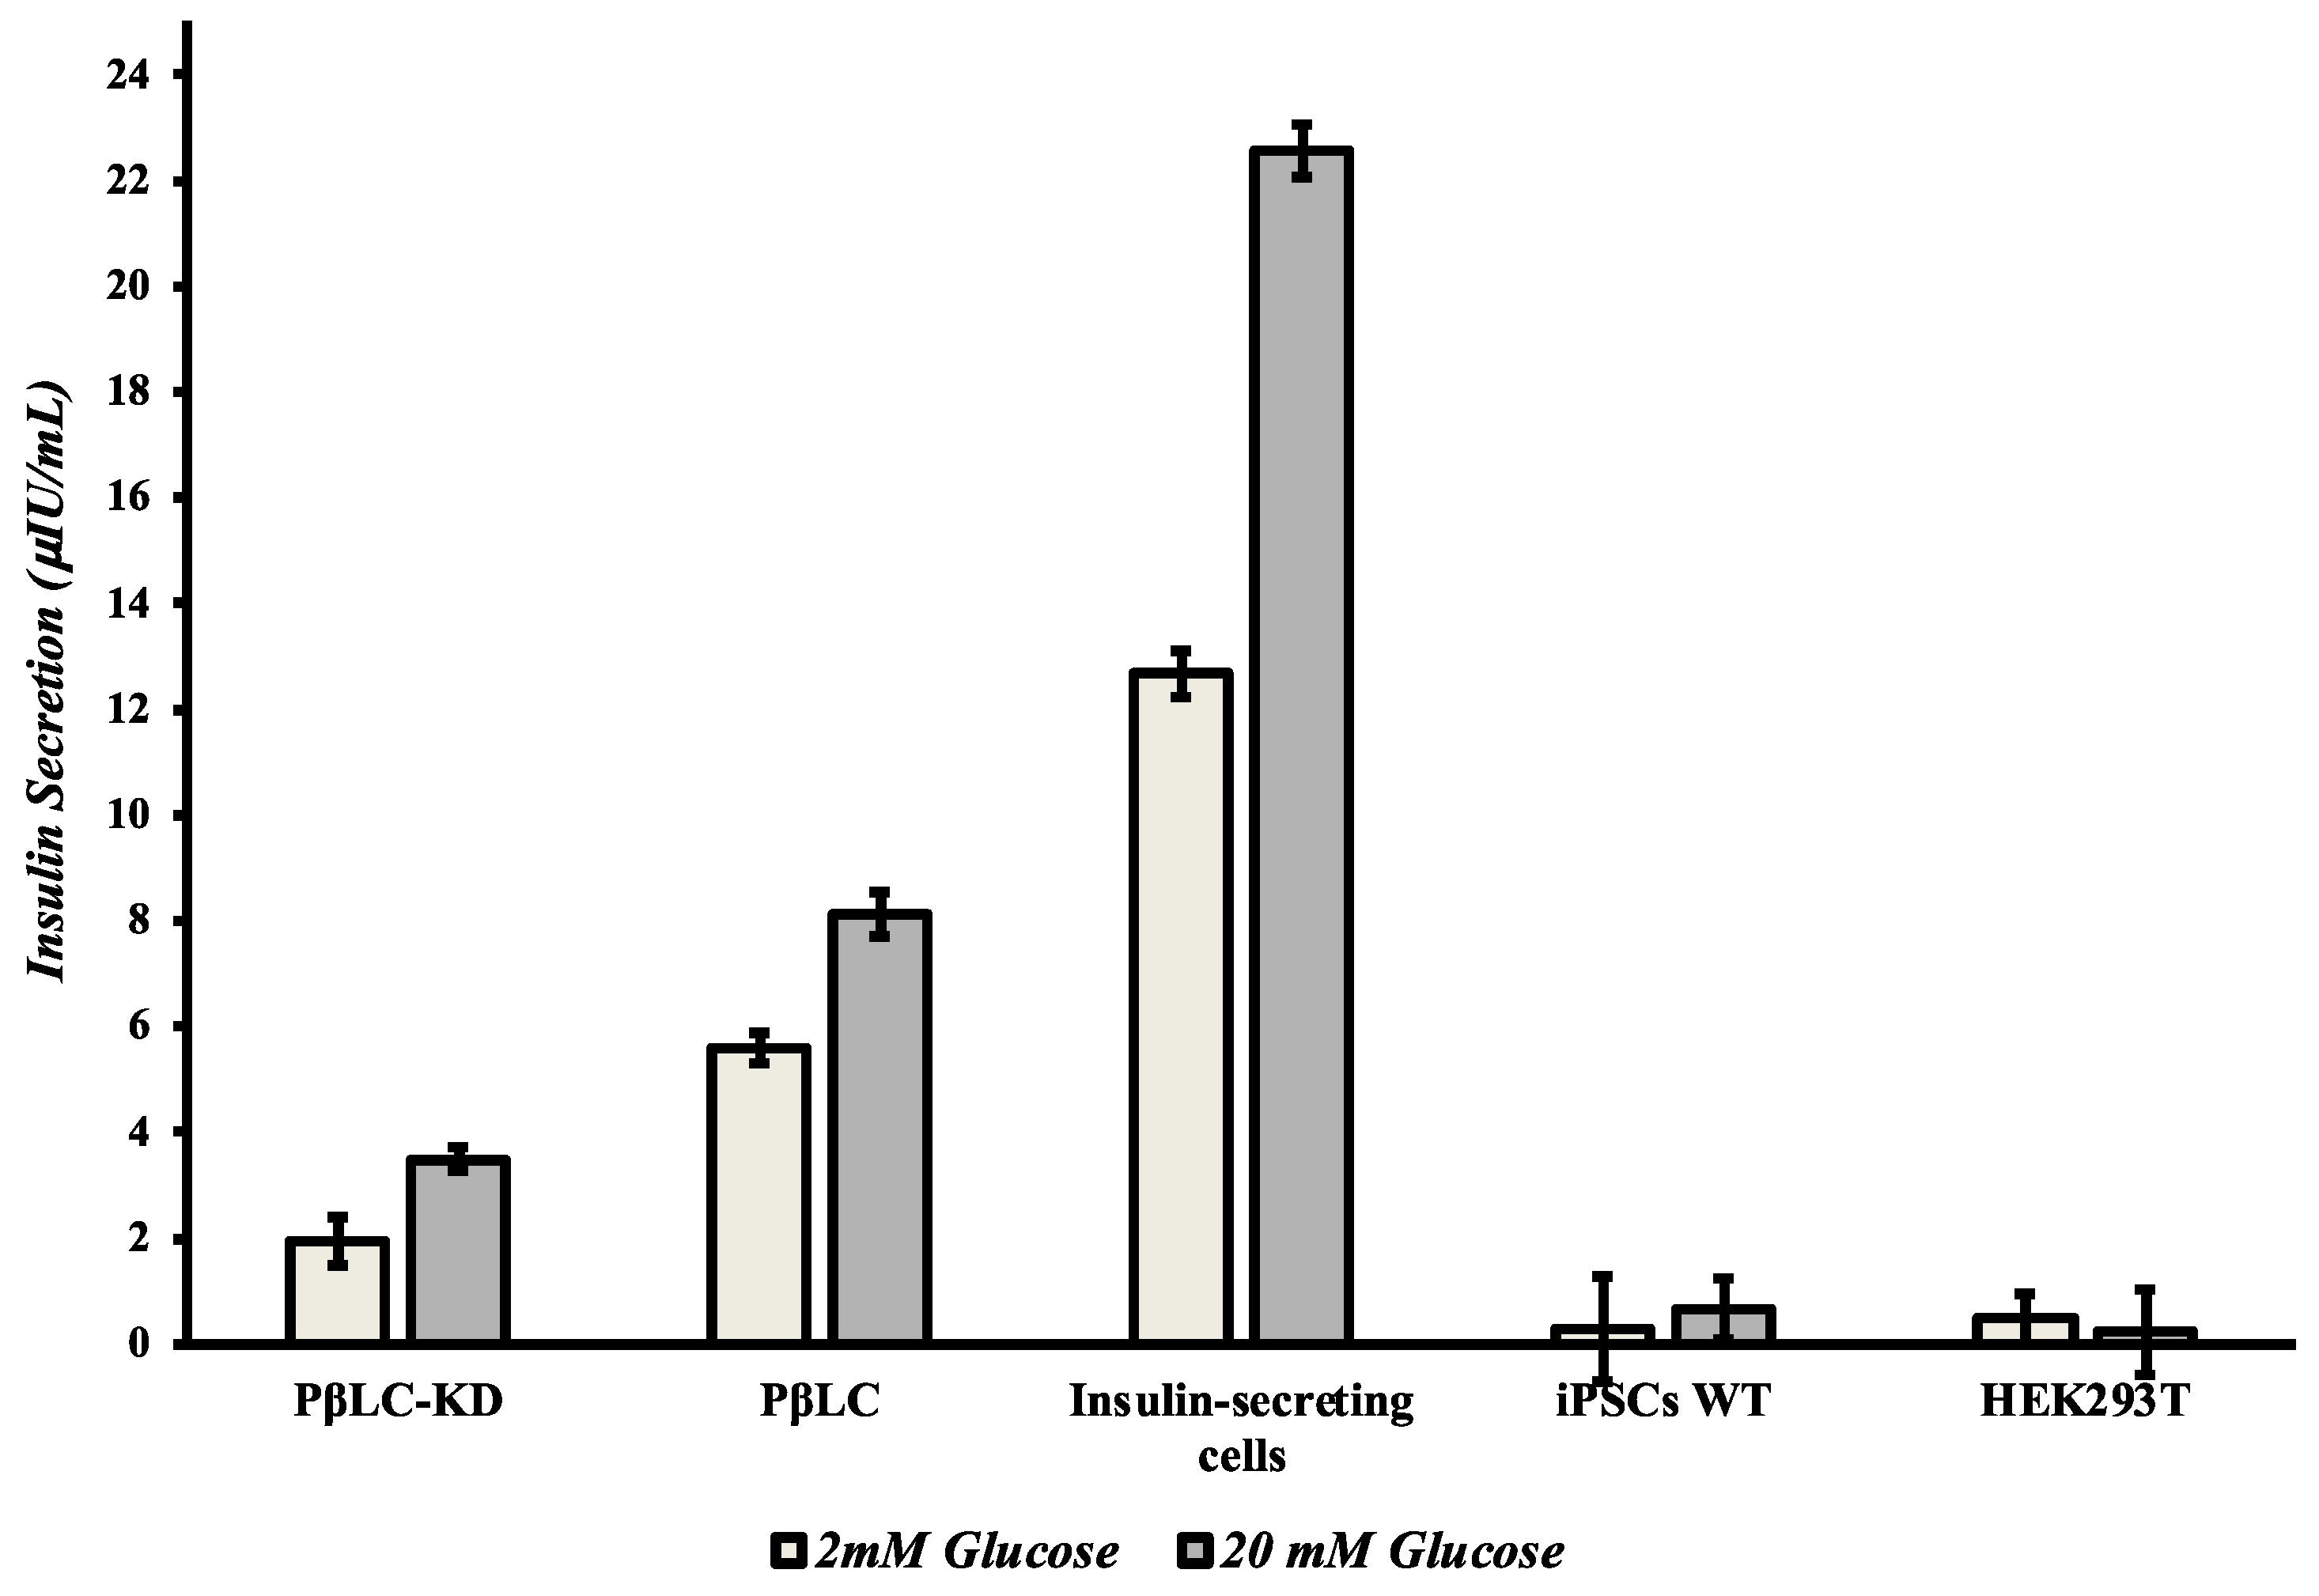
Figure 6.
A. Immunofluorescence staining showing insulin (green), DAPI (blue), and merge pictures. The results showed that PβLC and PβLC-KD express insulin in response to glucose. However, insulin production in response to glucose by PβLC-KD was lower than that of PβLC, which would be consistent with the results obtained by qRT-PCR. Scale bar = 50 µm. All images were obtained on an Eclipse Ni-E microscope (Nikon) and analyzed with ImageJ software (National Institutes of Health) at 80 ms of exposure. B. Insulin expression percentage. The fluorescence expressed by insulin was normalized to that expressed by the nucleus. Bars under the same symbol (*) are statistically different under the two-tailed, unpaired Student’s t-test (p < 0.05*; p < 0.05** n = 3). Abbreviations: A. PβLC: Pancreatic β-like cells; B. PβLC-KD: Pancreatic β-like cells KDM4A-KD. C. HepG2: Hepatoblastoma cell line (negative control). D. INS823/13: Rat insulinoma cell line (insulin-secreting cells).
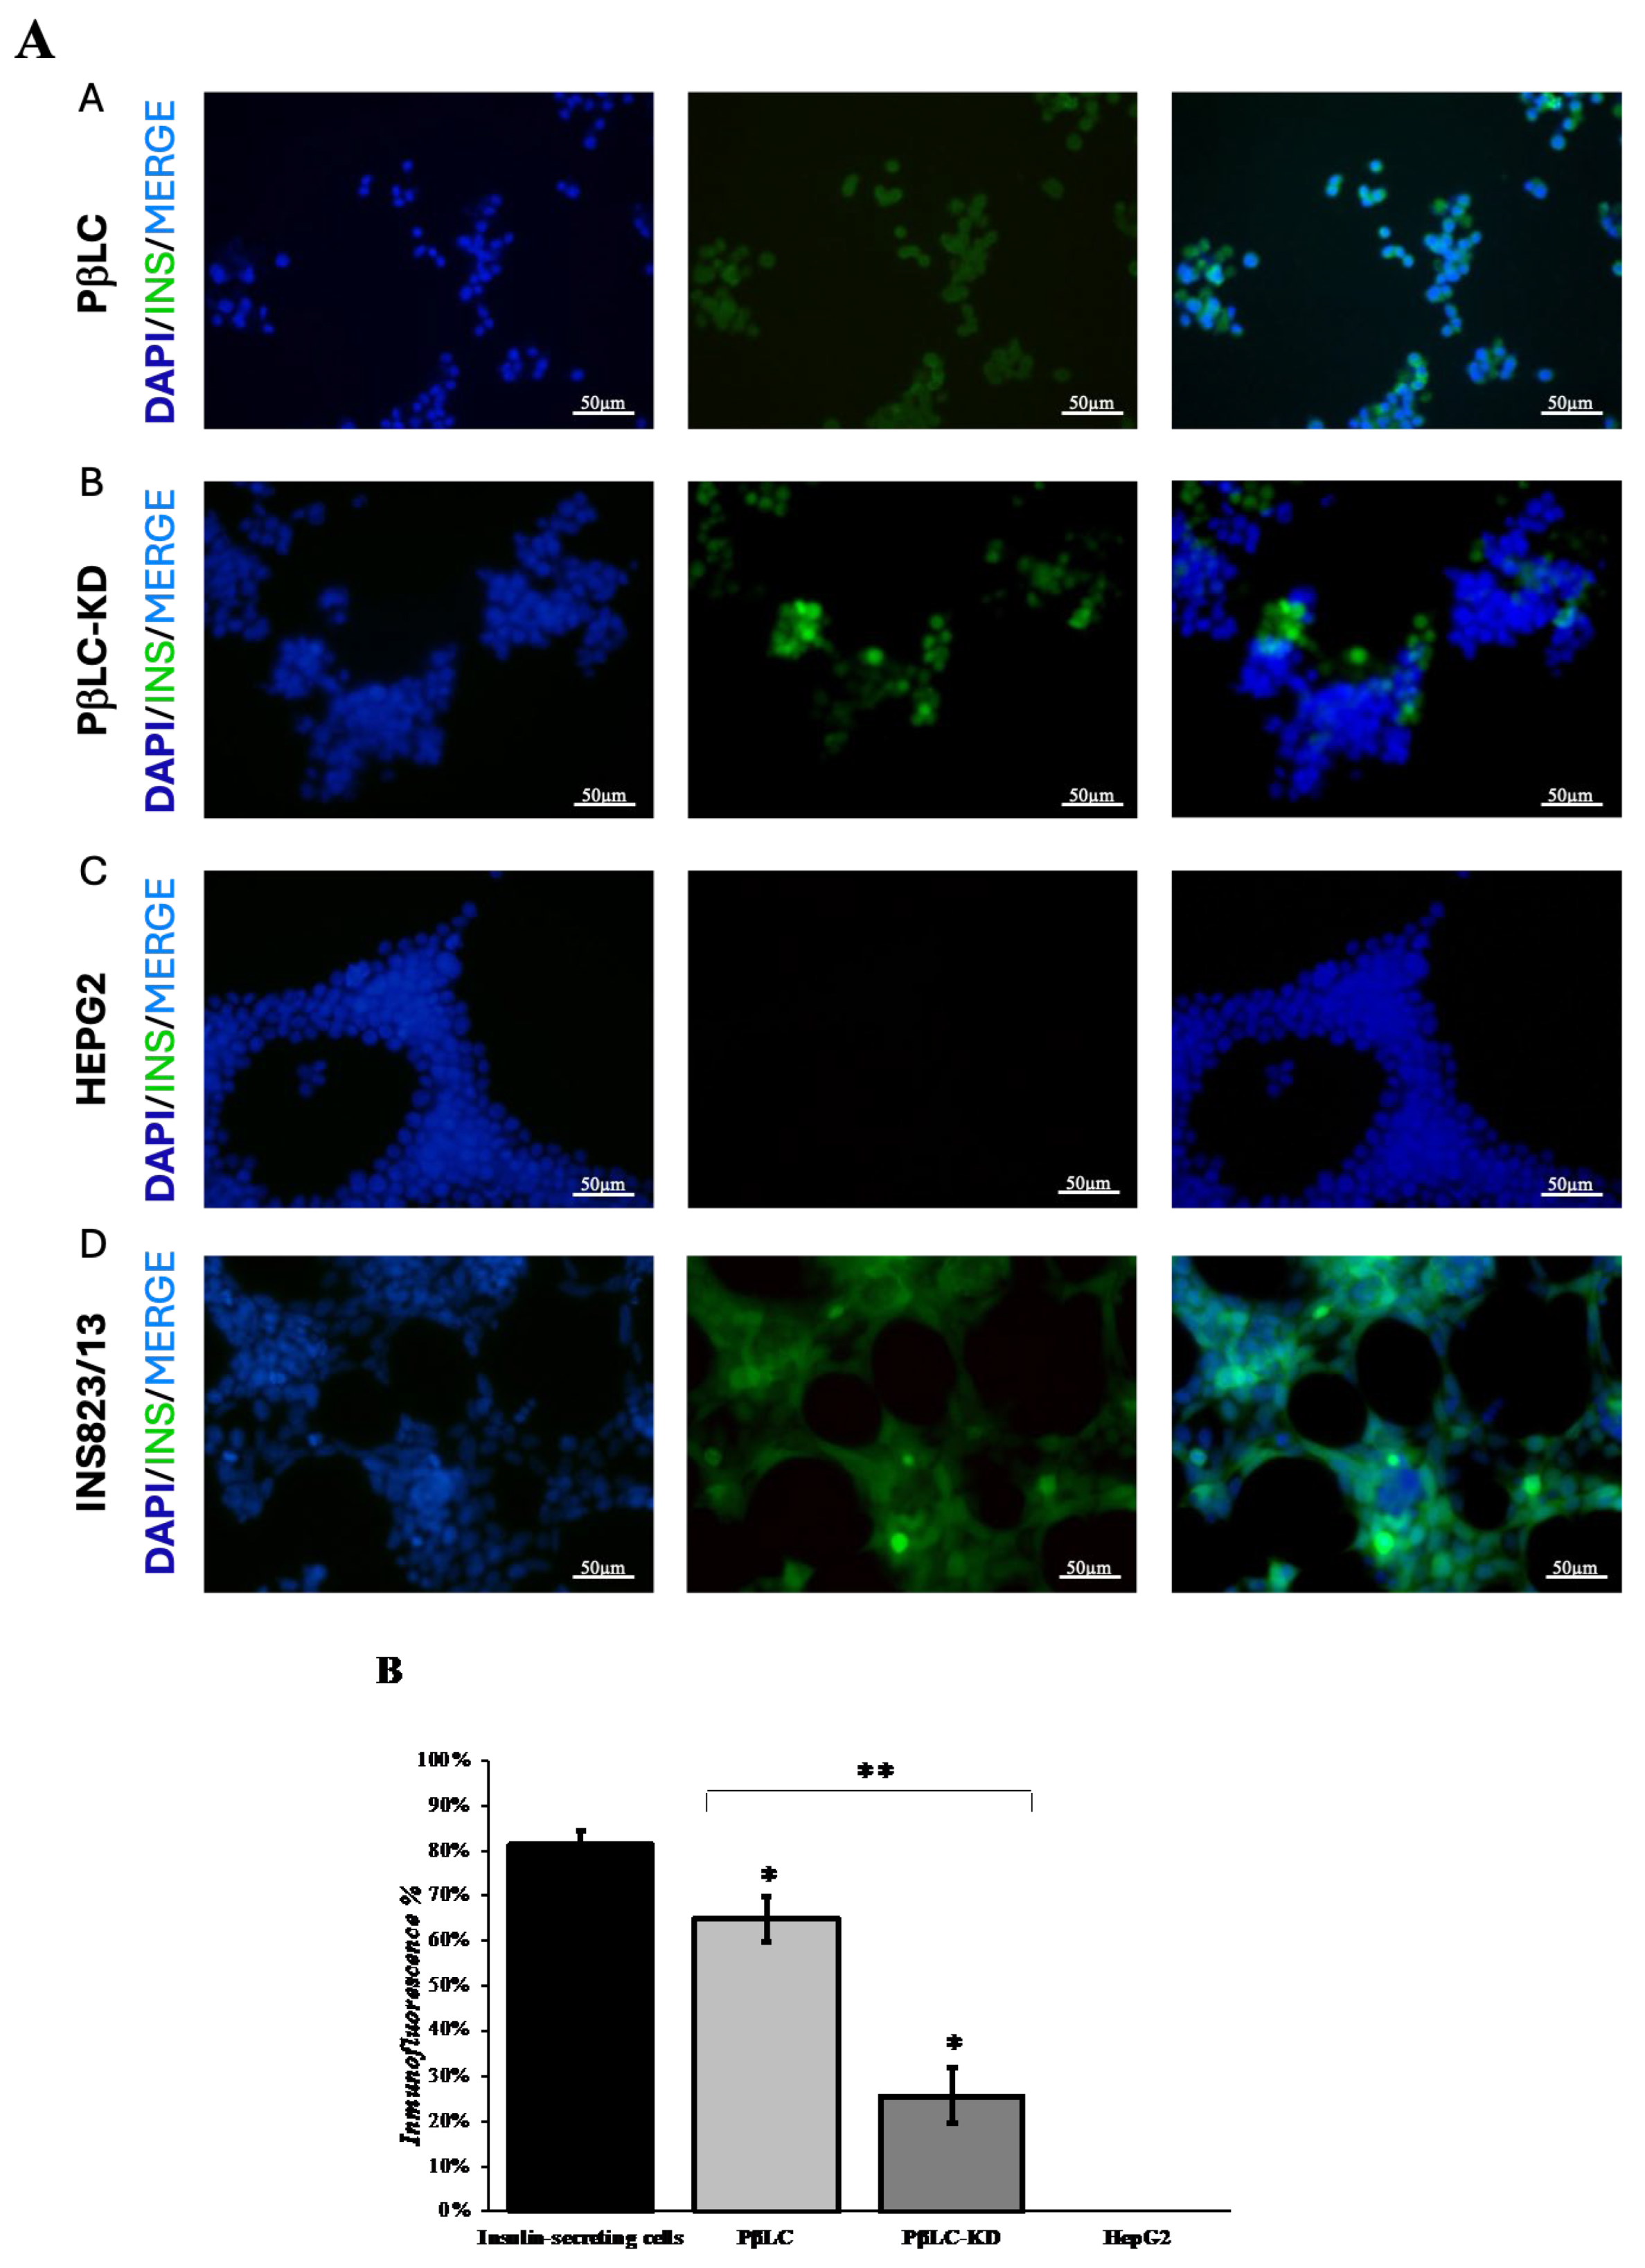

Table 1.
shKDM4A used to knock down (shKDM4A3).
| Name |
Forward CCGGGACTGCTGTTTATGCTCATTACTCGAGTAAT GAGCATAAACAGCAGTCTTTTTG |
Reverse AATTCAAAAAGACTGCTGTTTATGCTCATTACTCGAGTA ATGAGCATAAACAGCAGTC |
Table 2.
Primer list for qPCR.
| Name | Forward | Reverse |
| Kdm4a | TGCGGCAAGTTGAGGATGGTCT | GCTGCTTGTTCTTCCTCCTCATC |
| foxA2 | GGAACACCACTACGCCTTCAAC | AGTGCATCACCTGTTCGTAGGC |
| sox17 | ACGCTTTCATGGTGTGGGCTAAG | GTCAGCGCCTTCCACGACTTG |
| hnf4A | GGTGTCCATACGCATCCTTGAC | AGCCGCTTGATCTTCCCTGGAT |
| pdx1 | GAAGTCTACCAAAGCTCACGCG | GGAACTCCTTCTCCAGCTCTAG |
| sox9 | AGGAAGCTCGCGGACCAGTAC | GGTGGTCCTTCTTGTGCTGCAC |
| ptf1A | GAAGGTCATCATCTGCCATCGG | CCTTGAGTTGTTTTTCATCAGTC |
| nkx6.1 | CCTATTCGTTGGGGATGACAGAG | TCTGTCTCCGAGTCCTGCTTCT |
| ngn3 | CCTAAGAGCGAGTTGGCACTGA | AGTGCCGAGTTGAGGTTGTGCA |
| ins | ACGAGGCTTCTTCTACACACCC | TCCACAATGCCACGCTTCTGCA |
| gcg | CGTTCCCTTCAAGACACAGAGG | ACGCCTGGAGTCCAGATACTTG |
| sst | CCAGACTCCGTCAGTTTCTGCA | TTCCAGGGCATCATTCTCCGTC |
| actB | CACCATTGGCAATGAGCGGTTC | AGGTCTTTGCGGATGTCCACGT |
Disclaimer/Publisher’s Note: The statements, opinions and data contained in all publications are solely those of the individual author(s) and contributor(s) and not of MDPI and/or the editor(s). MDPI and/or the editor(s) disclaim responsibility for any injury to people or property resulting from any ideas, methods, instructions or products referred to in the content. |
© 2025 by the authors. Licensee MDPI, Basel, Switzerland. This article is an open access article distributed under the terms and conditions of the Creative Commons Attribution (CC BY) license (http://creativecommons.org/licenses/by/4.0/).
Copyright: This open access article is published under a Creative Commons CC BY 4.0 license, which permit the free download, distribution, and reuse, provided that the author and preprint are cited in any reuse.


