Submitted:
19 May 2025
Posted:
20 May 2025
You are already at the latest version
Abstract
Fish oil’s neuroprotective effects in ethanol-induced liver injury was investigated through the factor 2 (NRF2)/Kelch-like ECH-associated protein 1 (KEAP1) pathway. Male Wistar rats received a control liquid diet (C) or the ethanol diet (E), with 25% or 57% of fat replaced by fish oil (CF25, CF57, EF25, EF57) for 8 weeks. Compared to the C group, the E group exhibited brain damage, including impaired performance of Y maze and novel object recognition test, increased glial fibrillary acidic protein (GFAP)-positive astrocytes, and ionized calcium-binding adapter molecule 1 (Iba-1)-positive microglia. In the prefrontal cortex, glutathione (GSH) and phosphorylated (p)-NRF2 decreased, catalase activity increased and nqo1 mRNA declined; hippocampal NRF2 and nqo1 were also downregulated. However, compared to the E group, the EF25 and EF57 groups exhibited restored spatial and memory functions, reduced GFAP and Iba-1 expressions, potentiated β-amyloid (Aβ) clearance, and escalated catalase activity. Furthermore, increases in p-NRF2 and elevated hippocampal nqo1 mRNA expressions in the prefrontal cortex were observed in the EF25 and EF57 groups. In conclusion, fish oil ameliorated deficits in spatial and memory functions, and enhanced Aβ1-42 clearance in the prefrontal cortex and hippocampus of rats with chronic ethanol-induced liver damage by activating the NRF2/KEAP1 pathway.
Keywords:
fish oil
; alcoholic brain damage
; oxidative stress
; NRF2/KEAP1 pathway
1. Introduction
Approximately 17% of people aged 15 years and older worldwide have engaged in heavy episodic or binge drinking [1]. The latest World Health Organization (WHO) guidelines and a Lancet article clarified that there is no threshold amount of alcohol, and even the smallest volume has hazards [2,3]. Problematic episodes come from continuous heavy drinking [1]. Ethanol, the main toxic substance of alcohol beverages, is metabolized in two stages. First, ethanol is oxidized to acetaldehyde by three different axes, the microsomal ethanol oxidation system (MEOS) involving cytochrome P450 2E1 (CYP2E1), alcohol dehydrogenase (ADH), and catalase (CAT). Second, acetaldehyde is further oxidized to acetate by aldehyde dehydrogenase (ALDH) [4]. Reactive oxygen species (ROS) occur as byproducts of CYP2E1, ascribed to amassed oxidative stress in alcohol-related diseases [5].
Clinically, patients with alcohol use disorder frequently experience memory impairments, as well as behavioral and cognitive deficits [6-8]. Studies demonstrated that alcohol consumption is negatively associated with both gray matter and white matter volumes in the brain, and that binge drinking further exacerbates these negative effects on the brain’s structure [9]. Moreover, chronic alcoholic liver injury was also suggested to be correlated to memory deficits [10]. In the central nervous system (CNS), ethanol and acetate are primarily metabolized by neurons and astrocytes [11]. Sustained activation of these metabolic processes alters mitochondrial function and morphology, eventually leading to dysregulation of oxidative stress [11]. The resulting oxidant overload, due to both alcoholic liver injury and local alcohol metabolism in the brain, induces a redox imbalance, that further stimulates immune, apoptotic, and necrotic responses in neurons [12].
To counteract oxidative stress, cells activate nuclear factor erythroid 2-related factor 2 (NRF2) signaling, which is recognized as a crucial regulator in aging and various chronic diseases [13]. Under normal conditions, the Kelch-like ECH-associated protein 1 (KEAP1) complex binds to NRF2, maintaining its low levels through proteasomal degradation, but upon NRF2 recruitment to balance the redox status, protein kinase C (PKC) phosphorylates NRF2 at ser40 (p-NRF2(ser40)), leading to its detachment from KEAP1 [14]. p-NRF2 is translocated to nuclei and binds to the antioxidant response element (ARE), activating genes that code for enzymes involved in antioxidant defense and detoxification, such as NAD(P)H:quinone oxidoreductase 1 (NQO1) [15]. In addition, NRF2 plays a role in modulating inflammation by reducing an oxidative imbalance to prevent activation of nuclear factor kappa-light-chain-enhancer of activated B cells (NF-κB) and inhibiting degradation of NF-κB inducers, thus blocking NF-κB’s translocation to nuclei [16]. NRF2 signaling is therefore considered to be anti-inflammatory [16]. Chronic alcohol exposure was shown to disrupt the NRF2 system, contributing to neurodegenerative diseases, including Alzheimer’s disease (AD) and alcoholic-related brain disease (ARBD) due to β-amyloid (Aβ) aggregation in the brain [17,18,19].
Fish oil, composed primarily of eicosapentaenoic acid (EPA, 20:5) and docosahexaenoic acid (DHA, 22:6), is widely consumed as a supplement and has gained attention for its antioxidant and anti-inflammatory effects over the past decades [20]. Numerous studies proved that supplementing fish oil can alleviate metabolic diseases, such as metabolic dysfunction-associated steatotic liver disease (MASLD) [21], metabolic syndrome [22], and diabetes [23]. This protection is closely linked to the amelioration of oxidative stress [22]. NRF2 signaling was identified as a targeted pathway of polyunsaturated fatty acids (FAs; PUFAs), primarily through their electrophilic derivatives [24,25]. This provides a rationale for the beneficial effects of fish oil in neurodegenerative diseases such as Parkinson’s disease and AD [26,27]. Our previous study also demonstrated the potential benefits of fish oil in ARBD, focusing on insulin resistance by analyzing the insulin receptor substrate 1 (IRS-1)/glycogen synthase kinase-3β (GSK3β) pathway and ceramide concentration levels [28]. Therefore, we hypothesized that fish oil can reduce brain damage by mitigating oxidative stress through activation of NRF2 signaling pathways in rats with chronic alcohol exposure. This study was designed to validate this hypothesis.
2. Materials and Methods
2.1. Animal Study Protocol
Male Wistar rats were purchased from BioLASCO Taiwan (Yilan, Taiwan). At the beginning age of 6 weeks, rats were housed in plastic cages under a constant temperature at 23±2 °C and a relative humidity of 55%±10%, in an individual animal facility with a 12-h light-dark cycle. This study was approved by the Institutional Animal Care and Use Committee of Taipei Medical University (approval no.: LAC-2020-0297). During the adaption period, all rats were provided with LabDiet 5001 Rodent Diet (St. Louis, MO, USA) and water ad libitum. The ethanol induction model was established using Lieber-Decarli’s model. The control liquid diet (C) consisted of olive oil, safflower oil, and corn oil, while the ethanol liquid diet (E) replaced maltodextrin with absolute alcohol (459396, Sigma-Aldrich, St. Louis, MO, USA) in an isocaloric formulation. To observe the effects of fish oil, both diets were modified by substituting olive oil with fish oil, and fish oil was included at concentrations of 25% and 57%, resulting in the following experimental groups: CF25 and CF57 for the control diet, and EF25 and EF57 for the ethanol diet. The final monounsaturated FA (MUFA)/PUFA ratios were 0.4, 0.7, and 1.6, with n-6/n-3 ratios of 21.9, 1.9, and 0.8, respectively. Behavioral patterns and blood samples collected from tail veins were examined before the experimental period for baseline values and at the end of the experiment. After 8 weeks, rats were sacrificed, and blood was collected from the ventral aorta, followed by collection of the liver and tissues from different anatomical regions of the brain for further analyses.
2.2. Blood Biochemical Examination
All blood samples were collected in heparin-contained vacutainers (BD Bioscience, Franklin Lakes, NJ, USA) and centrifuged at 3000 rpm and 4°C for 15 min. Plasma was preserved for examination of aspartate aminotransferase (AST) and alanine aminotransferase (ALT), which was performed by ADVIA Chemistry XPT (Siemens Healthineers, Forchheim, Germany).
2.3. Behavioral Tests
2.3.1. Y Maze Spontaneous Alternation
The Y-shaped acrylic maze consisted of three arms (L 45 × W 10 × H 25 cm), each 120° apart. At the start of the experiment, a rat was placed in the center of the maze. Without interference, their instinctive visits to the three arms were recorded for 10 min. A clockwise or counterclockwise sequence of visits to each arm was defined as spontaneous alternation, scored as follows:.
2.3.2. Novel Object-Recognition (NOR) Test
The object-recognition test was composed of a three-phase cycle of habituation, training, and testing. The main concept of the NOR test is the rats’ instinctive tendency to explore novel objects. A square (59 × 59 cm) flat-bottom acrylic darkroom was used as the trial field. During habituation, rats were allowed free access to the trail field for 10 min. After 24 h, the same procedure was conducted and recorded for the open-field test. In the training phase, two identical objects were introduced into the field for 10 min. The formal test was administered and recorded after 24 h, with one of the objects replaced by a novel one. The percentage of preference for the novel object was assessed using the following formula: .
2.3.3. Behavioral Analysis
All formal behavioral tests above were recorded with a fixed camera. Noldus EthoVision (Noldus Information Technology, Wageningen, the Netherlands) was used in this study to analyze behavioral patterns of the rats.
2.4. Antioxidant and Antioxidative Enzyme Activities
Liver tissues and the prefrontal cortex were homogenized in cold potassium phosphate lysate buffer (50 mM, with 1 mM EDTA, pH 7.5) at 1:10 (w/v). Glutathione (GSH), glutathione peroxidase (GPx), glutathione reductase (GRd), superoxide dismutase (SOD), and catalase (CAT) activities were measured using commercial kits (703002, 703102, 703202, 706002, and 707002, Cayman, Ann Arbor, MI, USA). All procedures were performed following the manufacturer’s instructions.
2.5. Histopathological Evaluation and Immunohistochemical (IHC) Staining
After dissection of the liver caudate lobe and brain, tissues were preserved in a 10% formaldehyde aqueous solution, followed by paraffin embedding. Tissue sections were stained with hematoxylin and eosin (H&E). All assessments were conducted by veterinary pathologists. Fatty changes and amounts of inflammatory cell foci were observed in liver samples. Scores were calculated in a semiquantitative method. Fatty changes scores were classified from 0 (none) to 4 (> 67%). Inflammation scores were based on the number of inflammatory cell foci: fewer than 3=0, 4–10 foci=1, 11–20 foci=2, and so on, up to over 31 foci=4 [29]. For the brain, morphologies of the cortical area (CA)1/CA2/CA3 were evaluated according to Wu and Wang’s method to access the viability of neuronal cells in the hippocampus [30]. GFAP and ionized calcium-binding adaptor molecule 1 (Iba-1) were stained by IHC to respectively estimate the inflammatory status of microglial and astrocytes.
2.6. Western Blotting Analysis of the NRF2 Signaling Pathway
Liver, prefrontal cortical, and hippocampal tissues were lysed by radioimmunoprecipitation assay (RIPA) buffer containing protease and phosphatase inhibitors. Supernatants were preserved after centrifugation at 12,000 rpm and 4 °C for 30 min. Protein concentrations were quantified using the Bradford assay. Protein samples (50μg) separated by sodium dodecyl sulfate polyacrylamide gel electrophoresis (SDS-PAGE) were transferred to polyvinylidene difluoride (PVDF) membranes. Procedures followed to those of a previous study [31]. Antibodies of NRF2, p-NRF2(ser40), and KEAP1 for blotting are listed in Table A1.
2.7. Reverse-Transcription Quantitative Polymerase Chain Reaction (RT-qPCR) Analysis
Liver and prefrontal cortical samples were extracted with the Trizol reagent, while hippocampal RNA was extracted with an RNeasy Mini Kit (74104, Qiagen, Venlo, the Netherlands). Total RNA extracts were then reverse-transcribed into complementary (c)DNA using a synthesis kit (K1622, Thermo Fisher Scientific, Waltham, MA, USA). qPCRBIO SyGreen® Mix (PB20.15, PCR Biosystems, London, UK) was applied for complementary (c)DNA amplification with the QuantStudio 1 Real-Time PCR System (Thermo Fisher Scientific). Primer sequences of nuclear factor, erythroid 2 like 2 (nfe2l2), keap1, heme oxygenase 1 (hmox1), and nqo1 are shown in Table A2.
2.8. Statistical Analysis
Values are presented as the mean ± standard deviation (SD), using GraphPad Prism 9 (GraphPad Software, Boston, MA, USA). Differences between the C and E groups were examined using Students’ t-test. A one-way analysis of variance (ANOVA) was applied to compare differences among control diets (C, CF25, and CF57) and among ethanol diets (E, EF25, and EF57). A two-way ANOVA was used to analyze the effects of ethanol, fish oil, and their interaction.
3. Results
3.1. Ethanol Consumption, Body Weights (BWs), and Tissue Weights
3.2. Hepatic Damage
Compared to the C group, higher plasma AST and AST activities were observed in the E group (Table 1). Hepatic impairments caused by chronic alcohol consumption were evident as escalated fatty changes and inflammatory foci in the E group (Figure 1, p<0.001 compared to C). As the above evidence confirms, an alcoholic-damaged liver disease model was established. EF25 demonstrated lower AST, with both the EF25 and EF57 groups exhibiting improved fatty changes and inflammatory foci by H&E observations and scores of fatty changes and inflammation (Table 1, Figure 1).
3.3. Hepatic Oxidative Hemostasis Shifts
GSH concentration and activities of antioxidant enzymes, including GPx, SOD, and CAT, significantly decreased in the E group. Among these enzymes, only CAT activity was restored in the EF25 and EF57 groups (Table 2). For the NRF2/KEAP1 pathway, protein expressions of p-NRF2 and KEAP-1 were significantly elevated in the E group, with increases in both keap1 and nqo1 Mrna levels (Figure 2). Compared to the E group, the EF25 group demonstrated significantly higher keap1 and lower nqo1 Mrna levels.
3.4. Behavioral and Histopathological Changes in the Brain
The Y maze was used to assess the spatial working memory, with higher spontaneous alterations indicating better spatial memory [32]. The spontaneous alteration percentage was significantly lower in the E group (Figure 3A, p=0.0028 C vs. E). The spontaneous alteration pattern was restored in both the EF25 and EF57 groups (Figure 3A). On the other hand, NOR served as an indicator of non-spatial learning and memory [33]. Rats in a normal condition tend to explore a novel object; therefore, an impaired recognition rate of novel objects was related to memory dysfunction [33]. Compared to the C group, exploration of the novel object was significantly reduced in the E group (p = 0.0056), while the EF25 group showed a significant increase in the recognition rate (Figure 3B).
Regarding the histopathological examination of the hippocampus, the E group exhibited a greater degree of nuclear condensation in pyramidal cells within the CA1, CA2, and CA3 regions (Figure 4, C vs. E). GFAP-positive and Iba-1-positive staining appeared more frequently in the E group, indicating increased activation of astrocytes and microglia as injury markers (Figure 4B, C, C vs. E) [34]. Following fish oil administration, expressions of both GFAP and Iba-1 were reduced in the EF25 and EF57 groups (Figure 4B, C).
As to Aβ1-40 levels, the only notable change was higher hippocampal Aβ1-40 in the CF25 group compared to the C group. On the other hand, no significant differences in Aβ1-42 levels were observed in either the prefrontal cortex or hippocampus of the E group, although a trend toward significance was noted in the hippocampus when compared to the C group (p = 0.06, Figure 4D). Both the EF25 and EF57 groups showed lower Aβ1-42 levels and ratios of Aβ1-42/Aβ1-40 compared to the E group in the prefrontal cortex, while in the hippocampus, only the EF57 group showed significantly lower Aβ1-42 levels (Figure 4D, E vs. EF57).
3.5. Antioxidant Defense in the Prefrontal Cortex
The GSH concentration was significantly reduced in the E group compared to the C group (Table 3, p=0.0270). However, no change was observed among the E, EF25, and EF 57 groups (Table 3). Regarding antioxidant enzymes, only CAT activity was markedly elevated in the E group (p=0.0201, C vs. E), and EF57 group also exhibited a higher level compared to the E group (Table 3).
3.6. The NRF2/KEAP1 Pathway in the Prefrontal Cortex and Hippocampus
In the prefrontal cortex, p-NRF2(Ser40) protein expression was significantly inhibited in the E group compared to the C group, whereas the EF25 and EF57 groups showed significantly higher p-NRF2(Ser40) protein expression than the E group (Figure 5A). This suppression was accompanied by a decrease in nqo1 mRNA levels in the E group. Interestingly, keap1 mRNA expression was also reduced in the E group (Figure 5B). However, no difference was found among the E, EF25 and EF 57 groups in mRNA levels of nqo1 or keap1 (Figure 5B).
In the hippocampus, NRF2 protein expression was significantly inhibited, which contributed to a higher p-NRF2/NRF2 ratio; however, the nqo1 mRNA level was significantly lower in the E group compared to the C group (Figure 6). Notably, nqo1 mRNA levels were restored in the EF25 and EF57 groups (Figure 6B).
4. Discussion
4.1. Ethanol Administration Amount
Daily ethanol consumption was approximately 8.9–9.3 g/kg BW in the three ethanol-fed groups. This corresponds to roughly 90 g of ethanol for a 60-kg adult, equivalent to more than six standard drinks per day. According to the National Institute on Alcohol Abuse and Alcoholism (NIAAA), this meets the criteria for a heavy drinker [35]. The latest EASL-EASD-EASO Clinical Practice Guidelines suggest that this level of alcohol consumption in patients with steatotic liver diseases should be classified as alcoholic liver disease (ALD) [36].
4.2. Ethanol-Induced Hepatic Injury and Fish Oil
4.2.1. Ethanol and Hepatic Injury
Rats fed ethanol-containing liquid diets without fish oil exhibited elevated AST and ALT activities, along with severe hepatic oil droplet accumulation, inflammatory cell infiltration, and CYP2E1 overexpression. Consistent with previous reports using the Lieber-DeCarli diet, alcohol-induced hepatic steatosis and inflammation were successfully established, resembling the early stage of ALD [29,37].
4.2.2. Ethanol-Induced Hepatic injury, Oxidative Stress, and the NRF2/KEAP1 Pathway
GSH levels and GPx, SOD, and CAT activities had decreased after 8 weeks of ethanol intake (Table 2, C vs. E). However, p-NRF2 was found to be elevated in the E group, along with higher KEAP1 protein expression and mRNA levels (Figure 2, C vs. E). As the primary organ responsible for ethanol metabolism, when exposed to prolonged ethanol intake, the liver depletes alcohol dehydrogenase and over-activates CYP2E1 to oxidize ethanol. This leads to increased production of reactive oxygen species (ROS) and other free radicals, further worsening the redox imbalance [38]. In response to overwhelming CYP2E1-derived oxidative stress, hepatocytes may enhance NRF2 signaling as an adaptive mechanism [39]. Not performing as expected, the antioxidant systems did not work in concert by upregulating NRF2. GSH and antioxidant enzymes are often found to show low abundances in patients with liver diseases and in chronic alcoholic rodent models [37,40,41]. This phenomenon may be attributed to the involvement of specific enzymes and antioxidants in ethanol metabolism and in the detoxification of its byproduct, hydrogen peroxide (H2O2) [42,43], despite activation of the NRF2 signaling pathway.
4.2.3. Fish Oil and Ethanol-Induced Hepatic Injury
Fish oil ameliorated lipid accumulation and inflammatory foci and elevated CAT activity (Table 2, Figure 1, E vs. EF25, EF57). A UK Biobank study found that omega-3 PUFA supplementation significantly reduced the risk of ALD [44]. Omega-3 PUFAs were shown to mitigate alcohol-induced hepatic steatosis by activating free FA receptor 4 (FFA4) in Kupffer cells, leading to reduced lipid accumulation and inflammation [45]. In our previous study, we demonstrated that partial fish oil replacement may enhance FA oxidation by upregulating mRNA expressions of downstream FA-oxidative enzymes, such as medium-chain acyl-coenzyme A dehydrogenase (MCAD) and carnitine palmitoyl transferase (CPT)-1, ultimately attenuating ethanol-induced hepatic steatosis in rats subjected to chronic ethanol feeding [46].
On the other hand, substitution of fish oil in the ethanol-liquid diet also increased hepatic CAT activity, while decreasing the nqo1 mRNA level (Table 2, Figure 2B; E vs. EF25, EF57). Siegel et al. confirmed that nqo1 possesses SOD activity, both as a purified recombinant protein and in cellular systems expressing nqo1 [47]. Therefore, elevation of CAT activity observed with fish oil substitution might be related to enhanced ethanol clearance [48], thereby reducing the accumulation of oxidative adducts.
Additionally, hmox1 and nqo1 are phase II detoxifying enzymes regulated by upstream pathways and their expressions might not have been activated under the current experimental conditions [49]. The protective effect of fish oil may become more evident through modulation of upstream regulators, such as inflammation-related signals like hypoxia-inducible factor (HIF)-1α [50].
4.3. Ethanol-Induced Brain Damage and Fish Oil
4.3.1. Ethanol-Induced Behavioral Impairment and Brain Damage
Chronic alcohol exposure led to poorer performances in both the Y-maze and NOR tests, respectively indicating impairments in spatial memory and recognition ability (Figure 3, C vs. E) [51]. Additionally, increased expressions of Iba-1 and GFAP in the E group suggested neuroinflammation or glial activation, which contributed to ethanol-induced brain damage (Figure 4A-C). Cognitive deficits associated with alcohol abuse are most frequently observed in visuospatial processing, memory, and executive function [52]. Spatial learning depends on the coordinated activity of the prefrontal cortex and hippocampus [53,54].
However, no significant Aβ accumulation was observed in the prefrontal cortex or hippocampus (Figure 4D). Gong et al. reported that chronic ethanol consumption induces Aβ overproduction and oxidative stress in the mouse brain [55]. In their study, the Aβ level was measured using whole-brain samples, whereas in this study, a specific brain region was analyzed. This methodological difference may partly explain the lack of observable changes of Aβ overproduction induced by chronic ethanol intake in this study.
4.3.2. Ethanol-Induced Brain Oxidative Stress and the NRF2/KEAP1 Pathway
When rats were subjected to chronic ethanol feeding, the GSH level was depleted, while CAT activity was elevated in the prefrontal cortex (Table 3, C vs. E). Moreover, protein expression levels of p-NRF2 and KEAP1 were suppressed, accompanied by a corresponding decrease in nqo1 mRNA levels in the prefrontal cortex (Figure 5, C vs. E). Taken together, although the NRF2 signaling pathway was inhibited, that did not suppress antioxidant enzyme activity; on the contrary, CAT activity increased. These findings suggest that CAT activity in the prefrontal cortex may be regulated through NRF2-independent pathways, possibly as a compensatory response to chronic ethanol-induced oxidative stress.
On the other hand, the hippocampus exhibited lower total NRF2 protein expression, which resulted in a higher ratio of p-NRF2 to total NRF2, along with a decreased mRNA level of nqo1 under chronic ethanol intake (Figure 6, C vs. E). A previous study suggested that the prefrontal cortex is more vulnerable to alcohol exposure than the hippocampus, potentially due to DNA damage and impairments in one-carbon metabolism [56]. This regional difference in vulnerability may help explain the distinct molecular responses observed in this study, such as the more-pronounced changes in NRF2 signaling and redox-related gene expressions in the prefrontal cortex. On the other hand, the hippocampus showed milder transcriptional changes, which may reflect a greater resilience to ethanol-induced oxidative stress. However, due to limited sample quantity, antioxidant enzyme activities in the hippocampus were not measured. Future studies with sufficient sample availability are warranted to assess enzyme activity levels in the hippocampus and further clarify its redox status under chronic ethanol exposure. As histological evidence of hippocampal injury was observed, parallel analysis of the prefrontal cortex will be crucial for a more-comprehensive understanding of region-specific vulnerability to ethanol-induced damage.
Fish oil improved spatial and short-term memory performances in rats under 8-week ethanol administration (Figure 3A, B, E vs. EF25, EF57). Fish oil also showed an ability to clear Aβ1-42 in both the prefrontal cortex and hippocampus (Figure 4C, E vs. EF25, EF57). A systematic review suggested that omega-3 PUFA intake can enhance learning, memory, cognitive function, and cerebral blood flow [57]. Furthermore, omega-3 PUFA supplementation was reported to improve spatial and learning memory in both adult and adolescent male rats [58,59]. In addition, fish oil significantly attenuated chronic alcohol-induced aberrant dendritic morphological changes in medium-sized spiny neurons within both the core and shell regions of the nucleus accumbens [60]. Taken together, these findings support the protective role of fish oil in mitigating ethanol-related memory impairments.
In addition, from the perspective of Aβ-related brain damage, supplementation with EPA was shown to reduce Aβ concentrations, while omega-3 PUFAs might promote Aβ clearance through the glymphatic system [61,62]. As discussed above, Aβ accumulation did not appear after 8 weeks of ethanol administration. Nevertheless, fish oil enhanced Aβ scavenging, suggesting this as one of its protective properties in ARBD.
In the prefrontal cortex, p-NRF2 levels were significantly elevated, accompanied by increased CAT activity in rats fed an ethanol-containing diet substituted with fish oil (Figure 5A, Table 3, E vs. EF25, EF57). Omega-3 PUFAs were shown to activate the NRF2 signaling pathway, thereby upregulating antioxidant proteins such as heme oxygenase (HO)-1 in models of ischemic brain injury [63]. Notably, 4-hydroxy-2E-hexenal (4-HHE), an end-product of n-3 PUFA peroxidation, may contribute to this effect, as it is recognized as a potent NRF2 inducer [63]. Modulating dietary omega-3 PUFAs also enhanced antioxidant proteins through an NRF2/KEAP1-dependent mechanism in the mice hippocampus [64]. These findings suggest that fish oil may enhance antioxidant defense mechanisms via partial activation of the NRF2 signaling pathway. Although the total NRF2 protein and certain downstream antioxidant genes such as nqo1 were not upregulated in this study, the observed increase in p-NRF2 indicates potential activation of redox-sensitive transcriptional regulation. This selective or region-specific activation may reflect a targeted response to oxidative stress, in which CAT–an important enzyme in hydrogen peroxide detoxification–is prioritized. Moreover, the lipid composition of fish oil, rich in omega-3 PUFAs, may modulate membrane dynamics and cellular signaling pathways, thereby influencing the redox response [65]. These molecular findings are consistent with behavioral improvements and histological protection observed in this study, further supporting the neuroprotective potential of fish oil supplementation under chronic ethanol exposure.
Although this study provides important insights into the protective effects of fish oil supplementation under chronic ethanol exposure, several limitations remain that warrant further investigation. Due to limited brain tissue availability, antioxidant enzyme activities in the hippocampus and histopathological alterations in the prefrontal cortex were not analyzed. Given the region-specific responses observed at the molecular level, it is essential for future studies to include both biochemical and histological assessments in these brain regions to establish clearer links between molecular changes and structural or functional outcomes. Moreover, considering the well-recognized anti-inflammatory and antioxidant properties of fish oil [58], future research should also explore its effects through broader mechanistic lenses. These include modulation of inflammatory signaling pathways and the roles of bioactive lipid mediators such as 4-HHE and ceramides, which may contribute to neuroprotection in ways beyond the NRF2 signaling pathway. A more-holistic understanding of fish oil’s impacts on brain health may facilitate the development of nutritional strategies for preventing or attenuating alcohol-related neurotoxicity.
5. Conclusions
Fish oil ameliorated spatial and memory declines and potentiated Aβ1-42 clearance in the prefrontal cortex and hippocampus in rats with chronic ethanol-induced liver damage. These effects might be attributed to activation of the NRF2/KEAP1 pathway, including increased p-NRF2(ser40) in the prefrontal cortex, elevated nqo1 mRNA in the hippocampus, elevated CAT activity, all of which contribute to reducing oxidative stress in the brain.
Author Contributions
Conceptualization, H.S. and S.-C.Y.; methodology, H.S. and S.-C.Y.; validation, Q.X., Y.-H.C, H.-A.N, and L.-C.F.; formal analysis, Q.X.; investigation, Q.X.; resources, S.-C.Y.; data curation, Q.X., Y.-H.C, H.-A.N, L.-C.F., and J.-H.L.; writing–original draft preparation, Q.X. and S.-C.Y.; writing–review and editing, Q.X. and S.-C.Y.; supervision, S.-C.Y.; project administration, S.-C.Y.; funding acquisition, S.-C.Y. All authors have read and agreed to the published version of the manuscript.
Funding
This research was funded by the National Science and Technology Council, Taipei, Taiwan, grant number NSTC 113-2320-B-038-041 and MOST 110-2320-B-038-049.
Institutional Review Board Statement
The animal study protocol was approved by the Institutional Animal Care and Use Committee of Taipei Medical University (protocol code LAC-2020-0297)
Data Availability Statement
The data that support the findings of this study are available from the corresponding author upon reasonable request.
Acknowledgments
The authors would like to acknowledge the Laboratory Animal Center at TMU for technical support in the animal experiment.
Conflicts of Interest
The authors declare no conflicts of interest.
Abbreviations
The following abbreviations are used in this manuscript:
| 4-HHE | 4-hydroxy-2E-hexenal |
| AD | Alzheimer’s disease |
| ADH | alcohol dehydrogenase |
| ALD | alcoholic liver disease |
| ALDH | aldehyde dehydrogenase |
| ALT | alanine aminotransferase |
| ANOVA | analysis of variance |
| ARBD | alcoholic-related brain disease |
| ARE | antioxidant response element |
| AST | aspartate aminotransferase |
| Aβ | β-amyloid |
| BW | body weight |
| CAT | catalase |
| CNS | central nervous system |
| CPT | carnitine palmitoyl transferase |
| CYP2E1 | cytochrome P450 2E1 |
| DHA | docosahexaenoic acid |
| EPA | eicosapentaenoic acid |
| GFAP | glial fibrillary acidic protein |
| GPx | glutathione peroxidase |
| GRd | glutathione reductase |
| GSH | glutathione |
| GSK3β | glycogen synthase kinase-3β |
| HIF | hypoxia-inducible factor |
| hmox1 | heme oxygenase 1 |
| HO | heme oxygenase |
| Iba-1 | ionized calcium-binding adapter molecule 1 |
| IHC | histopathological evaluation and immunohistochemical |
| IRS-1 | insulin receptor substrate 1 |
| KEAP1 | kelch-like ECH-associated protein 1 |
| MASLD | metabolic dysfunction-associated steatotic liver disease |
| MCAD | medium-chain acyl-coenzyme A dehydrogenase |
| MEOS | microsomal ethanol oxidation system |
| MUFA | monounsaturated fatty acid |
| nfe2l2 | nuclear factor, erythroid 2 like 2 |
| NF-κB | nuclear factor kappa-light-chain-enhancer of activated B cells |
| NIAAA | National Institute on Alcohol Abuse and Alcoholism |
| NOR | novel object-recognition |
| NQO1 | NAD(P)H:quinone oxidoreductase 1 |
| NRF2 | nuclear factor erythroid 2-related factor 2 |
| PKC | protein kinase C |
| PUFAs | polyunsaturated fatty acids |
| PVDF | polyvinylidene difluoride |
| RIPA | radioimmunoprecipitation assay |
| ROS | reactive oxygen species |
| SDS-PAGE | sodium dodecyl sulfate polyacrylamide gel electrophoresis |
| SOD | superoxide dismutase |
| WHO | World Health Organization |
Appendix A

Table A1.
Antibodies used for Western blotting.
| Antibody | Type | Product No. | Source | |
| Primary antibody | p-NRF2(ser40) | polyclonal | bs-2013R | Bioss Antibodies |
| NRF2 | polyclonal | 16396-1-AP | Proteintech Group | |
| KEAP1 | polyclonal | 10503-2-AP | Proteintech Group | |
| Internal controls | β-actin | monoclonal | sc-47778 | Santa Cruz Biotechnology |
| GAPDH | monoclonal | MAB374 | Millipore | |
| Secondary antibody | anti-mouse IgG | HRP conjugated | #405306 | BioLegend |
| anti-rabbit IgG | HRP conjugated | #406401 | BioLegend |
Table A2.
Primers used for RT-qPCR.
| Forward 5’→3’ | Reverse 3’→5’ | GenBank No. | |
| NFE2L2 | CTCTCTGGAGACGGCCATGACT | CTGGGCTGGGGACAGTGGTAGT | NM_001399173.1 |
| KEAP1 | TGGGTCAAATACGACTGCCC | GCAGGATCTCGCACTTTTGC | NM_057152.2 |
| HMOX1 | GAGCGAAACAAGCAGAACCC | ACCTCGTGGAGACGCTTTAC | NM_012580.2 |
| NQO1 | TCCGAAGCATTTCAGGGTCG | TCTGCGTGGGCCAATACAAT | NM_017000.3 |
| GAPDH | AGTGCCAGCCTCGTCTCATA | GATGGTGATGGGTTTCCCGT | NM_017008.4 |
References
- World Health Organization. Global status report on alcohol and health and treatment of substance use disorders, G: Health Organization, 2024.
- No level of alcohol consumption is safe for our health. Available online: https://www.who.int/europe/news/item/04-01-2023-no-level-of-alcohol-consumption-is-safe-for-our-health (accessed on 10-04-2025).
- Anderson, B.O.; Berdzuli, N.; Ilbawi, A.; Kestel, D.; Kluge, H.P.; Krech, R.; Mikkelsen, B.; Neufeld, M.; Poznyak, V.; Rekve, D. Health and cancer risks associated with low levels of alcohol consumption. The Lancet Public Health 2023, 8, e6–e7. [Google Scholar] [CrossRef] [PubMed]
- Cederbaum, A.I. Alcohol metabolism. Clin Liver Dis 2012, 16, 667–685. [Google Scholar] [CrossRef] [PubMed]
- Tsermpini, E.E.; Plemenitaš Ilješ, A.; Dolžan, V. Alcohol-induced oxidative stress and the role of antioxidants in alcohol use disorder: a systematic review. Antioxidants 2022, 11, 1374. [Google Scholar] [CrossRef] [PubMed]
- Evert, D.L.; Oscar-Berman, M. Alcohol-Related Cognitive Impairments: An Overview of How Alcoholism May Affect the Workings of the Brain. Alcohol Health Res world 1995, 19, 89–96. [Google Scholar]
- Ariesen, A.D.; Neubert, J.H.; Gaastra, G.F.; Tucha, O.; Koerts, J. Risky Decision-Making in Adults with Alcohol Use Disorder-A Systematic and Meta-Analytic Review. J Clin Med 2023, 12. [Google Scholar] [CrossRef]
- Kamarajan, C.; Pandey, A.K.; Chorlian, D.B.; Meyers, J.L.; Kinreich, S.; Pandey, G.; Subbie-Saenz de Viteri, S.; Zhang, J.; Kuang, W.; Barr, P.B.; et al. Predicting Alcohol-Related Memory Problems in Older Adults: A Machine Learning Study with Multi-Domain Features. Behav Sci (Basel) 2023, 13. [Google Scholar] [CrossRef]
- Topiwala, A.; Ebmeier, K.P.; Maullin-Sapey, T.; Nichols, T.E. No safe level of alcohol consumption for brain health: observational cohort study of 25,378 UK Biobank participants. MedRxiv 2021, 2021–05. [Google Scholar]
- King, J.A.; Nephew, B.C.; Choudhury, A.; Poirier, G.L.; Lim, A.; Mandrekar, P. Chronic alcohol-induced liver injury correlates with memory deficits: Role for neuroinflammation. Alcohol 2020, 83, 75–81. [Google Scholar] [CrossRef]
- Waddell, J.; McKenna, M.C.; Kristian, T. Brain ethanol metabolism and mitochondria. Curr Top in Biochem Res 2022, 23, 1–13. [Google Scholar]
- Kamal, H.; Tan, G.C.; Ibrahim, S.F.; Shaikh, M.F.; Mohamed, I.N.; Mohamed, R.M.P.; Hamid, A.A.; Ugusman, A.; Kumar, J. Alcohol Use Disorder, Neurodegeneration, Alzheimer's and Parkinson's Disease: Interplay Between Oxidative Stress, Neuroimmune Response and Excitotoxicity. Front Cell Neurosci 2020, 14, 282. [Google Scholar] [CrossRef]
- Cuadrado, A.; Rojo, A.I.; Wells, G.; Hayes, J.D.; Cousin, S.P.; Rumsey, W.L.; Attucks, O.C.; Franklin, S.; Levonen, A.-L.; Kensler, T.W. Therapeutic targeting of the NRF2 and KEAP1 partnership in chronic diseases. Nat Rev Drug Disco 2019, 18, 295–317. [Google Scholar] [CrossRef] [PubMed]
- Huang, H.-C.; Nguyen, T.; Pickett, C.B. Phosphorylation of Nrf2 at Ser-40 by protein kinase C regulates antioxidant response element-mediated transcription. J Biol Chem 2002, 277, 42769–42774. [Google Scholar] [CrossRef] [PubMed]
- Ma, Q. Role of nrf2 in oxidative stress and toxicity. Annu Rev of Pharmacol Toxicol 2013, 53, 401–426. [Google Scholar] [CrossRef]
- Saha, S.; Buttari, B.; Panieri, E.; Profumo, E.; Saso, L. An overview of Nrf2 signaling pathway and its role in inflammation. Molecules 2020, 25, 5474. [Google Scholar] [CrossRef] [PubMed]
- Sun, J.; Fu, J.; Zhong, Y.; Li, L.; Chen, C.; Wang, X.; Wang, L.; Hou, Y.; Wang, H.; Zhao, R. NRF2 mitigates acute alcohol-induced hepatic and pancreatic injury in mice. Food Chem Toxicol 2018, 121, 495–503. [Google Scholar] [CrossRef]
- Lin, X.; Wang, H.; Zou, L.; Yang, B.; Chen, W.; Rong, X.; Zhang, X.; He, L.; Li, X.; Peng, Y. The nrf2 activator rta-408 ameliorates chronic alcohol exposure-induced cognitive impairment and nlrp3 inflammasome activation by modulating impaired mitophagy initiation. Free Radic Biol Med 2024, 220, 15–27. [Google Scholar] [CrossRef]
- Venkataraman, A.; Kalk, N.; Sewell, G.; Ritchie, C.W.; Lingford-Hughes, A. Alcohol and Alzheimer's disease—does alcohol dependence contribute to beta-amyloid deposition, neuroinflammation and neurodegeneration in Alzheimer's disease? Alcohol Alcohol 2017, 52, 151–158. [Google Scholar]
- Ozyurt, G.; Ekmen, D.; Durmuş, M.; Ucar, Y. Assessment of the safety of dietary fish oil supplements in terms of content and quality. Environ Sci Pollut Res Int 2022, 29, 25006–25019. [Google Scholar] [CrossRef]
- Zhou, L.; Sun, D.; Bai, H. Efficacy of fish oil supplementation on metabolic dysfunction-associated steatotic liver disease: a meta-analysis. Front Nutr 2025, 12, 1524830. [Google Scholar] [CrossRef]
- Venturini, D.; Simão, A.N.C.; Urbano, M.R.; Dichi, I. Effects of extra virgin olive oil and fish oil on lipid profile and oxidative stress in patients with metabolic syndrome. Nutrition 2015, 31, 834–840. [Google Scholar] [CrossRef]
- Damaiyanti, D.W.; Tsai, Z.-Y.; Masbuchin, A.N.; Huang, C.-Y.; Liu, P.-Y. Interplay between fish oil, obesity and cardiometabolic diabetes. J Formos Med Assoc 2023, 122, 528–539. [Google Scholar] [CrossRef] [PubMed]
- Abrescia, P.; Treppiccione, L.; Rossi, M.; Bergamo, P. Modulatory role of dietary polyunsaturated fatty acids in Nrf2-mediated redox homeostasis. Prog Lipid Res 2020, 80, 101066. [Google Scholar] [CrossRef] [PubMed]
- Davinelli, S.; Medoro, A.; Intrieri, M.; Saso, L.; Scapagnini, G.; Kang, J.X. Targeting NRF2-KEAP1 axis by Omega-3 fatty acids and their derivatives: Emerging opportunities against aging and diseases. Free Radic Biol Med 2022, 193, 736–750. [Google Scholar] [CrossRef] [PubMed]
- Chen, J.; Jayachandran, M.; Bai, W.; Xu, B. A critical review on the health benefits of fish consumption and its bioactive constituents. Food Chem 2022, 369, 130874. [Google Scholar] [CrossRef] [PubMed]
- Nolan, J.M.; Power, R.; Howard, A.N.; Bergin, P.; Roche, W.; Prado-Cabrero, A.; Pope, G.; Cooke, J.; Power, T.; Mulcahy, R. Supplementation With Carotenoids, Omega-3 Fatty Acids, and Vitamin E Has a Positive Effect on the Symptoms and Progression of Alzheimer's Disease. J Alzheimers Dis 2022, 90, 233–249. [Google Scholar] [CrossRef]
- Liu, Z.-Y.; Xiao, Q.; Chen, Y.-H.; Shirakawa, H.; Lai, J.-H.; Chiang, Y.-H.; Yang, S.-C. Effects of fish oil on insulin resistance in the brains of rats with alcoholic liver damage. J Funct Foods 2024, 120, 106369. [Google Scholar] [CrossRef]
- Chen, Y.-L.; Shirakawa, H.; Lu, N.-S.; Peng, H.-C.; Xiao, Q.; Yang, S.-C. Impacts of fish oil on the gut microbiota of rats with alcoholic liver damage. J Nutri Biochem 2020, 86, 108491. [Google Scholar] [CrossRef]
- Wu, Q.; Wang, H. The spatiotemporal expression changes of CB2R in the hippocampus of rats following pilocarpine-induced status epilepticus. Epilepsy Res 2018, 148, 8–16. [Google Scholar] [CrossRef]
- Xiao, Q.; Chen, Y.-H.; Chen, Y.-L.; Chien, Y.-S.; Hsieh, L.-H.; Shirakawa, H.; Yang, S.-C. Potential Benefits of Epidermal Growth Factor for Inhibiting Muscle Degrative Markers in Rats with Alcoholic Liver Damage. Int J Mol Sci 2023, 24, 8845. [Google Scholar] [CrossRef]
- Kim, J.; Kang, H.; Lee, Y.-B.; Lee, B.; Lee, D. A quantitative analysis of spontaneous alternation behaviors on a Y-maze reveals adverse effects of acute social isolation on spatial working memory. Sci Rep 2023, 13, 14722. [Google Scholar] [CrossRef]
- Grayson, B.; Leger, M.; Piercy, C.; Adamson, L.; Harte, M.; Neill, J.C. Assessment of disease-related cognitive impairments using the novel object recognition (NOR) task in rodents. Behav Brain Res 2015, 285, 176–193. [Google Scholar] [CrossRef] [PubMed]
- Dunn, C.; Sturdivant, N.; Venier, S.; Ali, S.; Wolchok, J.; Balachandran, K. Blood-Brain Barrier Breakdown and Astrocyte Reactivity Evident in the Absence of Behavioral Changes after Repeated Traumatic Brain Injury. Neurotrauma Rep 2021, 2, 399–410. [Google Scholar] [CrossRef] [PubMed]
- Understanding Alcohol Drinking Patterns. Available online: https://www.niaaa.nih.gov/alcohols-effects-health/alcohol-drinking-patterns (accessed on 10-04-2025).
- Liver, E.A.f.t.S.o.t.; Diabetes, E.A.f.t.S.o.; Obesity, E.A.f.t.S.o. EASL-EASD-EASO Clinical Practice Guidelines on the management of metabolic dysfunction-associated steatotic liver disease (MASLD). Obes Facts 2024, 17, 374–443. [Google Scholar]
- Guo, F.; Zheng, K.; Benedé-Ubieto, R.; Cubero, F.J.; Nevzorova, Y.A. The Lieber-DeCarli Diet-A Flagship Model for Experimental Alcoholic Liver Disease. Alcohol Clin Exp Res 2018, 42, 1828–1840. [Google Scholar] [CrossRef]
- Fuertes-Agudo, M.; Luque-Tévar, M.; Cucarella, C.; Martín-Sanz, P.; Casado, M. Advances in Understanding the Role of NRF2 in Liver Pathophysiology and Its Relationship with Hepatic-Specific Cyclooxygenase-2 Expression. Antioxidants 2023, 12, 1491. [Google Scholar] [CrossRef]
- Zhou, J.; Zheng, Q.; Chen, Z. The Nrf2 Pathway in Liver Diseases. Front Cell Dev Biol 2022, 10, 826204. [Google Scholar] [CrossRef]
- Li, H.; Xie, Z.; Zhang, Y.; Liu, Y.; Niu, A.; Liu, Y.; Zhang, L.; Guan, L. Rosa rugosa polysaccharide attenuates alcoholic liver disease in mice through the gut-liver axis. Food Biosci 2021, 44, 101385. [Google Scholar] [CrossRef]
- Song, G.; Han, H.; Park, S.; Sa, S.; Chung, W.; Lee, B.Y. Effects of GSH on Alcohol Metabolism and Hangover Improvement in Humans: A Randomized Double-Blind Placebo-Controlled Crossover Clinical Trial. Nutrients 2024, 16. [Google Scholar] [CrossRef]
- Contreras-Zentella, M.L.; Villalobos-García, D.; Hernández-Muñoz, R. Ethanol Metabolism in the Liver, the Induction of Oxidant Stress, and the Antioxidant Defense System. Antioxidants 2022, 11, 1258. [Google Scholar] [CrossRef]
- Xiong, W.; Garfinkel, A.E.M.; Li, Y.; Benowitz, L.I.; Cepko, C.L. NRF2 promotes neuronal survival in neurodegeneration and acute nerve damage. J Clin Invest 2015, 125, 1433–1445. [Google Scholar] [CrossRef]
- Vell, M.S.; Creasy, K.T.; Scorletti, E.; Seeling, K.S.; Hehl, L.; Rendel, M.D.; Schneider, K.M.; Schneider, C.V. Omega-3 intake is associated with liver disease protection. Front Public Health 2023, 11, 1192099. [Google Scholar] [CrossRef] [PubMed]
- Kang, S.; Koh, J.M.; Im, D.S. N-3 Polyunsaturated Fatty Acids Protect against Alcoholic Liver Steatosis by Activating FFA4 in Kupffer Cells. Int J Mol Sci 2024, 25. [Google Scholar] [CrossRef] [PubMed]
- Wang, H.Y.; Peng, H.C.; Chien, Y.W.; Chen, Y.L.; Lu, N.S.; Yang, S.C. Effects of Fish Oil on Lipid Metabolism and Its Molecular Biological Regulators in Chronic Ethanol-Fed Rats. Nutrients 2018, 10. [Google Scholar] [CrossRef] [PubMed]
- Siegel, D.; Gustafson, D.L.; Dehn, D.L.; Han, J.Y.; Boonchoong, P.; Berliner, L.J.; Ross, D. NAD (P) H: quinone oxidoreductase 1: role as a superoxide scavenger. Mol Pharmacol 2004, 65, 1238–1247. [Google Scholar] [CrossRef]
- Yue, R.; Chen, G.-y.; Xie, G.; Hao, L.; Guo, W.; Sun, X.; Jia, W.; Zhang, Q.; Zhou, Z.; Zhong, W. Activation of PPARα-catalase pathway reverses alcoholic liver injury via upregulating NAD synthesis and accelerating alcohol clearance. Free Radic Biol Med 2021, 174, 249–263. [Google Scholar] [CrossRef]
- Yeligar, S.M.; Machida, K.; Kalra, V.K. Ethanol-induced HO-1 and NQO1 Are Differentially Regulated by HIF-1α and Nrf2 to Attenuate Inflammatory Cytokine Expression. J Biol Chem 2010, 285, 35359–35373. [Google Scholar] [CrossRef]
- Siegel, D.; Gustafson, D.L.; Dehn, D.L.; Han, J.Y.; Boonchoong, P.; Berliner, L.J.; Ross, D. NAD(P)H:Quinone Oxidoreductase 1: Role as a Superoxide Scavenger. Mol Pharmacol 2004, 65, 1238–1247. [Google Scholar] [CrossRef]
- Navarro, D.; Gasparyan, A.; Martí Martínez, S.; Díaz Marín, C.; Navarrete, F.; García Gutiérrez, M.S.; Manzanares, J. Methods to Identify Cognitive Alterations from Animals to Humans: A Translational Approach. Int J Mol Sci 2023, 24, 7653. [Google Scholar] [CrossRef]
- Sachdeva, A.; Chandra, M.; Choudhary, M.; Dayal, P.; Anand, K.S. Alcohol-Related Dementia and Neurocognitive Impairment: A Review Study. Int J High Risk Behav Addict 2016, 5, e27976. [Google Scholar] [CrossRef]
- Ge, C.L.; Chen, W.; Zhang, L.N.; Ai, Y.H.; Zou, Y.; Peng, Q.Y. Hippocampus-prefrontal cortex inputs modulate spatial learning and memory in a mouse model of sepsis induced by cecal ligation puncture. CNS Neurosci Ther 2023, 29, 390–401. [Google Scholar] [CrossRef]
- García, F.; Torres, M.-J.; Chacana-Véliz, L.; Espinosa, N.; El-Deredy, W.; Fuentealba, P.; Negrón-Oyarzo, I. Prefrontal cortex synchronization with the hippocampus and parietal cortex is strategy-dependent during spatial learning. Commun Biol 2025, 8, 79. [Google Scholar] [CrossRef] [PubMed]
- Gong, Y.-S.; Guo, J.; Hu, K.; Gao, Y.-Q.; Hou, F.-L.; Song, F.-L.; Liang, C.-Y. Chronic ethanol consumption and thiamine deficiency modulate β-amyloid peptide level and oxidative stress in the brain. Alcohol Alcohol 2017, 52, 159–164. [Google Scholar] [CrossRef] [PubMed]
- Fowler, A.K.; Thompson, J.; Chen, L.; Dagda, M.; Dertien, J.; Dossou, K.S.; Moaddel, R.; Bergeson, S.E.; Kruman, II. Differential sensitivity of prefrontal cortex and hippocampus to alcohol-induced toxicity. PloS One 2014, 9, e106945. [Google Scholar] [CrossRef] [PubMed]
- Dighriri, I.M.; Alsubaie, A.M.; Hakami, F.M.; Hamithi, D.M.; Alshekh, M.M.; Khobrani, F.A.; Dalak, F.E.; Hakami, A.A.; Alsueaadi, E.H.; Alsaawi, L.S. Effects of omega-3 polyunsaturated fatty acids on brain functions: a systematic review. Cureus 2022, 14. [Google Scholar] [CrossRef]
- Haidary, M.; Ahmadi-Soleimani, S.M.; Ghofraninezad, M.; Azhdari-Zarmehri, H.; Beheshti, F. Omega-3 fatty acids supplementation prevents learning and memory impairment induced by chronic ethanol consumption in adolescent male rats through restoration of inflammatory and oxidative responses. Int J Dev Neurosci 2024, 84, 423–433. [Google Scholar] [CrossRef]
- Byerley, L.O.; Reppel, J.E.; Pahng, A.R.; Edwards, S.R. Omega-3 Dietary Fatty Acids Improve Spatial Learning and Memory But Do Not Alter the Escalation of Alcohol Drinking. FASEB J 2016, 30, 679.675–679.675. [Google Scholar] [CrossRef]
- Shi, Z.; Xie, Y.; Ren, H.; He, B.; Wang, M.; Wan, J.B.; Yuan, T.F.; Yao, X.; Su, H. Fish oil treatment reduces chronic alcohol exposure induced synaptic changes. Addict Biol 2019, 24, 577–589. [Google Scholar] [CrossRef]
- Yavari, M.; Khedmatgozar, H.; Ramalingam, L.; Harris, B.; Kahathuduwa, C.N.; Zu, Y.; Moustaid-Moussa, N. Mechanisms Mediating the Protective Effects of Eicosapentaenoic Acid in Brain of the APPswePS1dE9 Alzheimer’s Mouse Model. Curr Dev Nutr 2022, 6, 815. [Google Scholar] [CrossRef]
- Ren, H.; Luo, C.; Feng, Y.; Yao, X.; Shi, Z.; Liang, F.; Kang, J.X.; Wan, J.B.; Pei, Z.; Su, H. Omega-3 polyunsaturated fatty acids promote amyloid-β clearance from the brain through mediating the function of the glymphatic system. FASEB J 2017, 31, 282–293. [Google Scholar] [CrossRef]
- Zhang, M.; Wang, S.; Mao, L.; Leak, R.K.; Shi, Y.; Zhang, W.; Hu, X.; Sun, B.; Cao, G.; Gao, Y. Omega-3 fatty acids protect the brain against ischemic injury by activating Nrf2 and upregulating heme oxygenase 1. J Neurosci 2014, 34, 1903–1915. [Google Scholar] [CrossRef]
- Díaz, M.; Valdés-Baizabal, C.; de Pablo, D.P.; Marin, R. Age-dependent changes in Nrf2/Keap1 and target antioxidant protein expression correlate to lipoxidative adducts, and are modulated by dietary N-3 LCPUFA in the hippocampus of mice. Antioxidants 2024, 13, 206. [Google Scholar] [CrossRef] [PubMed]
- Dyall, S.C. Long-chain omega-3 fatty acids and the brain: a review of the independent and shared effects of EPA, DPA and DHA. Front aging neurosci 2015, 7, 52. [Google Scholar] [CrossRef] [PubMed]
Figure 1.
Effects of fish oil on hepatic damage markers in rats with alcohol-induced injury. (A) H&E staining (magnification ×200) (red arrows: lipid vacuoles). (B) Scores of fatty changes and inflammation. (C) CYP2E1 protein expression. * p<0.05 compared to the C group by Student’s t-test. Superscript letters (a,b,c) and (A,B,C) respectively indicate differences among three control and ethanol groups according to a one-way ANOVA with Tukey’s post-hoc test (p<0.05). C, control group; E, ethanol group; F25, 25% fish oil substituted for olive oil; F57, 57% fish oil substituted for olive oil; CYP2E1, cytochrome P450 2E1.
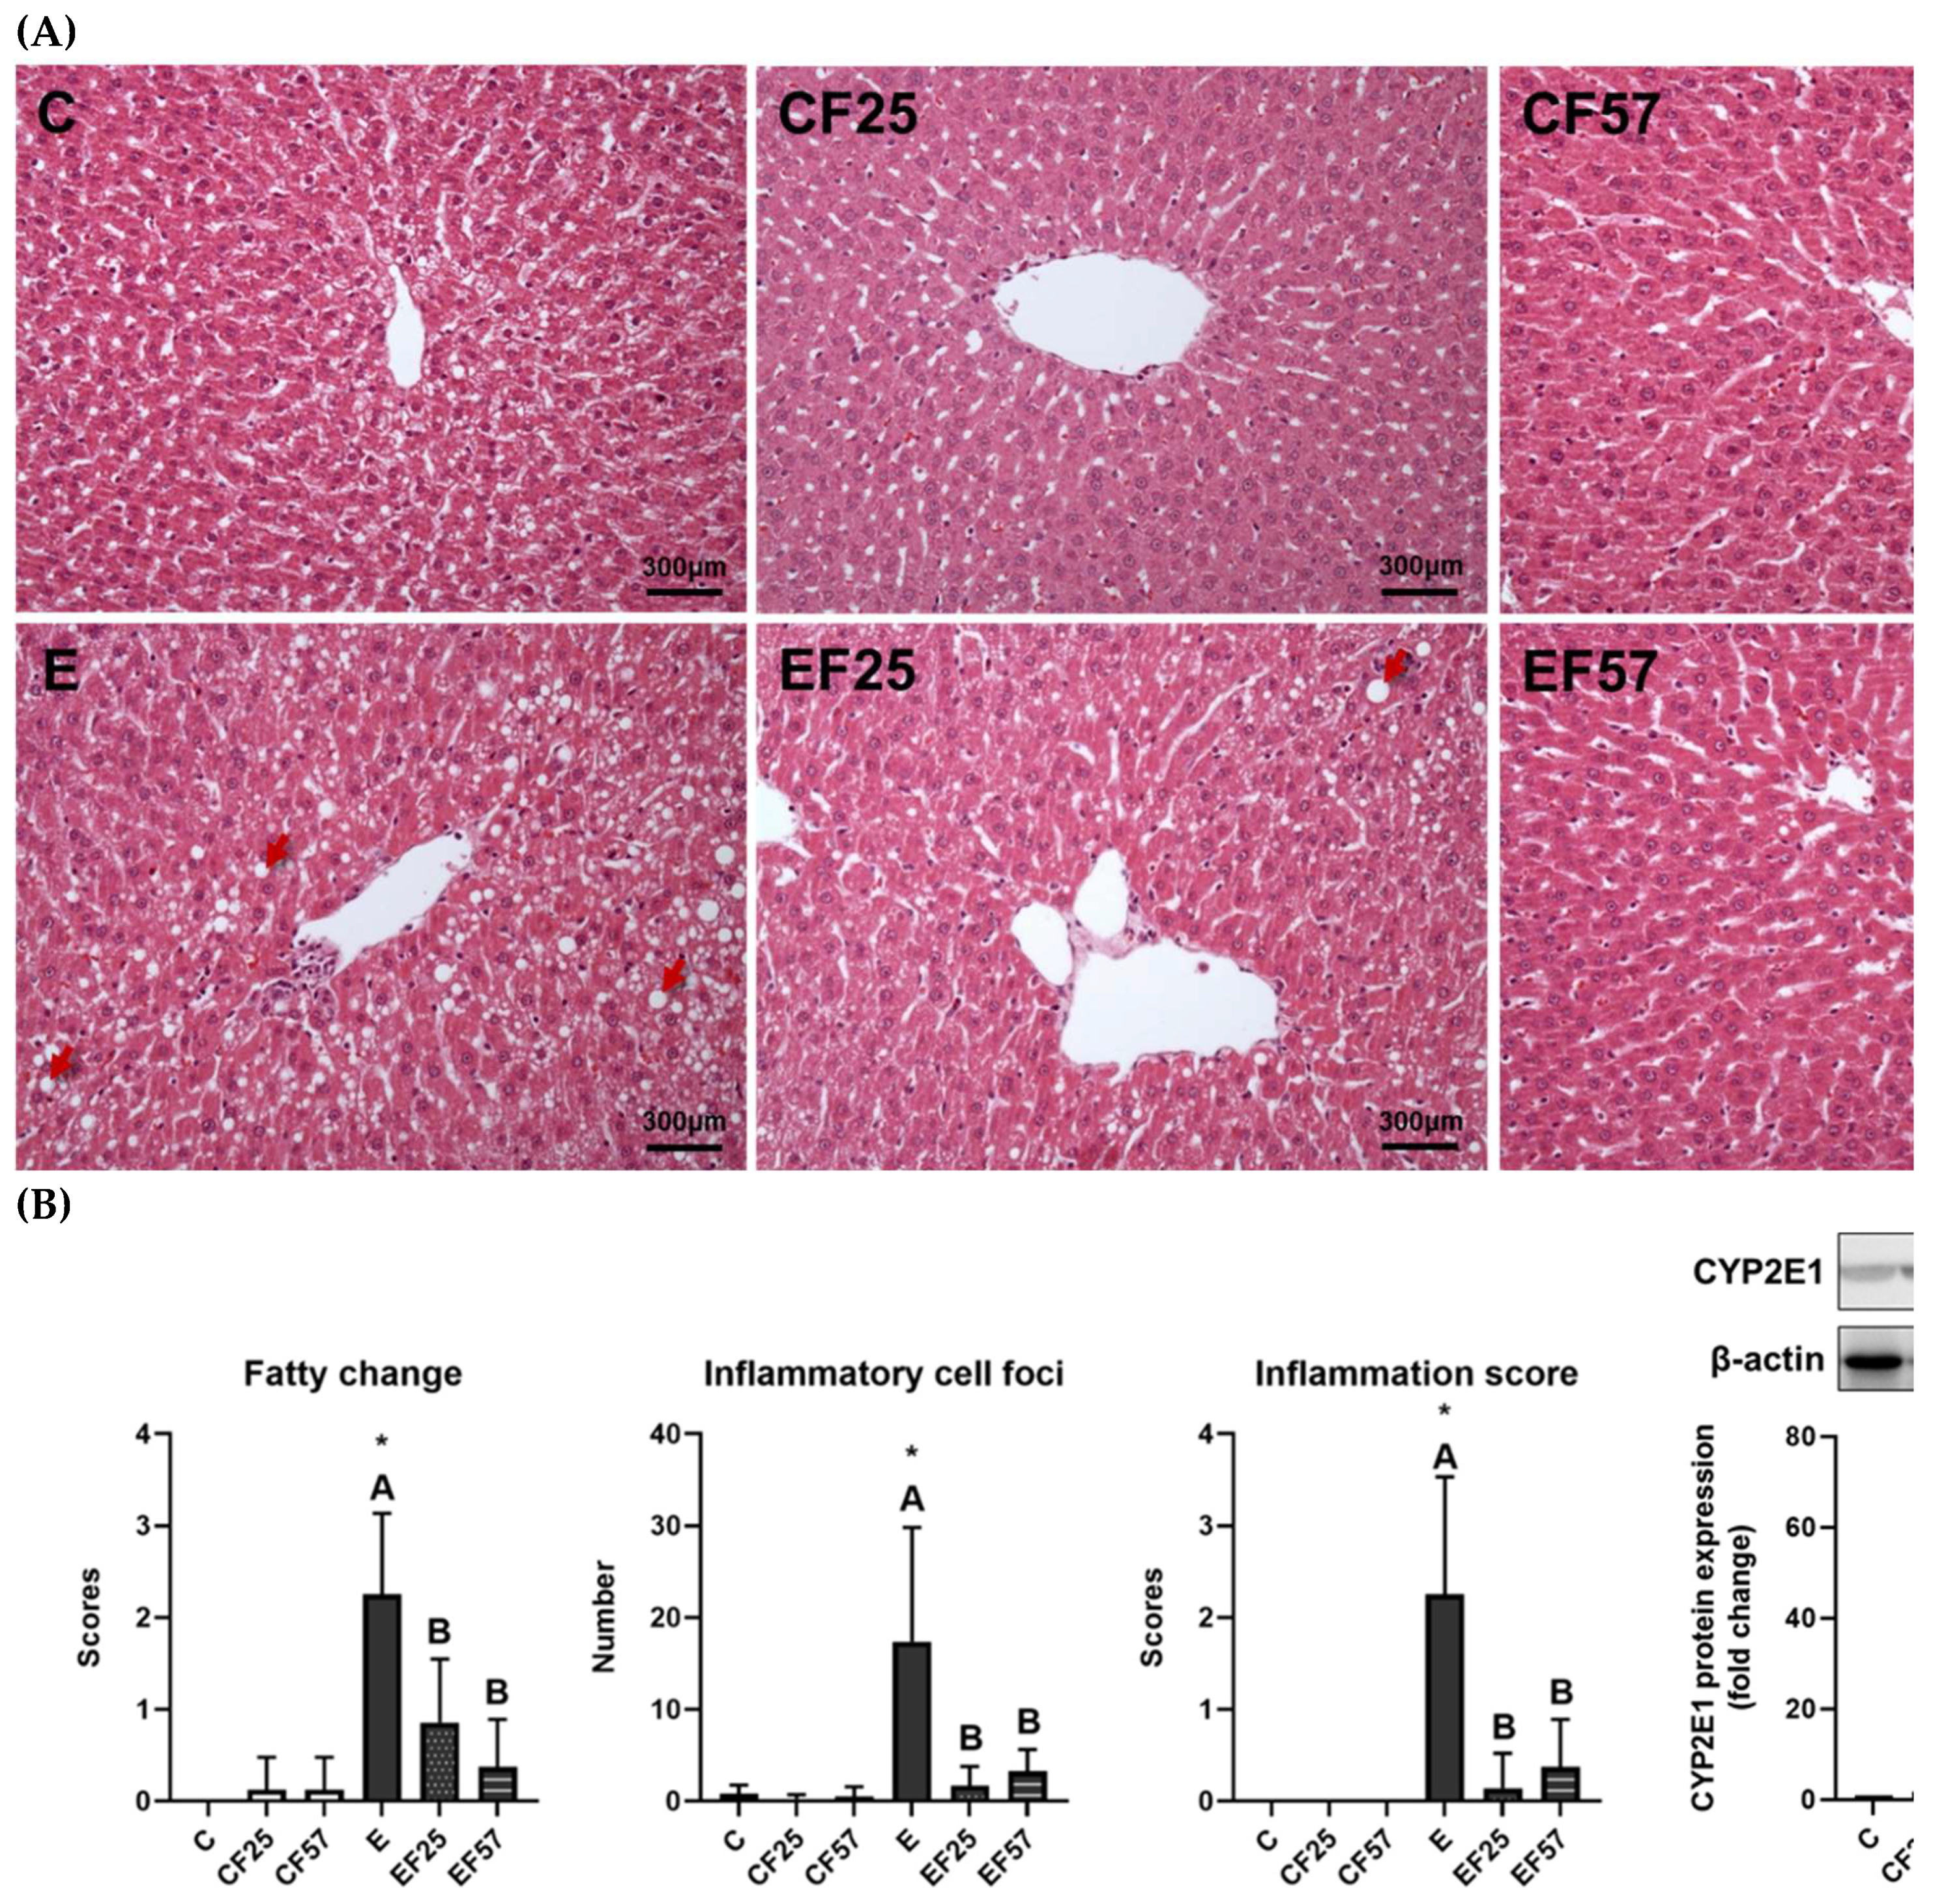
Figure 2.
Effects of fish oil on the hepatic NRF2/KEAP1 signaling pathway in rats with chronic ethanol-induced liver damage. (A) Representative images and quantitation of phosphorylated (p)-NRF2(ser40), NRF2, phosphorylated ratio, and KEAP1 protein expressions. (B) mRNA levels of nfe2l2, keap1, hmox1, and nqo1. Values are presented as the mean±SD. * p<0.05 compared to the C group by Student’s t-test. Superscript letters (a,b,c) and (A,B,C) respectively indicate differences among three control and ethanol groups according to a one-way ANOVA with Tukey’s post-hoc test (p<0.05). C, control group; E, ethanol group; F25, 25% fish oil substitution for olive oil; F57, 57% fish oil substitution for olive oil. NRF2, nuclear factor erythroid 2-related factor 2, KEAP1: kelch-like ECH-associated protein 1, nfe2l2, nuclear factor, erythroid 2 like 2; hmox1, heme oxygenase 1; nqo1, NAD(P)H:quinone oxidoreductase 1.
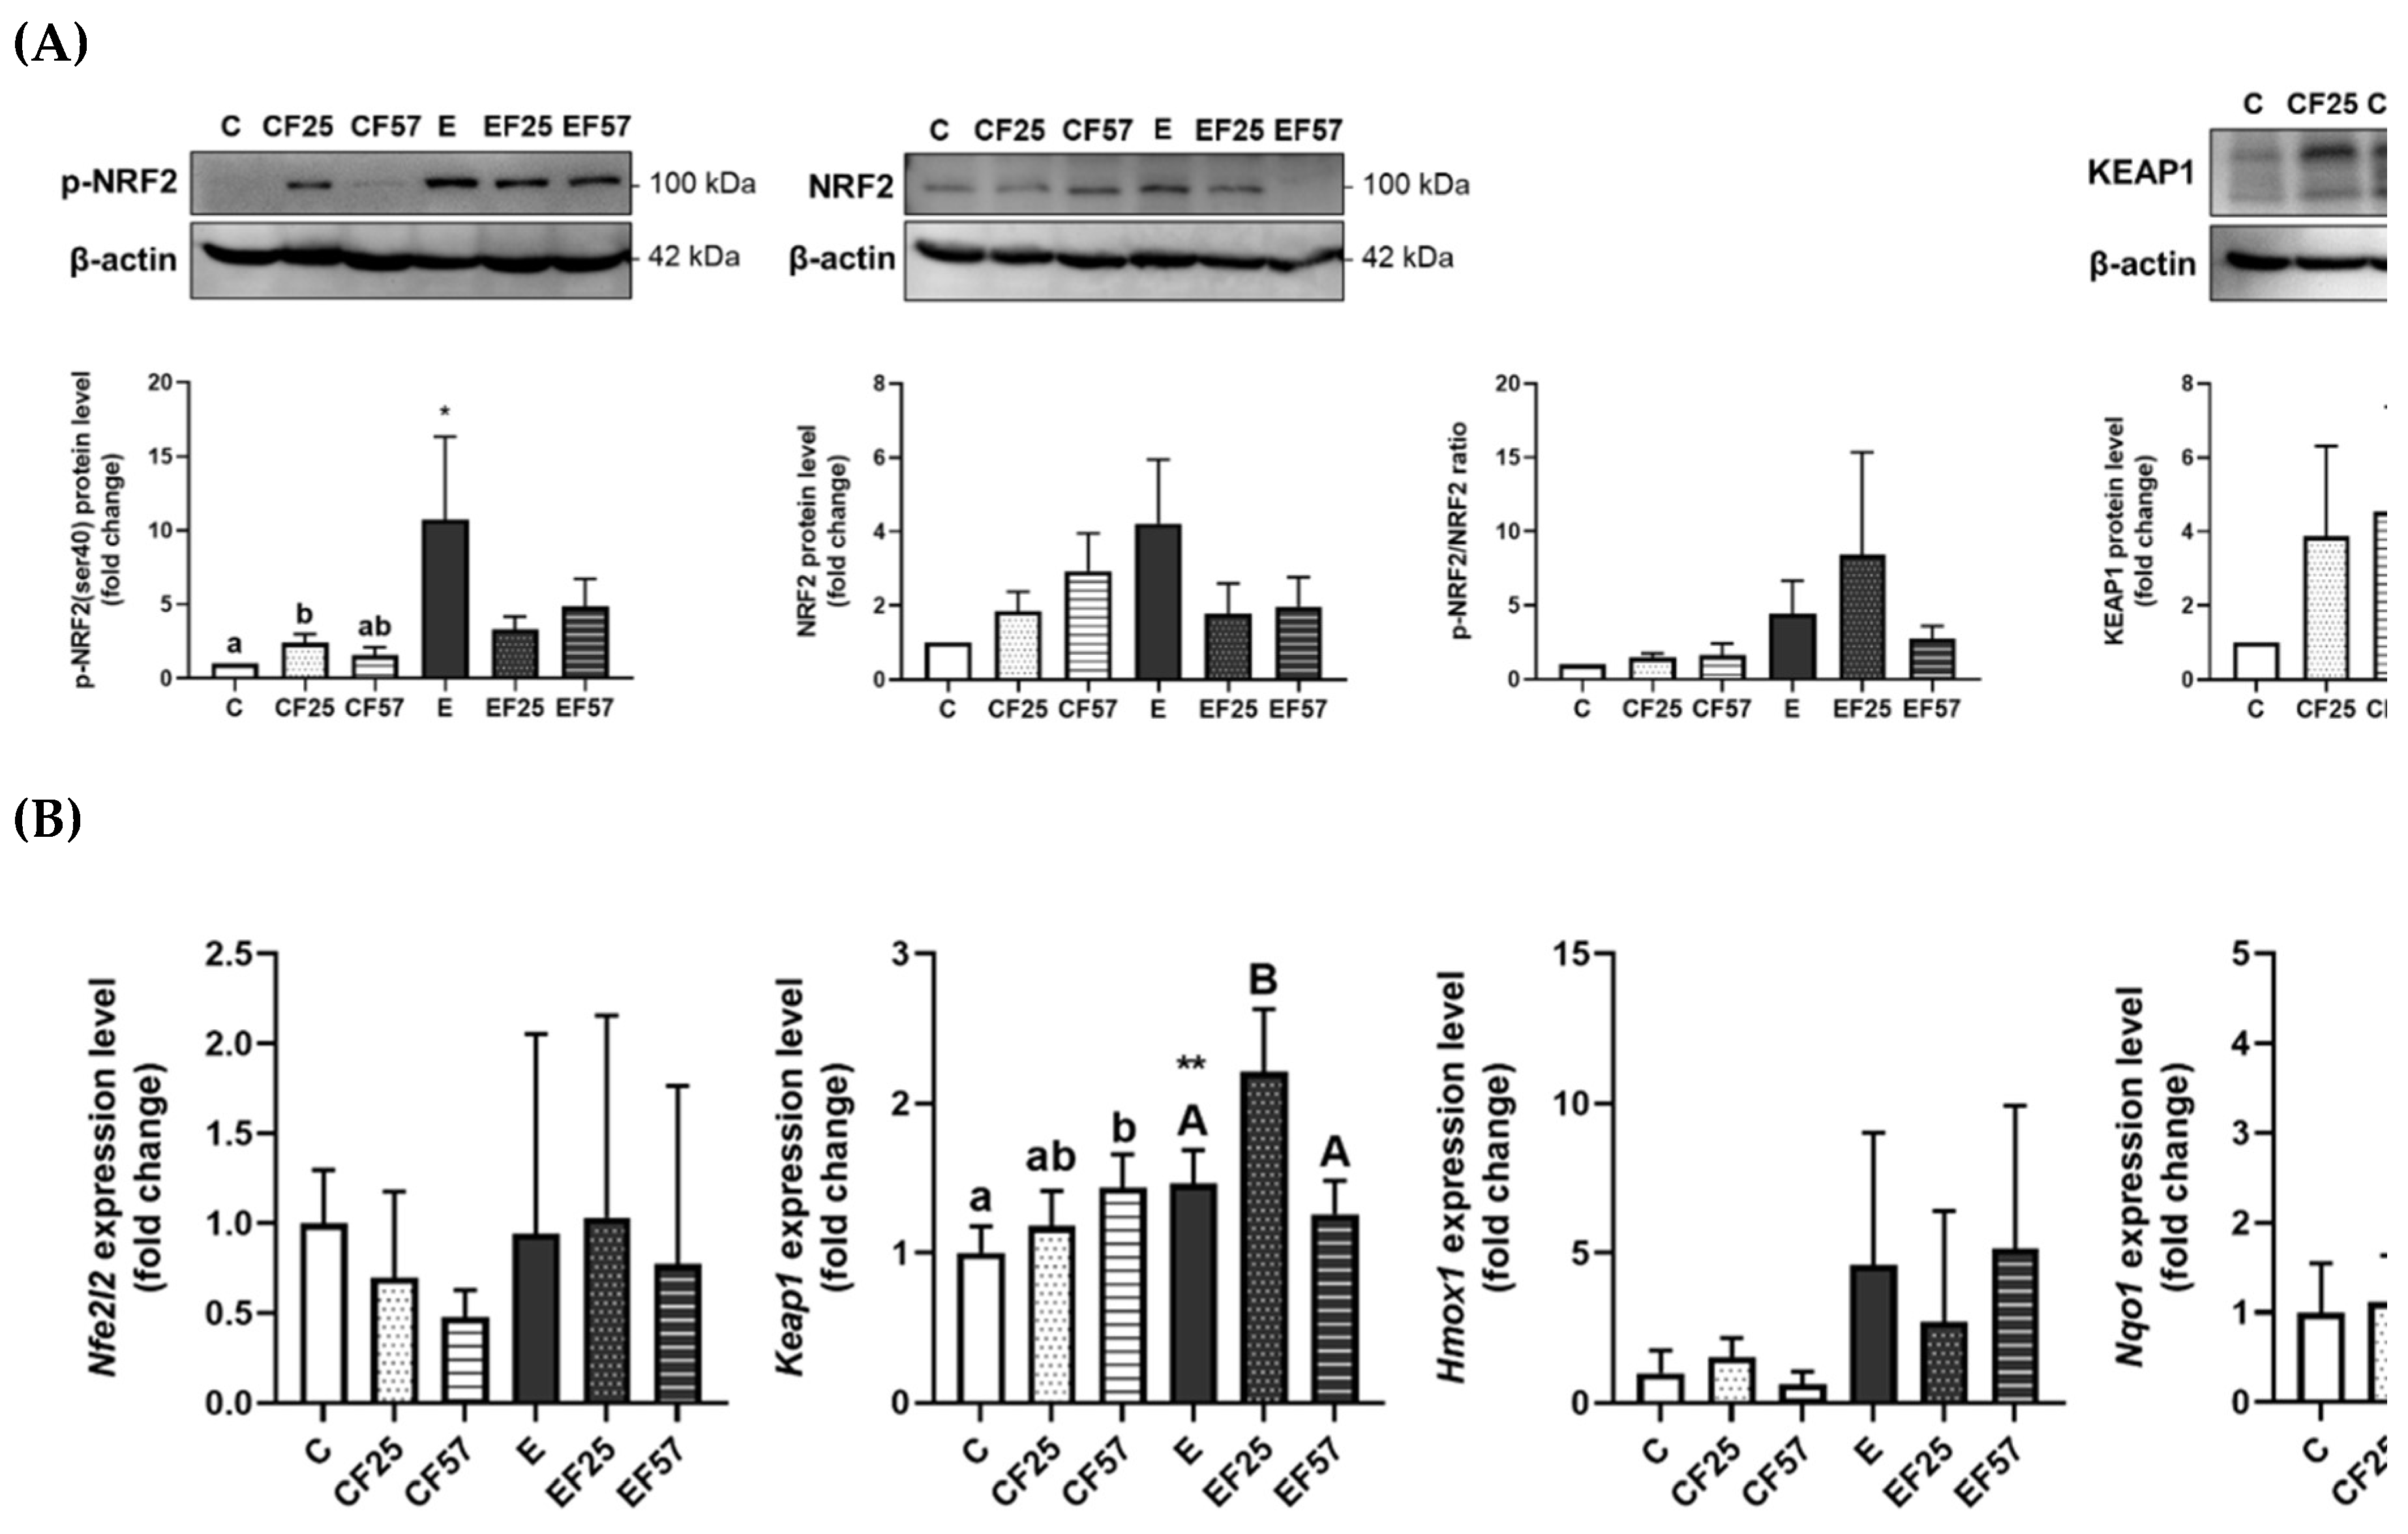
Figure 3.
Figure 3. Effects of fish oil on behavioral changes in rats with chronic ethanol-induced liver damage. (A) Spontaneous alterations in the Y maze. (B) Novel objective recognition (NOR) at the endpoint. (C) Representative images of rats’ route in the NOR test. Values are presented as the mean±SD. ** p<0.01 compared to the C group according to Student’s t-test. Superscript letters (a,b,c) and (A,B,C) respectively indicate differences among three control and ethanol groups according to a one-way ANOVA with Tukey’s post-hoc test (p<0.05). C, control group; E, ethanol group; F25, 25% fish oil substitution for olive oil; F57, 57% fish oil substitution for olive oil.
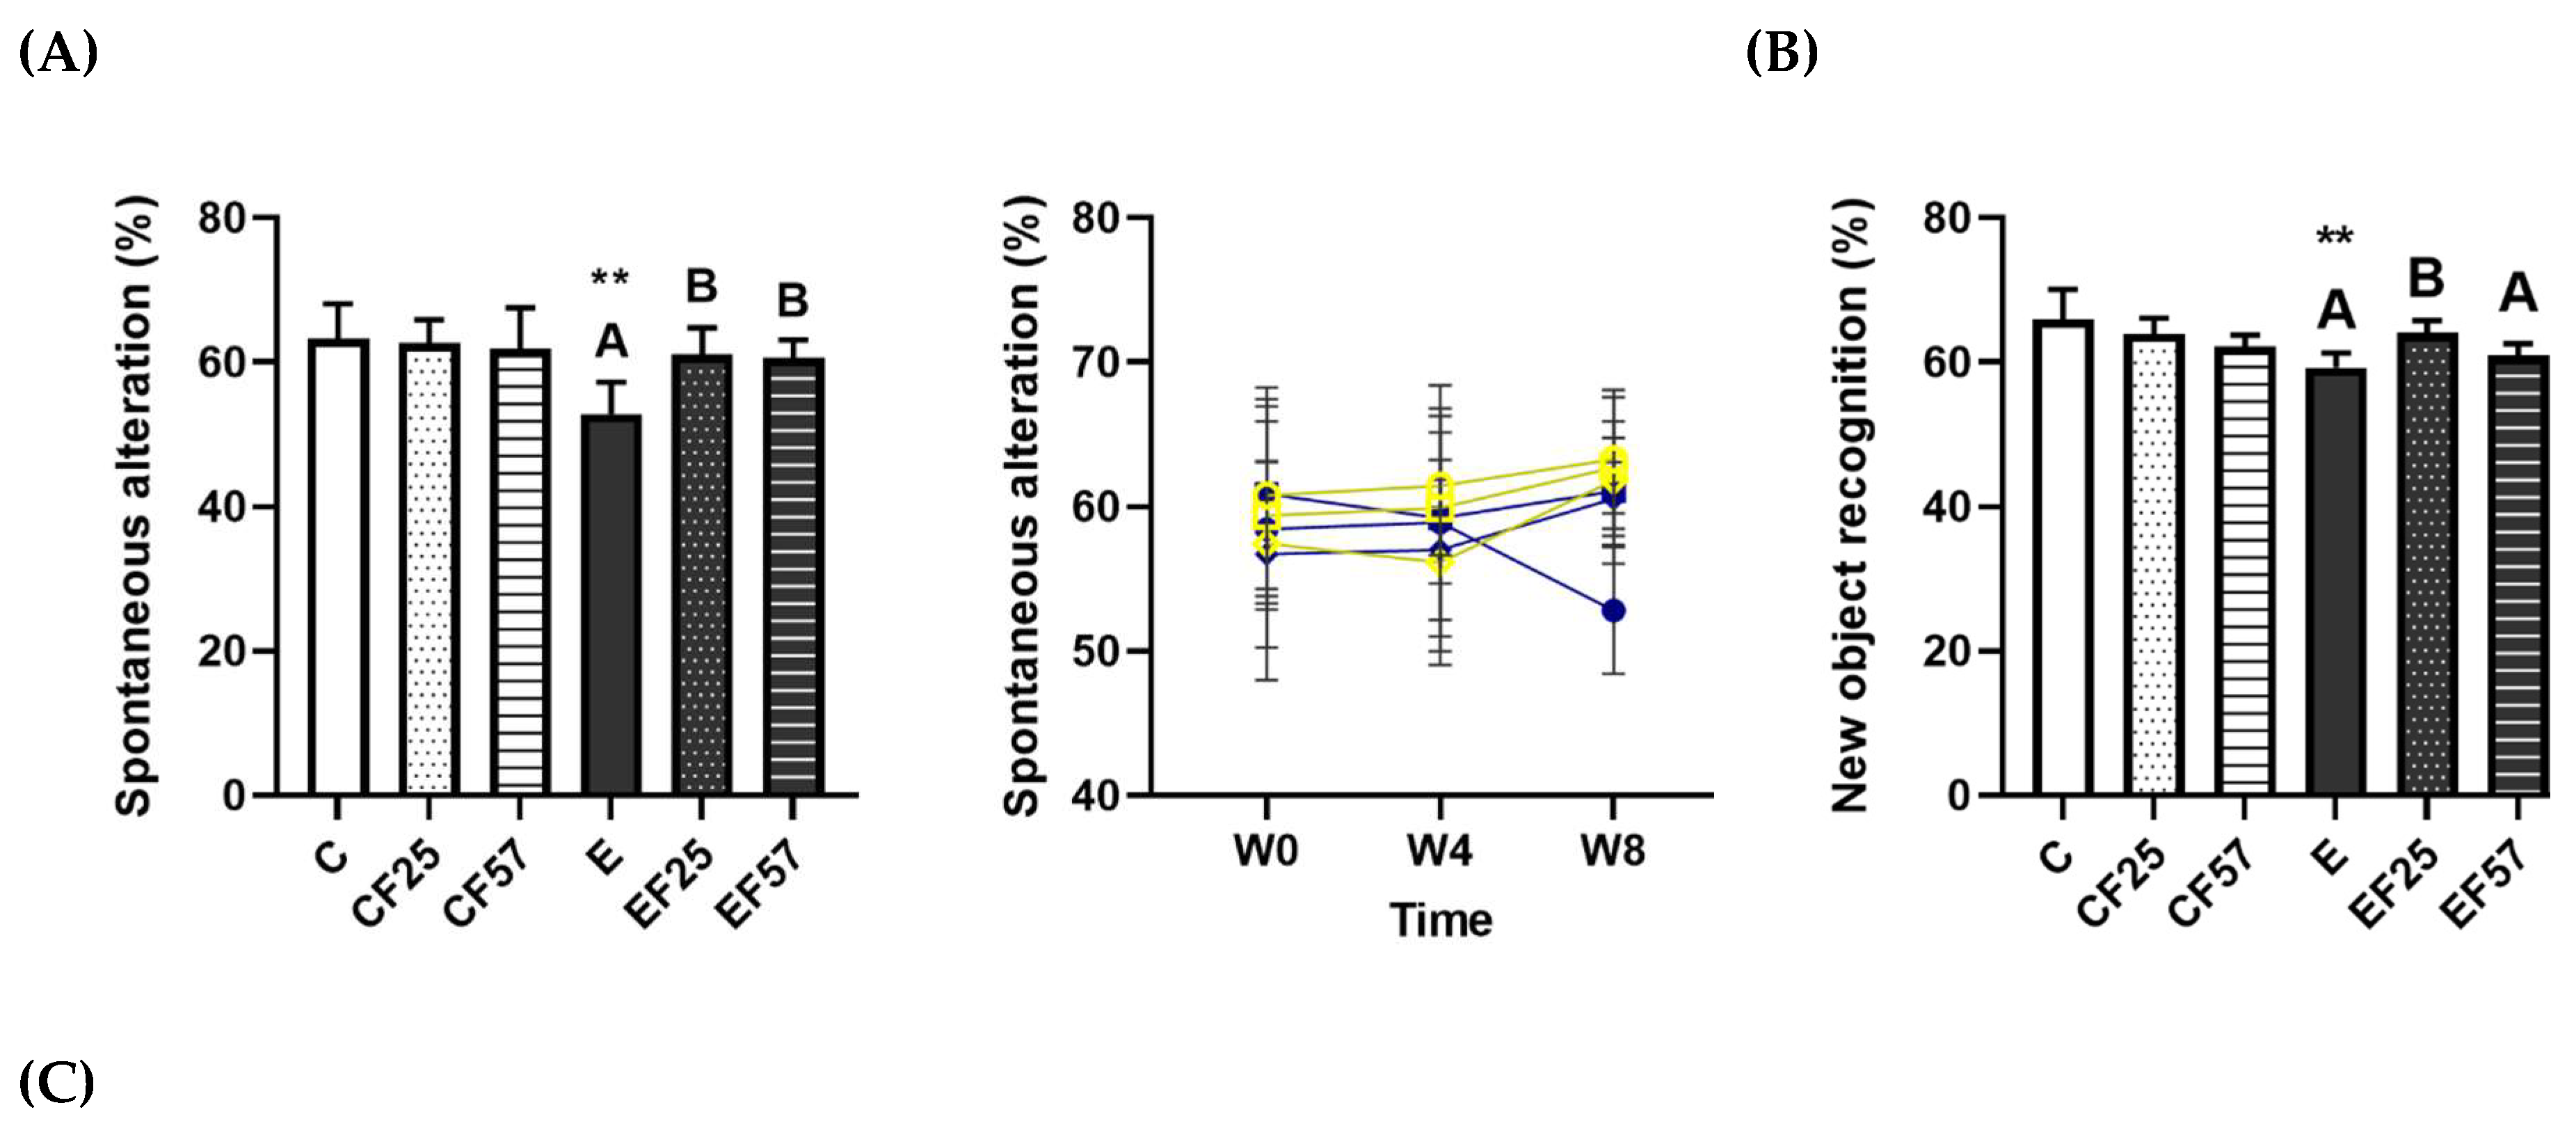
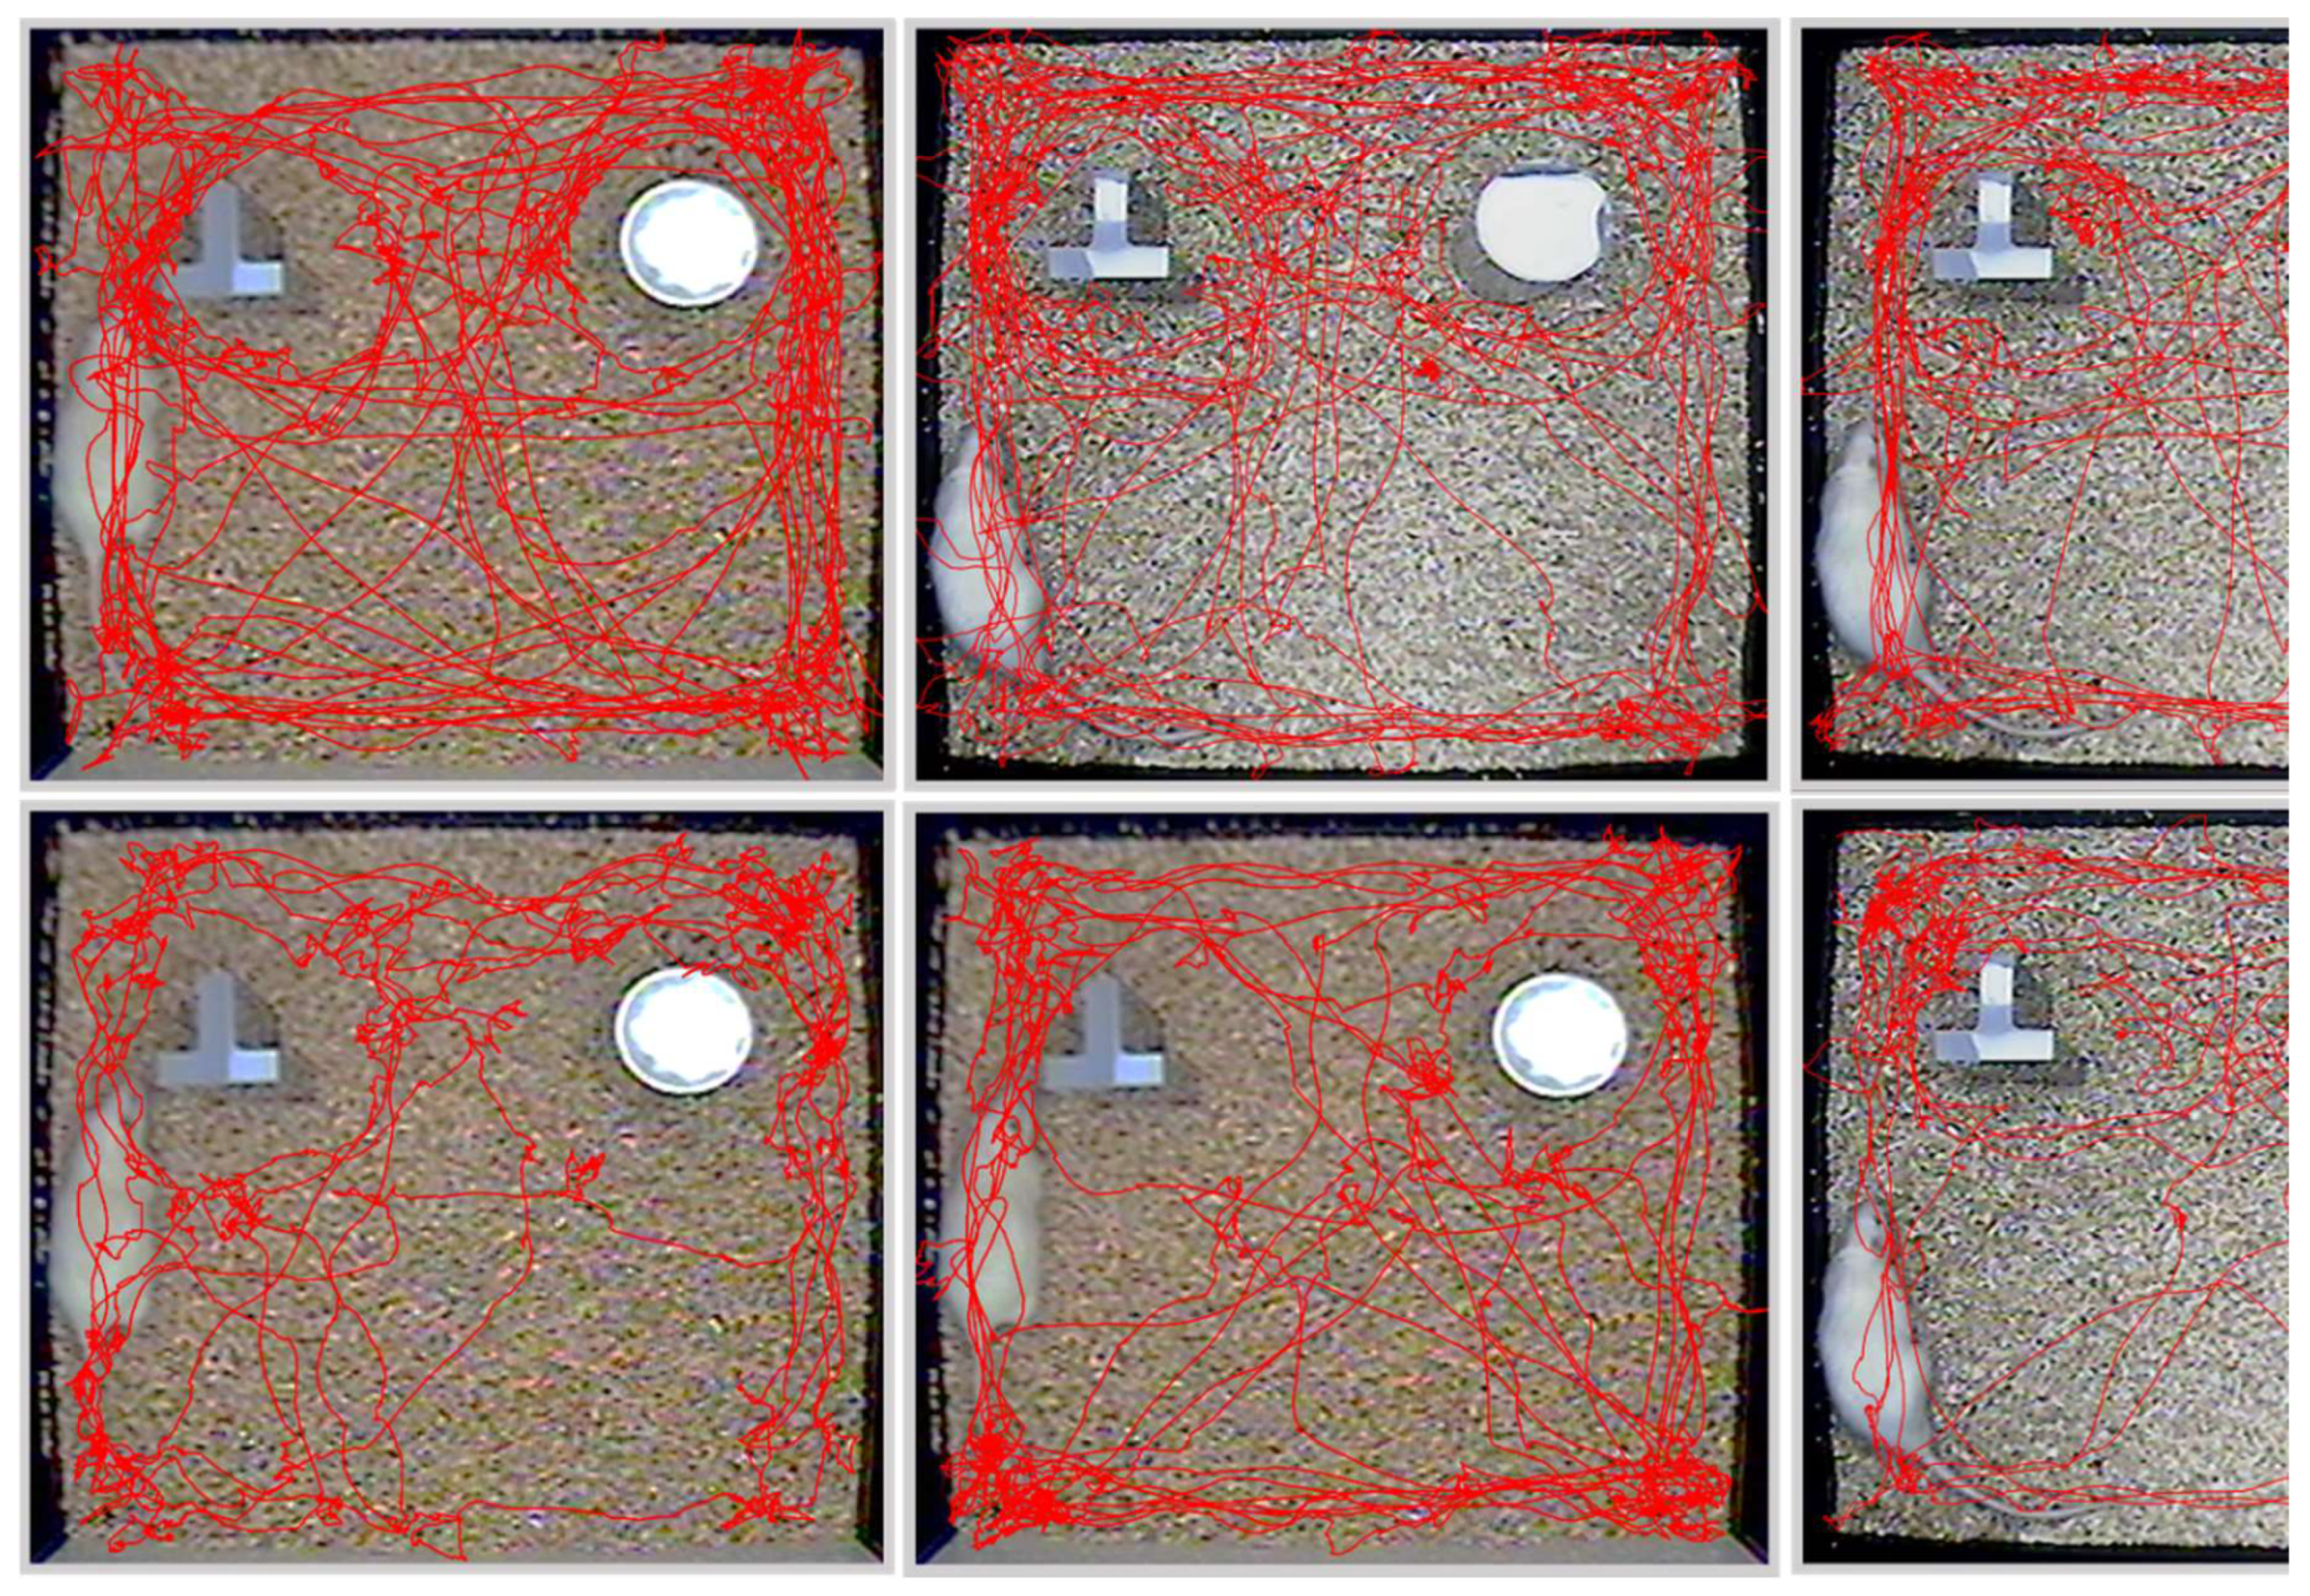
Figure 4.
Effects of fish oil on hippocampus H&E staining, neuronal inflammation markers, and β-amyloid (Aβ) accumulation in rats with chronic ethanol-induced liver damage. (A) H&E staining of the hippocampus at ×40 magnification (white arrowhead: normal pyramidal cells, yellow arrow: nuclear condensed pyramidal cell). (B) Representative images of GFAP by IHC, at ×200 magnification (red arrow: GFAP-positive astrocytes). (C) Represented images of Iba-1 by IHC, at ×200 magnification (yellow arrows: Iba-1-positive microglia). (D) Aβ1-40 and Aβ1-42 concentrations, and ratio in the prefrontal cortex and hippocampus. Values are presented as the mean±SD. ** p<0.01 compared to the C group according to Student’s t-test. Superscript letters (a,b,c) and (A,B,C) respectively indicate differences among three control and ethanol groups according to a one-way ANOVA with Tukey’s post-hoc test (p<0.05). C, control group; E, ethanol group; F25, 25% fish oil substitution for olive oil; F57, 57% fish oil substitution for olive oil; CA, cortical area; Pfc, prefrontal cortex; Aβ, β-amyloid.
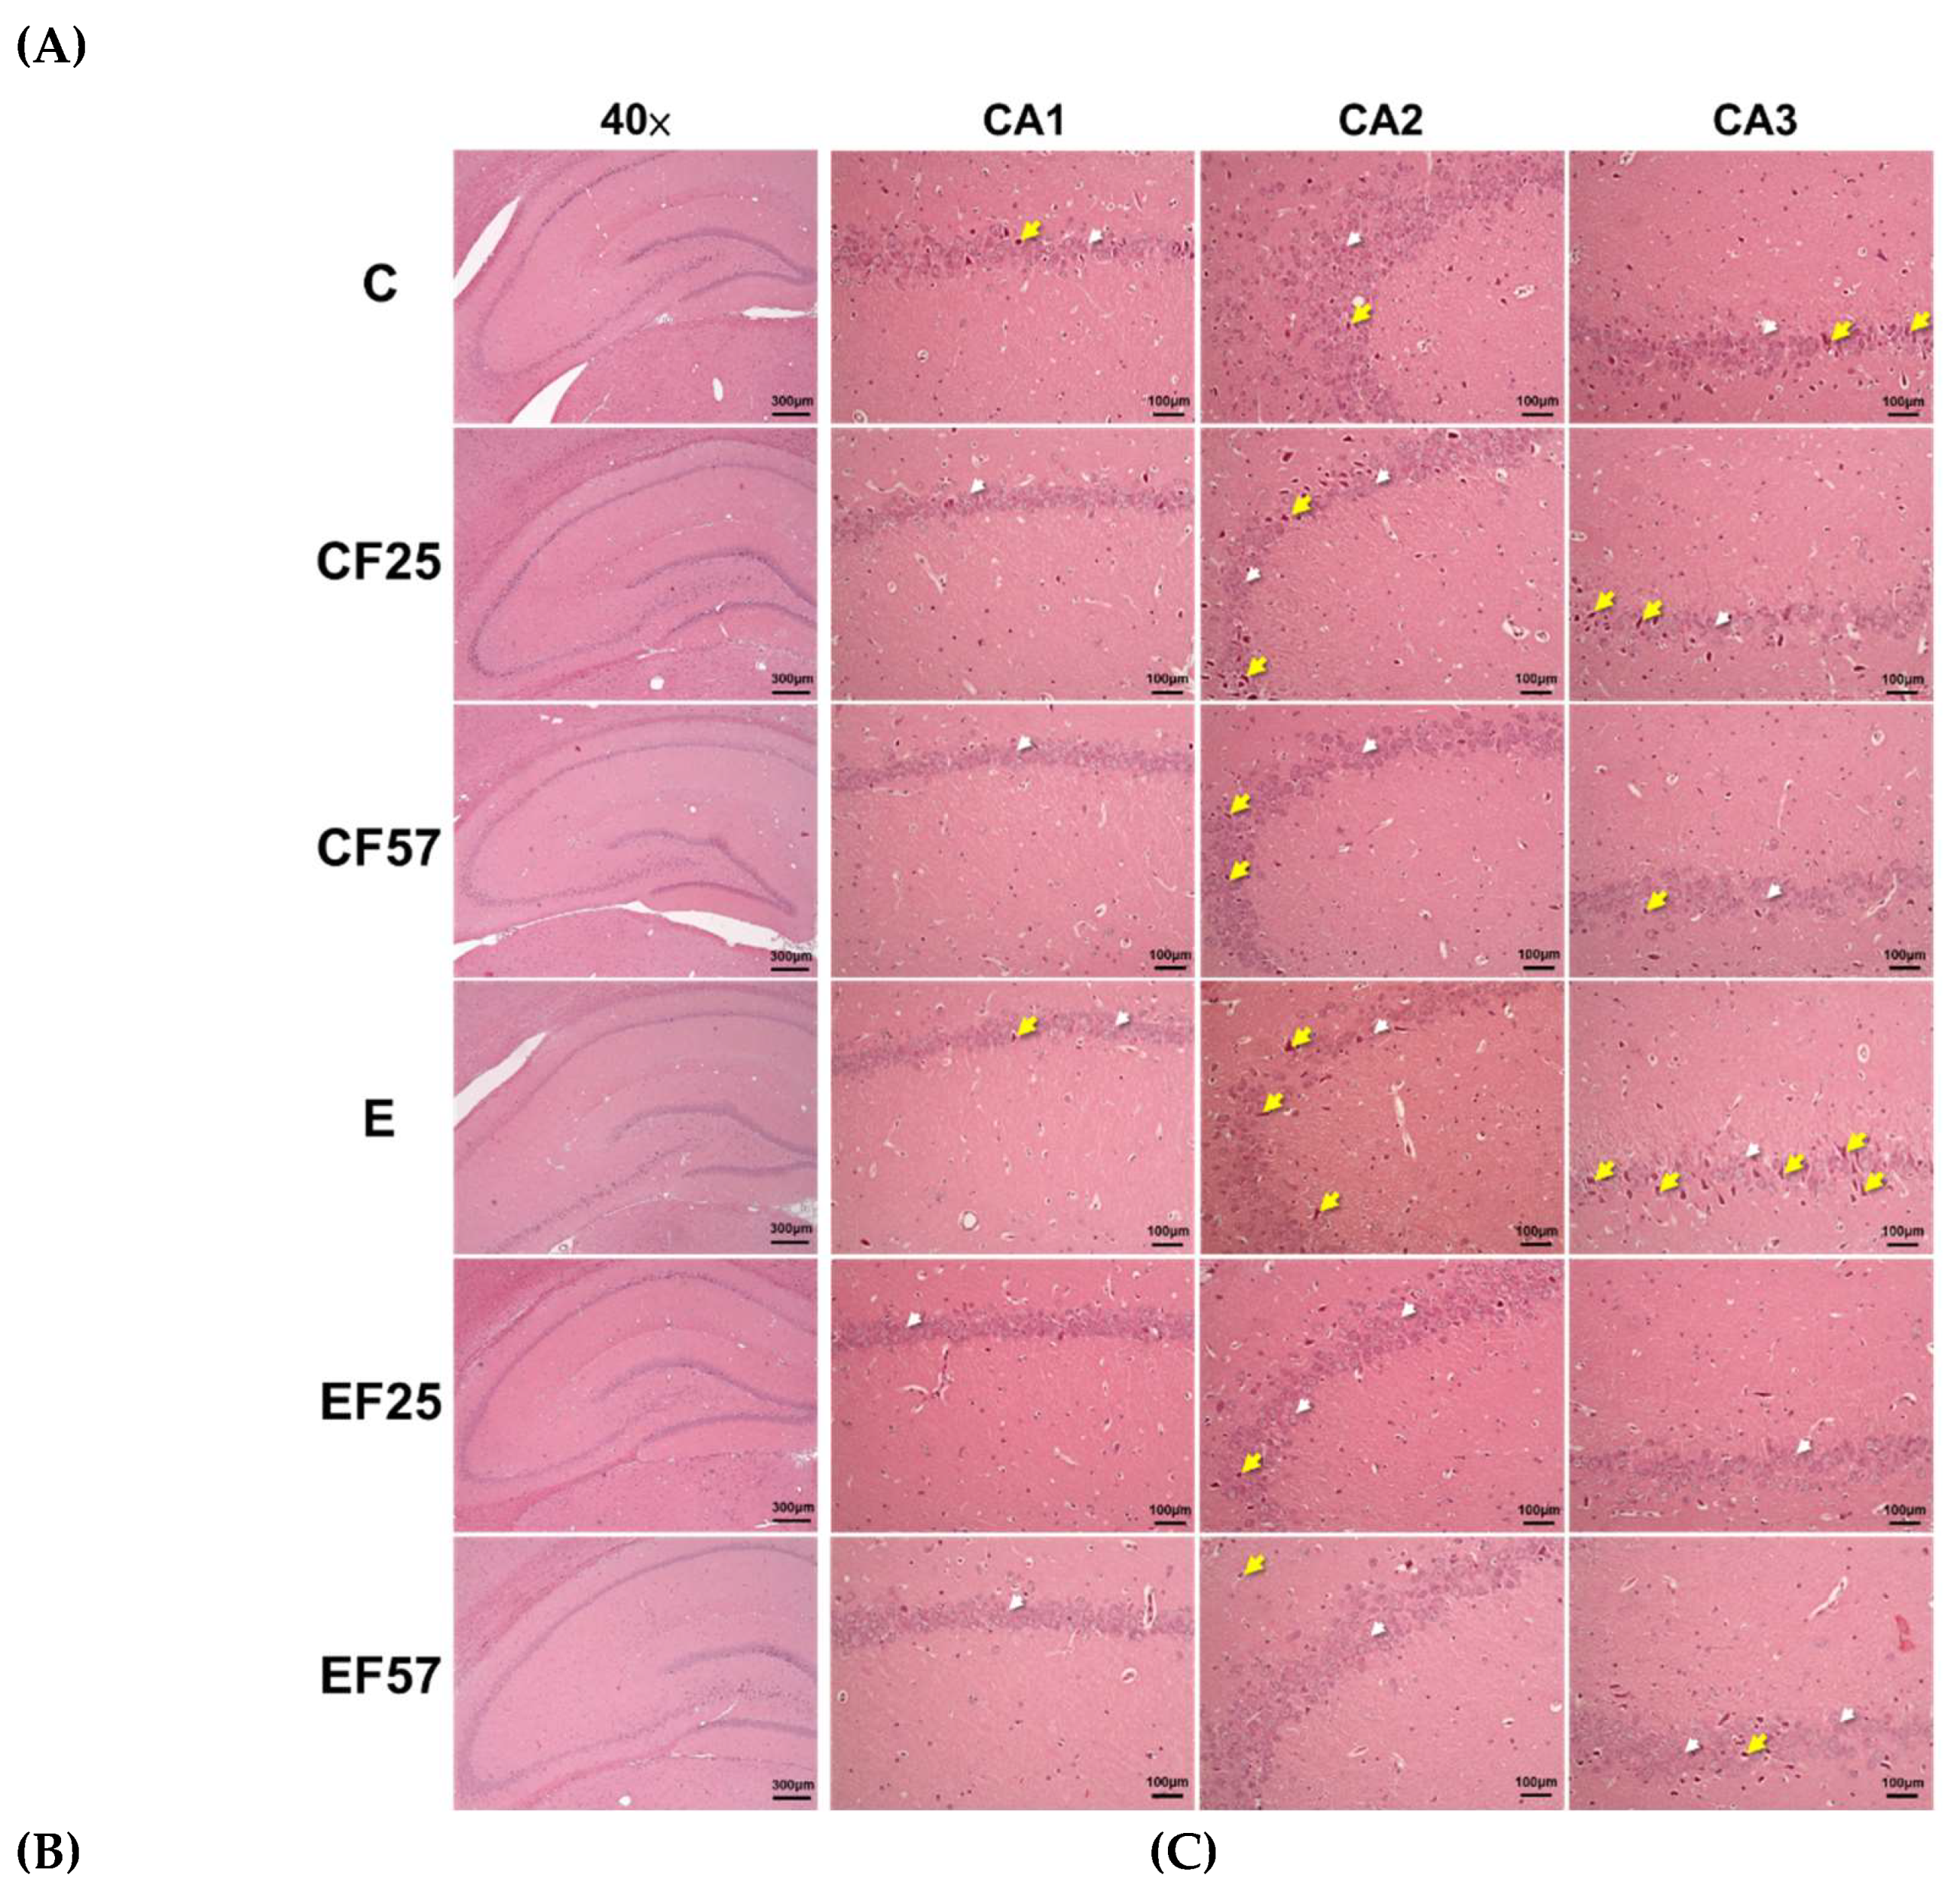
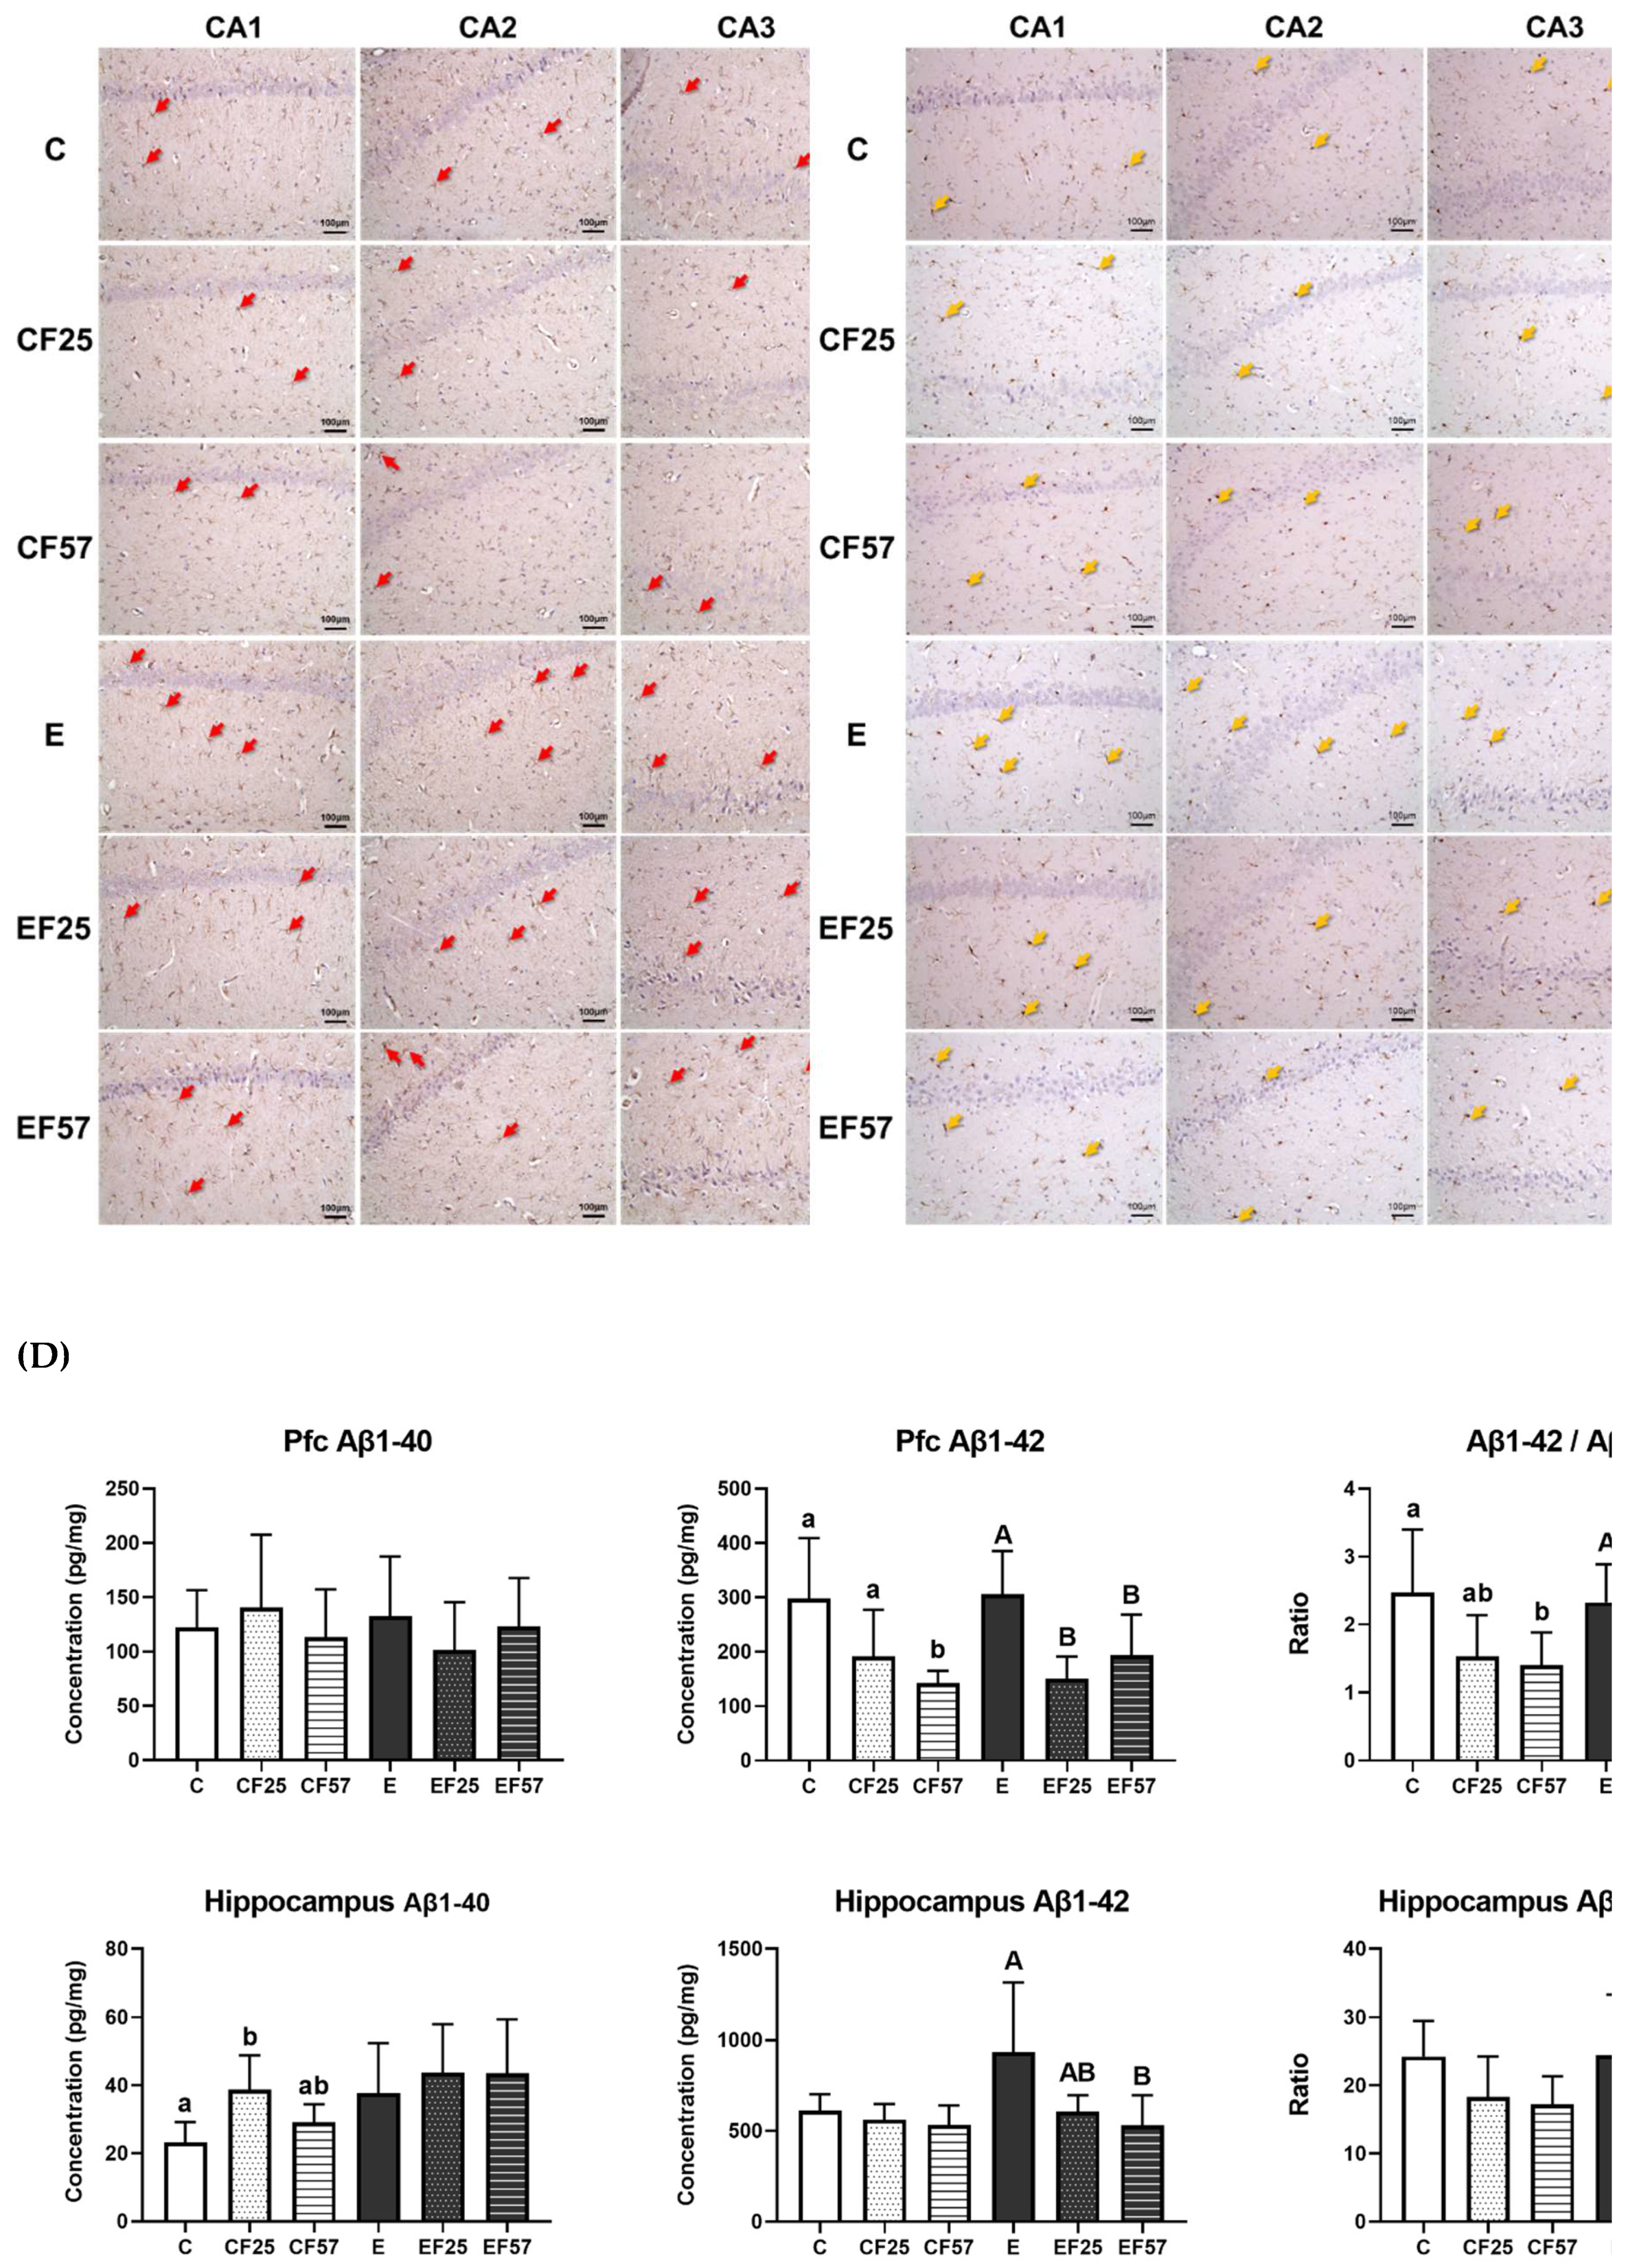
Figure 5.
Effects of fish oil on prefrontal cortex NRF2/KEAP1 protein levels in rats with chronic ethanol-induced liver damage. (A) Representative images and quantitation of phosphorylated (p)-NRF2(ser40), NRF2, phosphorylated ratio, and KEAP1 protein expressions. (B) mRNA levels of nfe2l2, keap1, hmox1, and nqo1. Values are presented as the mean±SD. * p<0.05 compared to the C group according to Student’s t-test. Superscript letters (a,b,c) and (A,B,C) respectively indicate differences among three control and ethanol groups according to a one-way ANOVA with Tukey’s post-hoc test (p<0.05). C, control group; E, ethanol group; F25, 25% fish oil substitution for olive oil; F57, 57% fish oil substitution for olive oil.
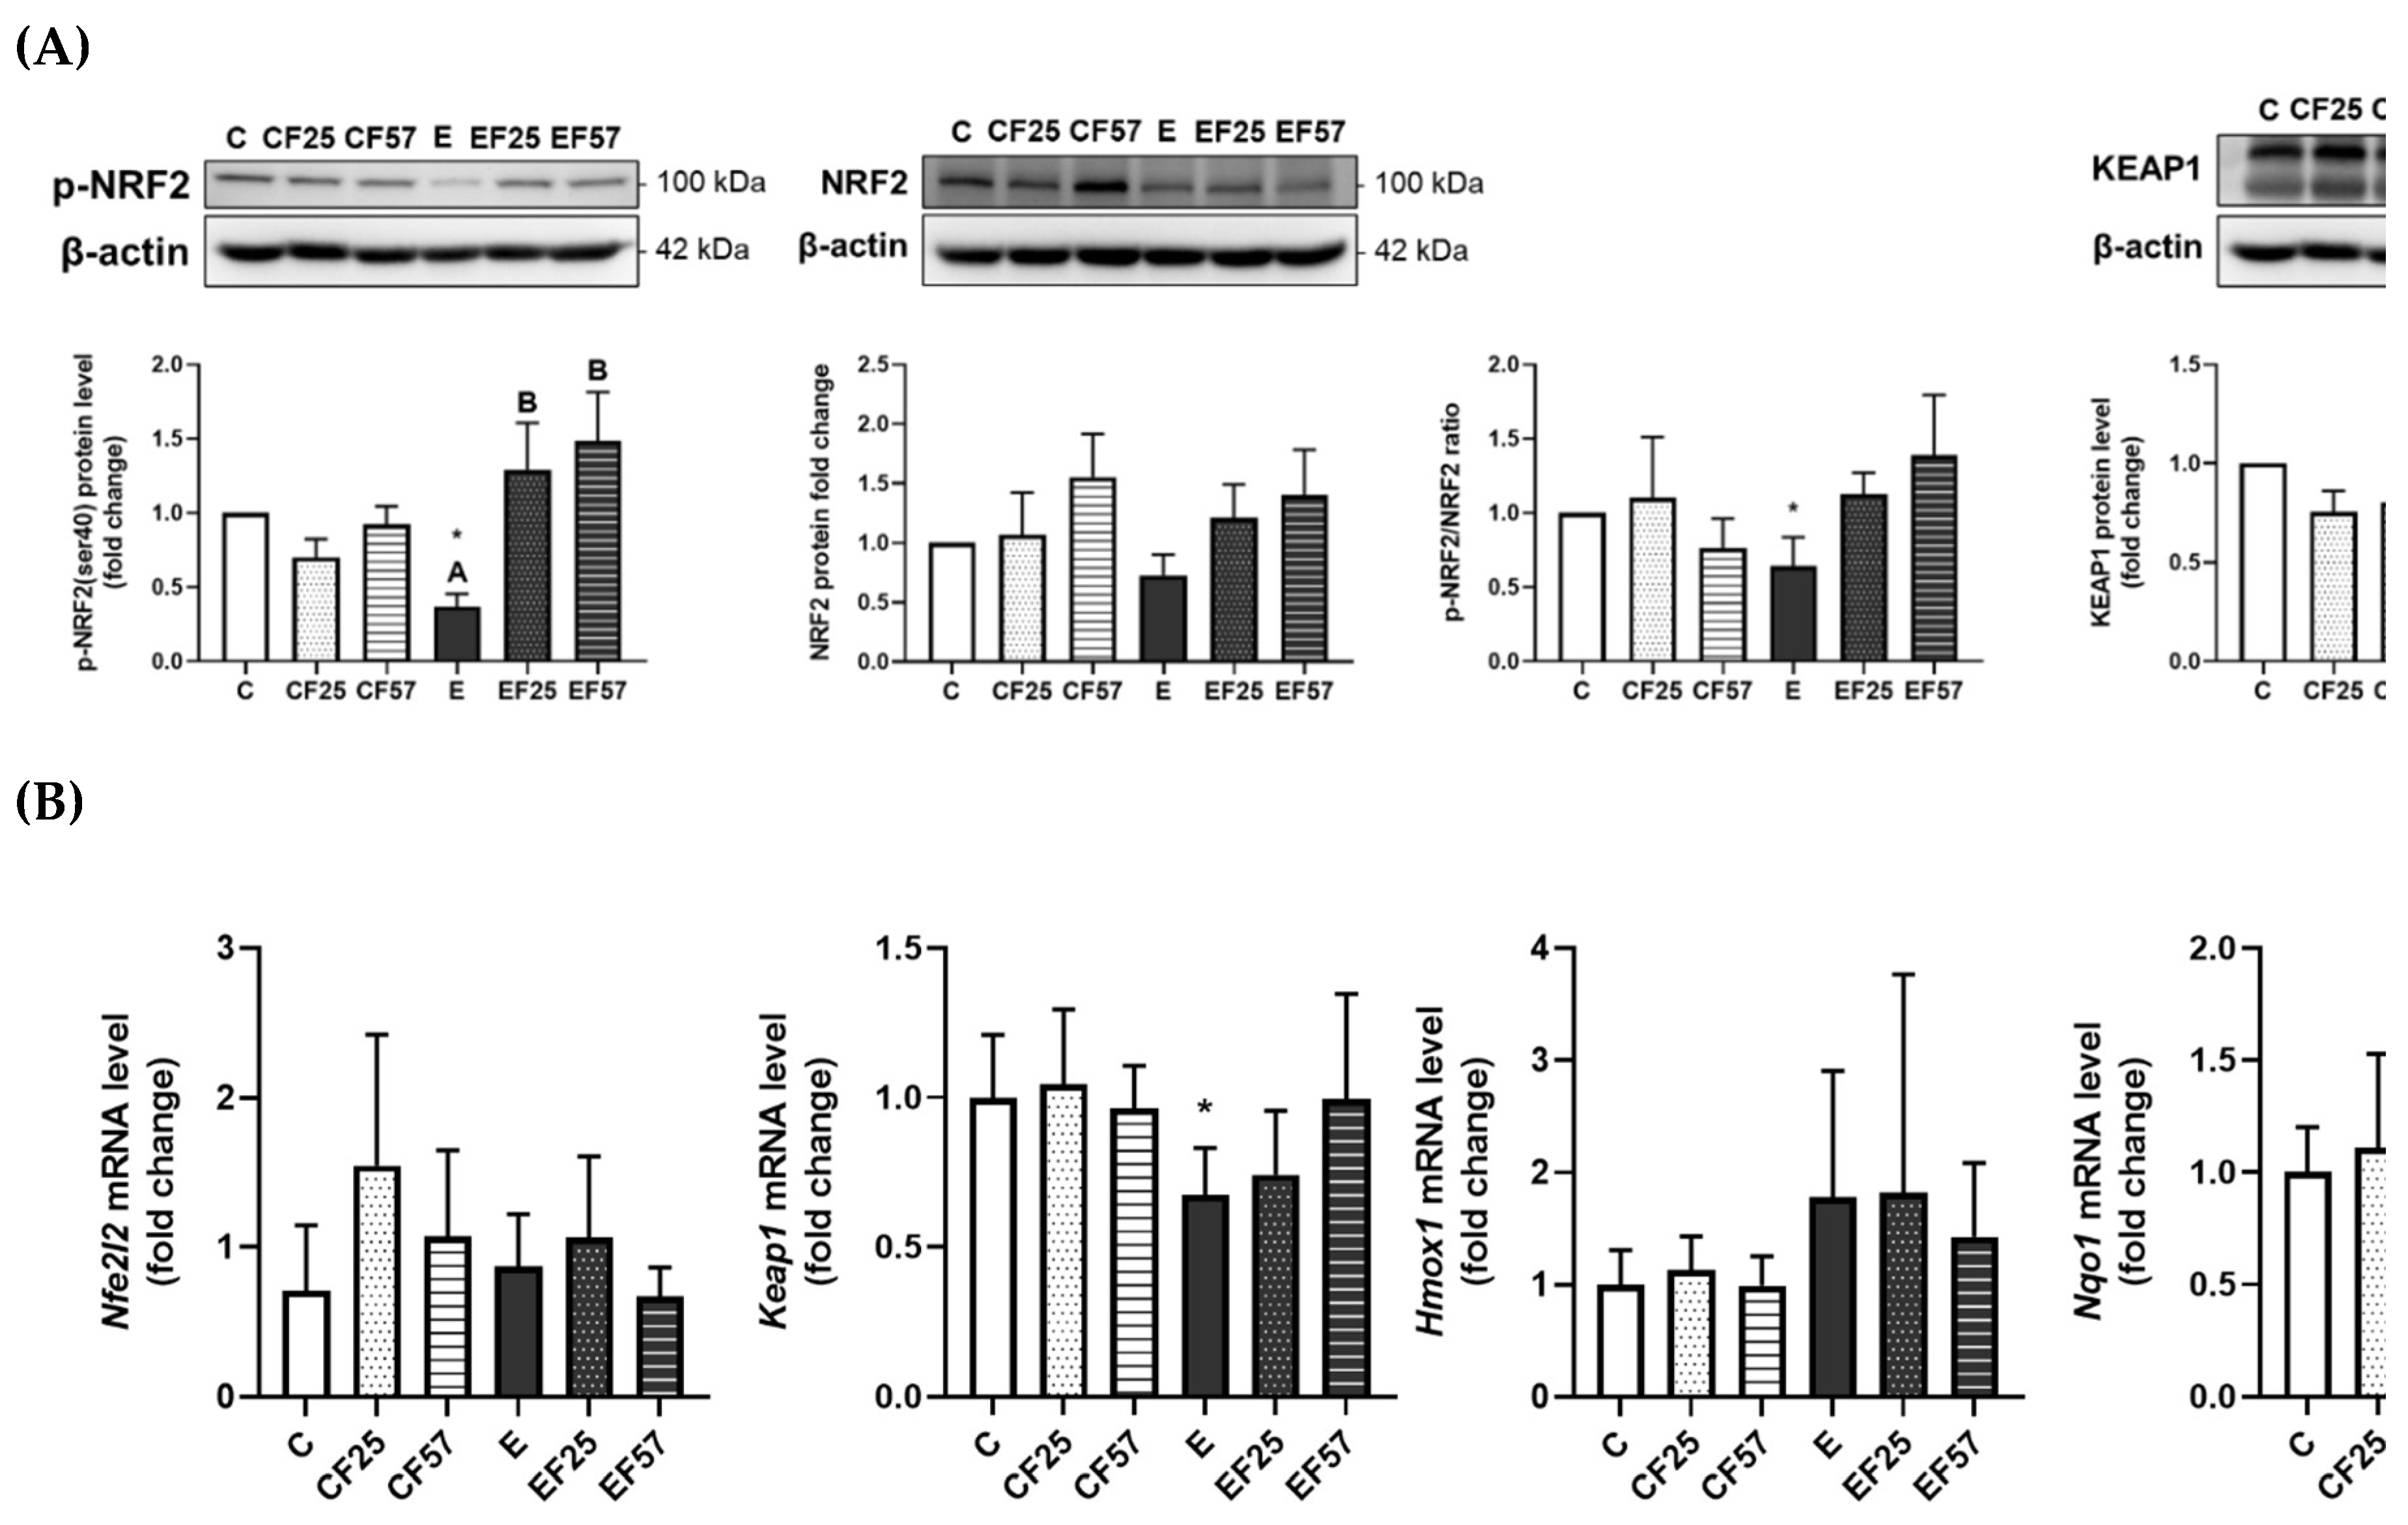
Figure 6.
Effects of fish oil on hippocampal NRF2/KEAP1 protein levels in rats with chronic ethanol-induced liver damage. (A) Representative images and quantitation of phosphorylated (p)-NRF2(ser40), NRF2, phosphorylated ratio, and KEAP1 protein expressions. (B) mRNA levels of nfe2l2, keap1, hmox1, and nqo1. Values are presented as the mean ± SD. * p<0.05 compared to the C group according to Student’s t-test. Superscript letters (a,b,c) and (A,B,C) respectively indicate differences among three control and ethanol groups according to a one-way ANOVA with Tukey’s post-hoc test (p<0.05). C, control group; E, ethanol group; F25, 25% fish oil substitution for olive oil; F57, 57% fish oil substitution for olive oil.
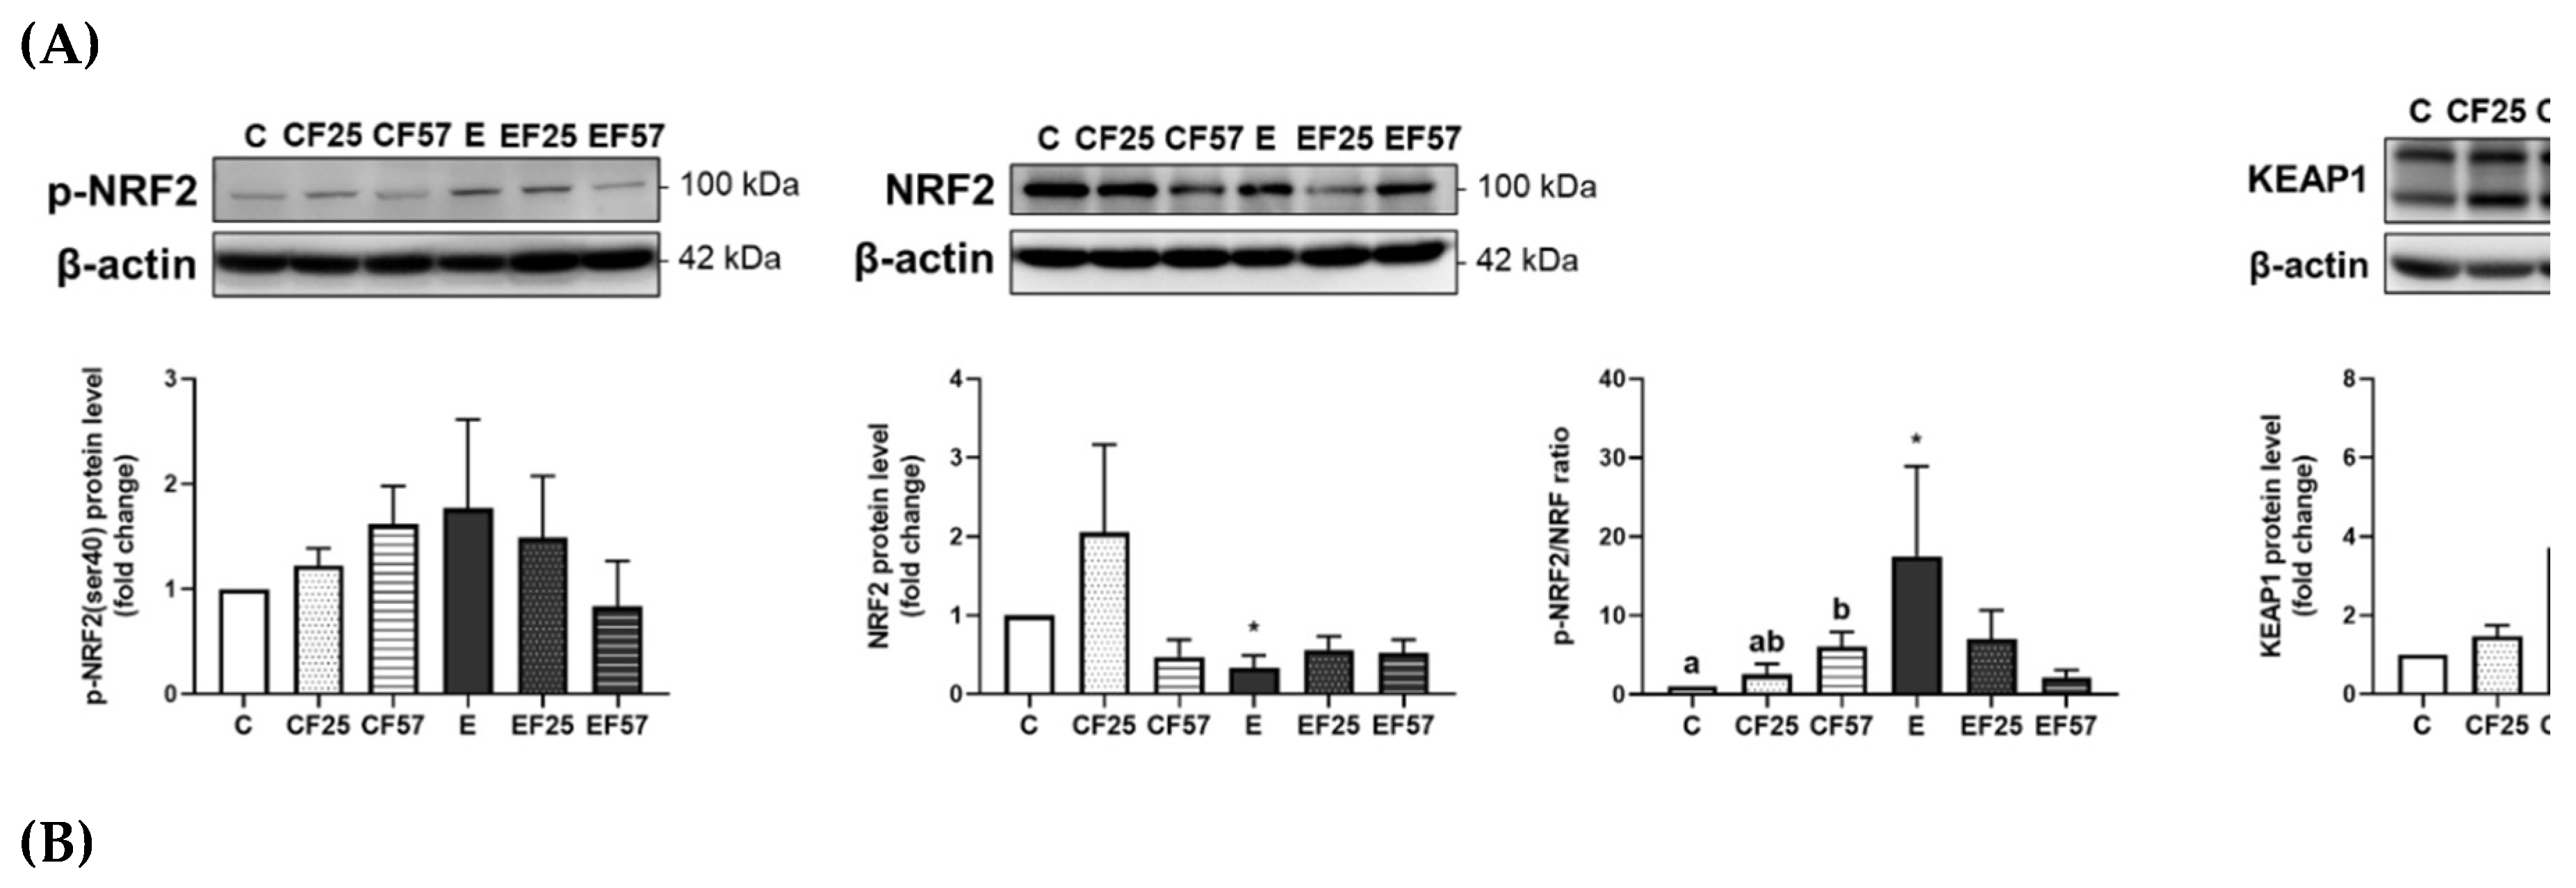
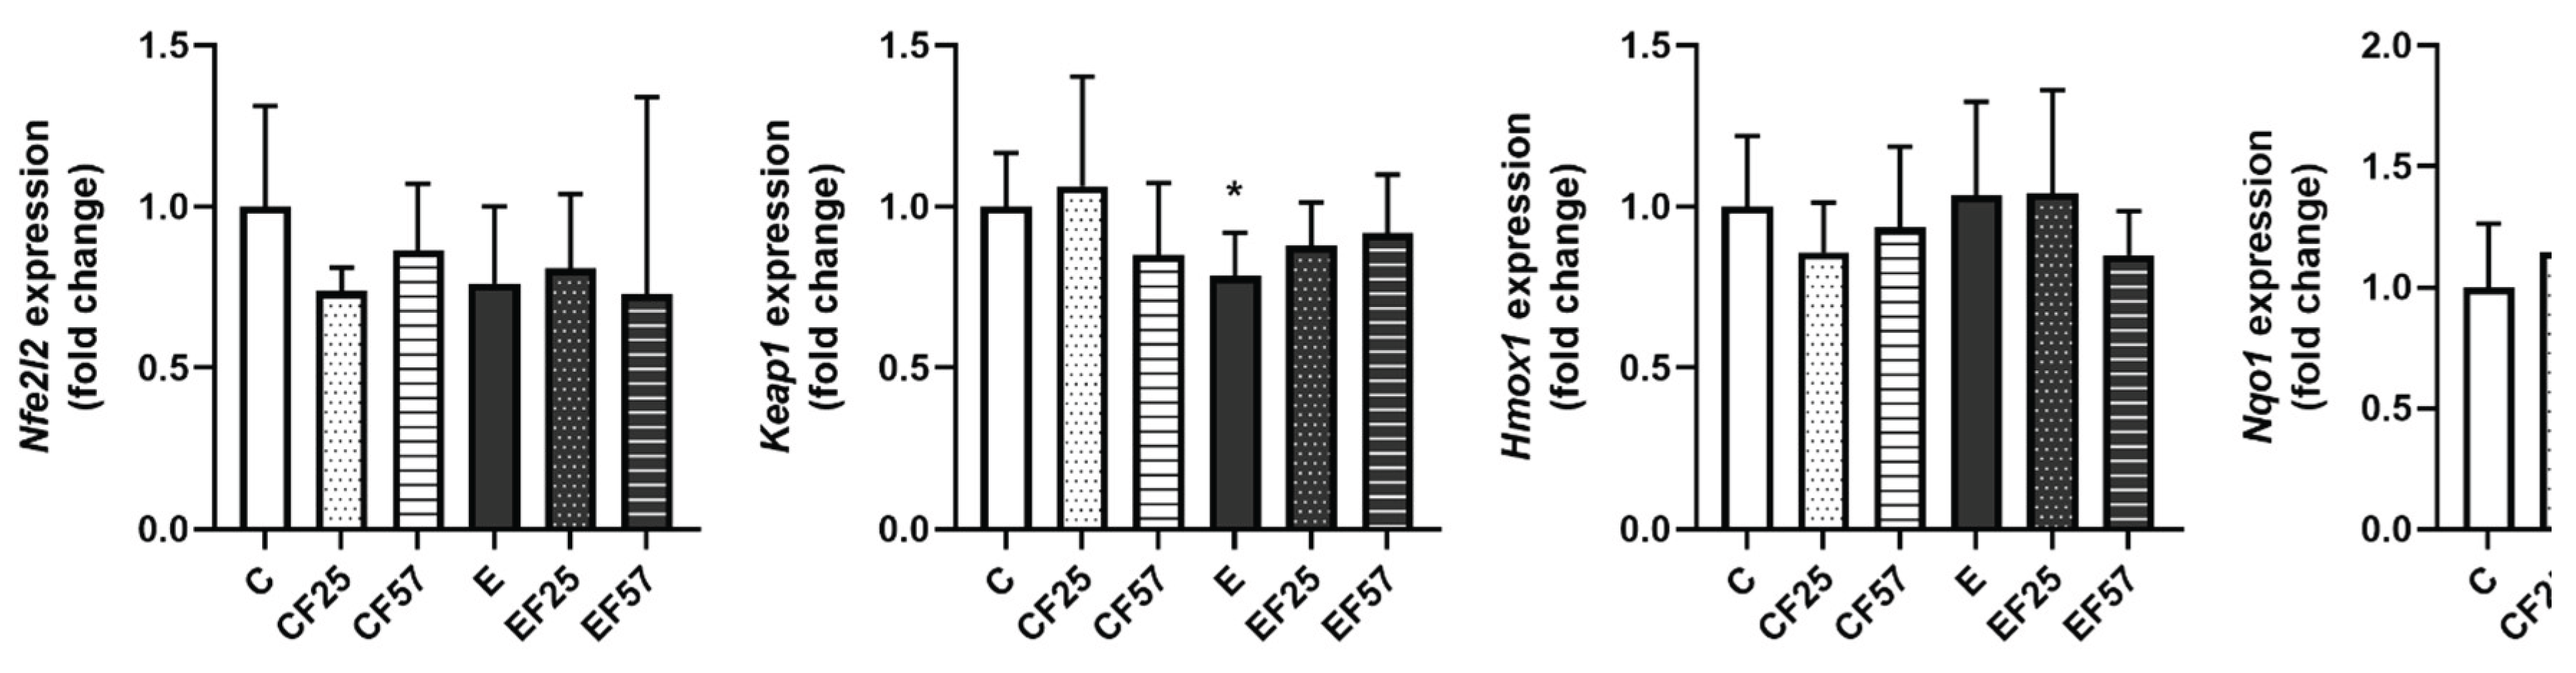
Table 1.
Effects of fish oil on ethanol consumption, dietary intake and efficiency, body weight (BW), relative liver weight, and liver injury markers in rats with chronic ethanol-induced liver damage1.
Table 1.
Effects of fish oil on ethanol consumption, dietary intake and efficiency, body weight (BW), relative liver weight, and liver injury markers in rats with chronic ethanol-induced liver damage1.
| Group2 | - | F25 | F57 |
Interaction (p value)3 |
|||||||
| Ethanol × Fish oil | |||||||||||
| Initial BW (g) | C | 264.7 | ± | 13.0 | 271.2 | ± | 5.9 | 270.7 | ± | 11.8 | 0.5164 |
| E | 271.4 | ± | 6.4 | 274.0 | ± | 9.9 | 267.7 | ± | 12.8 | ||
| Final BW (g) | C | 449.9 | ± | 10.9 | 460.4 | ± | 8.0 | 442.3 | ± | 25.5 | 0.5559 |
| E | 406.2 | ± | 21.2* | 404.2 | ± | 14.7 | 399.1 | ± | 11.8 | ||
|
Relative liver weight (%) |
C | 3.06 | ± | 0.37 | 3.15 | ± | 0.19 | 3.15 | ± | 0.15 | 0.5370 |
| E | 3.46 | ± | 0.41 | 3.85 | ± | 0.48 | 3.63 | ± | 0.30 | ||
|
AST (U/L) |
C | 59.7 | ± | 5.8a | 65.8 | ± | 5.8a | 74.5 | ± | 3.3b | 0.0058 |
| E | 193.7 | ± | 61.3*A | 120.8 | ± | 38.9B | 134.3 | ± | 19.6A | ||
|
ALT (U/L) |
C | 40.0 | ± | 12.1 | 49.5 | ± | 5.2 | 49.2 | ± | 7.8 | 0.6402 |
| E | 96.0 | ± | 15.8* | 92.0 | ± | 32.8 | 93.7 | ± | 23.4 | ||
1 Values are represented as the mean ± standard deviation (N=6). An asterisk (*) indicates a significant difference compared to the C group (p<0.05) according to Student’s t-test. Superscript letters (a,b,c) and (A,B,C) respectively indicate differences among the three control and ethanol groups according to a one-way ANOVA with Tukey’s post-hoc test (p<0.05). 2 C, control group; E, ethanol group; F25, 25% fish oil substituted for olive oil; F57, 57% fish oil substituted for olive oil. 3 The interaction was evaluated by a two-way ANOVA with Tukey’s multiple-comparison test. BW, body weight; AST, aspartate aminotransferase; ALT, alanine aminotransferase.
Table 2.
Effects of fish oil on hepatic glutathione (GSH) concentration and antioxidant enzymes in rats with chronic ethanol-induced liver damage1.
Table 2.
Effects of fish oil on hepatic glutathione (GSH) concentration and antioxidant enzymes in rats with chronic ethanol-induced liver damage1.
| Group2 | - | F25 | F57 |
Interaction (p value)3 |
|||||||
| Ethanol × Fish oil | |||||||||||
| GSH (µM/mg) | C | 35.9 | ± | 18.11 | 23.34 | ± | 8.4 | 21.19 | ± | 4.63 | 0.0247 |
| E | 10.20 | ± | 2.66* | 12.31 | ± | 4.07 | 13.93 | ± | 6.35 | ||
| GPx (nmol/min/mg) | C | 0.225 | ± | 0.055 | 0.241 | ± | 0.083 | 0.174 | ± | 0.054 | 0.3770 |
| E | 0.147 | ± | 0.035* | 0.175 | ± | 0.057 | 0.149 | ± | 0.027 | ||
| GRd (nmol/min/mg) | C | 12.336 | ± | 2.393 | 12.2 | ± | 1.793 | 12.85 | ± | 1.82 | 0.2203 |
| E | 9.429 | ± | 2.892 | 12.996 | ± | 4.46 | 12.188 | ± | 3.261 | ||
| SOD (U/mg) | C | 13.27 | ± | 2.97 | 14.98 | ± | 4.11 | 13.68 | ± | 4.23 | 0.7607 |
| E | 8.79 | ± | 2.27* | 12.15 | ± | 3.95 | 10.85 | ± | 3.12 | ||
| CAT (nmol/min/mg) | C | 4705.4 | ± | 1886.4 | 4638.2 | ± | 1136.7 | 5344.4 | ± | 864.6 | 0.4142 |
| E | 2522.3 | ± | 724.2*A | 3062.4 | ± | 458.5B | 4222.9 | ± | 921.0B | ||
1 Values are presented as the mean ± standard deviation (N=6). An asterisk (*) indicates a significant difference compared to the C group (p<0.05) according to Student’s t-test. Superscript letters (a,b,c) and (A,B,C) respectively indicate differences among three control and ethanol groups according to a one-way ANOVA with Tukey’s post-hoc test (p<0.05). 2 C, control liquid diet group; E, ethanol liquid diet group; F25, fish oil substituted for 25% olive oil in dietary oil; F57, fish oil substituted for 57% olive oil in dietary oil. 3 The interaction was evaluated by a two-way ANOVA with Tukey’s multiple-comparison test. GSH, glutathione; GPx, glutathione peroxidase; GRd, glutathione reductase; SOD, superoxide dismutase; CAT, catalase.
Table 3.
Effects of fish oil on prefrontal cortex glutathione (GSH) concentration and antioxidant enzymes in rats with chronic alcohol feeding1.
Table 3.
Effects of fish oil on prefrontal cortex glutathione (GSH) concentration and antioxidant enzymes in rats with chronic alcohol feeding1.
| Group2 | - | F25 | F57 |
Interaction (p value)3 |
|||||||
| Ethanol × Fish oil | |||||||||||
| GSH (µM/mg) | C | 20.11 | ± | 4.03 | 13.81 | ± | 8.11 | 12.05 | ± | 5.25 | 0.4606 |
| E | 12.31 | ± | 6.18* | 11.18 | ± | 4.37 | 15.27 | ± | 5.62 | ||
| GPx (nmol/min/mg) | C | 283.89 | ± | 39.03 | 230.21 | ± | 52.66 | 240.74 | ± | 47.79 | 0.0798 |
| E | 279.35 | ± | 91.85 | 274.37 | ± | 78.98 | 306.15 | ± | 87.59 | ||
| SOD (U/mg) | C | 7.96 | ± | 1.32 | 6.71 | ± | 1.34 | 5.91 | ± | 1.38 | 0.7309 |
| E | 7.48 | ± | 2.89 | 7.03 | ± | 0.6 | 6.4 | ± | 1.04 | ||
| CAT (nmol/min/mg) | C | 6.95 | ± | 3.3 | 9.33 | ± | 3.25 | 9.64 | ± | 2.03 | 0.2093 |
| E | 11.60 | ± | 2.48*A | 13.19 | ± | 2.89AB | 17.79 | ± | 4.09B | ||
1 Values are presented as the mean ± standard deviation (N=6). An asterisk (*) indicates a significant difference compared to the C group (p<0.05) according to Student’s t-test. Superscript letters (a,b,c) and (A,B,C) respectively indicate differences among three control and ethanol groups according to a one-way ANOVA with Tukey’s post-hoc test (p<0.05). 2 C, control liquid diet group; E, ethanol liquid diet group; F25, fish oil substituted for 25% olive oil in dietary oil; F57, fish oil substituted for 57% olive oil in dietary oil. 3 The interaction was evaluated by a two-way ANOVA with Tukey’s multiple-comparison test.
Disclaimer/Publisher’s Note: The statements, opinions and data contained in all publications are solely those of the individual author(s) and contributor(s) and not of MDPI and/or the editor(s). MDPI and/or the editor(s) disclaim responsibility for any injury to people or property resulting from any ideas, methods, instructions or products referred to in the content. |
© 2025 by the authors. Licensee MDPI, Basel, Switzerland. This article is an open access article distributed under the terms and conditions of the Creative Commons Attribution (CC BY) license (https://creativecommons.org/licenses/by/4.0/).
Copyright: This open access article is published under a Creative Commons CC BY 4.0 license, which permit the free download, distribution, and reuse, provided that the author and preprint are cited in any reuse.


