Submitted:
19 May 2025
Posted:
20 May 2025
You are already at the latest version
Abstract
This study presents multi-band photometric observations and detailed period analysis of a totally eclipsing binary system exhibiting low photometric amplitude. The system demonstrates characteristic W Ursae Majoris (EW)-type light curves with complete eclipses, enabling precise determination of fundamental parameters through light curve modeling. Photometric analysis reveals that ASASSN-V J171815.10+450432.9 (hereafter J171815) represents a marginal contact binary system with an extreme mass ratio (q<0.09; the more massive component is designated as the primary star), approaching the theoretical lower limit for stable contact configurations. Furthermore, our investigation of orbital period variations uncovers a long-term period increase at a rate of dPdt=(1.08±0.05)×10−6dayyr−1, which is likely attributable to ongoing mass transfer between components. This interpretation aligns with the system’s geometric configuration and observed light curve asymmetries. The unique characteristics presented by this binary system serve as a rare opportunity for in-depth research on the mass ratio theory, and also provide an important opportunity for testing the Thermal Relaxation Oscillation (TRO) theory.
Keywords:
close binaries
; mass ratio
; near-contact binaries
1. Introduction
As defined by Shaw [1], near-contact binaries (NCBs) represent a distinctive subtype within the category of close binaries, where at least one component approaches but does not fully fill its Roche lobe. These systems exhibit diverse morphological configurations, encompassing marginal contact, semi-detached, and near-detached states [2], serving as crucial transitional objects bridging the evolutionary gap between detached and fully contact binaries. According to TRO theory, these binaries undergo oscillations between shallow contact states and semi-detached configurations. In shallow contact binary systems, the component stars have just started to share a common envelope. This distinctive feature makes them ideal subjects for validating the relevant theory and for exploring in depth the complex processes involved in the formation and evolution of over-contact binary systems. These NCBs have relatively short evolutionary timescales [3,4], which results in their relative rarity in the universe. Given their scarcity, there is a pressing need to gather more observational data, as such data are crucial for understanding their fundamental physical characteristics.
Prior theoretical investigations (e.g., [5,6]) established that tidal instability arises in close binaries when the system’s orbital angular momentum falls below three times the rotational angular momentum of the primary component (). Beyond this threshold, the breakdown of synchronized rotation initiates rapid orbital inspiral, ultimately leading to coalescence into a single object. This instability criterion for contact binaries aligns with the theoretically predicted minimum mass ratio , below which systems are predicted to undergo catastrophic orbital decay. However, because different studies employ different research methods, the proposed values for are different. For instance, Yang and Qian [7] statistically deduced that could be as low as 0.044. In contrast, Pešta and Pejcha [8] demonstrated that the value of is contingent upon the type of contact binary. Specifically, for late - type systems with orbital periods exceeding 0.3 days, is approximately 0.087; systems with shorter periods, conversely, exhibit a higher of around 0.246. Early - type contact binaries, on the other hand, display a lower , approximately 0.030. Recent comprehensive reviews by Arbutina and Wadhwa [9] and Wadhwa et al. [10] have thoroughly examined the critical mass ratio and orbital stability of low-q contact binaries. Detection of contact binary systems with observed q values below theoretical predictions poses a significant challenge to existing astrophysical models. Until now, only a few systems with have been identified, including TIC 55007847 (,11]), TYC 4002 - 2628 - 1 (,12]) and TYC 3801 - 1529 - 1 (,13]). These ultra-low-q systems provide a unique perspective for observing stellar merger processes.
Based on the International Variable Star Index 1, CSS-J171815.1+450432 (other names: ASASSN-V J171815.10+450432.9) was a newly discovered contact binary with a low amplitude (0.24 CV band ) and a short period (0.317907d) by Drake et al. [14]. In this paper, photometric observations and their corresponding photometric solutions for the totally eclipsing binary J171815 are presented. Meanwhile, orbital period variations are also investigated, revealing a continuous period increase.
2. Observations and Data Reduction
2.1. Ground Based Observation
Multi-band photometric observations for the totally eclipsing binary J171815 were conducted using the newly installed 50 cm telescope located at Wendeng Biblical Mountain in Weihai ( WH50, N, E ). The observational system consists of a PlaneWave CDK20 telescope (f/6.8) coupled with a Dhyana 4040BSI sCMOS detector featuring square pixels. With an image scale of pixel−1, the system provides a 36.7′ × 36.7′ field of view. Image acquisition was done with MaxIm DL. During the photometric observation, the standard Cousins filters ( ) were employed. Bias, dark and flat frame were obtained during the observations, which were used to calibrate the images of the target. A completed band light curves () were obtained on June 25, 26 and 30, 2024. The typical exposure times for B, V and bands are 140 s, 90 s and 60 s, respectively. Differential photometry was performed using aperture techniques with carefully selected reference stars: the comparison star ( ; ) and check star ( ; ). The phase-folded light curves (Figure 1) were computed using the ephemeris: .
2.2. TESS Observation
NASA’s Transiting Exoplanet Survey Satellite (TESS; [15]) provides continuous photometric observations, making it possible to conduct a detailed analysis of the light curve shapes of eclipsing binary systems. We found that J171815 was observed by TESS in Sectors 24, 25, 26 at 30-minute cadence, while in sectors 51, and 53 at 10-minute cadence. Then we download the relevant data from the Mikulski Archive for Space Telescopes (MAST)2. After acquiring the local minimum times and applying them to phase the light curves, we excluded data points with evident discrepancies in our analysis. Then, we normalized the light curves according to the values at phase 0.25. All phased light curves from TESS are illustrated in Figure 2. Moreover, for the sake of comparison, we included all these light curves in the last panel of the same figure. As can be seen from the figure, the secondary minimum distinctly shows a flat bottom characteristic.
3. Orbital Period Investigation
For the purpose of examining the orbital period’s variation, we adhered to the procedures described in [16,17,18] to calculate the minimum times of TESS data. As a result, 20 minimum times were obtained. Since the TESS data use the Barycentric Julian Date (BJD), we transformed the minimum times determined by our observations to BJD using online tools3 [19]. Through these efforts, we identified 24 eclipsing minima, which are listed in Table 1. Using the following equation:
the diagrams of are obtained and displayed in Figure 3. The diagram of illustrates an upward parabolic change. By using the least square method to fit the curve, we derived the following ephemeris formula:
According to Equation (2), the residuals are calculated and displayed at the bottom of Figure 3. The increase in the secular period of Equation (2) is calculated to be . Considering the short timescale and the limited observational data available for J171815, the observed long-term orbital trend may represent only a portion of the actual orbital period variation. Therefore, additional observations are required to confirm and further understand these findings.
4. Photometric Solutions
We employed the Wilson-Devinney (W-D) code [20,21,22,23,24,25] to obtain photometric solutions for the binary system. A pivotal step in deriving the photometric parameters of the binary system was determining the effective temperatures, as accurate temperature values are essential for reliable modeling. Using data from the Gaia mission [26,27], we calculated the effective temperature to be 5495 K. As reported by Andrae et al. [28], Gaia-derived effective temperatures within the 3000–10,000 K range are typically associated with uncertainties of approximately 324 K.
Notably, the light curves of J171815 display extremely low amplitudes, suggesting that the primary component predominantly contributes to the system’s overall luminosity. Consequently, we adopted the effective temperatures obtained from the Gaia mission as the effective temperature for the primary component. In accordance with the guidelines proposed by Lucy [29] and Ruciński [30], we set the bolometric albedo coefficients and gravity darkening coefficients for both components. The bolometric albedo coefficients were assigned as , while the gravity darkening coefficients were set to .
The light curves of the target exhibit small amplitudes, suggesting an extremely low mass ratio. This presents a considerable challenge in directly measuring the mass ratio from radial velocity (RV) observations. However, the presence of total eclipses in the system supports the reliability of photometric results obtained using the Wilson–Devinney (W–D) code, as corroborated by earlier studies [31,32]. Given that the target displays typical EW-type light curves, we initially adopted mode 3 for the photometric analysis, which is suitable for overcontact binary systems. To estimate the initial mass ratio, we applied the q-search method, beginning with a sequence of trial mass ratios starting at 0.06. For each tested mass ratio, parameters including the surface potential (), orbital inclination (i), secondary component temperature (), and the luminosity of the primary component () were allowed to vary. Light curve models were generated for each q and compared to the observed data. The optimal model, selected by minimizing a statistical indicator such as the chi-squared () value, yielded an estimate for the initial mass ratio.
During the q-search process, we observed that certain trial mass ratios did not converge even after 200 iterations for the target J171815. To address this, we expanded the q-search approach to incorporate modes 4 and 5. Mode 4 is intended for semi-detached binary systems in which the primary star fills its critical Roche lobe, whereas mode 5 applies to semi-detached systems where the less massive component reaches its Roche lobe. Eventually, convergent solutions for J171815 were obtained under modes 3, 4, and 5. The plots illustrating the correlation between the tested mass ratios q and the sums of weighted squared deviations are displayed in the left panel of Figure 4.
As previously stated, the TESS mission observed the binary system. It monitored sectors 24, 25, and 26 at a 30 - minute sampling rate, while sectors 51 and 53 were observed at a more frequent 10 - minute cadence, as depicted in Figure 2. The figure clearly reveals that the 30 minute cadence data suffered substantially from phase - smearing effects. These effects can distort the true shape of the light curve and lead to inaccuracies in the photometric analysis. Furthermore, the light curves obtained from different sectors exhibit remarkable similarity in their profiles. This similarity strongly suggests that there were no significant intrinsic changes in the system’s brightness during the observation period. Given these factors, the light curves from sector 53 were selected for deriving the photometric solutions. Sector 53’s data stood out because of its higher data density and lower scatter. For comparison, the q-search method was applied to the TESS data set. The plots in the right panels of Figure 4 illustrate the relationships between the tested mass ratios q and .
Based on the left panel of Figure 4, the minimum values of derived from modes 3, 4, and 5 are 0.084, 0.088, and 0.087, respectively. They are quite similar to the results derived from TESS, which yielded a minimum value of at , , and for modes 3, 4, and 5, respectively. Given the long - term increasing trend in the orbital period, which indicates mass transfer from the less massive component to the more massive one, modes 3 and 5 are considered more plausible than mode 4. Therefore, modes 3 and 5 were selected for subsequent photometric solutions. The corresponding mass ratios from our data and TESS data were used as initial mass ratios. These values were then treated as adjustable parameters in the following analysis, together with other key parameters such as the luminosity of the primary (), phase shift, secondary temperature (), potential (), and inclination (i). From Figure 1 and Figure 2, we can see that all the light curves show asymmetry with brightness enhancement at the secondary light maximum. Just as the asymmetry in some NCBs [33,34,35] has been explained by a hot spot on the binaries, we added a hot spot to the primary component. Since the light curve exhibits total eclipses, the derived photometric solutions should be reliable [31,36]. The final photometric solutions from the data and the TESS data are summarized in Table 2, labeled , , and , respectively. The theoretical light curves obtained for mode 3 and mode 5 were shown in Figure 5.
In order to investigate whether J171815 is contaminated by the visible star in its surroundings, we consulted the Gaia database for nearby stars: the closest star is located 27 arcseconds away, with a g-band magnitude of 19.72. This star is significantly dimmer than J171815, which has a g-band magnitude of 13.10. Given these findings, the contribution of third light from nearby stars is negligible. Since most W UMa systems contain a third component, the mass ratio we obtained should be regarded as the lower limit of the binary’s mass ratio.
5. Discussions and Conclusions
The photometric solutions and detailed orbital period analysis for J171815 are carried out for the first time. Photometric solutions derived from multi-band observations and TESS data are listed in Table 2. From Figure 4, it is evident that the light curve can be well reproduced by both mode 3 and mode 4. Given that no significant abrupt changes in the slope of the observed light curves were detected around the orbital phases of approximately 0.36 and 0.64 (see Figure 1 and Figure 2), mode 3 appears to be a more suitable choice. Photometric solutions derived from mode 3 suggest that J171815 is a W-type contact binary system, where the more massive star is cooler than the less massive one. The system has an ultra low mass ratio and a shallow contact degree, where f is defined as , with being the Roche lobe potential at the Lagrangian point, the potential at the Lagrangian point and the actual potential of the star.
In an effort to determine the global parameters of J171815, we utilized the final results from its light-curve solutions (mode3 of TESS)). Assuming that the more massive primary star in the system is on the main sequence, we estimated its mass using data from an online table [37]. This led to a mass estimate of . Applying Kepler’s third law (), we calculated the semi-major axes (the separations between the components) to be approximately . Based on the photometric solutions provided in Table 2, the radii of the primary and secondary components were calculated. These values are (primary) and (secondary). The luminosities of the binaries were then computed based on the Stefan - Boltzmann law (), which resulted in and .
For the first time, we analyzed the minimum times calculated for constructing and plotting the diagrams for J171815, which are shown in Figure 3, which reveal an upward parabolic trend. The quadratic term in the orbital period ephemeris (Equation (2)) reveals a secular increase in the orbital period at a rate of (), which indicates mass transfer from the less massive primary component to the more massive secondary star. Then, using Equation (3):
we calculate the mass accretion rate of the primary component as .
In summary, our analysis based on photometric solutions and orbital period studies indicates that J171815 has an ultra-low mass ratio. The observed positive () supports this scenario, suggesting mass transfer from the less massive star to the more massive one through Roche lobe overflow, which may cause brightness enhancement around the secondary light maximum. Given its very small mass ratios and marginal critical states, J171815 is an important candidate for continuous monitoring. Such observations are crucial for testing theories of binary mergers and thermal relaxation oscillations, providing valuable insights into the evolution of these systems.
Funding
This research received no external funding.
Data Availability Statement
The -band photometric data utilized in this study are available from the corresponding author upon reasonable request. Those interested are invited to contact Dr. Guo at difu@sdu.edu.cn. All other data used in this research are publicly accessible.
Acknowledgments
This work makes use of data from the European Space Agency (ESA) mission Gaia (https://www.cosmos.esa.int/gaia), processed by the Gaia Data Processing and Analysis Consortium (https://www.cosmos.esa.int/web/gaia/dpac/consortium). This work makes use of data collected by the TESS mission which are funded by NASA Science Mission directorate. We acknowledge the TESS team for its support of this work. We acknowledge supports by the instrument Enducation Funds of Shandong University (yr20240103), and by the Qilu Young Researcher Project of Shandong University.
Conflicts of Interest
The authors declare no conflicts of interest.
References
- Shaw, J.S. Near-Contact Binary Stars. In Proceedings of the Active Close Binaries Proceedings, NATO Advanced Study Institute, Vol. 319, NATO Advanced Study Institute (ASI) Series C; 1990; p. 241. [Google Scholar]
- Zhu, L.; Qian, S.; Liu, L.; Liao, W.P.; He, J.J.; Li, L.J.; Zhao, E.G.; Dai, Z.B.; Zhang, J.; Li, K. A Preliminary Photometric Study of the HW Vir-like Binary NSVS14256825. In Proceedings of the 9th Pacific Rim Conference on Stellar Astrophysics; Qain, S.; Leung, K.; Zhu, L.; Kwok, S., Eds., Vol. 451, Astronomical Society of the Pacific Conference Series; 2011; p. 155. [Google Scholar]
- Zhu, L.; Qian, S. BL Andromedae and GW Tauri: close binary stars in a key evolutionary stage. Monthly Notices of the Royal Astronomical Society 2006, 367, 423–432. [Google Scholar] [CrossRef]
- Meng, Z.B.; Wang, H.W.; Yu, Y.X.; Hu, K.; Xiang, F.Y. HT Lyn and IR Lyn: Two Semi-detached-type Near-contact Binaries with Stable Orbital Period. Research in Astronomy and Astrophysics 2022, 22, 115015. [Google Scholar] [CrossRef]
- Darwin, G.H. The Determination of the Secular Effects of Tidal Friction by a Graphical Method. Proceedings of the Royal Society of London Series I 1879, 29, 168–181. [Google Scholar]
- Hut, P. Stability of tidal equilibrium. Astronomy & Astrophysics 1980, 92, 167–170. [Google Scholar]
- Yang, Y.G.; Qian, S.B. Deep, Low Mass Ratio Overcontact Binary Systems. XIV. A Statistical Analysis of 46 Sample Binaries. Astronomical Journal 2015, 150, 69. [Google Scholar] [CrossRef]
- Pešta, M.; Pejcha, O. Mass-ratio distribution of contact binary stars. Astronomy & Astrophysics 2023, arXiv:astro-ph.SR/2212.02553]672, A176. [Google Scholar] [CrossRef]
- Arbutina, B.; Wadhwa, S. The Critical Mass Ratio for W-UMa-Type Contact Binary Sytems. Serbian Astronomical Journal 2024, arXiv:astro-ph.SR/2404.03821]208, 1–15. [Google Scholar] [CrossRef]
- Wadhwa, S.S.; Landin, N.R.; Arbutina, B.; Tothill, N.F.H.; De Horta, A.Y.; Filipović, M.D.; Petrović, J.; Djurašević, G. Low-mass contact binaries: orbital stability at extreme low mass ratios. Monthly Notices of the Royal Astronomical Society 2024, arXiv:astro-ph.SR/2411.02020]535, 2494–2502. [Google Scholar] [CrossRef]
- Cheng, Q.; Xiong, J.; Ding, X.; Ji, K.; Li, J.; Liu, C.; Li, J.; Luo, J.; Lyu, X.; Han, Z.; et al. The First Photometric Analysis of Two Low-mass-ratio Contact Binary Systems in TESS Survey. Astronomical Journal 2024, arXiv:astro-ph.SR/2405.19841]167, 148. [Google Scholar] [CrossRef]
- Guo, D.F.; Li, K.; Liu, F.; Li, H.Z.; Xia, Q.Q.; Gao, X.; Gao, X.; Chen, X.; Gao, D.Y.; Sun, G.Y. The first photometric and orbital period investigation of an extremely low mass ratio contact binary with a sudden period change TYC 4002-2628-1. Monthly Notices of the Royal Astronomical Society 2022, arXiv:astro-ph.SR/2209.15175]517, 1928–1936. [Google Scholar] [CrossRef]
- Li, K.; Gao, X.; Guo, D.F.; Gao, D.Y.; Chen, X.; Wang, L.H.; Xin, Y.X.; Han, Y.X.; Kim, C.H.; Jeong, M.J. Detection of the lowest mass ratio contact binary in the universe: TYC 3801-1529-1. Astronomy & Astrophysics 2024, arXiv:astro-ph.SR/2411.12132]692, L4. [Google Scholar] [CrossRef]
- Drake, A.J.; Graham, M.J.; Djorgovski, S.G.; Catelan, M.; Mahabal, A.A.; Torrealba, G.; García-Álvarez, D.; Donalek, C.; Prieto, J.L.; Williams, R.; et al. The Catalina Surveys Periodic Variable Star Catalog. Astrophysical Journal Supplement Series 2014, arXiv:astro-ph.SR/1405.4290]213, 9. [Google Scholar] [CrossRef]
- Ricker, G.R.; Winn, J.N.; Vanderspek, R.; Latham, D.W.; Bakos, G.Á.; Bean, J.L.; Berta-Thompson, Z.K.; Brown, T.M.; Buchhave, L.; Butler, N.R.; et al. Transiting Exoplanet Survey Satellite (TESS). Journal of Astronomical Telescopes, Instruments, and Systems 2015, 1, 014003. [Google Scholar] [CrossRef]
- Li, K.; Kim, C.H.; Xia, Q.Q.; Michel, R.; Hu, S.M.; Gao, X.; Guo, D.F.; Chen, X. The First Light Curve Modeling and Orbital Period Change Investigation of Nine Contact Binaries around the Short-period Cutoff. Astronomical Journal 2020, arXiv:astro-ph.SR/2003.02377]159, 189. [Google Scholar] [CrossRef]
- Li, K.; Xia, Q.Q.; Kim, C.H.; Gao, X.; Hu, S.M.; Guo, D.F.; Gao, D.Y.; Chen, X.; Guo, Y.N. Photometric Study and Absolute Parameter Estimation of Six Totally Eclipsing Contact Binaries. Astronomical Journal 2021, arXiv:astro-ph.SR/2104.13759]162, 13. [Google Scholar] [CrossRef]
- Li, K.; Gao, X.; Liu, X.Y.; Gao, X.; Li, L.Z.; Chen, X.; Sun, G.Y. Extremely Low Mass Ratio Contact Binaries. I. The First Photometric and Spectroscopic Investigations of Ten Systems. Astronomical Journal 2022, arXiv:astro-ph.SR/2209.03653]164, 202. [Google Scholar] [CrossRef]
- Eastman, J.; Siverd, R.; Gaudi, B.S. Achieving Better Than 1 Minute Accuracy in the Heliocentric and Barycentric Julian Dates. Publications of the Astronomical Society of the Pacific 2010, arXiv:astro-ph.IM/1005.4415]122, 935. [Google Scholar] [CrossRef]
- Wilson, R.E.; Devinney, E.J. Realization of Accurate Close-Binary Light Curves: Application to MR Cygni. Astrophysical Journal 1971, 166, 605. [Google Scholar] [CrossRef]
- Wilson, R.E.; Van Hamme, W.; Terrell, D. Flux Calibrations from Nearby Eclipsing Binaries and Single Stars. Astrophysical Journal 2010, 723, 1469–1492. [Google Scholar] [CrossRef]
- Wilson, R.E. Accuracy and Efficiency in the Binary Star Reflection Effect. Astrophysical Journal 1990, 356, 613. [Google Scholar] [CrossRef]
- Wilson, R.E. Spotted Star Light Curves with Enhanced Precision. Astronomical Journal 2012, 144, 73. [Google Scholar] [CrossRef]
- Wilson, R.E. Eclipsing Binary Solutions in Physical Units and Direct Distance Estimation. Astrophysical Journal 2008, 672, 575–589. [Google Scholar] [CrossRef]
- Van Hamme, W.; Wilson, R.E. Third-Body Parameters from Whole Light and Velocity Curves. Astrophysical Journal 2007, 661, 1129–1151. [Google Scholar] [CrossRef]
- Gaia Collaboration. ; Prusti, T.; de Bruijne, J.H.J.; Brown, A.G.A.; Vallenari, A.; Babusiaux, C.; Bailer-Jones, C.A.L.; Bastian, U.; Biermann, M.; Evans, D.W.; et al. The Gaia mission. Astronomy & Astrophysics 2016, arXiv:astro-ph.IM/1609.04153]595, A1. [Google Scholar] [CrossRef]
- Gaia Collaboration. ; Brown, A.G.A.; Vallenari, A.; Prusti, T.; de Bruijne, J.H.J.; Babusiaux, C.; Bailer-Jones, C.A.L.; Biermann, M.; Evans, D.W.; Eyer, L.; et al. Gaia Data Release 2. Summary of the contents and survey properties. Astronomy & Astrophysics 2018, arXiv:astro-ph.GA/1804.09365]616, A1. [Google Scholar] [CrossRef]
- Andrae, R.; Fouesneau, M.; Creevey, O.; Ordenovic, C.; Mary, N.; Burlacu, A.; Chaoul, L.; Jean-Antoine-Piccolo, A.; Kordopatis, G.; Korn, A.; et al. Gaia Data Release 2. First stellar parameters from Apsis. Astronomy & Astrophysics 2018, arXiv:astro-ph.SR/1804.09374]616, A8. [Google Scholar] [CrossRef]
- Lucy, L.B. Gravity-Darkening for Stars with Convective Envelopes. Zeitschrift für Astrophysik 1967, 65, 89. [Google Scholar]
- Ruciński, S.M. The Proximity Effects in Close Binary Systems. II. The Bolometric Reflection Effect for Stars with Deep Convective Envelopes. Acta Astronomica 1969, 19, 245. [Google Scholar]
- Terrell, D.; Wilson, R.E. Photometric Mass Ratios of Eclipsing Binary Stars. Astrophysics and Space Sciences 2005, 296, 221–230. [Google Scholar] [CrossRef]
- Li, K.; Xia, Q.Q.; Kim, C.H.; Hu, S.M.; Guo, D.F.; Jeong, M.J.; Chen, X.; Gao, D.Y. Two Contact Binaries with Mass Ratios Close to the Minimum Mass Ratio. Astrophysical Journal 2021, arXiv:astro-ph.SR/2109.02923]922, 122. [Google Scholar] [CrossRef]
- Zhu, L.Y.; Qian, S.B.; Zola, S.; Kreiner, J.M. Near-Contact Binaries with Mass Transfer: V473 Cassiopeiae and II Persei. Astronomical Journal 2009, 137, 3574–3580. [Google Scholar] [CrossRef]
- Tian, X.M.; Chang, L.F. Investigation on the mass transferring near-contact binary TT Cet. Publication of the Astronomical Society of Australia 2020, 37, e031. [Google Scholar] [CrossRef]
- Chang, L.F.; Zhu, L.Y. V505 Cyg: A Mass-transferring Marginal Contact Binary. Publications of the Astronomical Society of the Pacific 2022, 134, 054202. [Google Scholar] [CrossRef]
- Zhang, J.; Qian, S.B.; Han, Z.T.; Wu, Y. Two W-subtype contact binaries: GQ Boo and V1367 Tau. Monthly Notices of the Royal Astronomical Society 2017, 466, 1118–1126. [Google Scholar] [CrossRef]
- Pecaut, M.J.; Mamajek, E.E. Intrinsic Colors, Temperatures, and Bolometric Corrections of Pre-main-sequence Stars. Astrophysical Journal Supplement Series 2013, arXiv:astro-ph.SR/1307.2657]208, 9. [Google Scholar] [CrossRef]
| 1 | |
| 2 | |
| 3 |
Figure 1.
light curves of J171815 observed by 50 cm telescope at Weideng station of Weihai observatory.
Figure 1.
light curves of J171815 observed by 50 cm telescope at Weideng station of Weihai observatory.
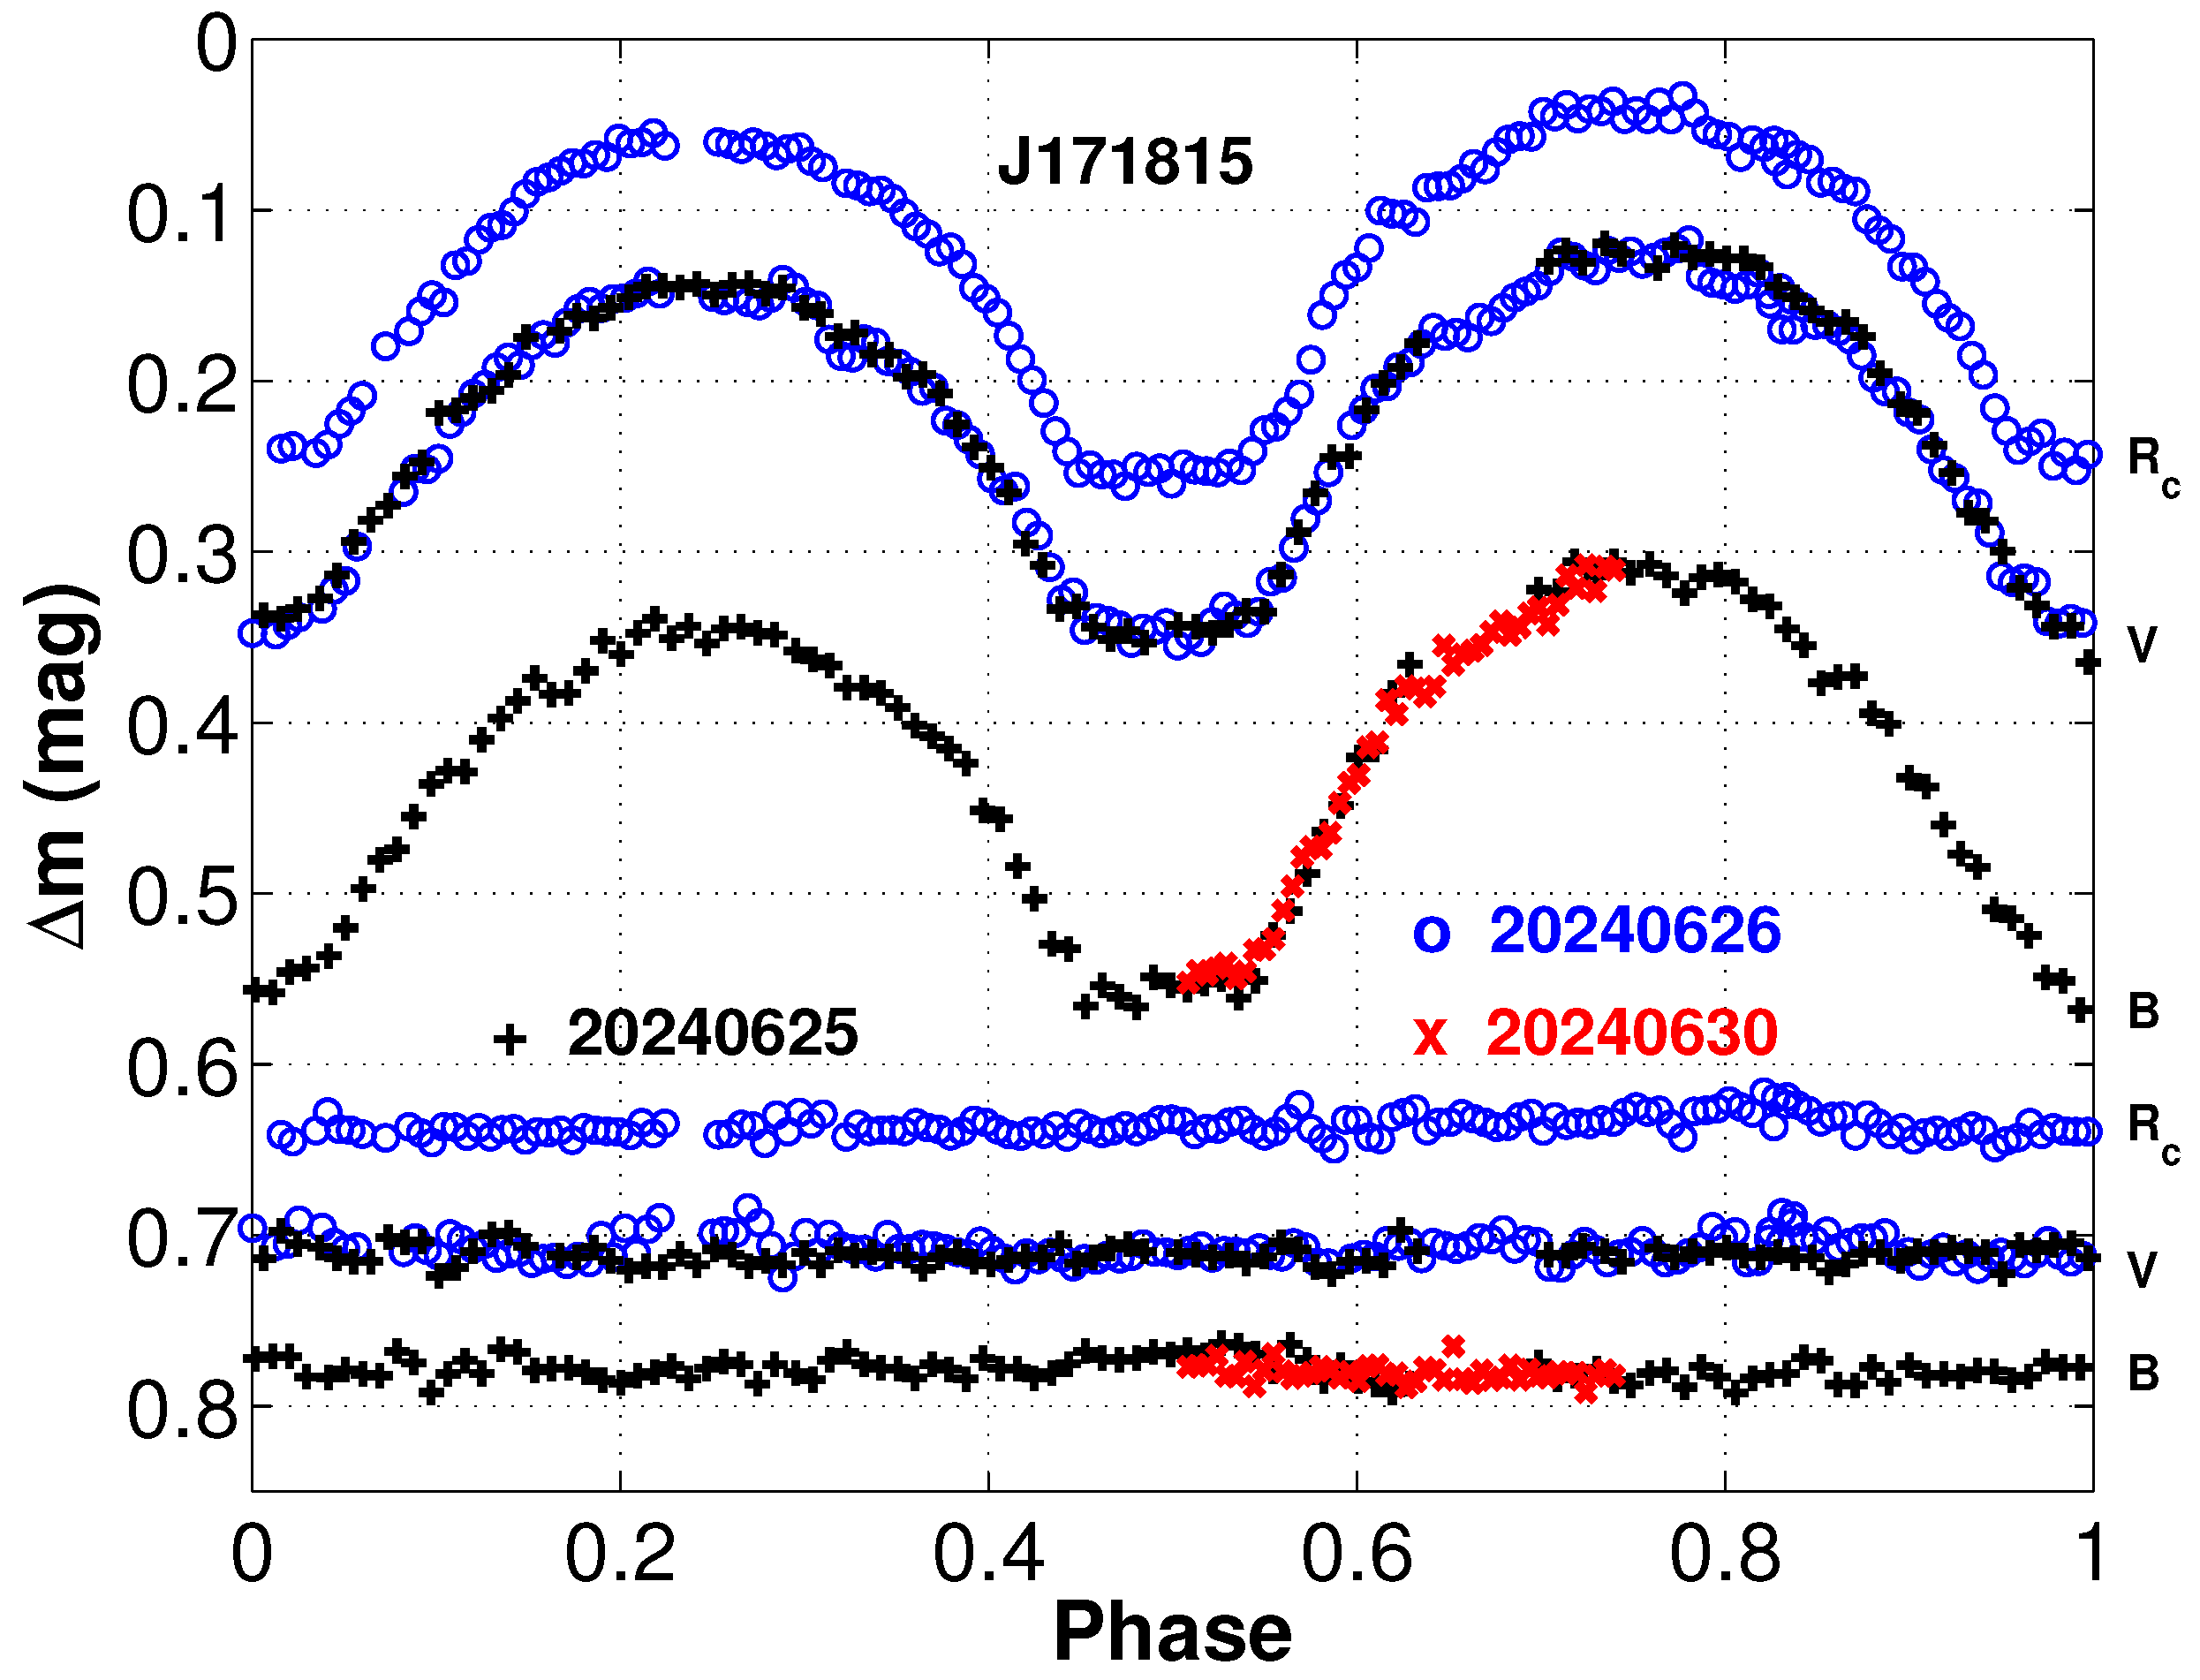
Figure 2.
The normalized TESS light curves observed of J171815 at different sectors. For comparison, all the light curves were shown in the last panel.
Figure 2.
The normalized TESS light curves observed of J171815 at different sectors. For comparison, all the light curves were shown in the last panel.
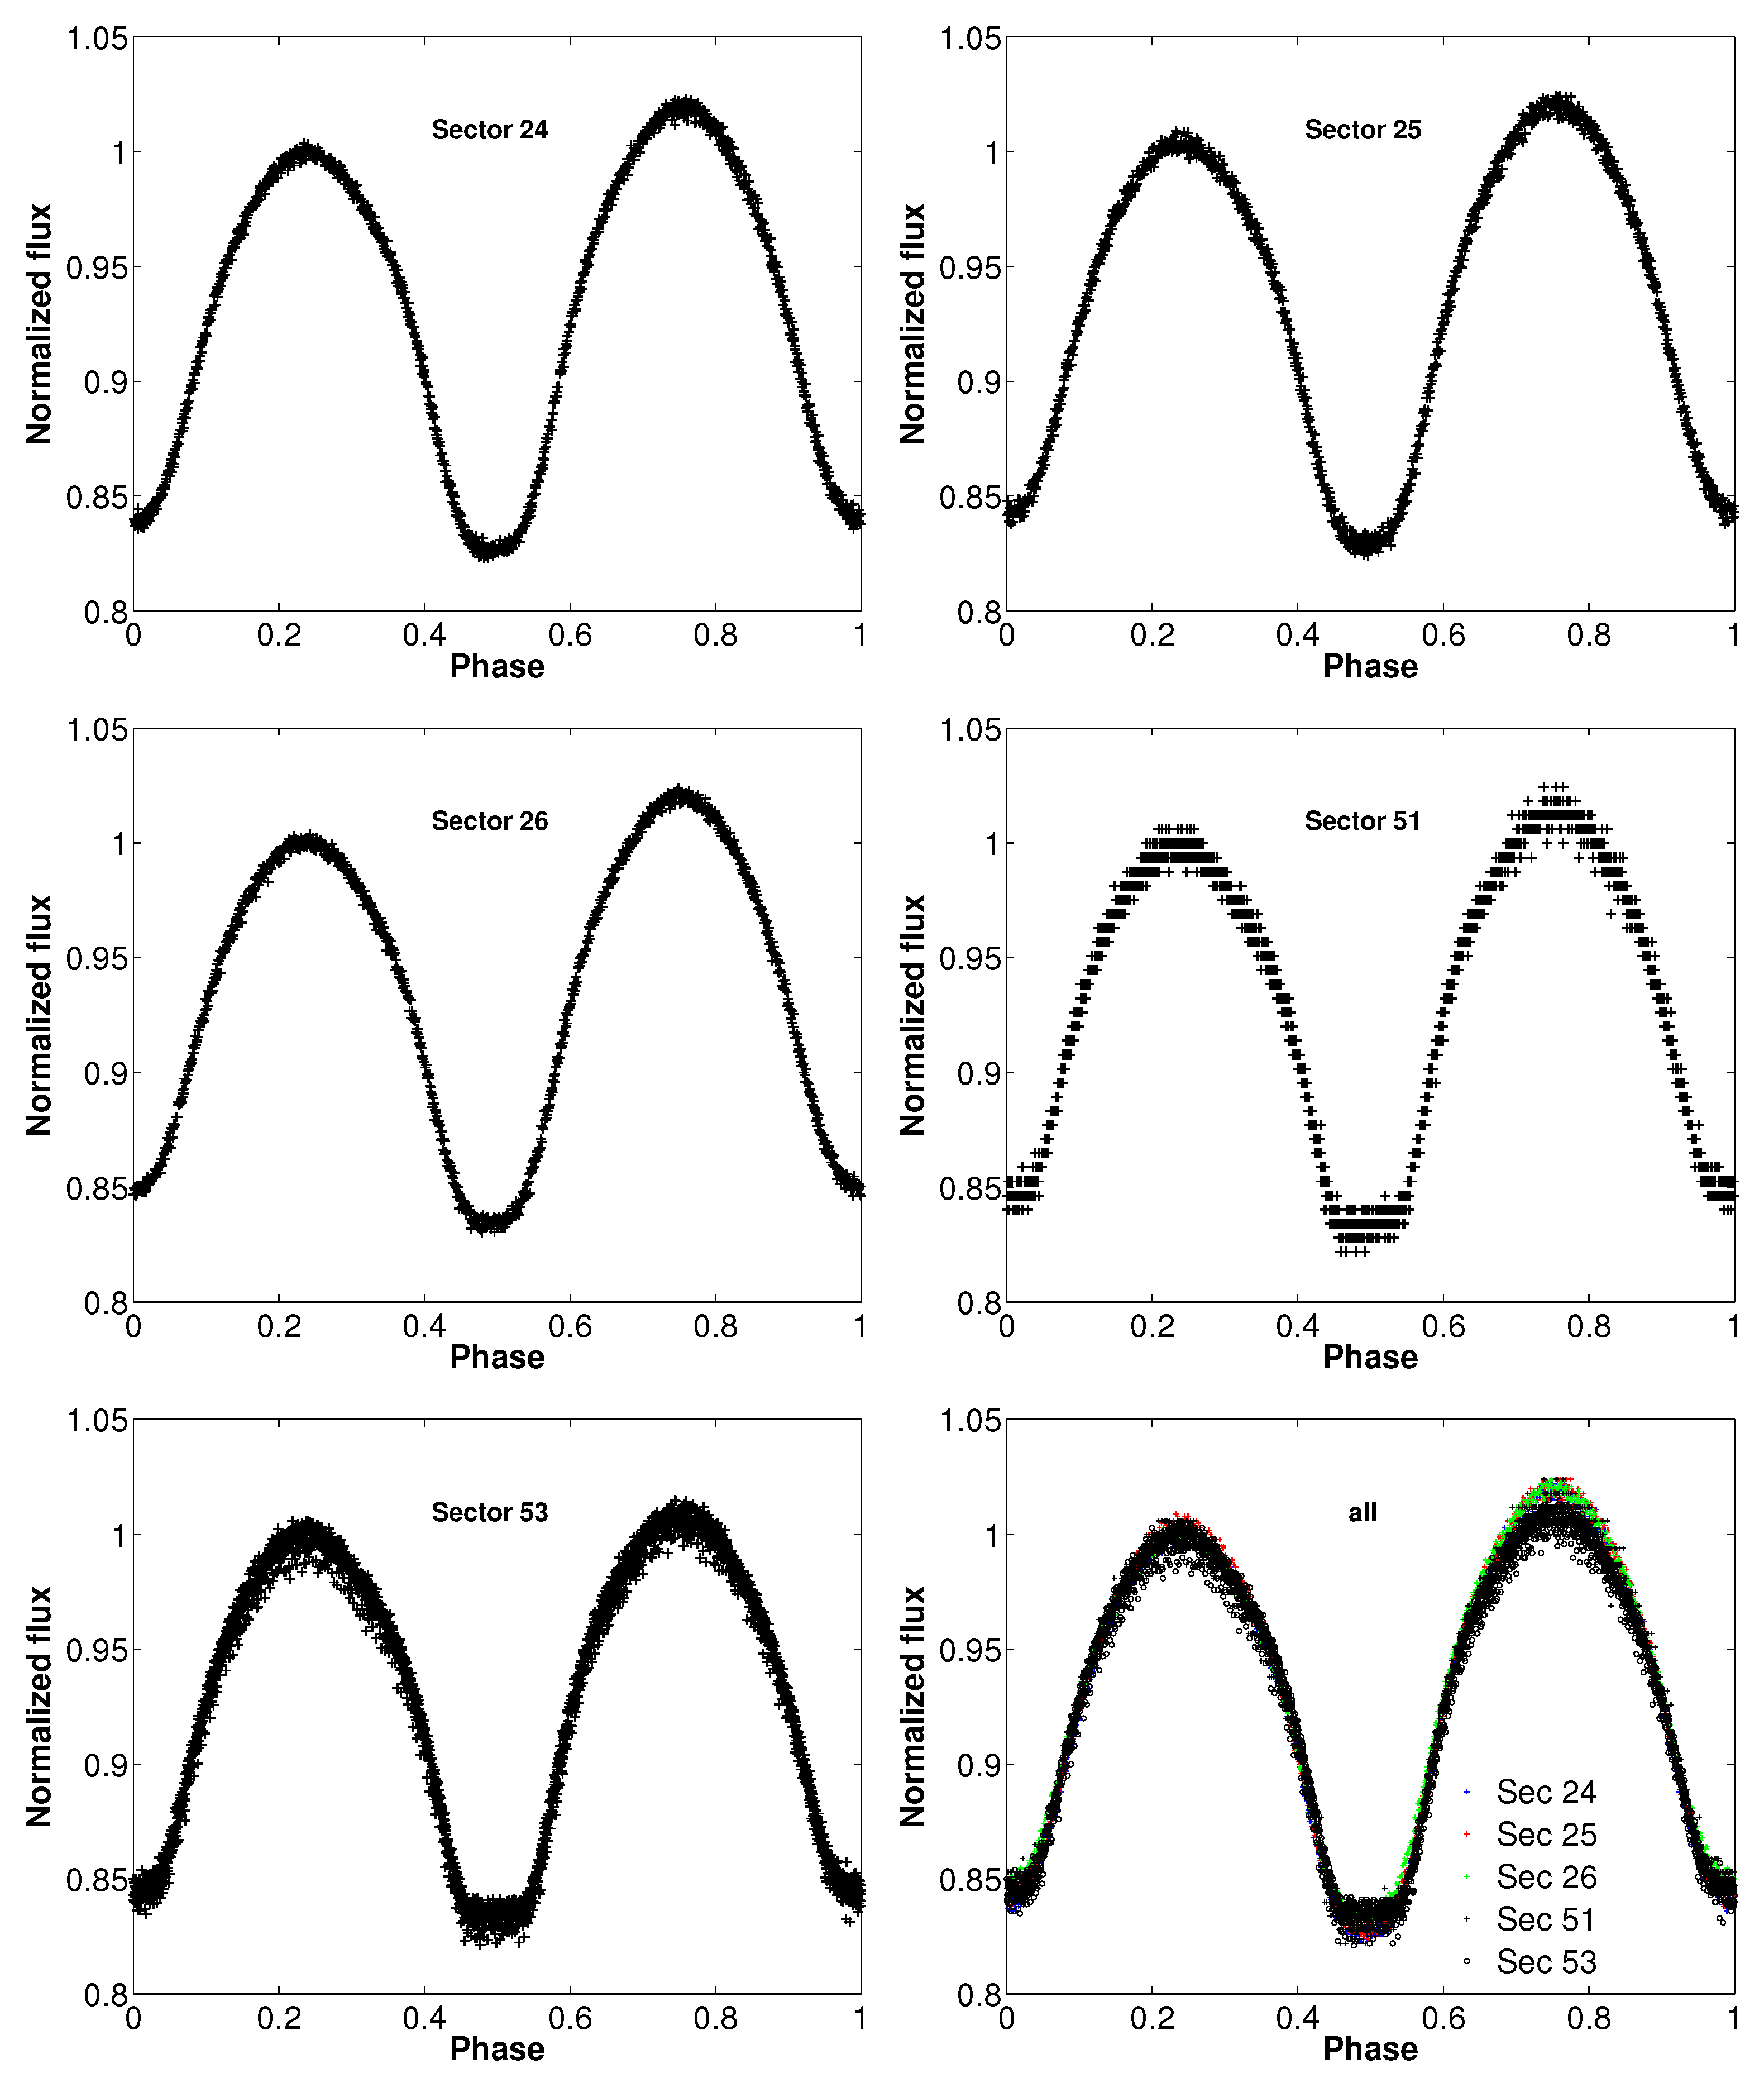
Figure 3.
O-C diagram of J171815. Different symbols refer to different observations.
Figure 4.
The left panel displays the q-search results derived from data obtained using the WH50 telescope, while the right panel presents the q-search results utilizing data from TESS.
Figure 4.
The left panel displays the q-search results derived from data obtained using the WH50 telescope, while the right panel presents the q-search results utilizing data from TESS.
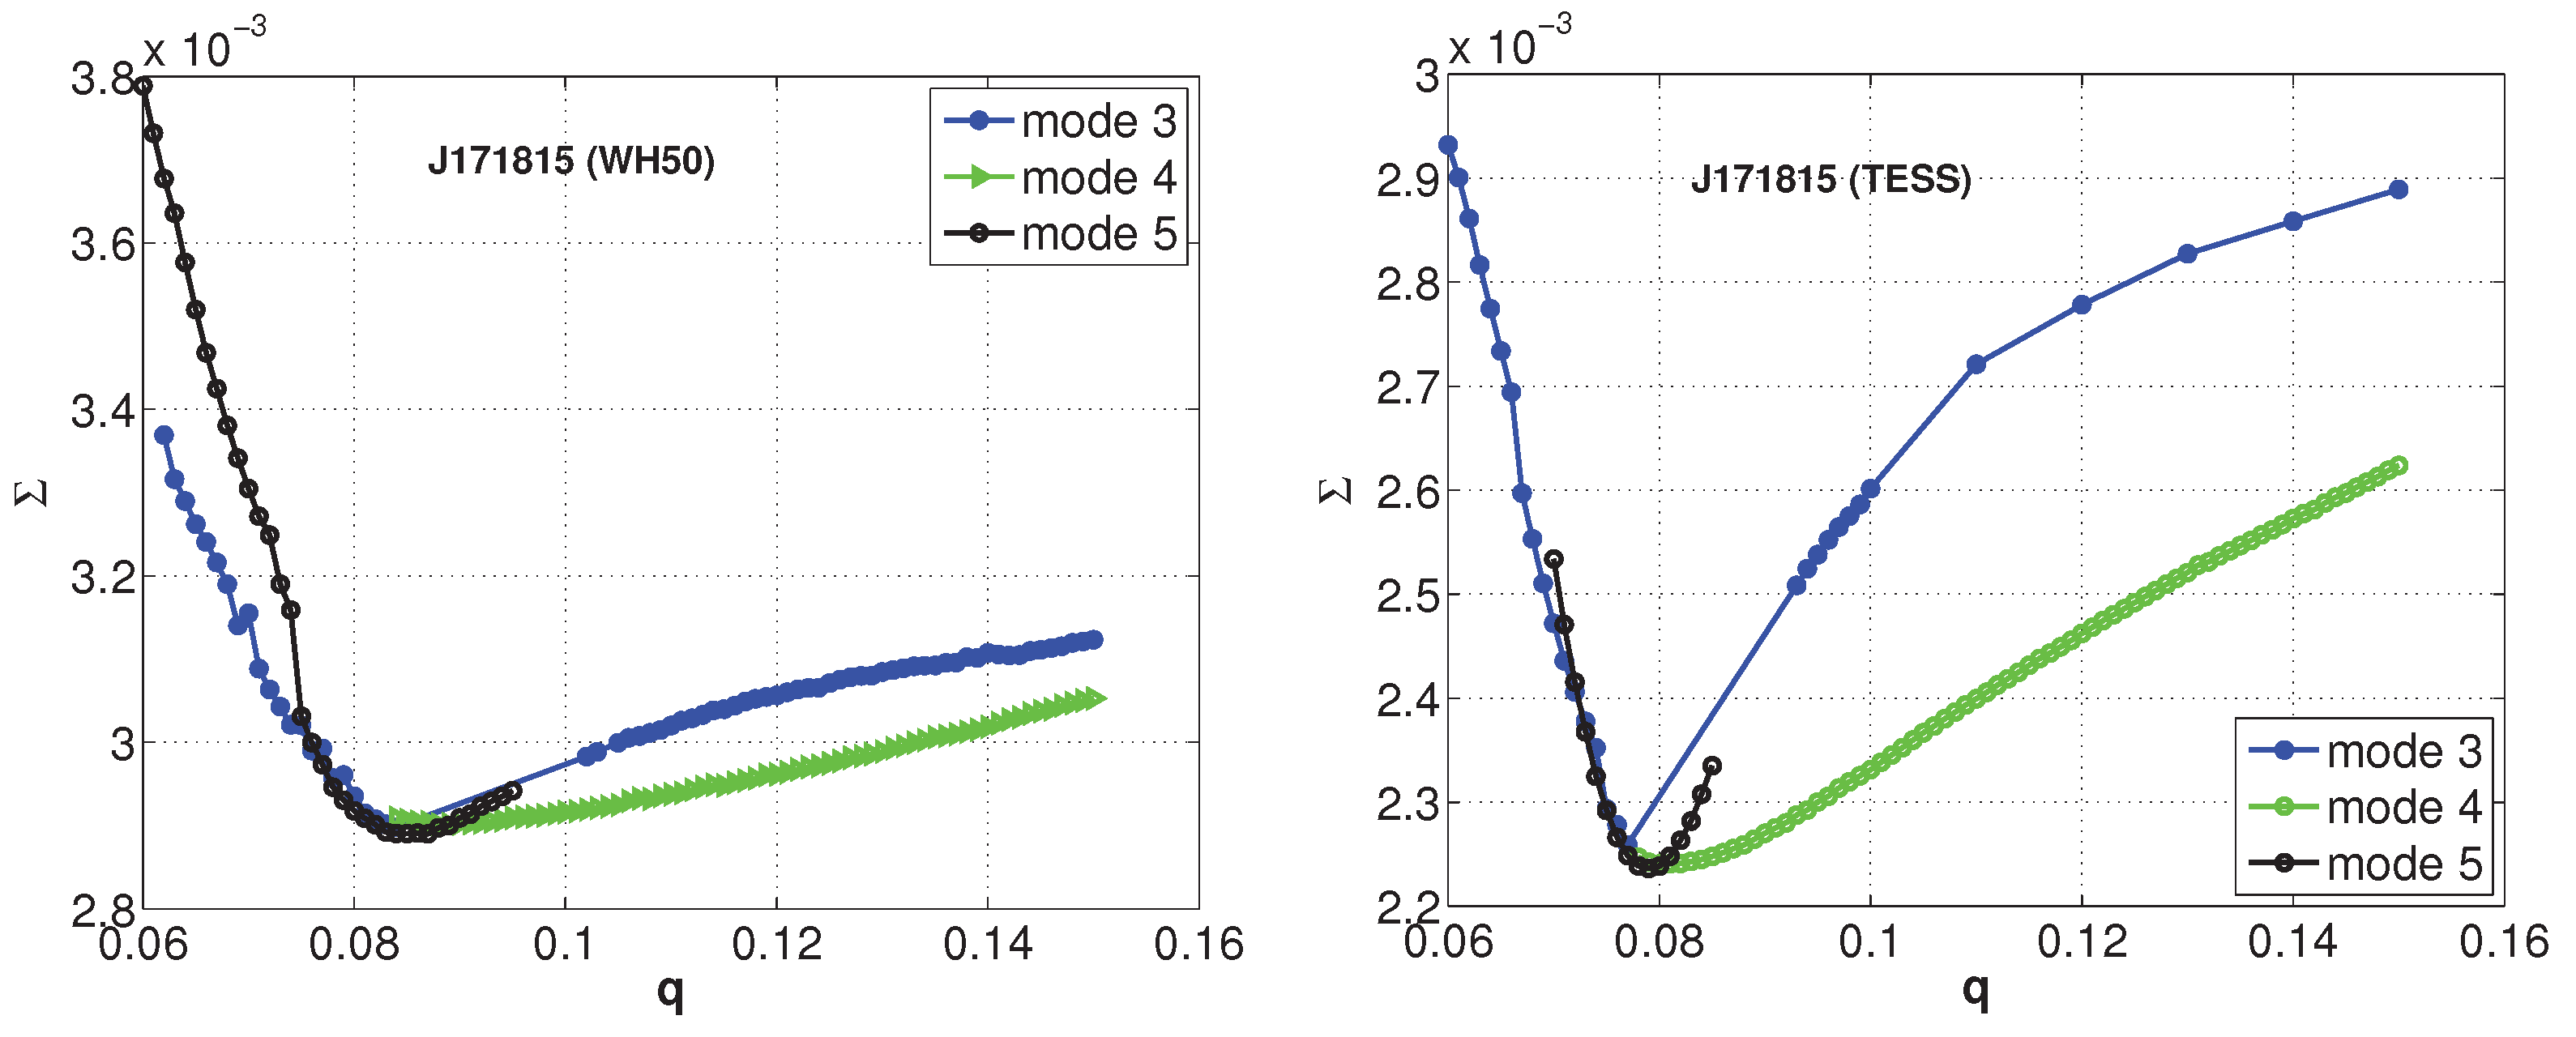
Figure 5.
The left panel, the fitted light curves for band are exhibited, whereas in the right panel, the fitted light curves for TESS are provided. The green solid line stands for mode 3, while the black solid line represent mode 5.
Figure 5.
The left panel, the fitted light curves for band are exhibited, whereas in the right panel, the fitted light curves for TESS are provided. The green solid line stands for mode 3, while the black solid line represent mode 5.
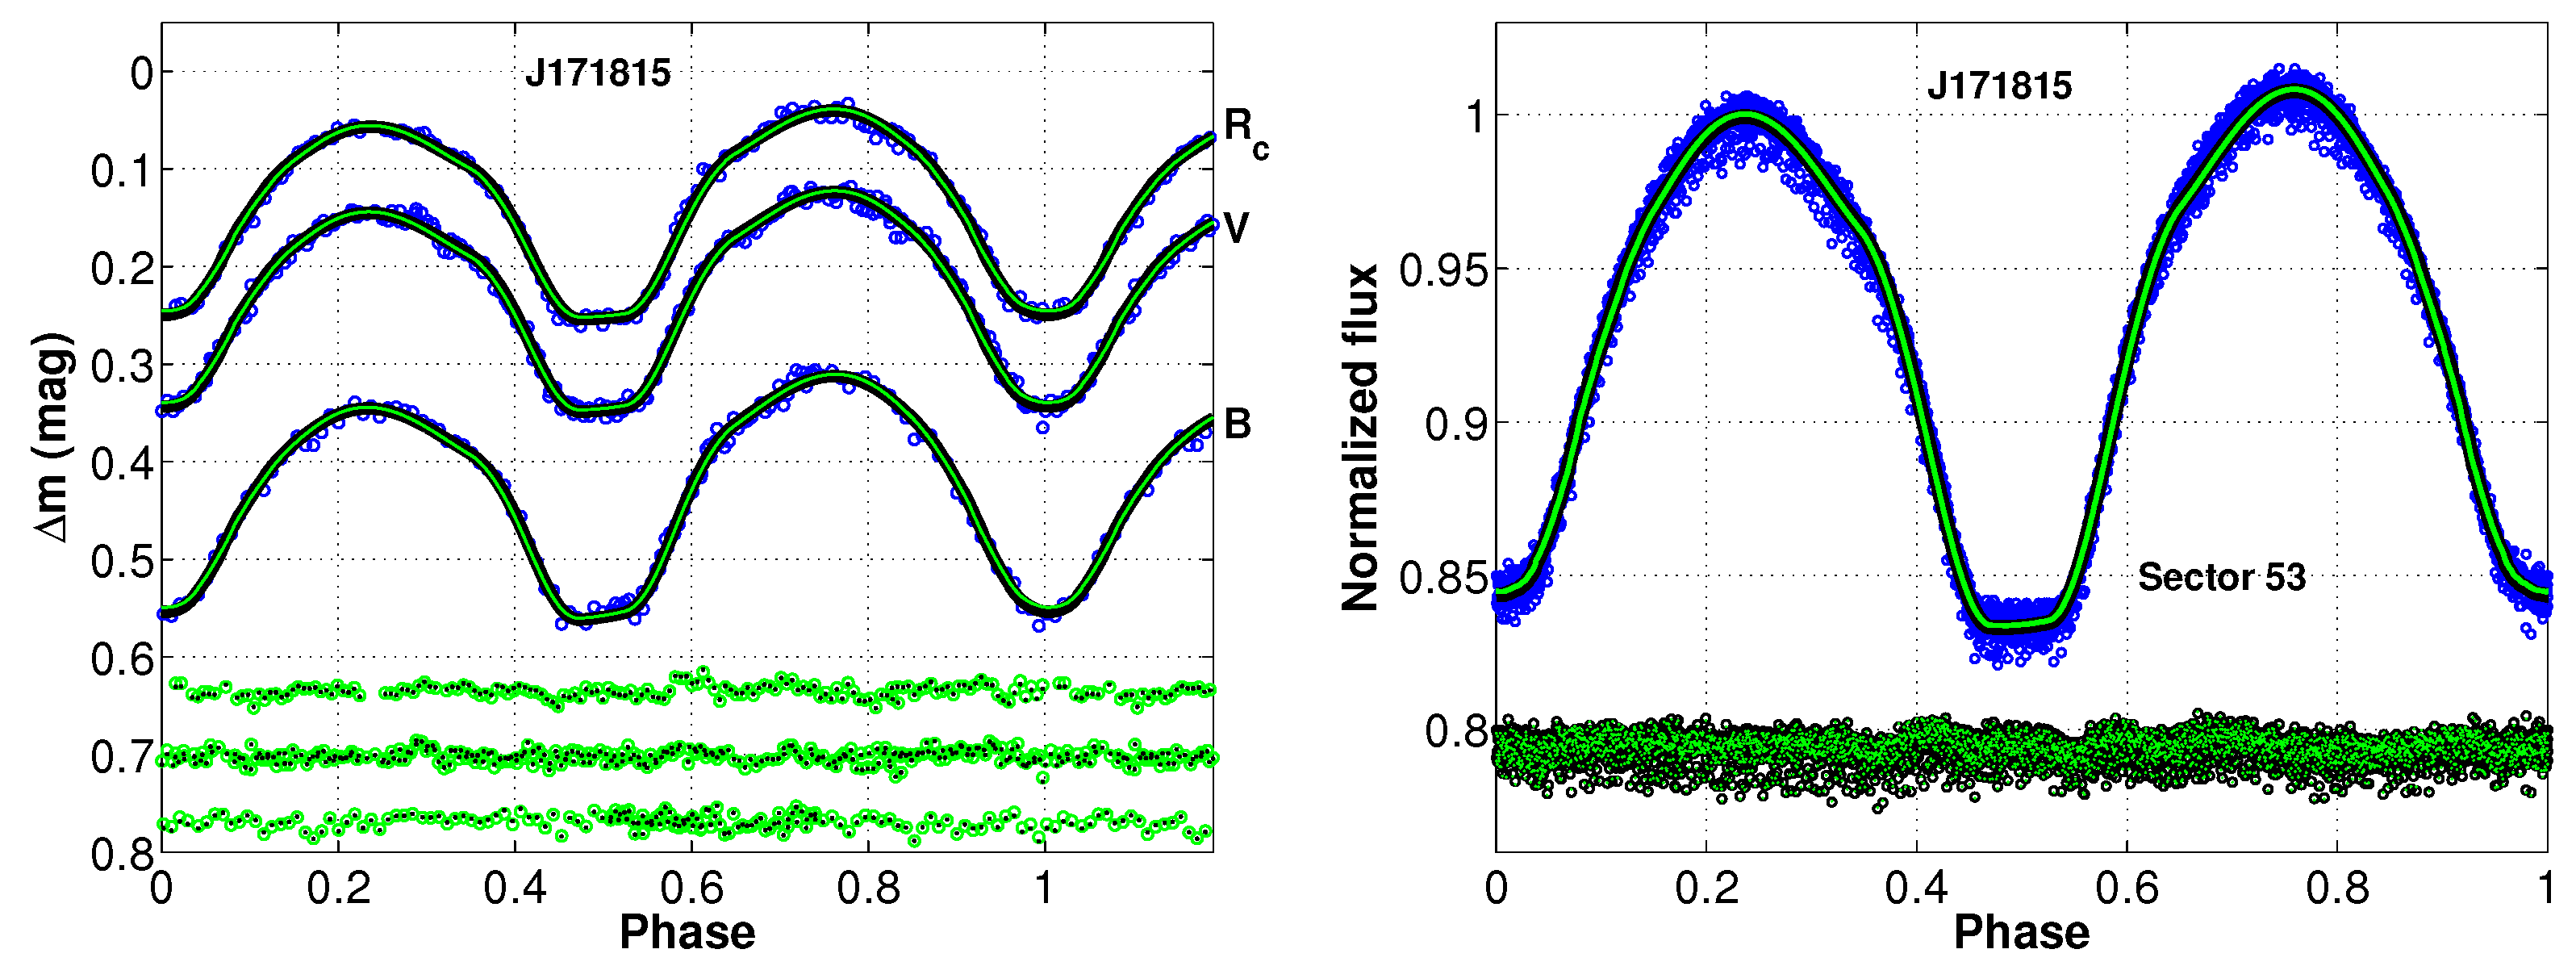

Table 1.
CCD times of light minimum for J171815.
| BJD +2450000 | Error (days) | Min. | E | O-C(day) | BJD +2450000 | Error (days) | Min. | E | O-C(day) |
|---|---|---|---|---|---|---|---|---|---|
| 8961.15962 a | I | -2320.0 | 0.00409 | 9698.69977 a | I | 0.0 | 0.00000 | ||
| 8961.31635 a | II | -2319.5 | 0.00187 | 9698.85715 a | II | 0.5 | -0.00157 | ||
| 8974.51138 a | I | -2278.0 | 0.00376 | 9712.36981 a | I | 43.0 | 0.00004 | ||
| 8974.66855 a | II | -2277.5 | 0.00197 | 9712.52697 a | II | 43.5 | -0.00175 | ||
| 8988.81727 a | I | -2233.0 | 0.00383 | 9745.74946 a | I | 148.0 | -0.00055 | ||
| 8988.97430 a | II | -2232.5 | 0.00191 | 9745.90766 a | II | 148.5 | -0.00130 | ||
| 9002.48734 a | I | -2190.0 | 0.00390 | 9759.41945 a | I | 191.0 | -0.00056 | ||
| 9002.64418 a | II | -2189.5 | 0.00179 | 9759.57765 a | II | 191.5 | -0.00131 | ||
| 8988.81728 a | I | -2233.0 | 0.00384 | 10487.11039 b | I | 2480.0 | 0.00127 | ||
| 8988.97429 a | II | -2232.5 | 0.00190 | 10487.26761 b | II | 2480.5 | -0.00047 | ||
| 9002.48734 a | I | -2190.0 | 0.00390 | 10488.06468 b | I | 2483.0 | 0.00183 | ||
| 9002.64416 a | II | -2189.5 | 0.00177 | 10488.22153 b | II | 2483.5 | -0.00027 |
Note (a) TESS, (b) WH50cm.
Table 2.
Photometric solutions for J171815 derived from the observations and TESS data.
| Parameters | () | () | () | () |
|---|---|---|---|---|
| 5495 | 5495 | 5495 | 5495 | |
| 5632(9) | 5754(4) | 5612(9) | 5738(4) | |
| q() | 0.081(1) | 0.077(1) | 0.084(1) | 0.079(1) |
| 69.7(2) | 69.8(1) | 70.3(3) | 70.0(1) | |
| 1.897 | 1.885 | 1.908 | 1.891 | |
| ) | 1.844 | 1.834 | 1.853 | 1.839 |
| 1.896(1) | 1.885(1) | 1.919(3) | 1.895(1) | |
| 1.896 | 1.885 | 1.908 | 1.891 | |
| f | 1(2)% | 1(1)% | ||
| 99(1)% | 100(1)% | |||
| 100% | 100% | |||
| 0.598(1) | 0.601(1) | 0.589(1) | 0.597(1) | |
| 0.192(1) | 0.189(1) | 0.194(1) | 0.191(1) | |
| (rad) | 0.3466 | 0.4532 | 0.3466 | 0.3384 |
| (rad) | 1.6796 | 1.7660 | 1.7190 | 1.7597 |
| (rad) | 0.2096 | 0.2077 | 0.2089 | 0.2073 |
| 1.1673 | 1.0891 | 1.1673 | 1.1164 | |
| 0.001769 | 0.001899 | 0.001605 | 0.001738 |
Disclaimer/Publisher’s Note: The statements, opinions and data contained in all publications are solely those of the individual author(s) and contributor(s) and not of MDPI and/or the editor(s). MDPI and/or the editor(s) disclaim responsibility for any injury to people or property resulting from any ideas, methods, instructions or products referred to in the content. |
© 2025 by the authors. Licensee MDPI, Basel, Switzerland. This article is an open access article distributed under the terms and conditions of the Creative Commons Attribution (CC BY) license (http://creativecommons.org/licenses/by/4.0/).
Copyright: This open access article is published under a Creative Commons CC BY 4.0 license, which permit the free download, distribution, and reuse, provided that the author and preprint are cited in any reuse.


