Submitted:
16 May 2025
Posted:
20 May 2025
You are already at the latest version
Abstract
Global warming can lead to changes in groundwater levels in forested areas. Groundwater is the primary water source for ecosystems, so changes in groundwater levels, if directional and constant, can cause changes in vegetation and habitat character. In Białowieża National Park, a significant decline in the water table was observed at the beginning of the 20th century. The question therefore arose as to whether the changes that occurred at that time were permanent and whether the negative trend continued in such a clear direction in the following years. And whether the large water reservoir, which was built near the northern boundary of the Białowieża Forest, had an impact on the groundwater level in the forest areas. The study is based on measurements from 1985-2005 and 2022- 2023, taken in the same monitoring wells. Complete data was collected from 21 monitoring wells, of which seven each represent swamp, moist and fresh habitats. An analysis of groundwater levels between 1985 and 2005 showed an average decline of 0.08 m/10years in swamp habitats, 0.11 m/10years in moist habitats and 0.21 m/10years in fresh habitats. The prediction for the year 2023 showed a significantly greater decreasing groundwater level than the measurements. The measurements in 2022 and 2023 showed that the trend of falling water levels has slowed down in almost the entire study area, with water levels in recent years being similar to those at the beginning of the century. This was also confirmed by comparing years with similar precipitation: 2022 with 1986, 2002, 2004 and 2023 with 1999. This is due to the higher precipitation after 2005. In the period 2006-2023, precipitation in the hydrological years was on average 60 mm higher than in the period 1985-2005. Despite the clear trend towards rising air temperatures, the higher precipitation compensated for the higher evapotranspiration. However, one area showed a systematic decrease in water levels, this occurred at the watershed of the two largest rivers in the Białowieża Forest. It can be indicated that watershed areas are most vulnerable to lowering the groundwater level due to climatic heating.
Keywords:
groundwater level
; climate change
; Białowieża Forests
; forest habitats
1. Introduction
Climate change projections indicate a significant decline in groundwater availability by the end of the 21st century, which will have a significant impact on global and regional water resources (Wunsch et al. 2022). Wunsch et al. (2022) found that due to increased evapotranspiration and reduced infiltration rates, groundwater storage is also likely to decrease as a result of climate change.
Since the beginning of the 21st century, there has been an increase in the frequency of droughts, including extreme droughts. In 2018, Central Europe experienced one of the most severe and longest summer droughts and heatwaves ever recorded. Before 2018, the conditions of 2003 were considered the drought of the millennium. This drought was classified as the most severe event in Europe in the last 500 years (Schuldt et al., 2020). Research now confirms that the 2018 drought was climatically more extreme and had a greater impact on forest ecosystems than the 2003 drought (Schuldt et al., 2020). The 2018-2019 droughts caused the destruction or death of coniferous and deciduous stands in large parts of Europe (Braun et al. 2020, Schuldt et al., 2020). It is even assumed that the 2018-2020 droughts in Central Europe were probably the worst in 2000 years (Büntgen et al., 2021). The role of groundwater in maintaining ecosystem functions is increasingly recognised, especially during droughts (Froend and Sommer, 2010; Kath et al., 2014).
Groundwater is an important source of water for many habitats. The absorption of groundwater, together with rainwater, creates soil water that is used by forest vegetation, including forest stands. A warming climate, which leads to an increase in evapotranspiration, can significantly affect the availability of soil water, including from groundwater. This is particularly evident in areas where precipitation will decrease as temperatures rise. In such areas, especially in groundwater-dependent habitats, there will be a drying out and reduced regeneration of spring areas and drying out of the upper sections of watercourses.
The Białowieża Forest is located on the border between Poland and Belarus (52°45’29”N; 23°46’8 ”E). Its area is 1345 km2, of which 592 km2 are in Poland and 753 km2 in Belarus. The Białowieża Forest Reserve is one of the last and largest fragments of the original European lowland forest. Most of the Białowieża Forest consists of species-rich stands. A total of 4 693.24 hectares of the forest was declared Białowieża National Park (BNP) in 1932, one of the first national parks in Europe. Today, the BNP covers an area of 10 517.27 ha, of which 6059.27 ha are under strict protection. The remaining area of the Białowieża Forest is managed forest, but even in this part there are nature reserves and areas with protected tree stands, habitats and species. Groundwater is one of the most important sources of water supply for habitats and stands. Almost half of the Białowieża Forest consists of swampy and moist habitats that are highly dependent on groundwater resources. Therefore, the changes in groundwater levels are extremely important for the sustainability and changes in the ecosystems of the Białowieża Forest and give rise to much speculation and questions about the effects of climate change on groundwater levels.
In connection with the construction of a reservoir at the northern border of the Białowieża Forest, groundwater measurements were initiated in the mid-1970s. In 1984, these measurements were supplemented by 25 measuring points in the area of the Białowieża National Park and the Browsk Forest District, in order to determine the directional changes of the groundwater situation in the forest habitats. A total of 52 points were measured during this period. The measurements were completed in 2005.
Global warming is leading to changes in water resources in forested areas where groundwater levels are expected to fall. In order to show that such changes can be observed in the Białowieża Forest, measurement points where measurements were stopped in 2005 were found again in 2021 and measurements were resumed at some of them. At the beginning of the hydrological year 2022, measurements were resumed at 34 measuring points representing the following habitats: fresh habitats - 16 wells, moist habitats - 9 wells and swamp habitats - 9 wells.
The aim of resuming the groundwater measurements was to determine
- the changes in groundwater levels in the ecosystems of the Białowieża Forest over several decades;
- whether the trend of declining groundwater levels in the Białowieża Forest observed at the beginning of the century is of a permanent nature
- the changes in the groundwater level in the Bialowieża Forest compared to previous studies.
2. Materials and Methods
The analysis was carried out in hydrological years running from November 1 of the first year to October 30 of the second year and divided into a winter half-year and a summer half-year from May 1 to October 31. This division is due to differences in the water supply. In Central Europe, water retention in the soil is increased in the winter half-year due to low evapotranspiration, while in the summer half-year the high temperatures and vegetation development lead to high water withdrawal and depletion of soil water resources.
Three analyses of groundwater levels were carried out:
- long-term changes
- differences in comparable years in terms of the amount of precipitation
The authors relied on measurements from wells that have complete groundwater measurement series; in total, they managed to collect such data from 21 measuring points from the period 1985-2005 and the years 2022-2023 (Figure 1).
Groundwater Over Several Years
The analysis includes groundwater measurements from the period 1985-2005 and from the period 2022-2023. The groundwater measurements were carried out at the monitoring sites renewed in 2021. The older measurements were carried out manually at intervals of several days. Levelogger 5 Junior groundwater level metres from Solinst Canada were installed at the renewed measuring points in conjunction with the Barologger 5 air pressure sensor. The measurements were carried out automatically by the measuring devices at one-hour intervals. In order to make the results comparable, the measurements from 2022-2023 were limited to the measurement intervals from the period 1985-2005 (Table 1).
The measurement points represent the basic types of habitat wetness: there are 7 wells in swamp habitats, 7 wells in moist habitats and 7 wells in fresh habitats. In moist and fresh habitats, a distinction can be made between variants with higher (2) and lower (1) groundwater levels, depending on the spring groundwater level (Table 1). The groundwater depths as a distinguishing feature for the classification of forest moisture types are shown in Table 2.
The trend of changes in meteorological parameters between 1951 and 2019 was tested with the non-parametric Mann-Kendall test using the Makesens 1.0 software developed at the Finnish Meteorological Institute (Salmi et al. 2002). The non-parametric method of Sen
(Sen 1968) was used to estimate trends in the time series. The advantage of the methods used is that data with missing values can be used and the data do not have to follow a particular distribution. In addition, the Sen method is not strongly influenced by individual data errors or outliers (Salmi et al. 2002). Both methods are described in detail in Salmi et al. (2002).
Trends in changes in groundwater levels in the period 1985-2005 were determined with the non-parametric Mann-Kendall test using the Makesens 1.0 software developed by the Finnish Meteorological Institute (Salmi et al. 2002). The non-parametric Sen slope estimation method (Sen, 1968) was used to estimate the magnitude of the trends in the data time series. On this basis, predictions were made for groundwater levels in 2022 and 2023.
The analysis was performed for each of the 21 wells and in groups for the different habitat moisture options. The groundwater levels were expressed in terms of distance to the ground level, which had a value of 0.00, so that the water levels had negative values if they were below ground and positive values for water levels above ground.
Groundwater levels in 2022 and 2023 were compared with selected years that were most similar in terms of rainfall.
Groundwater Level in Comparable Years
As the groundwater measurements were resumed after a long period, a selection of years with similar precipitation was made for a reliable analysis, so that the hydrological years Nov.2021-Oct.2022 and Nov.2022-Oct.2023 have a water flow as similar as possible to the measurement period 1985-2005. The analysis was carried out for measurement data from the station of the Institute of Meteorology and Water Management in Białowieża. The comparison and selection of years is shown in Figure 2. The years that are most similar to 2022 in terms of precipitation are 1985, 2002 and 2004, both in terms of the amount of precipitation in the entire hydrological year and in the summer and winter half-years. The differences between the hydrological years were no more than 1.5% (Table 3). There was a major problem in 2023, where the distribution of precipitation over the year was atypical. Precipitation in the winter half-year was slightly higher than in the summer half-year. This is a rare phenomenon in Białowieża, where summer precipitation significantly exceeds winter precipitation (on average by more than 150 mm). In the period 1985-2005, such a situation only occurred in 2000, albeit with low precipitation levels - a total of 526.9 mm per year.
In order to obtain comparable data, a two-stage selection was made: First, the years most similar to 2023 in terms of annual precipitation totals were selected, and then the year with the most similar summer and winter precipitation. Three years had precipitation amounts that differed by less than 15% from 2023: 1999 (596.6 mm), 2001 (622.1 mm) and 2005 (606.8 mm). The precipitation total was most similar in 2005, although the winter precipitation was more than 180 less than the summer precipitation. For this reason, the year 2001 was also excluded (difference of more than 50 mm). The year 1999 proved to be the closest year (difference of 26.7 mm), so this year was selected for comparison.
Water Balance
The water balance of the hydrological years as well as the winter and summer half-years was checked in the selected years. The calculations were carried out using measurement data from the station of the Institute of Meteorology and Water Management in Białowieża. For the selected years, the water balance of the stands was determined in the form
ΔR=P - I - ETa [mm].
ΔR - change in retention
P - total precipitation [mm]
I – canopy interception [mm]
ETa - actual evaporation aspiration [mm]
ETa was calculated using the Penman-Monteith formula according to the method presented in Allen et al (1998). Solar radiation is not measured at the IMGW station in Białowieża, so in 1999, 2002, 2004 and 2022 net radiation was calculated based on extraterrestrial radiation, air temperature and humidity and cloud cover. No data on cloud cover is available for 2023, so the measurements of solar radiation at the ICP Forests meteorological station in Czerlonka were used (measurements since 2010). The compatibility of the calculation of net radiation for the two data sources was checked for the year 2015. The calculations showed that the net radiation based on the solar radiation measuremen ts at the Czerlonka station yields slightly lower results than the calculations based on the data from IMGW Białowieża (Figure 3). For the ETa calculations, the average values for the Białowieża forest were used for the leaf area index in summer and winter, ground cover and stand height, which were developed from the airborne laser scanning in Kolendo et al. 2021.
3. Results
3.1. Meteorological Conditions
The mean annual air temperature in Białowieża in the hydrological years 1985-2023 was 7.4 oC. The trend determined by the Sen method shows an increase in the mean air temperature in Białowieża in this period by 1.87 oC (Figure 4) and by 0.98 oC between 1985 and 2005. The Mann-Kendall test showed that the changes were statistically significant.
Precipitation in the hydrological years between 1985 and 2023 averaged 632.0mm in Białowieża and ranged from 460.9mm in 1991 to 866.5 mm in 2010. Dry years with precipitation less than 90% of the average were recorded in 11 years and wet years with precipitation more than 110% of the average in 10 years (Figure 5). The trend determined using the Sen method shows an increase in precipitation in the hydrological years between 1985 and 2023 in Białowieża. Precipitation increased by 56.3 mm. The increase in precipitation in the winter half-year is almost twice as high as in the summer half-year. The Mann-Kendall test showed that the changes in precipitation totals are not statistically significant. The average annual precipitation from 1985 to 2005 was 604 mm and from 2006 to 2023 664mm.
In recent years, the number of days with snow cover has decreased significantly. After 2014, no more than 100 days with snow cover were recorded per year. In 2020, snow cover lasted only for 10 days, which was a major anomaly (Figure 6.).
3.2. Water Balance in the Analyzed Years
The water balance in the comparison years 2022 and 1986, 2002, 2004 and 2023 as well as 1999 with similar precipitation shows differences in water distribution, especially in evapotranspiration, which reached values in a wide range. In 2022, at 312.5mm, it was between 240.9 mm (2004) and 336.3 mm (2002) in the comparison years, while in 2023 it was almost 15 mm higher than in the comparison year 1999. There were much smaller fluctuations in the amount of precipitation, with differences of 6.3mm in the comparison years from 2022 onwards, with the smallest deviation in 2022. In 1999, it was 9.3mm lower than in 2023. There were similar conditions in the winter and summer half-years (Table 4).
3.3. Trends in Groundwater Level Changes in the Years 1985-2005 and Prediction for 2023
The trends determined for groundwater changes show a decline in the water level in the period 1985-2005 at all monitoring sites in the hydrological years and the summer and winter half-years. The average drawdown at the monitoring sites was 0.29m, in the half-years: 0.28m (Nov.-April) and 0.31m (May-Oct.). In swamp habitats, the calculated lowering of the groundwater level in the hydrological year averaged 0.17 m, 0.16 m in the winter half-year and 0.23m in the summer half-year. In the moist habitats, the average drawdown was 0.25m in the hydrological year and 0.23m in the winter half-year and 0.26 m in the summer half-year, except that the drawdown in the hydrological years was lower in the 2moist than in the 1moist: 0.23m and 0.27m respectively. In the fresh habitats, the average drawdown of the water table was 0.44m and was similar in the half-years at 0.44m (Nov.-April) and 0.45 m (May-Oct.). In 2fresh the average annual drawdown was 0.47m and in 1fresh 0.39m (Table 5, Table 6 and Table 7).
A prediction of the groundwater level in 2023 using the same trends showed that the drawdown of the groundwater level in the period 1985-2023 averaged -0.56m and in the swamp habitats -0.33m on average in the hydrological year and in the half-years -0.29m (Nov.-April) and -0.43m (May-Oct.); in moist -0.48m (Nov.-Oct.), -0.44m (Nov.-April), -0.49m (May-Oct.); in fresh -0.83m (Nov.-Oct.), -0.84m (Nov.-April). -0.86m (May-Oct.).
The values for the 2023 groundwater drawdown calculated on the basis of Sen's slope estimate from 1985 to 2005 are higher than the measured values at most measurement points In swamp habitats, the prediction of the mean annual groundwater drawdown was on average 0.14m higher, in moist habitats by 0.19m and in fresh habitats by 0.48m; in the winter half-year, the actual water level was on average 0.28m higher in swamp habitats, 0.37m higher in moist habitats and 0.72m higher in fresh habitats than predicted. In the summer half-years, the differences were smaller, averaging 0.05m in swamp habitats, 0.03m in moist habitats and 0.032m in fresh habitats. In swamp habitats, the predictions showed the smallest changes in water levels. In reality, they were even lower. For well 4, a decrease in water level of 0.70m was calculated, whereas in reality it was 0.38m lower. Only in wells 16, 60 and 61 was the actual water level lower or equal to the calculated water level, but these were small differences of up to 0.08m. In the moist habitats, the water table in one well - No. 55 - decreased more than predicted (by 0.26m). In the fresh habitats, the water levels in all wells were higher than predicted.
Comparison of years with similar precipitation
In the first group of comparison years: 1986, 2002, 2004 and 2022, the lowest groundwater level was generally at the beginning of the century: 2002 - 14 wells and 2004 - 6 wells. Only in one well no. 56 in 2022 was the lowest level of the 4 years compared measured. The average groundwater level in the study area in each year was: -1.19m in 1986, -1.49m in 2002, -1.45m in 2004, -1.33m in 2022.
A comparison between 2023 and 1999 showed that the groundwater level in 2023 was lower in all wells, with the exception of well no. 9, where the water was 0.03m higher. The largest decrease in the water table was found at No. 55 with 0.95m (2moist) and at No. 56 with 1.03m (1fresh). The average decline in the water table in 2023 was 0.31m.
The average groundwater level in the individual habitat types is summarised in Table 8. In the first comparison group, the lowest groundwater level was recorded in most habitat types in 2002. Only in 1fresh was the lowest water level recorded in 2004, but it should be noted that the water levels in this habitat type were similar in 2002, 2004 and 2022, ranging from -3.61m to -3.68m, and were also significantly lower than in 1986. The low average groundwater level in 2022 in 1fresh was due to the water level in well no. 56 (Figure 7, Figure 8, Figure 9, Figure 10 and Figure 11).
The comparison between 1999 and 2023 shows a significant decrease in the groundwater level. In 2023, the water level was on average 0.36m lower than in 1999. The greatest decline was recorded in the 1fresh (0.52m) and 2moist (0.46m) habitats. The change was smallest in swamp habitats.
a) significance level *** α = 0.001; ** α = 0.01; * α = 0.05; + α = 0.1; and blank cell α > 0.1.
4. Discussion
The trends of groundwater level changes from 1985 to 2005 indicate a decline water levels in all habitats in Białowieża Forest. Similar results were obtained for groundwater level changes in the Białowieża National Park from 1985 to 2001 (Pierzgalski et al. 2002). Water levels in the Białowieża Forest were strongly influenced by a long rainless period in 2000, when the lowest water levels since 1985 were recorded at several monitoring sites (Boczoń, 2002). The prediction of water levels for the years 2022-2023 based on the change trends from 1985-2005 indicated a much sharper decline in groundwater levels than the measured from these two years. The slowdown in the trend of falling water levels is due to the recharge conditions caused by precipitation. Precipitation in Białowieża shows clear variations over longer periods. Boczoń and Salachewicz (2022) distinguish 4 periods with different precipitation totals of calendar years:
- Period I: 1951-1966, characterized by low precipitation, with an average annual precipitation sum of 562.7mm. There were very dry, dry and average years, and no wet or very wet years were recorded. No wet or very wet years were recorded.
- Period II: 1967-1981, dominated by years with high precipitation (9 very wet and wet years). The average amount of precipitation was 733.6mm, there was only 1 dry year.
- Period III: From 1982 to 2008, the amount of precipitation decreased, so that the average amount of precipitation amounted to 610.6mm. Here too, the dry years (10 years) began to outweigh the wet years (2 years).
- Period IV: From 2009 to 2019, the average amount of precipitation was 678.7mm. This period is characterized by a high variability of years in terms of precipitation. There were 3 very wet and 2 wet years, but also 1 very dry year and 2 dry years were recorded.
The authors point out that the last two years of the period contain one dry and one very dry year. This could indicate the start of another period of lower precipitation and predominantly dry years, or the following years will continue the trend of high variability in annual precipitation. The following years (2020-2023) were average in terms of precipitation, and the last wet year (P>695mm) was 2017 (794mm in the hydrological year).
The variability of precipitation means that the groundwater measurements from 1985-2005 fall entirely within the period of low precipitation (1982-2008). The low water yield from precipitation was probably the main reason for the gradual lowering of the groundwater level to 2005. The measurements in the years 2022-2023 are characterized by higher water yields from precipitation. Therefore, the trend of lowering the groundwater level in these years was lower than predicted in the 1985-2005 measurements. However, the direction of the changes in the groundwater level was still negative (1985-2023). In the period 1985-2023, there is a trend towards an increase in precipitation (by 56mm). The increasing precipitation can compensate for the increased runoff for evaporation and to some extent reduce the rate of lowering of the groundwater table. The apparent seasonality of precipitation may determine the rate and direction of groundwater level changes in subsequent years.
A comparison of years with similar amounts of precipitation showed that the groundwater level in 2022 was similar to 1986 and higher than in 2002 and 2004. In contrast, the water level in 2023 was significantly lower than in 1999. The differences in water levels in years with similar precipitation recharge show that the water balance over a period longer than one year has a major influence on groundwater levels.
A very strong decrease in the groundwater level (approx. 1 m) in the years 1999 and 2023 (with similar precipitation recharge) was observed at two measuring points close to each other (55 and 56). It should be noted that these monitoring sites are located near the watershed of two large rivers (Narew and Narewka). The watershed is the highest area of the catchment; a sharp decrease in the groundwater level in the watershed may be due to the lack of water inflow from the higher areas, while there is water outflow to the lower areas. Therefore, rainwater is the only groundwater recharge in this area. Studies show that areas on the watershed are more vulnerable to decline groundwater levels than those closer to the river.
Declining water levels in watersheds can affect the continuity (periodicity) of upstream rivers. Bennett et al. 2012 point out that the high dependence on groundwater recharge and limited groundwater storage reserves make river flow in the upper catchments very sensitive to climate change. If the upper sections of rivers are no longer continuous, it can be difficult for species communities that are not adapted to such dry conditions to quickly regain their vitality, which can lead to a change in species composition (Majdi et al. 2020). In the Białowieża Forest, most of the small streams are continuous or discontinuous in the upper parts, which is mainly due to the runoff of water from snowmelt. The lowering of the groundwater table in the watersheds can reduce the length of permanent streams and shorten the water transit time. This is important for the sustainability of spring habitats and riparian forests. Similar phenomena have been observed in Bavarian forests in Germany. The siimulations of Munier et al. (2024) have demonstrated that upstream reaches are especially vulnerable to the effects of decreasing groundwater levels, with a high likelihood that streams in these areas will become intermittent in summer, and for spring areas this could mean that water supply from groundwater will decrease substantially or could be interrupted entirely with fatal consequences for these sensitive ecosystem and the associated ecosystem services
Tomczyk et al. (2021) report that in the period 1966/67–2019/20, the number of days with snow cover in Bialystok decreased at a rate of 4.2days/10 years. The situation is similar in Białowieża, where the rate of change in the period 1951–2019 was 5 days/10 years. And the number of days with snow cover per year decreased by 34 days (Boczoń, Salachewicz, 2022). This is probably related to climate change. In addition, winter snow cover in Central Europe has decreased in recent years and tends to melt much earlier (Szwed et al. 2017; Dong, Menzel 2020; Robinson 2020). In the winter of 2019/2020, the snow cover in large parts of the Polish lowlands was non-existent or patchy and largely volatile (Tomczyk et al. 2021).
This can significantly limit groundwater recharge in spring, as the lack of snow cover and the prevailing winter precipitation lead to earlier groundwater recharge and earlier river runoff. It is assumed that global warming will increase the frequency of rainfall in winter at the expense of snowfall (Kundzewicz et al. 2012). Such a process can significantly improve groundwater recharge if there is a lack of water from snowmelt. Between 1985 and 2023, precipitation in the hydrological years of Białowieża increased by 56.3mm, with the increase in the winter half-year being almost twice as high as in the summer half-year. This can also compensate for the increased evapotranspiration, but there is a risk that the rapid rise in temperature will have a greater impact on water runoff than the income from the increased precipitation. Good soil water availability at the beginning of the growing season is very important for tree growth. In the period from April to July, the main growth of tree thickness takes place, which is related to the formation of early wood. Therefore, a lack of available water during this period has the greatest impact on tree growth. The groundwater level prediction for the winter half-year 2023 showed a significantly lower groundwater level than the measurement results (on average by 0.46 m), while the actual level in the summer half-year was slightly higher. Despite the changes in the number of days with snow cover and a lower snow cover due to global warming, the lowering of the groundwater level in the winter half-year was therefore significantly lower. This is probably due to a change in the amount of precipitation, which increased about twice as much in the winter half-year as in the summer half-year in the period 1985-2023.
Dwire et al. (2018) suggest that plant communities that have adapted to high water saturation environments, such as riparian areas or swamp, will be affected by the decreasing availability of surface water during drought, which could lead to a reduction in the size of these areas over time. Currently, measurements in the Białowieża Forest swamp show an average decrease in groundwater levels of 0.19m, with the forecast for the period 1985-2005 indicating that the water level in these areas will decrease by an average of 0.33m by 2023. Although the decline in water levels in these habitats has slowed down, it is still a significant process. A smaller than expected decline in water levels could be significantly exacerbated by poorer conditions for rainfall recharge. Currently, higher precipitation compensates for water runoff via evapotranspiration, but in the event of lower precipitation and progressive global warming, the risk of a decrease in the water table could increase significantly.
5. Conclusions
The decline of the groundwater level in the period 1985-2023 in the Białowieża Forest was lower than predicted from the 1985-2005 measurements in all type of habitats. This is due to the different conditions of water recharge due to precipitation: 1985-2005 precipitation in Białowieża was low, the average was 604mm, and many dry and very dry years were recorded, while 2006-2023 average annual precipitation was 664mm and wet years prevailed. The lower lowering of the groundwater table is also due to the higher precipitation in winter. The results show that the lowering of the groundwater table in most parts of the study area largely came to a standstill after 2005.
The problem of falling groundwater levels in the Białowieża Forest can be exacerbated in years of low precipitation. The annual precipitation in Białowieża shows a certain periodicity. Lower precipitation with increasing air temperature and fewer days with a snow cover in winter, earlier snowmelt and recharge in winter mainly by rain may pose a major problem for the groundwater table and water availability for Białowieża Forest vegetation at the beginning of the growing season in the coming years.
The observed decline in water levels on watershed could indicate that these areas will be most affected by global warming.
Author Contributions
Andrzej Boczoń: Methodology, Investigation, Formal analysis, Writing – original draft.Michał Wróbel – Investigation, Data curation.Anna Kowalska – Resources, Validation.
Funding
This work was supported by The State Forests National Forest Holding (Poland) [grant number 500.470].
Conflicts of Interest
The authors declare no conflicts of interest.
Glossary
watershed - the elevated terrain that separates neighbouring drainage basins.
References
- Allen RG., Pereira LS., Raer D, Smith M, 1998. Crop Evapotranspiration—Guidelines for.
- Computing Crop Water Requirements. FAO Irrigation & Drainage Paper 56, FAO.
- Bennett KE, Werner AT, Schnorbus M, 2012. Uncertainties in hydrologic and climate change impact analyses in headwater basins of British Columbia. J Clim 25:5711–5730. [CrossRef]
- Boczoń A, 2002. Groundwater in the Białowieża Forest in the dry year 2000., Sylwan, 7, 93-105. (in Polish).
- Boczoń A, Sałachewicz A, 2022. Climatic conditions of Białowieża Forest. In Stereńczak k. (ed) The current state of Białowi eża Forest based on the results of the LIFE+ ForBioSensing project. Forest Research Institute, Sękocin Stary, ISBN 978-83-62830-92-3, 19-35.
- Braun S, de Witte LC, Hopf SE, 2020. Auswirkungen des Trockensommers 2018 auf Flächen der Interkantonalen Walddauerbeobachtung. Schweiz Z Forstwes 171:270–280.
- Büntgen U, Urban O, Krusic PJ et al. 2021. Recent European drought extremes beyond Common Era background variability. Nat. Geosci. 14, 190–196 (2021). [CrossRef]
- Dong C, Menzel L, 2020. Recent snow cover changes over central European low mountain.
- ranges. Hydrological Processes, 34(2): 321–338. [CrossRef]
- Dwire KA, Mellmann-Brown S, Gurrieri JT, 2018. Potential effects of climate change on riparian areas, wetlands, and groundwaterdependent ecosystems in the Blue Mountains, Oregon, USA. ClimServ 10:44–52. [CrossRef]
- Froend R, Sommer B, 2010. Phreatophytic vegetation response to climatic and abstraction-induced groundwater drawdown: examples of long-term spatial and temporal variability in community response. Ecol. Eng. 36, 1191e1200. [CrossRef]
- Kath J, Reardon-Smith K, Le Brocque AF, Dyer FJ, Dafny E, Fritz L,Batterham M, 2014. Groundwater decline and tree change in floodplain landscapes: Identifying non-linear threshold responses in canopy condition.Glob. Ecol. Conserv. 2, 148-160. [CrossRef]
- Kolendo Ł, Boczoń A, KoźniewskiM., WojtasK., Chmur Sz, 2021. Hydrographic study for the Białowieża Forest catchment area. Regional Directorate of State Forests in Białystok, Office of Forest Management and Forest Surveying, Branch in Białystok, Białystok. (in Polish).
- Krajewski T, 1997. The Siemianówka reservoir and its impact on the Białowieża Forest. Sylwan Vol.141 nr 11, s.91-101 (in Polish).
- Kundzewicz ZW, Matczak P, 2012. Climate change regional review: Poland. WIREs Climatic Change, 3: 297–311. [CrossRef]
- Majdi N, Colls M, Weiss L et al., 2020. Duration and frequency of non-flow periods affect the abundance and diversity of stream meiofauna. Freshw Biol 65:1906–1922. [CrossRef]
- Munir MU, Blaurock K, Frei S, 2024. Understanding the vulnerability of surface–groundwater interactions to climate change: insights from a Bavarian Forest headwater catchment. Environmental Earth Sciences 83:12. [CrossRef]
- Pierzgalski E, Boczoń A, Tyszka J, 2002. Variability of rainfall and groundwater position in the Białowieża National Park, Kosmos 51 (4), 415-425 (in Polish).
- Robinson DA, 2020. Northern Hemisphere continental snow cover extent [In:] Blunden J, Arnd, DS., State of the Climate in 2019. Bulletin of the American Meteorological Society, 101. [CrossRef]
- Salmi T, Määttä A, Anttila P, Ruoho-Airola T, Amnell T, 2002. Detecting trends of annual values of atmospheric pollutants by the Mann-Kendall test and Sen’s Slope Estimates -the excel template application MAKESENS. Publications on air quality. No. 31, FinnishMeteorological Institute.
- Sen PK, 1968. Estimates of the regression coefficient based on Kendall's tau. Journal of the American Statistical Association, 63: 1379–1389.
- Schuldt B, Buras A, Arend M, Vitasse Y, Beierkuhnlein C, Damm A, Gharun M, Grams TEE, Hauck M, Hajek P, Hartmann H, Hilbrunner E, Hoch G, Holloway-Phillips M, Kӧrner H, Larysch E, Lübbe T, Nelson DB, Rammig A,Rigling A, Rose L, Ruehr NK, Schumann K, Weiser F, Werner Ch, Wohlgemuth T, Zang ChS, Kahmen A, 2020. A first assessment of the impact of the extreme 2018 summer drought on Central European forests, Basic and Applied Ecology. [CrossRef]
- Szwed M, Pińskwar I, Kundzewicz ZW, Graczyk D, Mezghani A, 2017. Changes of snow cover in Poland. Acta Geophysica, 65: 65–76. [CrossRef]
- Tomczyk AM, Bednorz E, Szyga-Pluta K, 2021. Changes in Air Temperature and Snow Cover in Winter in Poland. Atmosphere, 12, 68. [CrossRef]
- Wunsch A, Liesch T, Broda S, 2022. Deep learning shows declining groundwater levels in Germany until 2100 due to climate change. Nat Commun 131(13):1–13. [CrossRef]
Figure 1.
Location of the measuring wells in the Białowieża Primaeval Forest (hydrography from the State Water Management „Polish Waters” Database – QGIS plugin https://github.com/LScislowski/Wody_Polskie_Baza_WMS).
Figure 1.
Location of the measuring wells in the Białowieża Primaeval Forest (hydrography from the State Water Management „Polish Waters” Database – QGIS plugin https://github.com/LScislowski/Wody_Polskie_Baza_WMS).
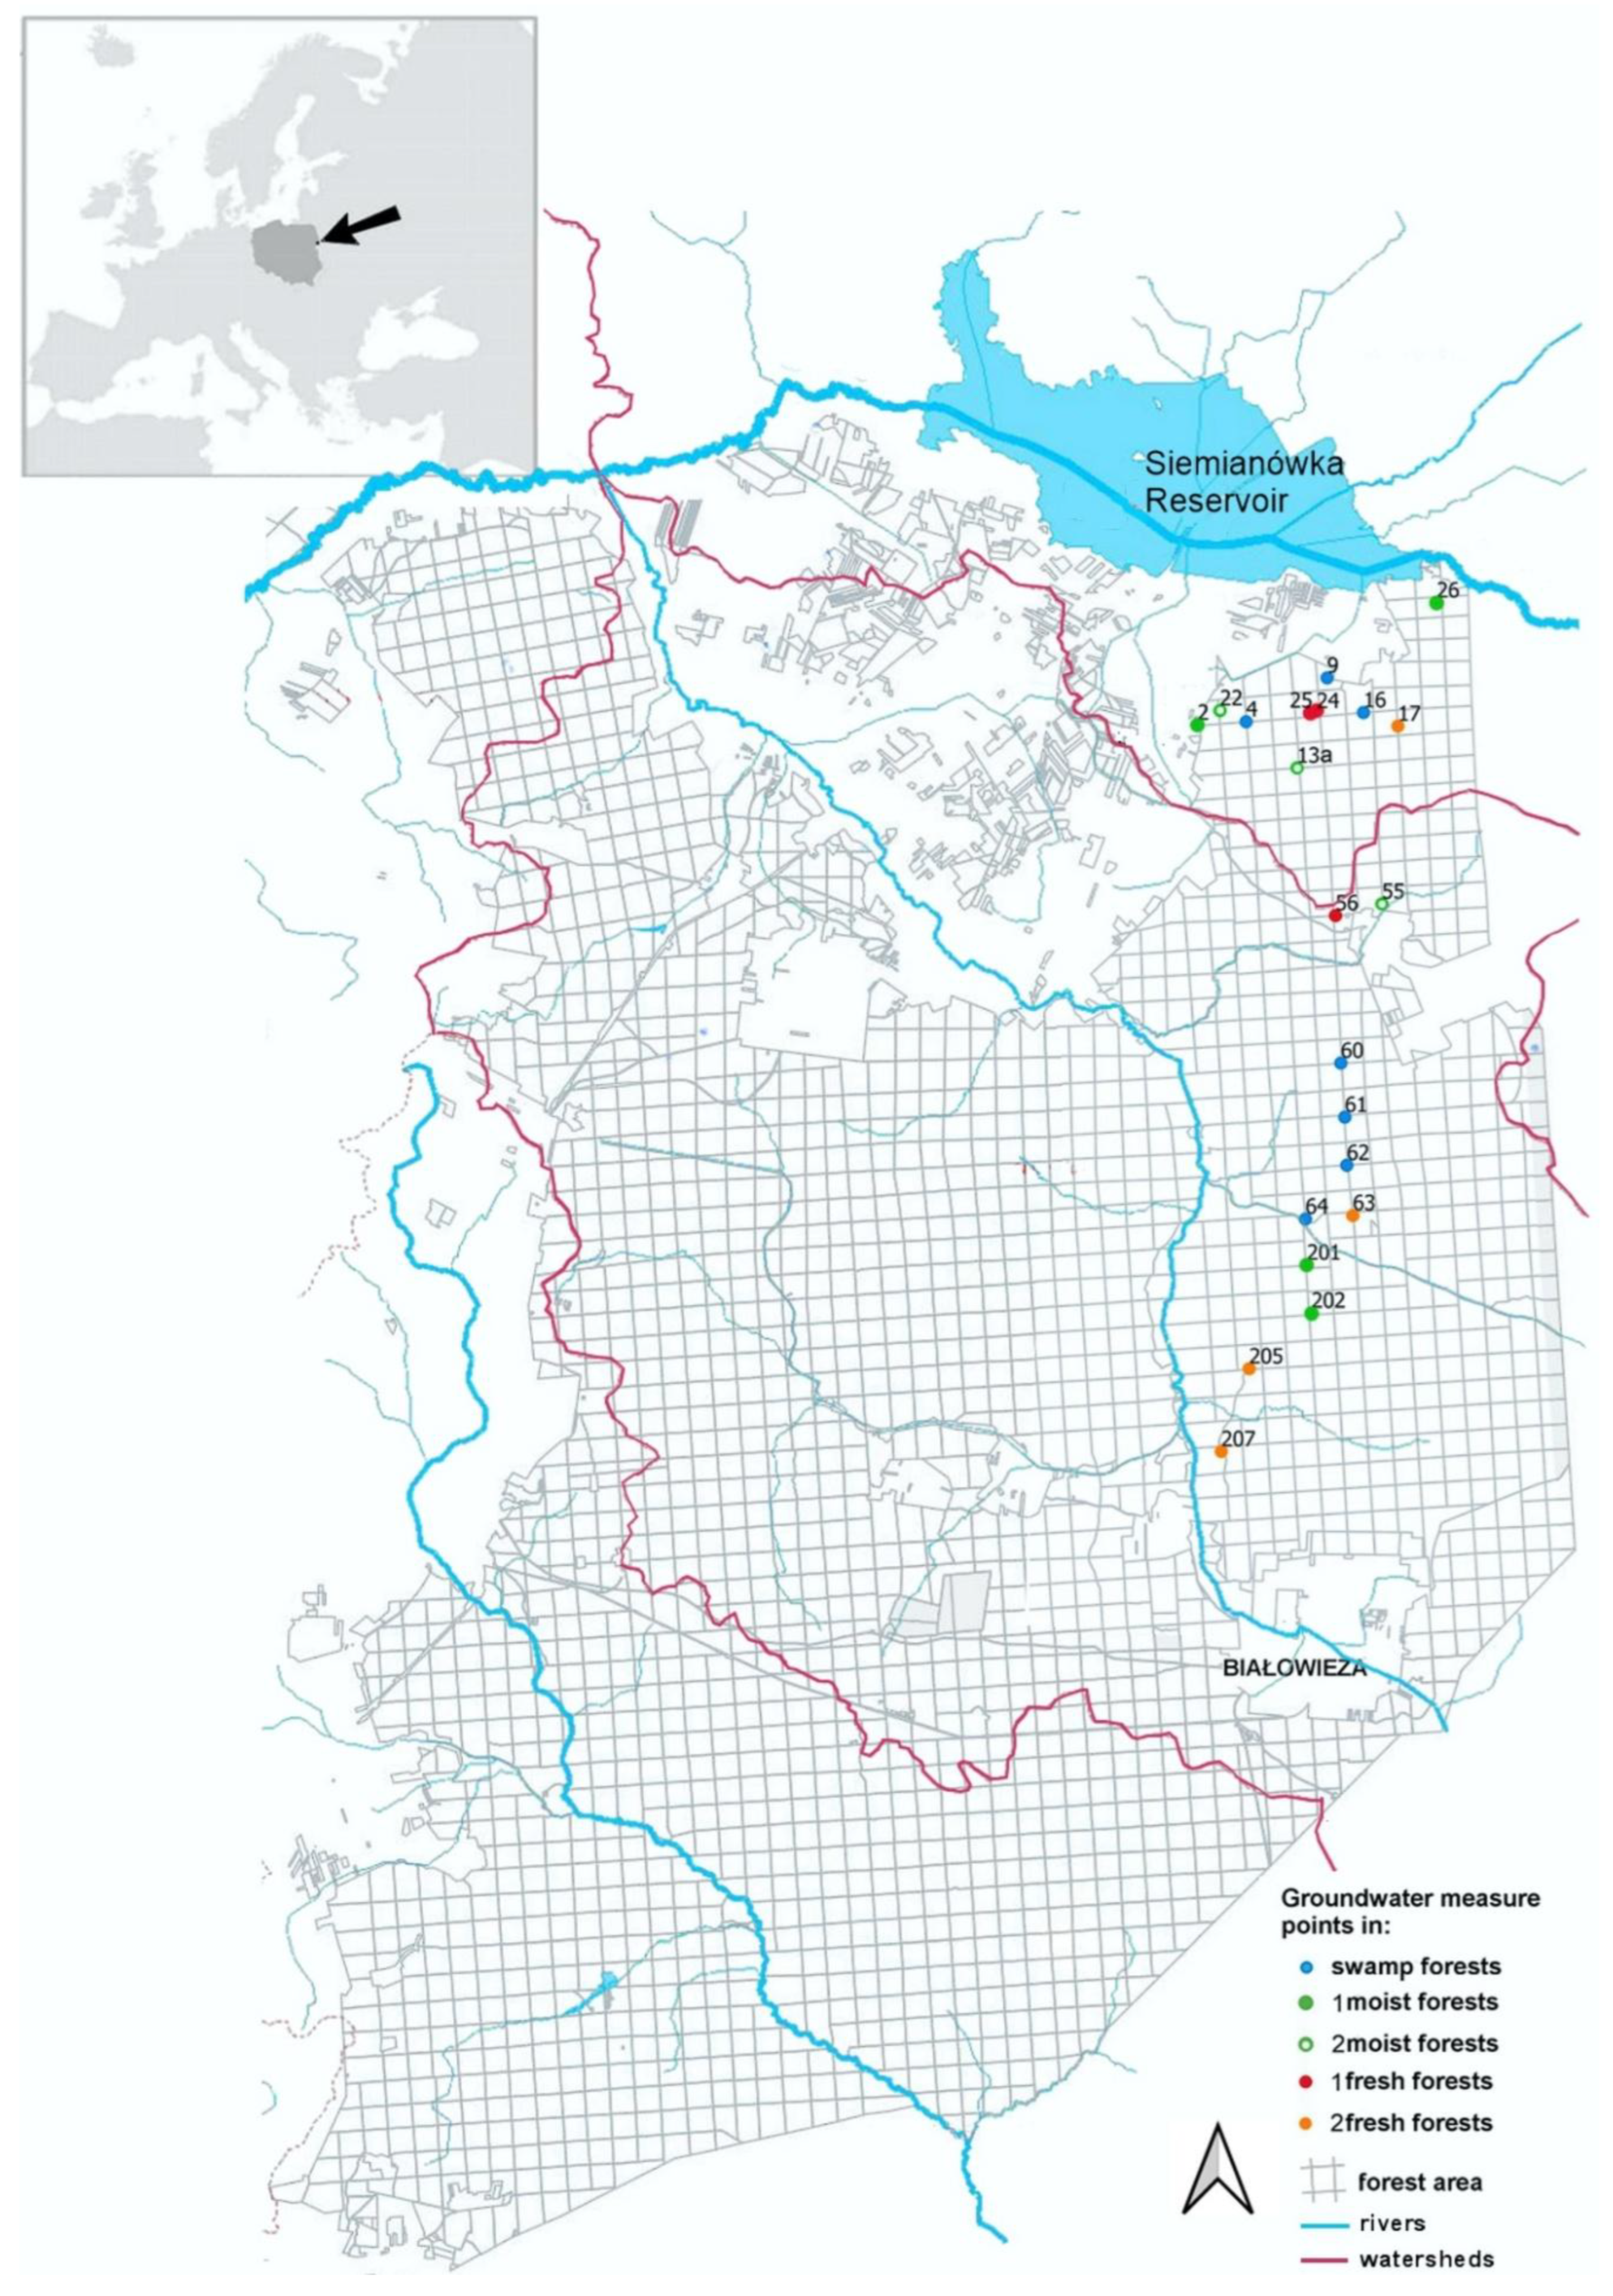
Figure 2.
Difference between precipitation in 2022, 2023 and the years in the period 1985-2005 in Bialowieża, taking into account the hydrological years, the summer period (May-Oct.) and the winter period (Nov.-April), the circle marks the years selected for comparison.
Figure 2.
Difference between precipitation in 2022, 2023 and the years in the period 1985-2005 in Bialowieża, taking into account the hydrological years, the summer period (May-Oct.) and the winter period (Nov.-April), the circle marks the years selected for comparison.
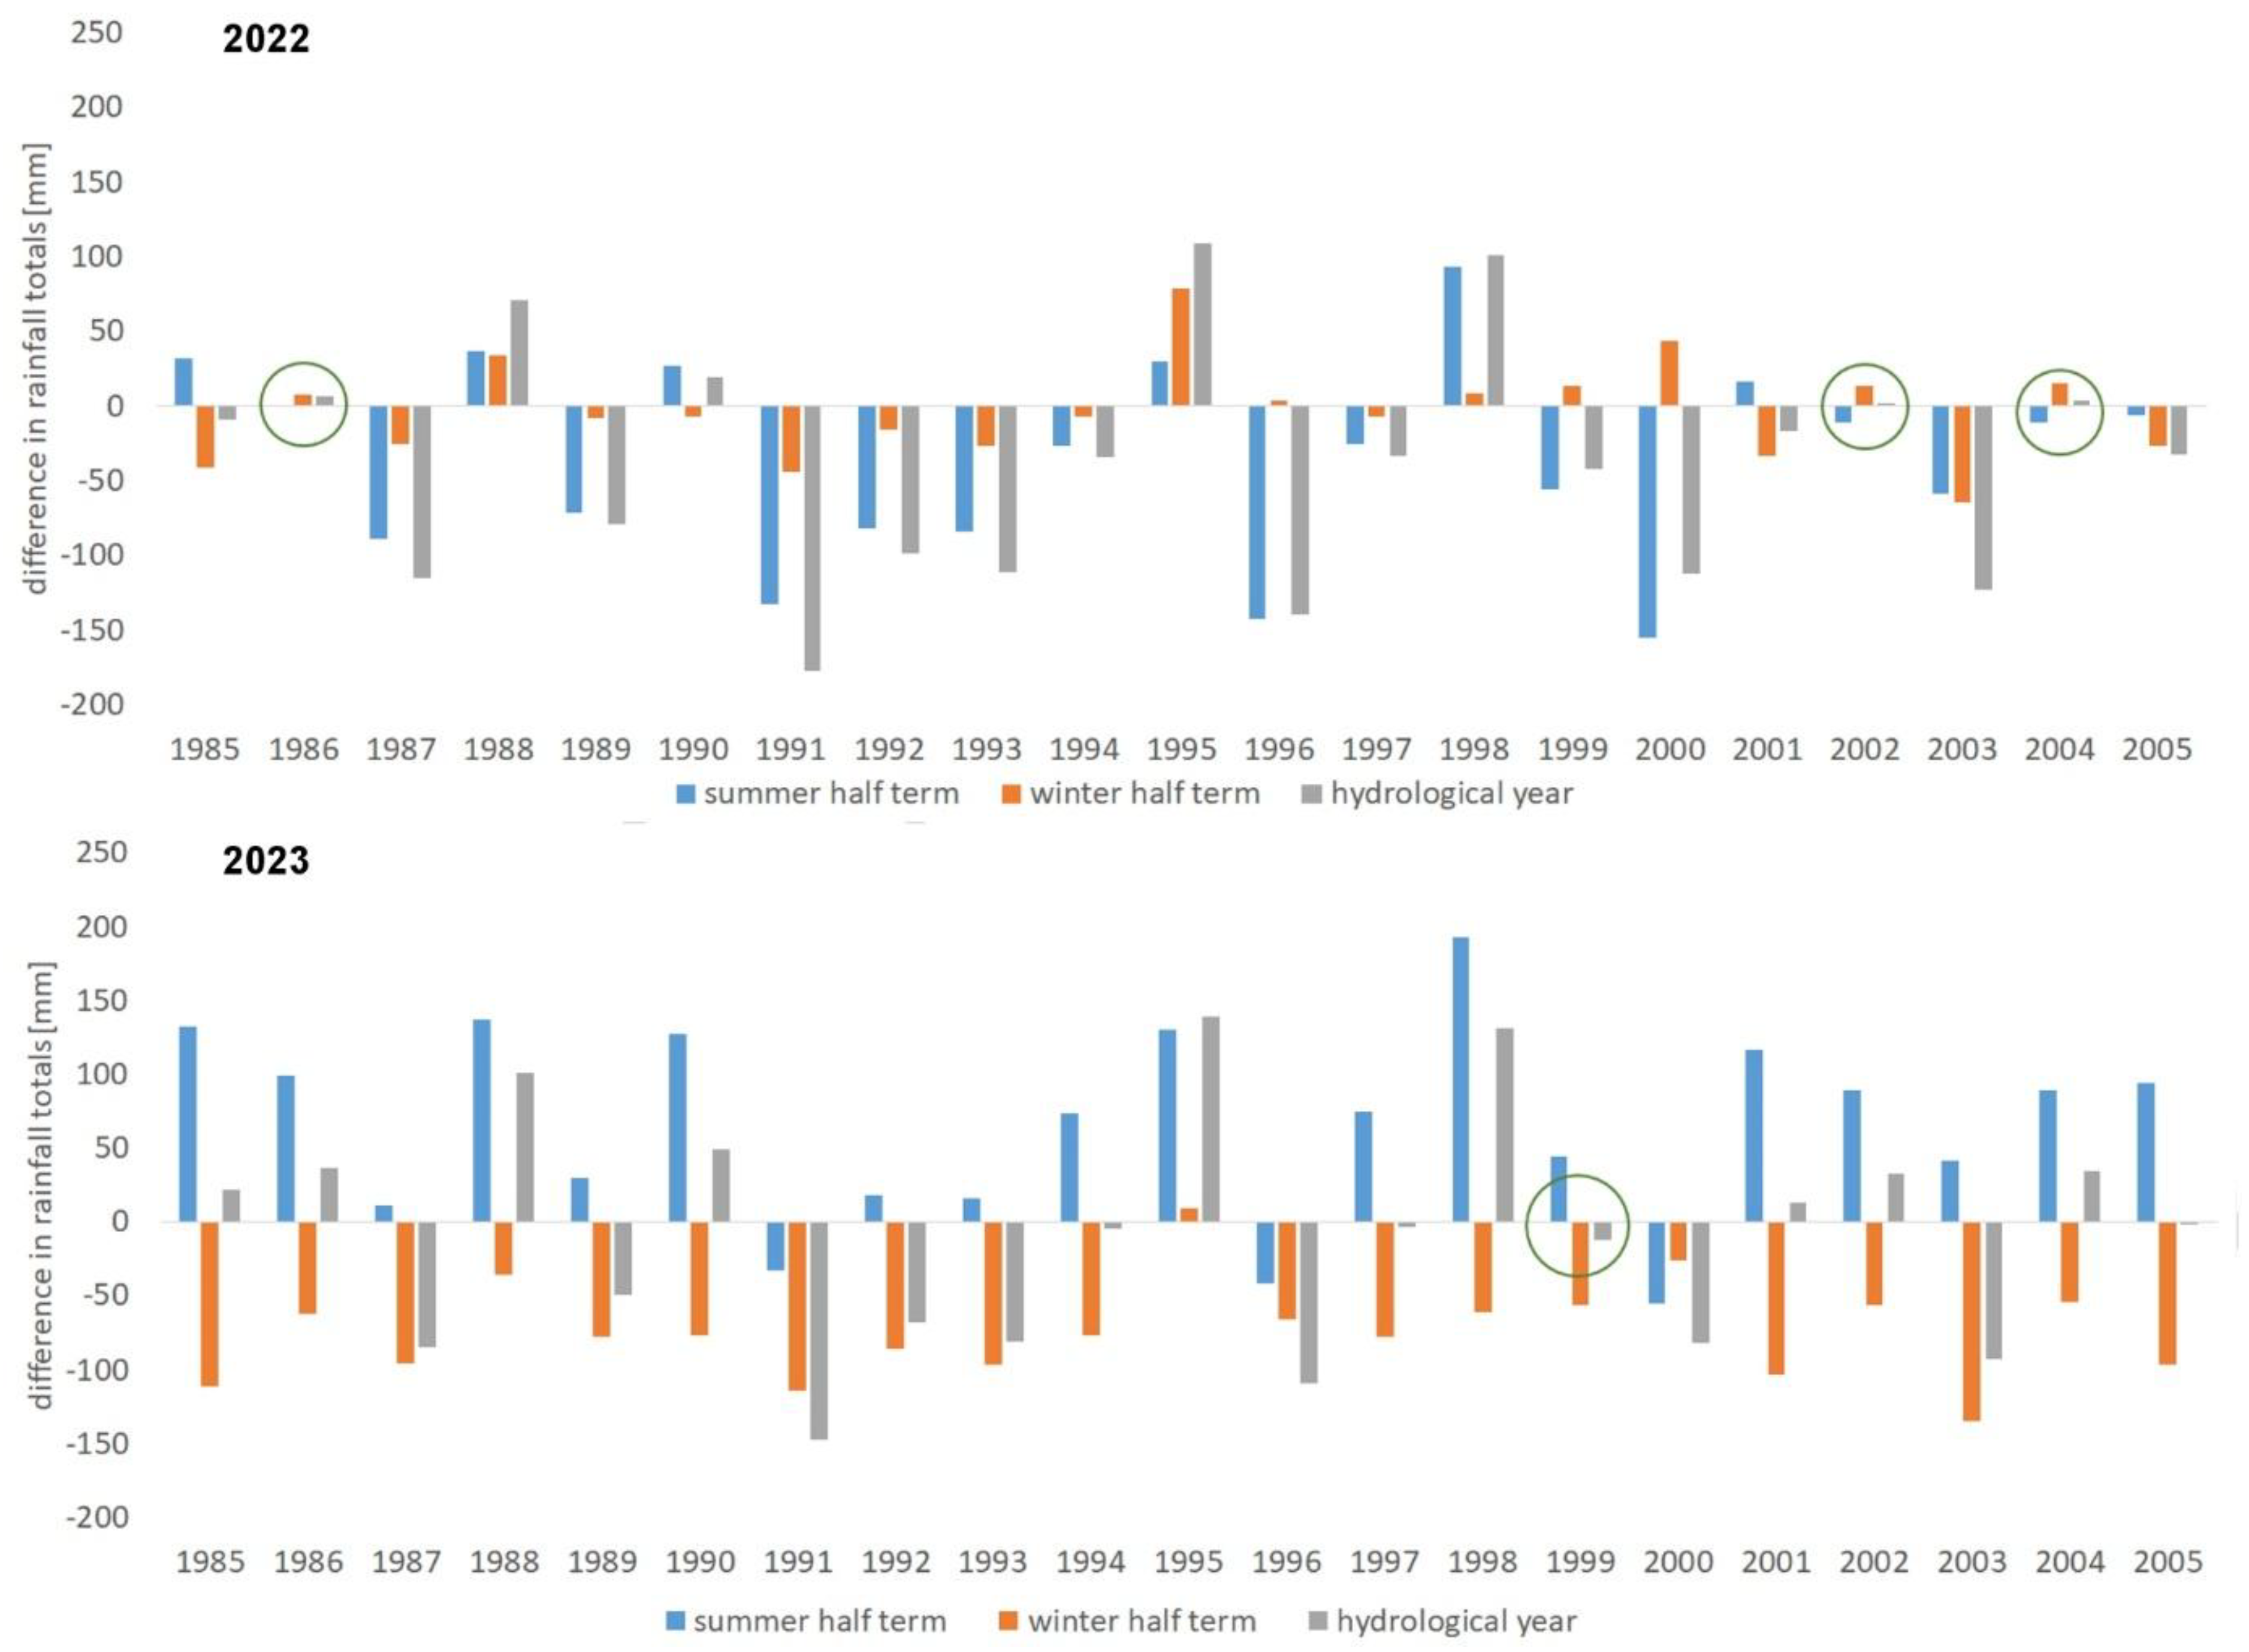
Figure 3.
Comparison of the net radiation calculated from the solar radiation in Czerlonka (B) and from the meteorological data of the Białowieża (A) station.
Figure 3.
Comparison of the net radiation calculated from the solar radiation in Czerlonka (B) and from the meteorological data of the Białowieża (A) station.
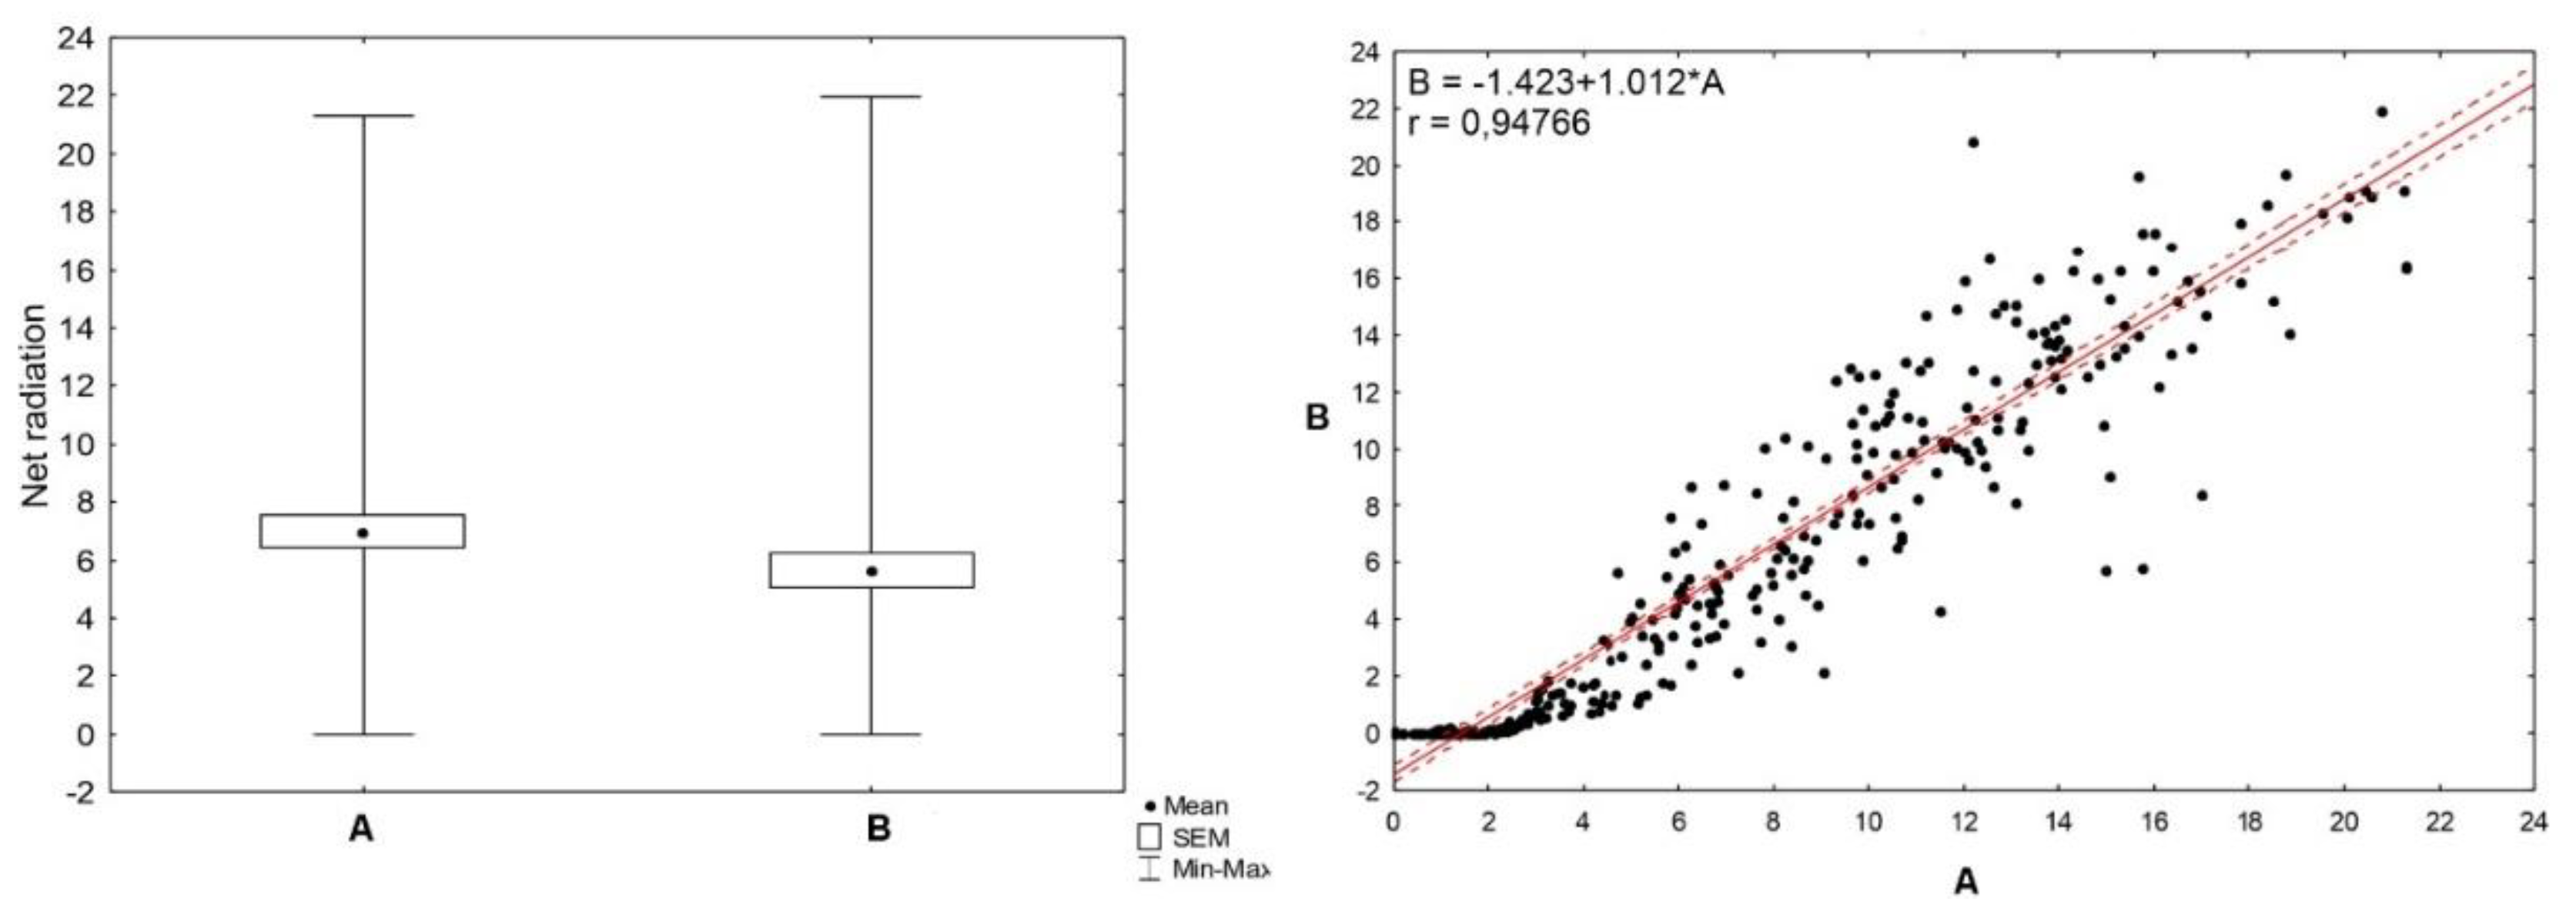
Figure 4.
Mean annual air temperature in Białowieża in the period 1985 – 2023.
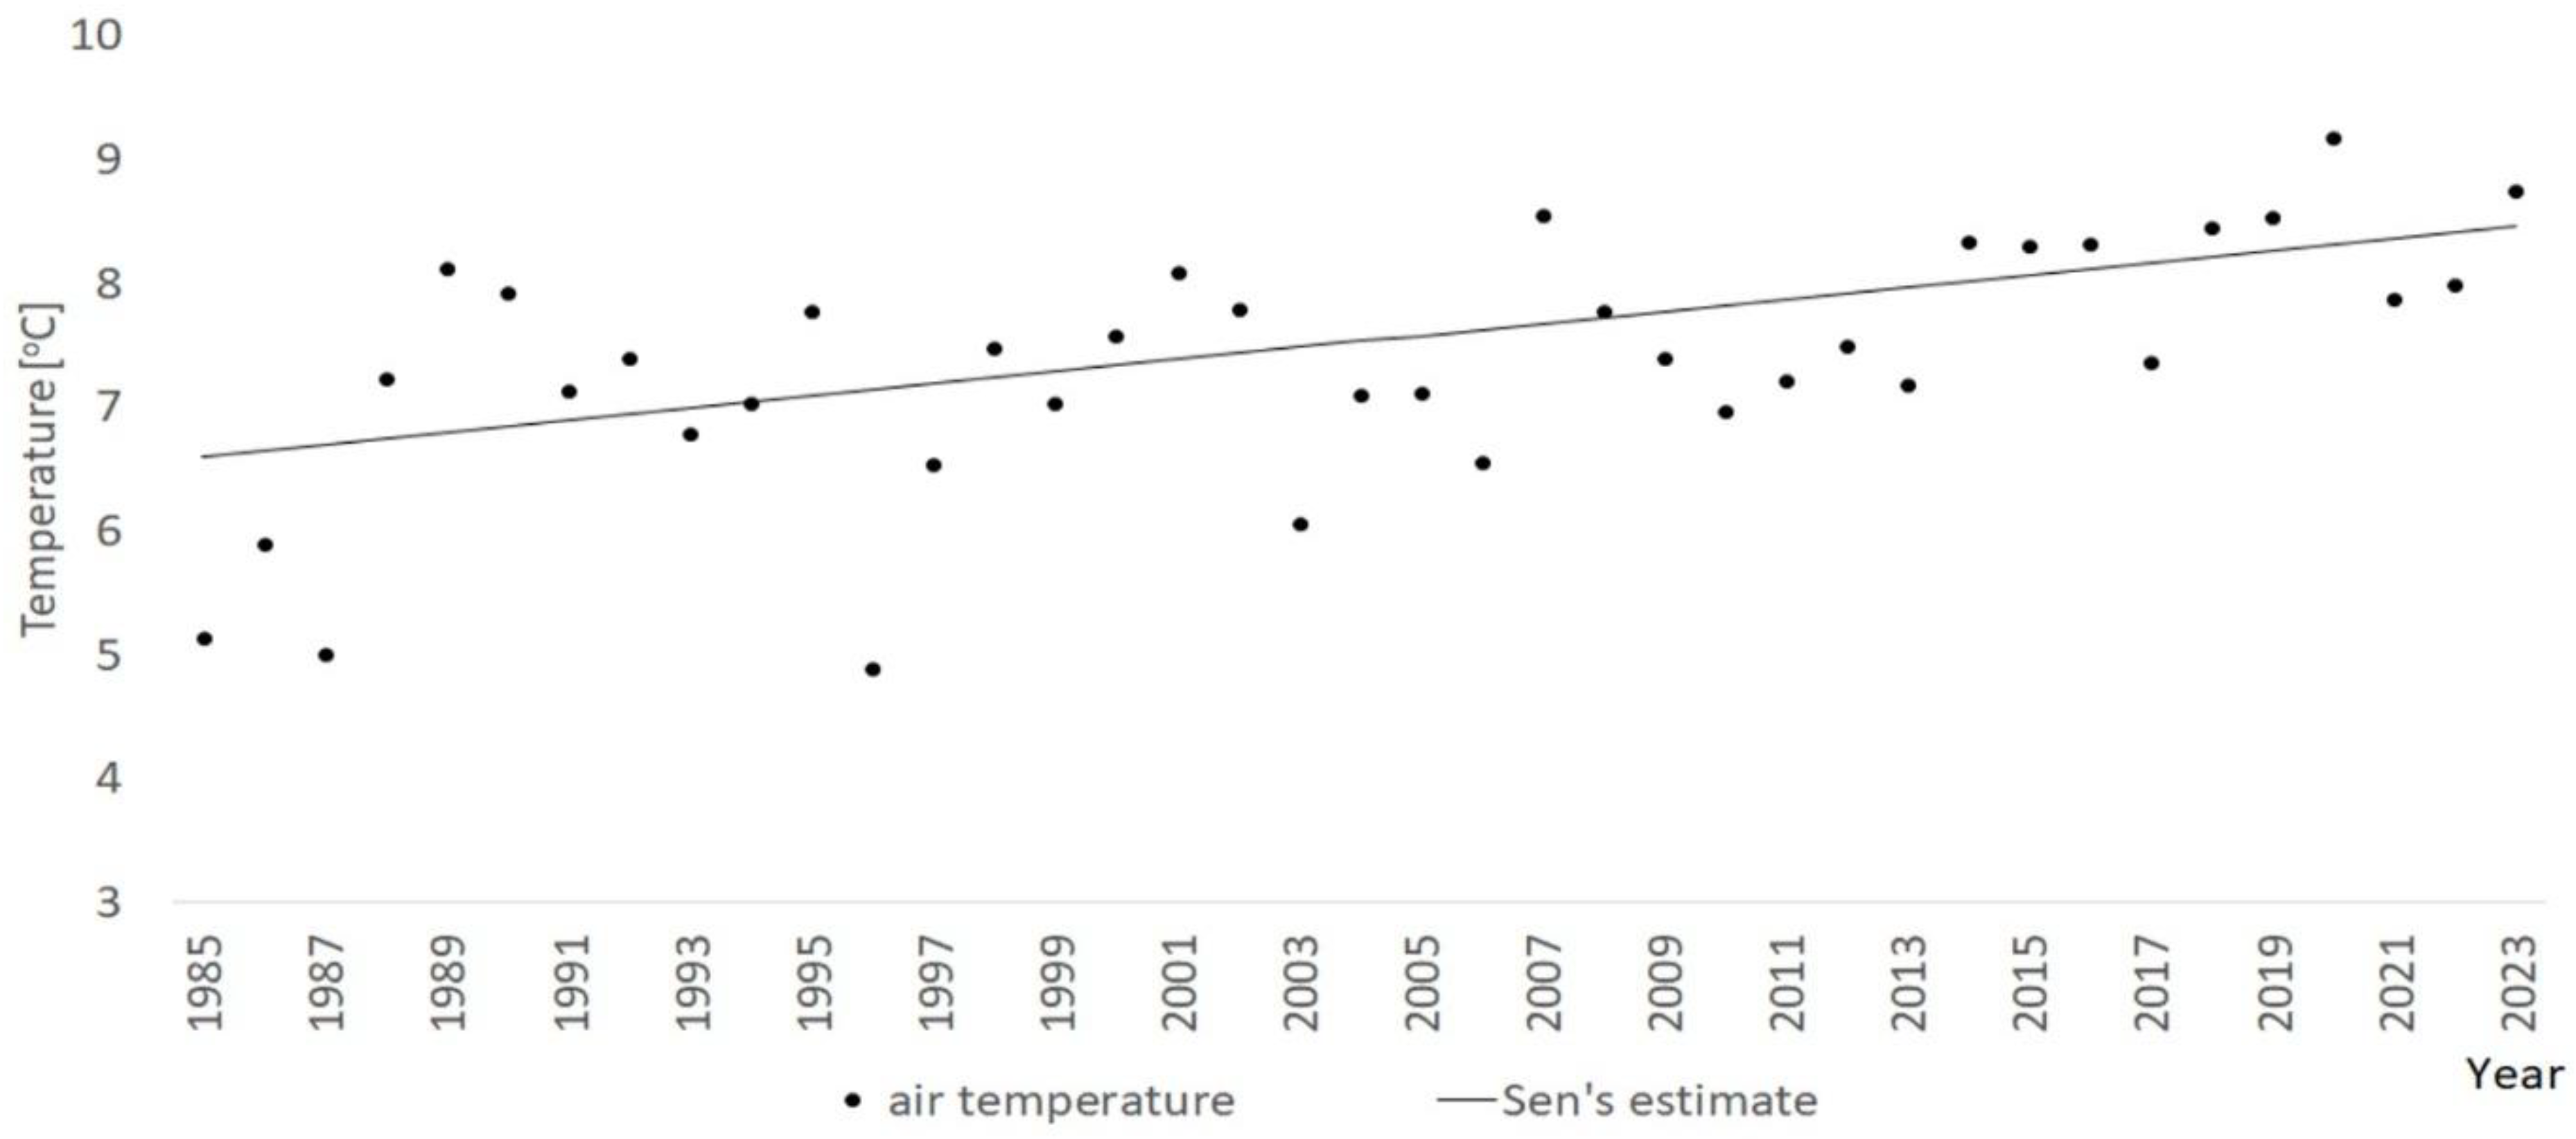
Figure 5.
Total precipitation of hydrological years in Białowieża in the period 1985-2023.
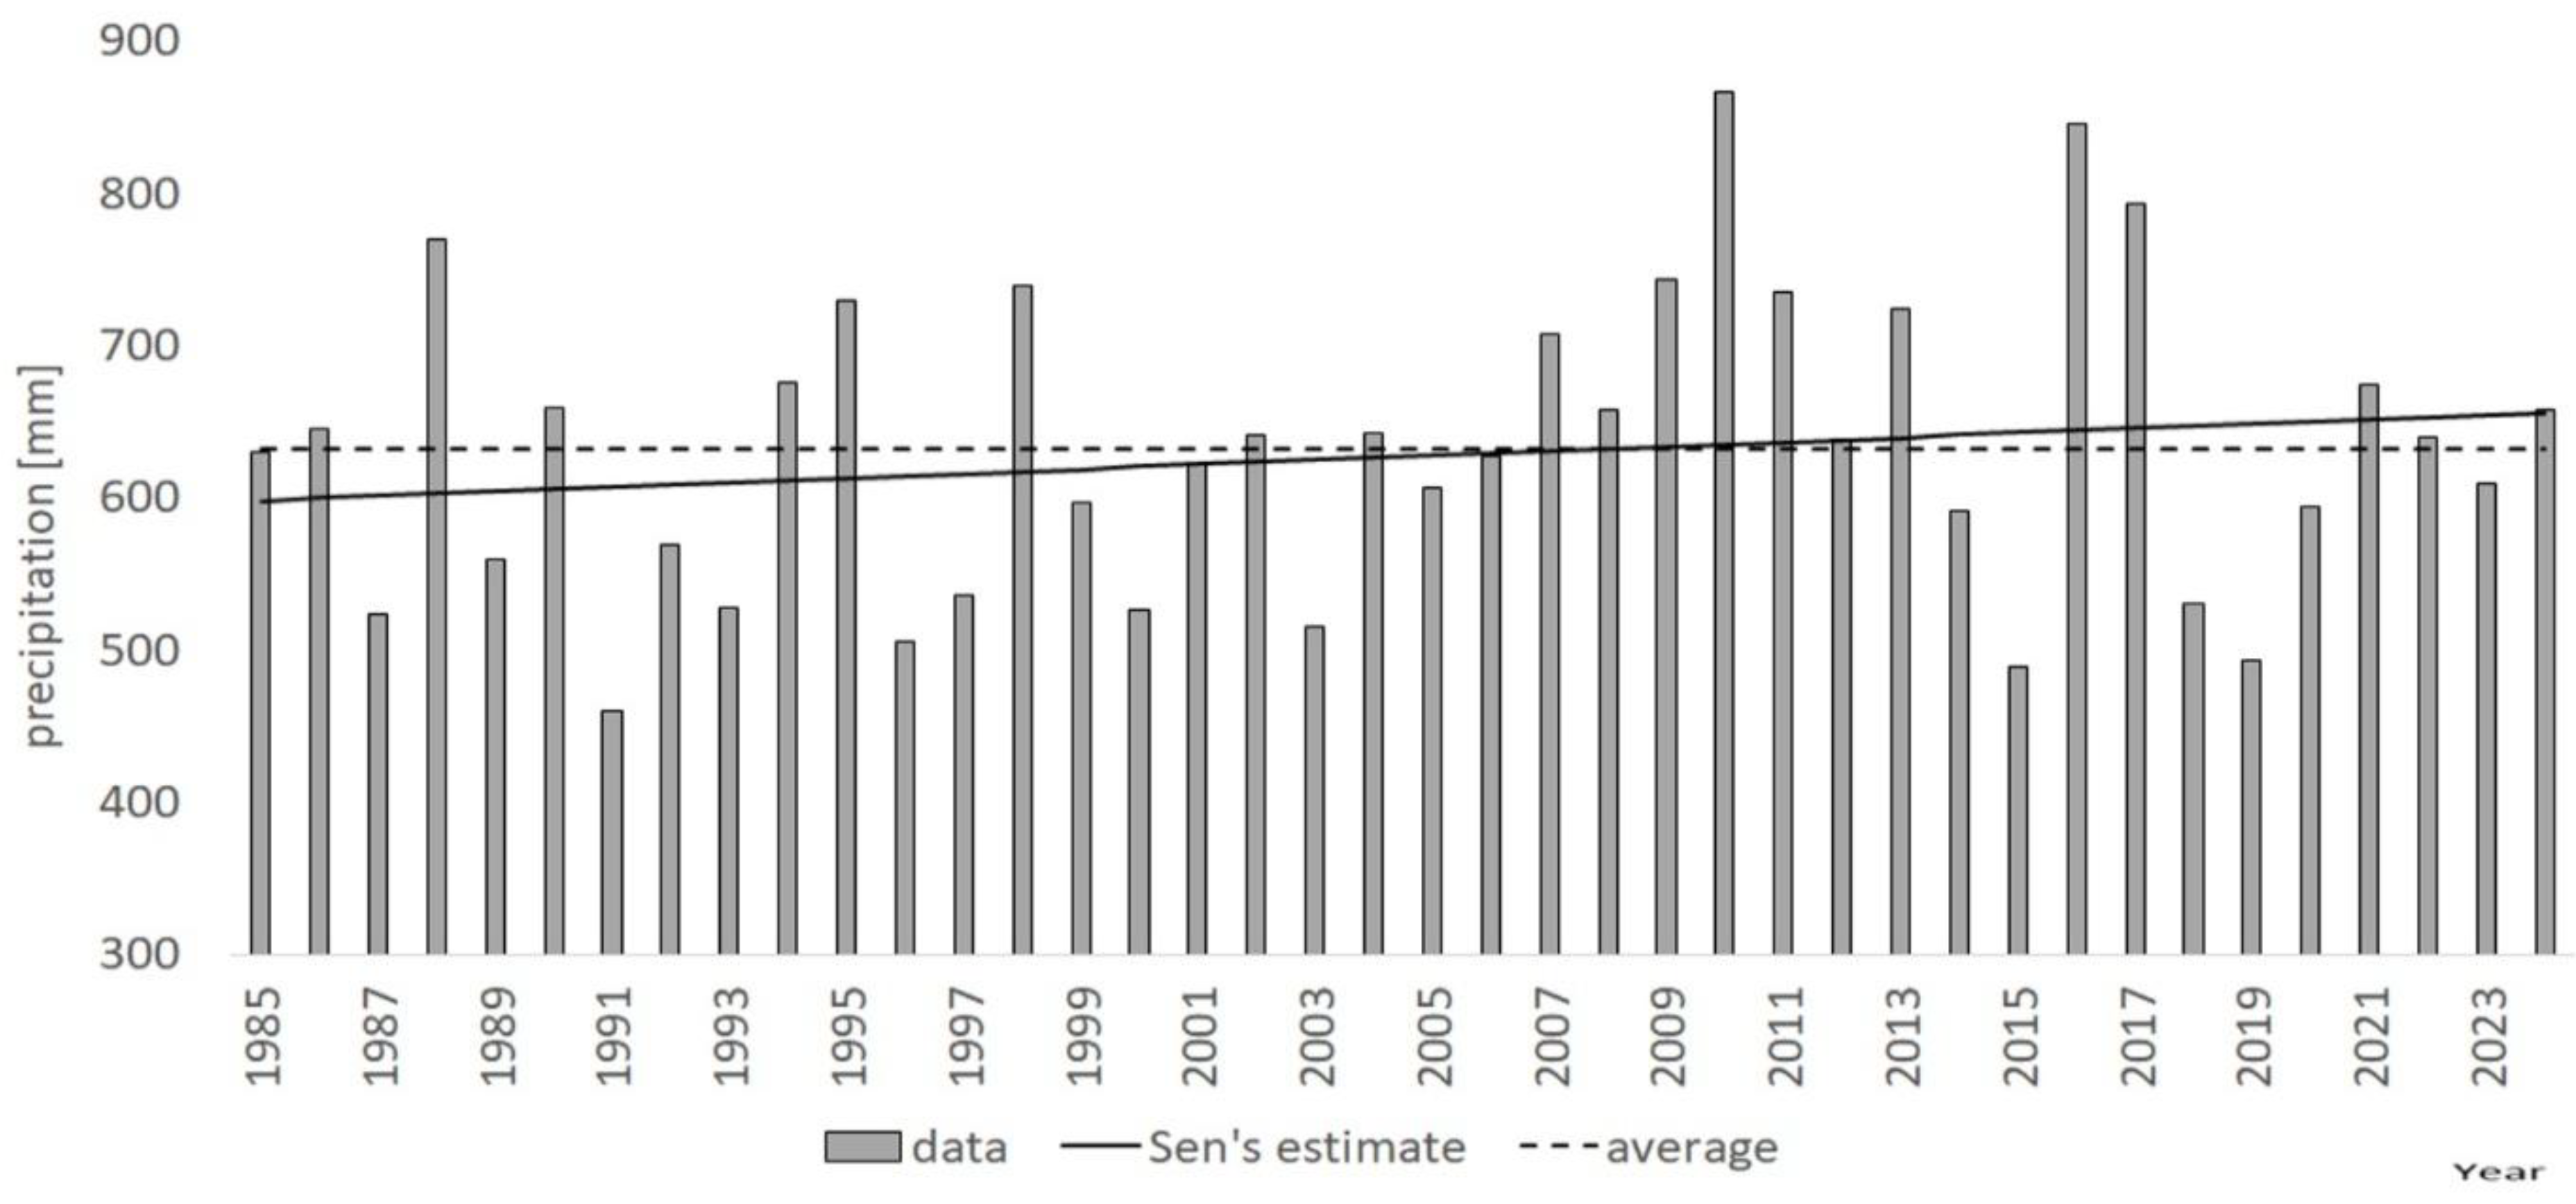
Figure 6.
Number of days snow cover in period in Białowieża 1985-2023.
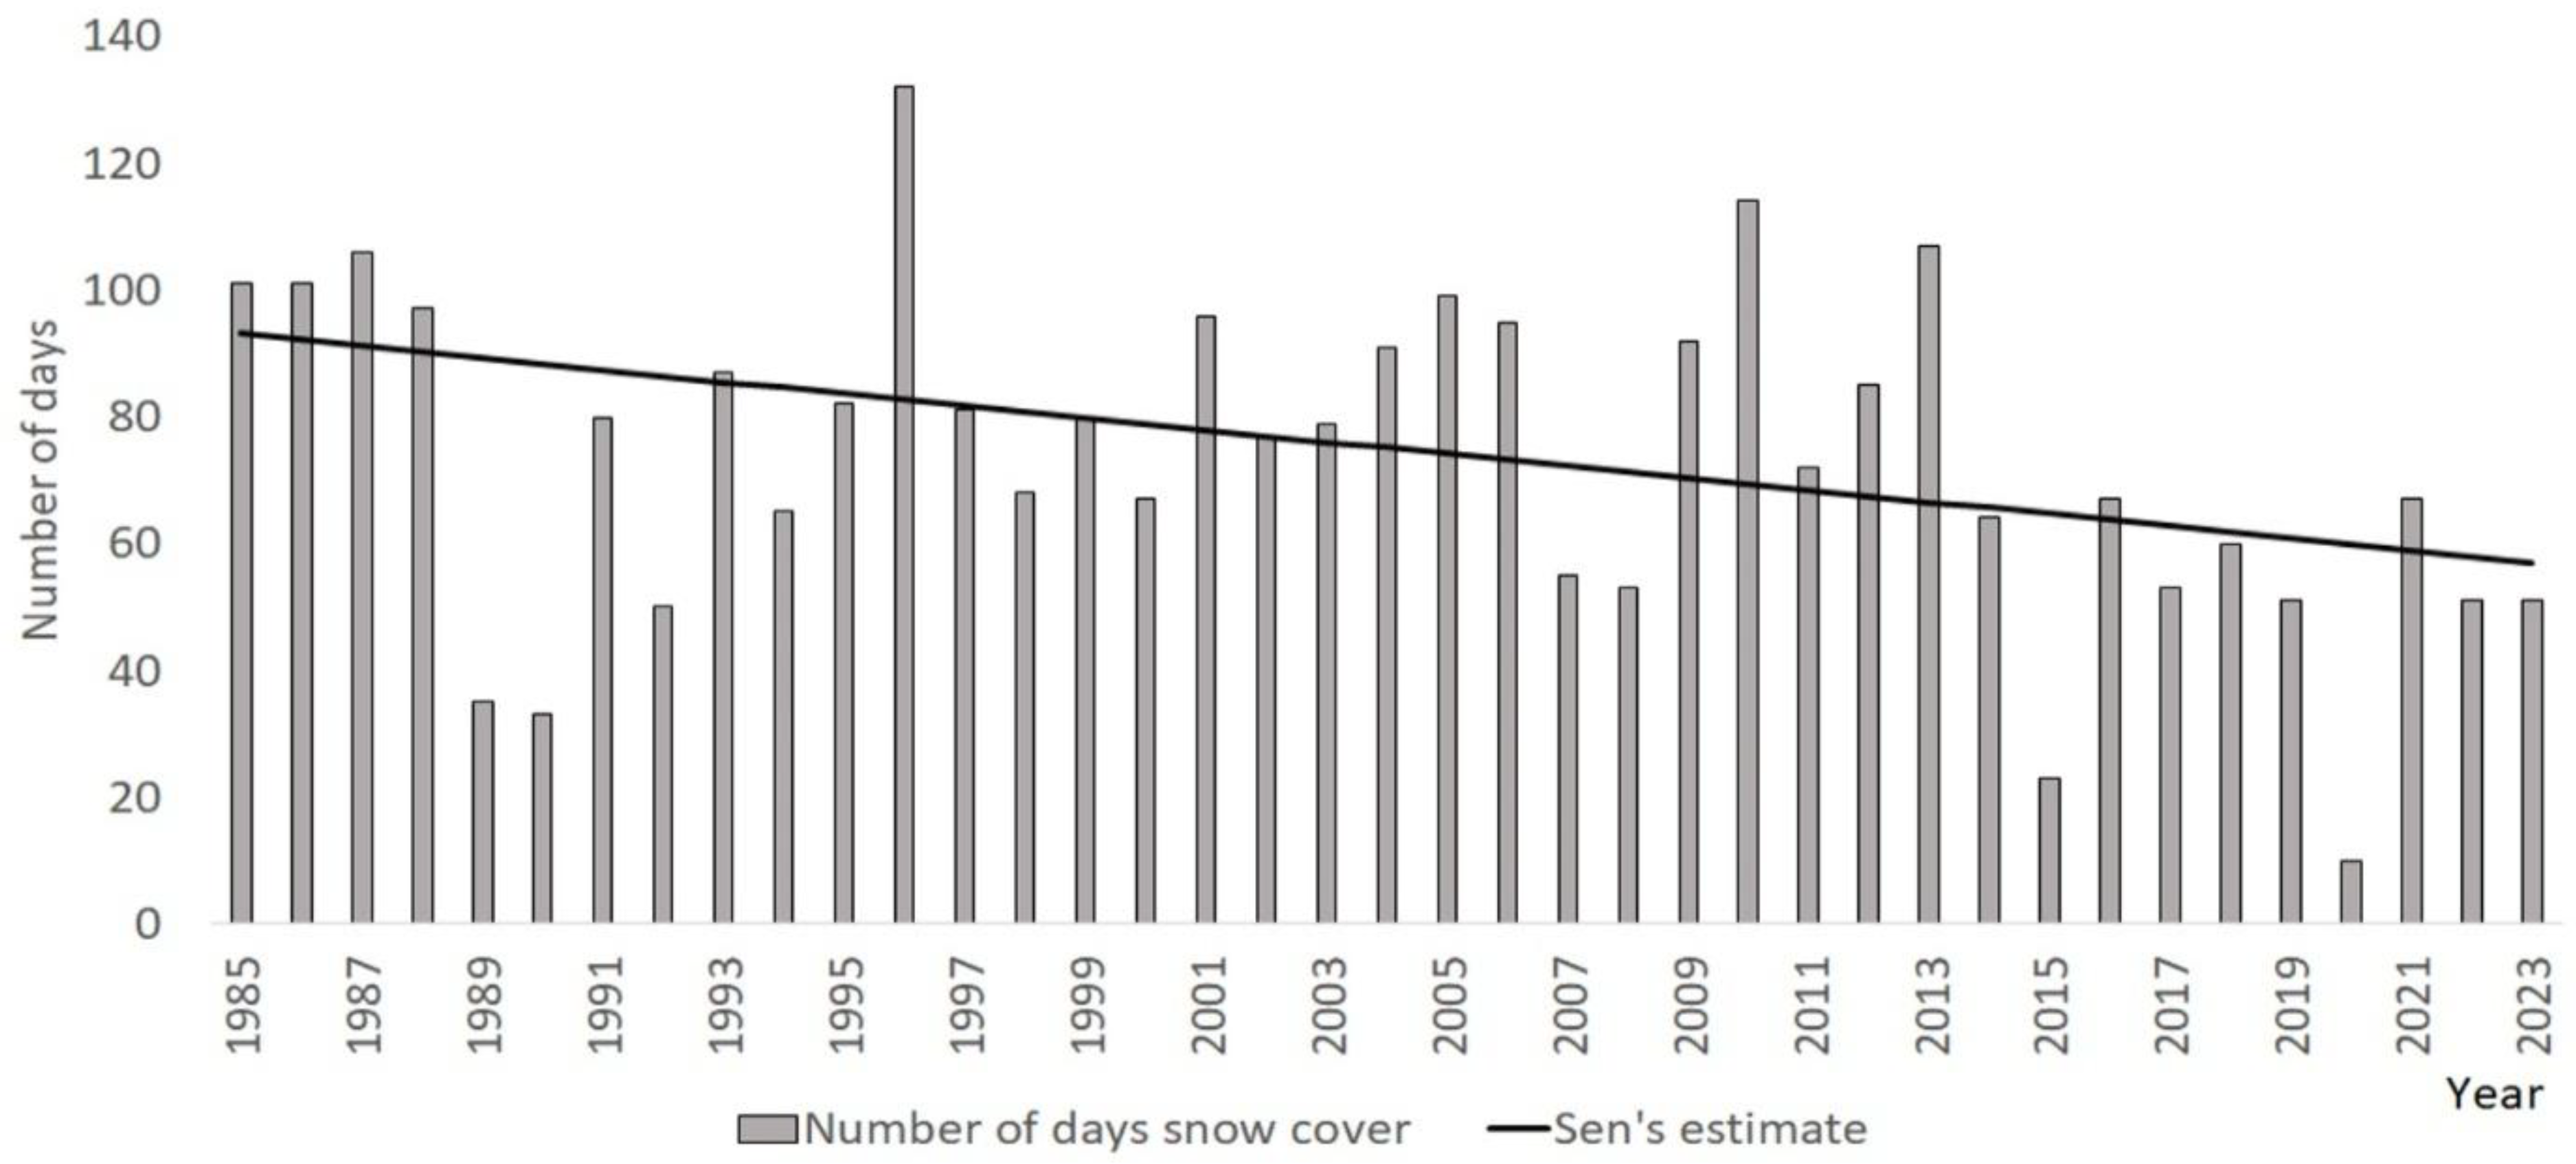
Figure 7.
Block diagrams of groundwater in swamp habitats in selected years.
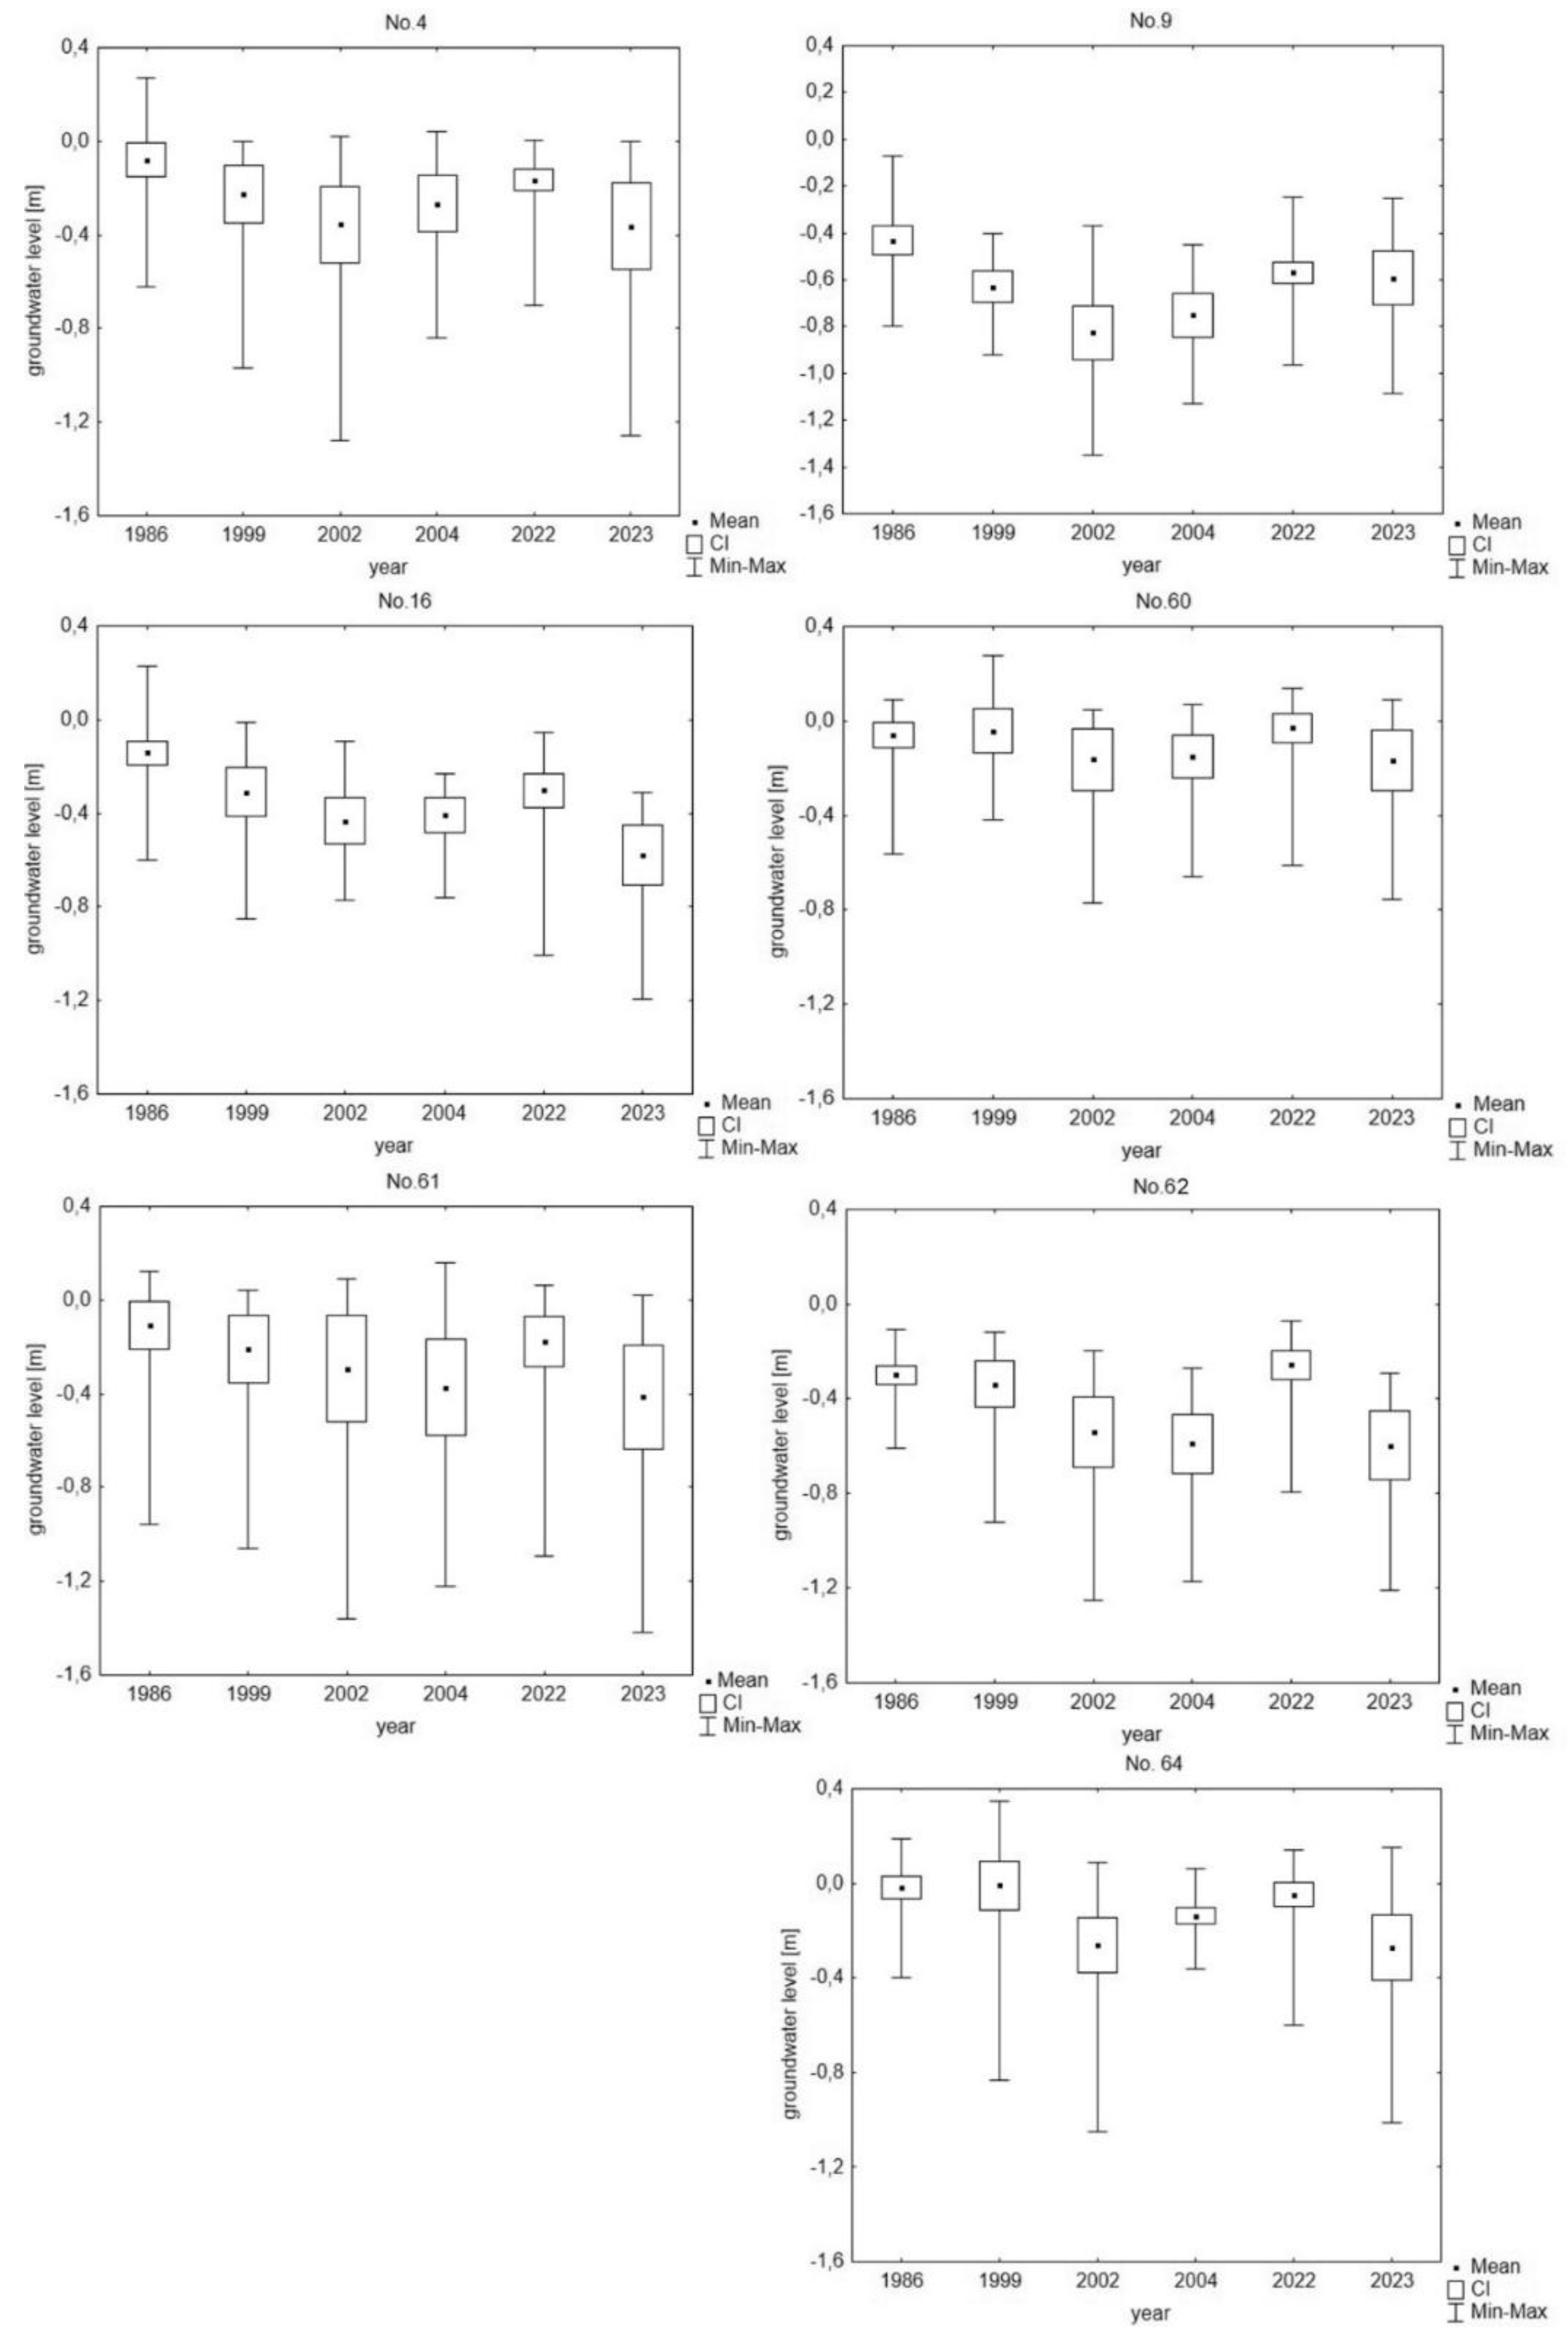
Figure 8.
Block diagrams of groundwater in 2moist habitats in selected years.
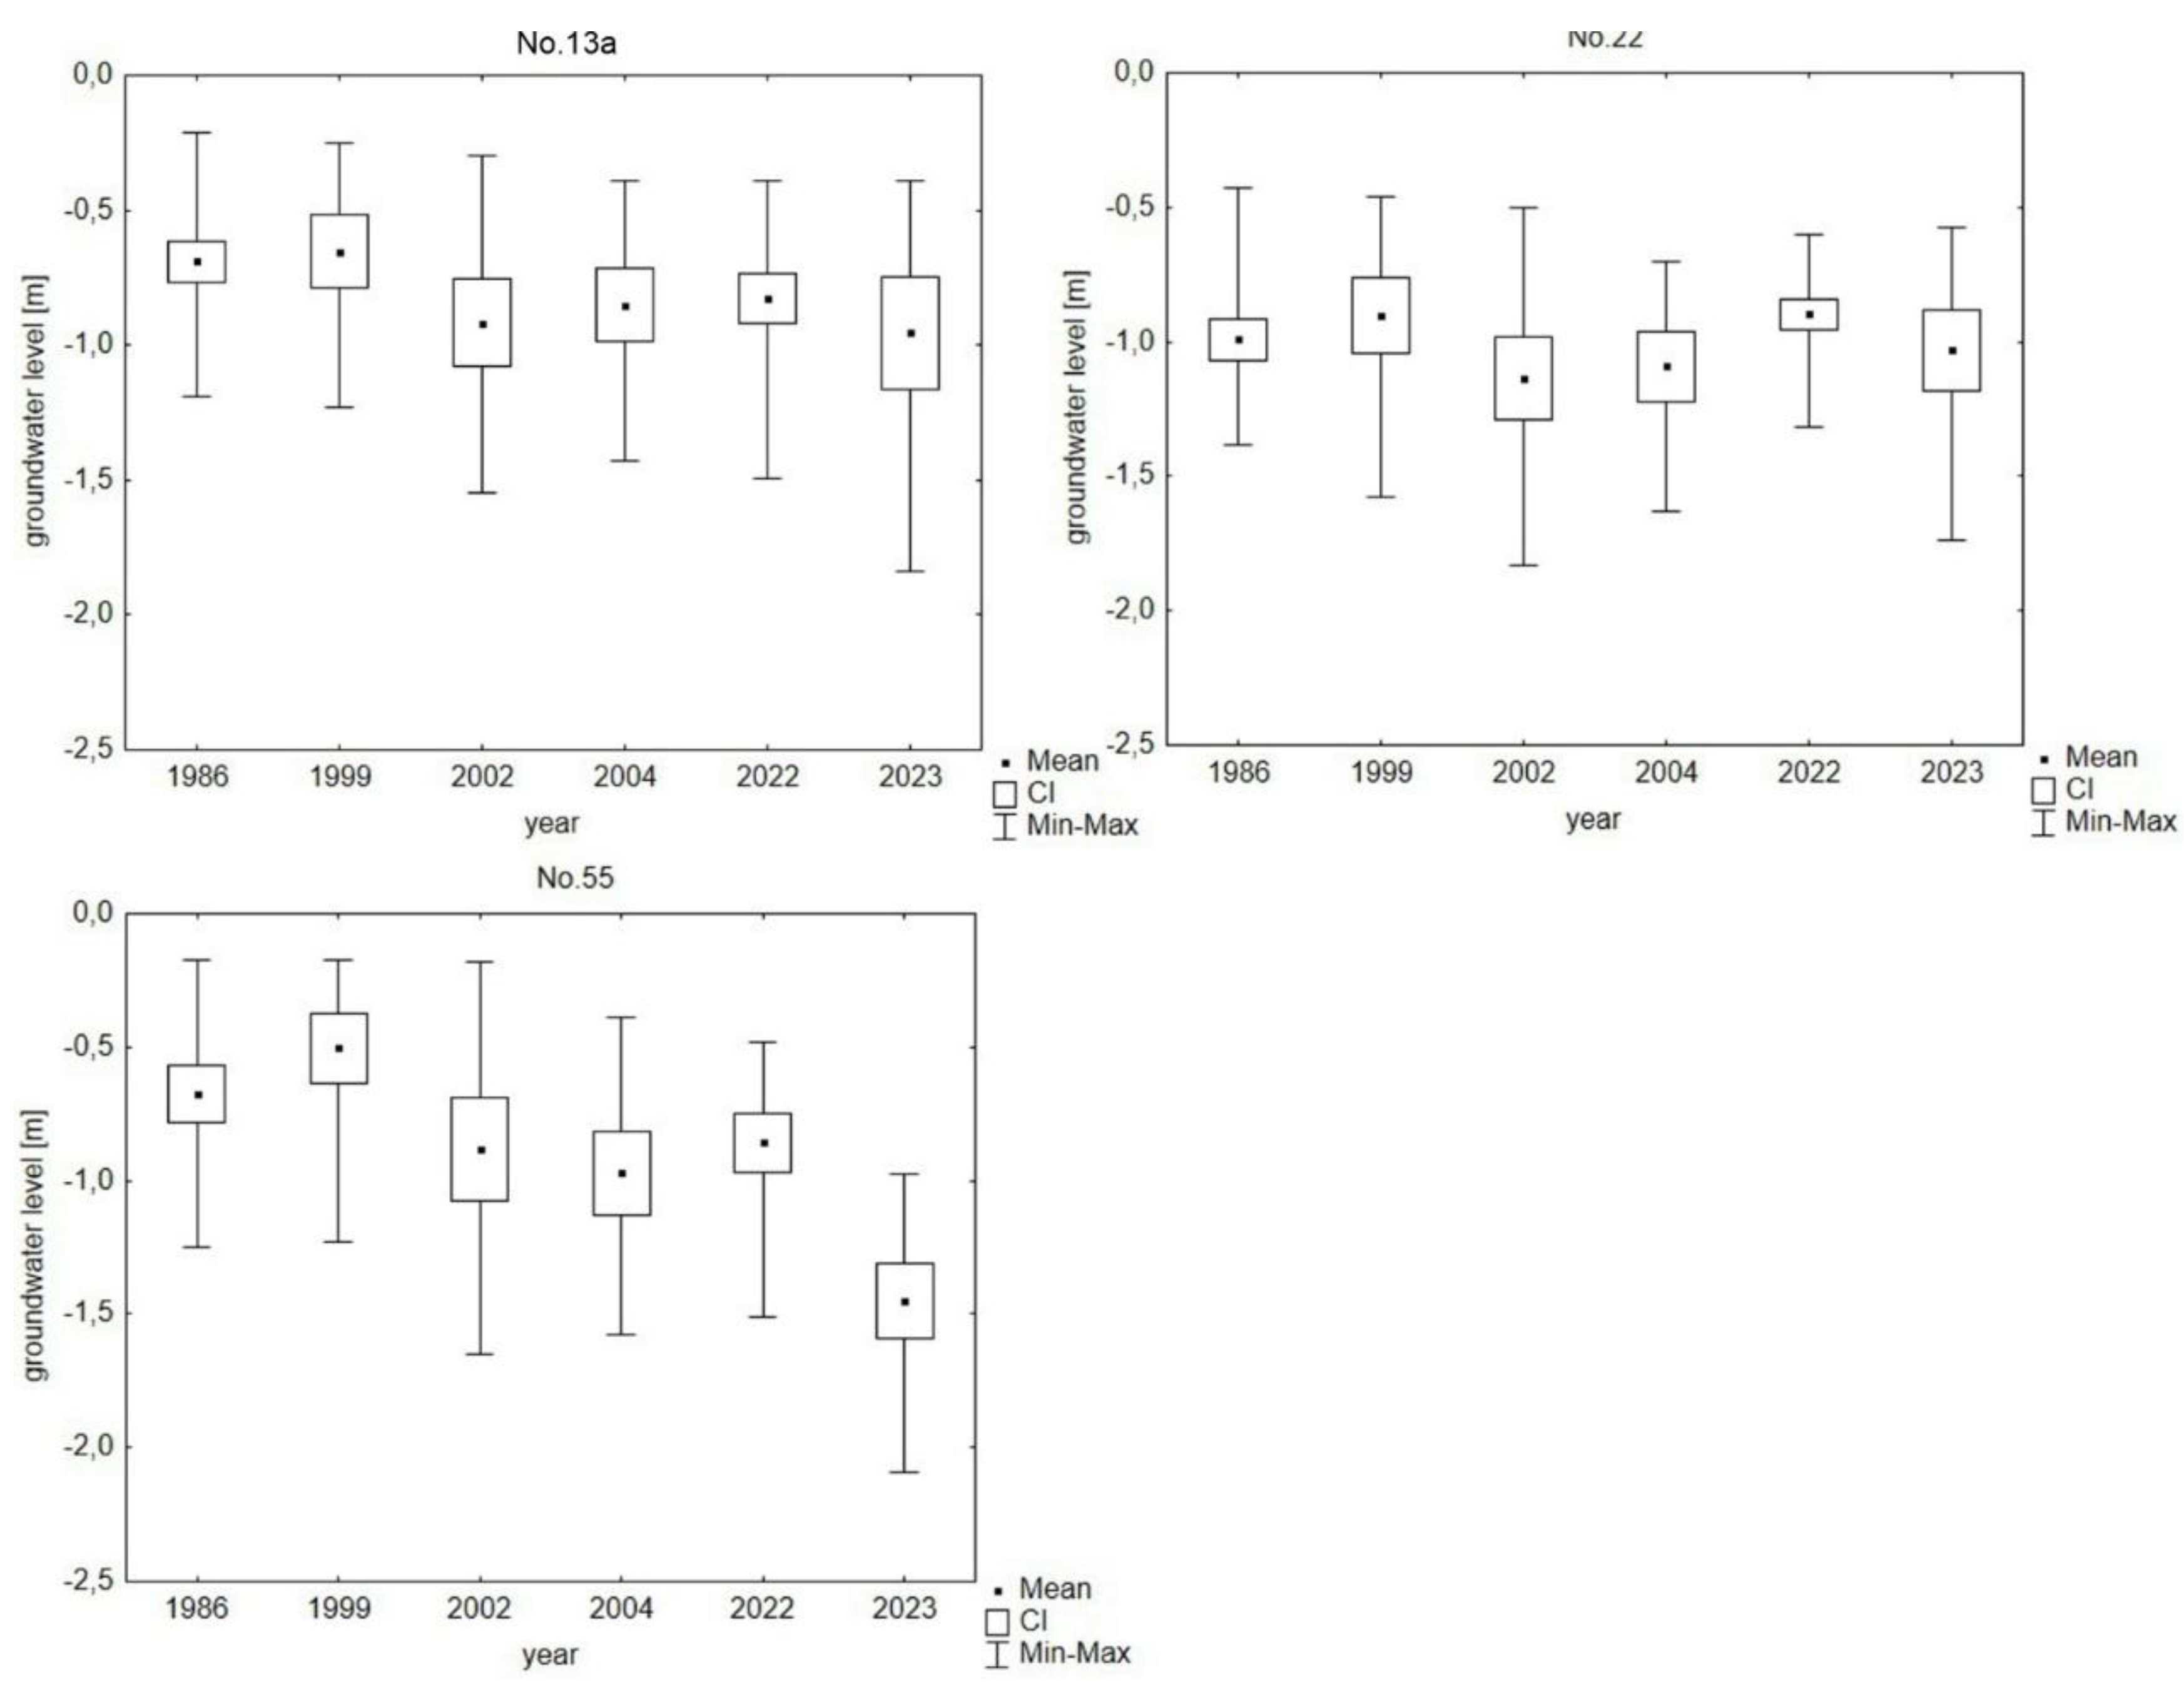
Figure 9.
Block diagrams of groundwater in 1moist habitats in selected years.
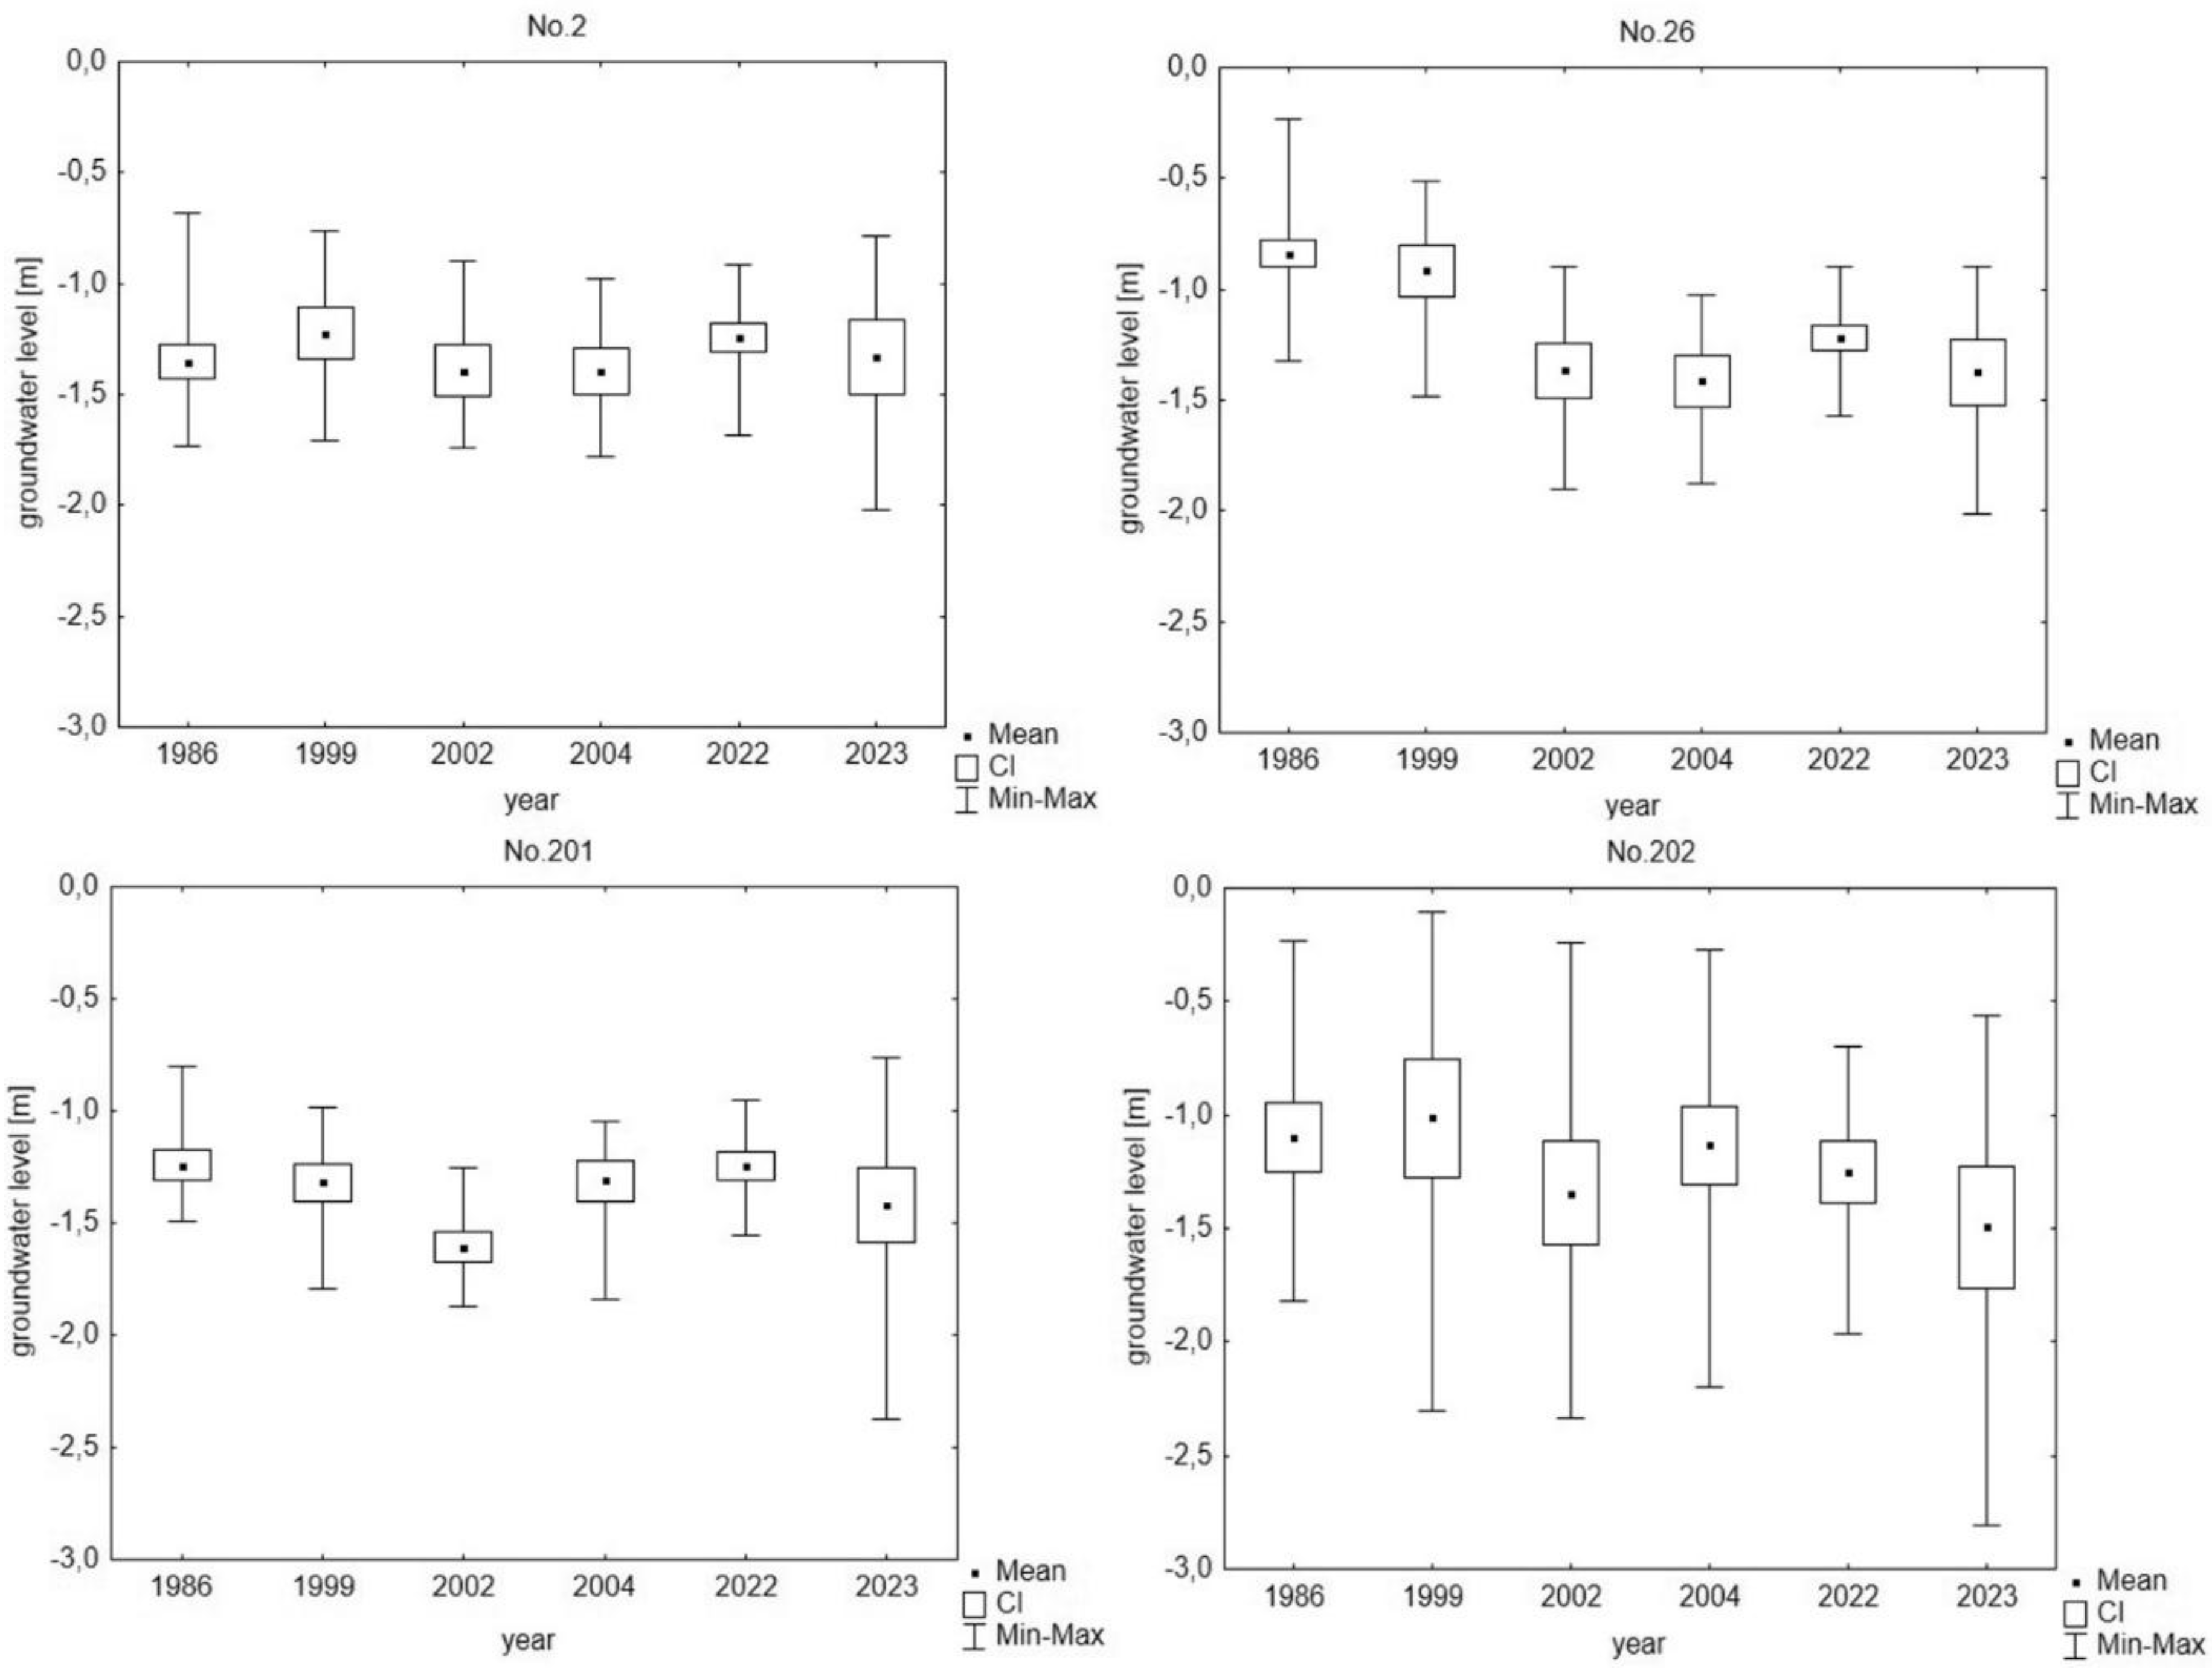
Figure 10.
Block diagrams of groundwater in 2fresh habitats in selected years.
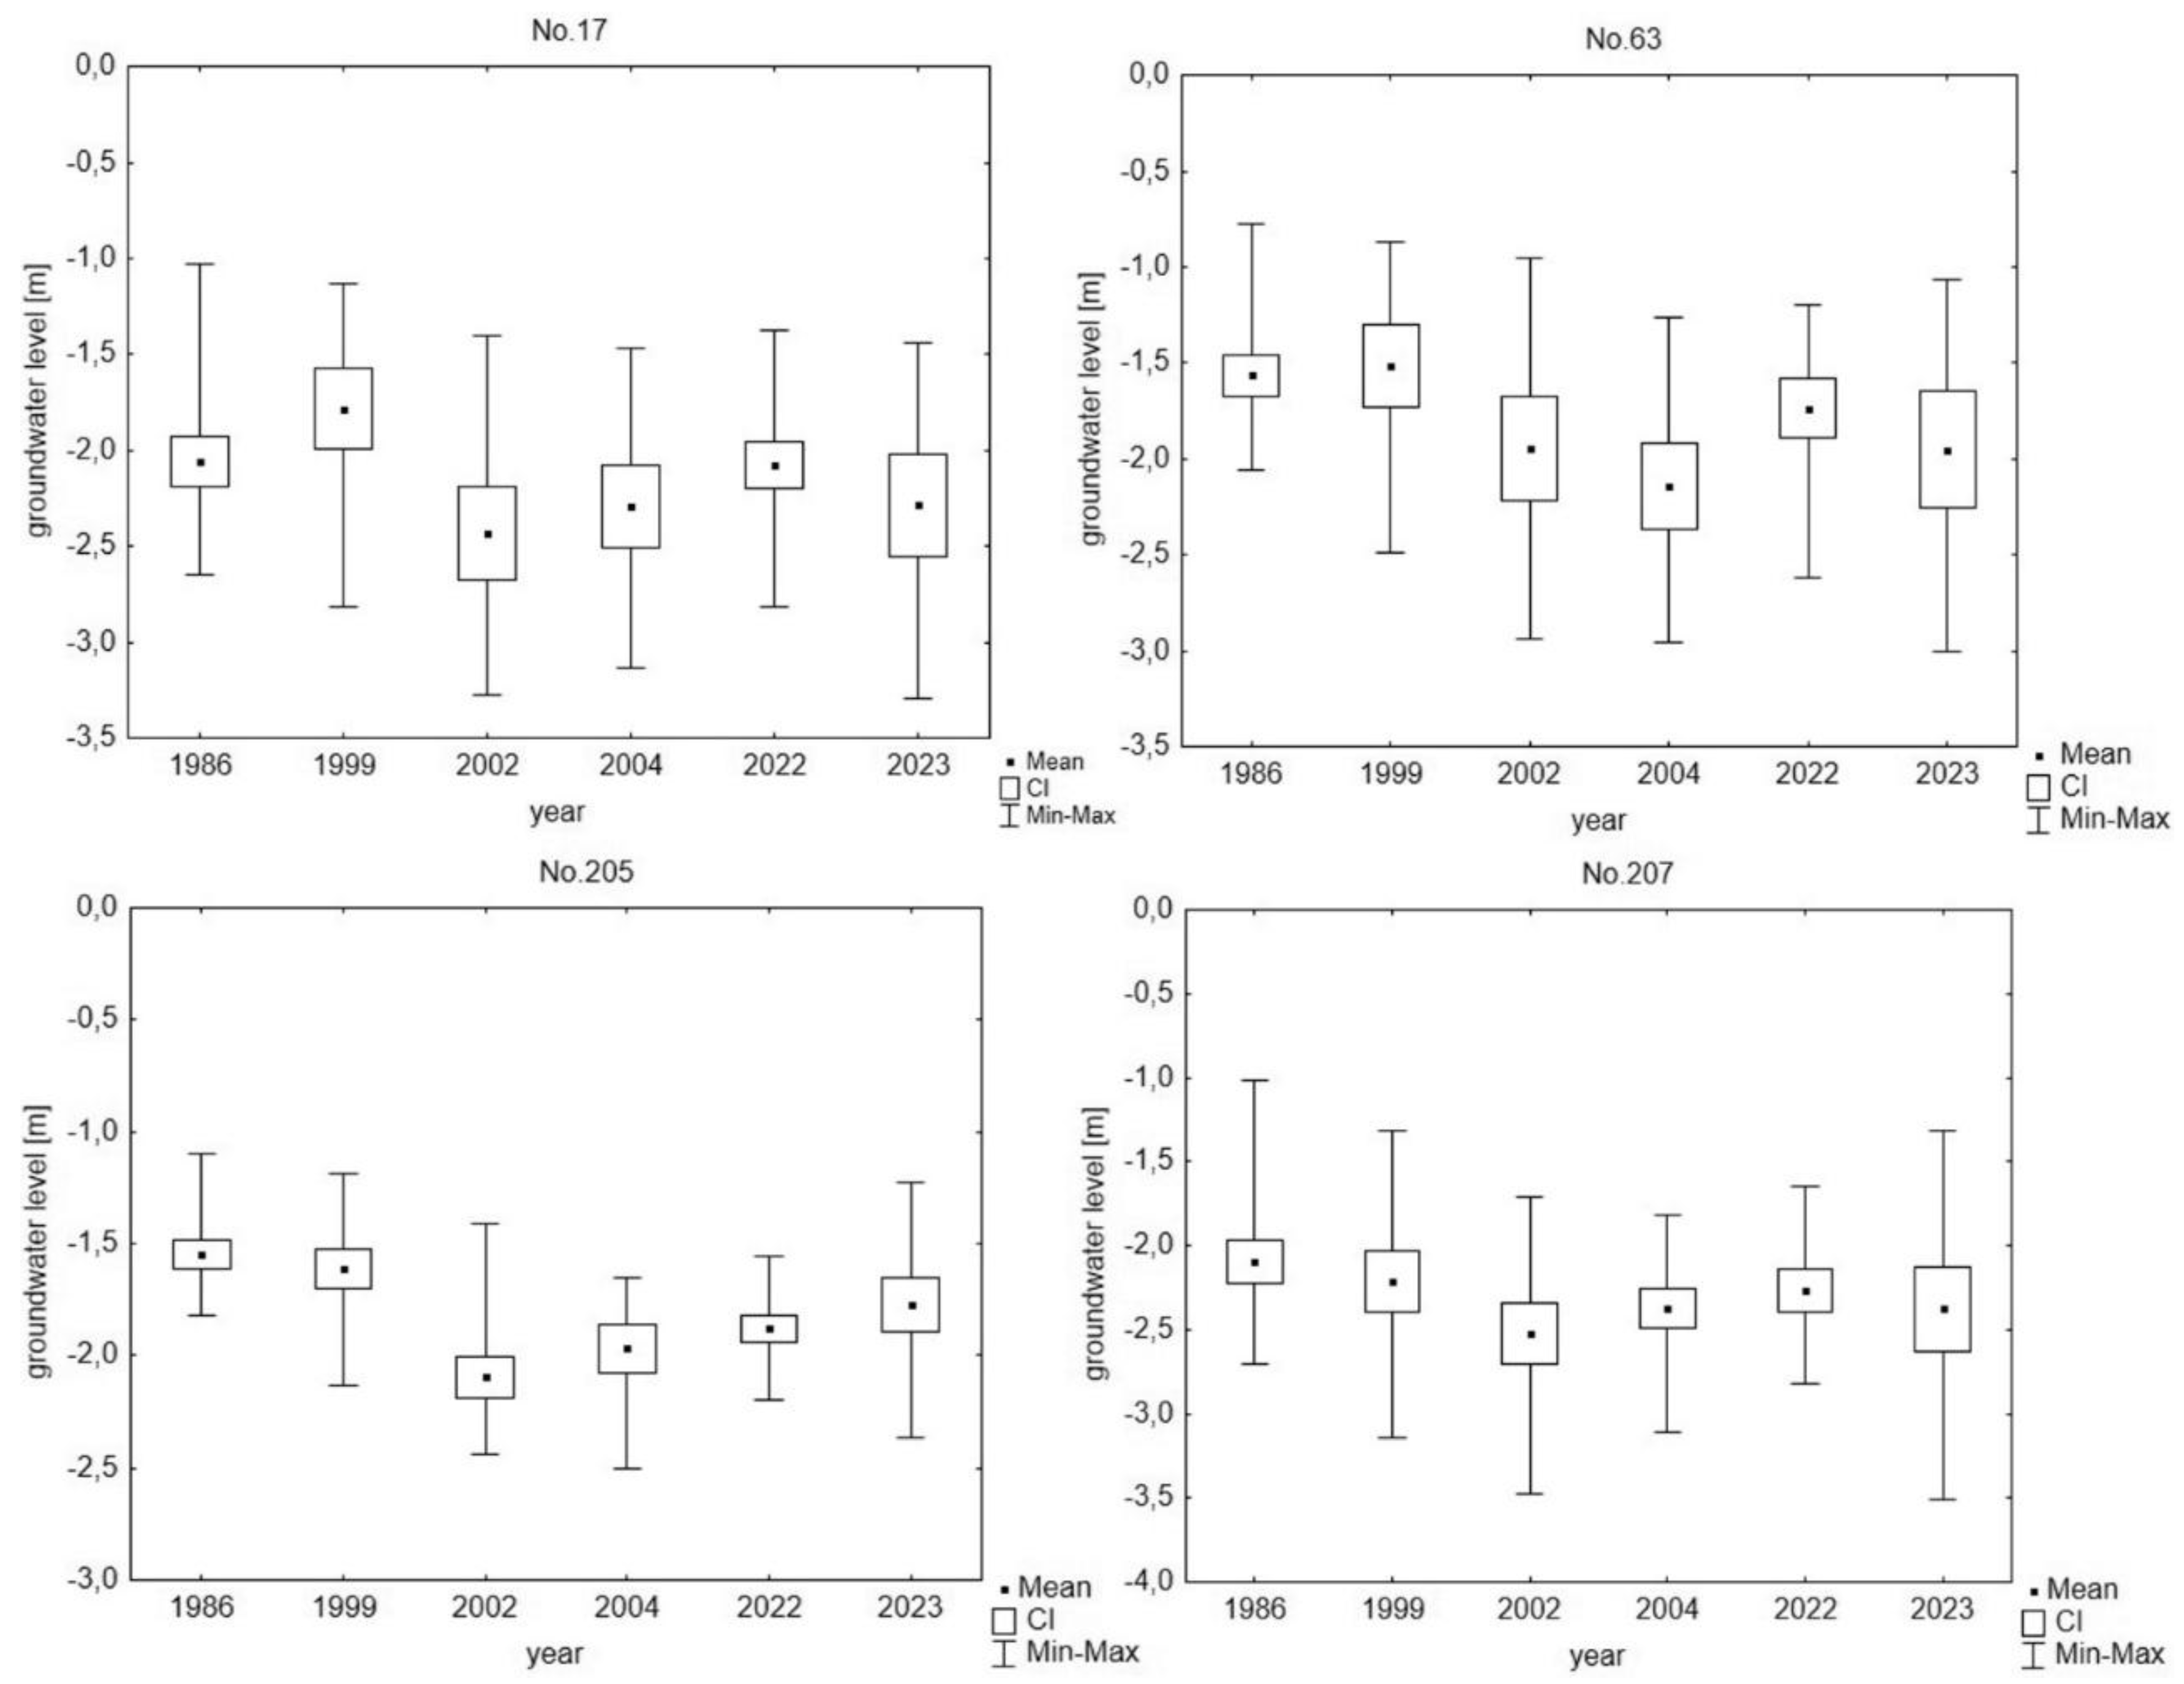
Figure 11.
Block diagrams of groundwater in 1fresh habitats in selected years.
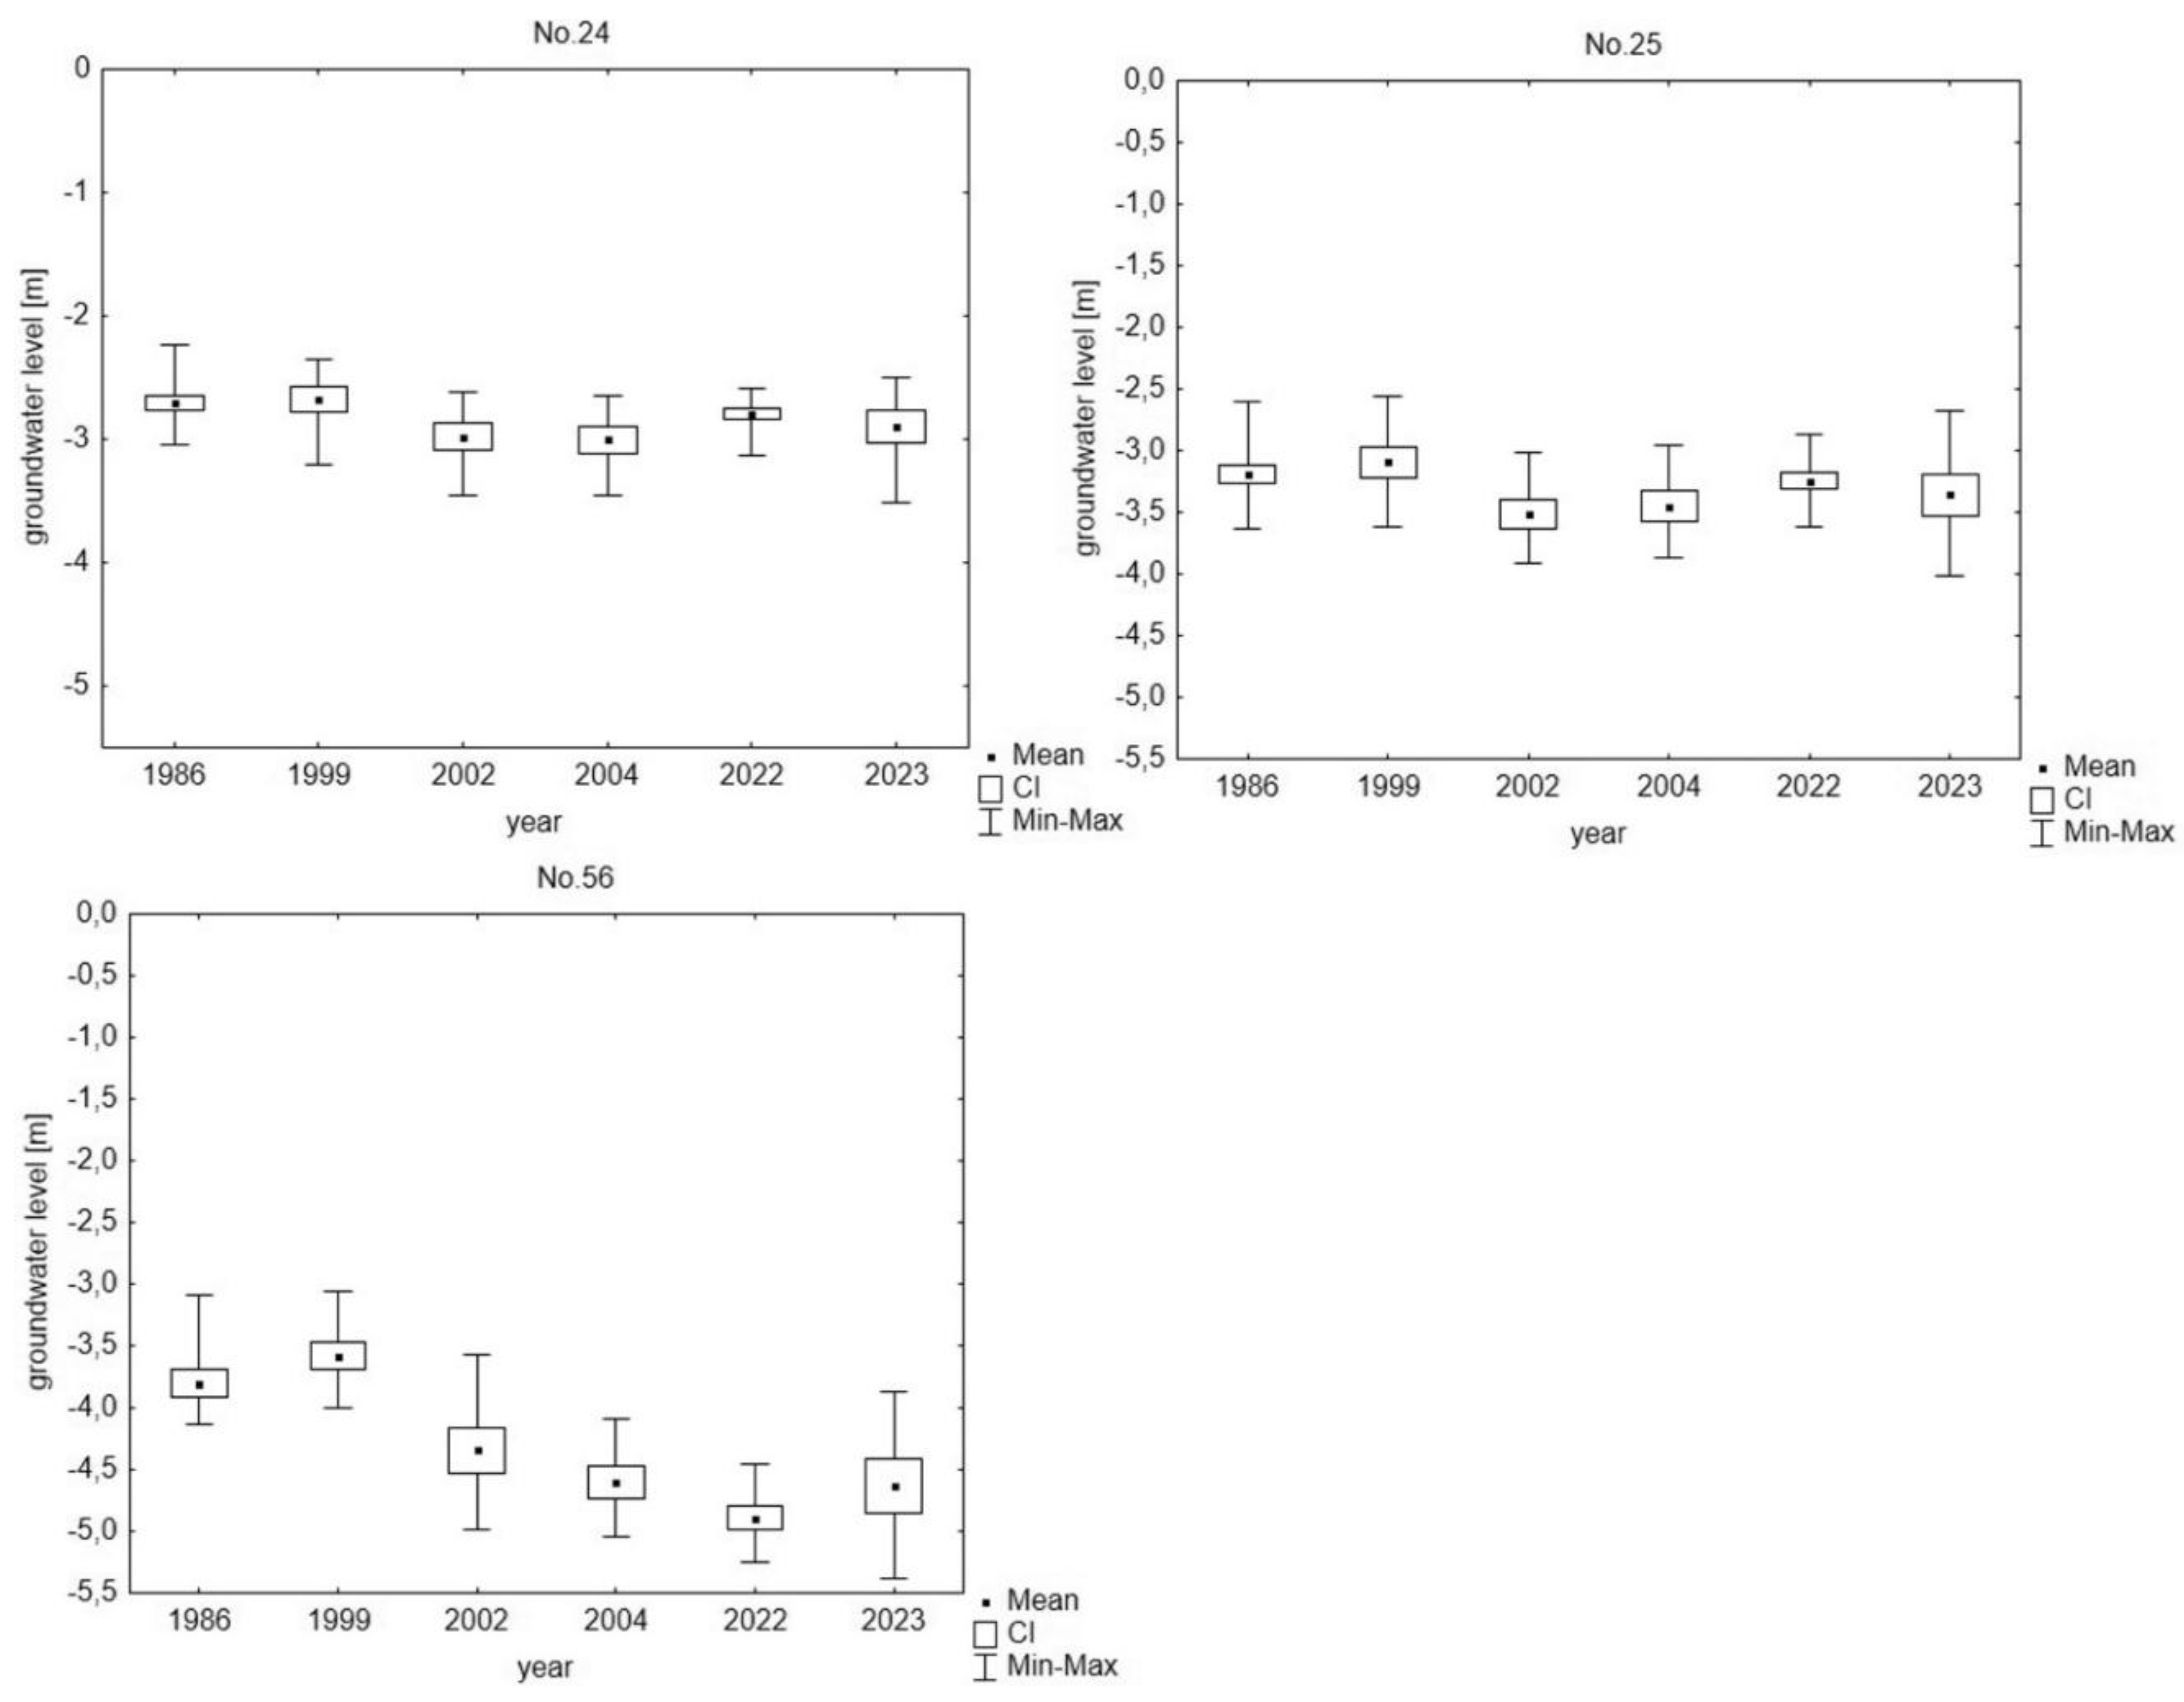

Table 1.
Description of the groundwater monitoring wells.
| Well number | Forest District |
Type of habitat moisture | Measurement interval |
| 2 | Browsk | moist forest (1) | 15 days |
| 4 | Browsk | swamp forest | 15 days |
| 9 | Browsk | swamp forest | 15 days |
| 13a | Browsk | moist forest (2) | 15 days |
| 16 | Browsk | swamp forest | 15 days |
| 17 | Browsk | fresh forest (2) | 15 days |
| 22 | Browsk | moist forest (2) | 15 days |
| 24 | Browsk | fresh forest (1) | 15 days |
| 25 | Browsk | fresh forest (1) | 15 days |
| 26 | Browsk | moist forest (1) | 15 days |
| 55 | Browsk | moist forest (2) | 15 days |
| 56 | Browsk | fresh forest (1) | 15 days |
| 60 | Białowieża NP | swamp forest | 15 days |
| 61 | Białowieża NP | swamp forest | 15 days |
| 62 | Białowieża NP | swamp forest | 15 days |
| 63 | Białowieża NP | fresh forest (2) | 15 days |
| 64 | Białowieża NP | swamp forest | 10-11 days |
| 201 | Białowieża NP | moist forest (1) | 10-11 days |
| 202 | Białowieża NP | moist forest (1) | 10-11 days |
| 205 | Białowieża NP | fresh forest (2) | 10-11 days |
| 207 | Białowieża NP | fresh forest (2) | 10-11 days |
Table 2.
Spring groundwater level [m] in the classification of wetness of forest habitats (without drainage) in Poland.
Table 2.
Spring groundwater level [m] in the classification of wetness of forest habitats (without drainage) in Poland.
| Type of habitat moisture |
1fresh | 2fresh | 1moist | 2moist | swamp |
| Groundwater level | below -2.5 | below -1.8 | -0.8 to -1.8 | -0.5 to -0.8 | to -0.5 |
Table 3.
Difference in precipitation [%} in selected years.
| Period | |||
| Summer half-year | Winter half-year | Hydrological years | |
| 2022-1986 | 0.3 | -2.3 | -1.0 |
| 2022-2002 | 2.7 | -3.2 | -0.3 |
| 2022-2004 | 2.9 | -3.8 | -0.6 |
| 2023-1999 | -14.8 | 18.4 | 2.0 |
Table 4.
Water balance of the Białowieża Forest in selected years [mm]: P – sum of precipitation, I - sum of interception, ETo – actual evapotranspiration, ΔR – retention change.
Table 4.
Water balance of the Białowieża Forest in selected years [mm]: P – sum of precipitation, I - sum of interception, ETo – actual evapotranspiration, ΔR – retention change.
| Year | P | I | ETo | R |
| HYDROLOGICAL YEAR (Nov.-Oct.) | ||||
| 1986 | 645.8 | 256.4 | 314.6 | 74.8 |
| 2002 | 641.4 | 254.5 | 336.3 | 50.6 |
| 2004 | 643.1 | 254.3 | 240.9 | 147.9 |
| 2022 | 639.5 | 251.6 | 312.5 | 75.3 |
| 1999 | 596.6 | 238.0 | 329.1 | 29.5 |
| 2023 | 609.1 | 245.4 | 343.9 | 19.8 |
| WINTER HALF-YEAR (Nov.-April) | ||||
| 1986 | 246.5 | 101.8 | 64.3 | 80.4 |
| 2002 | 252.1 | 106.8 | 63 | 82.3 |
| 2004 | 254.5 | 103.2 | 62.5 | 88.8 |
| 2022 | 239.3 | 103.0 | 62.6 | 73.7 |
| 1999 | 252.2 | 105.1 | 57.1 | 90.0 |
| 2023 | 309.1 | 127.9 | 63.8 | 117.4 |
| SUMMER HALF-YEAR (May-Oct.) | ||||
| 1986 | 399.3 | 154.7 | 250.3 | -5.7 |
| 2002 | 389.3 | 147.7 | 273.3 | -31.7 |
| 2004 | 388.6 | 151.1 | 178.3 | 59.2 |
| 2022 | 400.2 | 148.7 | 250.0 | 1.5 |
| 1999 | 344.4 | 133.0 | 272.0 | -60.6 |
| 2023 | 300.0 | 117.4 | 280.1 | -97.5 |
Table 5.
Summary of the Mann-Kendall test and the Sen's slope estimate for the groundwater levels of the hydrological years.
Table 5.
Summary of the Mann-Kendall test and the Sen's slope estimate for the groundwater levels of the hydrological years.
| Well number | First year | Last Year | Mann-Kendall | Sen's slope estimate | Groundwater level | Change in period | Difference | |||||||
| calculated | real | calculated | predicted | real | calculated | predicted | real | real-predicted | ||||||
| Test Z | Signific.a) | 1985 | 1985 | 2005 | 2023 | 2023 | 2005-1985 | 2023-1985 | 2023-1985 | 2023 | ||||
| 4 | 1985 | 2005 | -2.14 | * | f(year)=-0.01854*(year-1985)-0.03937 | -0.04 | -0.11 | -0.41 | -0.74 | -0.36 | -0.37 | -0.70 | -0.25 | 0.38 |
| 9 | 1985 | 2005 | -0.91 | f(year)=-0.01326*(year-1985)-0.56055 | -0.56 | -0.48 | -0.83 | -1.06 | -0.59 | -0.27 | -0.50 | -0.11 | 0.47 | |
| 16 | 1985 | 2004 | -0.91 | f(year)=-0.00418*(year-1985)-0.34122 | -0.34 | -0.41 | -0.42 | -0.50 | -0.58 | -0.08 | -0.16 | -0.17 | -0.08 | |
| 60 | 1985 | 2005 | -0.15 | f(year)=-0.00094*(year-1985)-0.13289 | -0.13 | -0.08 | -0.15 | -0.17 | -0.17 | -0.02 | -0.04 | -0.09 | 0.00 | |
| 61 | 1985 | 2005 | -1.12 | f(year)=-0.00368*(year-1985)-0.25608 | -0.26 | -0.17 | -0.33 | -0.40 | -0.41 | -0.07 | -0.14 | -0.24 | -0.02 | |
| 62 | 1985 | 2005 | -3.35 | *** | f(year)=-0.01103*(year-1985)-0.34451 | -0.34 | -0.37 | -0.57 | -0.76 | -0.60 | -0.22 | -0.42 | -0.23 | 0.16 |
| 64 | 1985 | 2005 | -1.63 | f(year)=0.00854*(year-1985)-0.00292 | 0.00 | 0.00 | -0.17 | -0.33 | -0.27 | -0.17 | -0.32 | -0.27 | 0.06 | |
| average swamp forests | -0.24 | -0.23 | -0.41 | -0.57 | -0.43 | -0.17 | -0.33 | -0.19 | 0.14 | |||||
| 13a | 1985 | 2005 | -2.24 | * | f(year)=-0.01165*(year-1985)-0.67641 | -0.68 | -0.72 | -0.91 | -1.12 | -0.95 | -0.23 | -0.44 | -0.23 | 0.17 |
| 22 | 1985 | 2005 | -1.81 | + | f(year)=-0.01039*(year-1985)-0.95928 | -0.96 | -1.05 | -1.17 | -1.35 | -1.03 | -0.21 | -0.39 | 0.02 | 0.32 |
| 55 | 1985 | 2005 | -1.87 | + | f(year)=-0.1261*(year-1985)-0.70957 | -0.71 | -0.76 | -0.96 | -1.19 | -1.45 | -0.25 | -0.48 | -0.69 | -0.26 |
| average moist (2) forests | -0.78 | -0.84 | -1.01 | -1.22 | -1.14 | -0.23 | -0.44 | -0.30 | 0.08 | |||||
| 2 | 1985 | 2005 | -0.85 | f(year)=-0.0043*(year-1985)-1.30658 | -1.31 | -1.44 | -1.39 | -1.47 | -1.33 | -0.09 | -0.16 | 0.11 | 0.14 | |
| 26 | 1985 | 2005 | -3.17 | ** | f(year)=-0.02913*(year-1985)-0.8811 | -0.88 | -0.96 | -1.46 | -1.99 | -1.37 | -0.58 | -1.11 | -0.41 | 0.61 |
| 201 | 1985 | 2005 | -1.18 | f(year)=-0.01207*(year-1985)-1.30237 | -1.30 | -1.53 | -1.54 | -1.76 | -1.42 | -0.24 | -0.46 | 0.11 | 0.34 | |
| 202 | 1985 | 2005 | -0.57 | f(year)=-0.00898*(year-1985)-1.17959 | -1.18 | -1.39 | -1.36 | -1.52 | -1.49 | -0.18 | -0.34 | -0.11 | 0.03 | |
| average moist (1) forests | -1.17 | -1.33 | -1.44 | -1.68 | -1.40 | -0.27 | -0.52 | -0.07 | 0.28 | |||||
| average moist forests | -1.00 | -1.12 | -1.26 | -1.49 | -1.29 | -0.25 | -0.48 | -0.17 | 0.19 | |||||
| 17 | 1985 | 2005 | -2.24 | * | f(year)=-0.03164*(year-1985)-1.83352 | -1.83 | -2.16 | -2.47 | -3.04 | -2.29 | -0.63 | -1.20 | -0.13 | 0.75 |
| 63 | 1985 | 2005 | -2.69 | ** | f(year)=-0.02221*(year-1985)-1.56868 | -1.57 | -1.80 | -2.01 | -2.41 | -1.95 | -0.44 | -0.84 | -0.16 | 0.46 |
| 205 | 1985 | 2005 | -2.26 | * | f(year)=-0.00210*(year-1985)-1.60989 | -1.61 | -1.93 | -2.03 | -2.41 | -1.77 | -0.42 | -0.80 | 0.16 | 0.64 |
| 207 | 1985 | 2005 | -2.81 | ** | f(year)=-0.02011*(year-1985)-2.175667 | -2.18 | -2.34 | -2.58 | -2.94 | -2.38 | -0.40 | -0.76 | -0.04 | 0.56 |
| average fresh (2) forests | -1.80 | -2.05 | -2.27 | -2.70 | -2.10 | -0.47 | -0.90 | -0.04 | 0.60 | |||||
| 24 | 1985 | 2005 | -2.36 | * | f(year)=-0.01321*(year-1985)-2.75367 | -2.75 | -2.83 | -3.02 | -3.26 | -2.89 | -0.26 | -0.50 | -0.07 | 0.36 |
| 25 | 1985 | 2005 | -2.42 | * | f(year)=-0.01509*(year-1985)-3.16782 | -3.17 | -3.34 | -3.47 | -3.74 | -3.35 | -0.30 | -0.57 | -0.01 | 0.39 |
| 56 | 1985 | 2005 | -2.57 | * | f(year)=-0.029557*(year-1985)-3.70479 | -3.70 | -4.11 | -4.30 | -4.83 | -4.63 | -0.59 | -1.12 | -0.52 | 0.20 |
| average fresh (1) forests | -3.21 | -3.43 | -3.59 | -3.94 | -3.63 | -0.39 | -0.73 | -0.20 | 0.32 | |||||
| average fresh forests | -2.40 | -2.64 | -2.84 | -3.23 | -2.75 | -0.44 | -0.83 | -0.11 | 0.48 | |||||
Table 6.
Summary of the Mann-Kendall test and the Sen slope estimate for the groundwater level values in the winter half-year (Nov.-April)).
Table 6.
Summary of the Mann-Kendall test and the Sen slope estimate for the groundwater level values in the winter half-year (Nov.-April)).
| Well number | First year | Last Year | Mann-Kendall | Sen's slope estimate | Groundwater level | Change in period | Difference | |||||||
| calculated | real | calculated | predicted | real | calculated | predicted | real | real-predicted | ||||||
| Test Z | Signific.a) | 1985 | 1985 | 2005 | 2023 | 2023 | 2005-1985 | 2023-1985 | 2023-1985 | 2023 | ||||
| 4 | 1985 | 2005 | -1.9024 | + | f(year)=-0.01556*(year-1985)+0.034898 | 0.03 | -0.21 | -0.28 | -0.56 | -0.07 | -0,31 | -0,59 | 0,14 | 0,49 |
| 9 | 1985 | 2005 | -1.1173 | f(year)=-0.0118*(year-1985)-0.51727 | -0.52 | -0.57 | -0.75 | -0.97 | -0.39 | -0,24 | -0,45 | 0,17 | 0,57 | |
| 16 | 1985 | 2004 | -0.3573 | f(year)=-0.00269*(year-1985)-0.2826 | -0.28 | -0.40 | -0.34 | -0.38 | -0.37 | -0,05 | -0,10 | 0,03 | 0,02 | |
| 60 | 1985 | 2005 | 0.0908 | f(year)=-0.000222*(year-1985)-0.03778 | -0.04 | -0.02 | -0.03 | -0.03 | 0.05 | 0,00 | 0,01 | 0,07 | 0,08 | |
| 61 | 1985 | 2005 | -1.2381 | f(year)=-0.00698*(year-1985)-0.06333 | -0.06 | -0.07 | -0.20 | -0.33 | -0.02 | -0,14 | -0,27 | 0,04 | 0,30 | |
| 62 | 1985 | 2005 | -2.3877 | * | f(year)=-0.00829*(year-1985)-0.25057 | -0.25 | -0.39 | -0.42 | -0.57 | -0.35 | -0,17 | -0,32 | 0,05 | 0,22 |
| 64 | 1985 | 2005 | -1.842 | + | f(year)=-0.00914*(year-1985)+0.148286 | 0.15 | 0.07 | -0.03 | -0.20 | 0.04 | -0,18 | -0,35 | -0,02 | 0,24 |
| average swamp forests | -0.14 | -0.23 | -0.29 | -0.43 | -0.16 | -0.16 | -0.29 | 0.07 | 0.28 | |||||
| 13 | 1985 | 2005 | -1.842 | + | f(year)=-0.01062*(year-1985)-0.58799 | -0.59 | -0.77 | -0.80 | -0.99 | -0.63 | -0,21 | -0,40 | 0,14 | 0,36 |
| 22 | 1985 | 2005 | -0.7251 | f(year)=-0.00645*(year-1985)-0.88774 | -0.89 | -1.11 | -1.02 | -1.13 | -0.80 | -0,13 | -0,24 | 0,31 | 0,33 | |
| 55 | 1985 | 2005 | -1.1173 | f(year)=-0.01147*(year-1985)-0.5875 | -0.59 | -0.90 | -0.82 | -1.02 | -1.25 | -0,23 | -0,44 | -0,35 | -0,22 | |
| average moist (2) forests | -0.69 | -0.93 | -0.88 | -1.05 | -0.89 | -0.19 | -0.36 | 0.03 | 0.16 | |||||
| 2 | 1985 | 2005 | -0.0906 | f(year)=-0.00253*(year-1985)-1.28456 | -1.28 | -1.50 | -1.34 | -1.38 | -1.07 | -0,05 | -0,10 | 0,44 | 0,31 | |
| 26 | 1985 | 2005 | -2.7479 | ** | f(year)=-0.02839*(year-1985)-0.87656 | -0.88 | -1.13 | -1.44 | -1.96 | -1.20 | -0,57 | -1,08 | -0,07 | 0,75 |
| 201 | 1985 | 2005 | -1.2688 | f(year)=-0.01253*(year-1985)-1.30365 | -1.30 | -1.73 | -1.55 | -1.78 | -1.13 | -0,25 | -0,48 | 0,60 | 0,65 | |
| 202 | 1985 | 2005 | -0.9361 | f(year)=-0.00949*(year-1985)-1.01931 | -1.02 | -1.68 | -1.21 | -1.38 | -1.01 | -0,19 | -0,36 | 0,67 | 0,37 | |
| average moist (1) forests | -1.12 | -1.51 | -1.39 | -1.62 | -1.10 | -0.26 | -0.50 | 0.41 | 0.52 | |||||
| average moist forests | -0.94 | -1.26 | -1.17 | -1.38 | -1.01 | -0.23 | -0.44 | 0.25 | 0.37 | |||||
| 17 | 1985 | 2005 | -2.0232 | * | f(year)=-0.03036*(year-1985)-1.77369 | -1.77 | -2.37 | -2.38 | -2.93 | -1.96 | -0,61 | -1,15 | 0,41 | 0,96 |
| 63 | 1985 | 2005 | -2.2044 | * | f(year)=-0.02407*(year-1985)-1.47875 | -1.48 | -1.99 | -1.96 | -2.39 | -1.57 | -0,48 | -0,91 | 0,41 | 0,82 |
| 205 | 1985 | 2005 | -2.1752 | * | f(year)=-0.02743*(year-1985)-1.61181 | -1.61 | -2.20 | -2.16 | -2.65 | -1.62 | -0,55 | -1,04 | 0,58 | 1,03 |
| 207 | 1985 | 2005 | -1.148 | f(year)=-0.01435*(year-1985)-2.10797 | -2.11 | -2.62 | -2.39 | -2.65 | -1.87 | -0,29 | -0,55 | 0,74 | 0,78 | |
| average fresh (2) forests | -1.74 | -2.29 | -2.22 | -2.66 | -1.76 | -0.48 | -0.91 | 0.54 | 0.90 | |||||
| 24 | 1985 | 2005 | -2.2356 | * | f(year)=-0.01724*(year-1985)-2.71132 | -2.71 | -2.94 | -3.00 | -3.25 | -2.75 | -0,29 | -0,54 | 0,19 | 0,50 |
| 25 | 1985 | 2005 | -2.3856 | * | f(year)=-0.01724*(year-1985)-3.26647 | -3.27 | -3.53 | -3.61 | -3.92 | -3.24 | -0,34 | -0,66 | 0,28 | 0,68 |
| 56 | 1985 | 2005 | -2.0232 | * | f(year)=-0.0278*(year-1985)-3.7528 | -3.75 | -4.26 | -4.31 | -4.81 | -4.54 | -0,56 | -1,06 | -0,28 | 0,27 |
| average fresh (1) forests | -3.24 | -3.58 | -3.64 | -4.00 | -3.51 | -0.40 | -0.75 | 0.07 | 0.49 | |||||
| average fresh forests | -2.39 | -2.84 | -2.83 | -3.23 | -2.51 | -0.44 | -0.84 | 0.33 | 0.72 | |||||
a) significance level *** α = 0.001; ** α = 0.01; * α = 0.05; + α = 0.1; and blank cell α > 0.1.
Table 7.
Summary of the Mann-Kendall test and Sen's slope estimate for the groundwater level values in the summer half-year (May-Oct.).
Table 7.
Summary of the Mann-Kendall test and Sen's slope estimate for the groundwater level values in the summer half-year (May-Oct.).
| Well number | First year | Last Year | Mann-Kendall | Sen's slope estimate | Groundwater level | Change in period | Difference | |||||||
| calculate | real | calculated | predicted | real | calculated | predicted | real | real-predicted | ||||||
| Test Z | Signific.a) | 1985 | 1985 | 2005 | 2023 | 2023 | 2005-1985 | 2023-1985 | 2023-1985 | 2023 | ||||
| 4 | 1985 | 2005 | -2.54 | * | f(year)=-0.026*(year-1985)-0.08571 | -0.09 | -0.02 | -0.61 | -1.07 | -0,66 | -0,52 | -0,99 | -0,64 | 0,42 |
| 9 | 1985 | 2005 | -1.78 | + | f(year)=-0.01969*(year-1985)-0.57198 | -0.57 | -0.40 | -0.97 | -1.32 | -0,80 | -0,39 | -0,75 | -0,39 | 0,52 |
| 16 | 1985 | 2004 | -1.40 | f(year)=-0.00554*(year-1985)-0.40892 | -0.41 | -0.41 | -0.52 | -0.62 | -0,79 | -0,11 | -0,21 | -0,38 | -0,17 | |
| 60 | 1985 | 2005 | -0.27 | f(year)=-0.00244*(year-1985)-0.25678 | -0.26 | -0.14 | -0.31 | -0.35 | -0,39 | -0,05 | -0,09 | -0,25 | -0,04 | |
| 61 | 1985 | 2005 | -0.57 | f(year)=-0.00528*(year-1985)-0.40167 | -0.40 | -0.27 | -0.51 | -0.60 | -0,81 | -0,11 | -0,20 | -0,53 | -0,20 | |
| 62 | 1985 | 2005 | -2.08 | * | f(year)=-0.01246*(year-1985)-0.37875 | -0.38 | -0.35 | -0.63 | -0.85 | -0,85 | -0,25 | -0,47 | -0,50 | 0,00 |
| 64 | 1985 | 2005 | -1.24 | f(year)=-0.00815*(year-1985)-0.07667 | -0.08 | -0.08 | -0.24 | -0.39 | -0,58 | -0,16 | -0,31 | -0,51 | -0,20 | |
| average swamp forests | -0.31 | -0.24 | -0.54 | -0.74 | -0.70 | -0.23 | -0.43 | -0.46 | 0.05 | |||||
| 13a | 1985 | 2005 | -2.26 | * | f(year)=-0.01476(year-1985)-0.77214 | -0.77 | -0.67 | -1.07 | -1.33 | -1,28 | -0,30 | -0,56 | -0,61 | 0,06 |
| 22 | 1985 | 2005 | -1.84 | + | f(year)=-0.01419*(year-1985)-1.02111 | -1.02 | -0.99 | -1.31 | -1.56 | -1,26 | -0,28 | -0,54 | -0,27 | 0,30 |
| 55 | 1985 | 2005 | -1.66 | + | f(year)=-0.01218*(year-1985)-0.87574 | -0.88 | -0.63 | -1.12 | -1.34 | -1,65 | -0,24 | -0,46 | -1,02 | -0,31 |
| average moist (2) forests | -0.89 | -0.76 | -1.16 | -1.41 | -1.40 | -0.27 | -0.52 | -0.63 | 0.01 | |||||
| 2 | 1985 | 2005 | -0.39 | f(year)=-0.00279*(year-1985)-1.4327 | -1.43 | -1.39 | -1.49 | -1.54 | -1,60 | -0,06 | -0,11 | -0,21 | -0,06 | |
| 26 | 1985 | 2005 | -2.93 | ** | f(year)=-0.0251*(year-1985)-0.93406 | -0.93 | -0.80 | -1.44 | -1.89 | -1,55 | -0,50 | -0,95 | -0,75 | 0,34 |
| 201 | 1985 | 2005 | -1.12 | f(year)=-0.01073*(year-1985)-1.325 | -1.33 | -1.33 | -1.54 | -1.73 | -1,71 | -0,21 | -0,41 | -0,38 | 0,02 | |
| 202 | 1985 | 2005 | -0.45 | f(year)=-0.01069*(year-1985)-1.42889 | -1.43 | -1.10 | -1.64 | -1.84 | -1,98 | -0,21 | -0,41 | -0,88 | -0,15 | |
| average moist (1) forests | -1.28 | -1.15 | -1.53 | -1.75 | -1.71 | -0.25 | -0.47 | -0.56 | 0.04 | |||||
| average moist forests | -1.11 | -0.99 | -1.37 | -1.60 | -1.57 | -0.26 | -0.49 | -0.59 | 0.03 | |||||
| 17 | 1985 | 2005 | -2.33 | * | f(year)=-0.028*(year-1985)-1.9525 | -1.95 | -1.95 | -2.51 | -3.02 | -2,61 | -0,56 | -1,06 | -0,66 | 0,41 |
| 63 | 1985 | 2005 | -2.33 | * | f(year)=-0.02673*(year-1985)-1.61925 | -1.62 | -1.62 | -2.15 | -2.64 | -2,33 | -0,53 | -1,02 | -0,71 | 0,31 |
| 205 | 1985 | 2005 | -1.90 | + | f(year)=-0.01701*(year-1985)-1.64333 | -1.64 | -1.66 | -1.98 | -2.29 | -1,92 | -0,34 | -0,65 | -0,26 | 0,37 |
| 207 | 1985 | 2005 | -2.81 | ** | f(year)=-0.03361*(year-1985)-2.25 | -2.25 | -2.05 | -2.92 | -3.53 | -2,88 | -0,67 | -1,28 | -0,83 | 0,65 |
| average fresh (2) forests | -1.87 | -1.82 | -2.39 | -2.87 | -2.43 | -0.53 | -1.00 | -0.61 | 0.43 | |||||
| 24 | 1985 | 2005 | -2.81 | ** | f(year)=-0.01578*(year-1985)-2.75089 | -2.75 | -2.72 | -3.07 | -3.35 | -3,04 | -0,32 | -0,60 | -0,32 | 0,31 |
| 25 | 1985 | 2005 | -1.90 | + | f(year)=-0.00898*(year-1985)-3.18373 | -3.18 | -3.17 | -3.36 | -3.52 | -3,46 | -0,18 | -0,34 | -0,30 | 0,06 |
| 56 | 1985 | 2005 | -2.17 | * | f(year)=-0.02889*(year-1985)-3.74778 | -3.75 | -3.97 | -4.33 | -4.85 | -4,72 | -0,58 | -1,10 | -0,75 | 0,12 |
| average fresh (1) forests | -3.23 | -3.28 | -3.59 | -3.91 | -3.74 | -0.36 | -0.68 | -0.46 | 0.16 | |||||
| average fresh forests | -2.45 | -2.45 | -2.90 | -3.31 | -2.99 | -0.45 | -0.86 | -0.55 | 0.32 | |||||
a) significance level *** α = 0.001; ** α = 0.01; * α = 0.05; + α = 0.1; and blank cell α > 0.1.
Table 8.
Average water levels in the habitat types in selected years.
| Type of habitats | |||||||
| Year | swamp | 2moist | 1moist | all moist | 2fresh | 1fresh | all fresh |
| 1986 | -0.16 | -0.79 | -1.14 | -0.99 | -1.82 | -3.24 | -2.43 |
| 2002 | -0.41 | -0.98 | -1.43 | -1.23 | -2.25 | -3.61 | -2.83 |
| 2004 | -0.38 | -0.97 | -1.31 | -1.17 | -2.19 | -3.68 | -2.83 |
| 2022 | -0.22 | -0.86 | -1.24 | -1.07 | -1.99 | -3.65 | -2.70 |
| 1999 | -0.25 | -0.68 | -1.12 | -0.93 | -1.78 | -3.12 | -2.36 |
| 2023 | -0.43 | -1.14 | -1.40 | -1.29 | -2.10 | -3.63 | -2.75 |
| 2023-1999 | -0.18 | -0.46 | -0.28 | -0.36 | -0.31 | -0.52 | -0.39 |
Disclaimer/Publisher’s Note: The statements, opinions and data contained in all publications are solely those of the individual author(s) and contributor(s) and not of MDPI and/or the editor(s). MDPI and/or the editor(s) disclaim responsibility for any injury to people or property resulting from any ideas, methods, instructions or products referred to in the content. |
© 2025 by the authors. Licensee MDPI, Basel, Switzerland. This article is an open access article distributed under the terms and conditions of the Creative Commons Attribution (CC BY) license (http://creativecommons.org/licenses/by/4.0/).
Copyright: This open access article is published under a Creative Commons CC BY 4.0 license, which permit the free download, distribution, and reuse, provided that the author and preprint are cited in any reuse.


