Submitted:
15 May 2025
Posted:
16 May 2025
Read the latest preprint version here
Abstract
With the intensification of climate change, heatwaves increasingly threaten the well-being of urban residents, yet the complex relationships among heatwaves, environmental factors, and public sentiment remain insufficiently studied. This research employed a multi-source data fusion and multi-level analysis framework, combining GCCM and Bayesian GLMMs to quantitatively analyze the relationships between heatwaves, environment, and sentiment across five major Chinese urban agglomerations over a decade. Results indicate asymmetric bidirectional causality between environmental factors and heatwave indicators, with surface physical properties (especially albedo) exerting the strongest influence; spatial heterogeneity in environmental effects across urban agglomerations; and nonlinear relationships between heatwaves and public sentiment, with negative emotional tendencies generally increasing as heatwaves intensify, showing regional variations. These findings provide new perspectives for understanding urban thermal environment formation mechanisms and their impacts on public mental health, offering significant implications for guiding urban planning and developing climate adaptation strategies.
Keywords:
Heatwave
; Urban Agglomerations
; Emotional Responses
; Causality
1. Introduction
Since the early 21st century, the combined impacts of global warming and rapid urbanization have significantly increased frequency, intensity, and spatial extent of extreme high-temperature events in urban areas, rendering heatwaves one of the most critical environmental challenges globally [1,2]. The World Health Organization (WHO) has recognized high temperatures as among the most severe environmental health threats of the 21st century, emphasizing that prolonged heat exposure can cause systemic physiological damage, including immunosuppression and metabolic disorders [3,4]. The combined effects of elevated temperatures and urbanization have intensified the duration, spatial reach, and extremity of heatwaves [5], posing significant risks to human habitats and public health [6]. The rapid advancement of urbanization has made urban agglomerations the "hotspots" of heatwave events by altering land cover, increasing heat emissions and intensifying the urban heat island effect [7,8,9]. The complex thermal environments and vulnerable socioeconomic structures within these densely populated urban agglomerations further amplify the health risks associated with heatwaves [10,11]. Therefore, investigating the interactions between heatwaves and the urban agglomeration environment, as well as their multidimensional impacts on human health, is of critical importance for developing effective strategies to mitigate the adverse effects of heatwaves.
A substantial body of research has explored the complex interplay between heatwaves and urban environmental factors. These studies encompass both natural environmental variables—such as urban heat island effects, land use change, vegetation cover, hydrological conditions, and topography [7,12,13], and socioeconomic factors, including population density, economic development, and infrastructure distribution [8,14]. The spatial distribution and intensity of heatwaves are shaped by the joint influence of multiple natural and anthropogenic factors across varying spatiotemporal scales, resulting in pronounced spatiotemporal variability [5,15]. Remote sensing technologies, with their extensive spatial coverage, long time series, and high spatiotemporal resolution, have become essential for monitoring, assessing, and elucidating the spatiotemporal dynamics of heatwaves [16,17]. For instance, land surface temperature (LST) data derived from remote sensing imagery are widely used to quantify the spatiotemporal characteristics of heatwaves and to reveal the specific impacts of urbanization on heatwave intensification[18,19]. Vegetation indices (e.g., Fractional Vegetation Cover [FVC], Normalized Difference Vegetation Index [NDVI]) and land use/land cover (LULC) data further facilitate analyses of the relationships among vegetation degradation, land use change, and heatwave exposure [20,21].
However, most existing studies are constrained to a single spatiotemporal section and lack systematic time series analyses, limiting the ability to comprehensively capture the dynamic evolution of heatwaves [11,22]. Research on the mechanisms by which environmental factors influence heatwaves often overlooks issues of multicollinearity and has limited capacity to disentangle multilevel, cross-scale drivers, thereby constraining explanations of the complex origins of heatwave exposure [9,14,23,24]. Geographical Convergent Cross Mapping (GCCM) model, grounded in causal inference theory, quantifies dynamic information flows among variables and effectively detects causal effects in multivariate systems, overcoming the confounding effects of multicollinearity [25]. This enables robust elucidation of the dynamic causality between environmental factors and heatwave evolution. The Bayesian Generalized Linear Mixed Model (Bayesian GLMMs) offers a flexible hierarchical structure to integrate cross-scale and multilevel data [26,27], allowing for multidimensional analysis of the drivers of heatwave exposure risk. The integration of these two methods provides a scientifically rigorous analytical framework for investigating the spatiotemporal dynamics of relationships between heatwave and environment.
In the domain of heatwave impacts on human health, prior research has primarily focused on physiological health outcomes, resulting in a relatively mature theoretical framework [28]. In contrast, studies on the psychological health impacts of heatwaves, particularly on emotional responses, remain limited. Due to the challenges of acquiring large-scale mental health data, most existing studies rely on small-sample surveys or clinical experiments, restricting effective research samples to narrow spatiotemporal scopes and hindering continuous population-level monitoring [29,30]. Moreover, conventional health indicators are inadequate for capturing the temporal dynamics of emotional fluctuations [31]. Consequently, the cross-scale interactive effects between mental health and environmental climate events—especially the temporal lag effects of emotional responses to heatwaves—remain insufficiently explored [32,33], and their underlying mechanisms are not fully understood [11].
Emotional responses constitute a critical dimension of individual and societal adaptation to heatwaves. During heatwave periods, the public may experience heightened negative emotions such as anxiety and depression [30,34,35], which not only affect individual psychological states but can also alter social behaviors and, in turn, influence societal resilience [23,36]. The proliferation of internet and social media platforms has created new avenues for individuals to express opinions and emotions [37]. Social media big data, with its extensive temporal coverage and broad spatial reach, has become an important resource for studying public emotional dynamics in response to both social and environmental stimuli [38]. Leveraging social media big data to investigate emotional responses to heatwave events can effectively address limitations of small sample sizes, short observation periods, and restricted spatial scales in traditional emotion research, providing a promising approach for examining the emotional impacts of heatwaves.
As one of the world’s most populous countries, China faces particularly acute challenges in coping with extreme climate events due to the rapid development and high population density of its urban agglomerations [14]. Understanding the spatiotemporal mechanisms linking heatwaves, urban environmental variables, and emotional responses in Chinese urban agglomerations is essential for optimizing urban spatial structure and developing effective urban management strategies to mitigate the impacts of heatwaves. This study focuses on China’s five major urban agglomerations, aiming to quantify the spatiotemporal heterogeneity of heatwave exposure, analyze dynamic spatiotemporal patterns of public emotional responses using social media data, and elucidate the underlying mechanisms. The main research objectives are: (i) to construct heatwave exposure indicators and environmental factors for urban agglomerations from 2014 to 2023 using remote sensing data, and to employ GCCM to analyze the causality between heatwaves and environmental factors, identifying key environmental drivers; (ii) to apply Bayesian GLMMs to elucidate the driving mechanisms of heatwave exposure risk; and (iii) to construct a dynamic sentiment index based on geotagged Weibo data, and, in combination with modeling, to reveal the association patterns between heatwave events and public emotional fluctuations. This research aims to address gaps in the emotional dimension of heatwave studies, provide new perspectives on the multilevel impacts of extreme heat events, and offer scientific evidence for public health planning and climate adaptation strategies.
2. Data
2.1. Study Area
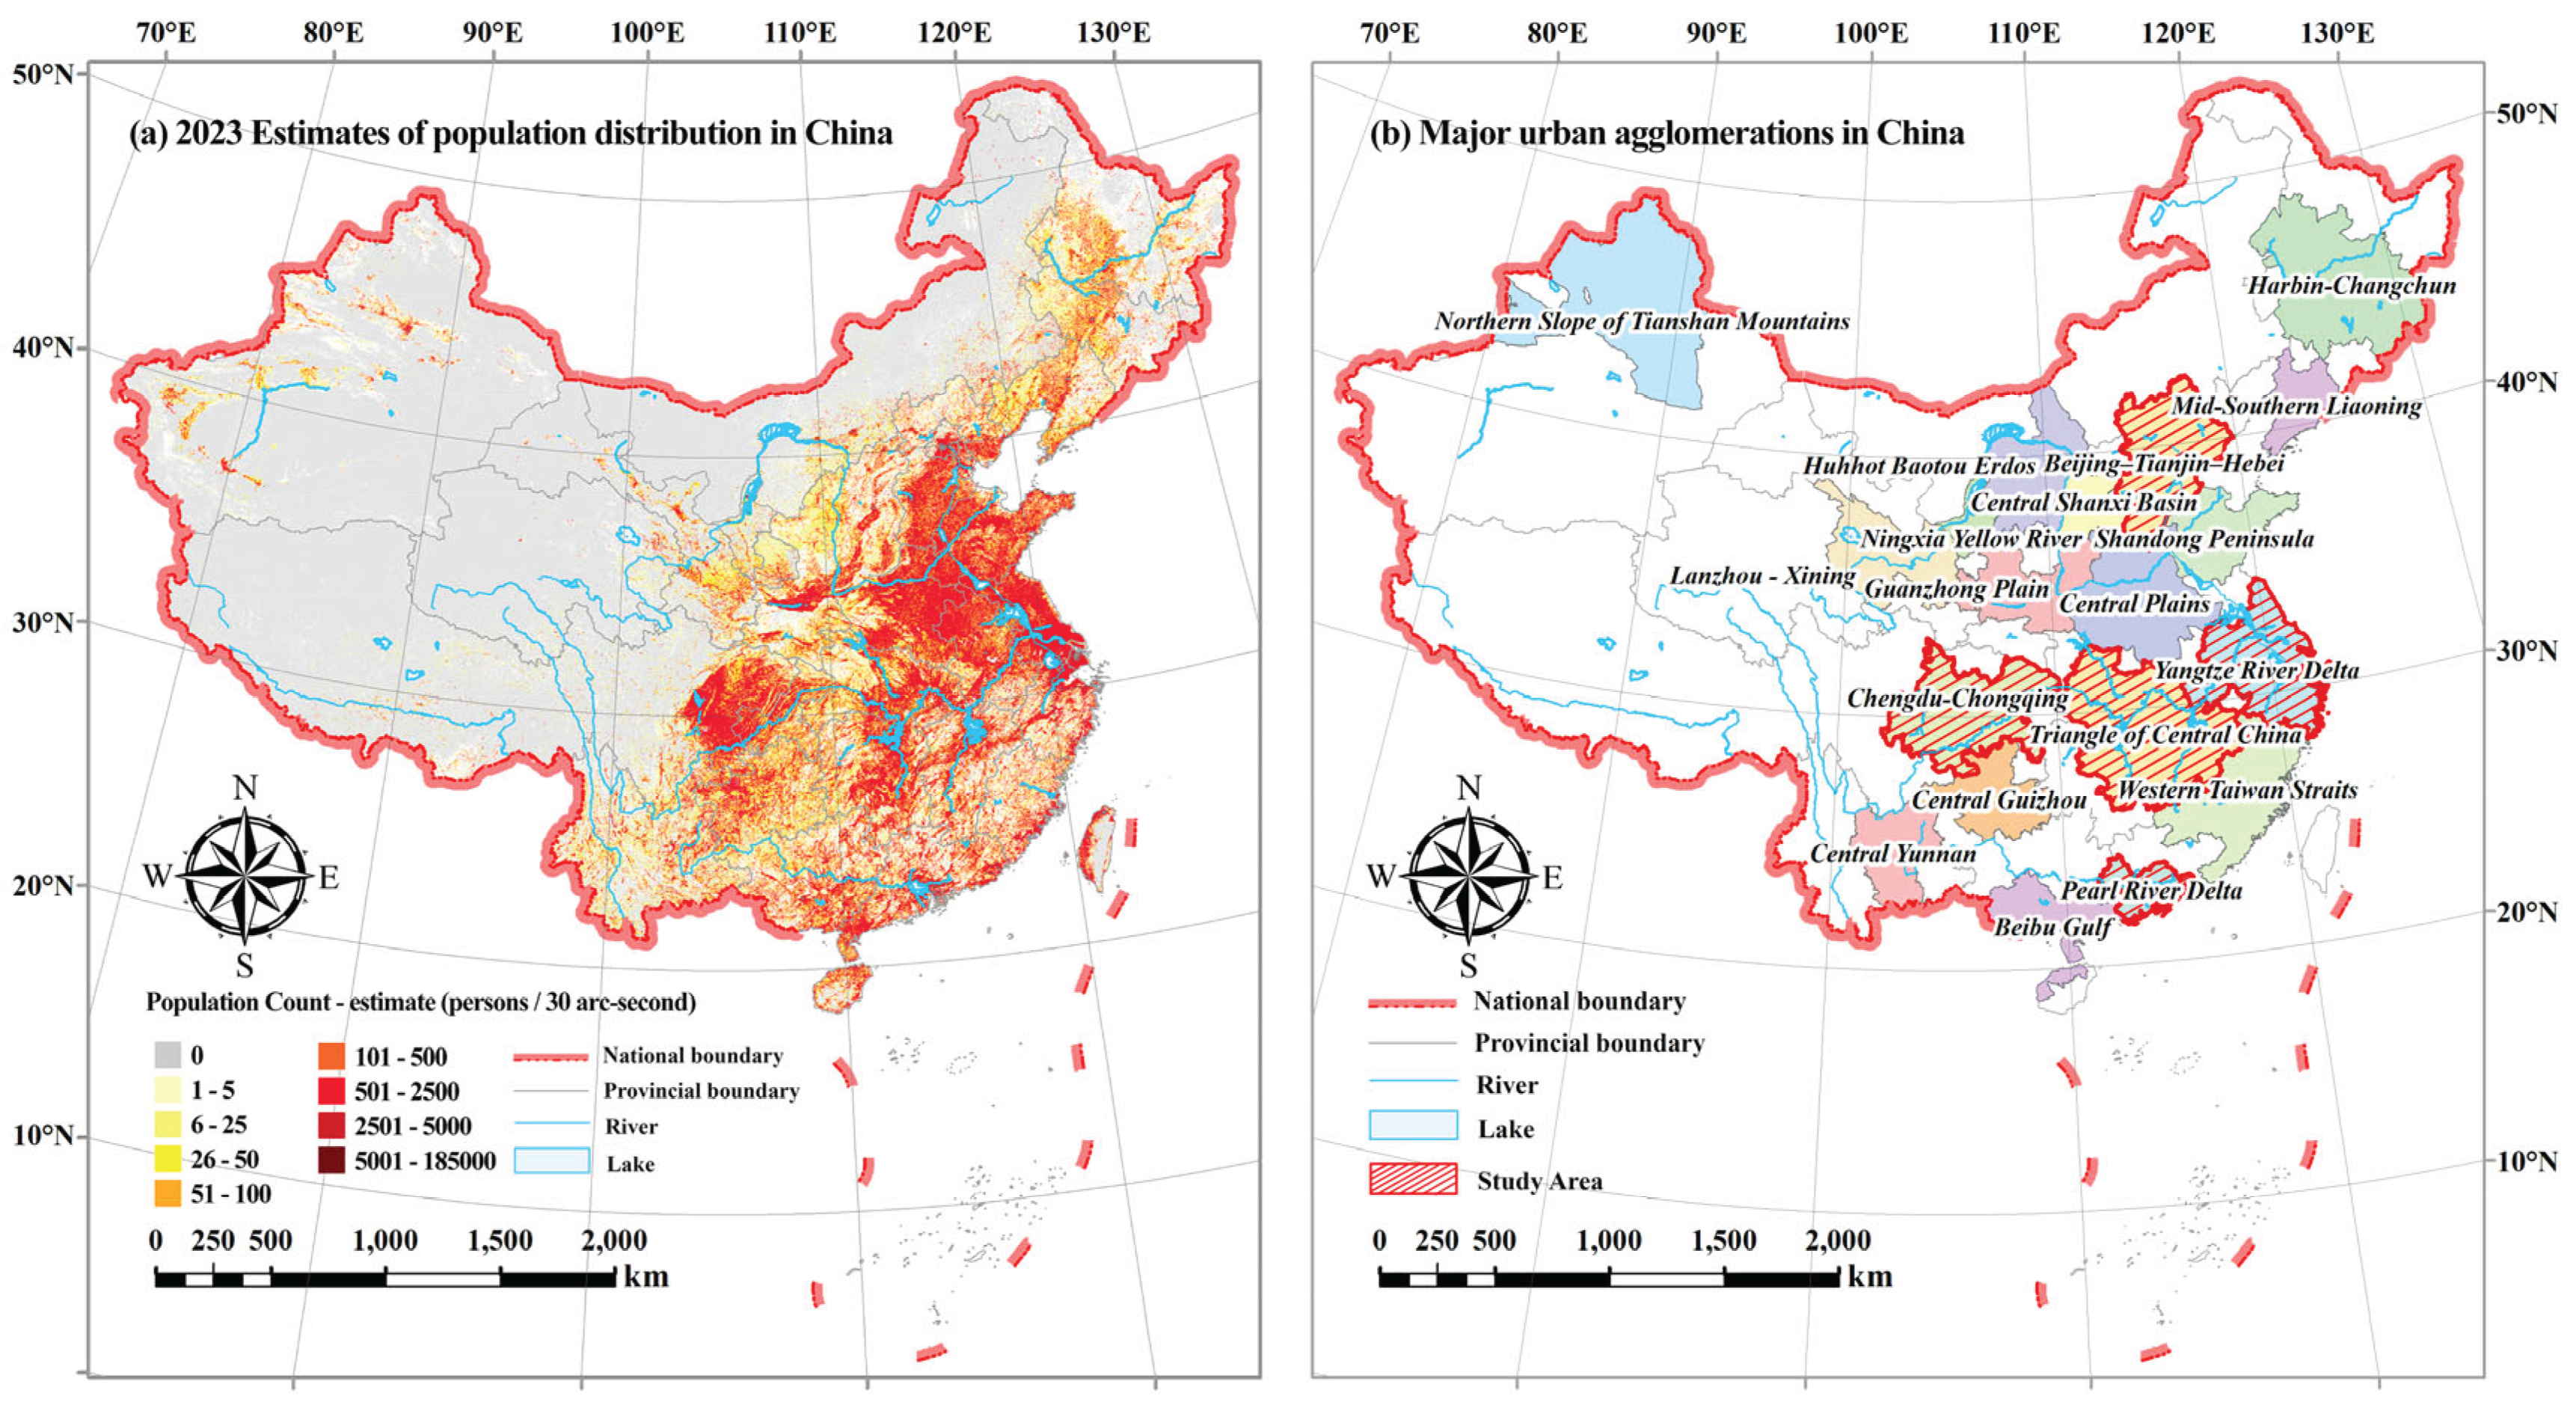
This study focuses on the five major urban agglomerations in China: the Beijing–Tianjin–Hebei Urban Agglomeration (BTHUA), Chengdu–Chongqing Urban Agglomeration (CCUA), Triangle of Central China (TCC), Yangtze River Delta Urban Agglomerations (YRDUA), and Pearl River Delta Urban Agglomeration (PRDUA). These regions represent the most densely populated and economically developed urban clusters in China, occupying a central role in the country’s urbanization strategy [39]. Their geographic diversity and distribution across China’s north-south and east-west axes provide a comprehensive perspective for investigating the spatiotemporal evolution of heatwaves and associated emotional responses.
2.2. Data Sources
The primary datasets used in this study include temperature data, remote sensing data, population data, and social media data, as detailed in Table 1.
2.2.1. Temperature Data
This Research utilized the temperature_2m band from the ERA5-Land dataset provided by the European Centre for Medium-Range Weather Forecasts (ECMWF) [40] to extract heatwave-related indicators. ERA5-Land, derived from the ERA5 reanalysis, offers a globally consistent climate dataset with high spatial resolution (0.1°), providing an accurate representation of temperature variability across China.
Figure 1.
(a) 2023 Estimates of population distribution in China, (b) Major urban agglomerations in China.
Figure 1.
(a) 2023 Estimates of population distribution in China, (b) Major urban agglomerations in China.
2.2.2. Remote Sensing Data
Remote sensing data from MODIS [41], Landsat 8 [42], Copernicus DEM [43], and VNL V2 [44], along with their derived products (Table 1), were used to generate a suite of natural environmental factors, including surface Albedo, Modified Normalized Difference Water Index (MNDWI), Normalized Difference Thermal Index (NDTI), Elevation, Fractional Vegetation Cover (FVC), and Nighttime Light data (NTL). All data processing was conducted on the Google Earth Engine platform.
2.2.3. Population and Administrative Boundary Data
Population distribution data were obtained from the LandScan dataset [45], which provides high-resolution (30 arc-second) global population grids. Figure 1 (a) presents the estimated population distribution of China in 2023 in the LandScan dataset. Administrative boundary data were sourced from the Ministry of Natural Resources of the People’s Republic of China to delineate the spatial extents of the five urban agglomerations.
2.2.4. Social Media Data
Using a Python 3.8-based web crawler, we collected climate change–related posts from core cities within the five urban agglomerations on Sina Weibo (one of China’s most active social media platforms) between 2019 and 2023. After filtering out irrelevant or insufficiently detailed posts, approximately 3.2 million original Weibo entries were retained for sentiment analysis.

Table 1.
Datasets used in this study.
| Datasets | Environmental factors | Time span | Source |
|---|---|---|---|
| ERA5-Land | Temperature | 2014-2023 | https://cds.climate.copernicus.eu |
| Administrative region | 2014-2023 | https://www.mnr.gov.cn/sj/sjfw/ | |
| LandScan | Population | 2014-2023 | https://landscan.ornl.gov |
| MODIS Albedo | Albedo | 2014-2023 | https://lpdaac.usgs.gov/products/mcd43a3v061/ |
| Landsat 8 Collection 2 Tier 1 Raw Scenes | Modified Normalized Difference Water Index (MNDWI)[46] | 2014-2023 | https://www.usgs.gov/land-resources/nli/landsat/landsat-8-data-users-handbook |
| Normalized Difference Thermal Index (NDTI)[47] | |||
| Copernicus DEM | Elevation | 2015 | https://dataspace.copernicus.eu/collections/copernicus-digital-elevation-model |
| MOD13Q1 V6.1 | Fractional Vegetation Cover (FVC) | 2014-2023 | https://lpdaac.usgs.gov/products/mod13q1v061/ |
| VNL V2 | Nighttime lights (NTL) | 2014-2023 | https://eogdata.mines.edu/products/vnl/ |
3. Methods
3.1. Methodological Framework
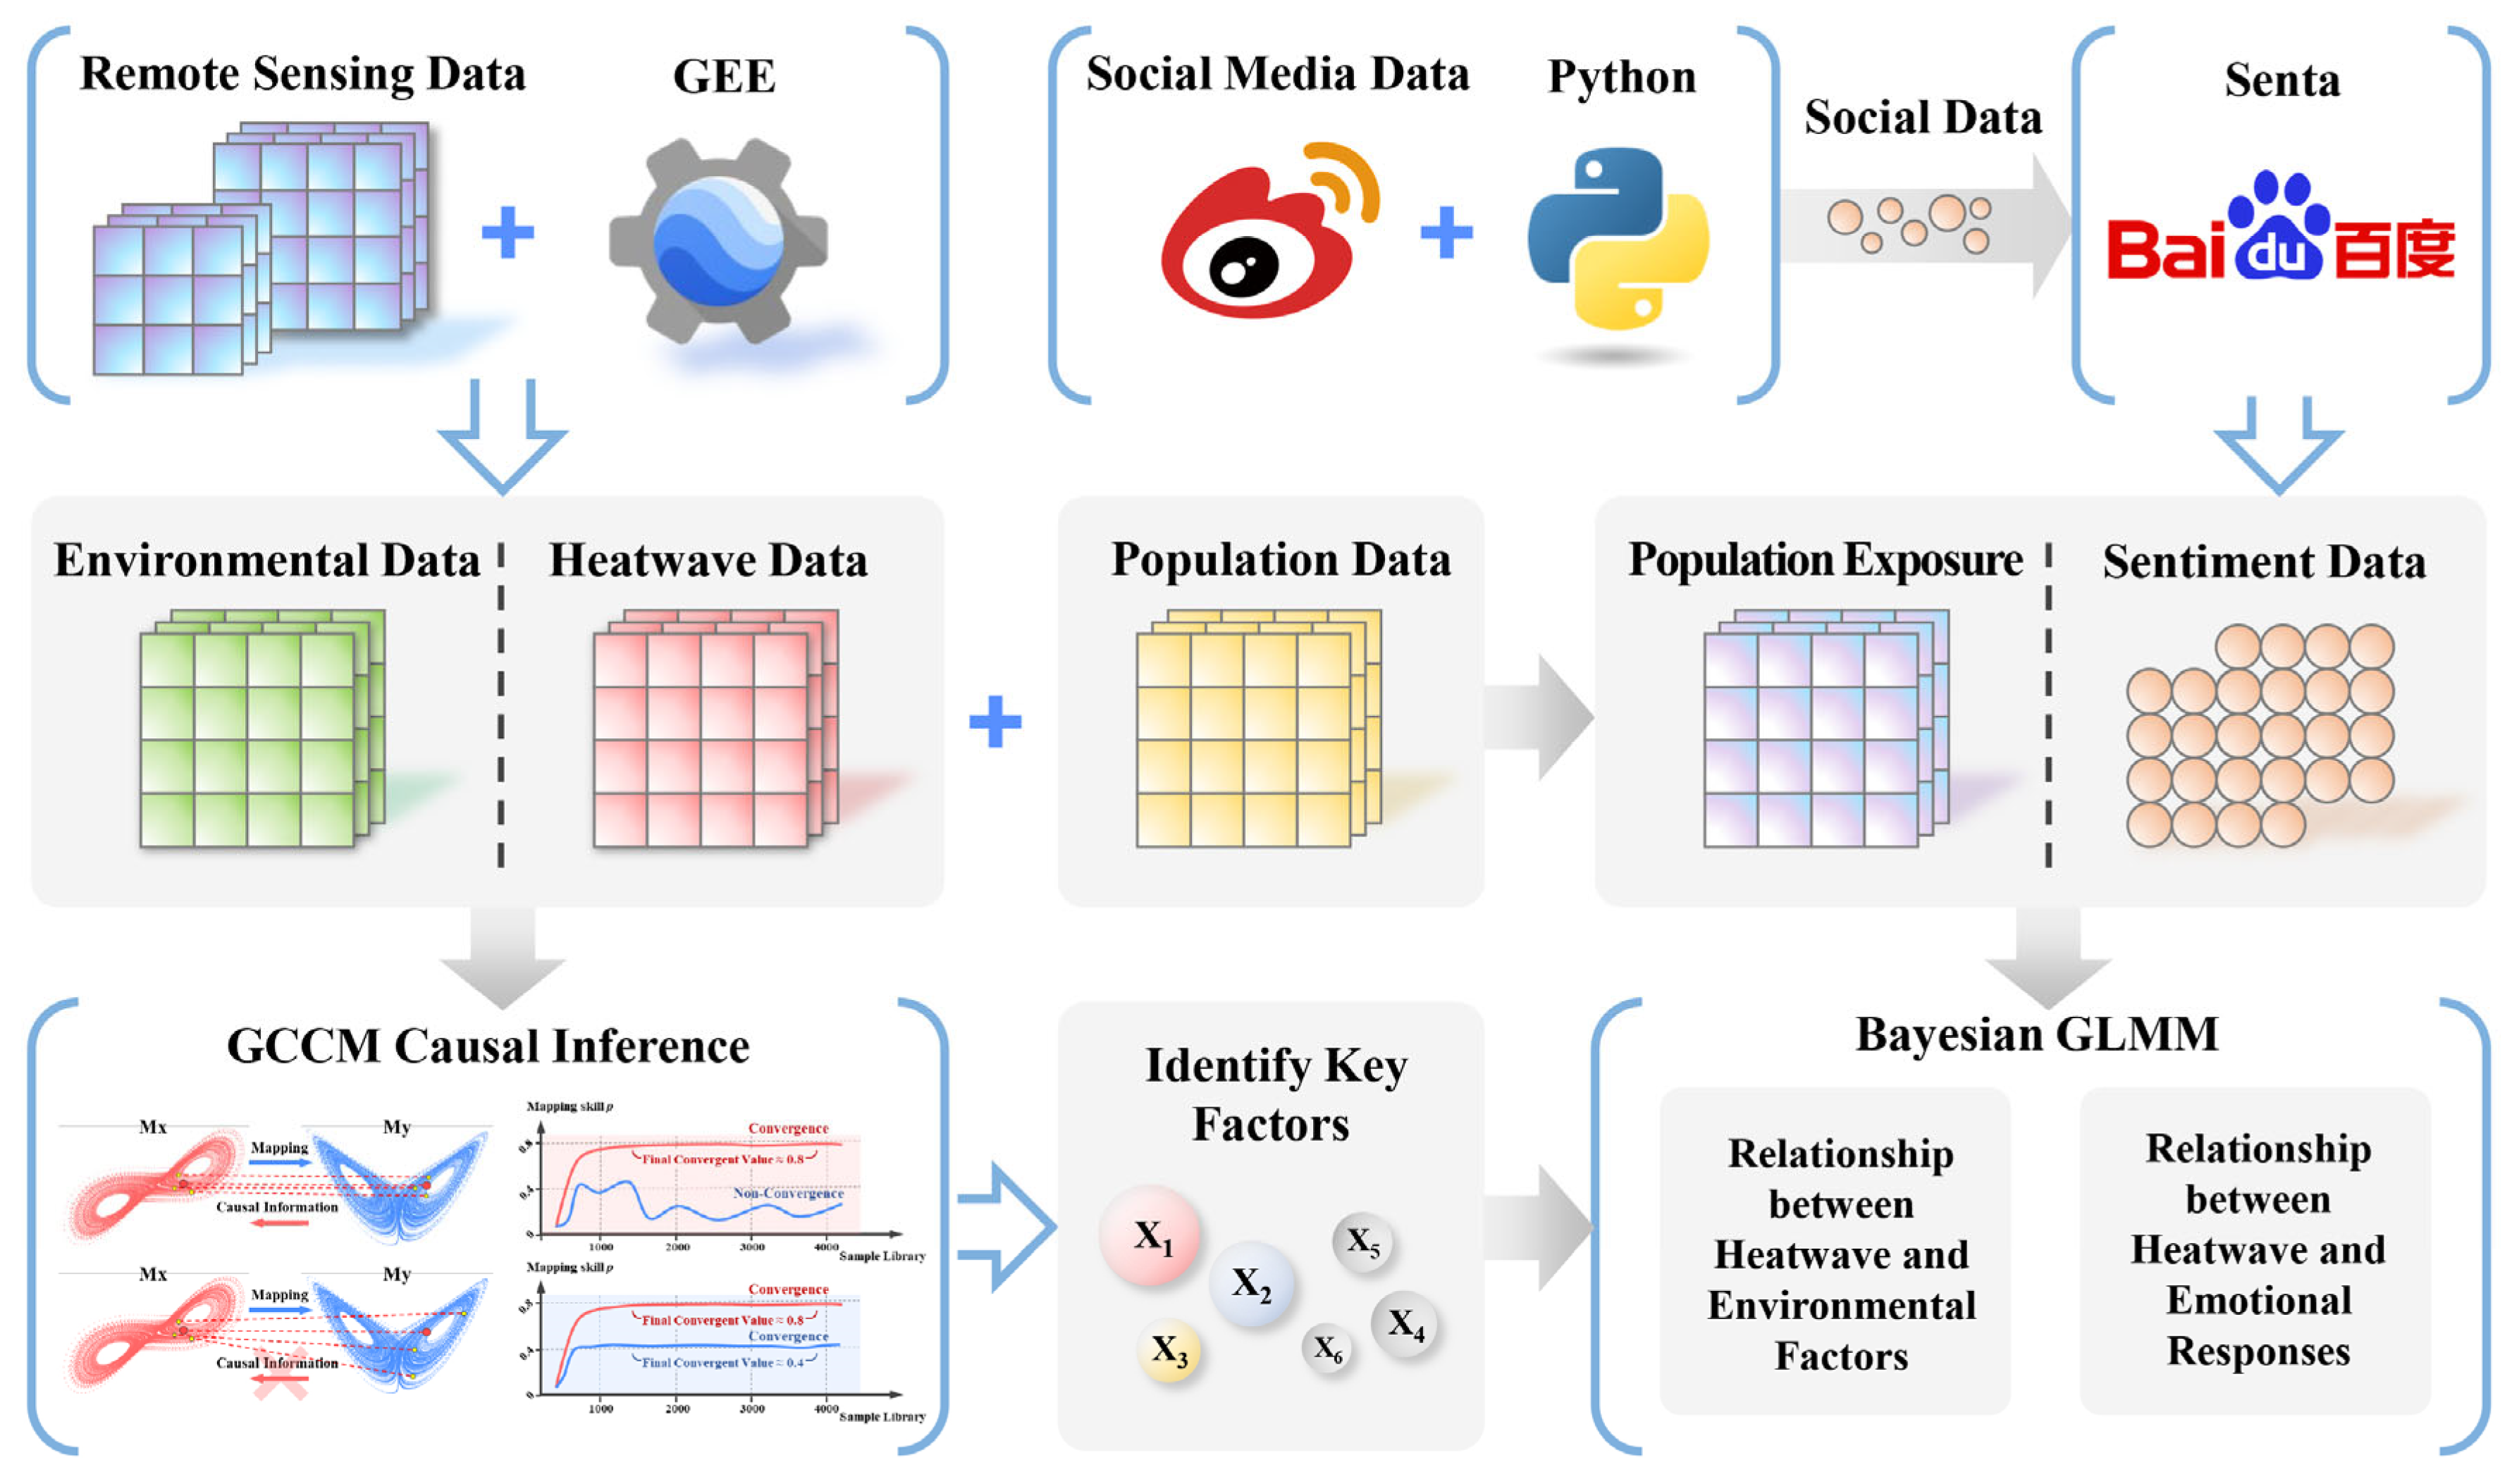
The methodological framework comprises three main steps (Figure 2):
(i) Multi-source remote sensing, meteorological, demographic, and topographic data were processed through the GEE platform to generate environmental factors including FVC and NDTI, as well as heatwave indicators such as intensity, frequency, and duration. Simultaneously, social media data were acquired using Python web crawling techniques, and sentiment indices were constructed based on Baidu's open-source NLP Senta model to quantify public emotional responses to heatwave events.
(ii) Geographic Convergent Cross Mapping (GCCM) was applied to quantitatively assess the bidirectional causality strength between heatwave indicators and environmental factors and their spatiotemporal variation characteristics, thereby identifying causality between environmental factors and heatwave indicators.
(iii) Bayesian Generalized Linear Mixed Model (Bayesian GLMMs) was constructed to integrate heatwave indicators, selected environmental factors, and sentiment indices into a unified analytical framework, exploring the complex interactions and potential moderating effects between heatwaves and environment as well as sentiment, revealing the multilevel spatiotemporal response mechanisms of public sentiment to heatwaves, and providing scientific support for urban thermal environment management and public health protection.
3.2. Heatwave Indicators
3.2.1. Excess Heat Factor (EHF) Calculation
Bulleted lists look like this: The Excess Heat Factor (EHF) [1] was adopted as the primary metric for heatwave events, with several derived indicators to characterize heatwave features. EHF is calculated as follows:
where is the daily mean temperature (average of daily maximum and minimum); is the average temperature of three consecutive days; represents the i-th day of each year, is the 95th percentile value of the daily temperature distribution at a certain location from 1981 to 2010, which is considered as the threshold for extreme high temperatures in this area; is the average temperature of the past 30 days.
Figure 2.
Workflow of this study.
3.2.2. Heatwave Event Definition
In this study, a high temperature weather event is defined as an occurrence where , and a heatwave event is identified when persists for at least three consecutive days [48]. To more comprehensively reflect the severity of heatwave events, multiple heatwave indicators recommended by the WMO Commission for Climatology [49] are adopted. These indicators are widely used to describe the frequency, duration, and intensity of heatwave events.
Furthermore, to further distinguish the severity levels of high-temperature events, is introduced, representing the 85th percentile of all EHF values greater than zero at a given location during 2014–2023, arranged in ascending order, and used as the threshold for moderate heat events. When , the event is defined as a mild heat event (HWday); when , it is defined as a moderate heat event (HWsev); and when , it is defined as a severe heat event (HWex). By accumulating EHF values during heatwave events, the annual total EHF (HWa) is obtained to measure the overall intensity of annual heatwave events.
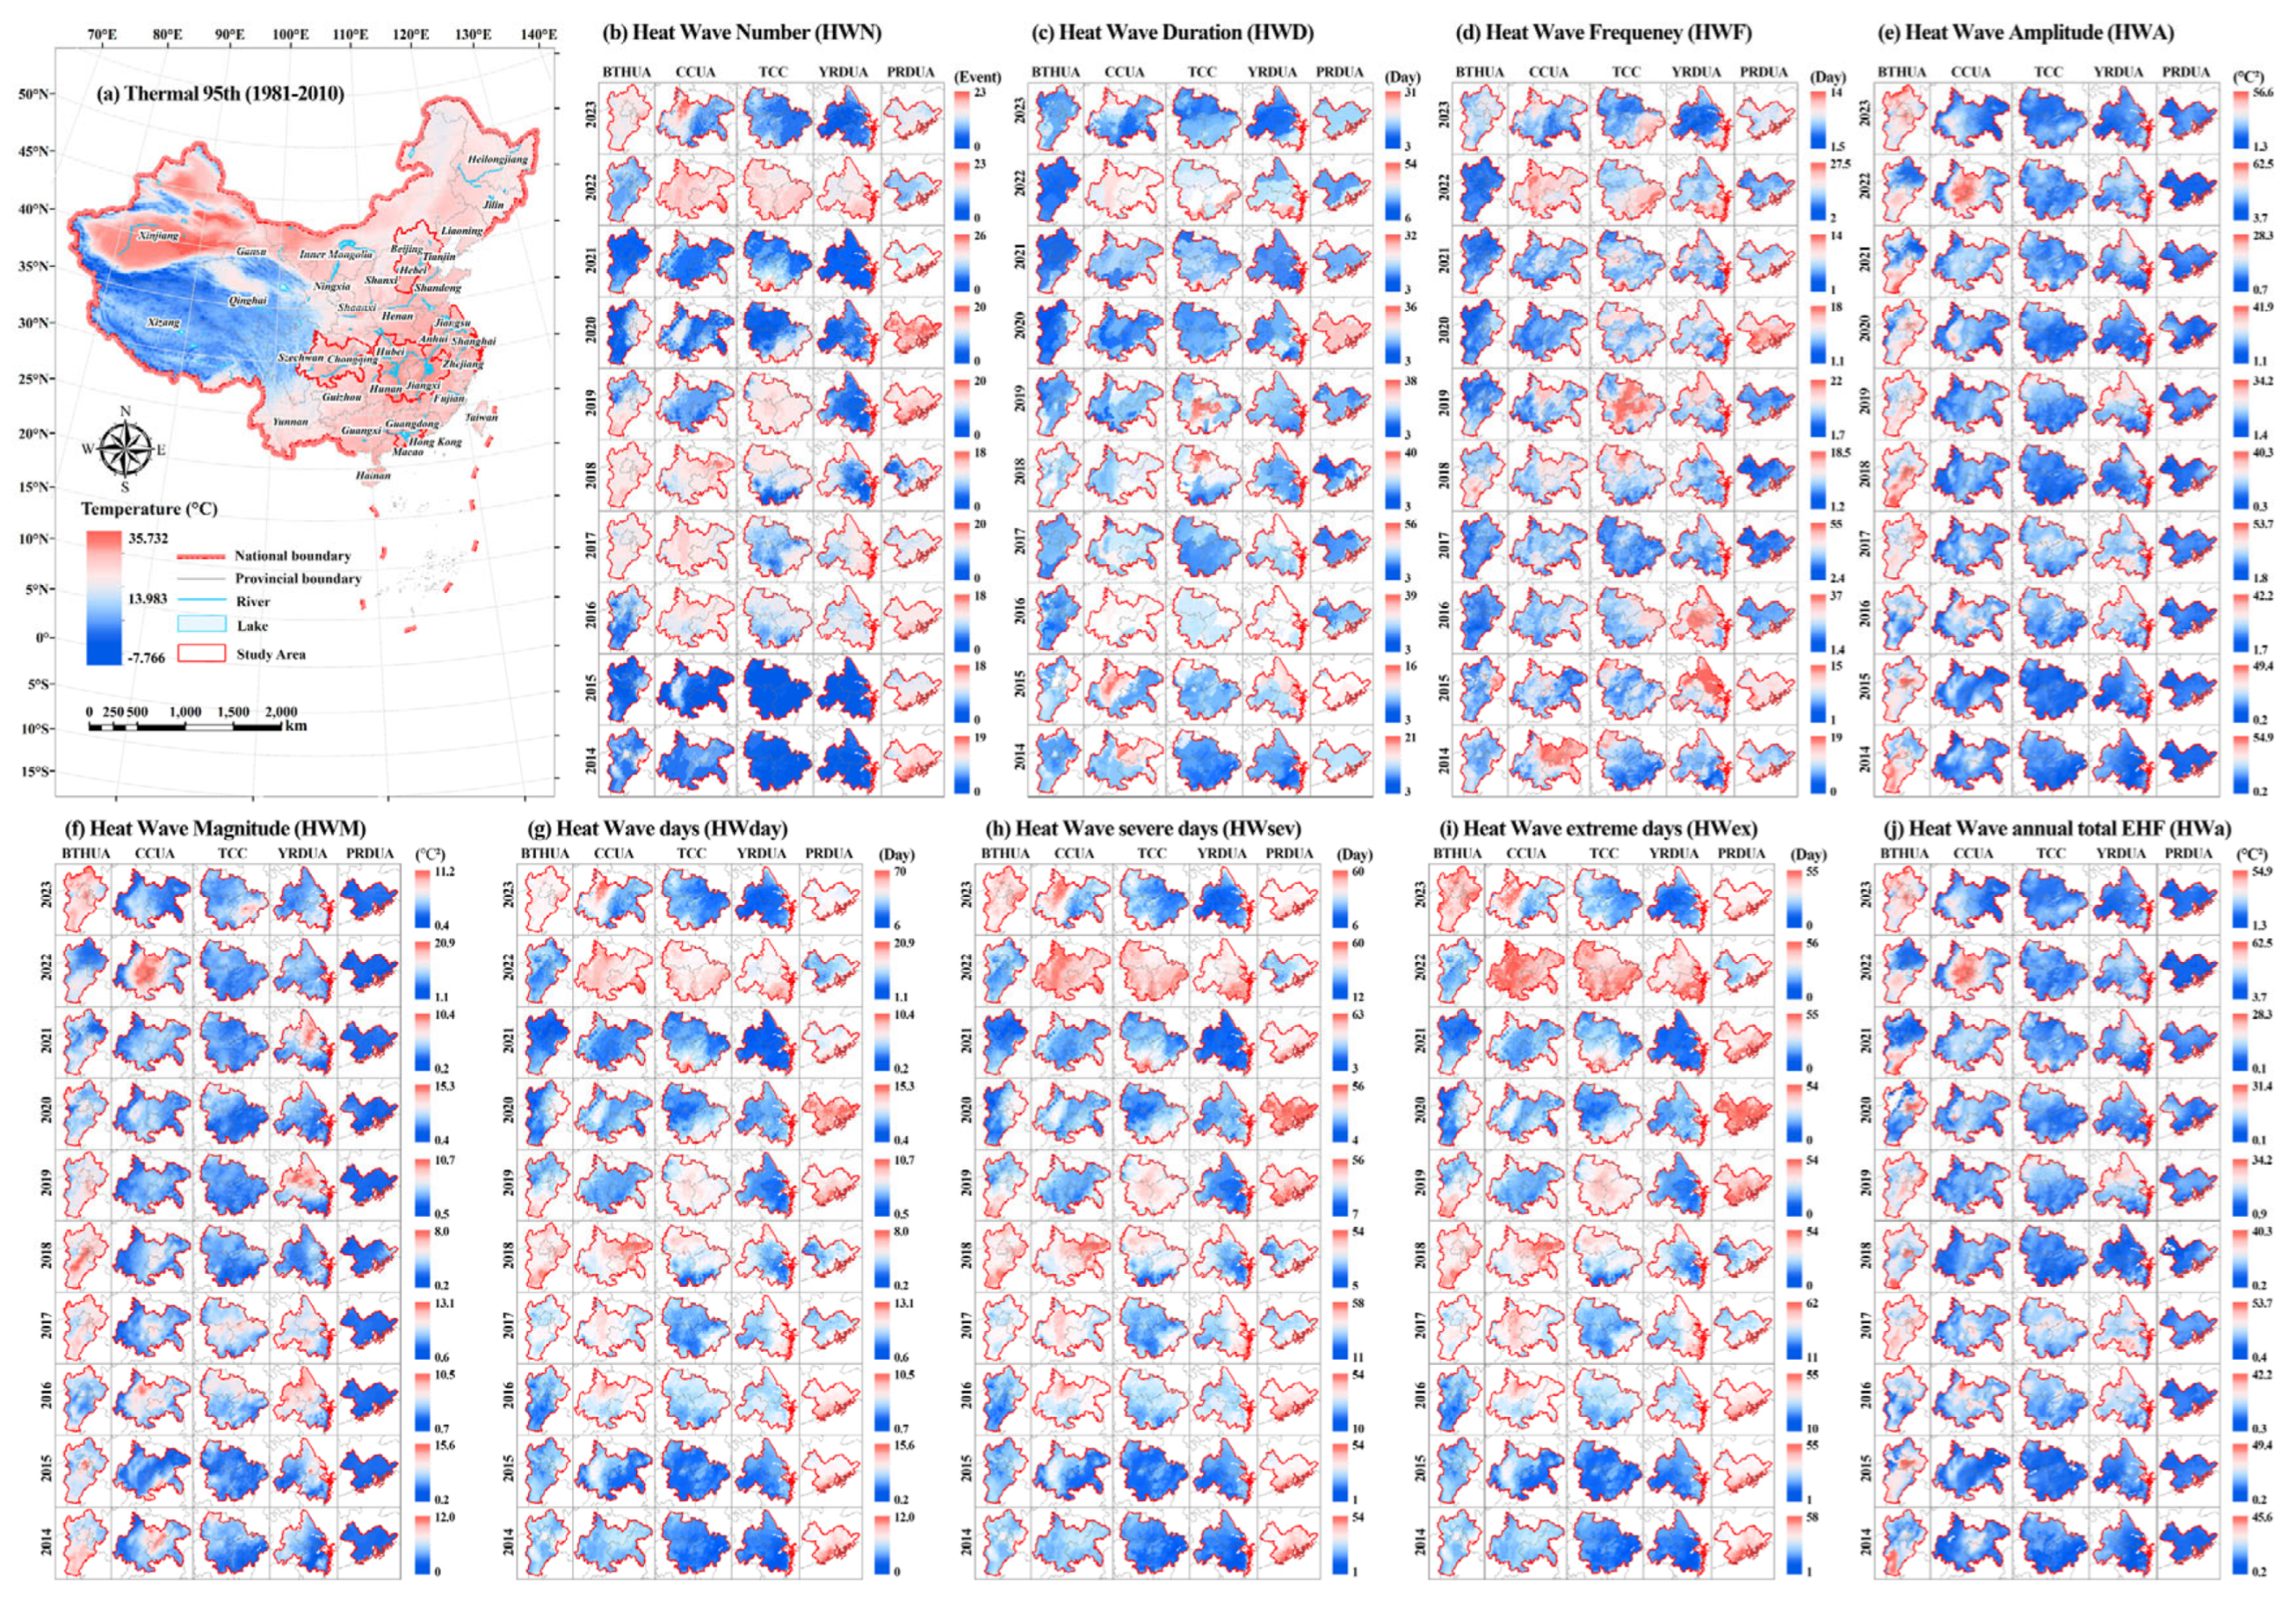
All heatwave-related indicators were calculated using the Google Earth Engine platform. Figure 3. (a) shows the spatial distribution of across China in this study, while Figure 3. (b)–(j) present the distributions of nine heatwave indicators in the five urban agglomerations.
Figure 3.
(a) Spatial visualization of the 95th percentile value of the daily temperature distribution at a certain location from 1981 to 2010; (b)-(j) are HWN, HWD, HWF, HWa, HWM, HWday, HWsev, HWex, and HWa respectively. The five columns from left to right in each sub-graph are BTHUA, CCUA, TCC, YRDUA and PRDUA. From top to bottom are for different years from 2023 to 2014.
3.2.3. Population Exposure
To assess the impact of heatwaves on emotional responses, we estimated total population exposure using a grid-based approach[50]:
where is the heatwave indicator and is the total population in a given area, is the total amount of population exposure to heatwaves in this area.
3.3. Geographical Convergent Cross Mapping
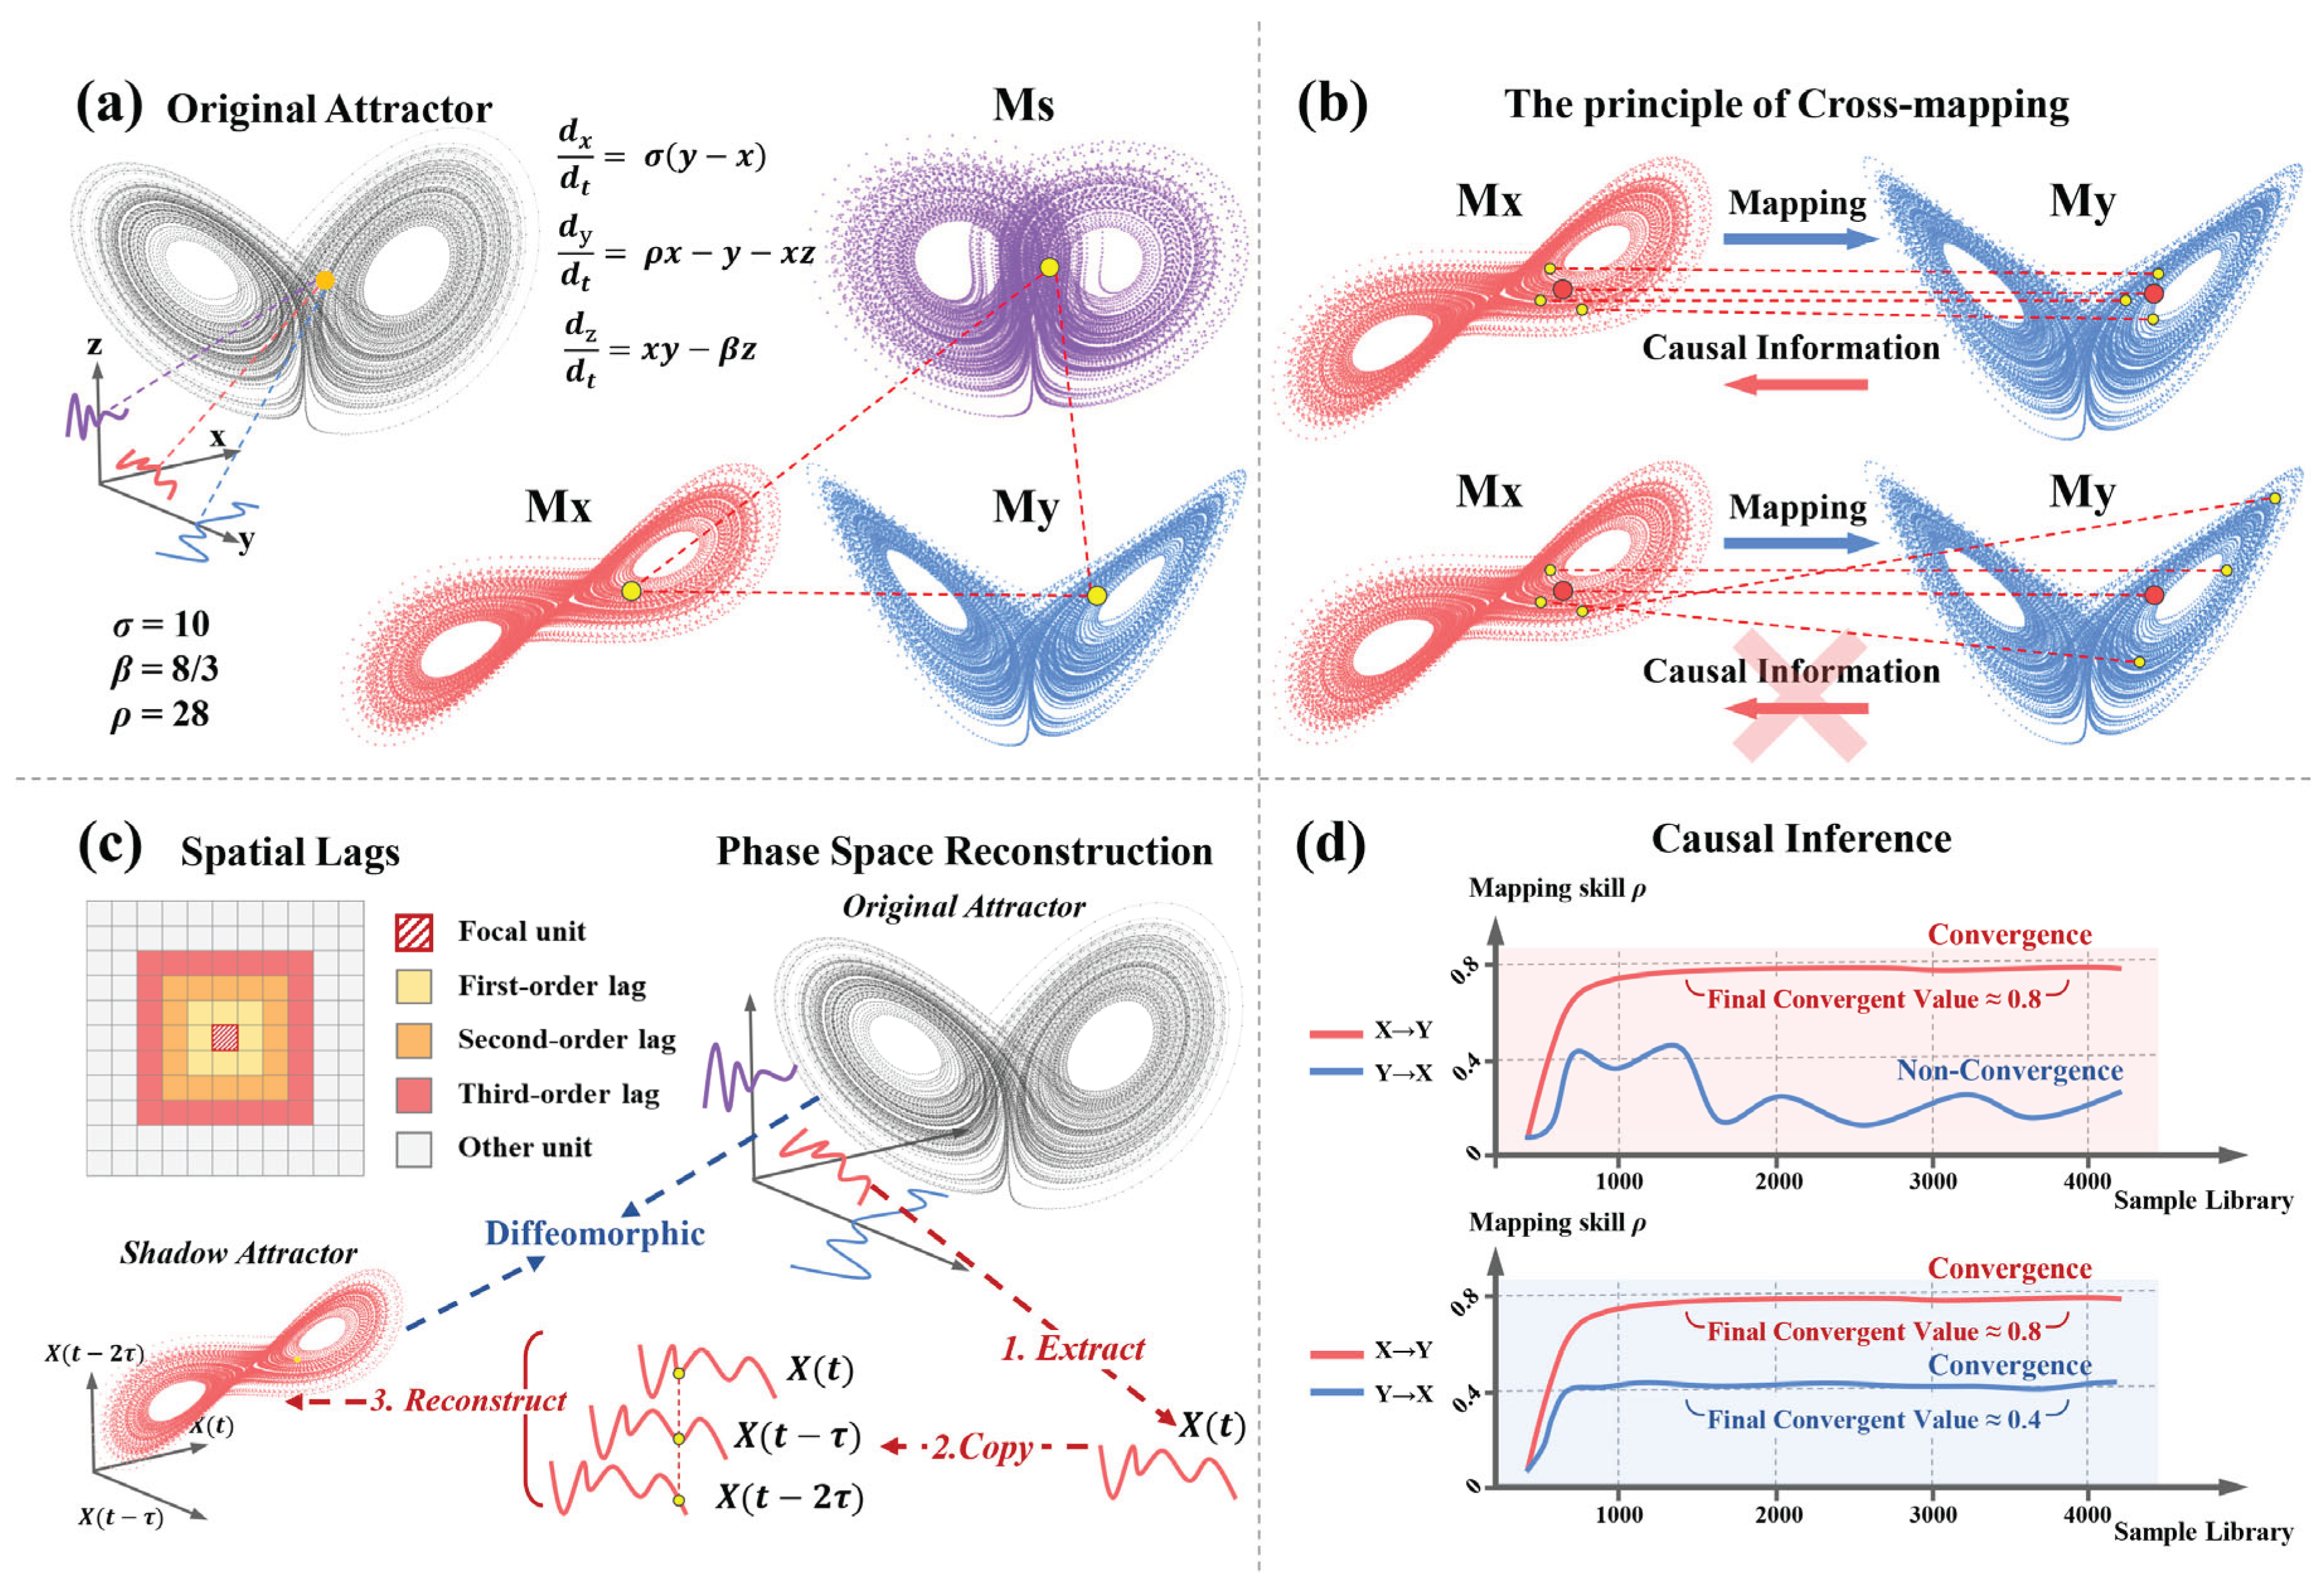
When exploring the influencing factors of a group of variables, the direction of causality and mirroring effect should be considered. To uncover the driving mechanisms of heatwave exposure within the five major Chinese city clusters, we employ the Geographical Convergent Cross Mapping (GCCM) model[25]. GCCM is a state-space reconstruction technique designed for causal inference from spatial cross-sectional data, which is particularly well suited for Earth system analyses where time series data may be limited or exhibit only subtle variations. In addition, GCCM performs cross-mapping prediction based on the spatial section data in the reconstructed state space, which overcomes the mirroring effect well and can fully mine the causality of the spatio-temporal section data in the Earth system (Figure 4).
3.3.1. Spatial Embedding and State-Space Reconstruction
GCCM builds on the principles of Takens’ embedding theorem and the generalized embedding theorem. GCCM uses spatial lags—values observed at a focal spatial unit and its neighbors—to construct a “shadow manifold” for each variable. Formally, for a spatial variable observed over discrete spatial units, the embedding is defined as:
where is the observation at the focal unit and represents the th-order spatial lag.
Figure 4.
(a) Lorenz system: Nonlinear governing equations and attractor with a butterfly-like structure. Relationships between original and shadow attractors are illustrated. (b) Cross-mapping principle: Nearest neighbors are mapped to determine causal information. If nearest neighbors remain after mapping, causal information exists (top); otherwise, they do not remain nearest (bottom). Mapping direction and causal information are inverse. (c) Phase Space Reconstruction (PSR): Reconstructs a diffeomorphic shadow attractor using a single time series from the original attractor. Spatial lags: Focal unit and spatial lags of different orders in raster data (first-order: yellow, second-order: orange, third-order: red). (d) Causal inference via convergence: GCCM results (red line) indicate causality if convergent; non-convergence (blue line) indicates no causality. Mutual causality occurs if both lines converge, while unidirectional causality occurs if only one line converges. Two non-convergent lines suggest variables belong to separate systems.
3.3.2. Cross-Mapping Prediction
Once the state spaces (manifolds) for two spatially distributed variables (e.g., a heatwave indicator and a candidate environmental factor) are reconstructed, GCCM employs cross mapping to quantify the causality. In this framework, if two variables and are dynamically linked, the manifold reconstructed from (denoted ) can be used to predict the corresponding states in the manifold of (). Specifically, for a given spatial unit , the value of is estimated as:
where the weights are computed based on the distances between the focal state and its nearest neighbors in :
The distance between two points in the shadow manifold is defined by:
where the term represents the absolute difference between the th-order spatial lags of the focal unit and its neighbor. In the data based on this paper, the absolute difference function is defined as follows:
where is the observed value in the th direction of the th-order lag, and is the total number of directions considered.
3.3.3. Evaluating Prediction Skill and Inferring Causality
The skill of the cross-mapping prediction is evaluated using the Pearson correlation coefficient between the observed and predicted values:
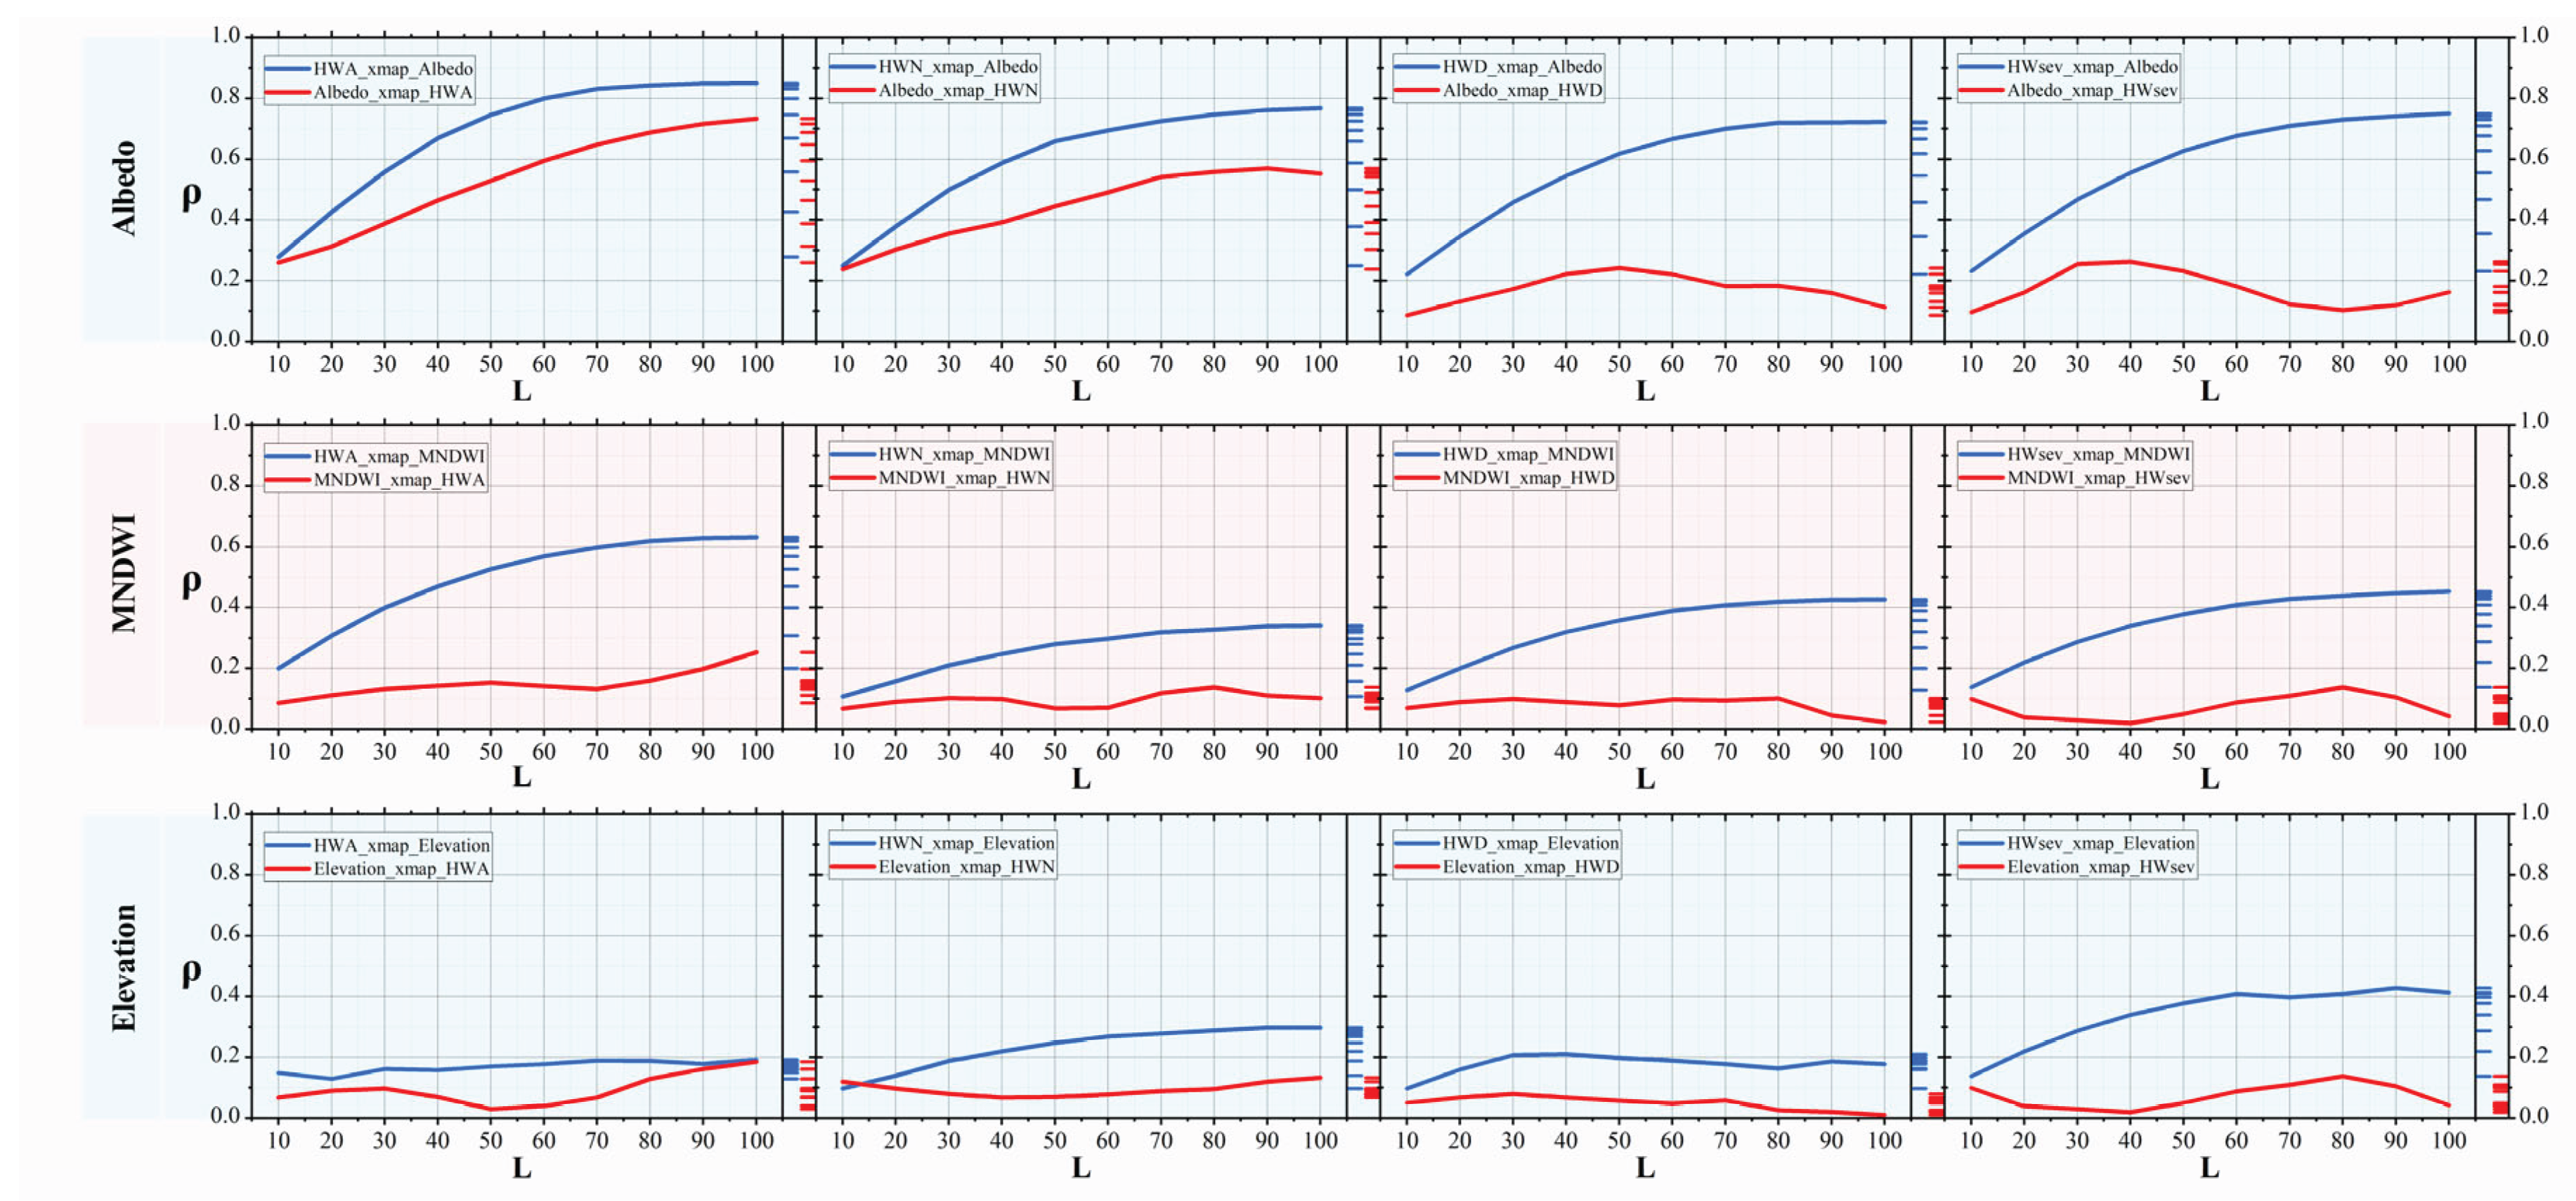
By increasing the library size (i.e., the number of spatial units used in the reconstruction), convergence of is examined. A statistically significant convergence indicates a robust causal association between and . In particular, if the cross mapping from to (denoted ) yields a significantly higher than the inverse mapping (), the dominant causal direction is inferred as .
In our study, causality determination is based on the convergence behavior of the two mapping curves as the library size (i.e., the number of spatial units used for state space reconstruction) increases. If one mapping curve converges while the other remains low or does not converge, the direction corresponding to the convergent curve is considered the dominant causal direction, indicating a unidirectional causality. If both mapping curves converge as the library size increases, the relationship is interpreted as bidirectional. If neither mapping curve converges or both remain at low levels, no causality is inferred. A convergent curve reaching a high correlation coefficient indicates strong causality, while convergence within a moderate range suggests weak causality.
3.4. Senta Model
he open-source Senta model provided by Baidu NLP National Artificial Intelligence Open Innovation Platform is based on deep learning technology, utilizing a pre-trained BERT model as its foundation to efficiently and accurately perform sentiment analysis on text. First, unstructured Chinese text is preprocessed through tokenization and extraction of key elements (such as target, opinion, holder, and time), which are crucial for capturing contextual sentiment. Subsequently, the Baidu NLP platform’s API is used to call the Chinese sentiment lexicon, mapping lexical cues to sentiment polarity. In typical scenarios involving subjective descriptive text, a high-precision deep neural network (DNN) semantic model, integrated with an extensive sentiment lexicon (Supplementary S1), is employed to capture the hedonic state of individual emotions in Weibo updates. The DNN model computes rich semantic representations of the input text and outputs a set of indicators to facilitate sentiment determination: the probability of the text being classified as positive, the probability of being classified as negative, the overall sentiment polarity label, and the associated confidence scores for the classification. This multi-output result not only quantifies the degree of emotion but also ensures robust handling of emotional cues in the dynamic social media environment.
3.5. Bayesian Generalized Linear Mixed Models
This study employs Bayesian Generalized Linear Mixed Models (Bayesian GLMMs) to analyze the driving mechanisms of heatwave exposure risk. GLMMs can simultaneously handle fixed and random effects, and by appropriately selecting the probability distribution and link function for the response variable, they can address the challenges of non-normal data. Within the Bayesian framework, prior distributions are specified and Markov Chain Monte Carlo (MCMC) methods are used to sample from the posterior distribution, providing uncertainty estimates for model parameters and a solid basis for subsequent inference.
3.5.1. Model Structure
All continuous covariates (heatwave exposure indicators , environmental factors , and sentiment indices ) are first centered and standardized by their overall sample standard deviation:
where and denote the mean and standard deviation of the variable across all observations, respectively.
Let the response variable follow an appropriate distribution, with its mean linked to a linear combination of covariates and random effects via a link function. The general form of the model is:
where ; is a known link function; is the vector of fixed-effect covariates for the i-th observation, is the corresponding vector of regression coefficients; is the covariate vector associated with random effects, and follows a multivariate normal distribution , where is the covariance matrix of the random effects.
3.5.2. Priors and Posterior Distributions
Weakly informative priors are assigned to the fixed-effect parameters , such as normal distributions with large variance to reflect prior uncertainty. For the covariance matrix of the random effects, an inverse Wishart prior is used to ensure model flexibility and numerical stability. Based on the above priors and the likelihood function, the posterior distribution is:
where denotes the response for the i-th observation; is the fixed-effect covariate vector with corresponding parameter ; is the covariate vector for random effects, with random effects ; is the covariance matrix of the random effects, with its prior typically specified as an inverse Wishart distribution.
3.5.3. Model Validation
Markov Chain Monte Carlo (MCMC) methods are used to sample from the posterior. Appropriate numbers of iterations, burn-in periods, and thinning intervals are set, and diagnostic metrics (such as R2, effective sample size (MAE), etc.) are used to assess chain convergence and mixing. After sampling, model convergence is diagnosed using posterior density plots, trace plots, and autocorrelation plots. Additionally, posterior predictive checks are performed by comparing simulated and observed heatwave indicators for 2024 to evaluate model fit. For each parameter, the 95% credible interval is calculated; if the interval does not include zero, the corresponding effect is considered statistically significant.
To facilitate the interpretation and direct comparison of the relative importance of different environmental predictors, we report standardized effect sizes for all fixed effects. The standardized effect size for each predictor is defined as the estimated regression coefficient () when all predictors and the response variable have been standardized to have zero mean and unit variance. This approach allows the effect size to be interpreted as the expected change in the response variable (in standard deviation units) associated with a one standard deviation increase in the predictor, holding other variables constant.
3.5.4. Integrated Analysis
The sentiment scores of the five urban agglomerations from 2019 to 2023 were weighted by the population distribution of each Urban Agglomeration to generate annual sentiment indices for each region. These sentiment indices, together with selected environmental factors, were incorporated into the model as interaction terms with heatwave variables. The model is specified as follows:
where denotes the heatwave exposure indicator for Urban Agglomeration in year , is the sentiment index calculated and weighted based on geo-tagged Weibo data, represents the selected key environmental factors, and is the appropriate link function. The random intercept captures the heterogeneity among urban agglomerations. is the fixed intercept, and to are the regression coefficients for heatwave indicators and environmental factors in the equation. This model structure allows for the simultaneous examination of the individual and interactive effects among heatwaves, sentiment, and environmental factors, providing a statistical basis for elucidating how these factors jointly influence heatwave exposure risk.
4. Results
4.1. Causality between Heatwave and Environment
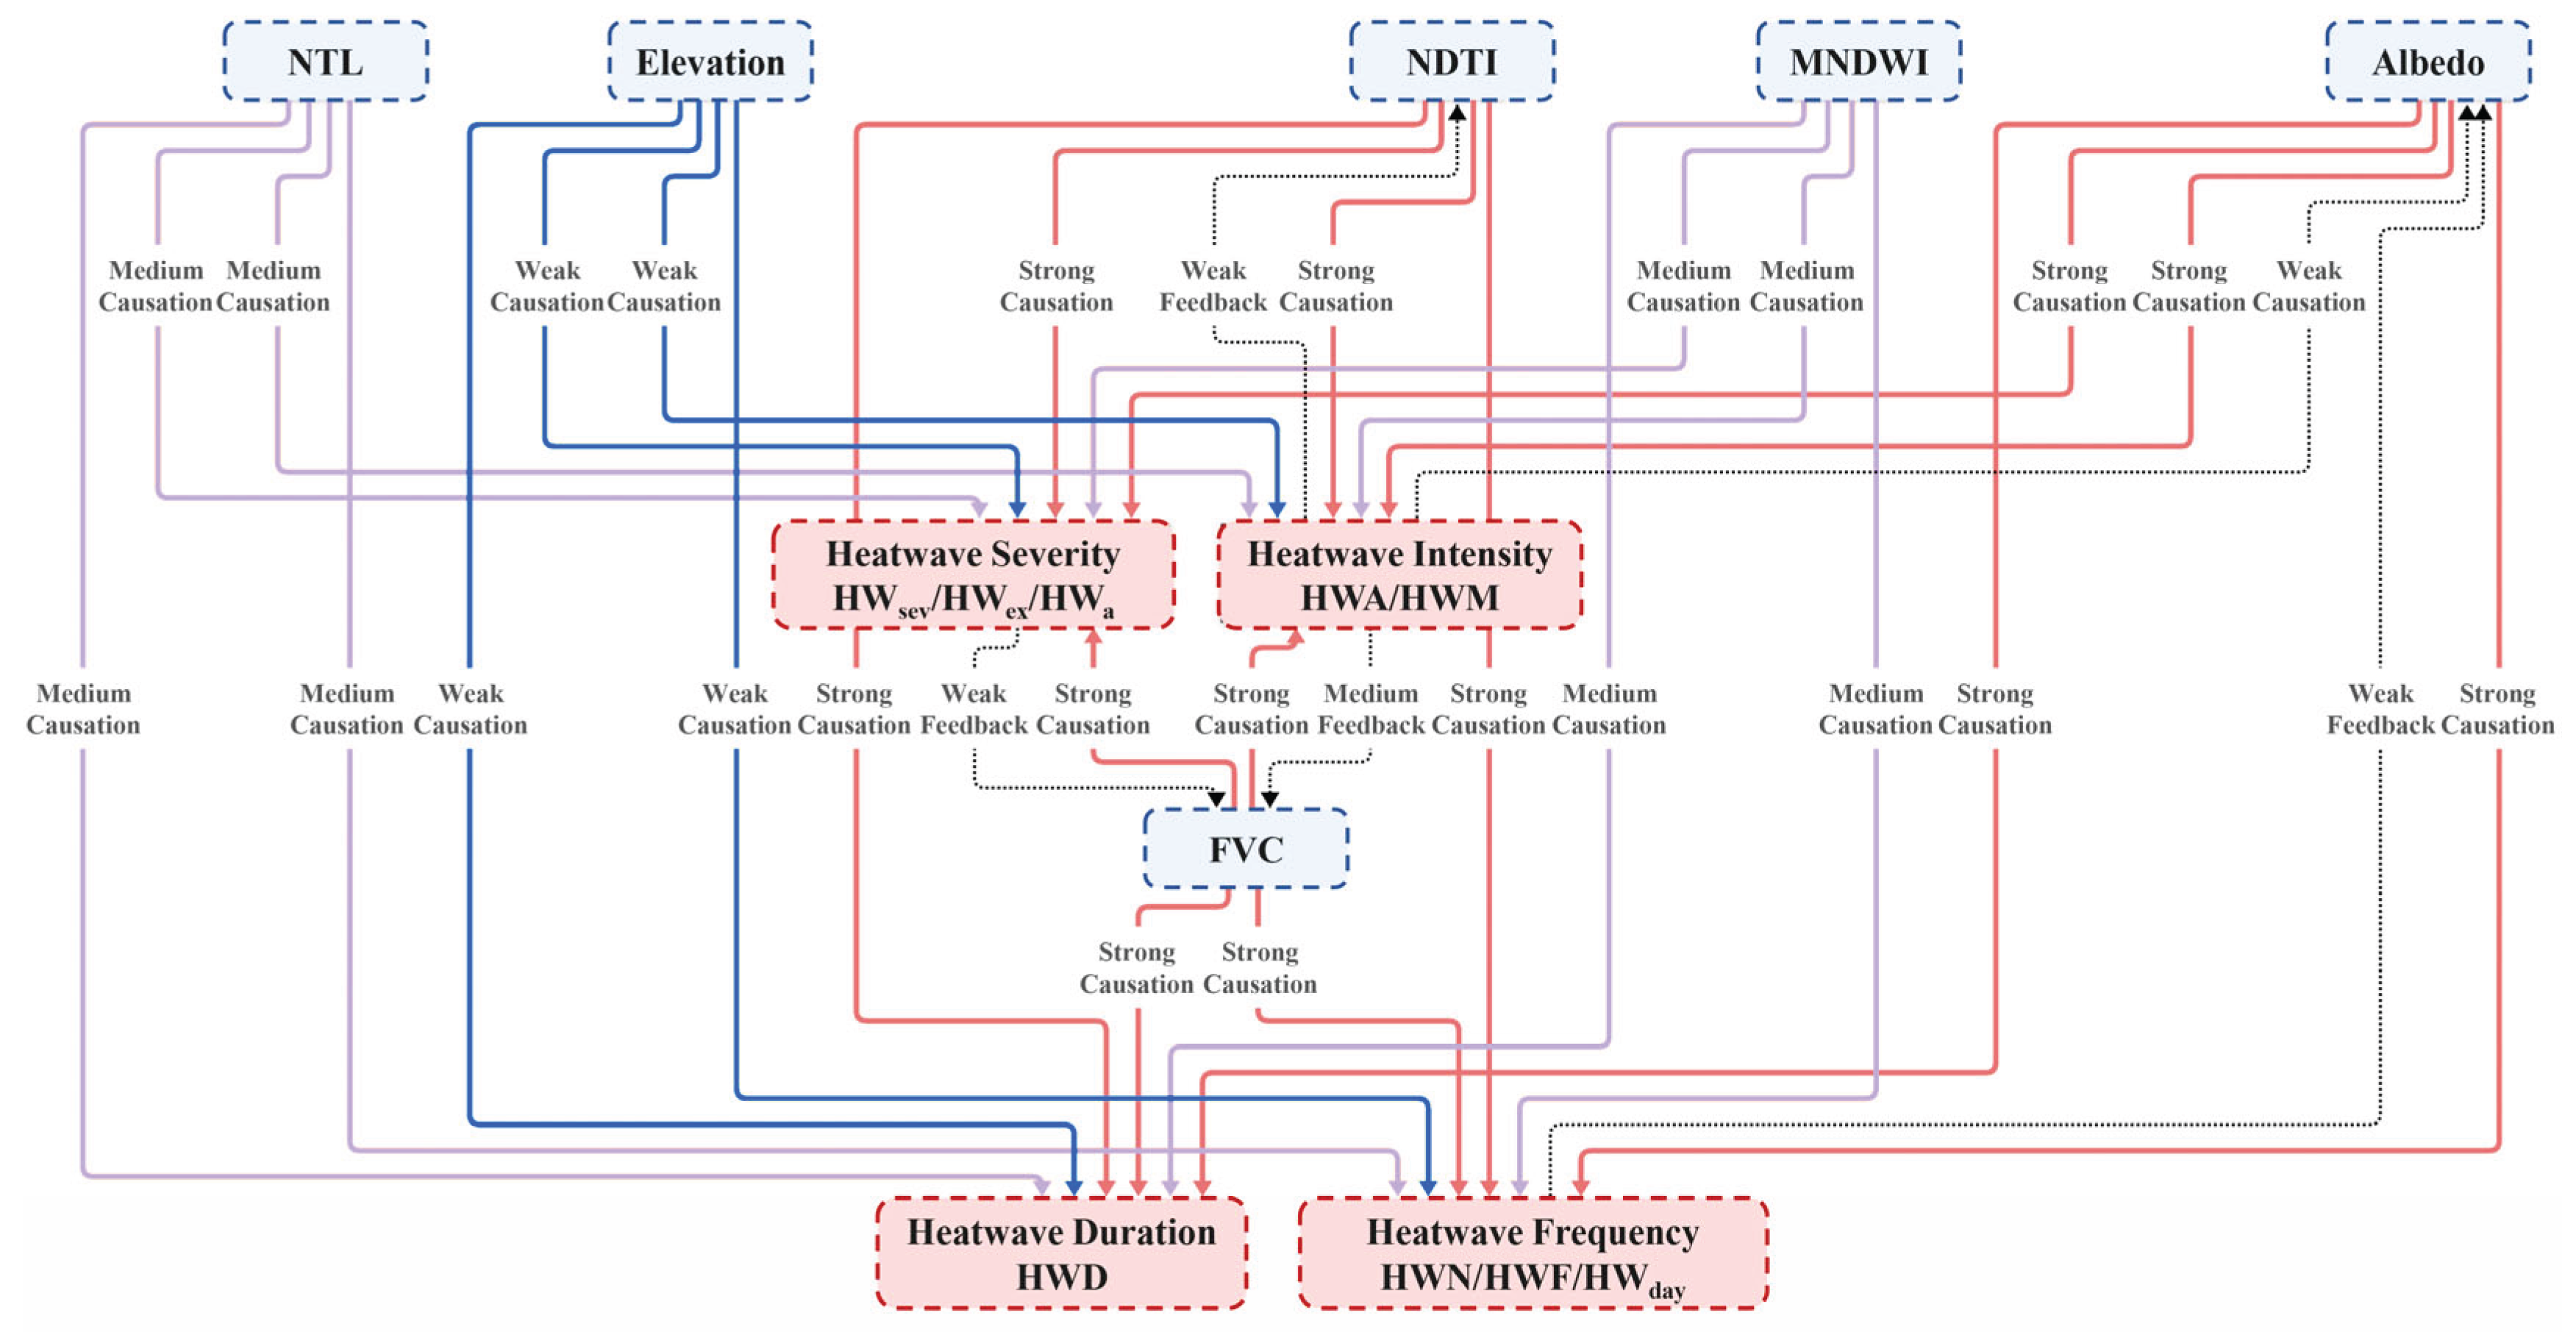
GCCM analysis revealed that most relationships exhibited asymmetric bidirectional causality: environmental factors generally showed strong causality toward heatwave indicators, whereas heatwave indicators exhibited weaker or negligible causality toward environmental factors. Intensity indicators (HWA, HWM, HWA) showed the strongest response to environmental factors, frequency indicators (HWF, HWday) demonstrated moderate to strong responses, and the sensitivity of duration indicators (HWD) was slightly lower than that of intensity indicators (Figure 5., Figure 6.). Albedo exhibited the strongest overall causality with heatwave indicators (mean ρ ≈ 0.772); FVC and NDTI showed lower causality with most heatwave indicators compared to Albedo, but were still relatively strong among all factors (mean ρ ≈ 0.673 and ρ ≈ 0.691, respectively). MNDWI and NTL exhibited moderate causality (mean ρ ≈ 0.475 and ρ ≈ 0.533, respectively), with a greater impact on intensity indicators (HWA, HWM) than on frequency indicators (HWN, HWF, HWday). Elevation showed the weakest causality with heatwave indicators (mean ρ ≈ 0.304).
Figure 5.
Causality between heatwave indicators and environmental factors,The red arrow represents strong causality, the purple arrow represents medium causality, the blue arrow represents weak causality, and the gray arrow represents feedback under strong coupling relationship.
Figure 5.
Causality between heatwave indicators and environmental factors,The red arrow represents strong causality, the purple arrow represents medium causality, the blue arrow represents weak causality, and the gray arrow represents feedback under strong coupling relationship.
Temporally, the mean maximum library prediction skill ρ for the causality between heatwave indicators and environmental factors in the five urban agglomerations remained generally stable across years, despite some fluctuations. The strength of the causality between the same environmental factor and different heatwave indicators exhibited varying trends over time (Figure. 7). The causality between Albedo and heatwave indicators remained highly stable and strong throughout the study period (ρ values for different heatwave indicators in all years were above 0.6). Only the HWA indicator showed a steadily increasing and then stabilizing trend with Albedo from 2014 to 2023 (mean ρ increased from 0.7023 to 0.8500, peaking in 2020), while the causality between other heatwave indicators and Albedo did not show regular temporal trends. The causal strength of MNDWI, NDTI, Elevation, FVC, and NTL with heatwave indicators remained generally stable over time, with only minor interannual differences and no clear temporal trends.
Spatially, the strength of the causality between environmental factors and heatwave indicators varied significantly among urban agglomerations. The causal strength between Albedo and heatwave indicators was significantly higher in BTHUA and CCUA (mean ρ values of 0.792 and 0.790, respectively) than in PRDUA and YRDUA, especially for HWN and HWF, where the mean ρ values of Albedo in BTHUA and CCUA both exceeded 0.8. The impact of MNDWI on heatwaves was much higher in YRDUA and PRDUA (mean ρ values of 0.6398 and 0.6598, respectively) than in BTHUA (mean ρ value 0.4636). NDTI showed a much stronger causality with heatwaves in PRDUA and CCUA (mean ρ values of 0.7488 and 0.7203, respectively) than in TCC (0.6288). The effect of Elevation on heatwaves was most pronounced in CCUA (mean ρ value 0.4591), much higher than in BTHUA (mean ρ value 0.3012), especially for heatwave intensity (HWA), where the prediction skill ρ value for Elevation in CCUA reached 0.5865. The causal strength of FVC on heatwaves was significantly higher in PRDUA and YRDUA (mean ρ values of 0.7787 and 0.7599, respectively) than in BTHUA (mean ρ value 0.6393), particularly for heatwave intensity (HWA) and heatwave days (HWday), where the ρ values for FVC in PRDUA and YRDUA both exceeded 0.8. The impact of NTL on heatwaves was most significant in BTHUA (mean ρ value 0.6052), higher than in CCUA (0.5051).
Figure 6.
Causal inference for heatwave indicators and environmental factors (three different causal intensity relationships).
Figure 6.
Causal inference for heatwave indicators and environmental factors (three different causal intensity relationships).
4.2. Bayesian GLMMs Results and Reliability
4.2.1. Fixed Effects of Environmental Factors
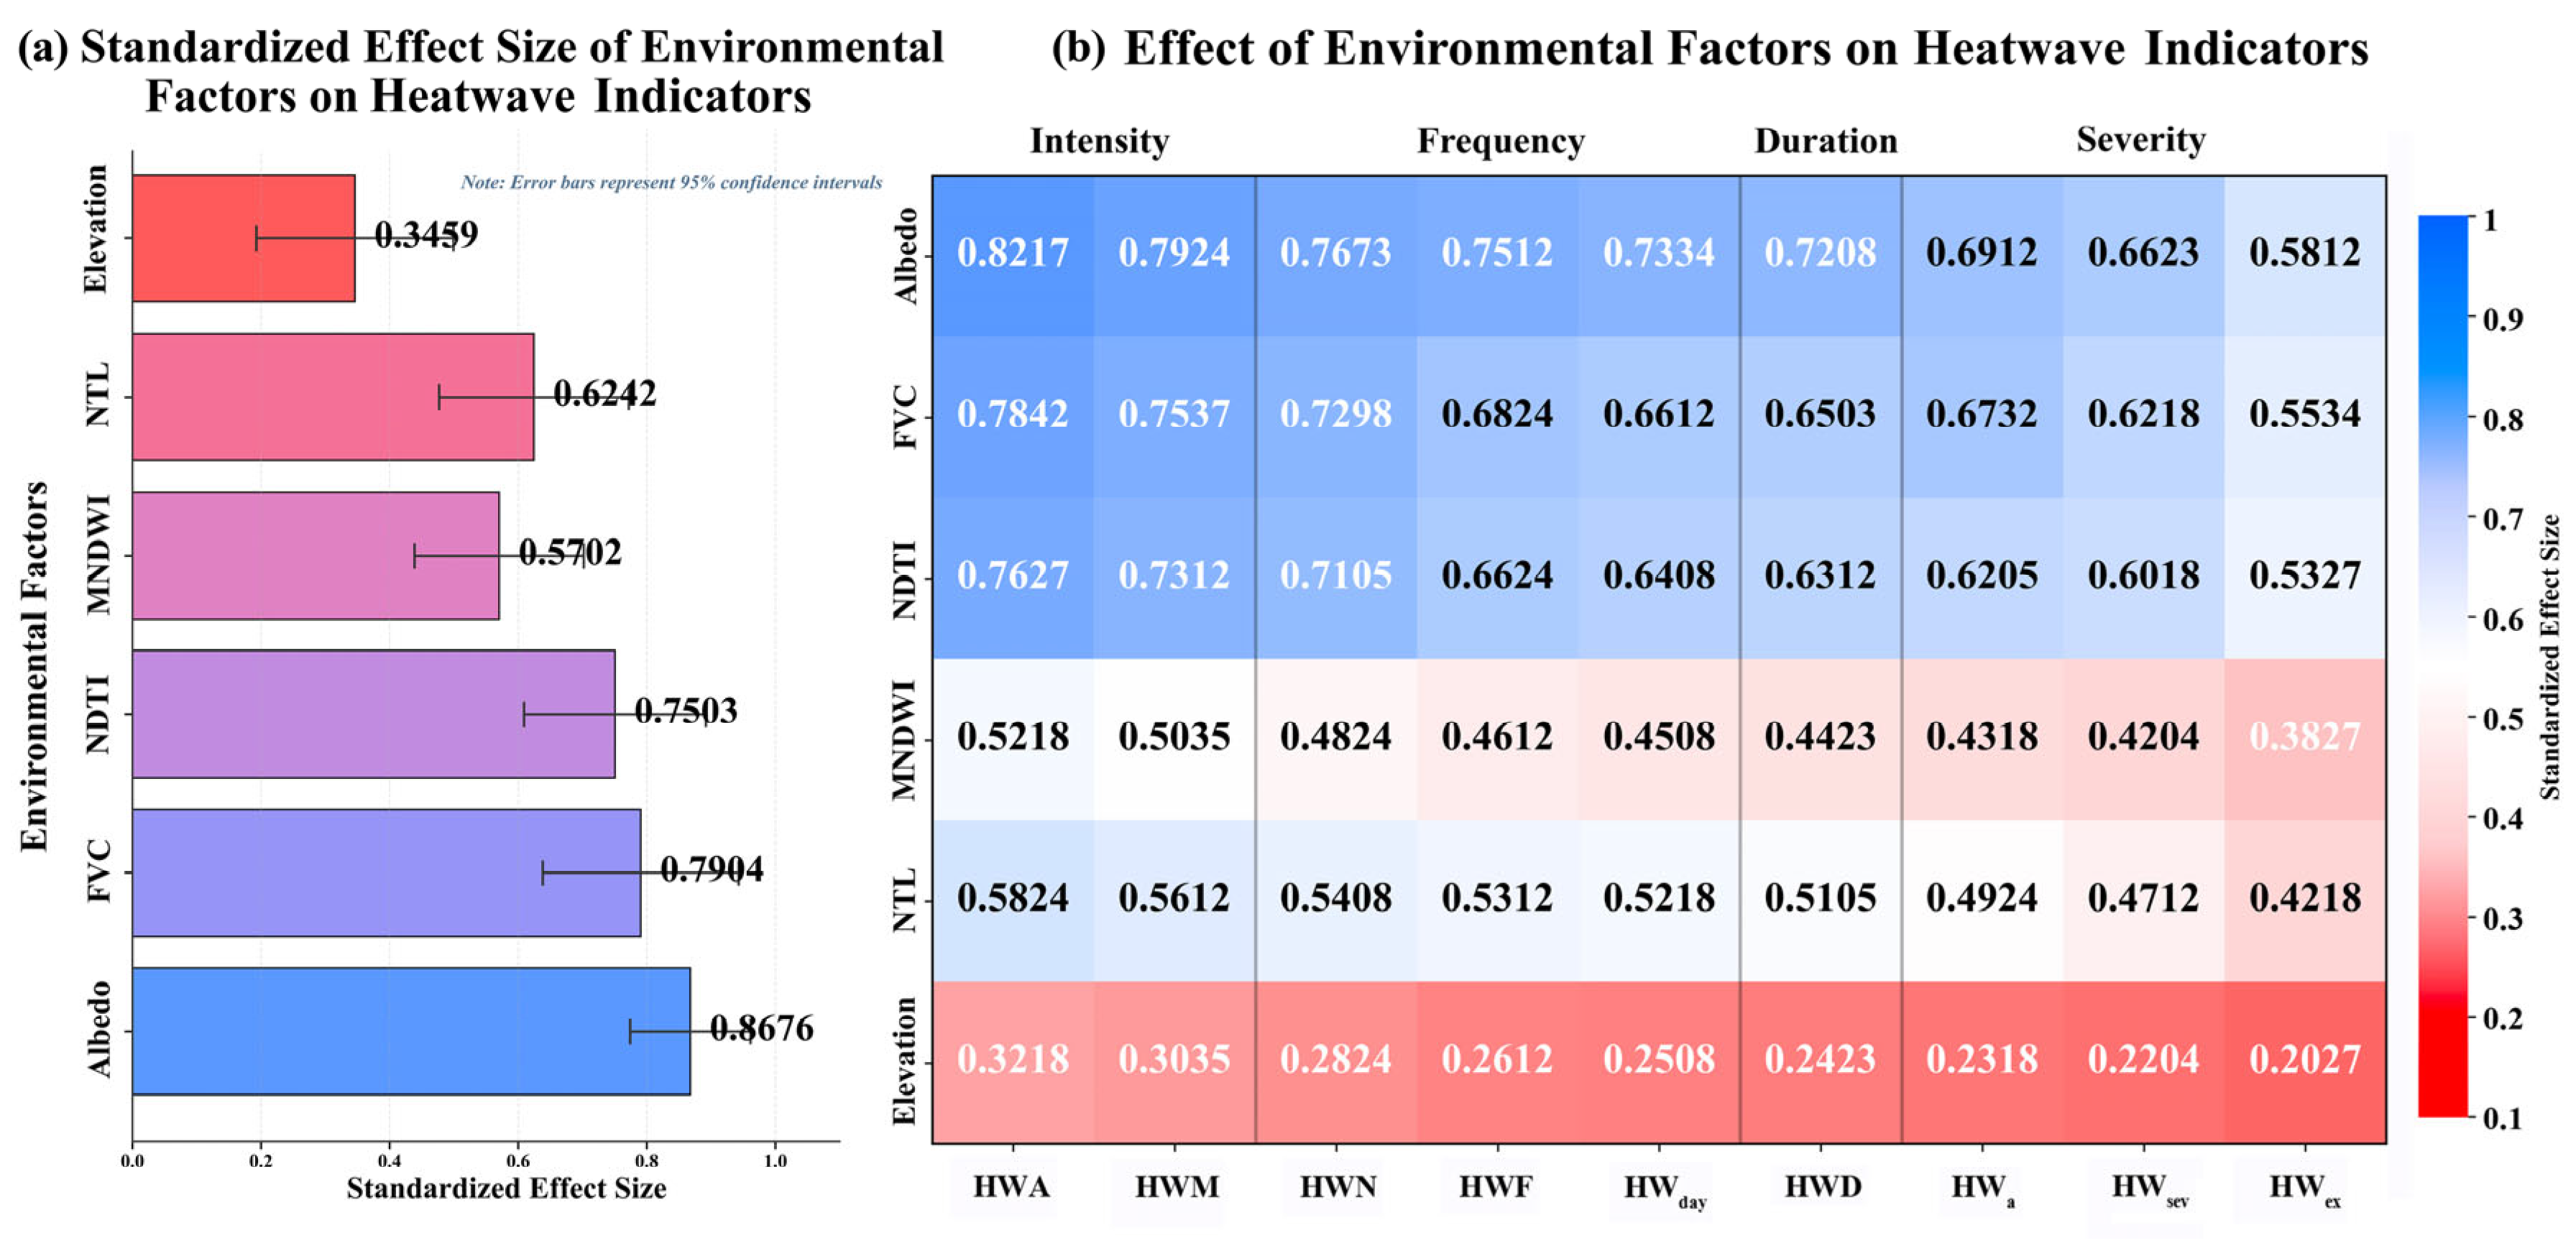
The results of the Bayesian GLMMs showed that the influence strength of selected environmental factors on heatwave indicators was highly consistent with the findings from the causality analysis (Figure 8, Figure 9(b)). Strong causality factors—Albedo (Standardized Effect: 0.58–0.82), FVC (0.55–0.78), and NDTI (0.53–0.76)—exhibited the strongest effects, especially on heatwave intensity indicators (HWA, HWM). Moderate causality factors—NTL (0.42–0.58) and MNDWI (0.38–0.52)—showed moderate effects, with relatively stronger impacts on heatwave frequency indicators (HWN, HWF, HWday). Weak causality factor—Elevation (0.20–0.32)—had relatively weak effects on all heatwave indicators, with the smallest impact on heatwave severity indicators (HWa, HWsev, HWex).
The effect sizes of different environmental factors on heatwave indicators also varied. The order of effect size from strongest to weakest was: intensity indicators > frequency indicators > duration indicators > severity indicators (Figure 8). The standardized effect sizes of environmental factors exhibited a consistent hierarchical pattern across the five urban agglomerations (Figure 9). Among different urban agglomerations, the average effect strength of environmental factors on heatwave occurrence ranked as follows: BTHUA, PRDUA, YRDUA, TCC, and CCUA (Figure 9(c)). Notably, unlike other urban agglomerations where Albedo was the strongest influencing factor, FVC had the strongest effect on heatwaves in CCUA, and Elevation had a higher impact than in other urban agglomerations (Figure 9(a)). In PRDUA and YRDUA, NDTI had a stronger effect on heatwaves than FVC, second only to Albedo, whereas the opposite was true in other urban agglomerations. The water index (MNDWI) had the least impact on urban heatwaves in BTHUA but was significant in TCC, while nighttime lights (NTL) had the least impact in CCUA but was significant in BTHUA and PRDUA, showing moderate effect sizes. The effect of Elevation was relatively weak (0.359, 95% CI: 0.250–0.468) and did not reach high significance in any urban agglomeration.
Figure 7.
Under the premise of convergence, when the largest library size is reached, the prediction skill ρ (keep four decimals) of heatwave indicators and environmental factors is obtained.
Figure 7.
Under the premise of convergence, when the largest library size is reached, the prediction skill ρ (keep four decimals) of heatwave indicators and environmental factors is obtained.
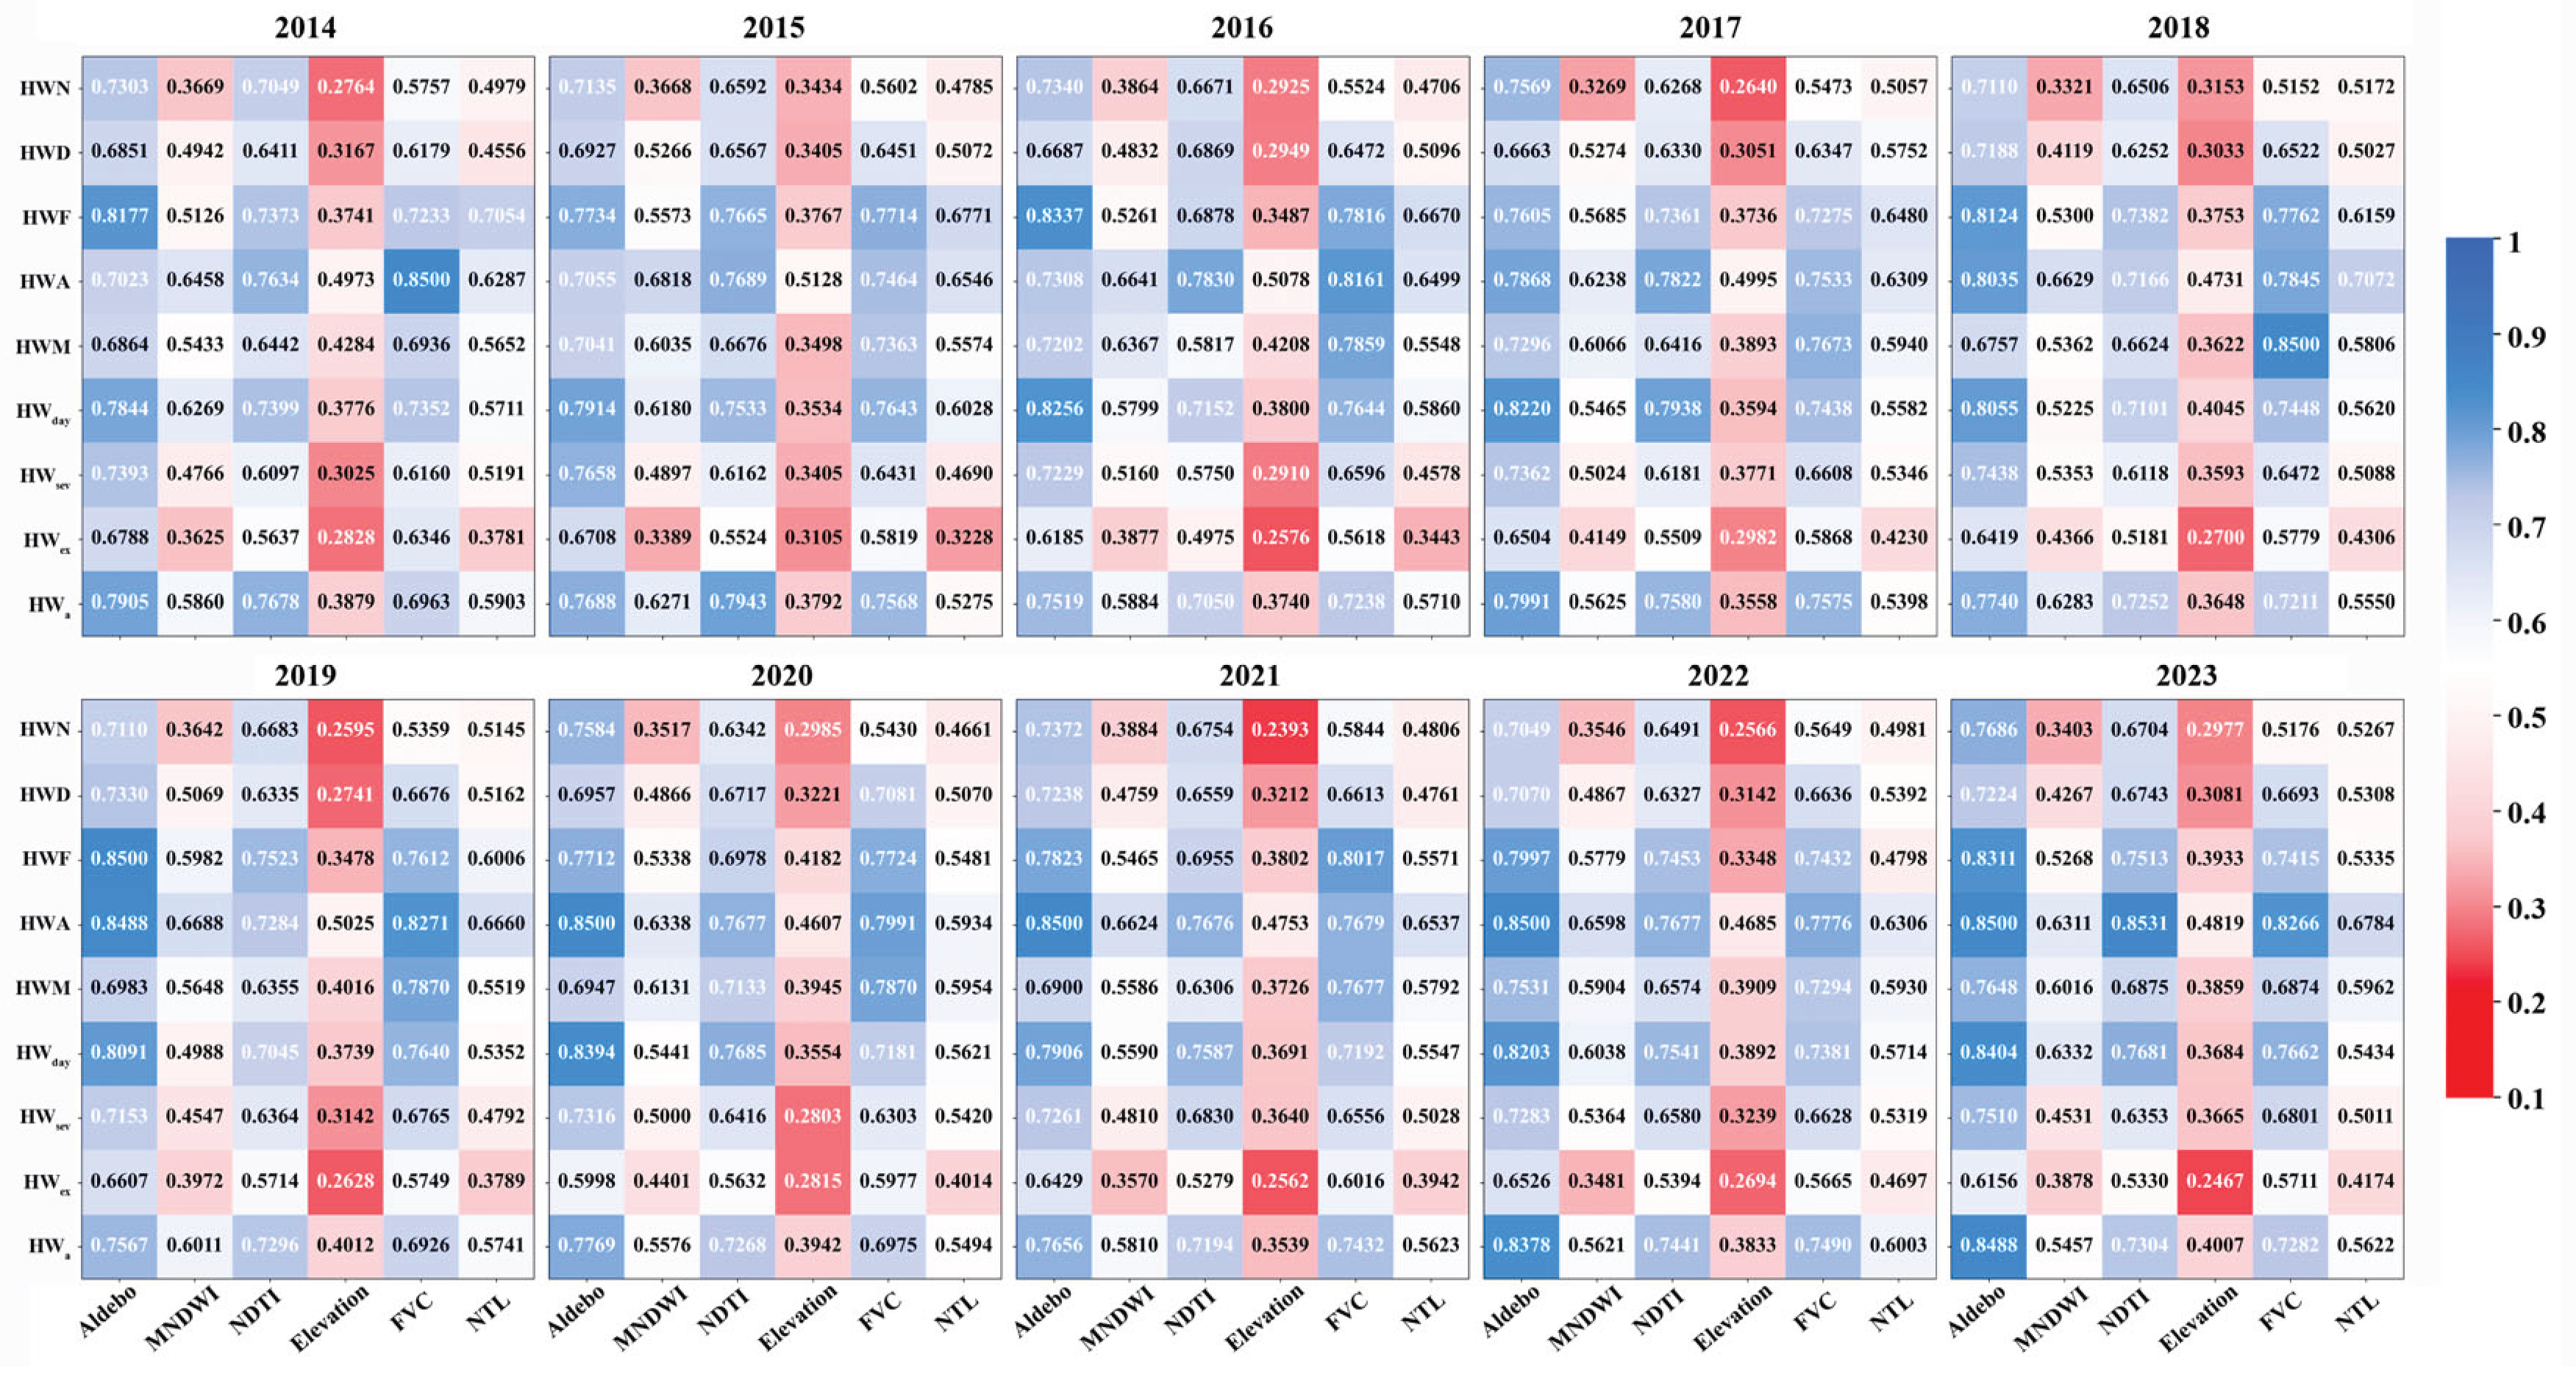
Figure 8.
Fixed effect analysis: The impact of environmental factors on heatwaves; (a) Standardized Effect Size of Environmental Factors on Heatwave Indicators, (b) Effect of Environmental Factors on Heatwave Indicators.
Figure 8.
Fixed effect analysis: The impact of environmental factors on heatwaves; (a) Standardized Effect Size of Environmental Factors on Heatwave Indicators, (b) Effect of Environmental Factors on Heatwave Indicators.
The effect sizes of different environmental factors on heatwave indicators also varied. The order of effect size from strongest to weakest was: intensity indicators > frequency indicators > duration indicators > severity indicators (Figure 8). The standardized effect sizes of environmental factors exhibited a consistent hierarchical pattern across the five urban agglomerations (Figure 9). Among different urban agglomerations, the average effect strength of environmental factors on heatwave occurrence ranked as follows: BTHUA, PRDUA, YRDUA, TCC, and CCUA (Figure 9(c)). Notably, unlike other urban agglomerations where Albedo was the strongest influencing factor, FVC had the strongest effect on heatwaves in CCUA, and Elevation had a higher impact than in other urban agglomerations (Figure 9(a)). In PRDUA and YRDUA, NDTI had a stronger effect on heatwaves than FVC, second only to Albedo, whereas the opposite was true in other urban agglomerations. The water index (MNDWI) had the least impact on urban heatwaves in BTHUA but was significant in TCC, while nighttime lights (NTL) had the least impact in CCUA but was significant in BTHUA and PRDUA, showing moderate effect sizes. The effect of Elevation was relatively weak (0.359, 95% CI: 0.250–0.468) and did not reach high significance in any urban agglomeration.
Figure 9.
Standardized Effect Size of Environmental Factors in Urban Agglomerations, (a) Standardized Effect Size of Environmental Factors in Urban Agglomerations, (b) Mean Effect Sizes of Environmental Factors, (c) Mean Effect Size by Urban Agglomerations.
Figure 9.
Standardized Effect Size of Environmental Factors in Urban Agglomerations, (a) Standardized Effect Size of Environmental Factors in Urban Agglomerations, (b) Mean Effect Sizes of Environmental Factors, (c) Mean Effect Size by Urban Agglomerations.
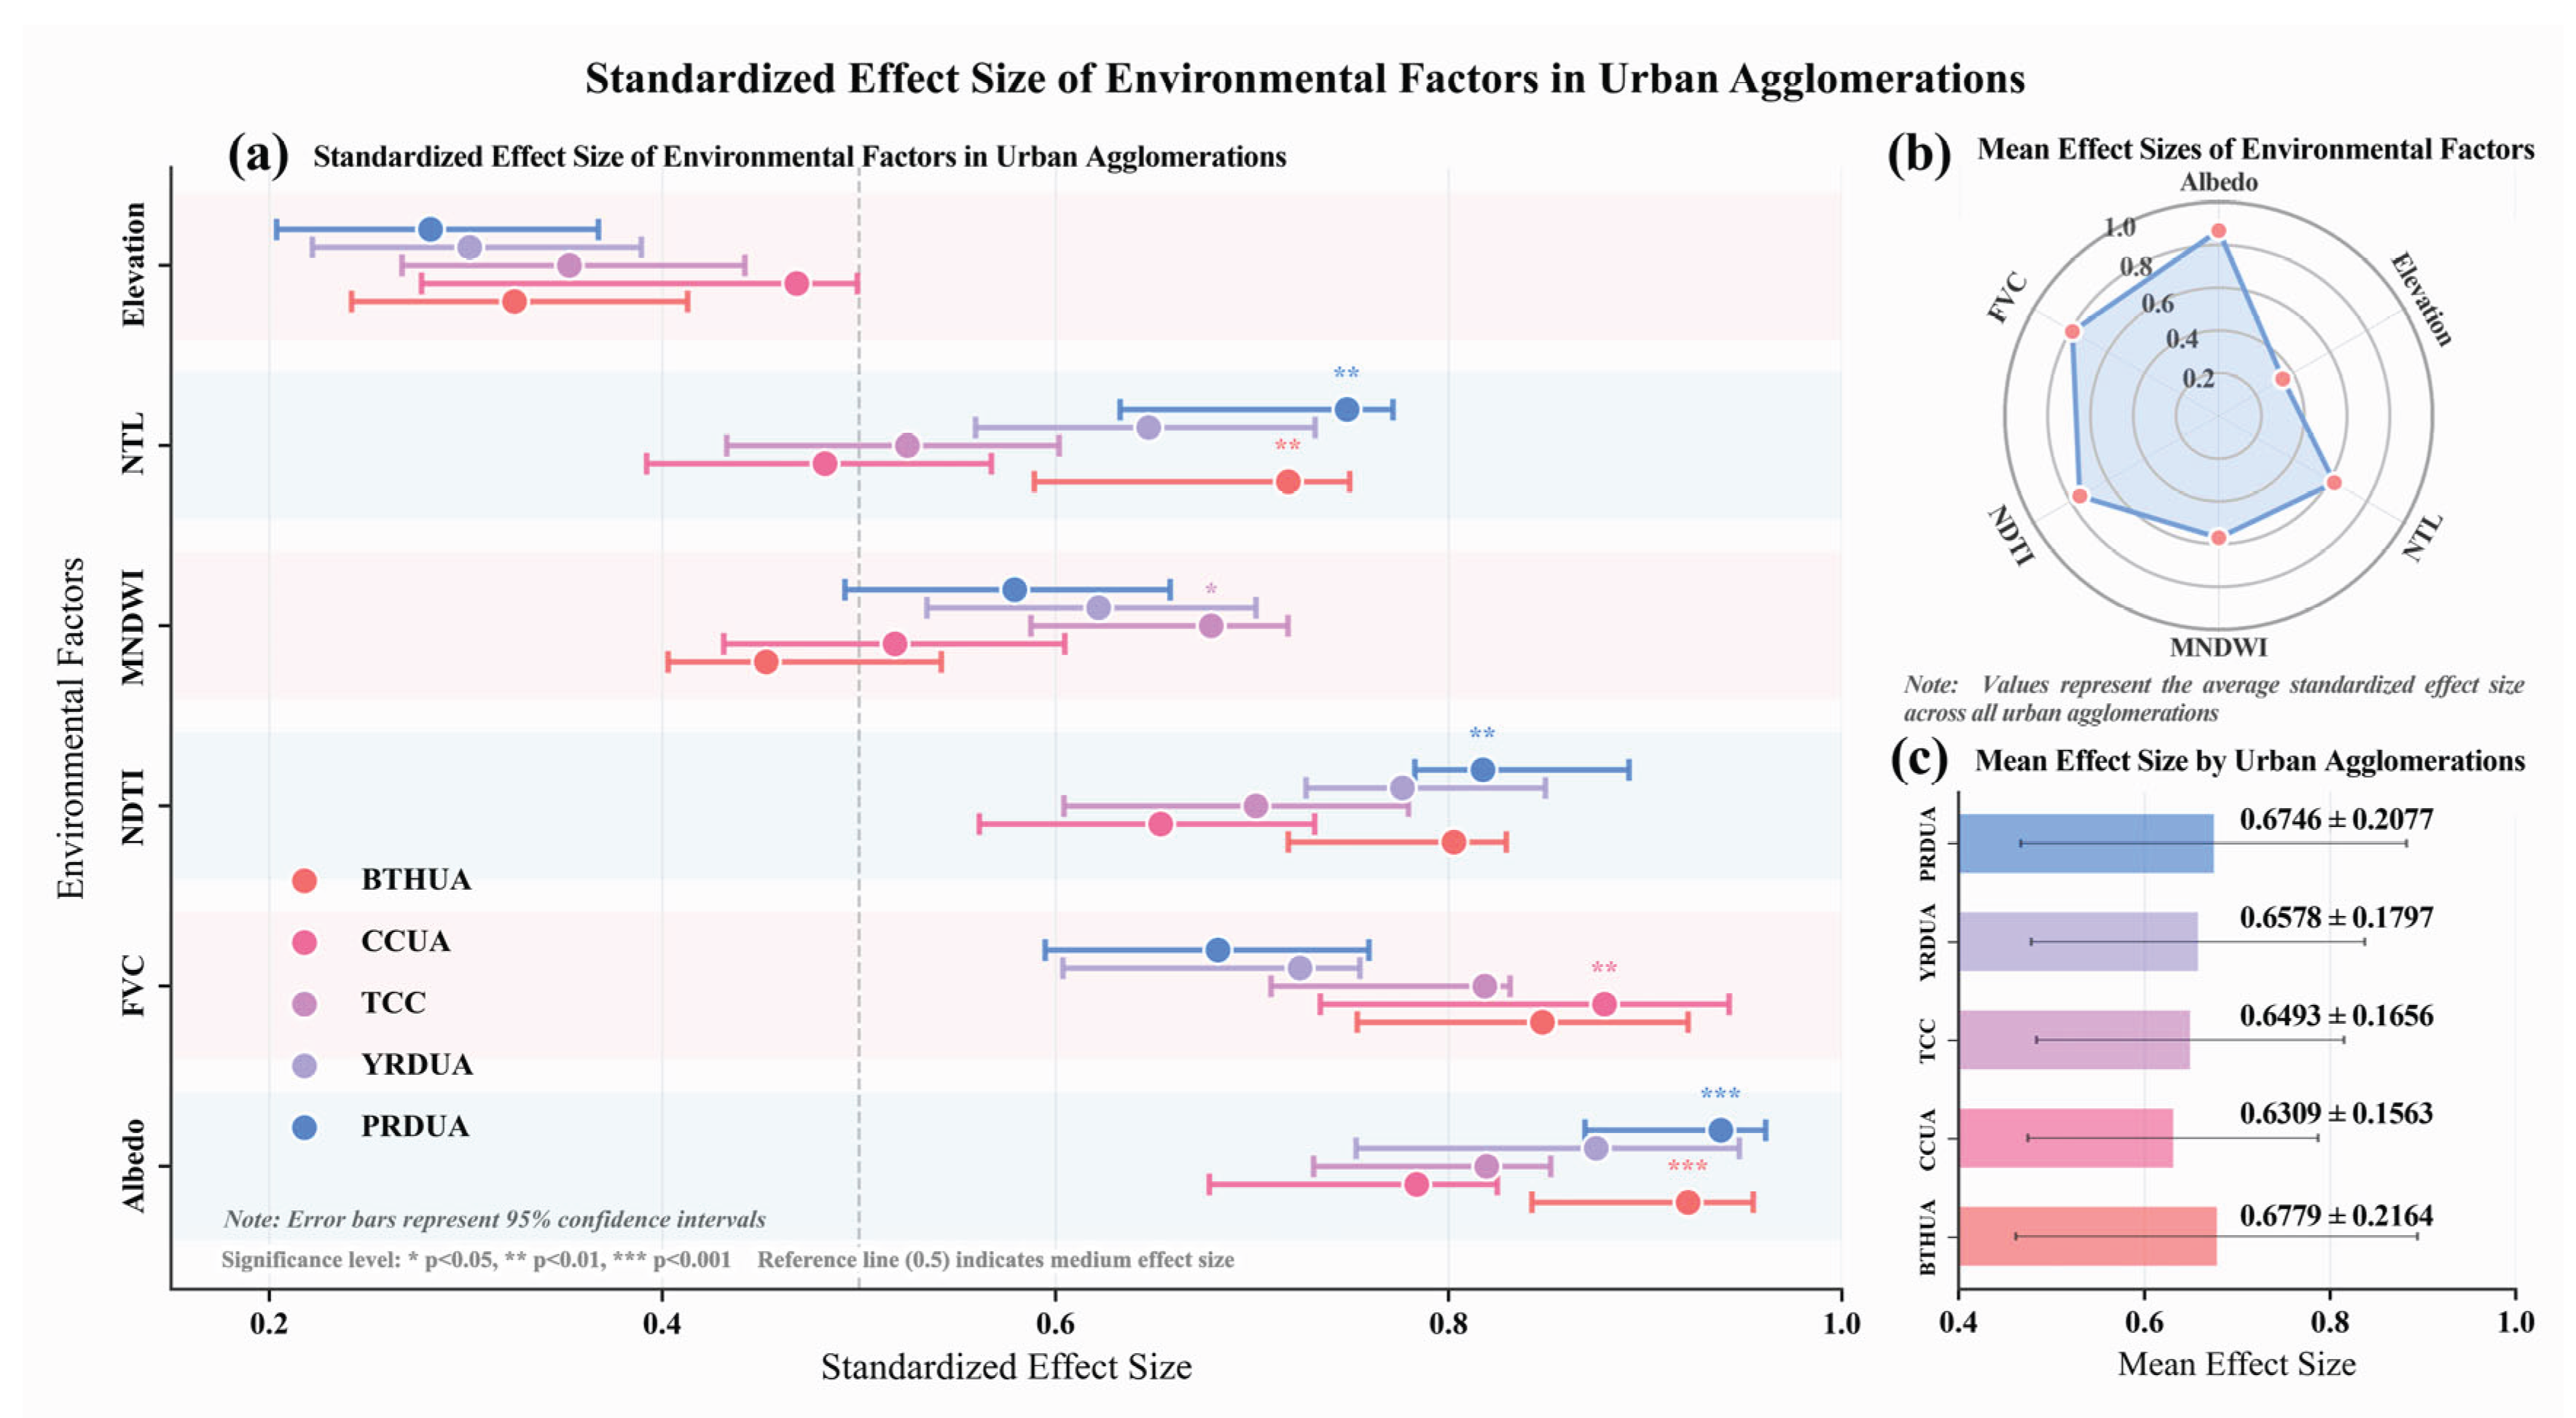
Analysis of the average effects of all environmental factors (Figure 8(b)) indicated that surface physical properties (Albedo, FVC, NDTI) had a significantly stronger impact on heatwaves than hydrological and topographic features (MNDWI, Elevation). This result supports the urban heat island theory, highlighting that urban surface material properties and vegetation cover are key factors in regulating the urban thermal environment. There were slight differences in the responses of different urban agglomerations to environmental factors (Figure 8(c)), with BTHUA and PRDUA showing stronger average effect sizes, and TCC showing weaker effects.
Figure 10.
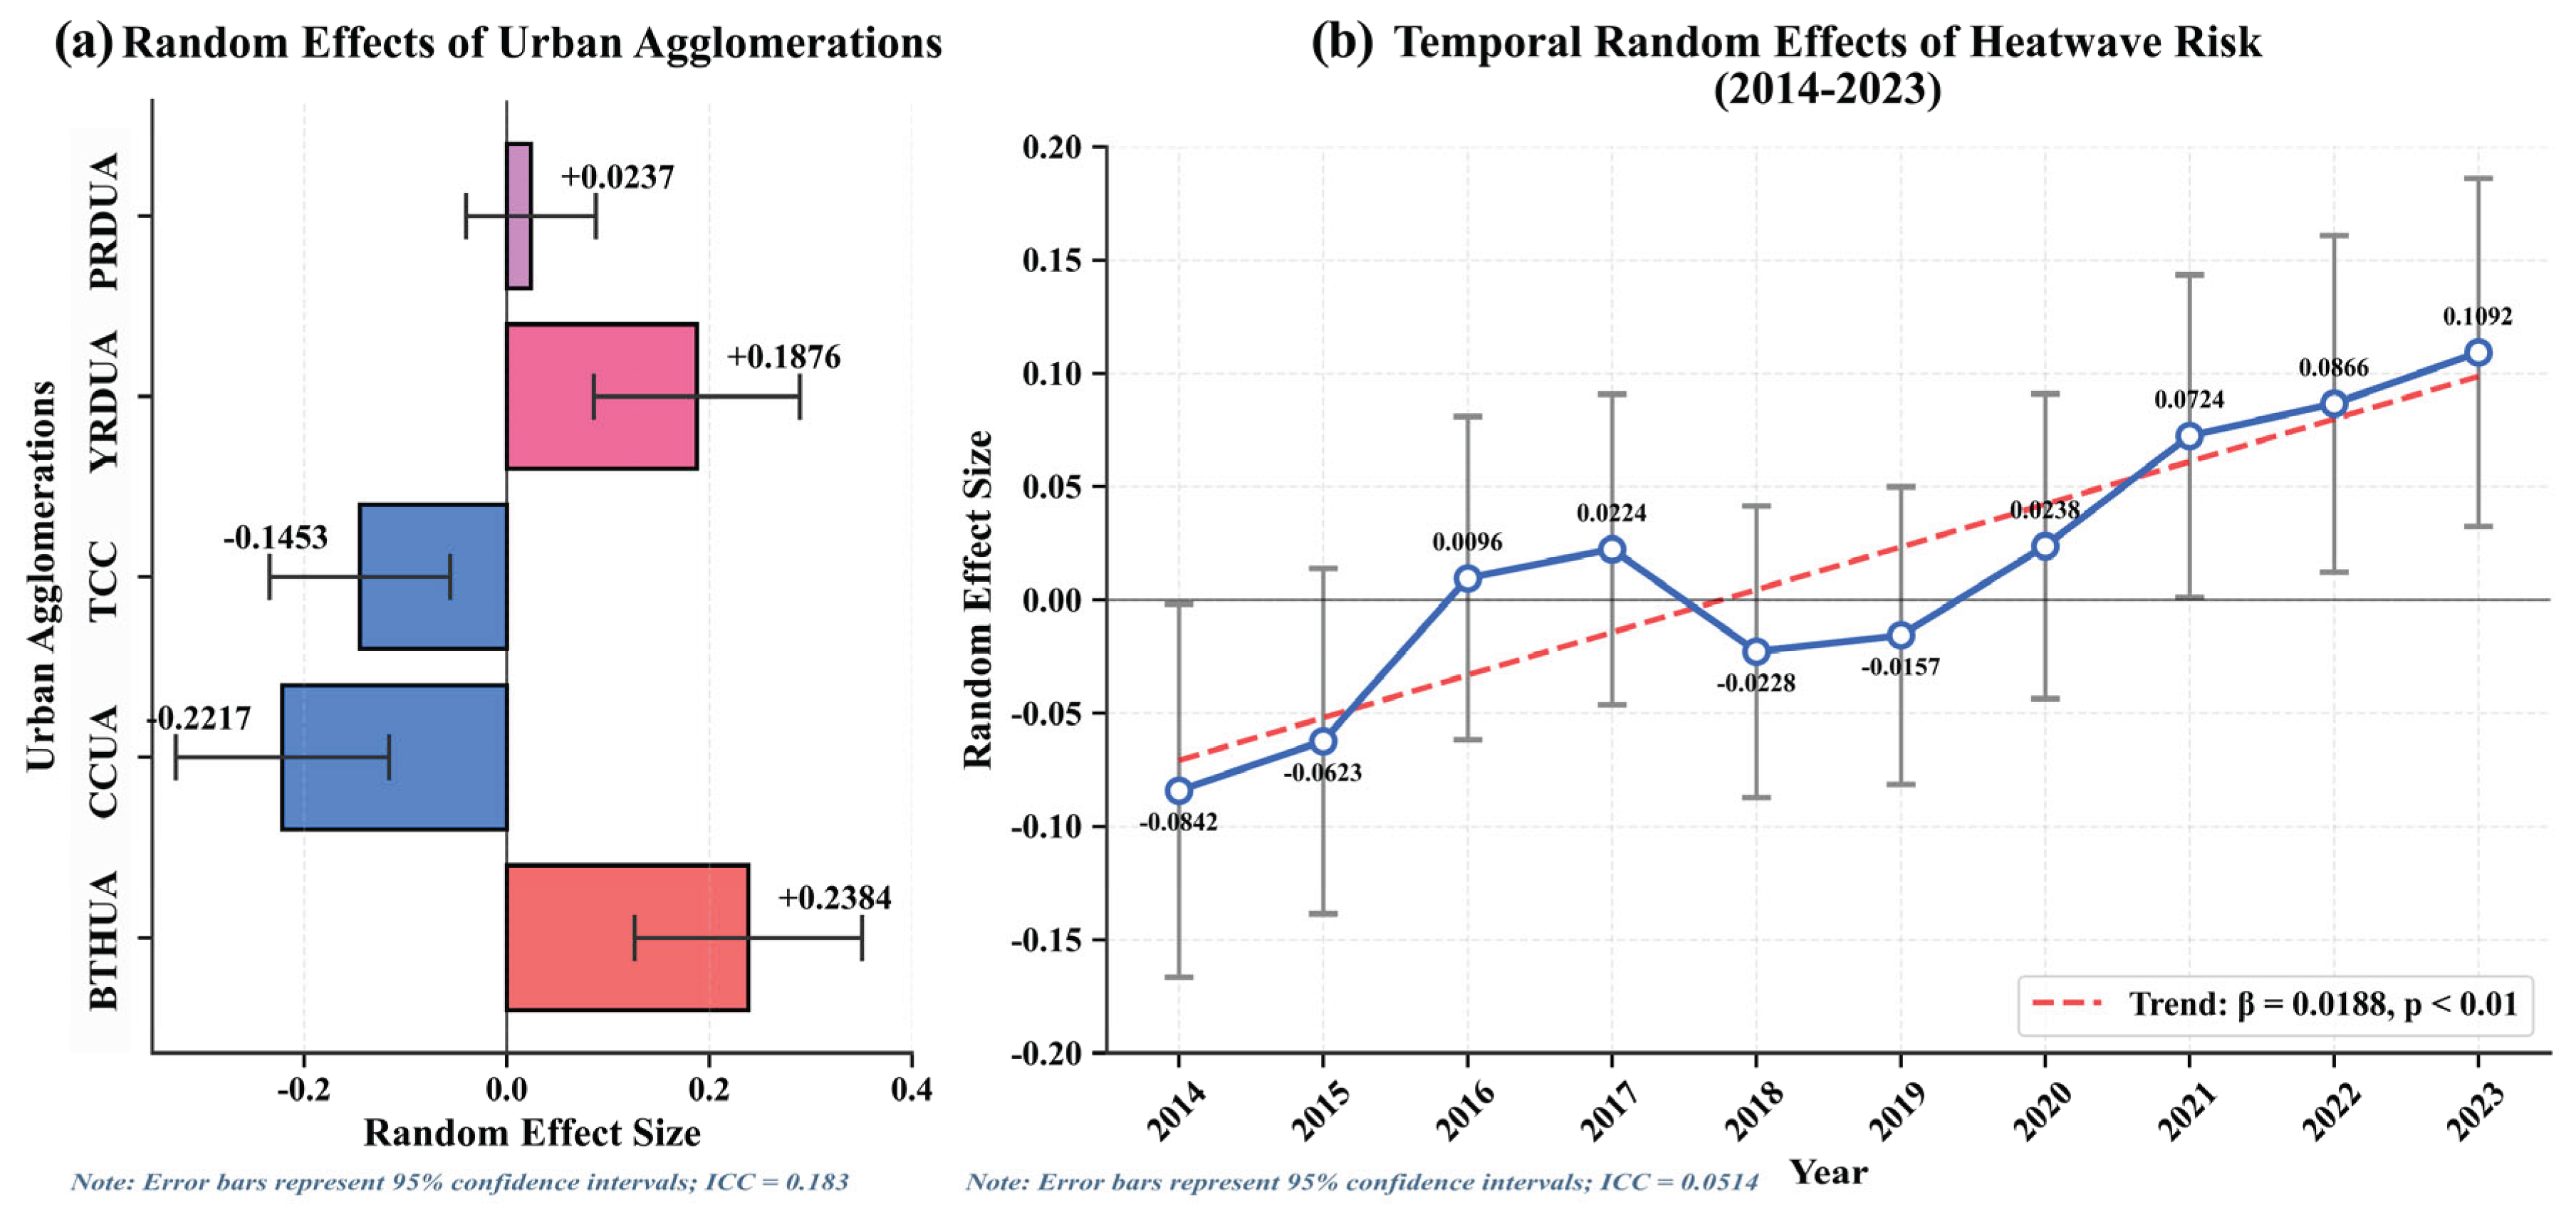
Random effect analysis: Spatial and temporal heterogeneity; (a) Random Effects of Urban Agglomerations, (b) Temporal Random Effects of Heatwave Risk.
Figure 10.
Random effect analysis: Spatial and temporal heterogeneity; (a) Random Effects of Urban Agglomerations, (b) Temporal Random Effects of Heatwave Risk.
4.2.2. Random Effects of Environmental Factors
There was significant spatial heterogeneity in the environmental effects on heatwave occurrence across the five urban agglomerations (Figure 9(a)), indicating that heatwave occurrence in different urban agglomerations was significantly influenced by random effects. The estimated random effects represent the deviation of each urban agglomeration from the national average. BTHUA (+0.2384) and YRDUA (+0.1876) exhibited higher positive random effects, while CCUA (–0.2217) and TCC (–0.1453) showed stronger negative random effects, and PRDUA (+0.0237) was close to zero.
Temporal random effects analysis revealed significant temporal heterogeneity in heatwave risk from 2014 to 2023 (Figure 9(b)). The estimated random effects for each year represent the deviation from the decadal average, reflecting the influence of interannual climate variability and other time-related factors. Trend analysis showed that heatwave risk generally increased from 2014 to 2023 (β = 0.0188, p < 0.01), but with notable interannual fluctuations. From 2014 to 2017, the random effect values increased from –0.0842 to 0.0224, indicating an overall upward trend in heatwave risk. A brief decline occurred in 2018–2019 (random effect values –0.0228 and –0.0157, respectively), followed by a sustained increase from 2020 to 2023 (random effect values rising from 0.0238 to 0.1092), indicating that heatwave risk in recent years was significantly higher than the decadal average. This pattern is generally consistent with global temperature trends, but also reflects the complexity and interannual variability of regional climate systems.
4.2.3. Reliability
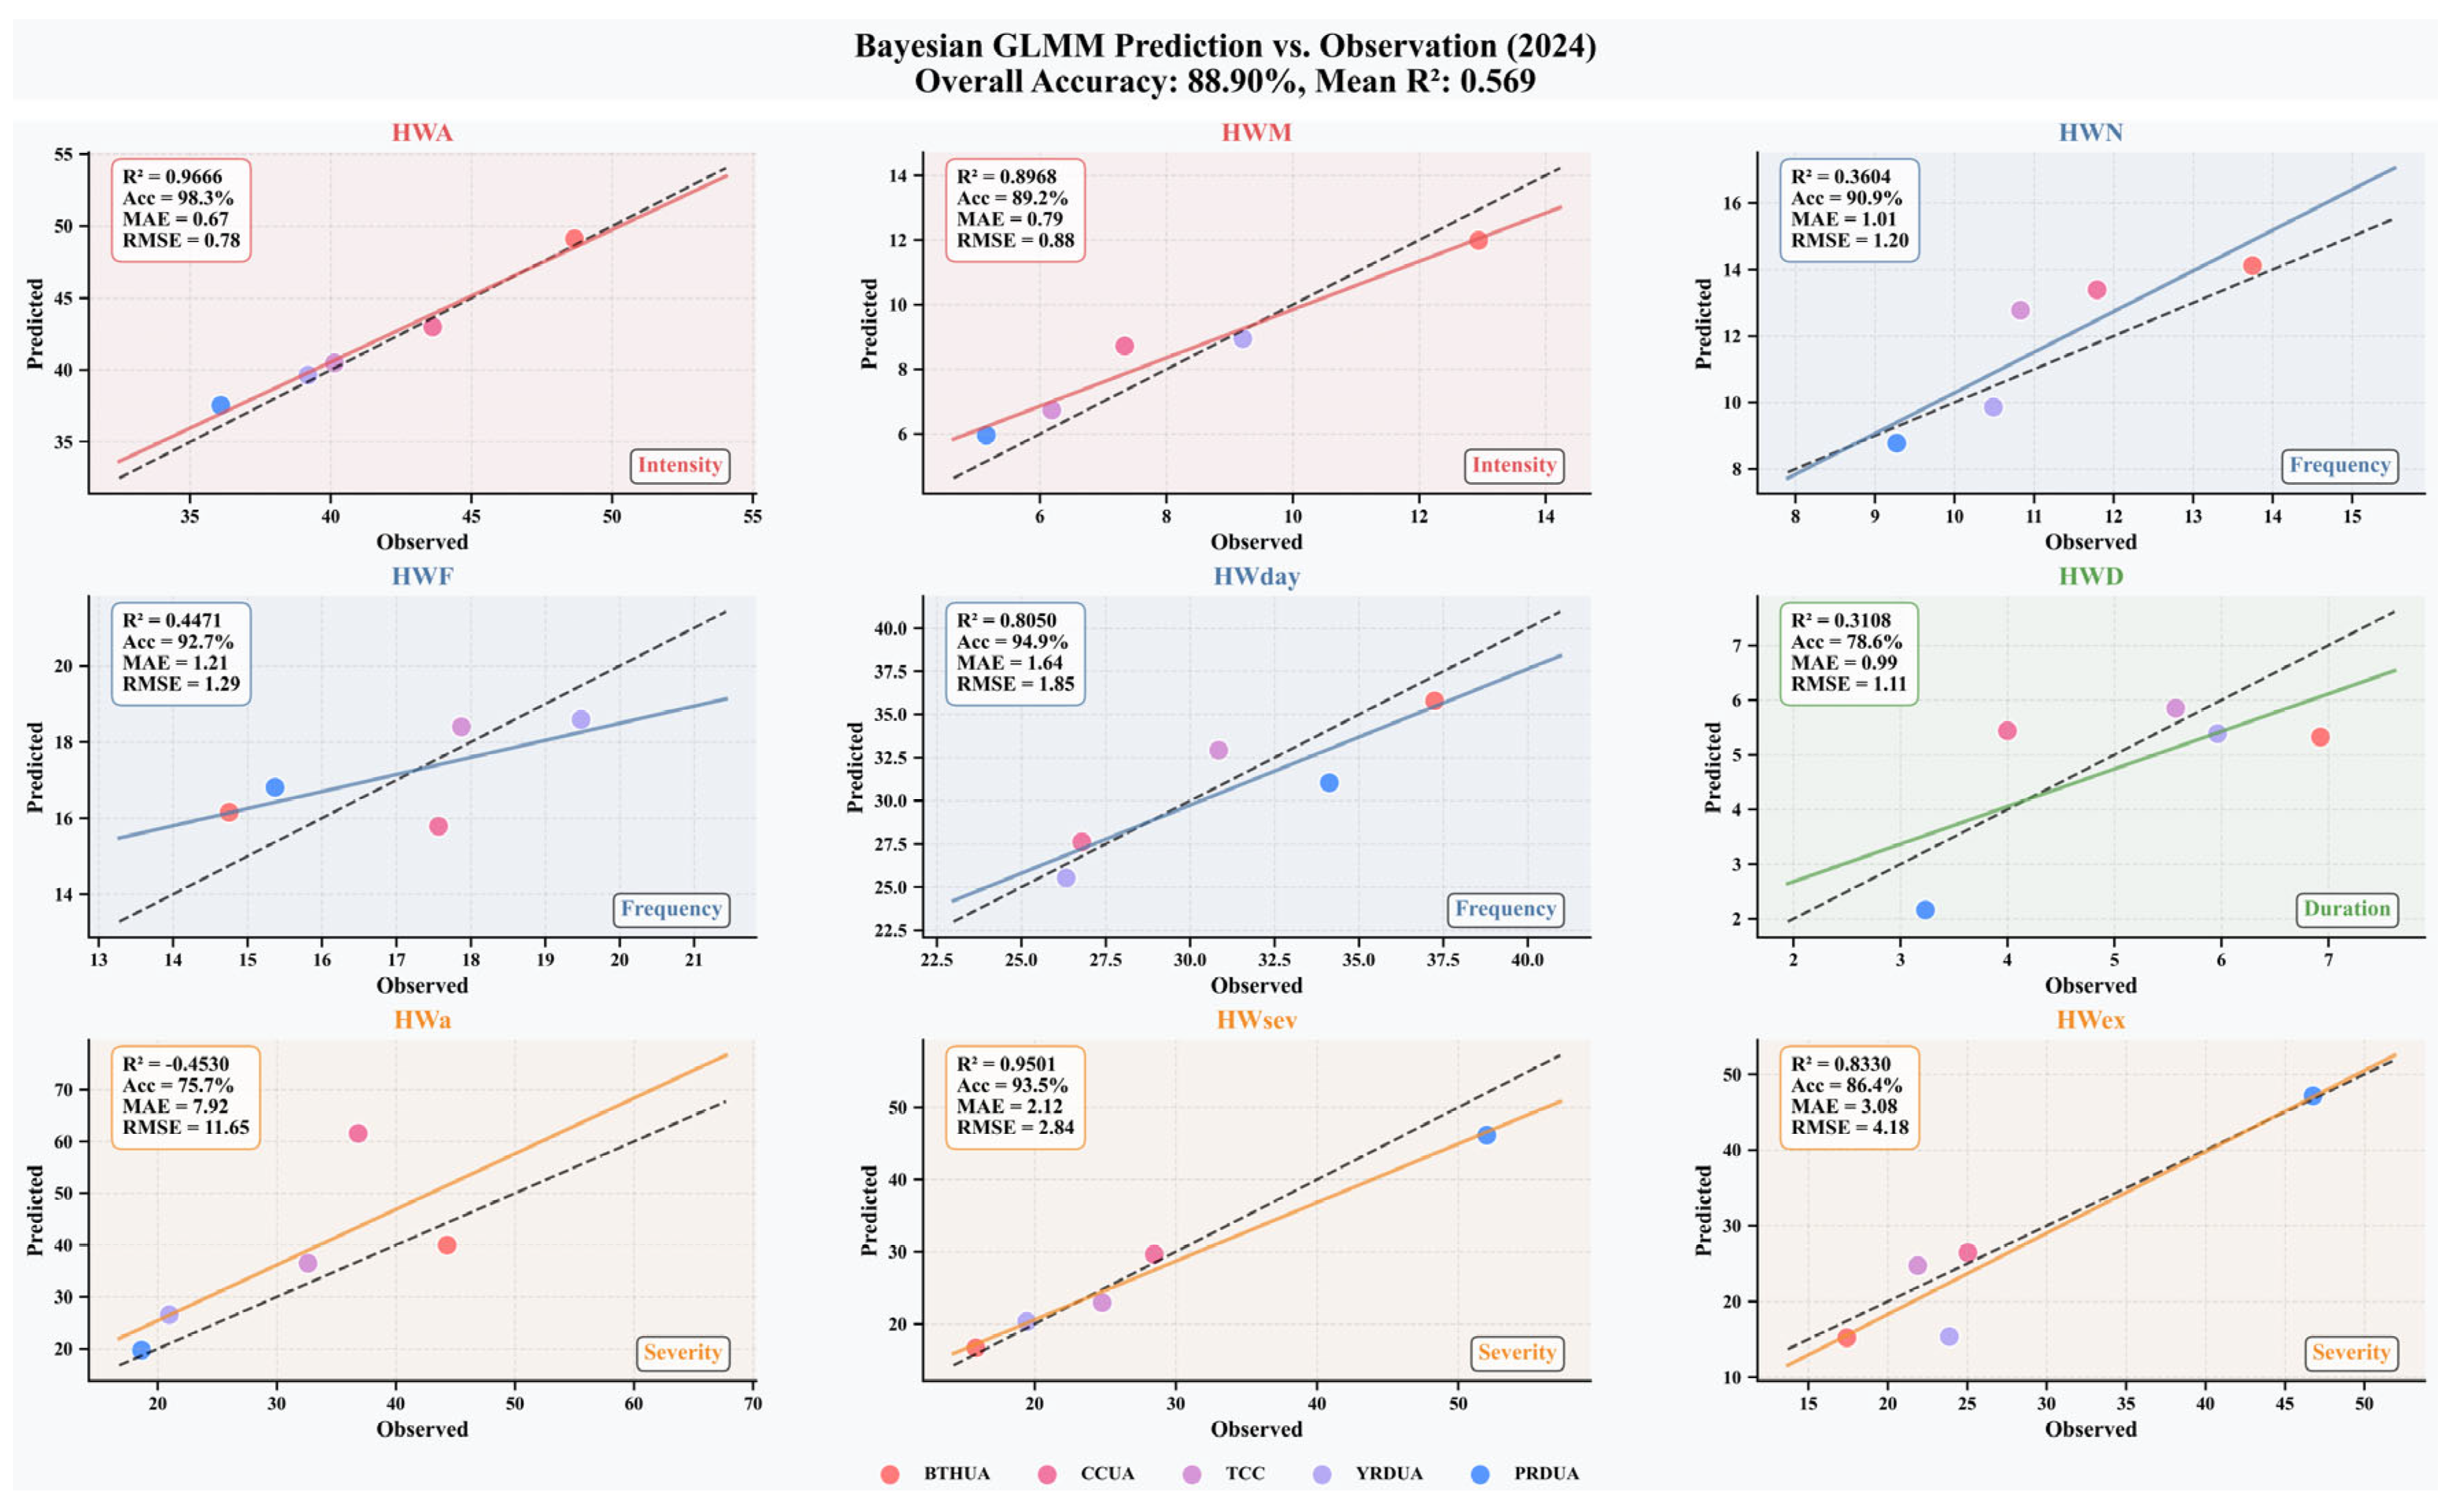
Based on environmental factor and heatwave indicator data for the five urban agglomerations from 2014 to 2023, we used the Bayesian GLMMs to predict heatwave indicators for each urban agglomeration in 2024. To assess model reliability, we collected actual observed heatwave indicator data for the five urban agglomerations in 2024 and compared them with the model predictions (Figure 11). The validation results showed that the model’s predictive ability varied across different types of heatwave indicators. Overall, the model demonstrated good predictive performance, with an average R² of 0.5694 and an average prediction accuracy of 88.90%. This indicates that the model can effectively capture future trends in heatwave characteristics based on historical relationships between environmental factors and heatwave indicators. In terms of indicator types, the model achieved the highest predictive accuracy for heatwave intensity indicators (HWA, HWM), with an average R² of 0.9314. The prediction accuracy for heatwave amplitude (HWA) was particularly high (R² = 0.9666, RMSE = 0.78°C), while that for heatwave magnitude (HWM) was slightly lower but still high (R² = 0.8968, RMSE = 0.88°C). For heatwave frequency indicators (HWN, HWF, HWday), the model showed moderate predictive ability (average R² = 0.5375). Among these, the prediction accuracy for heatwave days (HWday) was relatively high (R² = 0.8050, RMSE = 1.85 days), while that for heatwave frequency (HWF) was lower (R² = 0.4471, RMSE = 1.29 times). The predictive accuracy for heatwave duration indicators (HWD) was moderate (R² = 0.3108, RMSE = 1.11 days), while for heatwave severity indicators (HWa, HWsev, HWex), the model’s predictive accuracy was relatively low. The lowest accuracy was for cumulative heatwave intensity (HWa) (R² = –0.4530, RMSE = 11.65°C·days), while the accuracy for heatwave severity (HWsev) and heatwave excess index (HWex) was slightly higher (R² = 0.9501 and 0.9330, respectively).
Figure 11.
Bayesian GLMMs Prediction vs. Observation (2024).
4.3. Relationship between Heatwave and Emotional Responses
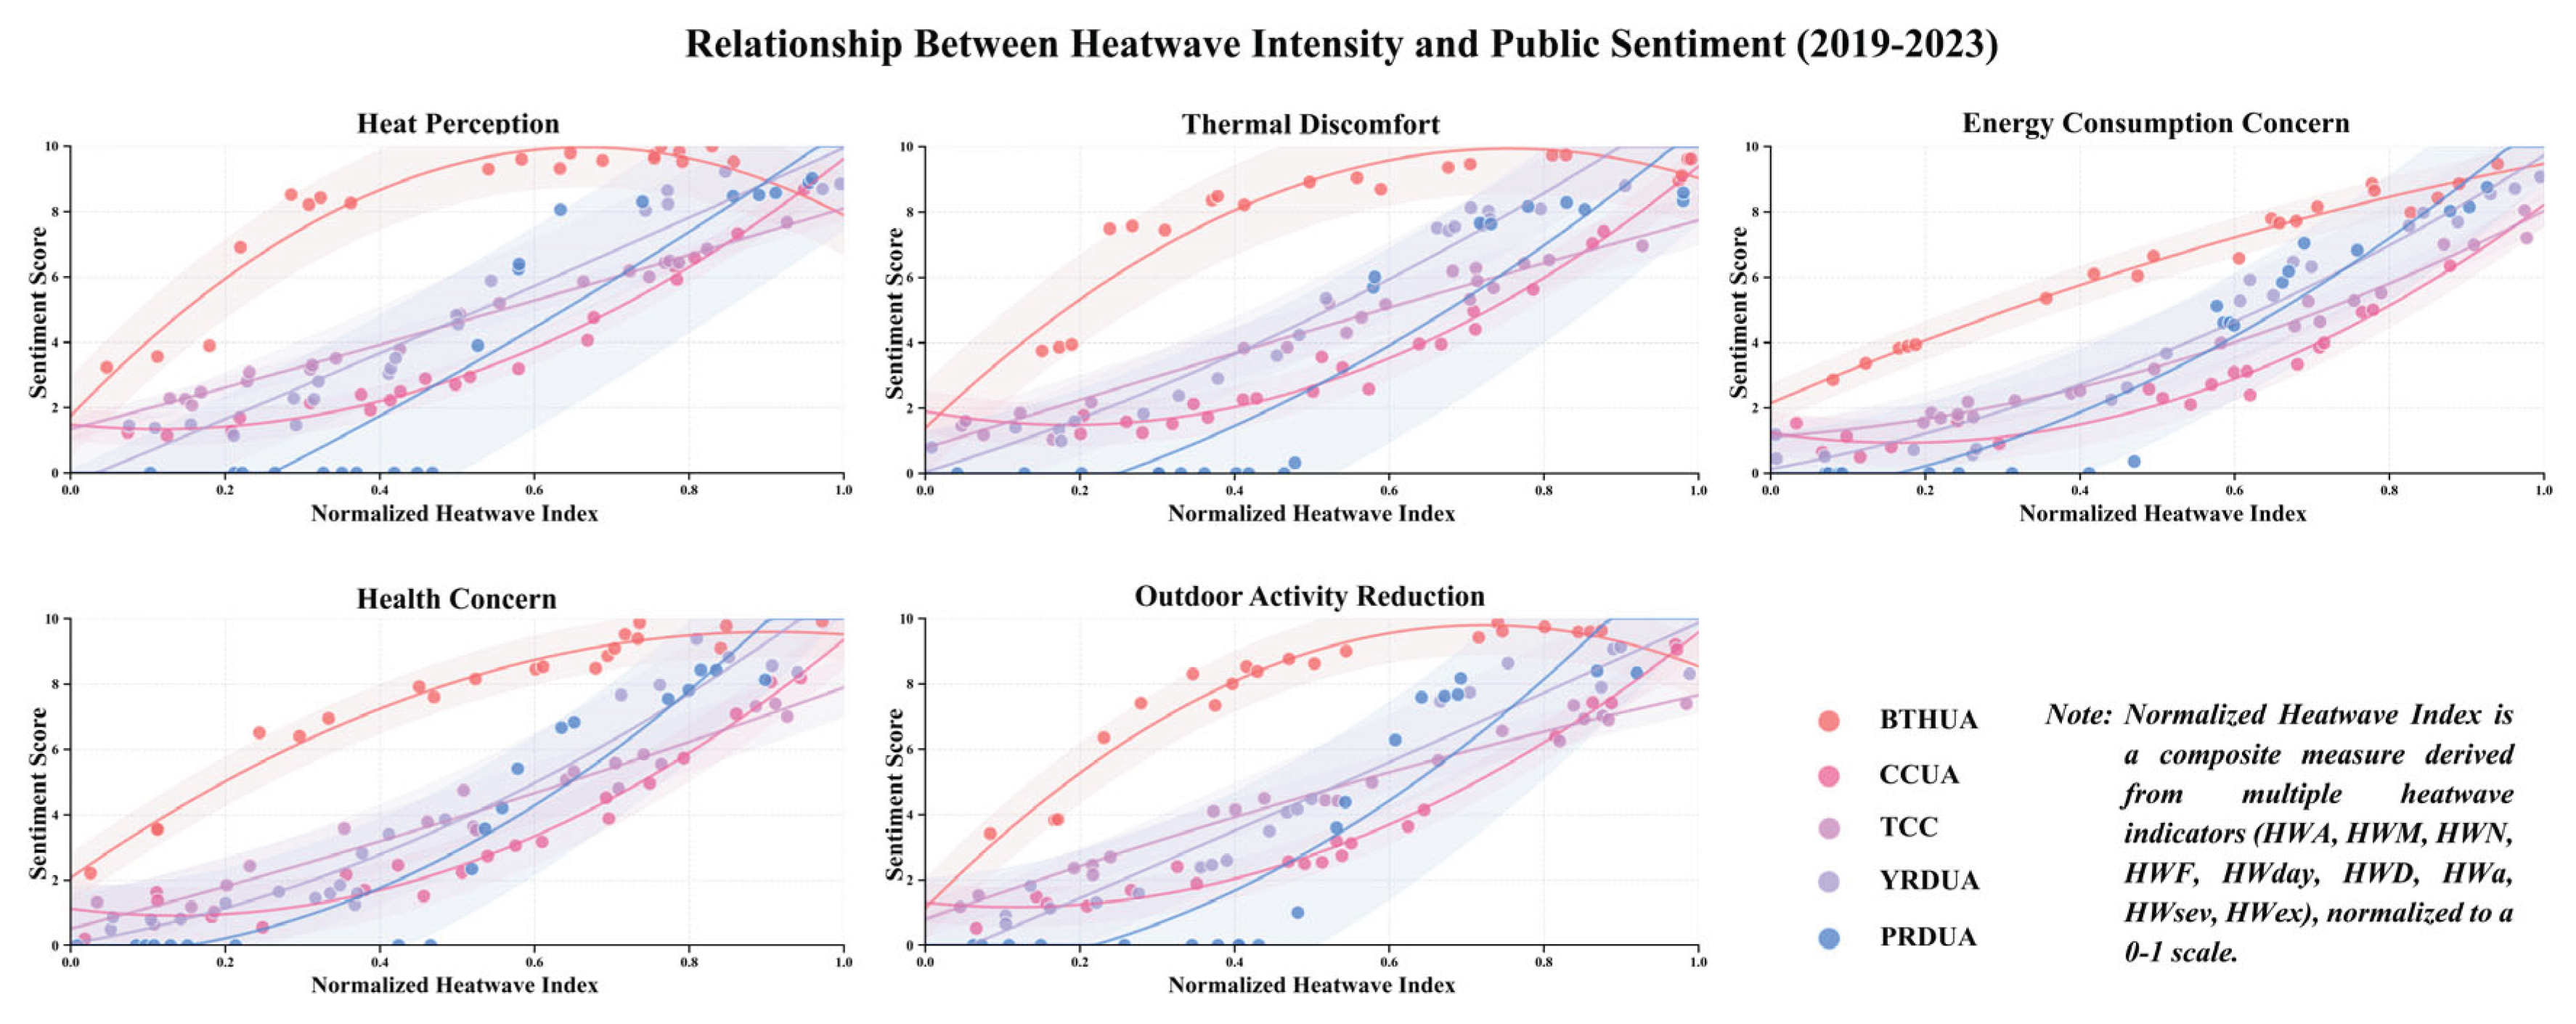
Through quantitative analysis of the associations between heatwave indicators and five sentiment dimensions (Heat Perception, Thermal Discomfort, Health Concern, Outdoor Activity Reduction, and Energy Consumption Concern), this study revealed the nonlinear characteristics and regional heterogeneity of heatwave–emotional response relationships.
The results showed that as the intensity of various heatwave indicators increased, the scores for all sentiment dimensions also increased, but the patterns of increase differed significantly (Figure 12). The Heat Perception dimension exhibited the most direct response, with scores rising significantly with increasing heatwave intensity in all urban agglomerations, from 2–4 at low intensity to 7–9 at high intensity. The Thermal Discomfort dimension showed a similar but slightly lower trend, indicating a high correlation but not complete consistency between the two. The Health Concern dimension changed little at low heatwave intensity (0–0.3), but showed an accelerated increase at moderate to high intensity (0.3–1.0), especially in BTHUA and CCUA. The Outdoor Activity Reduction dimension began to increase significantly at moderate heatwave intensity (around 0.4–0.6), suggesting that behavioral adjustments occur earlier than other emotional responses. The Energy Consumption Concern dimension showed the most pronounced increase at high heatwave intensity (0.7–1.0), particularly in YRDUA and PRDUA.
Figure 12.
Relationship Between Heatwave Intensity and Public Sentiment (2019-2023).
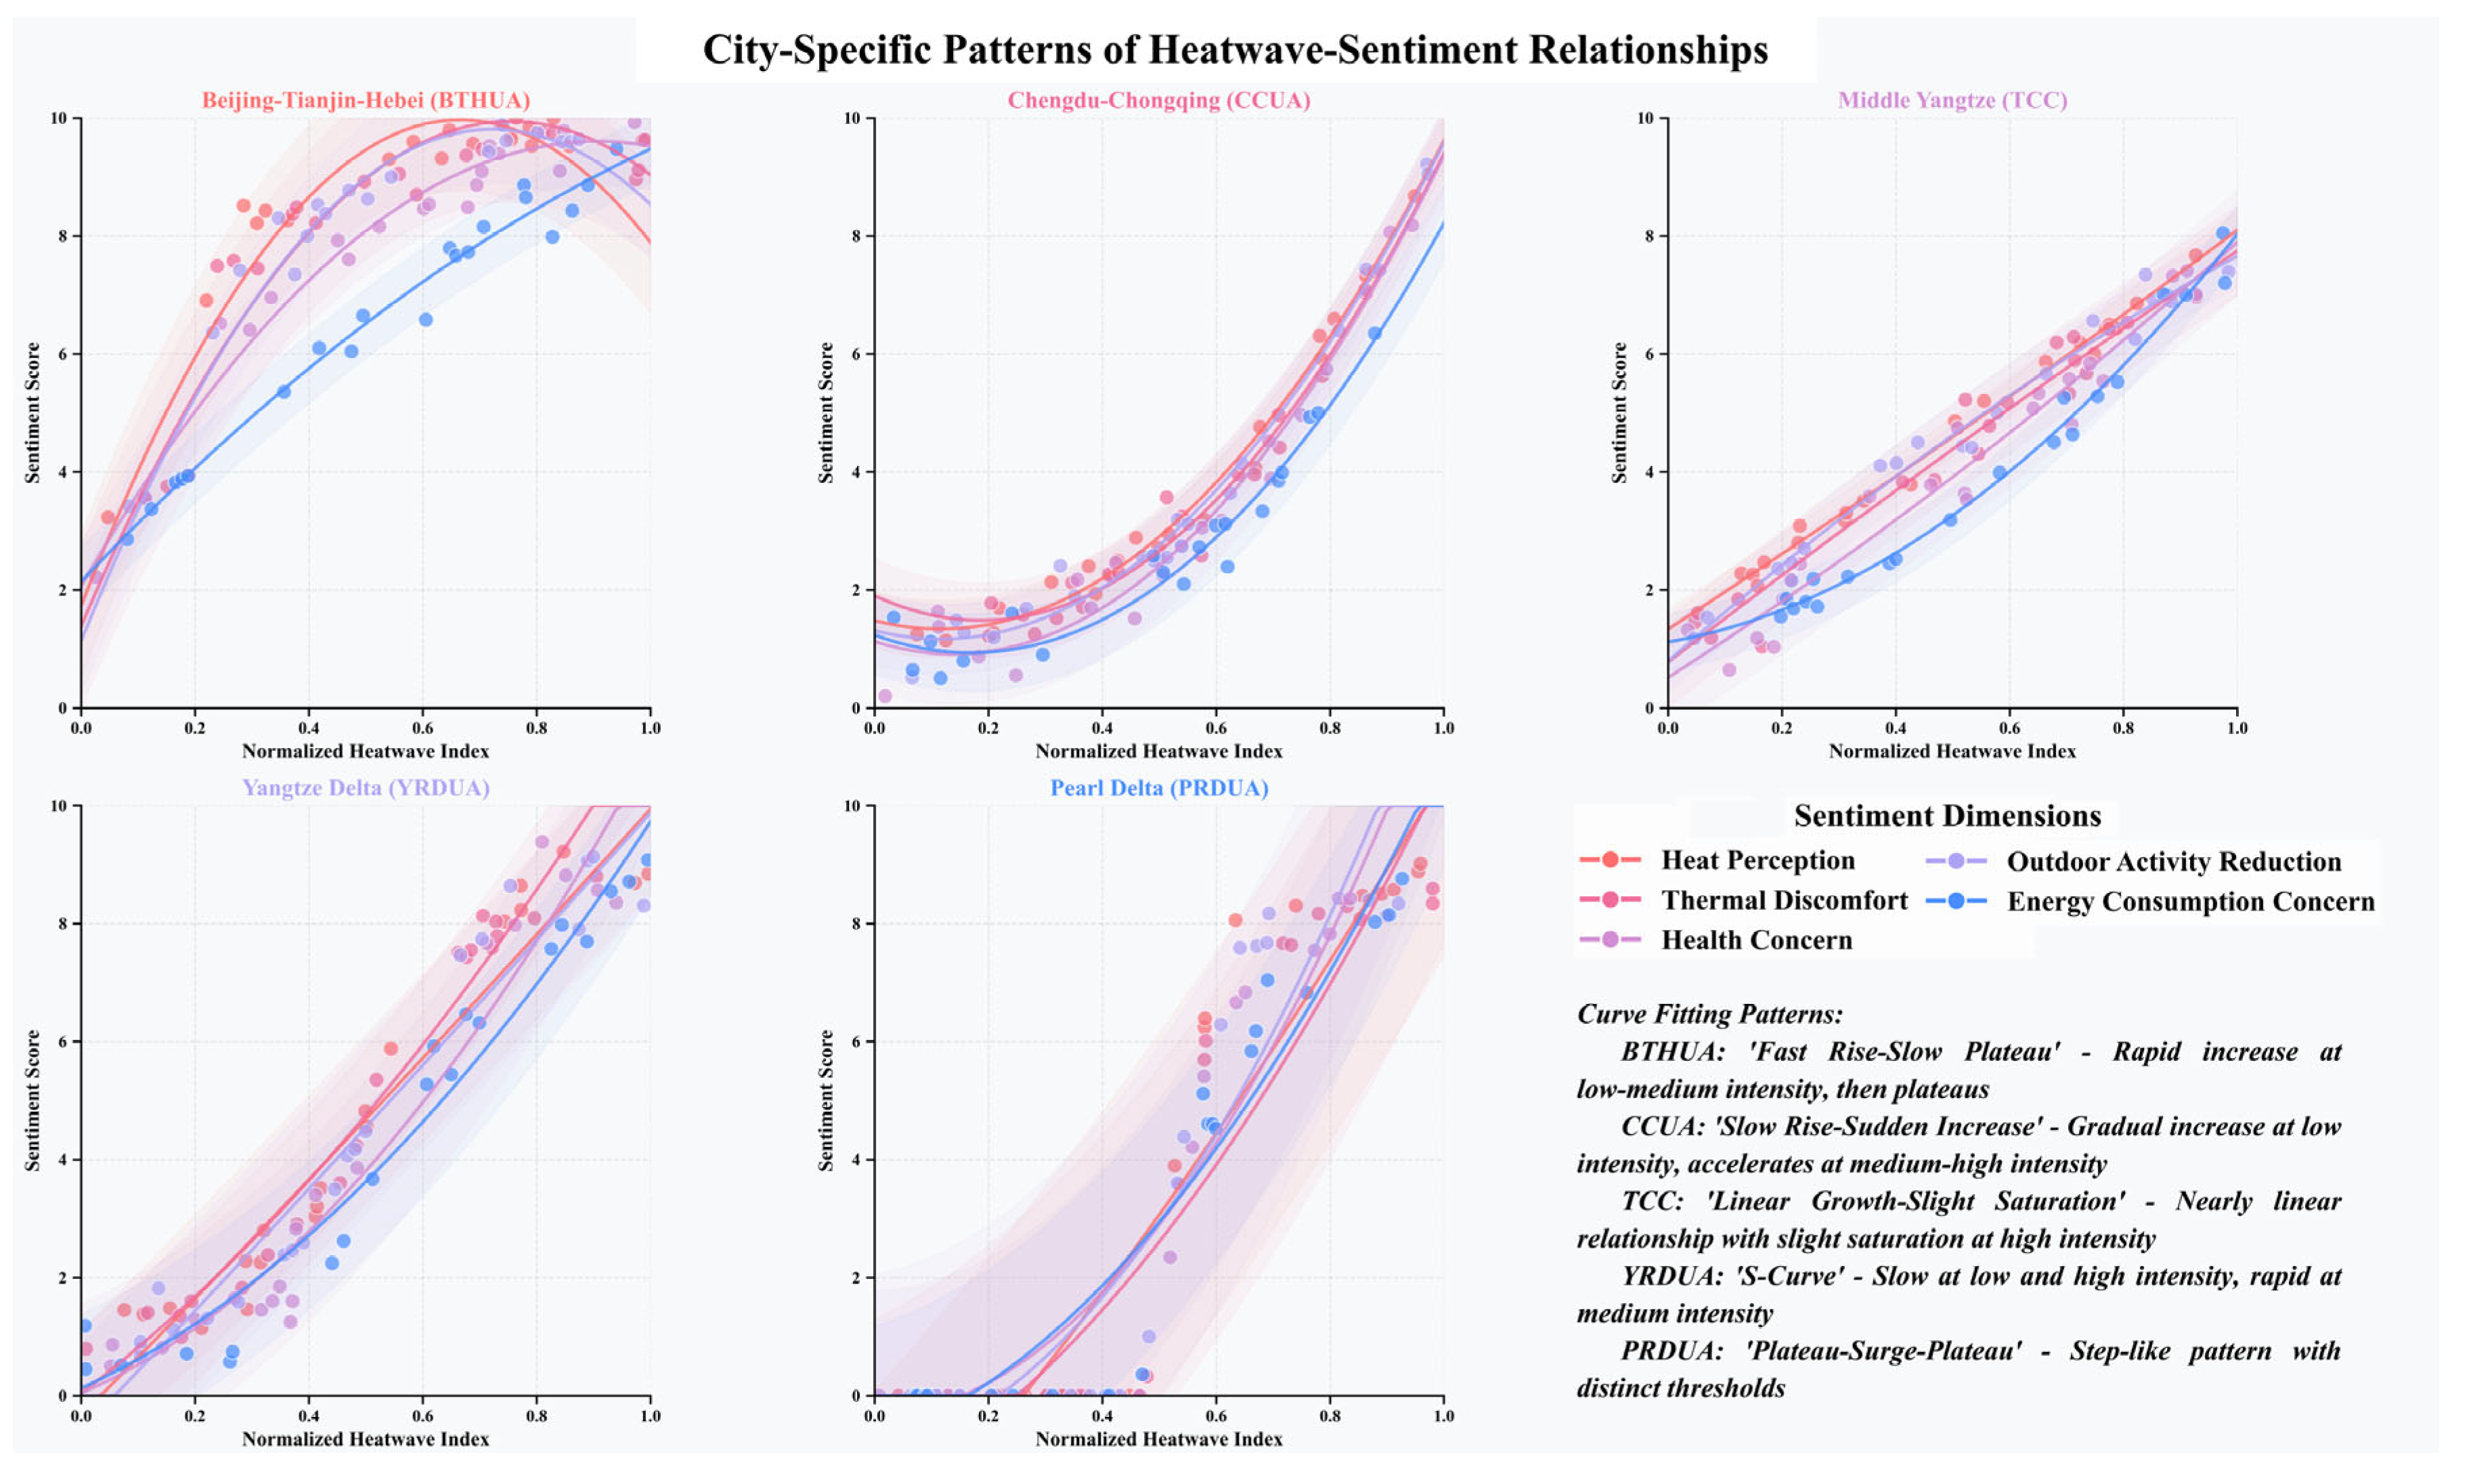
Significant differences were observed among the five urban agglomerations in the heatwave–emotional response relationship, each exhibiting a unique curve-fitting pattern (Figure 13). BTHUA: "Fast Rise–Slow Plateau" pattern, with sentiment scores rising rapidly in the 0.2–0.5 heatwave index range and leveling off in the 0.5–1.0 range. All sentiment dimensions in this urban agglomeration had generally higher scores than in others, especially at low to moderate heatwave intensity. CCUA: "Slow Rise–Sudden Increase" pattern, with slow growth in sentiment scores in the 0–0.6 range and accelerated increase in the 0.6–1.0 range. The Health Concern and Energy Consumption Concern dimensions showed particularly pronounced increases at high heatwave intensity. TCC: "Linear Growth–Slight Saturation" pattern, with sentiment scores nearly linearly related to heatwave intensity and only slight saturation at high intensity (0.8–1.0). Differences among sentiment dimensions were relatively small in this urban agglomeration. YRDUA: steady growth pattern, with relatively uniform changes in response to increasing heatwave intensity, especially in the Heat Perception and Thermal Discomfort dimensions. PRDUA: "Plateau–Surge–Plateau" stepwise pattern, with a marked jump in sentiment scores at a specific heatwave intensity threshold (around 0.2), forming a step-like change. The Energy Consumption Concern dimension showed the greatest variation in this urban agglomeration.
There were also differences among sentiment dimensions within the same urban agglomeration. The Heat Perception and Thermal Discomfort dimensions consistently showed the highest baseline scores and relatively stable growth trends across all urban agglomerations. The Health Concern dimension had lower scores at low heatwave intensity but increased most significantly at high intensity, especially in CCUA and PRDUA. The Outdoor Activity Reduction dimension began to increase at moderate heatwave intensity, indicating that this is an early behavioral response of the public to heatwaves. The Energy Consumption Concern dimension showed little difference among urban agglomerations, suggesting that the relationship between emotional tendencies toward energy use and heatwave intensity was relatively consistent across regions.
Figure 13.
City-Specific Patterns of Heatwave-Sentiment Relationships.
5. Discussion
5.1. Methodological Innovations
This study integrates remote sensing big data and its derivatives with social media data, combining the geographical causality model (GCCM), social media data analysis methods, and Bayesian GLMM from the perspective of urban agglomerations to explore the relationship between heatwaves and environmental factors and their spatiotemporal impacts on human emotional responses. This approach effectively overcomes the limitations imposed by the scarcity of spatiotemporal data in this research field, and the adopted data processing and analytical methods provide a valuable reference for similar studies at the regional scale.
First, a causality inference model was used for environmental variable selection, breaking through the traditional correlation-based screening framework. By constructing a spatiotemporal causality network between environmental factors and heatwave indicators, key variables directly driving heatwave intensity were identified, reducing the risk of spurious associations in traditional analyses [51,52]. This causality-based screening mechanism not only enhances model interpretability but also provides a more solid scientific foundation for understanding the mechanisms of heatwave formation.
Second, by utilizing geo-tagged, real-time, large-scale, and naturally expressed sentiment data from social media platforms such as Weibo, this study captures multidimensional public emotional responses during heatwaves, enabling timely monitoring of public sentiment fluctuations at the urban agglomeration scale. This approach avoids recall bias and representativeness issues inherent in traditional surveys [53] , and captures instantaneous emotional responses that are difficult to obtain through questionnaires, thus providing dynamic support for adaptive decision-making regarding heatwaves.
Third, the application of Bayesian GLMM establishes a more robust statistical framework for analyzing the relationships among heatwaves, environmental factors, and sentiment. Compared to traditional linear or generalized linear models, Bayesian GLMM can simultaneously address spatiotemporal dependencies and complex interactions between environmental factors and sentiment indices [26]. By incorporating random effects, spatial heterogeneity among urban agglomerations and interannual temporal variability are controlled. Parameter uncertainty estimation under the Bayesian framework is particularly valuable for risk assessment and management in climate change adaptation.
Finally, this study innovatively adopts the perspective of urban agglomeration populations, linking extreme climatic events and human well-being at the scale of population aggregation. By using urban agglomerations as analytical units and comprehensively considering intra-regional population distribution and environmental heterogeneity, the study reveals the impact of heatwaves on regional well-being. The constructed heatwave–emotional response curves for each urban agglomeration show significant differences, highlighting the necessity of regionally differentiated adaptation strategies.
5.2. Spatiotemporal Relationships of Environment on Heatwave
5.2.1. Causality
GCCM results indicate the existence of asymmetric bidirectional causality between environmental factors and heatwave indicators, consistent with the findings of Qiao et al. (2024) [19], Yang et al. (2024) [23], and others. The causal effect of environmental variables on heatwave indicators is much stronger than the causal feedback from heatwave indicators to the environment. This asymmetry reveals the dominant role of environmental factors in the formation of heatwaves and reflects the limited feedback capacity of heatwaves on environmental systems. In terms of causal strength, Albedo exhibits the strongest causality with heatwave indicators, while Elevation shows the weakest. This is consistent with the findings of Kala et al. (2022) [54] regarding the impact of urban surface albedo on heatwaves, further confirming the key role of surface radiation balance in heatwave formation. Moreover, different types of heatwave indicators respond differently to environmental factors. Heatwave intensity indicators are most sensitive to environmental factors, while severity indicators are less responsive. This finding aligns with Wei et al. (2024) [55] and others regarding the differential effects of urban environmental factors on various heatwave characteristics, indicating that environmental factors selectively influence different features of heatwaves, with the most pronounced regulatory effect on heatwave intensity.
5.2.2. Spatial Heterogeneity
The influence of environmental factors on heatwaves exhibits significant spatial heterogeneity among the five major urban agglomerations, both in terms of overall effect strength and the relative importance of specific environmental factors.
In terms of overall effect strength, the average effect of environmental factors on heatwaves decreases in the order: BTHUA, PRDUA, YRDUA, TCC, and CCUA. This spatial pattern partially agrees with the findings of Lei et al. (2024) [56] on the spatial distribution of heatwaves in China, but our study finds that the effect strength of environmental factors on heatwaves in PRDUA is lower than in BTHUA, which differs from conventional understanding. This may be due to the higher vegetation cover and water body proportion in PRDUA, which provide a stronger buffering effect against heatwave formation [55,57], a hypothesis supported by the higher causal strength of FVC and MNDWI in PRDUA in our GCCM model.
Regarding the relative importance of specific environmental factors, different urban agglomerations exhibit unique patterns. Albedo has the most significant impact in BTHUA and CCUA, consistent with the findings of Zhang et al. (2022) [58] and Zeng et al. (2024) [59] on the influence of surface material properties on the urban heat island effect. MNDWI has a much greater impact in YRDUA and PRDUA than in BTHUA, consistent with Xu et al. (2023) [60], who found that the water body cooling effect is more pronounced in humid southern regions. This spatial heterogeneity indicates that the mechanisms of heatwave formation are regulated by regional climate background [61], geographical environment, and urbanization characteristics [5,12], and that heatwave prevention and control strategies should consider such regional differences.
5.2.3 Temporal Heterogeneity
Temporal random effects analysis further reveals the temporal heterogeneity of heatwave risk from 2014 to 2023. Overall, heatwave risk shows an upward trend, but with significant interannual fluctuations. Heatwave risk from 2020 to 2023 is significantly higher than the decadal average, consistent with the conclusions of the IPCC Sixth Assessment Report regarding the increasing frequency and intensity of global extreme high-temperature events [62], and also with global temperature trends [2,63], reflecting the complexity and interannual variability of regional climate systems. However, a brief decline in heatwave risk was observed in 2018–2019, which may be attributed to internal variability of the regional climate system or short-term effects of specific circulation patterns, suggesting that both long-term climate change trends and short-term climate fluctuations should be considered in heatwave prediction.
5.2.4 Integrated Mechanisms of Environmental Factors on Heatwaves
Based on the results of GCCM and Bayesian GLMM, this study identifies the integrated mechanisms by which environmental factors influence heatwaves. Surface physical properties (Albedo, FVC, NDTI) have a significantly stronger impact on heatwaves than hydrological and topographic features (MNDWI, Elevation), supporting the urban heat island theory that urban surface material properties and vegetation cover are key regulators of the urban thermal environment [58,64,65,66]. Specifically, Albedo directly affects surface energy balance by regulating the absorption and reflection of solar radiation and is an important factor related to heatwaves. FVC reflects the effect of surface vegetation in regulating local temperature through transpiration and shading, playing a stabilizing and regulatory role in heatwaves [67]. NDTI reflects spatial differences in surface thermal inertia and heat capacity, significantly affecting the duration and intensity of heatwaves. MNDWI highlights the greater importance of natural cooling systems in regulating heatwaves in humid climates, while Elevation has a more pronounced effect on heatwaves in CCUA.
There are significant interactive and nonlinear effects of environmental factors on heatwaves. For example, the combination of high surface albedo and low vegetation cover produces a synergistic effect, significantly increasing heatwave risk [68], while the combination of high water body coverage and high vegetation cover produces an antagonistic effect, effectively reducing heatwave risk [57]. These complex interactions indicate that heatwave formation results from the joint action of multiple environmental factors at different spatiotemporal scales, and changes in a single factor may, through internal feedback mechanisms, produce complex cascading effects.
5.3 Spatiotemporal Relationships between Heatwaves and Sentiment
There is a clear positive correlation between heatwaves and emotional responses, but this relationship does not follow a simple linear pattern. As heatwave intensity increases, scores for all sentiment dimensions rise, but the growth curves exhibit dimension-specific characteristics. The Heat Perception dimension responds most directly and sensitively to heatwaves, increasing significantly even at low heatwave intensity, consistent with the findings of Thompson et al. (2018), Liu et al. (2021), and Weng et al. (2024) on climate perception [30,34,35], indicating high public sensitivity to temperature changes. The Health Concern dimension exhibits a clear threshold effect, with significant increases only after heatwave intensity reaches a moderate level, reflecting the threshold nature of public health risk perception.
Furthermore, the five urban agglomerations show significant spatial heterogeneity in the heatwave–sentiment relationship, forming five distinct response patterns. This spatial variability is reflected not only in the curve shapes but also in sentiment intensity and threshold levels. The "fast rise–slow plateau" pattern in BTHUA is related to its history of climate adaptation; residents in this region, long exposed to large temperature fluctuations, may have developed strong adaptive capacity. In contrast, the "plateau–surge–plateau" stepwise pattern in PRDUA reflects a unique response mechanism of residents in subtropical regions to heatwaves, possibly related to the region’s persistently hot and humid climate.
In addition, different sentiment dimensions exhibit temporal sequence differences in response to changes in heatwave intensity. The Outdoor Activity Reduction dimension begins to increase significantly at moderate heatwave intensity, preceding other sentiment dimensions, indicating that behavioral adjustment is an early public response mechanism to heatwaves. This finding is consistent with Hansen et al. (2015) regarding public behavioral adaptation strategies during heatwave events [69]. The Energy Consumption Concern dimension increases significantly only at high heatwave intensity (0.7–1.0), suggesting that emotional responses related to energy use may be a lagged effect of heatwave impacts.
Finally, this study also finds intra-urban agglomeration differences in the heatwave–sentiment relationship. Within the same urban agglomeration, different sentiment dimensions exhibit distinct response patterns and sensitivities to heatwaves, which may reflect the heterogeneity of socioeconomic structure and environmental conditions within urban agglomerations. For example, in CCUA, the Health Concern and Energy Consumption Concern dimensions show particularly pronounced increases at high heatwave intensity, possibly related to the region’s complex topography and relatively low urbanization level.
5.4 Limitations
Despite the progress made in exploring the relationships among heatwaves, environmental factors, and emotional responses, several limitations remain that may affect the interpretation and generalizability of the results.
First, although social media data provide a large sample of emotional expressions, there is inherent selection bias. The Weibo user base is mainly composed of young people and urban residents, which may inadequately capture the emotional responses of older adults, rural residents, and other groups [70]. In addition, emotional expression on the Weibo platform may be influenced by social desirability effects and platform algorithms, leading to amplification or suppression of certain emotions. Such data source bias may result in the findings not fully reflecting the true emotional state of the entire population, especially the emotional responses of more vulnerable groups such as the elderly during heatwave events, which may be systematically underestimated [71].
In terms of methodology, although the GCCM model effectively addresses multicollinearity and identifies causality, its handling of spatial autocorrelation remains limited. In highly urbanized areas, spatial interactions among environmental factors may be more complex, and relying solely on GCCM may not fully capture such complex spatial dependency structures. Meanwhile, although Bayesian GLMM can handle multilevel data, the increased model complexity raises uncertainty in parameter estimation, especially when the sample size is relatively limited [27].
Regarding spatiotemporal scales, although the study period (2014–2023) covers a decade, it is still relatively short in the context of long-term climate change, which may limit the ability to capture long-term evolution trends in heatwave patterns. Spatially, although the study covers China’s five major urban agglomerations, intra-agglomeration heterogeneity (e.g., urban–suburban gradients, socioeconomic differences) may be averaged out [72], leading to insufficient identification of special patterns in local hotspot areas.
Regarding the selection of environmental factors, although the six environmental factors chosen in this study cover the main natural and anthropogenic environmental characteristics, some potentially important factors, such as urban morphology, building density, and the quality of green infrastructure, may have been overlooked. Furthermore, although remote sensing data provide large-scale environmental information, their spatial and temporal resolution limitations may hinder the capture of small-scale environmental features, especially in highly heterogeneous urban environments. In addition, causality is often nonlinear and multidirectional and may be influenced by unobserved variables. Although this study considers the bidirectional relationship between environmental factors and heatwaves, it may not fully exclude the influence of other potential confounders, such as large-scale climate patterns and urban development policies.
6. Conclusions
Through the integration of multi-source data and a multi-level analytical framework, this study systematically investigated the complex spatiotemporal relationships among heatwaves, environmental factors, and public emotional responses in China’s five major urban agglomerations, revealing the environmental driving mechanisms of heatwave formation and their multidimensional impacts on public sentiment. The main conclusions are as follows:
(i) There exists a significant asymmetric bidirectional causality between environmental factors and heatwave indicators, with the influence of environmental factors on heatwaves being much stronger than the feedback effect of heatwaves on environmental factors. Surface physical properties exert a significantly greater impact on heatwaves than hydrological and topographic features, with surface albedo exhibiting the strongest causal relationship, while topographic factors have the weakest effect. This finding supports the urban heat island theory, namely, that urban surface material properties and vegetation cover are key regulators of the urban thermal environment.
(ii) The influence of environmental factors on heatwaves exhibits marked spatial heterogeneity. The mechanisms of heatwave formation differ significantly among urban agglomerations, with the overall effect strength of environmental factors decreasing in the order of BTHUA, PRDUA, YRDUA, TCC, and CCUA. The relative importance of specific environmental factors also varies by urban agglomeration: surface albedo has the most significant impact in BTHUA and CCUA; the water body index plays a more prominent role in YRDUA and PRDUA; vegetation cover has a stronger effect in PRDUA and YRDUA; and topographic factors are relatively more important in CCUA. This spatial heterogeneity reflects the complex regulation of heatwave formation by regional climate background, geographical environment, and urbanization characteristics.
(iii) Heatwave exposure showed an overall increasing trend from 2014 to 2023, albeit with significant interannual fluctuations. Heatwave exposure from 2020 to 2023 was significantly higher than the decadal average, indicating an increasing threat from heatwaves in recent years.
(iv) There is a nonlinear relationship between heatwaves and public emotional responses, with pronounced regional differences. As heatwave intensity increases, all five sentiment dimensions (heat perception, thermal discomfort, health concern, outdoor activity reduction, and energy consumption concern) show an upward trend, but the patterns of increase differ. The heat perception dimension exhibits the most direct response; the health concern dimension accelerates in the moderate-to-high heatwave intensity range; the outdoor activity reduction dimension begins to increase significantly at moderate heatwave intensity, indicating that behavioral adjustment precedes other emotional responses; and the energy consumption concern dimension increases most markedly at high heatwave intensity. Each urban agglomeration presents a unique heatwave–sentiment relationship pattern, reflecting differences in regional sociocultural backgrounds and climate adaptation capacities.
In summary, by combining causality inference and mixed-effects models, this study elucidates the complex spatiotemporal relationships among environmental factors, heatwaves, and emotional responses, providing new perspectives for understanding the mechanisms of urban thermal environment formation and its impacts on public mental health. The findings not only enrich the theoretical understanding of urban thermal environments but also provide a scientific basis for heatwave early warning, risk assessment, and public health protection based on environmental factors, offering important practical implications for guiding urban planning, optimizing spatial structure, and formulating climate adaptation strategies.
Author Contributions
Conceptualization, S.S. and Q.Z.; data curation, J.K., Q.Y., Y.C. and S.S.; formal analysis, S.S. and Q.Y.; funding acquisition, Q.Z; investigation, S.S.; methodology, S.S.; project administration, Q.Z. and S.S; resources, S.S.; software, S.S.; supervision, Q.Z.; validation, J.K., Q.Y. and Y.C.; visualization, S.S.; writing—original draft preparation, S.S. and Q.Z.; writing—review and editing, S.S. and Q.Z. All authors have read and agreed to the published version of the manuscript.
Funding
This research was funded by the National Natural Science Foundation of China, grant number 31901155.
Data Availability Statement
The data that support the findings of this study are available from the corresponding author upon reasonable request.
Acknowledgments
During the preparation of this manuscript, the authors used LLMs for the purposes of language polishing and improving the clarity of the English text. The authors have reviewed and edited the output and take full responsibility for the content of this publication.
Conflicts of Interest
The authors declare no conflicts of interest.
References
- Perkins-Kirkpatrick, S. E. and S. C. Lewis. "Increasing trends in regional heatwaves." Nature Communications 11 (2020): 8. 10.1038/s41467-020-16970-7. <Go to ISI>://WOS:000546623500057. [CrossRef]
- Esper, J., M. Torbenson and U. Büntgen. "2023 summer warmth unparalleled over the past 2,000 years." Nature (2024): 11. 10.1038/s41586-024-07512-y. <Go to ISI>://WOS:001260579300001. [CrossRef]
- WHO. "Heat and health." World Health Organization: 2024. https://www.who.int/news-room/fact-sheets/detail/climate-change-heat-and-health.
- WHO. "Scale and nature of the health impacts of heat." World Health Organization: 2024. https://www.who.int/multi-media/details/scale-and-nature-of-the-health-impacts-of-heat.
- Röthlisberger, M. and L. Papritz. "Quantifying the physical processes leading to atmospheric hot extremes at a global scale." Nature Geoscience 16 (2023): 210-16. 10.1038/s41561-023-01126-1. https://doi.org/10.1038/s41561-023-01126-1. [CrossRef]
- Yin, J., P. Gentine, L. J. Slater, L. Gu, Y. Pokhrel, N. Hanasaki, S. Guo, L. Xiong and W. Schlenker. "Future socio-ecosystem productivity threatened by compound drought–heatwave events." Nature Sustainability 6 (2023): 259-72.
- Deng, X. W., Q. Cao, L. C. Wang, W. Wang, S. Wang, S. Q. Wang and L. Z. Wang. "Characterizing urban densification and quantifying its effects on urban thermal environments and human thermal comfort." Landscape and Urban Planning 237 (2023): 16. 10.1016/j.landurbplan.2023.104803. <Go to ISI>://WOS:001017585700001. [CrossRef]
- Yang, Q. Q., Y. Xu, X. H. Tong, T. Hu, Y. Liu, T. C. Chakraborty, R. Yao, C. J. Xiao, S. R. Chen and Z. H. Ma. "Influence of urban extent discrepancy on the estimation of surface urban heat island intensity: A global-scale assessment in 892 cities." Journal of Cleaner Production 426 (2023): 14. 10.1016/j.jclepro.2023.139032. <Go to ISI>://WOS:001087024200001. [CrossRef]
- Ashwini, K., B. S. Sil, A.-A. Kafy, H. A. Altuwaijri, H. Nath and Z. A. Rahaman. "Harnessing machine learning algorithms to model the association between land use/land cover change and heatwave dynamics for enhanced environmental management." Land (2024):.
- Shafiei Shiva, J. How heatwaves are changing urban livability across the united states: A case study in ten communities. 2020,.
- Dou, M. X., Y. D. Wang, M. L. Qiao, D. Y. Wang, J. Y. Gong and Y. Y. Gu. "Public responses to heatwaves in chinese cities: A social media-based geospatial modelling approach." International Journal of Applied Earth Observation and Geoinformation 134 (2024): 13. 10.1016/j.jag.2024.104205. <Go to ISI>://WOS:001331901100001. [CrossRef]
- Domeisen, D. I. V., E. A. B. Eltahir, E. M. Fischer, R. Knutti, S. E. Perkins-Kirkpatrick, C. Schar, S. I. Seneviratne, A. Weisheimer and H. Wernli. "Prediction and projection of heatwaves." Nature Reviews Earth & Environment 4 (2023): 36-50. 10.1038/s43017-022-00371-z. <Go to ISI>://WOS:000898684500001. [CrossRef]
- Horton, R. M., J. S. Mankin, C. Lesk, E. Coffel and C. Raymond. "A review of recent advances in research on extreme heat events." Current Climate Change Reports 2 (2016): 242-59. 10.1007/s40641-016-0042-x. <Go to ISI>://WOS:000463899600011. [CrossRef]
- Luo, M. and N. C. Lau. "Increasing human-perceived heat stress risks exacerbated by urbanization in china: A comparative study based on multiple metrics." Earths Future 9 (2021): 13. 10.1029/2020ef001848. <Go to ISI>://WOS:000677819700022. [CrossRef]
- Chitsaz, F., A. Gohari, M. R. Najafi, M. J. Zareian and A. T. Haghighi. "Heatwave duration and heating rate in a non-stationary climate: Spatiotemporal pattern and key drivers." Earths Future 11 (2023): 18. 10.1029/2023ef003995. <Go to ISI>://WOS:001128316200001. [CrossRef]
- Chongtaku, T., A. Taparugssanagorn, H. Miyazaki and T. W. Tsusaka. "Enhanced spatiotemporal heatwave analysis in urban and nonurban thai environments through integration of in-situ and remote sensing data." Ieee Journal of Selected Topics in Applied Earth Observations and Remote Sensing 17 (2024): 19174-93. 10.1109/jstars.2024.3481460. <Go to ISI>://WOS:001346124200016. [CrossRef]
- Dong, C. X., X. F. Wang, Y. H. Ran and Z. Nawaz. "Heatwaves significantly slow the vegetation growth rate on the tibetan plateau." Remote Sensing 14 (2022): 17. 10.3390/rs14102402. <Go to ISI>://WOS:000801874000001. [CrossRef]
- Guo, X. Z., Y. J. Yao, Q. X. Tang, S. L. Liang, C. L. Shao, J. B. Fisher, J. Q. Chen, K. Jia, X. T. Zhang, K. Shang, et al. "Multimodel ensemble estimation of landsat-like global terrestrial latent heat flux using a generalized deep cnn-lstm integration algorithm." Agricultural and Forest Meteorology 349 (2024): 22. 10.1016/j.agrformet.2024.109962. <Go to ISI>://WOS:001209198300001. [CrossRef]
- Qiao, Z., N. Wang, J. Y. Chen, X. L. Xu, L. Liu and D. R. Han. "Understanding the differences in the contribution and impact of urbanization on urban warming during heatwave and non-heatwave periods in china." Journal of Cleaner Production 474 (2024): 13. 10.1016/j.jclepro.2024.143626. <Go to ISI>://WOS:001317673600001. [CrossRef]
- Zhou, Y., H. Zhao, S. Mao, G. Zhang, Y. Jin, Y. Luo, W. Huo, Z. Pan, P. An and F. Lun. "Studies on urban park cooling effects and their driving factors in china: Considering 276 cities under different climate zones." Building and Environment 222 (2022): 10.1016/j.buildenv.2022.109441. <Go to ISI>://WOS:000888246900001. [CrossRef]
- Yang, M., C. Ren, H. Wang, J. Wang, Z. Feng, P. Kumar, F. Haghighat and S.-J. Cao. "Mitigating urban heat island through neighboring rural land cover." Nature Cities 1 (2024): 522-32. 10.1038/s44284-024-00091-z. https://doi.org/10.1038/s44284-024-00091-z. [CrossRef]
- Qian, C., Y. B. Ye, J. C. Jiang, Y. Y. Zhong, Y. T. Zhang, I. Pinto, C. R. Huang, S. H. Li and K. Wei. "Rapid attribution of the record-breaking heatwave event in north china in june 2023 and future risks." Environmental Research Letters 19 (2024): 9. 10.1088/1748-9326/ad0dd9. <Go to ISI>://WOS:001115859600001. [CrossRef]
- Yang, X. L., Z. H. Wang, C. H. Wang and Y. C. Lai. "Megacities are causal pacemakers of extreme heatwaves." Npj Urban Sustainability 4 (2024): 10. 10.1038/s42949-024-00148-x. <Go to ISI>://WOS:001174250800001. [CrossRef]
- Yang, Y. R. and C. X. Yuan. "Causality of compound extreme heat-precipitation events in northeastern china." Atmospheric Research 316 (2025): 12. 10.1016/j.atmosres.2025.107975. <Go to ISI>://WOS:001426482700001. [CrossRef]
- Gao, B. B., J. Y. Yang, Z. Y. Chen, G. Sugihara, M. C. Li, A. Stein, M. P. Kwan and J. F. Wang. "Causal inference from cross-sectional earth system data with geographical convergent cross mapping." Nature Communications 14 (2023): 12. 10.1038/s41467-023-41619-6. <Go to ISI>://WOS:001075884500017. [CrossRef]
- Hadeld, J. "Mcmcglmm course notes." Presented at 2012.
- Brooks, M. E., K. Kristensen, K. J. v. Benthem, A. Magnusson, C. W. Berg, A. Nielsen, H. J. Skaug, M. Mächler and B. M. Bolker. "Glmmtmb balances speed and flexibility among packages for zero-inflated generalized linear mixed modeling." R J. 9 (2017): 378.
- Perkins, S. E. "A review on the scientific understanding of heatwaves—their measurement, driving mechanisms, and changes at the global scale." Atmospheric Research 164 (2015): 242-67.
- Cheng, Y., Z. Yu, C. Xu, G. Manoli, X. Ren, J. Zhang, Y. Liu, R. Yin, B. Zhao and H. Vejre. "Climatic and economic background determine the disparities in urbanites' expressed happiness during the summer heat." Environmental science & technology (2023):.
- Thompson, R., R. Hornigold, L. Page and T. D. Waite. "Associations between high ambient temperatures and heat waves with mental health outcomes: A systematic review." Public health 161 (2018): 171-91.
- Cecinati, F., T. Matthews, S. Natarajan, N. J. McCullen and D. A. Coley. "Mining social media to identify heat waves." International Journal of Environmental Research and Public Health 16 (2019):.
- Su, L., S. Zhou, M. P. Kwan, Y. Chai and X. Zhang. "The impact of immediate urban environments on people’s momentary happiness." Urban Studies 59 (2021): 140 - 60.
- Hua, Y., Y. Qiu and X. Tan. "The effects of temperature on mental health: Evidence from china." Journal of Population Economics 36 (2022): 1293 - 332.
- Weng, H. D., L. Deng, T. Y. Wang, H. C. Xu, J. L. Wu, Q. J. Zhou, L. T. Yu, B. L. Chen, L. A. Huang, Y. B. Qu, et al. "Humid heat environment causes anxiety-like disorder via impairing gut microbiota and bile acid metabolism in mice." Nature Communications 15 (2024): 18. 10.1038/s41467-024-49972-w. <Go to ISI>://WOS:001264948100009. [CrossRef]
- Liu, J., B. M. Varghese, A. L. Hansen, J. Xiang, Y. Zhang, K. Dear, M. Gourley, T. R. Driscoll, G. G. Morgan, A. G. Capon, et al. "Is there an association between hot weather and poor mental health outcomes? A systematic review and meta-analysis." Environment international 153 (2021): 106533.
- Wong, C. "What is the hottest temperature humans can survive? These labs are redefining the limit." Nature 632 (2024): 713-15. 10.1038/d41586-024-02422-5. <Go to ISI>://WOS:001297098500004. [CrossRef]
- Kramer, A. D. I., J. Guillory and J. T. Hancock. "Experimental evidence of massive-scale emotional contagion through social networks." Proceedings of the National Academy of Sciences 111 (2014): 8788 - 90.
- Cheng, Y. Y., M. Browning, B. Zhao, B. Qiu, H. Y. Wang and J. G. Zhang. "How can urban green space be planned for a 'happy city'? Evidence from overhead- to eye-level green exposure metrics." Landscape and Urban Planning 249 (2024): 10. 10.1016/j.landurbplan.2024.105131. <Go to ISI>://WOS:001250825000001. [CrossRef]
- Fang, C. and D. Yu. "Urban agglomeration: An evolving concept of an emerging phenomenon." Landscape and Urban Planning 162 (2017): 126-36. 10.1016/j.landurbplan.2017.02.014. <Go to ISI>://WOS:000399627800012. [CrossRef]
- Muñoz-Sabater, J., E. Dutra, A. Agustí-Panareda, C. Albergel, G. Arduini, G. Balsamo, S. Boussetta, M. Choulga, S. Harrigan, H. Hersbach, et al. "Supplementary material to "era5-land: A state-of-the-art global reanalysis dataset for land applications"." Earth System Science Data (2021):.
- Didan, K. Modis/terra vegetation indices 16-day l3 global 250m sin grid v061. 2021,.
- Survey, U. S. G. Usgs landsat 8 collection 2 tier 1 raw scenes.
- Copernicus. Copernicus dem - global and european digital elevation model. 2015,.
- Elvidge, C. D., M. Zhizhin, T. Ghosh, F.-C. Hsu and J. Taneja. "Annual time series of global viirs nighttime lights derived from monthly averages: 2012 to 2019." Remote Sensing 13 (2021): 10.3390/rs13050922. <Go to ISI>://WOS:000628493800001. [CrossRef]
- Lebakula, V., J. Epting, J. Moehl, C. Stipek, D. Adams, A. Reith, J. Kaufman, J. Gonzales, B. Reynolds, S. Basford, et al. Landscan silver edition. tion. Oak Ridge, TN: Oak Ridge National Laboratory, 2024,.
- Han-Qiu, X. "A study on information extraction of water body with the modified normalized difference water index (mndwi)." National Remote Sensing Bulletin (2005): 589-95.
- McInerney, M. and R. Lozar. "Comparison of methodologies to derive a normalized difference thermal index (ndti) from atlas imagery." Presented at Proceedings of the ASPRS 2007 Annual Conference, 2007.
- Zhou, Y., S. W. Gu, H. Yang, Y. Li, Y. J. Zhao, Y. C. Li and Q. Y. Yang. "Spatiotemporal variation in heatwaves and elderly population exposure across china." Science of The Total Environment 917 (2024): 16. 10.1016/j.scitotenv.2024.170245. <Go to ISI>://WOS:001178850600001. [CrossRef]
- WMO. World Meteorological Organization Commission for Climatology (CCL), https://wmo.int/.
- Nishant, N., F. Ji, Y. Guo, N. Herold, D. Green, G. Di Virgilio, K. Beyer, M. Riley and S. E. Perkins-Kirkpatrick. "Future population exposure to australian heatwaves." Environmental Research Letters 17 (2022):.
- Rohrer, J. M. "Thinking clearly about correlations and causation: Graphical causal models for observational data." Advances in Methods and Practices in Psychological Science 1 (2018): 27-42. 10.1177/2515245917745629. <Go to ISI>://WOS:000707087400001. [CrossRef]
- D'Amico, F., M. Marmiere, M. Fonti, M. Battaglia and A. Belletti. "Association does not mean causation, when observational data were misinterpreted as causal: The observational interpretation fallacy." J Eval Clin Pract 31 (2025): e14288. 10.1111/jep.14288. [CrossRef]
- Bell, A., P. Ward, M. E. H. Tamal and M. Killilea. "Assessing recall bias and measurement error in high-frequency social data collection for human-environment research." Popul Environ 40 (2019): 325-45. 10.1007/s11111-019-0314-1. [CrossRef]
- Kala, J., A. L. Hirsch, T. Ziehn, S. E. Perkins-Kirkpatrick, M. G. De Kauwe and A. Pitman. "Assessing the potential for crop albedo enhancement in reducing heatwave frequency, duration, and intensity under future climate change." Weather and Climate Extremes 35 (2022): 100415.
- Wei, Y., H. Chen and J. J. Huang. "Response of surface energy components to urban heatwaves and its impact on human comfort in coastal city." Urban Climate 54 (2024): 101836.
- Lei, N., Y. Xie, Z. Bao, M. Zhao, Z. Su and X. Guan. "Decadal heatwave fluctuations in china caused by the indian and atlantic oceans." Environmental Research Letters 19 (2024): 074063.
- Liao, J., Y. Dai, L. An, J. Hang, Y. Shi and L. Zeng. "Water-energy-vegetation nexus explain global geographical variation in surface urban heat island intensity." Science of The Total Environment 895 (2023): 165158.
- Zhang, Y., A. Zhang, G. Sun, H. Fu and Y. Yao. "Exploring the influence and time variation of impervious surface materials on urban surface heat island." Presented at IGARSS 2022-2022 IEEE International Geoscience and Remote Sensing Symposium, 2022. IEEE, 6276-79.
- Zeng, P., C. Zong and X. Wei. "Quantitative analysis and spatial pattern research of built-up environments and surface urban heat island effect in beijing’s main urban area." Journal of Urban Planning and Development 150 (2024): 04024006.
- Xu, H., K. Sheng and J. Gao. "Mitigation of heat island effect by green stormwater infrastructure: A comparative study between two diverse green spaces in nanjing." Frontiers in Ecology and Evolution 11 (2023): 1307756.
- Jianping, L. and Z. Qingcun. "A new monsoon index and the geographical distribution of the global monsoons." Advances in atmospheric sciences 20 (2003): 299-302.
- IPCC. "Ar6 synthesis report: Climate change 2023." 2023. https://www.ipcc.ch/report/sixth-assessment-report-cycle/.
- Zhang, B., Y. He and X. Guan. "Increasing trends of land and coastal heatwaves under global warming." Atmospheric Research 318 (2025): 108007.
- Wang, X., H. Li and S. Sodoudi. "The effectiveness of cool and green roofs in mitigating urban heat island and improving human thermal comfort." Building and Environment 217 (2022): 109082.
- Aflaki, A., M. Mirnezhad, A. Ghaffarianhoseini, A. Ghaffarianhoseini, H. Omrany, Z.-H. Wang and H. Akbari. "Urban heat island mitigation strategies: A state-of-the-art review on kuala lumpur, singapore and hong kong." Cities 62 (2017): 131-45.
- Manoli, G., S. Fatichi, M. Schläpfer, K. Yu, T. W. Crowther, N. Meili, P. Burlando, G. G. Katul and E. Bou-Zeid. "Magnitude of urban heat islands largely explained by climate and population." Nature 573 (2019): 55-60.
- Xu, D., T. Bai, L. Yang, Y. Zhou, B. Chen, H. Xu, Y. Song, Y. Yuan, Y. Cui and L. Meng. "Quantifying the cooling effect of urban greening driven by ecological restoration projects in china." Environmental science & technology 58 (2024): 20990-1001.
- Schlaerth, H. L., S. J. Silva, Y. Li and D. Li. "Albedo as a competing warming effect of urban greening." Journal of Geophysical Research: Atmospheres 128 (2023): e2023JD038764.
- Hansen, A., P. Bi, D. Pisaniello, M. Nitschke, G. Tucker, J. Newbury, A. Kitson, E. Dal Grande, J. Avery and Y. Zhang. "Heat-health behaviours of older people in two a ustralian states." Australasian journal on ageing 34 (2015): E19-E25.
- Weng, H. and T. Ma. "Spatio-temporal variations and factors of the human perception of local temperature in china using weibo data." Journal of Geo-Information Science 24 (2022): 2058-70.
- Yang, Y. and Y. Zhu. "Social media use and emotion research:Theoretical foundation and measurement indicators construction." Journalism & Communication Review 77 (2024): 15. 10.14086/j.cnki.xwycbpl.2024.05.003. [CrossRef]
- Deng, X., F. Gao, S. Liao, Y. Liu and W. Chen. "Spatiotemporal evolution patterns of urban heat island and its relationship with urbanization in guangdong-hong kong-macao greater bay area of china from 2000 to 2020." Ecological Indicators 146 (2023): 109817.
Disclaimer/Publisher’s Note: The statements, opinions and data contained in all publications are solely those of the individual author(s) and contributor(s) and not of MDPI and/or the editor(s). MDPI and/or the editor(s) disclaim responsibility for any injury to people or property resulting from any ideas, methods, instructions or products referred to in the content. |
© 2025 by the authors. Licensee MDPI, Basel, Switzerland. This article is an open access article distributed under the terms and conditions of the Creative Commons Attribution (CC BY) license (http://creativecommons.org/licenses/by/4.0/).
Copyright: This open access article is published under a Creative Commons CC BY 4.0 license, which permit the free download, distribution, and reuse, provided that the author and preprint are cited in any reuse.


