
Submitted:
15 May 2025
Posted:
16 May 2025
You are already at the latest version
Abstract
This instrumental research aimed to determine the psychometric properties of the Cognitive Distortions Scale for Children and Adolescents (NNA) from Trujillo. The sample consisted of 531 children and adolescents aged 8 to 17 years. The results demonstrated content validity through the Aiken coefficient, reaching values of 1.00 for relevance and appropriateness, though some items showed coefficients between 0.7 and 0.8 for clarity. Construct validity was assessed using confirmatory factor analysis with the maximum likelihood method, showing fit indices: GFI = 0.86, AFGI= 0.83 RMSEA = 0.07, SRMR = 0.07, CFI = 0.89, TLI = 0.87, NFI = 0.82, indicating good fit. The exploratory factor analysis yielded a KMO of 0.90, explained variance of 66.40%, and factor loadings higher than 0.40. Reliability was established with a Cronbach’s alpha of 0.909 and McDonald’s omega of 0.909, indicating excellent internal consistency. Discriminative analysis showed high coefficients in most items, with skewness (-0.867 to 0.417) and kurtosis (-0.914 to 0.413) within acceptable ranges.
Keywords:
Validity
; reliability
; factor analysis
; cognitive distortions
; NNA
; psychometric scale
1. Introduction
Family neglect is a problem that affects individuals across all social backgrounds, including children and adolescents, who process these experiences differently. Therefore, it is essential to understand their thinking patterns, perception, and reactions to their environment. Based on this premise, the present study aligns with Sustainable Development Goal 3: Good Health and Well-being.
Cognitive distortions—maladaptive perceptions of reality—often emerge in children and adolescents who are victims of violence or abandonment. These individuals tend to develop rigid and pessimistic thoughts, forming such beliefs as coping mechanisms for what they are experiencing (Cerchiaro et al., 2021).
Internationally, in Colombia, the National Institute of Legal Medicine reported that cognitive distortions such as distrust, low self-esteem, anxiety, and poor interpersonal relationships are primarily caused by parents (30.58%) and mothers (29.46%) as the main aggressors (Manjarrez et al., 2023). Nationally, in Peru, the development of cognitive distortions accelerates in the context of high family neglect, with 1,187 reported cases in children aged 0 to 17 in 2019 (Romani, 2020). In the city of Trujillo, there is a notable lack of research addressing these phenomena (Rodríguez & Solorzano, 2024). Many children and adolescents are likely to develop cognitive distortions, which, according to Rojas (2021), can lead to negative self-perceptions and views of reality, difficulties in interpersonal relationships, low self-esteem, and increased anger and frustration.
The psychometric validation of a scale assessing cognitive distortions is crucial for identifying cognitive biases in children and adolescents, particularly within vulnerable populations such as those in Residential Care Centers (CARs) in Trujillo. The absence of studies in this area highlights the need for this research. Therefore, the primary research question is: What are the psychometric properties of the cognitive distortions scale in children and adolescents residing in CARs in Trujillo, 2024?
This study is theoretically justified as it explores the experiences of children and adolescents in CARs, updates the available information regarding cognitive distortions in this context, and contributes new hypotheses to academic discourse. Practically, the scale offers a reliable tool for assessing cognitive distortions and supports effective interventions to improve the psychological well-being of this population. Socially, the findings will provide valuable insights for mental health professionals, enhancing treatment approaches and the quality of life of affected youth. Methodologically, this research offers a validated instrument to support future studies and inform public policy planning and attention. The results may guide the development of policies, professional training, and prevention and intervention programs aimed at improving the mental health of children and adolescents in CARs.
Thus, the general objective of this study is to determine the psychometric properties of a cognitive distortions scale applied to a sample of children and adolescents in CARs in Trujillo. The specific objectives include: conducting content validation of the scale (EDC), generating descriptive data, determining construct validity, establishing percentile norms, and evaluating the scale's reliability.
This research is contextualized within relevant international studies. For example, Augusto and Nunes (2019) developed the Depressive Cognitive Distortions Scale (EDICOD), administered to 459 participants aged 18 to 60, with and without clinical diagnoses. Content validity was achieved by reducing the item count from 110 to 57. Parallel analysis (PA) and the ULS method suggested a five-factor structure, though a three-factor model showed a better fit (KMO = 0.94, Bartlett p < 0.001). Twenty-one items were subsequently removed, resulting in 36 items with communalities ranging from 0.34 to 0.73. The EDICOD proved suitable for identifying cognitive distortions, particularly in clinical settings.
Fernández et al. (2022) assessed the Spanish version of the Children’s Negative Cognitive Errors Questionnaire (CNCEQ) in 2,040 participants aged 12 to 22 (50.7% male, 47.3% female). Exploratory factor analysis revealed four factors explaining 44.04% of the variance, with satisfactory factor loadings (> 0.35 on the primary factor and < 0.35 on others). The total scale demonstrated high reliability (α = .88). Significant gender differences were found in the Social, Academic, and Athletic domains, with higher distortion levels in females (p < 0.05), supporting the CNCEQ's application in youth populations.
Nationally, Rojas et al. (2020) explored the relationship between aggression (reactive/proactive) and cognitive distortions in 2,830 Peruvian adolescents (ages 13–19) from Arequipa. They employed the Reactive-Proactive Aggression Questionnaire (RPQ), which showed adequate reliability coefficients for reactive aggression (α = .826; ω = .828) and proactive aggression (α = 0.852; ω = 0.863), along with the How I Think Questionnaire (HIT), which also showed acceptable reliability (α = 0.714 to 0.834; ω = 0.721 to 0.840). The study identified a weak relationship between reactive aggression and cognitive distortions, and a moderate relationship between proactive aggression and these distortions.
Pérez and Rosario (2017) analyzed the psychometric properties of the Automatic Thoughts Inventory for adolescents aged 14–17, reducing the scale to 42 items across seven dimensions via exploratory factor analysis, explaining over 3% of variance. Construct validity was supported by Bartlett’s test and KMO (0.839), and reliability was demonstrated through acceptable item correlations.
Becerra et al. (2023) confirmed the psychometric properties of the ATQ-8 in a non-probabilistic sample of 217 Peruvian university students. Confirmatory factor analysis supported a unidimensional model with a good fit (CFI = 0.99, GFI = 0.99, RMSEA = 0.07, SRMR = 0.03). High reliability indices were observed (α = 0.91, ω = 0.90), and items showed appropriate levels of discrimination and difficulty. The scale also correlated significantly with other psychological variables, confirming its validity and establishing it as a suitable tool for research among university populations.
By contrast, at the regional and local levels, studies on cognitive distortions—especially among children and adolescents—are limited. A notable exception is Suárez (2018), who used the Automatic Thoughts Questionnaire by Ruiz and Luján (1991) and found a negative, non-significant correlation between automatic thoughts and academic performance, indicating low and statistically insignificant scale values.
This research is grounded in cognitive-behavioral theories of cognitive distortions. According to Cadenas (2021), these distortions are erroneous thoughts about oneself, others, and the environment. Moral and González (2020) add that such biased thoughts significantly influence emotions and behaviors, contributing to issues such as depression, anxiety, and interpersonal conflict.
Aaron T. Beck, pioneer of Cognitive Behavioral Therapy (CBT), introduced the concept of cognitive distortions in the 1960s, defining them as thought patterns that distort emotional and behavioral responses (Cieza & Zúñiga, 2022). Beck noted that these distortions—whether positive or negative—diverge from reality (Suárez et al., 2021).
Cognitive distortions are classified as self-deprecating (e.g., self-disapproval, guilt, low self-esteem) or self-serving (e.g., attributing successes to internal causes and failures to external ones as a form of self-esteem protection) (Barriga et al., 2001, as cited in Cango, 2022). Finally, Cerchiaro et al. (2021) highlight the prevalence of these distortions in children and adolescents exposed to violence or abandonment, where they serve as defense mechanisms.
In light of the above, the study's hypothesis is as follows: The cognitive distortions scale, developed and applied to children and adolescents in Residential Care Centers (CARs) in Trujillo, will demonstrate adequate psychometric properties.
2. Method
This study is classified as basic research, which, according to Muñoz (2011), aims to generate knowledge without immediate utilitarian purposes. Its goal is to analyze and understand reality, creating new theories or modifying existing ones to broaden the scope of knowledge.
In addition, a quantitative approach is used, which is a sequential process based on evidence: a research idea is proposed, objectives are set, literature is reviewed, hypotheses are generated, variables are measured, and data are statistically analyzed to draw conclusions (Sampieri, Collado, & Lucio, 2014).
To understand this study, it is essential to define the primary variable: cognitive distortions. According to Moral and González (2020), these are characterized by erroneous thoughts about oneself, others, and the environment, affecting emotions and behaviors and potentially leading to issues such as depression, anxiety, and low self-esteem. Bautista and Rengifo (2021) note that these distortions vary in each individual and are influenced by their experiences.
Aligned with this, the dimensions are defined as self-serving and self-deprecating distortions. According to Akhrif (2020), self-deprecating distortions focus on disapproval and a negative self-perception, internalizing guilt; this can lead to phobias, depression, anxiety, or low self-esteem (Peña & Andreu, 2012, as cited in Cango, 2022). On the other hand, self-serving distortions are characterized by a tendency to misinterpret experiences as a means of protecting self-esteem. Successes are attributed to internal factors and failures to external ones (Barriga et al., 2001, as cited in Cango, 2022). Accordingly, the indicators for this study are: polarized thinking, catastrophizing, overgeneralization, global labeling, mind reading, should statements, and blaming.
To understand the development of this study, it is crucial to define the analyzed population. According to Sampieri, Collado, and Lucio (2014), the population is a group of individuals, groups, or objects that share relevant characteristics and from which data will be drawn for the study. In this research, the population consists of children and adolescents aged 8 to 17 who reside in Residential Care Centers (CARs) in Trujillo. Specific inclusion criteria were established, considering those who lived in a CAR in Trujillo, belonged to the city’s social context, and had guardian consent. Conversely, those excluded were children and adolescents not residing in a Trujillo CAR, those with intellectual disabilities impairing their understanding of the instrument, and those who chose not to participate.
Consequently, the sample is a subset of the study population, and its selection required considering elements such as the sampling frame, access to participants, and the identification of a valid interlocutor (Arroyo & Sádaba, 2012). This study worked with a sample of 553 children and adolescents from six CARs in Trujillo, ensuring diversity in age and gender.
Furthermore, a convenience sampling method was employed due to access restrictions to the full population (Sampieri et al., 2014). The survey technique was used, which allows for collecting, quantifying, and organizing data to generalize results (Blanchar & Martínez, 2024). The instrument applied was the Cognitive Distortions Scale for children and adolescents, consisting of 28 statements rated on a Likert scale: Never, Almost Never, Sometimes, Almost Always, Always.
Additionally, the research process included gathering information regarding the variable, item creation, instrument validation by expert judges, and a pilot test. This was followed by survey implementation and data analysis using Excel and SPSS, resulting in data cleaning, descriptive and discriminatory analysis, as well as exploratory and confirmatory factor analyses performed using the JASP software.
The ethical standards of the College of Psychologists of Peru (2018) and the code of ethics of César Vallejo University (2022) were respected, ensuring informed consent and data confidentiality. The study also complied with University Law 30220, guaranteeing integrity and responsibility in handling information.
3. Results Interpretation
3.1. Content Validity

Table 1.
Aiken's V Coefficient for Content Validity of the Cognitive Distortions Scale Items.
| N° Items | Mean | DE | Aiken's V | Li | Ls | |
|---|---|---|---|---|---|---|
| Item 1 | Relevance | 1 | 0.00 | 1.00 | 0.65 | 1.00 |
| Pertinence | 1 | 0.00 | 1.00 | 0.65 | 1.00 | |
| Clarity | 1 | 0.00 | 1.00 | 0.65 | 1.00 | |
| Item 2 | Relevance | 1 | 0.00 | 1.00 | 0.65 | 1.00 |
| Pertinence | 1 | 0.00 | 1.00 | 0.65 | 1.00 | |
| Clarity | 0.9 | 0.38 | 0.86 | 0.53 | 1.0 | |
| Item 3 | Relevance | 1 | 0.00 | 1.00 | 0.65 | 1.00 |
| Pertinence | 1 | 0.00 | 1.00 | 0.65 | 1.00 | |
| Clarity | 1 | 0.00 | 1.00 | 0.65 | 1.00 | |
| Item 4 | Relevance | 1 | 0.00 | 1.00 | 0.65 | 1.00 |
| Pertinence | 1 | 0.00 | 1.00 | 0.65 | 1.00 | |
| Clarity | 0.9 | 0.38 | 0.86 | 0.53 | 1.0 | |
| Item 5 | Relevance | 1 | 0.00 | 1.00 | 0.65 | 1.00 |
| Pertinence | 1 | 0.00 | 1.00 | 0.65 | 1.00 | |
| Clarity | 0.9 | 0.38 | 0.86 | 0.53 | 1.0 | |
| Item 6 | Relevance | 1 | 0.00 | 1.00 | 0.65 | 1.00 |
| Pertinence | 1 | 0.00 | 1.00 | 0.65 | 1.00 | |
| Clarity | 1 | 0.00 | 1.00 | 0.65 | 1.00 | |
| Item 7 | Relevance | 1 | 0.00 | 1.00 | 0.65 | 1.00 |
| Pertinence | 1 | 0.00 | 1.00 | 0.65 | 1.00 | |
| Clarity | 1 | 0.00 | 1.00 | 0.65 | 1.00 | |
| Item 8 | Relevance | 1 | 0.00 | 1.00 | 0.65 | 1.00 |
| Pertinence | 1 | 0.00 | 1.00 | 0.65 | 1.00 | |
| Clarity | 1 | 0.00 | 1.00 | 0.65 | 1.00 | |
| Item 9 | Relevance | 1 | 0.00 | 1.00 | 0.65 | 1.00 |
| Pertinence | 1 | 0.00 | 1.00 | 0.65 | 1.00 | |
| Clarity | 1 | 0.00 | 1.00 | 0.65 | 1.00 | |
| Item 10 | Relevance | 1 | 0.00 | 1.00 | 0.65 | 1.00 |
| Pertinence | 1 | 0.00 | 1.00 | 0.65 | 1.00 | |
| Clarity | 1 | 0.00 | 1.00 | 0.65 | 1.00 | |
| Item 11 | Relevance | 1 | 0.00 | 1.00 | 0.65 | 1.00 |
| Pertinence | 1 | 0.00 | 1.00 | 0.65 | 1.00 | |
| Clarity | 1 | 0.00 | 1.00 | 0.65 | 1.00 | |
| Item 12 | Relevance | 1 | 0.00 | 1.00 | 0.65 | 1.00 |
| Pertinence | 1 | 0.00 | 1.00 | 0.65 | 1.00 | |
| Clarity | 1 | 0.00 | 1.00 | 0.65 | 1.00 | |
| Note:V: Aiken's V Statistic; SD: Standard Deviation; LL: Lower Limit; UL: Upper Limit | ||||||
| Item 13 | Relevance | 1 | 0.00 | 1.00 | 0.65 | 1.00 |
| Pertinence | 1 | 0.00 | 1.00 | 0.65 | 1.00 | |
| Clarity | 1 | 0.00 | 1.00 | 0.65 | 1.00 | |
| Item 14 | Relevance | 1 | 0.00 | 1.00 | 0.65 | 1.00 |
| Pertinence | 1 | 0.00 | 1.00 | 0.65 | 1.00 | |
| Clarity | 1 | 0.00 | 1.00 | 0.65 | 1.00 | |
| Item 15 | Relevance | 1 | 0.00 | 1.00 | 0.65 | 1.00 |
| Pertinence | 1 | 0.00 | 1.00 | 0.65 | 1.00 | |
| Clarity | 1 | 0.00 | 1.00 | 0.65 | 1.00 | |
| Item 16 | Relevance | 1 | 0.00 | 1.00 | 0.65 | 1.00 |
| Pertinence | 1 | 0.00 | 1.00 | 0.65 | 1.00 | |
| Clarity | 1 | 0.00 | 1.00 | 0.65 | 1.00 | |
| Item 17 | Relevance | 1 | 0.00 | 1.00 | 0.65 | 1.00 |
| Pertinence | 1 | 0.00 | 1.00 | 0.65 | 1.00 | |
| Clarity | 0.7 | 0.49 | 0.71 | 0.35 | 0.92 | |
| Item 18 | Relevance | 1 | 0.00 | 1.00 | 0.65 | 1.00 |
| Pertinence | 1 | 0.00 | 1.00 | 0.65 | 1.00 | |
| Clarity | 1 | 0.00 | 1.00 | 0.65 | 1.00 | |
| Item 19 | Relevance | 1 | 0.00 | 1.00 | 0.65 | 1.00 |
| Pertinence | 1 | 0.00 | 1.00 | 0.65 | 1.00 | |
| Clarity | 1 | 0.00 | 1.00 | 0.65 | 1.00 | |
| Item 20 | Relevance | 1 | 0.00 | 1.00 | 0.65 | 1.00 |
| Pertinence | 1 | 0.00 | 1.00 | 0.65 | 1.00 | |
| Clarity | 1 | 0.00 | 1.00 | 0.65 | 1.00 | |
| Item 21 | Relevance | 1 | 0.00 | 1.00 | 0.65 | 1.00 |
| Pertinence | 1 | 0.00 | 1.00 | 0.65 | 1.00 | |
| Clarity | 1 | 0.00 | 1.00 | 0.65 | 1.00 | |
| Item 22 | Relevance | 1 | 0.00 | 1.00 | 0.65 | 1.00 |
| Pertinence | 1 | 0.00 | 1.00 | 0.65 | 1.00 | |
| Clarity | 1 | 0.00 | 1.00 | 0.65 | 1.00 | |
| Item 23 | Relevance | 1 | 0.00 | 1.00 | 0.65 | 1.00 |
| Pertinence | 1 | 0.00 | 1.00 | 0.65 | 1.00 | |
| Clarity | 1 | 0.00 | 1.00 | 0.65 | 1.00 | |
| Item 24 | Relevance | 1 | 0.00 | 1.00 | 0.65 | 1.00 |
| Pertinence | 1 | 0.00 | 1.00 | 0.65 | 1.00 | |
| Clarity | 0.9 | 0.38 | 0.86 | 0.53 | 1.0 | |
| Item 25 | Relevance | 1 | 0.00 | 1.00 | 0.65 | 1.00 |
| Pertinence | 1 | 0.00 | 1.00 | 0.65 | 1.00 | |
| Clarity | 1 | 0.00 | 1.00 | 0.65 | 1.00 | |
| Note:V: Aiken's V Statistic; SD: Standard Deviation; LL: Lower Limit; UL: Upper Limit | ||||||
| Item 26 | Relevance | 1 | 0.00 | 1.00 | 0.65 | 1.00 |
| Pertinence | 1 | 0.00 | 1.00 | 0.65 | 1.00 | |
| Clarity | 1 | 0.00 | 1.00 | 0.65 | 1.00 | |
| Item 27 | Relevance | 1 | 0.00 | 1.00 | 0.65 | 1.00 |
| Pertinence | 1 | 0.00 | 1.00 | 0.65 | 1.00 | |
| Clarity | 1 | 0.00 | 1.00 | 0.65 | 1.00 | |
| Item 28 | Relevance | 1 | 0.00 | 1.00 | 0.65 | 1.00 |
| Pertinence | 1 | 0.00 | 1.00 | 0.65 | 1.00 | |
| Clarity | 1 | 0.00 | 1.00 | 0.65 | 1.00 | |
| Note:V: Aiken's V Statistic; SD: Standard Deviation; LL: Lower Limit; UL: Upper Limit | ||||||
Interpretation
A content validity assessment of the Cognitive Distortions Scale for Children and Adolescents in Residential Care Centers (CAR-EDC), conducted by seven experts, yielded results confirming the relevance criterion for measuring the study variable. The scale demonstrated high acceptance in relevance and pertinence, with an Aiken's V coefficient of 1.00 across all 28 items. This score surpasses the value suggested by Charter (2003), who proposed an Aiken's V of 0.70 as the minimum acceptable level for validity. The lower limits (LL) ranged from 0.65 to 1.00, while the upper limits (UL) remained consistently at 1.00, indicating strong inter-rater reliability among the seven expert judges regarding the items' suitability for measuring the study variable. However, regarding clarity, some items (2, 4, 5, 17, and 24) exhibited lower Aiken's V coefficients, ranging from 0.7 to 0.8, with LLs ranging from 0.35 to 0.53 and ULs from 0.92 to 1.0. This suggests potential ambiguity or lack of clarity in the wording of these items, indicating a need for revision to enhance their interpretability.
Table 2.
Cronbach's Alpha Reliability Statistics of the Scale According to the Pilot Test.
| Variable: Cognitive Distortions | |
|---|---|
| α | .860 |
| Dimensión 1: Self- Humbling Distortions | |
| α | .586 |
| Dimensión 2: Self- Serving Distortions | |
| α | .844 |
| Note:α: Cronbach's Alpha | |
Interpretation:
Cronbach's alpha coefficient, an indicator of the internal consistency of a scale, ranges from 0 to 1. While there is no defined lower limit, values closer to 1 reflect higher reliability. Generally, a range between 0.7 and 0.9 is considered acceptable (Roco et al., 2024). In a pilot test with 50 participants, the instrument obtained a Cronbach's alpha of 0.860. This result indicates high reliability, suggesting that the questions are well-designed and produce accurate and consistent results, making it suitable for application.
Regarding Dimension 1, with a Cronbach's Alpha of 0.586, it presents low reliability, indicating possible inconsistencies between the items. The minimum considerable value for Cronbach's alpha coefficient is 0.7. Below this score, the internal consistency of the scale used is low (Celina and Campo, 2005 as cited in Duke et al., 2017). In light of this, it is recommended to review the wording, eliminate those that do not contribute to the scale, or reformulate them to improve internal cohesion and measurement accuracy.
Finally, Dimension 2, with a Cronbach's Alpha of 0.844, presents high reliability, indicating adequate consistency between the items. The acceptable range for reliability coefficients is between 0.7 and 0.9 (Roco et al., 2024).
3.2. Descriptive Analysis
Table 3.
Descriptive Statistics of the Cognitive Distortions Scale.
| N° Items | M | DE | G1 | G2 | Discriminatory Index | Discrimination Coefficient | ||
|---|---|---|---|---|---|---|---|---|
| Value | Interpretation | Value | Interpretation | |||||
| P1 | 1.36 | 0.988 | 0.628 | 0.133 | 0.33 | Appropriate | 0.524 | High |
| P2 | 1.38 | 1.089 | 0.494 | -0.464 | 0.37 | Appropriate | 0.532 | High |
| P3 | 1.44 | 1.056 | 0.394 | -0.496 | 0.38 | Appropriate | 0.538 | High |
| P4 | 1.40 | 1.033 | 0.524 | -0.219 | 0.38 | Appropriate | 0.562 | High |
| P5 | 1.45 | 1.065 | 0.417 | -0.527 | 0.41 | Excellent | 0.568 | High |
| P6 | 1.42 | 1.051 | 0.349 | -0.476 | 0.36 | Appropriate | 0.556 | High |
| P7 | 1.49 | 1.171 | 0.411 | -0.707 | 0.29 | Moderate | 0.412 | High |
| P8 | 1.66 | 1.151 | 0.217 | -0.739 | 0.34 | Appropriate | 0.451 | High |
| P9 | 1.56 | 1.080 | 0.255 | -0.639 | 0.32 | Appropriate | 0.483 | High |
| P10 | 1.50 | 1.127 | 0.406 | -0.616 | 0.33 | Appropriate | 0.466 | High |
| P11 | 1.61 | 1.092 | 0.248 | -0.701 | 0.29 | Moderate | 0.437 | High |
| P12 | 1.62 | 1.073 | 0.270 | -0.669 | 0.28 | Moderate | 0.437 | High |
| P13 | 1.43 | 1.074 | 0.446 | -0.530 | 0.41 | Excellent | 0.594 | High |
| P14 | 1.33 | 1.063 | 0.522 | -0.451 | 0.41 | Excellent | 0.594 | High |
| P15 | 1.36 | 1.111 | 0.461 | -0.659 | 0.40 | Appropriate | 0.573 | High |
| P16 | 1.34 | 1.111 | 0.524 | -0.494 | 0.42 | Excellent | 0.588 | High |
| P17 | 1.42 | 1.067 | 0.458 | -0.512 | 0.39 | Appropriate | 0.613 | High |
| P18 | 1.38 | 1.068 | 0.421 | -0.639 | 0.42 | Excellent | 0.622 | High |
| P19 | 1.64 | 1.091 | 0.247 | -0.773 | 0.39 | Appropriate | 0.550 | High |
| P20 | 1.67 | 1.116 | 0.137 | -0.878 | 0.35 | Appropriate | 0.476 | High |
| P21 | 1.70 | 1.125 | 0.086 | -0.914 | 0.41 | Excellent | 0.503 | High |
| P22 | 1.64 | 1.089 | 0.214 | -0.811 | 0.38 | Appropriate | 0.540 | High |
| P23 | 1.63 | 1.095 | 0.153 | -0.733 | 0.32 | Appropriate | 0.465 | High |
| P24 | 2.55 | 1.217 | -0.344 | -0.774 | 0.16 | Poor | 0.099 | Unsatisfactory |
| P25 | 2.23 | 1.152 | -0.055 | -0.633 | 0.20 | Poor | 0.182 | Unsatisfactory |
| P26 | 2.74 | 1.238 | -0.585 | -0.674 | 0.17 | Poor | 0.102 | Unsatisfactory |
| P27 | 2.49 | 1.221 | -0.389 | -0.766 | 0.25 | Poor | 0.201 | Low |
| P28 | 2.98 | 1.088 | -0.867 | 0.041 | 0.15 | Poor | 0.103 | Unsatisfactory |
| Note: M = Mean; SD = Standard Deviation; G1 = Skewness; G2 = Kurtosis | ||||||||
Interpretation:
Prior to the descriptive analysis, data cleaning was performed using box plots in SPSS. From an initial sample of 553 participants, 22 outliers were identified and removed, resulting in a final sample of 531 subjects. The analysis of the scale items maintains good psychometric performance. Most items exhibit adequate and excellent discrimination indices, with values ranging from 0.41 to 0.32, and a predominantly high discrimination coefficient, ranging from 0.60 to 0.40.
Specifically, items 1, 2, 3, 4, 6, 8, 9, 10, 15, 17, 19, 20, 22, and 23 show an adequate discrimination index accompanied by a high discrimination coefficient, while items 5, 13, 14, 16, 18, and 21 stand out with an excellent discrimination index and a high coefficient.
In contrast, items 24–28 exhibit a poor discrimination index along with poor discrimination coefficients, suggesting the need for revision, reformulation, or removal of these items in future applications. Overall, the results suggest that most of the scale items are effective in measuring the construct. Regarding skewness (G1), values for the scale items ranged from -0.867 to 0.417, while kurtosis (G2) values ranged from -0.914 to 0.413. According to the criteria proposed by Byrne (2010), which establishes acceptable ranges of -2 to +2 for skewness and -7 to +7 for kurtosis, these results are considered adequate.
3.3. Exploratory Factor Analysis Adequacy Measures:
Interpretation:
Table 4 presents the data suitability for factor analysis. The Kaiser-Meyer-Olkin (KMO) measure yielded a value of 0.90, indicating, according to Kaiser (1958), high sample adequacy for factor analysis. Item selection considered three criteria: factor loadings ≥ 0.400, loading on a single factor only, and at least three items per factor (Nunnally & Bernstein, 1995). Analysis of the two factors revealed factor loadings exceeding 0.400 for all items, suggesting well-defined factors and item coherence with the intended dimensions. A clear factorial structure emerged with 21 items, exhibiting uniqueness values ranging from 0.51 to 0.78. As noted by Pérez et al. (2022), ideal items exhibit high factor loadings on their assigned factor and near-zero loadings on other factors, without exceeding unity. This indicates the scale possesses a robust factorial structure and that the selected items are appropriate for measuring the construct.
3.4. Goodness-of-Fit Measures of the Confirmatory Factor Analysis
Interpretation:
Confirmatory factor analysis (CFA) conducted on the Cognitive Distortions Scale for children and adolescents (NNA) within the alternative care system (CAR) revealed significant factor loadings (p < .001) across the three factors, ranging from 0.57 to 0.79. These loadings exceed the Nunnally & Bernstein (1995) criterion of ≥ 0.400, indicating robust associations between items and their respective factors. Standard errors of the estimates remained low (0.06–0.07), suggesting, according to Gempp (2006), high measurement precision and minimal deviation between observed and true scores. The 95% confidence intervals did not include zero, further strengthening the robustness of the findings.
Figure 1.
Factorial Structure of the Cognitive Distortions Scale.
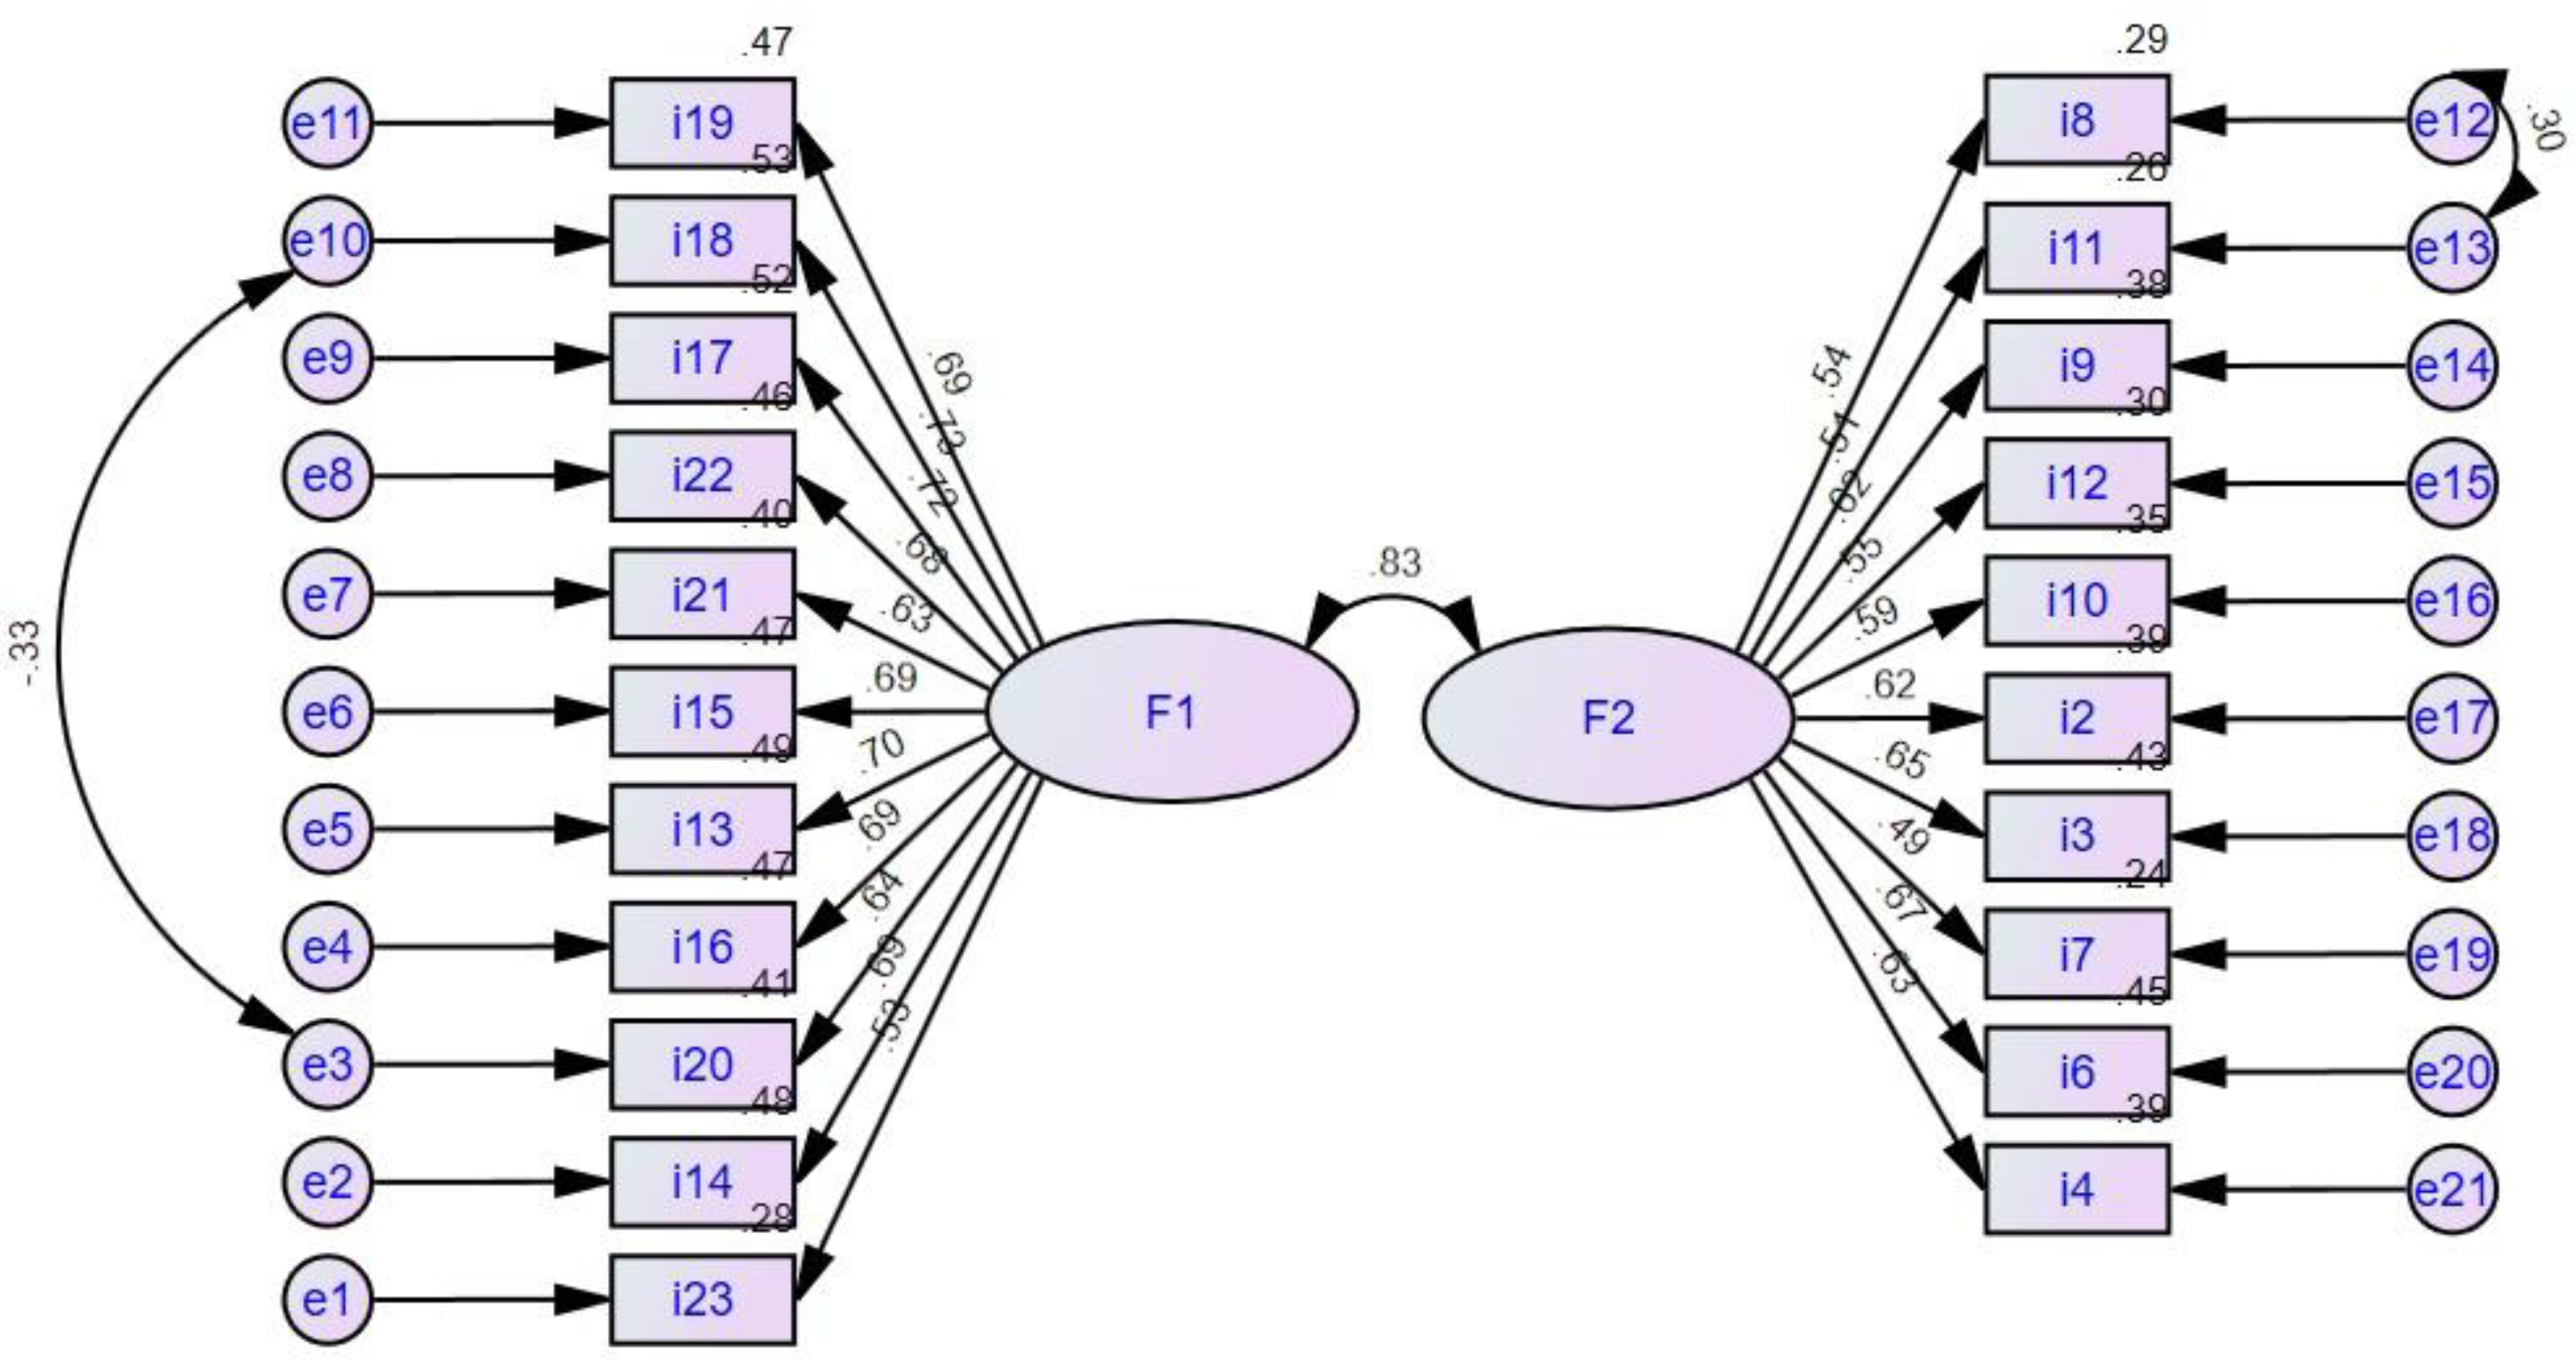
Interpretation:
Standardized factor loadings for the scale are presented. In Factor 1, loadings range from 0.53 to 0.73, with a negative correlation of -0.33 observed between items 18 and 20. Similarly, in Factor 2, loadings range from 0.49 to 0.67, showing a positive correlation of .30 between items 12 and 13.
Interpretation:
Table 6 presents the results of two fit analyses, AM1 and AM3, conducted to determine which model better represented the hypothesized latent structure. First, considering the absolute fit indices (GFI and AGFI), AM3 shows a slight improvement over AM1: GFI increases from 0.85 to 0.86, and AGFI from 0.81 to 0.83, indicating marginally better fit in terms of the proportion of variance explained by the model relative to the total variance. Following Hu and Bentler (1999), who recommend more stringent values (≥ 0.95), a GFI ≥ 0.90 generally indicates good fit, while a GFI ≥ 0.80 is considered acceptable in complex models or with small samples, particularly if other indices also show good fit. AGFI, correcting for degrees of freedom, typically yields slightly lower values; therefore, ≥ 0.80 is considered a minimum acceptable threshold. Given that GFI in AM3 = 0.86 and AGFI = 0.83, both exceed the minimum acceptable threshold of 0.80. Consistent with Hu and Bentler (1999), the model exhibits reasonable absolute fit.
In both models, the SRMR remains at 0.07, below the 0.08 threshold indicating acceptable fit according to Yucel (2020). This finding is reinforced by the RMSEA; a slight decrease in the approximation error is observed, from 0.08 in AM1 to 0.07 in AM3. This suggests that AM3 more accurately represents the population covariance, with both models remaining within the acceptable range (< 0.08).
Finally, comparative fit indices support this trend: CFI increases from 0.87 to 0.89, TLI from 0.85 to 0.87, and NFI from 0.80 to 0.82, demonstrating that AM3 consistently outperforms AM1 when comparing the improvement in fit against a null model. According to Salgado and Moscoso (2019), the obtained values (CFI = 0.89, TLI = 0.87, NFI = 0.82) are considered adequate and supported by established academic standards. While not reaching the "excellent" level (>0.95), they show a significant improvement over a null model, consistent with the criteria of multiple authors and sources in current psychometrics.
Interpretation:
Table 7 presents the results of the cognitive distortion scale, using different interpretation criteria depending on the section analyzed.
For the "Cognitive Distortions" variable, a score of 31 or less is considered "High," a score of 61 or less is considered "Medium," and a score of 92 or more is considered "Low." Importantly, in this section, higher scores reflect lower distortion.
This inverse interpretation principle (higher scores indicate lower distortion) applies to the "Self-Humiliating Cognitive Distortions" dimension: a score of 11 or less is "High," a score of 21 or less is "Medium," and a score of 32 or more is "Low." The same applies to the "Self-Serving Cognitive Distortions" dimension, where a score of 20 or less is "High," a score of 40 or less is "Medium," and a score greater than 60 is "Low."
Within the "Self-Humiliating Distortions" dimension, indicators use different interpretation criteria. For the "Global Label" and "Shoulds" indicators, a score of 3 or less indicates a high level of distortion, a score of 5 or less indicates a medium level, and a score of 8 or more indicates a low level of distortion. Finally, for the "Blame" indicator, a score of 5 or less indicates a high level of distortion, a score of 11 or less indicates a medium level, and a score of 16 or more indicates a low level of distortion.
Regarding the "Self-Serving Distortions" dimension, different scales are used for the indicators. The Polarized Thinking and Catastrophic Vision indicators show an inverse relationship with the severity of cognitive distortion: scores of 5 or less indicate a high level of distortion; between 6 and 11, a medium level; and 16 or more, a low level.
In the assessment of overgeneralization distortion, results indicate that a score of 32 or more suggests a low level of this distortion. Conversely, a score of 21 or less is considered a medium level. Finally, a score of 11 or less suggests a high level of overgeneralization.
Concerning thought interpretation, a score of 12 or more indicates a low level of distortion. A score between 8 and 12 is considered a medium level. Lastly, a score of 4 or less indicates a high level of distortion.
Interpretation:
Reliability analysis of the measurement scale, using Cronbach's alpha coefficient, yielded a value of 0.909 in a sample of children and adolescents (CAR's), with a 95% confidence interval ranging from 0.898 to 0.920. This result is acceptable because, according to George and Mallery (2003), values above 0.9 indicate excellent internal consistency of the instrument. Similarly, McDonald's omega coefficient yielded a value of 0.909, with a 95% confidence interval between 0.893 and 0.925, also within the optimal range of 0.70 to 0.90 (Roco et al., 2024). The high reliability observed in both Cronbach's alpha and McDonald's omega confirms the accuracy and consistency of the scale in measuring the construct, ensuring the reliability of the results for future research.
4. Discussion
Cognitive distortions, according to Beck (1995, as cited in Mancheno, 2020), are erroneous and dysfunctional interpretations of reality that can negatively influence how children and adolescents perceive their environment, themselves, and their relationships with others. In highly vulnerable contexts such as Residential Care Centers (CAR), where many children and adolescents (NNA) have experienced abandonment, neglect, or violence, these distortions may appear more frequently and with greater intensity. In response to this issue, the present study aimed to determine the psychometric properties of the Cognitive Distortions Scale (CDS) in a sample of NNA from CAR in the city of Trujillo. To this end, five specific objectives were proposed, based on a rigorous analysis of the interpreted tables that accompanied the study’s results.
Regarding the first objective, the content validity of the scale’s items was evaluated using Aiken's V coefficient. The results showed that all items reached acceptable values (Li ≥ 0.65) in the criteria of relevance, pertinence, and clarity, reflecting a high level of agreement among expert judges concerning the quality of the content. However, items 17 (V = 0.70) and 24 (V = 0.90) received slightly lower scores for clarity, suggesting the need to revise their wording to improve comprehension without compromising conceptual validity. This analysis aligns with García (2002, as cited in Urrutia et al., 2014), who emphasizes that content validity involves assessing whether the items in a test are truly related to what is intended to be measured, ensuring their comprehensibility, importance, and relevance. These findings are consistent with previous studies, such as that by Augusto and Nunes (2019), who validated the Depressive Cognitive Distortions Scale (EDICOD) and, through a rigorous refinement process, reduced the scale from 110 to 36 items, ensuring both content validity and clinical utility.
For the second objective, descriptive data analysis was carried out following an initial data quality review. From an original sample of 553 participants, 22 outliers were removed, resulting in a final sample of 531 subjects. The scale items demonstrated strong psychometric performance, with adequate to excellent discrimination indices (ranging from 0.32 to 0.41) and high discrimination coefficients (ranging from 0.40 to 0.60) in most cases. Specifically, items 1, 2, 3, 4, 6, 8, 9, 10, 15, 17, 19, 20, 22, and 23 showed solid performance, while items 5, 13, 14, 16, 18, and 21 stood out for their excellent performance. In contrast, items 24 to 28 displayed poor performance indicators, suggesting the need for revision or reformulation in future applications. Moreover, skewness and kurtosis values remained within acceptable ranges, as proposed by Byrne (2010), indicating a suitable distribution for statistical analysis. These findings are consistent with Becerra et al. (2023), who, when validating a scale for automatic thoughts, identified a high kurtosis value in one item that required the use of a robust estimator (MLR) to address non-normality. Despite this, all items showed adequate levels of corrected homogeneity, supporting their internal consistency and representativeness within the evaluated factor. These results reinforce the psychometric validity of the scale, reflecting similar patterns in item quality and data distribution.
Regarding the third objective, construct validity—understood as the extent to which a scale accurately measures the theoretical construct it intends to assess (Fernández et al., 2022)—was examined using both exploratory factor analysis (EFA) and confirmatory factor analysis (CFA). The EFA was supported by the Kaiser-Meyer-Olkin (KMO) index, which yielded an overall value of 0.90. According to Kaiser (1958), this indicates high sampling adequacy for factor analysis. A two-factor structure with 21 items was identified, with factor loadings exceeding 0.400. The first factor included items I19 (0.651), I18 (0.643), I17 (0.627), I22 (0.621), I21 (0.615), I15 (0.604), I13 (0.577), I16 (0.565), I20 (0.56), I14 (0.543), and I23 (0.432). The second factor included items I8 (0.681), I11 (0.651), I9 (0.589), I12 (0.561), I10 (0.512), I2 (0.493), I3 (0.485), I7 (0.484), I6 (0.452), and I(426). The analysis of both factors showed factor loadings above 0.400 for all items, indicating well-defined factors and coherence of the items with the intended dimensions. The resulting factorial structure with 21 items displayed item uniqueness values ranging from 0.51 to 0.78. According to Pérez et al. (2022), ideal items show high loadings on their respective factor and near-zero loadings on others, without exceeding unity. These findings are consistent with Fernández et al. (2022), who evaluated the construct validity of the Children’s Negative Cognitive Errors Questionnaire (CNCEQ) in a sample of 2,040 Spanish adolescents. They identified four factors via factor analysis, explaining 44.04% of the variance, with overall reliability of α = .88. Like the present study, their instrument exhibited a clear, differentiated multifactor structure, allowing for valid and specific assessment of various cognitive distortions.
As for the fourth objective, percentile norms were established to classify and interpret levels of cognitive distortions based on observed performance in the sample. In this study, percentiles were defined to classify cognitive distortion levels into three categories: high, medium, and low, based on participants’ scores. In all cases, higher scores indicate lower levels of cognitive distortions, allowing for a reverse interpretation of the severity of the issue. In the global scale, scores ≤ 31 indicate high distortion, ≤ 61 medium, and ≥ 92 low. For the self-deprecating cognitive distortions dimension, high distortion is classified as scores ≤ 11, medium up to 21, and low ≥ 32. For the self-serving cognitive distortions dimension, the cutoffs were: ≤ 20 indicates high distortion, ≤ 40 medium, and > 60 low. Regarding specific indicators of self-deprecating distortions, “Global labeling” and “Should statements” were classified as high distortion with scores ≤ 3, medium ≤ 5, and low ≥ 8. For “Blaming,” scores ≤ 5 indicated high distortion, ≤ 11 medium, and ≥ 16 low. For self-serving distortion indicators, a similar logic was applied. “Polarized thinking” and “Catastrophic vision” were high with scores ≤ 5, medium between 6 and 11, and low ≥ 16. In “Overgeneralization,” scores ≤ 11 were high, ≤ 21 medium, and ≥ 32 low. Lastly, in “Mind reading,” scores ≤ 4 reflected high distortion, 5 to 11 medium, and ≥ 12 low. The same progressive criterion was applied to all indicators. This classification allows for more precise and personalized clinical evaluation, which is especially useful in intervention settings like CAR. This strategy aligns with Sica et al. (2017), who, when analyzing the Automatic Thoughts Inventory in adolescents, established percentile norms differentiated by dimension. Their factorial analysis supported percentiles as a diagnostic and interpretative tool. As in the present study, the authors defined score ranges that enhance the identification of when intervention is most needed, particularly in contexts of psychosocial risk.
The fifth objective was to determine the reliability of the scale. Two internal consistency coefficients were calculated: Cronbach’s alpha (α) and total omega (ω). The results were highly satisfactory. Cronbach’s alpha was α = 0.909 and total omega was ω = 0.909. Both values fall within the “excellent” range, according to George and Mallery (2003), who suggest that alpha values above 0.80 indicate strong internal consistency. This means that the items comprising the scale demonstrate a high degree of homogeneity and internal coherence, i.e., they consistently measure the construct of cognitive distortions in the same direction. When comparing these findings with previous studies, notable similarities emerge. For instance, Rojas et al. (2020) applied the How I Think Questionnaire (HIT) to a sample of Peruvian adolescents and reported alpha coefficients ranging from 0.714 to 0.834 and omega coefficients from 0.721 to 0.840. While the values in our study are slightly higher, both studies demonstrate that reliable instruments can be developed for assessing cognitive distortions in adolescents, especially in vulnerable contexts like CAR.
5. Conclusions
The results of the study demonstrate that the Cognitive Distortions Scale (CDS) is a valid and reliable tool for assessing cognitive distortions. The content and construct validity were adequate, supported by a clear factorial structure and precise interpretation of distortion levels. Furthermore, the scale exhibited excellent internal consistency, confirming its reliability and usefulness in both clinical and research settings.
Regarding content validity, all items showed adequate levels of relevance, pertinence, and clarity, with strong agreement among expert judges. However, items 17 and 24 required minor wording adjustments.
In terms of the descriptive analysis, most items performed well and demonstrated appropriate discrimination indices, with some items standing out for their excellent performance. Nevertheless, items 24 through 28 displayed low performance and were recommended for review. The data showed an adequate distribution for statistical analyses.
With respect to construct validity, exploratory and confirmatory factor analyses identified a clear two-factor structure consisting of 21 items, all with factor loadings above 0.400, which supports the coherence of the items with the dimensions they were intended to measure.
As for the establishment of percentile norms, accurate classifications were achieved for high, medium, and low levels of cognitive distortions, both globally and within specific dimensions and indicators. This allows for clear interpretation and more precise assessment of results, facilitating its use in clinical contexts.
Finally, the reliability coefficients obtained (Cronbach’s alpha and total omega of 0.909) demonstrate excellent internal consistency, confirming that the items uniformly measure the intended construct and that the scale is a robust and reliable instrument for its intended purpose.
Author Contributions
Conceptualization, Flor Maria Morales-Ulloa, Nahomi Beatriz Moreno-Rodriguez, Yerelin Sofia Reyna-Chavez and Zaida Rojas-Lavado; Methodology, Sandro Omar Fernández Rojas; Software, Nahomi Beatriz Moreno-Rodriguez; Validation, Flor Maria Morales-Ulloa, Nahomi Beatriz Moreno-Rodriguez, Yerelin Sofia Reyna-Chavez and Zaida Rojas-Lavado; Formal analysis, Flor Maria Morales-Ulloa, Nahomi Beatriz Moreno-Rodriguez, Yerelin Sofia Reyna-Chavez and Zaida Rojas-Lavado; Research, Flor Maria Morales-Ulloa, Nahomi Beatriz Moreno-Rodriguez, Yerelin Sofia Reyna-Chavez and Zaida Rojas-Lavado; Resources, Flor Maria Morales-Ulloa, Nahomi Beatriz Moreno-Rodriguez, Yerelin Sofia Reyna-Chavez; Data curation, Flor Maria Morales-Ulloa, Nahomi Beatriz Moreno-Rodriguez, Yerelin Sofia Reyna-Chavez and Zaida Rojas-Lavado; Writing - original draft, Flor Maria Morales-Ulloa, Nahomi Beatriz Moreno-Rodriguez, Yerelin Sofia Reyna-Chavez and Zaida Rojas-Lavado; Writing - proofreading and editing, Flor Maria Morales-Ulloa, Nahomi Beatriz Moreno-Rodriguez, Yerelin Sofia Reyna-Chavez and Zaida Rojas-Lavado; Visualization, Flor Maria Morales-Ulloa, Nahomi Beatriz Moreno-Rodriguez, Yerelin Sofia Reyna-Chavez and Zaida Rojas-Lavado; Supervision, Sandro Omar Fernández Rojas.
Funding
No funding is reported for this study.
Ethical approval statement
The study was conducted in accordance with the principles of the Declaration of Helsinki.
Informed consent statement
Informed consent was obtained from all participants involved in the study.
Data availability
Data supporting the findings of this study are available from the corresponding author upon reasonable request.
Acknowledgments
We sincerely thank all participants for their time and willingness to contribute to this study, as their collaboration was essential for the development of this research.
Conflicts of Interest
The authors declare that they have no conflicts of interest.
References
- Augusto, F. y Nunes, M. (2019). Evidencia de validez basada en la relación con variables externas para la escala de Distorsiones Cognitivas Depresivas - EDICOD. Ciencias y Cognición, 24 (1). http://revista.cienciasecognicao.org/index.php/cec/article/view/1495.
- Arroyo, M. y Sádaba, I. (2012). Metodología de la investigación social: Técnicas innovadoras y sus aplicaciones. Síntesis.https://dialnet.unirioja.es/servlet/libro?codigo=551411.
- Alcalá, X., Cortés, L. y Vega, J. (2021). Emotional dependence and dating violence in pre-college students. Journal of Psychology and Behavioral Sciences of the Academic Unit of Legal and Social Sciences, 12(1), 29-45. https://revistapcc.uat.edu.mx/index.php/RPC/article/view/403/379.
- Akhrif, N. (2020). Evaluación de la distorsión cognitiva en la pederastia [Tesis de licenciatura]. Universidad de las Islas Baleares. https://dspace.uib.es/xmlui/bitstream/handle/11201/154900/Akhrif_Achelfatte_Nagua_154900.pdf?sequence=3&isAllowed=y.
- Blanchar, T.y Martinez, N. (2024). ¿Entrevista o encuesta?: Una diferencia necesaria. Revista Latina De Comunicación Social, (83). [CrossRef]
- Becerra, W., Quispe, A., Carcamo, E., Torres, A. y Yupanqui, D. (2023). Propiedades psicométricas del Cuestionario de Pensamientos Automáticos (ATQ-8) en una muestra peruana. Revista de Psicología, 22(2), 129-149. https://revistas.unc.edu.ar/index.php/revaluar/article/view/41010/41096.
- Byrne, B. M. (2010). Structural Equation Modeling with Amos: Basic Concepts, Applications, and Programming (2nd ed.). New York: Taylor and Francis Group. https://www.scirp.org/reference/referencespapers?referenceid=1406046.
- Cango, D. (2022). Distorsiones cognitivas y niveles de agresividad durante la covid 19 en escolares de secundaria de Tacalá - Piura - 2020 [Tesis de Licenciatura, Universidad Nacional de Tumbes].https://repositorio.untumbes.edu.pe/bitstream/handle/20.500.12874/2612/TESIS%20-%20CANGO%20TINEO.pdf?sequence=1&isAllowed=y.
- Cadenas, S. (2021). Distorsiones cognitivas y dependencia emocional en mujeres víctimas de violencia intrafamiliar que acuden a una comisaría del distrito de Chiclayo [Tesis de licenciatura, Universidad César Vallejo]. https://repositorio.ucv.edu.pe/bitstream/handle/20.500.12692/75393/Cadenas_TSJ-SD.pdf?sequence=1&isAllowed=y.
- Carr, S. (2015). The single-classification Chi-square (χ²) test. https://www-mun-ca.translate.goog/biology/scarr/2250_Chi-Square_test.html?_x_tr_sl=en&_x_tr_tl=es&_x_tr_hl=es&_x_tr_pto=rq#:~:text=That%20is%2C%20for%20a%20test,been%20obtained%20simply%20by%20chance.
- Cerchiaro, E., Sánchez, L., Manjarrés, M., y Solano, L. (2021). Cognitive skills in children victims of physical abuse. Praxis, 17(2), 1-15. https://revistas.unimagdalena.edu.co/index.php/praxis/article/view/4297.
- Cieza, W. y Zúñiga, C. (2022). Distorsiones cognitivas y satisfacción marital en adultos víctimas de violencia, Chiclayo 2022 [Tesis de licenciatura, Universidad César Vallejo]. https://repositorio.ucv.edu.pe/bitstream/handle/20.500.12692/125579/Cieza_SWY-Zu%C3%B1iga_RCH-SD.pdf?sequence=1&isAllowed=y.
- Císcar, E., Martínez, C. y Pérez, A. (2021). Aproximación al estudio de la negligencia parental y sus efectos en la infancia y adolescencia. Pedagogía Social. Revista Interuniversitaria, 39 , 153-166. [CrossRef]
- Colegio de psicólogos del Perú. (2018). Código de ética y deontología. https://www.cpsp.pe/codigo-de-etica-y-deontologia.
- Defensoría de la Niñez. (2024). Diagnóstico sobre la situación de derechos de la niñez y adolescencia 2024. Observatorio de Derechos de la Defensoría de la Niñez. https://observatorio.defensorianinez.cl/wp-content/uploads/2024/05/Diagnostico-sobre-situacion-de-derechos-2024-Observatorio-Derechos-Defensoria.pdf.
- Domínguez, S. (2014). Sobre los puntos de corte de los índices de bondad de ajuste en el Análisis Factorial Confirmatorio. Revista Argentina de Ciencias del Comportamiento, 6(2), 78–88. https://www.redalyc.org/journal/6723/672371335005/html/.
- El Peruano (Octubre, 2024). Decreto Supremo N° 006-2024-MIMP, que modifica el Reglamento del Decreto Legislativo N° 1297, Decreto Legislativo para la protección de las niñas, niños y adolescentes sin cuidados parentales o en riesgo de perderlos, N° 001-2018-MIMP. [Ley en línea]. https://busquedas.elperuano.pe/dispositivo/NL/2331248-7.
- Escobedo M, Hernández J, Estebané V, Martínez G, 2016. Modelos de Ecuaciones Estructurales: Características, Fases, Construcción, Aplicación y Resultados. Ciencia & trabajo, 18(55), 16-22. https://www.scielo.cl/scielo.php?pid=S0718-24492016000100004&script=sci_arttext.
- Fernández, B., González, J. y Cantero, M. (2022). Propiedades psicométricas del Children's Negative Cognitive Error Questionnaire en población española adolescente y joven. Revista de estudios e investigación en psicología y educación, 9(1), 137-157. https://www.redalyc.org/journal/6952/695272676009/695272676009.pdf.
- Ferrando P, Lorenzo U, Hernández, A. y Muñiz J. (2022). Decálogo para el análisis factorial de los ítems de un test. Psicothema, 34(1), 7–17. https://doi.org/10.7334/psicothema2021.456. [CrossRef]
- Gempp, R. (2006). El error estándar de medida y la puntuación verdadera de los tests psicológicos: Algunas recomendaciones prácticas. Terapia Psicológica, 24(2), 117-129. https://www.redalyc.org/pdf/785/78524201.pdf.
- Hu, L. y Bentler, P. (1999). Cutoff criteria for fit indexes in covariance structure analysis: Conventional criteria versus new alternatives. Structural Equation Modeling: A Multidisciplinary Journal, 6(1), 1–55. [CrossRef]
- Kaiser, H. (1958). The varimax criterion for analytic rotation in factor analysis. Psychometrika, 23, 187-200.
- Kline, R. (2016). Principles and practice of structural equation modeling (4th ed.). The Guilford Press. https://www.guilford.com/books/Principles-and-Practice-of-Structural-Equation-Modeling/Rex-Kline/9781462551910?srsltid=AfmBOopExVsLML2rrsSA3l4VTz75fHWOB9fdpNROTSsjCJaUYT1WLd00.
- Landacay, T. (2024). Distorsiones Cognitivas y Depresión en Pacientes, Hospital Regional “Virgen de Fátima”, Amazonas, 2023 [Tesis de licenciatura, Universidad César Vallejo]. https://repositorio.untrm.edu.pe/bitstream/handle/20.500.14077/4261/Taisia%20Marlith%20Landacay%20Laulate%20-%20FACISA.pdf?sequence=1&isAllowed=y.
- George, D., & Mallery, P. (2003). SPSS for Windows step by step: A simple guide and reference. 11.0 update (4th ed.). Allyn & Bacon.
- Mancheno, L. (2020). Distorsiones cognitivas y su repercusión en la ansiedad en un estudiante universitario en tiempos de pandemia [Documento probatorio del examen complexivo de grado para la obtención del título de Psicólogo Clínico, Universidad Técnica de Babahoyo]. Universidad Técnica de Babahoyo. https://dspace.utb.edu.ec/bitstream/handle/49000/8966/E-UTB-FCJSE-PSCLIN-000364.pdf?sequence=1&isAllowed=y.
- Ministerio de la Mujer y Poblaciones Vulnerables (MIMP). (2021). Estadísticas del MIMP: Servicio de Refugio Temporal para Niñas, Niños y Adolescentes. https://www.mimp.gob.pe/omep/estadisticas-nna.php.
- Moral, M., y González, M. (2020). Distorsiones Cognitivas y Estrategias de Afrontamiento en Jóvenes con Dependencia Emocional. Revista Iberoamericana de Psicología y Salud, 11 (1), 15-30. https://www.rips.cop.es/pdf/art322020.
- Muñoz, C. (2011). Cómo elaborar y asesorar una investigación de tesis (2a ed.). Pearson Educación.https://www.indesgua.org.gt/wp-content/uploads/2016/08/Carlos-Mu%C3%B1oz-Razo-Como-elaborar-y-asesorar-una-investigacion-de-tesis-2Edicion.pdf.
- Nunnally, J. C., y Bernstein, I. H. ( 1995). Teoría psicométrica (3a ed.). Ciudad de México: McGraw-Hill Latinoamericana.
- Salgado, J., y Moscoso, S. (2019).Análisis factorial confirmatorio en investigación psicológica y educativa. Revista Iberoamericana de Diagnóstico y Evaluación, 2(51), 63–76.
- Sampieri, R., Fernández, C., y Baptista, P. (2023). Metodología de la investigación (6a ed.). McGraw-Hill Education.https://www.esup.edu.pe/wp-content/uploads/2020/12/2.%20Hernandez,%20Fernandez%20y%20Baptista-Metodolog%C3%ADa%20Investigacion%20Cientifica%206ta%20ed.pdf.
- Sica, C., Chiri, L. R., Favili, R., y Marchetti, I. (2017). Evaluación del Q-PAD: Cuestionario para la Evaluación de Problemas en Adolescentes. Consejo General de la Psicología de España.https://www.cop.es/uploads/PDF/2017/QPAP.pdf.
- Suarez, J. (2018). Los pensamientos automáticos y el rendimiento académico de los estudiantes de Enfermería de una Universidad de la Ciudad de Trujillo-2017. [Tesis de Maestría, Universidad César Vallejo]. https://repositorio.ucv.edu.pe/bitstream/handle/20.500.12692/29497/suarez_pj.pdf?sequence=1&isAllowed=y.
- Suarez, L., Guerrero, M., y Bedoya, A. (2021). Ajuste razonable del modelo de terapia cognitiva de Aaron Beck en una muestra piloto de personas sordas señantes, una sistematización de experiencia. Revista de Psicoterapia, 32(118), 217-236. https://doi.org/10.33898/.
- Manjarrez, L., Ortiz, K. y Sierra, V. (2023). Distorsiones cognitivas en mujeres adolescentes víctimas de violencia sexual entre los años 2012 y 2022. [Trabajo de Grado]. Corporación Universitaria Minuto de Dios.
- Martínez, J., y González, R. (2021). Distorsiones Cognitivas En Jóvenes Y Adultos De La Ciudad De Barrancabermeja. [Tesis de licenciatura, Universidad Cooperativa De Colombia]. https://repository.ucc.edu.co/bitstream/20.500.12494/36051/2/2021_distorsiones_cognitivas.pdf.
- Pérez, M., y García, L. (2019). Factores psicológicos en niños y adolescentes institucionalizados: Un análisis cognitivo y emocional. Revista de Psicología y Educación, 34(2), 45-62. https://www.revistadepsicologiayeducacion.es/pdf/20231801.pdf.
- Pérez, E. y Rosario, F. (2017). Propiedades psicométricas del Inventario de Pensamientos Automáticos para estudios vinculados a la conducta antisocial y delictiva en estudiantes de secundaria de instituciones educativas del distrito de Comas, 2017. PsiqueMag, 6(1), 183–199. https://revistas.ucv.edu.pe/index.php/psiquemag/article/view/158.
- Rodriguez, L. y Solorzano, A. (2024). Rol mediador de las distorsiones cognitivas en la relación entre violencia de pareja y dependencia emocional en mujeres jóvenes. [Tesis para optar el título de Licenciada en Psicología]. https://repositorio.ucv.edu.pe/handle/20.500.12692/157673.
- Rivera, B. (2021). Implicancia de los Centros de Acogida Residencial normado en el Decreto Legislativo 1297, respecto al Interés Superior del Niño- Arequipa 2020 [Tesis de licenciatura; Universidad César Vallejo]. https://repositorio.ucv.edu.pe/bitstream/handle/20.500.12692/74471/Rivera_RBA-SD.pdf?sequence=1#:~:text=Es%20una%20comunidad%20p%C3%BAblica%2C%20privada,de%20acuerdo%20a%20sus%20necesidades.
- Roco-Videla, Ángel, Flores, Sergio Vladimir, Olguin-Barraza, Mariela, & Maureira-Carsalade, Nelson. (2024). Alpha de cronbach y su intervalo de confianza. Nutrición Hospitalaria, 41(1), 270-271. Epub 07 de marzo de 2024. [CrossRef]
- Roco, Á., Aguilera, R., y Olguín, M. (2024). Ventajas del uso del coeficiente de omega de McDonald frente al alfa de Cronbach. Nutrición Hospitalaria, 41(1), 262-263. [CrossRef]
- Rojas, G. (2021). Distorsiones cognitivas en niños de edad preescolar. [Trabajo Académico para optar el Título de Segunda Especialidad Profesional en Educación Inicial]. https://repositorio.untumbes.edu.pe/handle/20.500.12874/65083.
- Rojas, M., Arias, W., Rivera, R., Geldres, J., Starke, M. y Apaza, E. (2020). Propiedades psicométricas de los cuestionarios Reactive/Proactive Questionnaire (RPQ) y How I Think Questionaire (HIT) en estudiantes peruanos. Revista de Psicopatología y Psicología Clínica, 25(1). https://www.aepcp.net/wp-content/uploads/2020/07/30686_Psicopatologia_Vol_25_N1_WEB_Parte7.pdf.
- Romani, D. (2020). Dependencia emocional y distorsiones cognitivas en adolescentes de una institución educativa de Villa El Salvador. [Tesis de licenciatura, Universidad Autónoma del Perú]. https://repositorio.autonoma.edu.pe/handle/20.500.13067/1186.
- UNICEF. (2023). Informe anual 2023: Para cada infancia [Informe en línea].https://www.unicef.org/es/informes/informe-anual-unicef-2023.
- Universidad Cesar Vallejo. (2022). Resolución de consejo universitario. N° 0470. https://webadminportal.ucv.edu.pe/uploads/files/backup/RCUN-470-2022-UCV-Aprueba-actualizacion-del-Codigo-de-Etica-en-Investigacion-V01.
- Urrutia, M., Barrios, S., Gutiérrez, M. y Mayorga, M. (2014). Métodos óptimos para determinar validez de contenido. Educación Médica Superior, 28(3), 547-558. Recuperado en 30 de noviembre de 2019, de http://scielo.sld.cu/scielo.php?script=sci_arttext&pid=S0864-21412014000300014&lng=es&tlng=es.
- Checalla, R. (2018). Violencia familiar y distorsiones cognitivas en adolescentes de tres instituciones educativas públicas del distrito de Puente Piedra, Lima 2018. [Tesis de licenciatura, Universidad César Vallejo]- https://repositorio.ucv.edu.pe/handle/20.500.12692/30428.
- Mate, A. (2017). Esquemas cognitivos disfuncionales, distorsiones cognitivas y agresión en jóvenes y adolescentes. [Tesis de licenciatura, Universidad Complutense de Madrid]. https://dialnet.unirioja.es/servlet/tesis?codigo=134635.
- Ventura, J. (2019). Dos formas fáciles de interpretar las famosas cargas factoriales. Gaceta Sanitaria, 33(6), 599. https://doi.org/10.1016/j.gaceta.2019.04.002. [CrossRef]
- Ventura, J. y Caycho, T. (2017). "El análisis factorial confirmatorio para investigadores noveles". Apuntes de Psicología, 35(3), 567–576. https://joseventuraleon.com/f/artículos-científicos.
- Yucel SC, Ergin E, Orgun F, Gokçen M, Eser I. (2020). Validity and reliability study of the Moral Distress Questionnaire in Turkish for nurses. Rev. Latino-Am. Enfermagem. 2020;28:e3319. http://dx.doi.org/10.1590/1518-8345.2960.3319. [CrossRef]
Table 4.
Factor Loadings for the Cognitive Distortions Scale.
| Factor 1 | Factor 2 | Uniqueness | ||
|---|---|---|---|---|
| I19 | 0.651 | 0.573 | ||
| I18 | 0.643 | 0.523 | ||
| I17 | 0.627 | 0.511 | ||
| I22 | 0.621 | 0.606 | ||
| I21 | 0.615 | 0.622 | ||
| I15 | 0.604 | 0.547 | ||
| I13 | 0.577 | 0.56 | ||
| I16 | 0.565 | 0.562 | ||
| I20 | 0.56 | 0.685 | ||
| I14 | 0.543 | 0.563 | ||
| I23 | 0.432 | 0.785 | ||
| I8 | 0.681 | 0.537 | ||
| I11 | 0.651 | 0.574 | ||
| I9 | 0.589 | 0.62 | ||
| I12 | 0.561 | 0.678 | ||
| I10 | 0.512 | 0.713 | ||
| I2 | 0.493 | 0.666 | ||
| I3 | 0.485 | 0.705 | ||
| I7 | 0.484 | 0.746 | ||
| I6 | 0.452 | 0.695 | ||
| I4 | 0.426 | 0.671 | ||
| Kaiser-Meyer-Olkin Measure of Sampling Adequacy (MSA) | ||||
| MSA | ||||
| MSA General | 0.900 | |||
| Note: Varimax rotation method was applied. | ||||
Table 5.
Factor Loadings of the Cognitive Distortions Scale in Children and Adolescents from Residential Care Centers (CARs).
Table 5.
Factor Loadings of the Cognitive Distortions Scale in Children and Adolescents from Residential Care Centers (CARs).
| Factor | Indicator | Estimate | Standard Error | p | CI 95% | |
|---|---|---|---|---|---|---|
| Lower | Upper | |||||
| Factor 1 | I19 | 0.765 | 0.062 | < .001 | 0.642 | 0.887 |
| I18 | 0.798 | 0.062 | < .001 | 0.677 | 0.918 | |
| I17 | 0.782 | 0.059 | < .001 | 0.665 | 0.898 | |
| I22 | 0.742 | 0.061 | < .001 | 0.622 | 0.862 | |
| I21 | 0.721 | 0.066 | < .001 | 0.592 | 0.849 | |
| I15 | 0.759 | 0.061 | < .001 | 0.64 | 0.878 | |
| I13 | 0.77 | 0.061 | < .001 | 0.65 | 0.89 | |
| I16 | 0.754 | 0.06 | < .001 | 0.636 | 0.873 | |
| I20 | 0.693 | 0.065 | < .001 | 0.565 | 0.821 | |
| I14 | 0.775 | 0.061 | < .001 | 0.655 | 0.896 | |
| I23 | 0.579 | 0.065 | < .001 | 0.452 | 0.707 | |
| Factor 2 | I8 | 0.656 | 0.07 | < .001 | 0.519 | 0.794 |
| I11 | 0.593 | 0.067 | < .001 | 0.461 | 0.724 | |
| I9 | 0.699 | 0.066 | < .001 | 0.571 | 0.828 | |
| I12 | 0.597 | 0.064 | < .001 | 0.47 | 0.723 | |
| I10 | 0.678 | 0.067 | < .001 | 0.546 | 0.81 | |
| I2 | 0.659 | 0.063 | < .001 | 0.536 | 0.783 | |
| I3 | 0.696 | 0.062 | < .001 | 0.573 | 0.818 | |
| I7 | 0.598 | 0.074 | < .001 | 0.454 | 0.742 | |
| I6 | 0.722 | 0.062 | < .001 | 0.601 | 0.844 | |
| I4 | 0.667 | 0.063 | < .001 | 0.544 | 0.79 | |
| Note: χ²: Chi-square statistic; df: Degrees of freedom; p: Significance level; p < .01 | ||||||
Table 6.
Additional Fit Indices.
| Fit Model | Absolute Fit Index | Comparative Fit Index | |||||
|---|---|---|---|---|---|---|---|
| GFI | AGFI | SRMR | RMSEA | CFI | TLI | NFI | |
| AM1 | 0.85 | 0.81 | 0.07 | 0.08 | 0.87 | 0.85 | 0.80 |
| AM3 | 0.86 | 0.83 | 0.07 | 0.07 | 0.89 | 0.87 | 0.82 |
| Note: AM = Amos default model. GFI = Goodness-of-Fit Index. AGFI = Adjusted Goodness-of-Fit Index. RMR = Root Mean Square Residual. RMSEA = Root Mean Square Error of Approximation. CFI = Comparative Fit Index. TLI = Tucker-Lewis Index. NFI = Normed Fit Index. | |||||||
Table 7.
Percentile Norms of the Cognitive Distortions Scale in Children and Adolescents from Residential Care Centers (CARs).
Table 7.
Percentile Norms of the Cognitive Distortions Scale in Children and Adolescents from Residential Care Centers (CARs).
| Variable | Cognitive Distortions | ||||||
|---|---|---|---|---|---|---|---|
| Levels | |||||||
| Low | >= 92 | ||||||
| Medium | <= 61 | ||||||
| High | <= 31 | ||||||
| Dimensions | Cognitive Self-Demeaning Distortions | Cognitive Self-Serving Distortions | |||||
| Levels | |||||||
| Low | >= 32 | Baja | >= 60 | ||||
| Medium | <= 21 | Media | <= 40 | ||||
| High | <= 11 | Alta | <= 20 | ||||
| Indicators | Labeling | Should Statements | Blaming | Polarized Thinking | Catastrophizing | Overgeneralization | Thought Interpretation |
| Levels | |||||||
| Low | >= 8 | >= 8 | >= 16 | >= 16 | >= 16 | >= 32 | >= 12 |
| Medium | <= 5 | <= 5 | <= 11 | <= 11 | <= 11 | <= 21 | <= 8 |
| High | <= 3 | <= 3 | <= 5 | <= 5 | <= 5 | <= 11 | <= 4 |
Table 8.
Reliability Statistics of the Cognitive Distortions Scale in Children and Adolescents from Residential Care Centers (CARs).
Table 8.
Reliability Statistics of the Cognitive Distortions Scale in Children and Adolescents from Residential Care Centers (CARs).
| Coefficient | Estimate | Standar Error | CI 95% | |
|---|---|---|---|---|
| Lower | Upper | |||
| Coefficient α | 0.909 | 0.006 | 0.898 | 0.92 |
| Coefficient ω | 0.909 | 0.008 | 0.893 | 0.925 |
Disclaimer/Publisher’s Note: The statements, opinions and data contained in all publications are solely those of the individual author(s) and contributor(s) and not of MDPI and/or the editor(s). MDPI and/or the editor(s) disclaim responsibility for any injury to people or property resulting from any ideas, methods, instructions or products referred to in the content. |
© 2025 by the authors. Licensee MDPI, Basel, Switzerland. This article is an open access article distributed under the terms and conditions of the Creative Commons Attribution (CC BY) license (http://creativecommons.org/licenses/by/4.0/).
Copyright: This open access article is published under a Creative Commons CC BY 4.0 license, which permit the free download, distribution, and reuse, provided that the author and preprint are cited in any reuse.


