Submitted:
15 May 2025
Posted:
15 May 2025
You are already at the latest version
Abstract
Background/Objective:
The assessment of the efficacy of antiseizure medications (ASMs) in animal models of acute seizures has played a critical role in these drugs’ success in clinical trials for human epilepsy. One of the most widely used animal models for this purpose is the maximal electroshock seizure (MES) model. While there are numerous published reports on the efficacy of conventional ASMs in MES models, there is a need to expand the understanding on the brain concentrations that are needed to achieve optimal levels of efficacy in this model.
Methods:
We evaluated six clinically available ASMs in both a mouse and a rat MES model by analyzing dose-response and concentration-response for brain and plasma exposure levels: carbamazepine (CBZ), phenytoin (PHT), valproic acid (VPA), lacosa-mide (LSM), cenobamate (CNB), and retigabine (RTG).
Results:
Our data indicate that these ASMs tend to be more effective in reducing seizures in the rat MES, with notable differences in drug metabolism and brain penetrance be-tween mice and rats.
Conclusion:
These findings highlight the value of considering concentration-response variations and species-specific differences when assessing the efficacy of both conventional ASMs and novel compounds exhibiting anticonvulsant activity.
Keywords:
antiseizure medications
; brain-to-plasma ratio
; concentration-response
; epilepsy
; maximal electroshock seizure
; pharmacokinetics
; pharmacodynamics
1. Introduction
The maximal electroshock seizure (MES) model is one of the most widely used experimental paradigms to evaluate the efficacy of compounds against tonic-clonic seizures [1]. This test induces synchronous neural discharges in the brain through the application of electrical current using transcorneal or transauricular electrodes [2]. One of the main advantages of an MES model is its ability to quickly and reliably induce tonic-clonic seizures, allowing for the rapid assessment of potential antiseizure medications (ASMs). Standard and newly developed ASMs tend to prevent epileptic activity induced by an MES procedure through mechanisms that increase the threshold for seizure initiation and prevent its spread [3]. Despite ongoing efforts to develop new models that closely mimic human epilepsy, the MES model remains the most reliable and effective tool for identifying anticonvulsant compounds.
Commonly used in clinical practice, conventional ASMs such as carbamazepine (CBZ), phenytoin (PHT) and valproic acid (VPA) are still being studied in preclinical settings, particularly for their interactions with other drugs in the MES model [4,5,6]. Nevertheless, there is a need to expand the understanding of the pharmacokinetic/pharmacodynamic (PK/PD) profiles of different ASMs in rodents in this experimental paradigm, especially in terms of exploring interspecies variations. The choice between mice and rats is one factor that can influence experimental outcomes when assessing the effectiveness of new ASMs. Both species have been extensively used in the evaluation of novel drug candidates for epilepsy, and compounds that demonstrate efficacy in a mouse MES typically produce similar effects in a rat MES [7]. However, metabolic differences and variations in tissue distribution between both species can lead to distinct pharmacokinetic profiles, which can affect the potency of the compounds tested [8,9]. Notably, there is a shortage of studies comparing the PK/PD profiles of different ASMs in both mice and rats.
In addition, few studies report concentrations of ASMs in the brain and plasma, which is useful information to understand a drugs’ PK/PD profile. The ability of a drug to cross the blood-brain barrier (BBB) and reach its target site in the brain is expressed by the brain-to-plasma ratio (B/P ratio): the concentration of a drug in the brain relative to its concentration in the plasma [10]. Drugs with a high B/P ratio are more likely to penetrate the BBB and to present a low P-glycoprotein (Pgp) efflux transport [11]. However, despite the close relationship between the efficacy of drugs that act in the central nervous system (CNS) and their B/P ratio, the variation of this parameter among different rodent species has not been studied in great detail [12]. Increased understanding of the B/P ratio would allow for better comparison of preclinical data as it relates to effectiveness and safety of ASMs.
In-depth understanding of the interactive dynamics of PK/PD processes in a rodent model like the MES may provide valuable insights for pre-clinical drug discovery. Here, we conducted a comprehensive evaluation of five commonly prescribed ASMs: CBZ; PHT; VPA; lacosamide (LSM) and cenobamate (CNB) in mice and rats using an MES model. Retigabine (RTG) was also included due to its distinct mechanism of action. We determined the half maximal effective concentration (EC50) of each compound in the plasma and brain and their B/P ratios, providing significant insights into the variations in the PK/PD profiles of both species.
2. Results
The anticonvulsant activity of CBZ (a sodium channel blocker) against MES-induced seizures is shown in Figure 1A-B. Mice treated with CBZ had a significant reduction in fraction seizing at doses ranging from 6 to 30 mg/kg (p<0.0001) with a median effective dose (ED50) of 9.67 mg/kg. In rats, seizure activity induced by MES was reduced at doses from 3 to 30 mg/kg (p<0.0001) with an ED50 of 4.39 mg/kg. The EC50 of CBZ in mouse plasma (13.8 µM) was about 3 times higher than the EC50 in rat plasma (4.55 µM). The brain EC50 was nearly 7 times higher in mice compared to rats (EC50 mouse = 32.5 µM, EC50 rat = 4.70 µM) (Figure 2A-C).
The sodium channel blocker PHT induced a dose-dependent effect in mice at doses ranging from 9 to 18 mg/kg (p<0.0001, ED50 = 9.81 mg/kg), and in rats at doses from 10 to 75 mg/kg (p<0.0001, ED50 = 16.9 mg/kg) (Figures 1C-D). The plasma EC50 in mice treated with PHT (27.6 µM) was about 9 times higher than in rats (3.20 µM). This difference was even more pronounced in the brain, where the EC50 in mice (30.6 µM) was about 12 times higher than in rats (2.66 µM) (Figure 2D-F).
The mechanisms underlying the antiseizure activity of VPA are not fully understood, but it is known to increase γ-aminobutyric acid (GABA)-mediated signaling and block sodium channels [13]. In our study, VPA reduced seizures induced by MES in mice at doses ranging from 200 to 300 mg/kg (p<0.0001, ED50 = 196 mg/kg), and in rats at doses ranging from 375 to 750 mg/kg (p<0.0001, ED50 = 366 mg/kg) (Figures 1E-F). The plasma EC50 values were similar in mice (1668 µM) and rats (1306 µM). In the brain, however, the EC50 was twice as high in mice (630 µM) compared to rats (307 µM) (Figure 3A-C).
The antiepileptic activity of LSM is thought to be due to its ability to enhance the inactivation of voltage-gated sodium channels and interact with collapsin response mediator protein-2 (CRMP2) [14]. In our study, LSM was effective against MES-induced seizures in mice at doses ranging from 10 to 75 mg/kg (p<0.0001, ED50 = 15.2 mg/kg), and in rats at doses from 10 to 25 mg/kg (p<0.0001, ED50 = 9.80 mg/kg) (Figures 1G-H). Mice treated with LSM exhibited similar EC50 values in both plasma (19.3 µM; 0.78-fold difference) and brain (14.8 µM; 1.21-fold difference) compared to rats (EC50, plasma: 24.9 µM; EC50, brain: 12.2 µM) (Figure 3D-F).
The mechanism of CNB remains unclear but it has been proposed to exert its antiepileptic activity through a dual mechanism of action. This drug has been suggested to act as a voltage-gated sodium channel blocker as well as an enhancer of GABAergic activity [15]. In our study, CNB reduced MES-induced seizures in mice at doses of 7.5, 10 and 30 mg/kg (p<0.0001, ED50=7.05 mg/kg), and at the dose of 18 mg/kg in rats (p<0.0001, ED50=6 mg/kg) (Figure 1I-J). We observed that mice had a 4-fold higher EC50 in plasma (66.0 µM) and a 2-fold higher EC50 in the brain (24.9 µM) in comparison to rats (15.9 µM and 10.7 µM, respectively) (Figure 4A-C).
We also examined the effectiveness and tissue distribution of RTG, a KV7 potassium channel potentiator that has shown clinical efficacy in reducing seizures [16]. We observed a dose-response curve at doses ranging from 5 to 35 mg/kg, however, although we found a 50% reduction in seizure score compared to the vehicle-treated group, the results did not reach statistical significance (p=0.12, ED50=42.9 mg/kg). In rats, a significant reduction in seizure frequency was observed at 30 mg/kg (p<0.01, ED50=13.9 mg/kg) (Figure 1K-L). Mice EC50 values were 1.5-fold higher in plasma (2.26 µM) and 1.19-fold higher in brain (3.58 µM) compared to rats (1.46 µM and 3.01 µM, respectively) (Figure 4D-F).
The results described above are summarized in Table 1, which also provides the B/P values for each experimental group. Overall, brain and plasma EC50 values were higher in mice than in rats for the ASMs tested (Figure 5). Mice exhibited higher brain penetrance for CBZ, PHT, VPA and LSM compared to rats (2.28-, 1.33-, 1.61-, and 1.57-fold, respectively), but showed lower brain penetrance for CNB and RTG (0.56-, 0.77-fold, respectively).
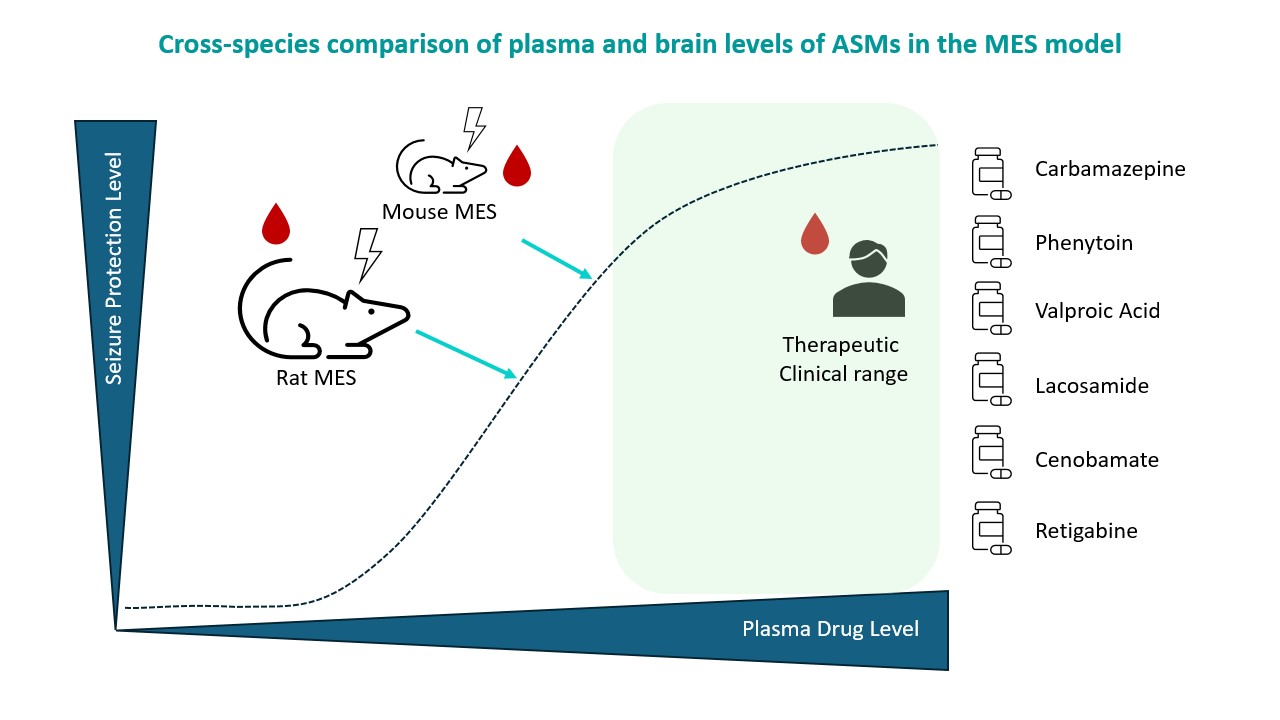
In addition, Table 1 compares the drug concentrations required to prevent seizures in mice and rats obtained in this study with previously published clinically efficacious exposure values [17,18,19,20,21]. In our study, drugs that act mainly as sodium channel blockers were effective in preventing seizures in rodents at lower plasma concentrations than the effective clinical plasma exposures. In contrast, the GABAergic potentiator VPA required higher concentrations to achieve efficacy in rodents than the concentrations needed for efficacy in humans. Drugs that act through other mechanisms such as LSM and RTG showed efficacy in the rodent MES model at concentrations that are comparable to therapeutic levels in the clinic (Figure 6).
3. Discussion
Epilepsy is a serious neurological condition that is often accompanied by psychiatric comorbidities [22] and can lead to significant mortality [23]. Despite the availability of many ASMs, there are still significant challenges in the management of epilepsy. A major problem is the high proportion of drug-resistant cases, when a patient does not respond to at least two tolerated ASMs used either in combination or separately. It is estimated that drug-resistant epilepsy, which requires adjunctive treatment, accounts for around 30% of cases [24,25]. While ASM combination therapy can increase the likelihood of achieving seizure control, it is also associated with an increased risk of adverse effects, which can lead to poor adherence to medication [26,27].
The variability in the PK/PD of ASMs in individual patients can make it difficult to predict the optimal therapeutic dose of an ASM, leading to a trial-and-error approach that can be time-consuming [19,28,29,30]. In some cases, pre-clinical studies providing additional information about the PK/PD profile of an ASM may be useful to improve dosing accuracy and reduce the time required for achieving adequate seizure control and minimizing side effects. In addition, improved understanding of the relationship between the efficacy of an ASM and brain exposure might be obtained from data linking plasma levels of ASMs to anticonvulsant activity in pre-clinical studies. In this study, we evaluated the PK/PD profile and B/P ratio of ASMs using MES models, a widely used paradigm to investigate anticonvulsant drug activity that can reasonably estimate human efficacious doses and exposure [1]. The efficacy and exposure levels of six ASMs commonly prescribed in clinical practice were evaluated in an MES model in both mice and rats, noting that the results presented in this study were obtained using CF-1 mice and Sprague-Dawley rats. As with any preclinical research, heterogeneity in the EC50 values can be expected between studies, due to strain-specific differences and methodological variations [31,32].
Our study found that CBZ, PHT, VPA, LSM, CNB, and RTG all had substantial anticonvulsant activity in the tested MES model. Although RTG did not produce a statistically significant anticonvulsant effect in mice at the doses tested (5-35 mg/kg), we observed a 50% reduction in the fraction seizing at the highest dose tested. Since mice treated with RTG at higher doses began to show clinical signs, we did not test additional doses to expand the dose-response curve.
Rodent ED50 from pre-clinical dose-response studies is often used as an early predictor of therapeutic antiepileptic effectiveness in humans [1]. Alternatively or in addition, determining the EC50 of a drug can provide valuable insights that cannot be obtained from ED50, given that the concentration of a drug in the blood and tissues is often a more accurate predictor of its pharmacological effects than the dose [33], as it can provide more information about the individual variability in pharmacological processes such as absorption, distribution, metabolism, and elimination [34]. The majority of published studies evaluating ASMs present exclusively ED50 values, and those where concentration is evaluated often assess only plasma EC50 values. Our study expands upon current knowledge by providing brain EC50 values for the assessed ASMs, which provides a thorough evaluation of the PK/PD profiles of these ASMs which target the CNS. Further, while most studies evaluate ASMs using mice or rats, there are few comparisons regarding drug efficacy between these species. Establishing these comparisons could allow for a more comprehensive understanding of species-specific responses, which may refine the reliability and translatability of the findings in preclinical research.
The results of our EC50 analyses in the plasma and brain of rodents indicate that the sodium channel blockers CBZ, PHT and CNB were several times more potent in rats compared to mice. However, no interspecies difference was observed in rodents treated with LSM. Moreover, we found that rats and mice that received the GABAergic modulator VPA had similar EC50 in plasma, but the EC50 in the brain of rats was about two times lower than the EC50 in mice. VPA has previously been reported to present a wide range of half-life in different species, with a shorter half-life in rats compared to mice [8]. This difference may be due to species-specific differences in drug-metabolizing enzymes [8] and/or drug-specific interactions with BBB permeability and/or efflux transporters [35]. In addition to evaluating conventional ASMs, we investigated the PK/PD of RTG, an ASM with a different mechanism of action (KV7 potassium channel potentiator) compared to the other ASMs tested. We observed that RTG was equipotent in mice and rats.
A review of the literature, which incorporated data from various studies that employed ED50 as a parameter for efficacy in an MES assay, revealed that nine ASMs assessed in mice and rats underestimated the effective doses required for human use [1]. In this study, we used a different approach by comparing the plasma EC50 values obtained in rodent MES models with the therapeutic plasma concentration values reported in patients. The EC50 values of the sodium channel blockers CBZ, PHT and CNB in rodents were lower than the minimal therapeutic plasma concentration reported in humans [17,18]. In contrast, the exposure levels of VPA required to prevent seizures in our rodent MES model were higher than those reported to be effective in patients [18,19]. Additionally, LSM and RTG prevent seizures in mice and rats at plasma concentrations comparable to the reported effective therapeutic range in humans [20,21]. One possible explanation for the observed variations in therapeutic concentrations between rodents and humans could stem from species-specific differences in brain penetrance and protein binding within this tissue. According to the free drug hypothesis, only unbound concentrations can interact with targets and elicit pharmacological effects [36], and drug compounds generally exhibit slightly higher plasma protein binding in humans than in rodents [37]. However, given that determination of drug levels in the human brain may have to rely on advanced imaging technology, a direct comparison of drug potency, brain penetrance and bioavailability between rodents and humans is complex, and therefore extrapolation is necessary to use rodent models to support clinical studies [31,32].
In conclusion, our study indicates that conventional ASMs are generally more effective in reducing seizures in the rat MES versus the mouse MES model and highlights differences in drug metabolism and brain penetrance between mice and rats. This emphasizes the potential value of considering species-specific differences when investigating new drug compounds, as well as the importance of considering exposure levels when assessing the efficacy of ASMs, particularly in the brain. Future studies may be helpful to provide a better understanding of how the anatomical and physiological differences between these mice and rats might contribute to drug-specific differences in plasma exposure levels, brain penetrance and efficacy. A comprehensive understanding of these factors may help to optimize the development of novel ASMs, ensuring maximum therapeutic potential.
4. Materials and Methods
4.1. Animals
CF-1 male mice (3-7 weeks old) and Sprague Dawley rats (5 weeks old) from both sexes were used in the experiments (obtained from Charles River Laboratories). Animals were group-housed (2-4 mice or 3-4 rats per cage) in plastic cages and maintained under controlled temperature (18-25°C), humidity, ventilation, and lighting (12-h light/dark cycle). They had free access to water and Certified Rodent Chow (Teklad Rodent Chow). Upon arrival, the animals were examined to ensure their satisfactory health status and were acclimated to the facility for at least 5 days before being subjected to the MES protocol. All experiments were conducted in accordance with guidelines set by the Canadian Council on Animal Care and approved by the Xenon Animal Care Committee.
4.2. Drugs and Treatments
To study the PK/PD profiles of conventional ASMs, the following drugs were investigated: CBZ (Sigma Aldrich C4024); PHT (Sigma Aldrich); VPA (Sigma Aldrich P4543); LSM (Toronto Research Chemicals L098500); CNB (Med Chem Express HY17607); and RTG (synthesized at Xenon Pharmaceuticals Inc.). Drugs were administered by intraperitoneal route (IP; dissolved in sterile saline) or oral route (PO; dissolved in 0.5% methylcellulose + 0.2% Tween 80 in DI water) in a volume of 10 mL/kg. Control animals received the appropriate vehicle. The doses and pre-treatment times for each drug were determined based on in-house data and are detailed in Table 2.
4.3 . Alternating Current-Maximal Electroshock Seizure Assay (AC-MES)
The MES seizure assay is widely used in the search for anticonvulsant substances [31,38,39]. This animal model for generalized tonic-clonic seizures assesses a compound’s ability to prevent seizure spread. In our studies, an alternating current electroshock (60 Hz, 40 mA for mice and 150 mA for rats) was delivered for 0.2 seconds (0.5 ms pulse width) using corneal electrodes (HSE-HA Rodent Shocker, Harvard Apparatus, model 73-0105). Before the electroshock stimulation, the eyes were anesthetized with a topical application of 0.5% proparacaine hydrochloride (one drop per eye). Animals were then restrained, the corneal electrodes applied, and the shock administered. An MES-induced seizure was characterized by an initial generalized tonic seizure with a hindlimb tonic extensor component.
In each experiment, animals were randomly assigned to a treatment group, ensuring that all animals had an equal and unbiased chance of being assigned to any treatment group. The protocols for administering PO or IP doses of vehicle or drug are described in Table 1. These doses were administered 0.5-2 h before the application of electric stimulation. An animal was considered protected from MES-induced seizures if the hindlimb tonic extensor component of the seizure was abolished and was then scored as "0". If a mouse or rat displayed tonic hindlimb extension within 5 seconds post-stimulation, the score was "1". Seizure induction and scoring was performed by an experimenter who was blinded to treatment conditions.
4.4. Collection of Plasma and Brain Samples
After being subjected to the stimulation protocol, rodents were anesthetized by isoflurane inhalation until they reached a surgical plane of anesthesia. Approximately 0.5 mL of blood was collected via cardiac puncture and transferred to EDTA-coated tubes on ice. Animals were then euthanized by cervical dislocation and brains were removed, weighed, and immediately frozen on dry ice. At the end of the sample collection, blood was centrifuged at 4000 rpm for 10 minutes at 4°C, and the plasma was separated. All samples were stored at -80°C until the time of bioanalysis.
4.5. Processing of Samples for Bioanalysis
4.5.1. Plasma Samples
Plasma samples were extracted for analysis using a protein precipitation method with acetonitrile. 50 µL of diluted plasma samples were mixed with 50 µL of an internal standard (IS) solution in a 1:1 mixture of acetonitrile and water. 200 µL of acetonitrile was then added to the mixture, which was vortexed for 30 seconds. The samples were centrifuged at 13,000 rpm for 20 minutes, decanted into a 96-well plate, and further centrifuged at 4000 rpm for 20 minutes. The samples were then analyzed using ultra-high performance electrospray ionization tandem mass spectrometry (UHPLC-ESI-MS/MS).
4.5.2. Brain Samples
Brains were homogenized in a 1:1 mixture of acetonitrile and water (2 mL per mouse brain) using the T18 ULTRA-TURRAX homogenizer for about 1 minute. The homogenate was centrifuged at 13,000 rpm for 20 minutes, and 50 µL of the supernatant was treated in the same way as the plasma samples for analysis.
4.6. Bioanalysis Procedures
Dipotassium EDTA blank mouse plasma (Valley Biomedical, USA) was used to prepare standards and quality control (QC) samples for plasma quantitation and as surrogates for brain homogenate quantitation. Twelve calibration samples ranged from 2.34 ng/mL to 4,800 ng/mL. QC samples at 14 ng/mL (QC-L), 225 ng/mL (QC-M) and 3,600 ng/mL (QC-H) were analyzed in triplicate.
Samples were analyzed by UHPLC-ESI MS/MS using a TQ-5500 Sciex triple quadrupole mass spectrometer equipped with a Shimadzu Nexera UHPLC pump and auto-sampler system using an ACE C18 PFP, 2.50 x 50 mm, 1.7 µm particle size column and gradient elution consisting of solvent A (0.1% formic acid in water) and solvent B (0.1% formic acid in acetonitrile) starting at 50% B from 0 minutes to 0.6 minutes and then increased to 100% B from 0.6 minutes to 1.0 minutes. At 1.5 minutes, the mobile phase composition was switched back to 50% B at 1.6 minute and then held at 50% B until 2.5 minutes. The flow rate used throughout the experiment was 0.4 mL/min. All compounds except phenytoin were detected in the positive ion mode using mass transitions 237→194 m/z (CBZ), 145→71 m/z (VPA), 251.2→91 m/z (LSM), 267.8→155.1 m/z (CNB), and 304.2→109 m/z (RTG). PHT was detected in the negative ion mode using mass transition 251→42 m/z. Each compound was matched with a proprietary co-eluting internal standard. The UHPLC-ESI MS/MS system was controlled, and samples were quantified using Analyst 1.6.
Sample concentrations were determined using a linear calibration function, weighted 1/x, generated by the regression of analyte to IS peak area ratios in the standard samples to their respective concentrations. Acceptance criteria for the analytical run required that the back-calculated values of the standards and the QC samples fell within ±20% of their nominal values, except for the lowest standard or lower limit of quantitation, for which the acceptance criterion was ± 25%. At least six out of twelve standard points had to show back-calculated values within ± 20% of their nominal concentrations for the calibration to be accepted. At least three QC samples, one at each concentration, had to show back-calculated values within ± 20% of their nominal concentrations for the whole sample batch to be valid.
4.7. Data Processing and Analysis
The statistical analysis for the data collected in this study was conducted using GraphPad Prism version 9 software. The data for MES test is presented as the fraction of animals that showed hindlimb extension out of the total number of animals in each group.
The concentration-response curves were generated using the Hill-Langmuir equation:
Y = B + (T - B) × xn / (IC50n + xn), where:
B = bottom, set as 0.
T = top, set as 1.
n = the Hill coefficient, constrained to less than zero.
IC50 = concentration of a compound required for 50% inhibition in vitro.
The AC-MES assay is a binary readout, animals are protected (0) or not (1). Therefore, a simple logistic regression analysis based on individual animal concentration response data was used to predict the concentration where there is a 50% probability that the rodents will be protected from seizure, reported as EC50. The logistic regression curve fit was generated using the Hill-Langmuir equation. For data plotting purposes, the curve fit was overlayed against the concentration response data points plotted by dose.
All data is expressed as mean and between-group differences were analyzed using Kruskal-Wallis followed by Dunn’s multiple comparison test. Statistical significance was reached at p<0.05.
Author Contributions
Conceptualization, G.B.; methodology, G.B., formal analysis, L.B., G.B. and R.D.; investigation, L.B., G.B., C.D., K.N., M.F., S.S., G.D.B, S.L. and A.L.; resources, L.S. and J.J.; data curation, L.B., G.B. and R.D.; writing—original draft preparation: L.B.; writing—review and editing, L.B., R.D., J.J. and N.W.; supervision, R.D., J.J. and N.W. All authors have read and agreed to the published version of the manuscript.
Data Availability Statement
Data is available upon request from the authors.
Acknowledgments
We thank Xenon Pharmaceuticals for supporting this research and acknowledge the invaluable contributions of our animal care team, whose dedication ensured high quality care of the animals used in this research.
Conflicts of Interest
The authors declare no conflicts of interest.
Abbreviations
The following abbreviations are used in this manuscript:
| ASMs | Antiseizure medications |
| BBB | Blood-brain barrier |
| B/P | Brain-to-plasma |
| CNB | Cenobamate |
| CBZ | Carbamazepine |
| EC50 | Half maximal effective concentration |
| ED50 | Median effective dose |
| GABA | γ-aminobutyric acid |
| LSM | Lacosamide |
| MES | Maximal electroshock seizure |
| PHT | Phenytoin |
| PK/PD | Pharmacokinetics/pharmacodynamics |
| RTG | Retigabine |
| SD | Sprague-Dawley |
| VPA | Valproic acid |
References
- Yuen, E. S.; Troconiz, I. F., Can pentylenetetrazole and maximal electroshock rodent seizure models quantitatively predict antiepileptic efficacy in humans? Seizure 2015, 24, 21-7. [CrossRef]
- Toman, J. E.; Swinyard, E. A.; Goodman, L. S., Properties of maximal seizures, and their alteration by anticonvulant drugs and other agents. J Neurophysiol 1946, 9, 231-9their alteration by anticonvulant drugs and other agents.
- Castel-Branco, M. M.; Alves, G. L.; Figueiredo, I. V.; Falcao, A. C.; Caramona, M. M., The maximal electroshock seizure (MES) model in the preclinical assessment of potential new antiepileptic drugs. Methods Find Exp Clin Pharmacol 2009, 31, (2), 101-6. [CrossRef]
- Lukawski, K.; Janowska, A.; Jakubus, T.; Czuczwar, S. J., Interactions between angiotensin AT1 receptor antagonists and second-generation antiepileptic drugs in the test of maximal electroshock. Fundam Clin Pharmacol 2014, 28, (3), 277-83. [CrossRef]
- Luszczki, J. J.; Trojnar, M. K.; Ratnaraj, N.; Patsalos, P. N.; Czuczwar, S. J., Interactions of stiripentol with clobazam and valproate in the mouse maximal electroshock-induced seizure model. Epilepsy Res 2010, 90, (3), 188-98. [CrossRef]
- Stepien, K. M.; Tomaszewski, M.; Luszczki, J. J.; Czuczwar, S. J., The interactions of atorvastatin and fluvastatin with carbamazepine, phenytoin and valproate in the mouse maximal electroshock seizure model. Eur J Pharmacol 2012, 674, (1), 20-6. [CrossRef]
- Bialer, M.; Twyman, R. E.; White, H. S., Correlation analysis between anticonvulsant ED50 values of antiepileptic drugs in mice and rats and their therapeutic doses and plasma levels. Epilepsy Behav 2004, 5, (6), 866-72. [CrossRef]
- Mensah, J. A.; Johnson, K.; Reilly, C. A.; Wilcox, K. S.; Rower, J. E.; Metcalf, C. S., Evaluating the efficacy of prototype antiseizure drugs using a preclinical pharmacokinetic approach. Epilepsia 2022, 63, (11), 2937-2948. [CrossRef]
- Caccia, S.; Guiso, G.; Samanin, R.; Garattini, S., Species differences in clobazam metabolism and antileptazol effect. J Pharm Pharmacol 1980, 32, (2), 101-3. [CrossRef]
- Kulkarni, A. D.; Patel, H. M.; Surana, S. J.; Belgamwar, V. S.; Pardeshi, C. V., Brain-blood ratio: implications in brain drug delivery. Expert Opin Drug Deliv 2016, 13, (1), 85-92. [CrossRef]
- Di, L.; Kerns, E. H.; Carter, G. T., Strategies to assess blood-brain barrier penetration. Expert Opin Drug Discov 2008, 3, (6), 677-87. [CrossRef]
- Di, L.; Rong, H.; Feng, B., Demystifying brain penetration in central nervous system drug discovery. Miniperspective. J Med Chem 2013, 56, (1), 2-12. [CrossRef]
- Zanatta, G.; Sula, A.; Miles, A. J.; Ng, L. C. T.; Torella, R.; Pryde, D. C.; DeCaen, P. G.; Wallace, B. A., Valproic acid interactions with the NavMs voltage-gated sodium channel. Proc Natl Acad Sci U S A 2019, 116, (52), 26549-26554. [CrossRef]
- Wilson, S. M.; Khanna, R., Specific binding of lacosamide to collapsin response mediator protein 2 (CRMP2) and direct impairment of its canonical function: implications for the therapeutic potential of lacosamide. Mol Neurobiol 2015, 51, (2), 599-609. [CrossRef]
- Roberti, R.; De Caro, C.; Iannone, L. F.; Zaccara, G.; Lattanzi, S.; Russo, E., Pharmacology of Cenobamate: Mechanism of Action, Pharmacokinetics, Drug-Drug Interactions and Tolerability. CNS Drugs 2021, 35, (6), 609-618. [CrossRef]
- Wickenden, A. D.; Yu, W.; Zou, A.; Jegla, T.; Wagoner, P. K., Retigabine, a novel anti-convulsant, enhances activation of KCNQ2/Q3 potassium channels. Mol Pharmacol 2000, 58, (3), 591-600.
- Patsalos, P. N.; Berry, D. J.; Bourgeois, B. F.; Cloyd, J. C.; Glauser, T. A.; Johannessen, S. I.; Leppik, I. E.; Tomson, T.; Perucca, E., Antiepileptic drugs--best practice guidelines for therapeutic drug monitoring: a position paper by the subcommission on therapeutic drug monitoring, ILAE Commission on Therapeutic Strategies. Epilepsia 2008, 49, (7), 1239-76.
- Johannessen Landmark, C.; Johannessen, S. I.; Patsalos, P. N., Therapeutic drug monitoring of antiepileptic drugs: current status and future prospects. Expert Opin Drug Metab Toxicol 2020, 16, (3), 227-238. [CrossRef]
- Patsalos, P. N.; Perucca, E., Clinically important drug interactions in epilepsy: interactions between antiepileptic drugs and other drugs. Lancet Neurol 2003, 2, (8), 473-81. [CrossRef]
- Large, C. H.; Sokal, D. M.; Nehlig, A.; Gunthorpe, M. J.; Sankar, R.; Crean, C. S.; Vanlandingham, K. E.; White, H. S., The spectrum of anticonvulsant efficacy of retigabine (ezogabine) in animal models: implications for clinical use. Epilepsia 2012, 53, (3), 425-36. [CrossRef]
- Reimers, A.; Berg, J. A.; Burns, M. L.; Brodtkorb, E.; Johannessen, S. I.; Johannessen Landmark, C., Reference ranges for antiepileptic drugs revisited: a practical approach to establish national guidelines. Drug Des Devel Ther 2018, 12, 271-280. [CrossRef]
- Mula, M.; Kanner, A. M.; Jette, N.; Sander, J. W., Psychiatric Comorbidities in People With Epilepsy. Neurol Clin Pract 2021, 11, (2), e112-e120. [CrossRef]
- Mbizvo, G. K.; Bennett, K.; Simpson, C. R.; Duncan, S. E.; Chin, R. F. M., Epilepsy-related and other causes of mortality in people with epilepsy: A systematic review of systematic reviews. Epilepsy Res 2019, 157, 106192. [CrossRef]
- Kwan, P.; Brodie, M. J., Early identification of refractory epilepsy. N Engl J Med 2000, 342, (5), 314-9. [CrossRef]
- Chen, Z.; Brodie, M. J.; Liew, D.; Kwan, P., Treatment Outcomes in Patients With Newly Diagnosed Epilepsy Treated With Established and New Antiepileptic Drugs: A 30-Year Longitudinal Cohort Study. JAMA Neurol 2018, 75, (3), 279-286.
- Eatock, J.; Baker, G. A., Managing patient adherence and quality of life in epilepsy. Neuropsychiatr Dis Treat 2007, 3, (1), 117-31. [CrossRef]
- Verrotti, A.; Tambucci, R.; Di Francesco, L.; Pavone, P.; Iapadre, G.; Altobelli, E.; Matricardi, S.; Farello, G.; Belcastro, V., The role of polytherapy in the management of epilepsy: suggestions for rational antiepileptic drug selection. Expert Rev Neurother 2020, 20, (2), 167-173. [CrossRef]
- Abou-Khalil, B., Selecting Rational Drug Combinations in Epilepsy. CNS Drugs 2017, 31, (10), 835-844. [CrossRef]
- Vajda, F. J.; Eadie, M. J., The clinical pharmacology of traditional antiepileptic drugs. Epileptic Disord 2014, 16, (4), 395-408. [CrossRef]
- Schmidt, D.; Schachter, S. C., Drug treatment of epilepsy in adults. BMJ 2014, 348, g254. [CrossRef]
- Loscher, W.; Fassbender, C. P.; Nolting, B., The role of technical, biological and pharmacological factors in the laboratory evaluation of anticonvulsant drugs. II. Maximal electroshock seizure models. Epilepsy Res 1991, 8, (2), 79-94.
- Loscher, W.; Ferland, R. J.; Ferraro, T. N., The relevance of inter- and intrastrain differences in mice and rats and their implications for models of seizures and epilepsy. Epilepsy Behav 2017, 73, 214-235. [CrossRef]
- Toutain, P. L.; Lees, P., Integration and modelling of pharmacokinetic and pharmacodynamic data to optimize dosage regimens in veterinary medicine. J Vet Pharmacol Ther 2004, 27, (6), 467-77. [CrossRef]
- Lucas, A. J.; Sproston, J. L.; Barton, P.; Riley, R. J., Estimating human ADME properties, pharmacokinetic parameters and likely clinical dose in drug discovery. Expert Opin Drug Discov 2019, 14, (12), 1313-1327. [CrossRef]
- Loscher, W.; Gericke, B., Novel Intrinsic Mechanisms of Active Drug Extrusion at the Blood-Brain Barrier: Potential Targets for Enhancing Drug Delivery to the Brain? Pharmaceutics 2020, 12, (10). [CrossRef]
- Summerfield, S. G.; Yates, J. W. T.; Fairman, D. A., Free Drug Theory - No Longer Just a Hypothesis? Pharm Res 2022, 39, (2), 213-222.
- Colclough, N.; Ruston, L.; Wood, J. M.; A., M. P., Species differences in drug plasma protein binding. Med. Chem. Commun. 2014, 5, (7), 963-967. [CrossRef]
- Piredda, S. G.; Woodhead, J. H.; Swinyard, E. A., Effect of stimulus intensity on the profile of anticonvulsant activity of phenytoin, ethosuximide and valproate. J Pharmacol Exp Ther 1985, 232, (3), 741-5. [CrossRef]
- White, H. S.; Johnson, M.; Wolf, H. H.; Kupferberg, H. J., The early identification of anticonvulsant activity: role of the maximal electroshock and subcutaneous pentylenetetrazol seizure models. Ital J Neurol Sci 1995, 16, (1-2), 73-7. [CrossRef]
Figure 1.
Efficacy of various antiseizure medications (ASM) in mice and rats subjected to a maximal electroshock stimulation (MES) model. The results show a clear dose-response relationship for carbamazepine (A, B), phenytoin (C, D), valproic acid (E, F), lacosamide (G, H), cenobamate (I, J), and retigabine (K, L). Data is presented as mean **p<0.01; p<0.001; p<0.0001 in comparison to vehicle-treated group (Kruskal–Wallis nonparametric ANOVA followed by Dunn’s multiple comparisons test).
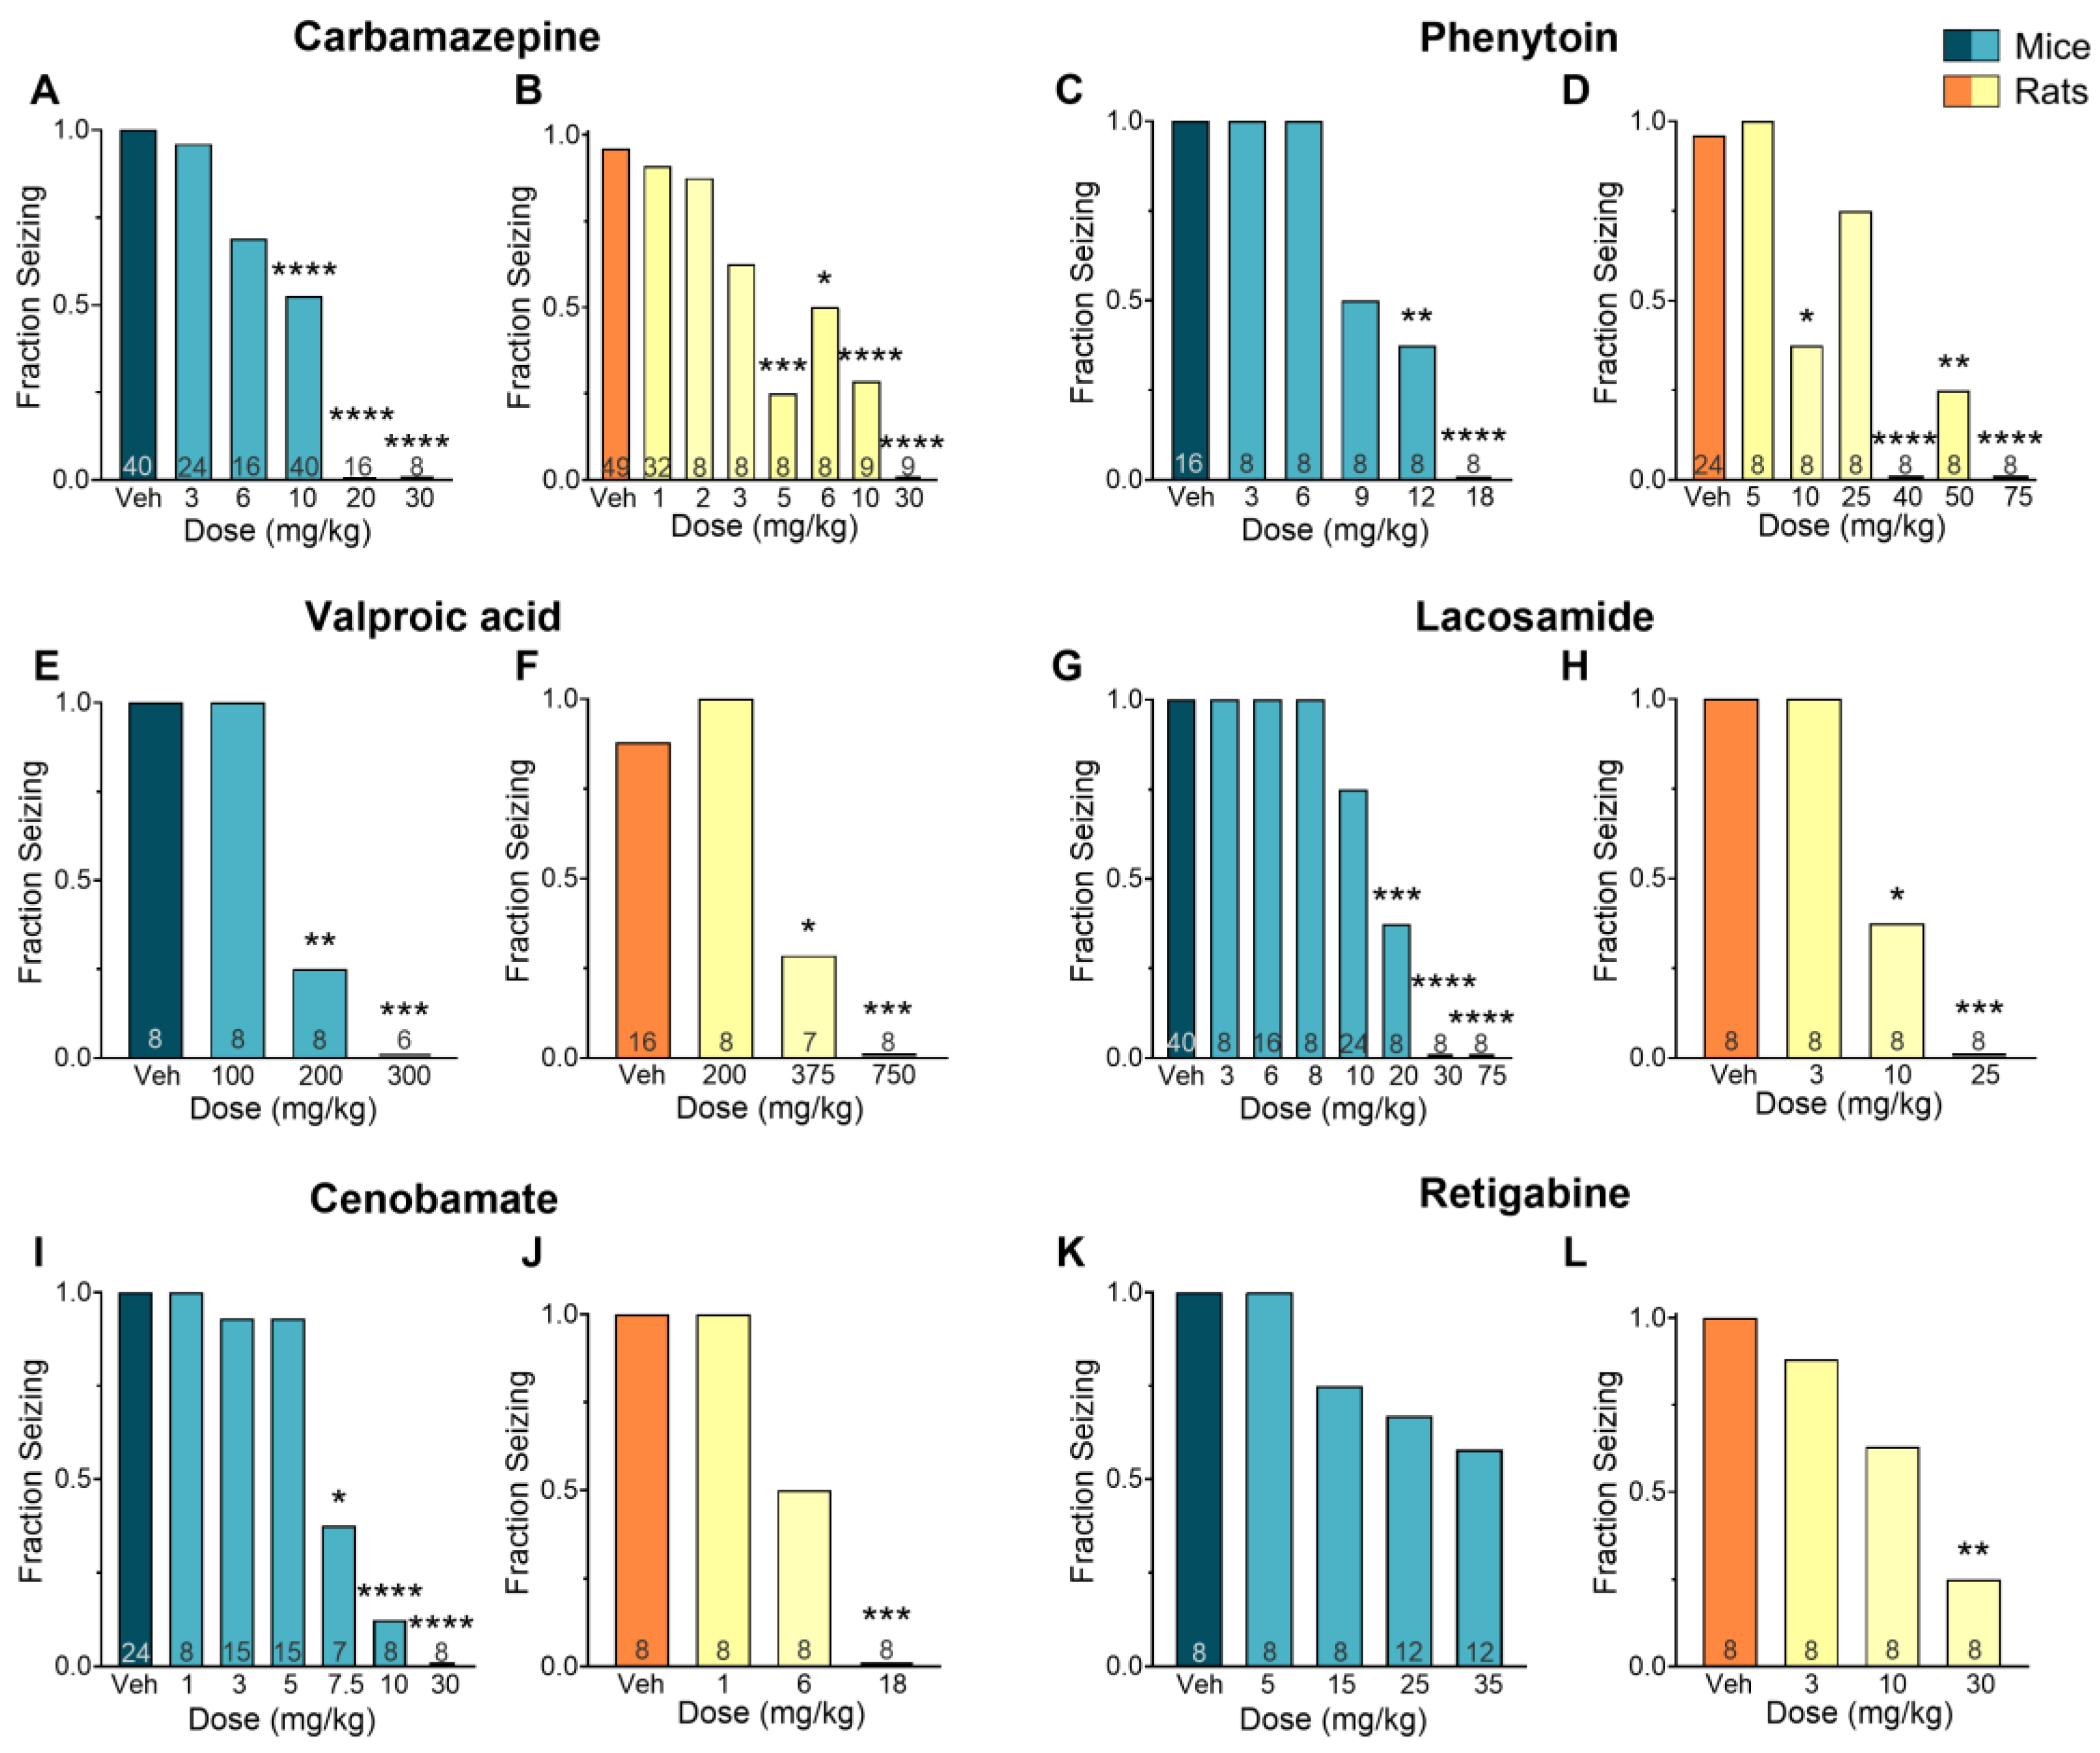
Figure 2.
Pharmacokinetics/pharmacodynamics (PK/PD) profile of carbamazepine (CBZ) and phenytoin (PHT) in rodents exposed to a maximal electroshock (MES) seizure model. Relationship between dose and concentration in the plasma and brain of treated animals (A, D). Concentration-response of CBZ and PHT in the plasma (B, E) and brain (C, F) of animals that received a single oral dose before being tested in the seizure assay. Each point represents the average value from a given experimental group. Some of the doses have multiple data points as they were tested more than once.
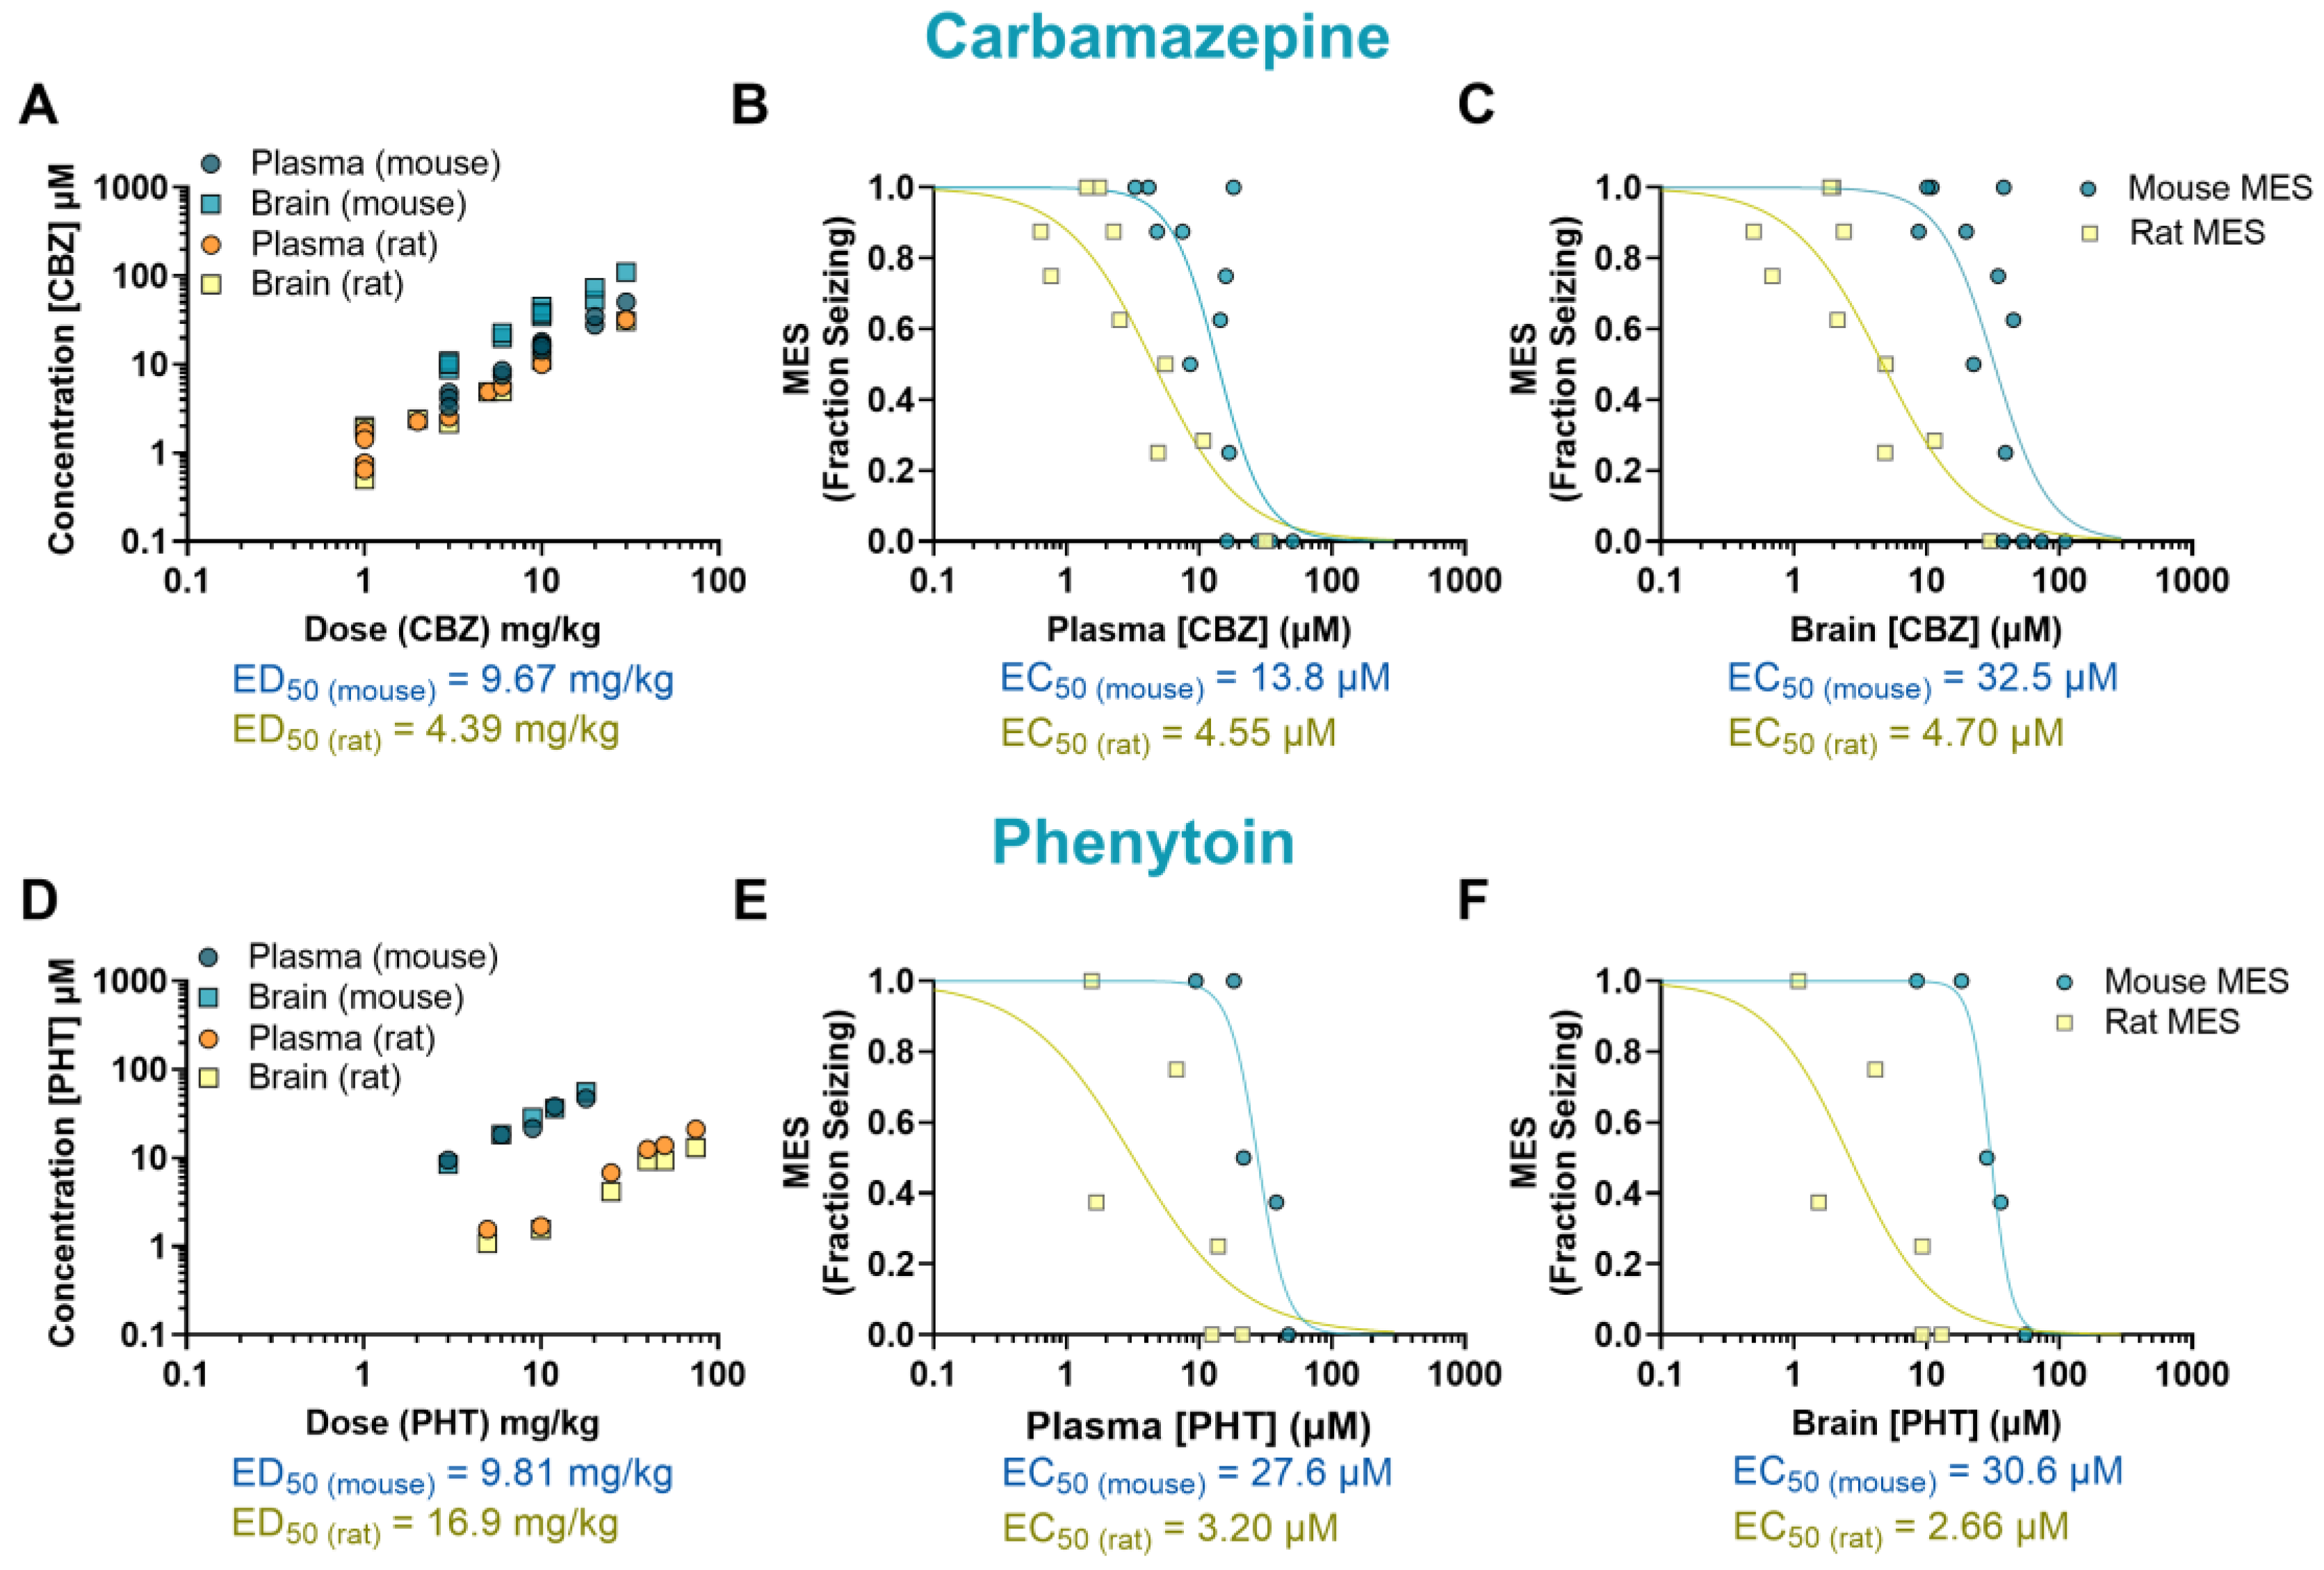
Figure 3.
Pharmacokinetics/pharmacodynamics (PK/PD) profile of valproic acid (VPA) and lacosamide (LSM) in rodents exposed to a maximal electroshock (MES) seizure model. Relationship between the dosage administered and the resulting concentration in the plasma and brain of treated animals (A, D). Concentration-response relationship of VPA and LSM in the plasma (B, E) and brain (C, F) of animals that received a single oral dose before being tested in the seizure assay. Each point represents the average value from a given experimental group. Some of the doses have multiple data points as they were tested more than once.
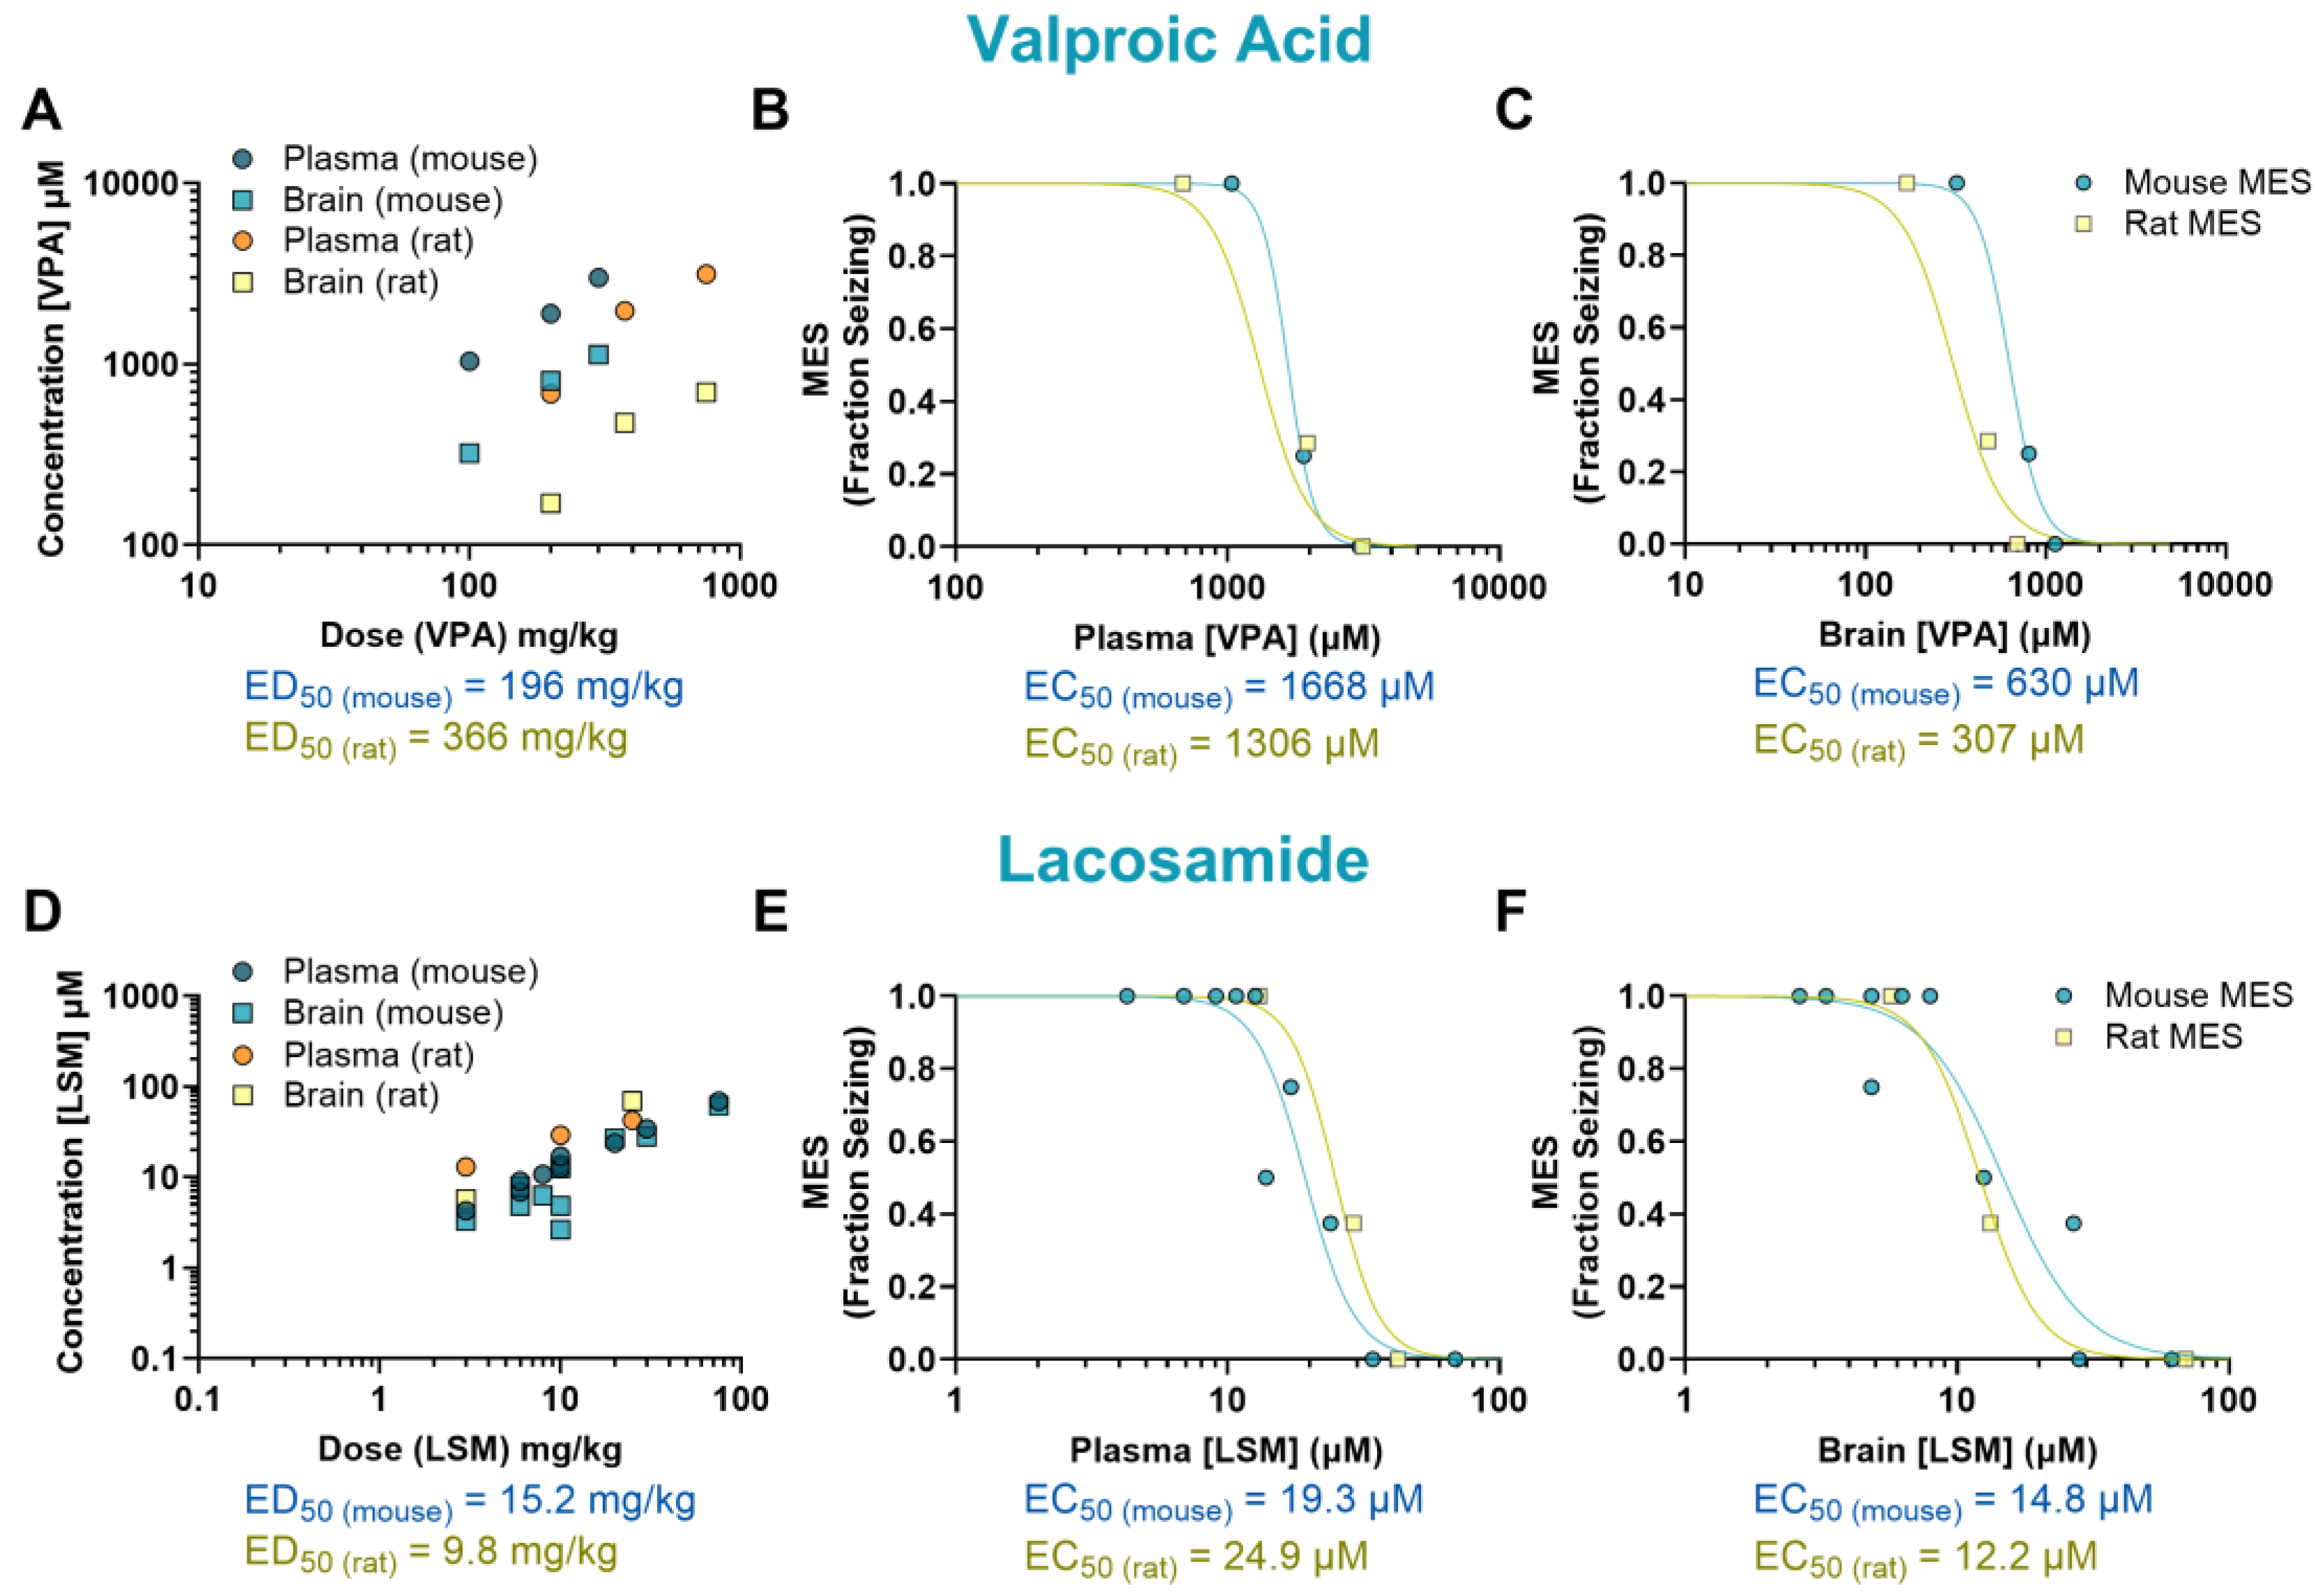
Figure 4.
Pharmacokinetics/pharmacodynamics (PK/PD) profile of cenobamate (CNB) and retigabine (RTG) in rodents exposed to a maximal electroshock (MES) seizure model. Relationship between dose and concentration in the plasma and brain of treated animals (A, D). Concentration-response curve of CNB and RTG in the plasma (B, E) and brain (C, F) of animals that received a single oral dose before being tested in the seizure assay. Some of the doses have multiple data points as they were tested more than once.
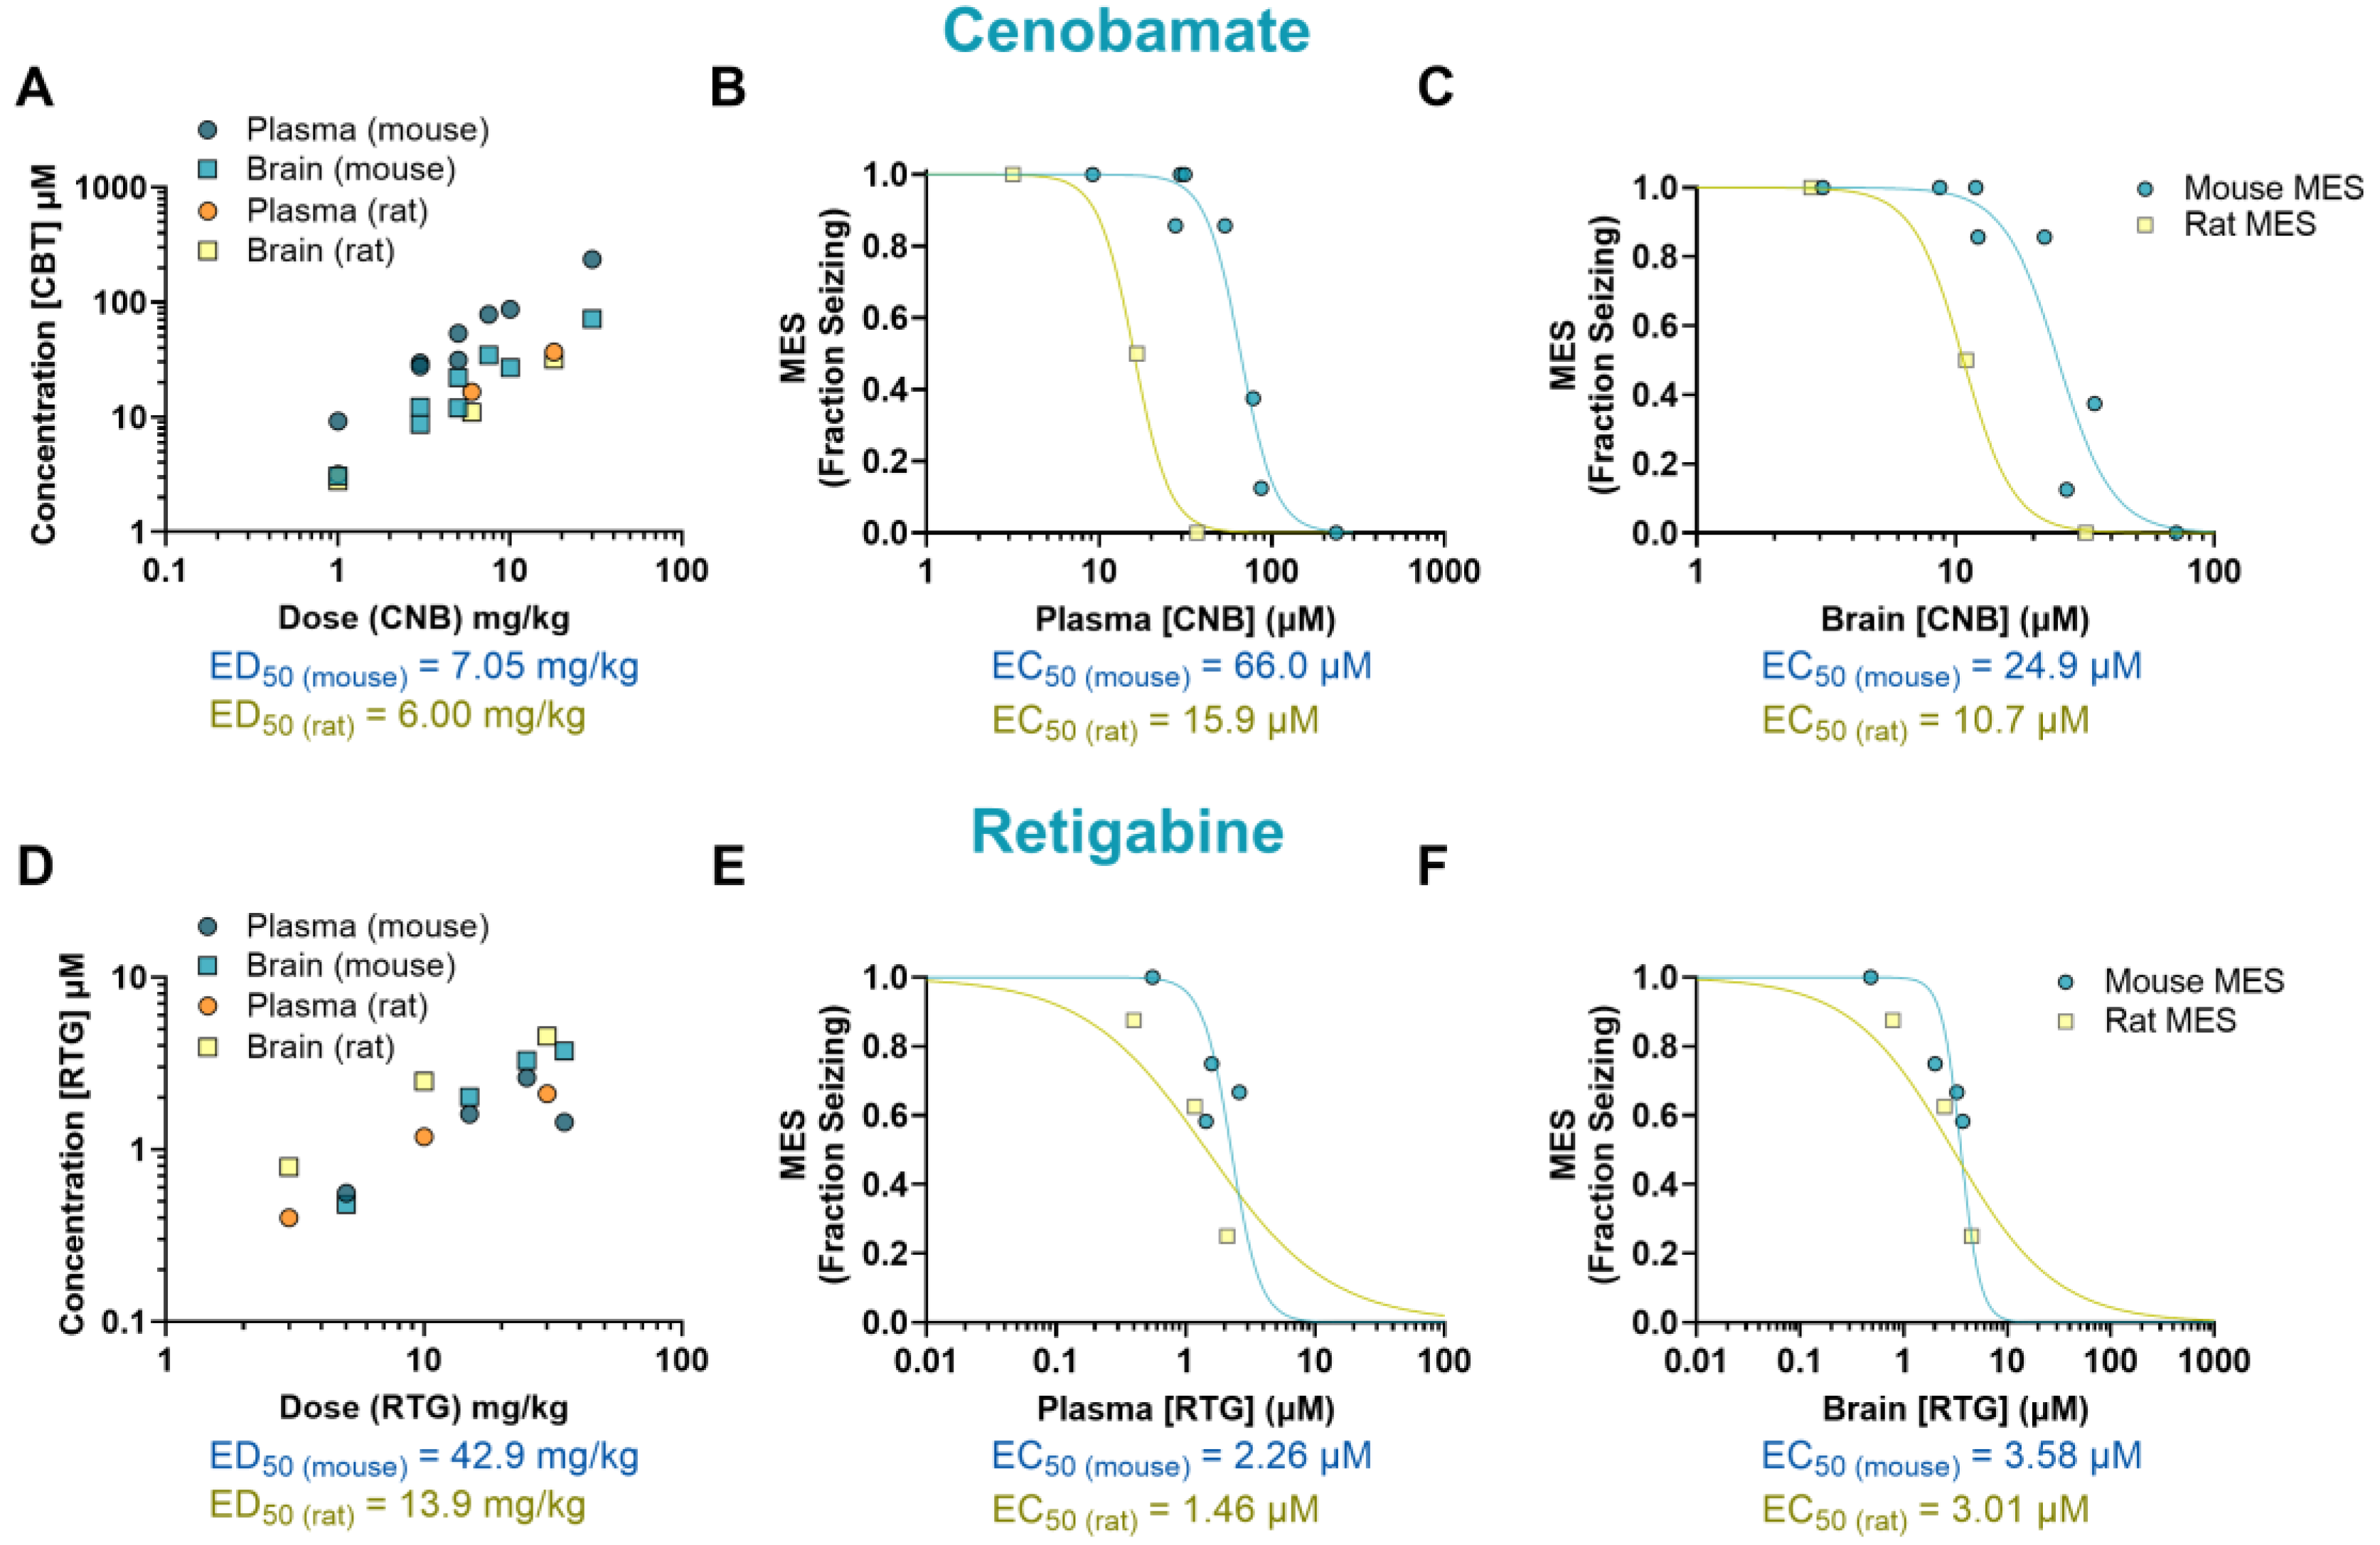
Figure 5.
EC50 values in the plasma and brain of rodents administered with a single dose of conventional antiseizure medications (ASMs). In general, the tested compounds exhibited greater potency in the rat MES compared to the mouse MES.
Figure 5.
EC50 values in the plasma and brain of rodents administered with a single dose of conventional antiseizure medications (ASMs). In general, the tested compounds exhibited greater potency in the rat MES compared to the mouse MES.
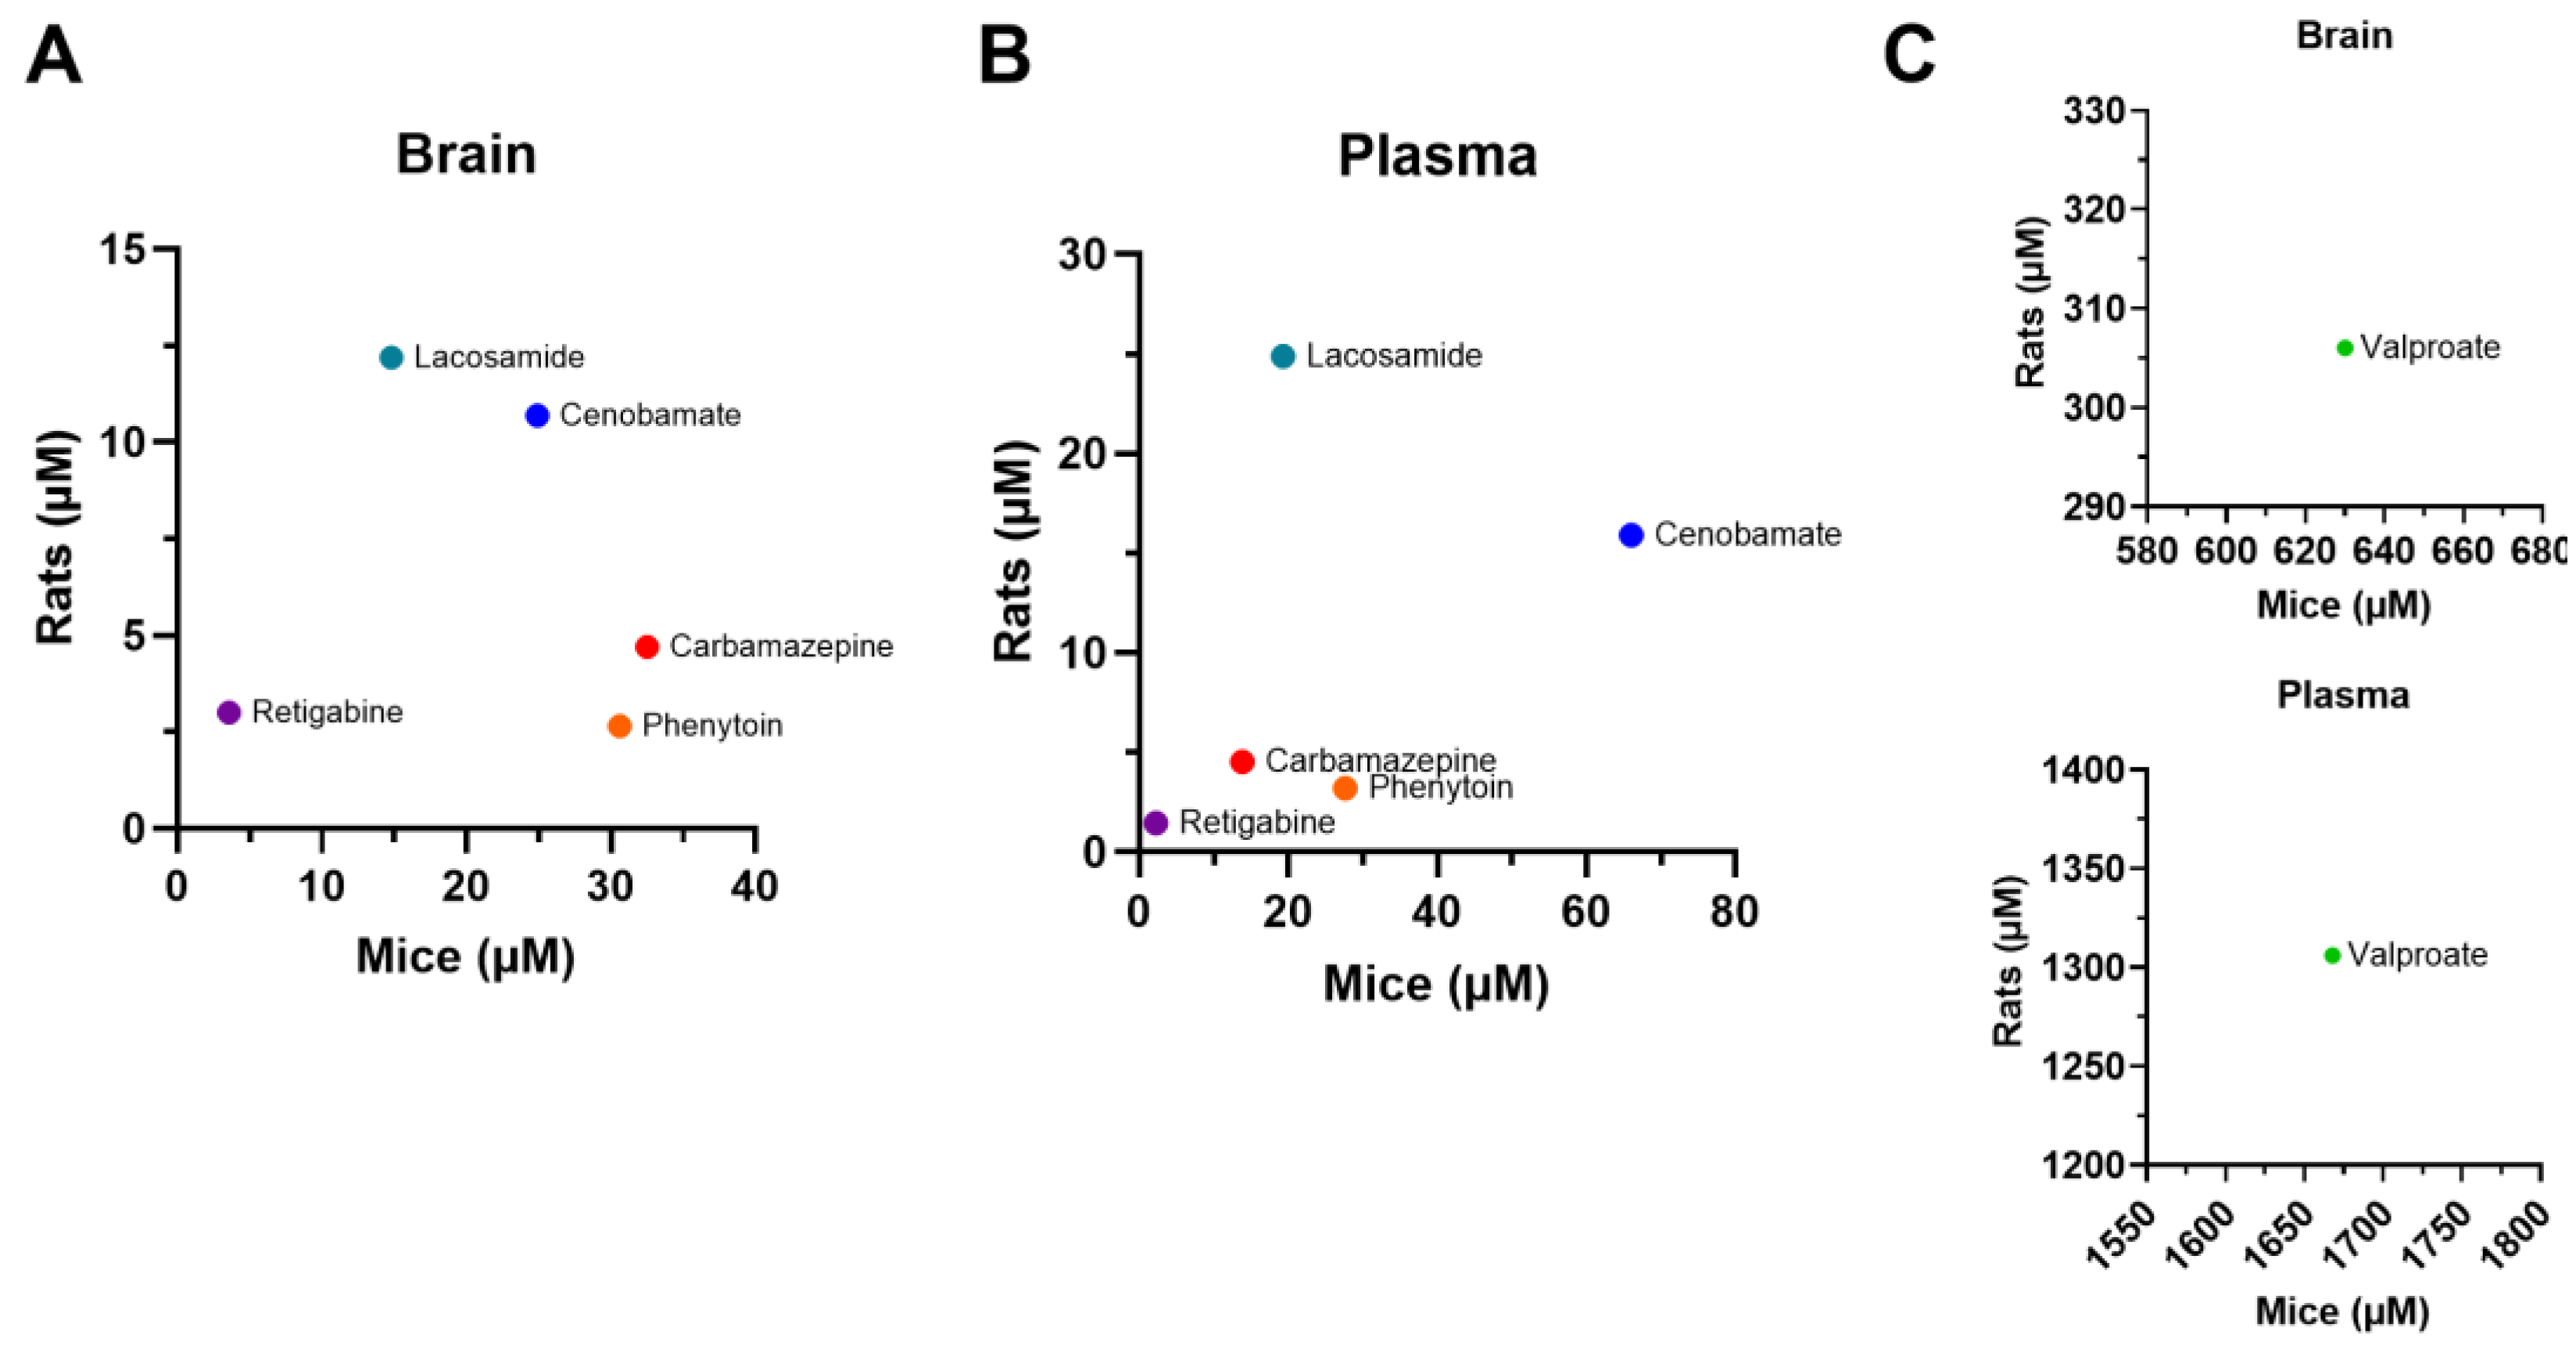
Figure 6.
Efficacious plasma concentrations in the maximal electroshock seizure (MES) model compared with therapeutic plasma concentration ranges of antiseizure medications (ASMs) in the clinic. Plasma EC50 of CBZ (carbamazepine), PHT (phenytoin), VPA (valproate), LSM (lacosamide), CNB (cenobamate), and RTG (retigabine) as determined in the MES model in mice and rats. Green shaded areas represent therapeutic plasma concentration ranges observed in patients, as reported in clinical studies. Data are shown on a logarithmic scale.
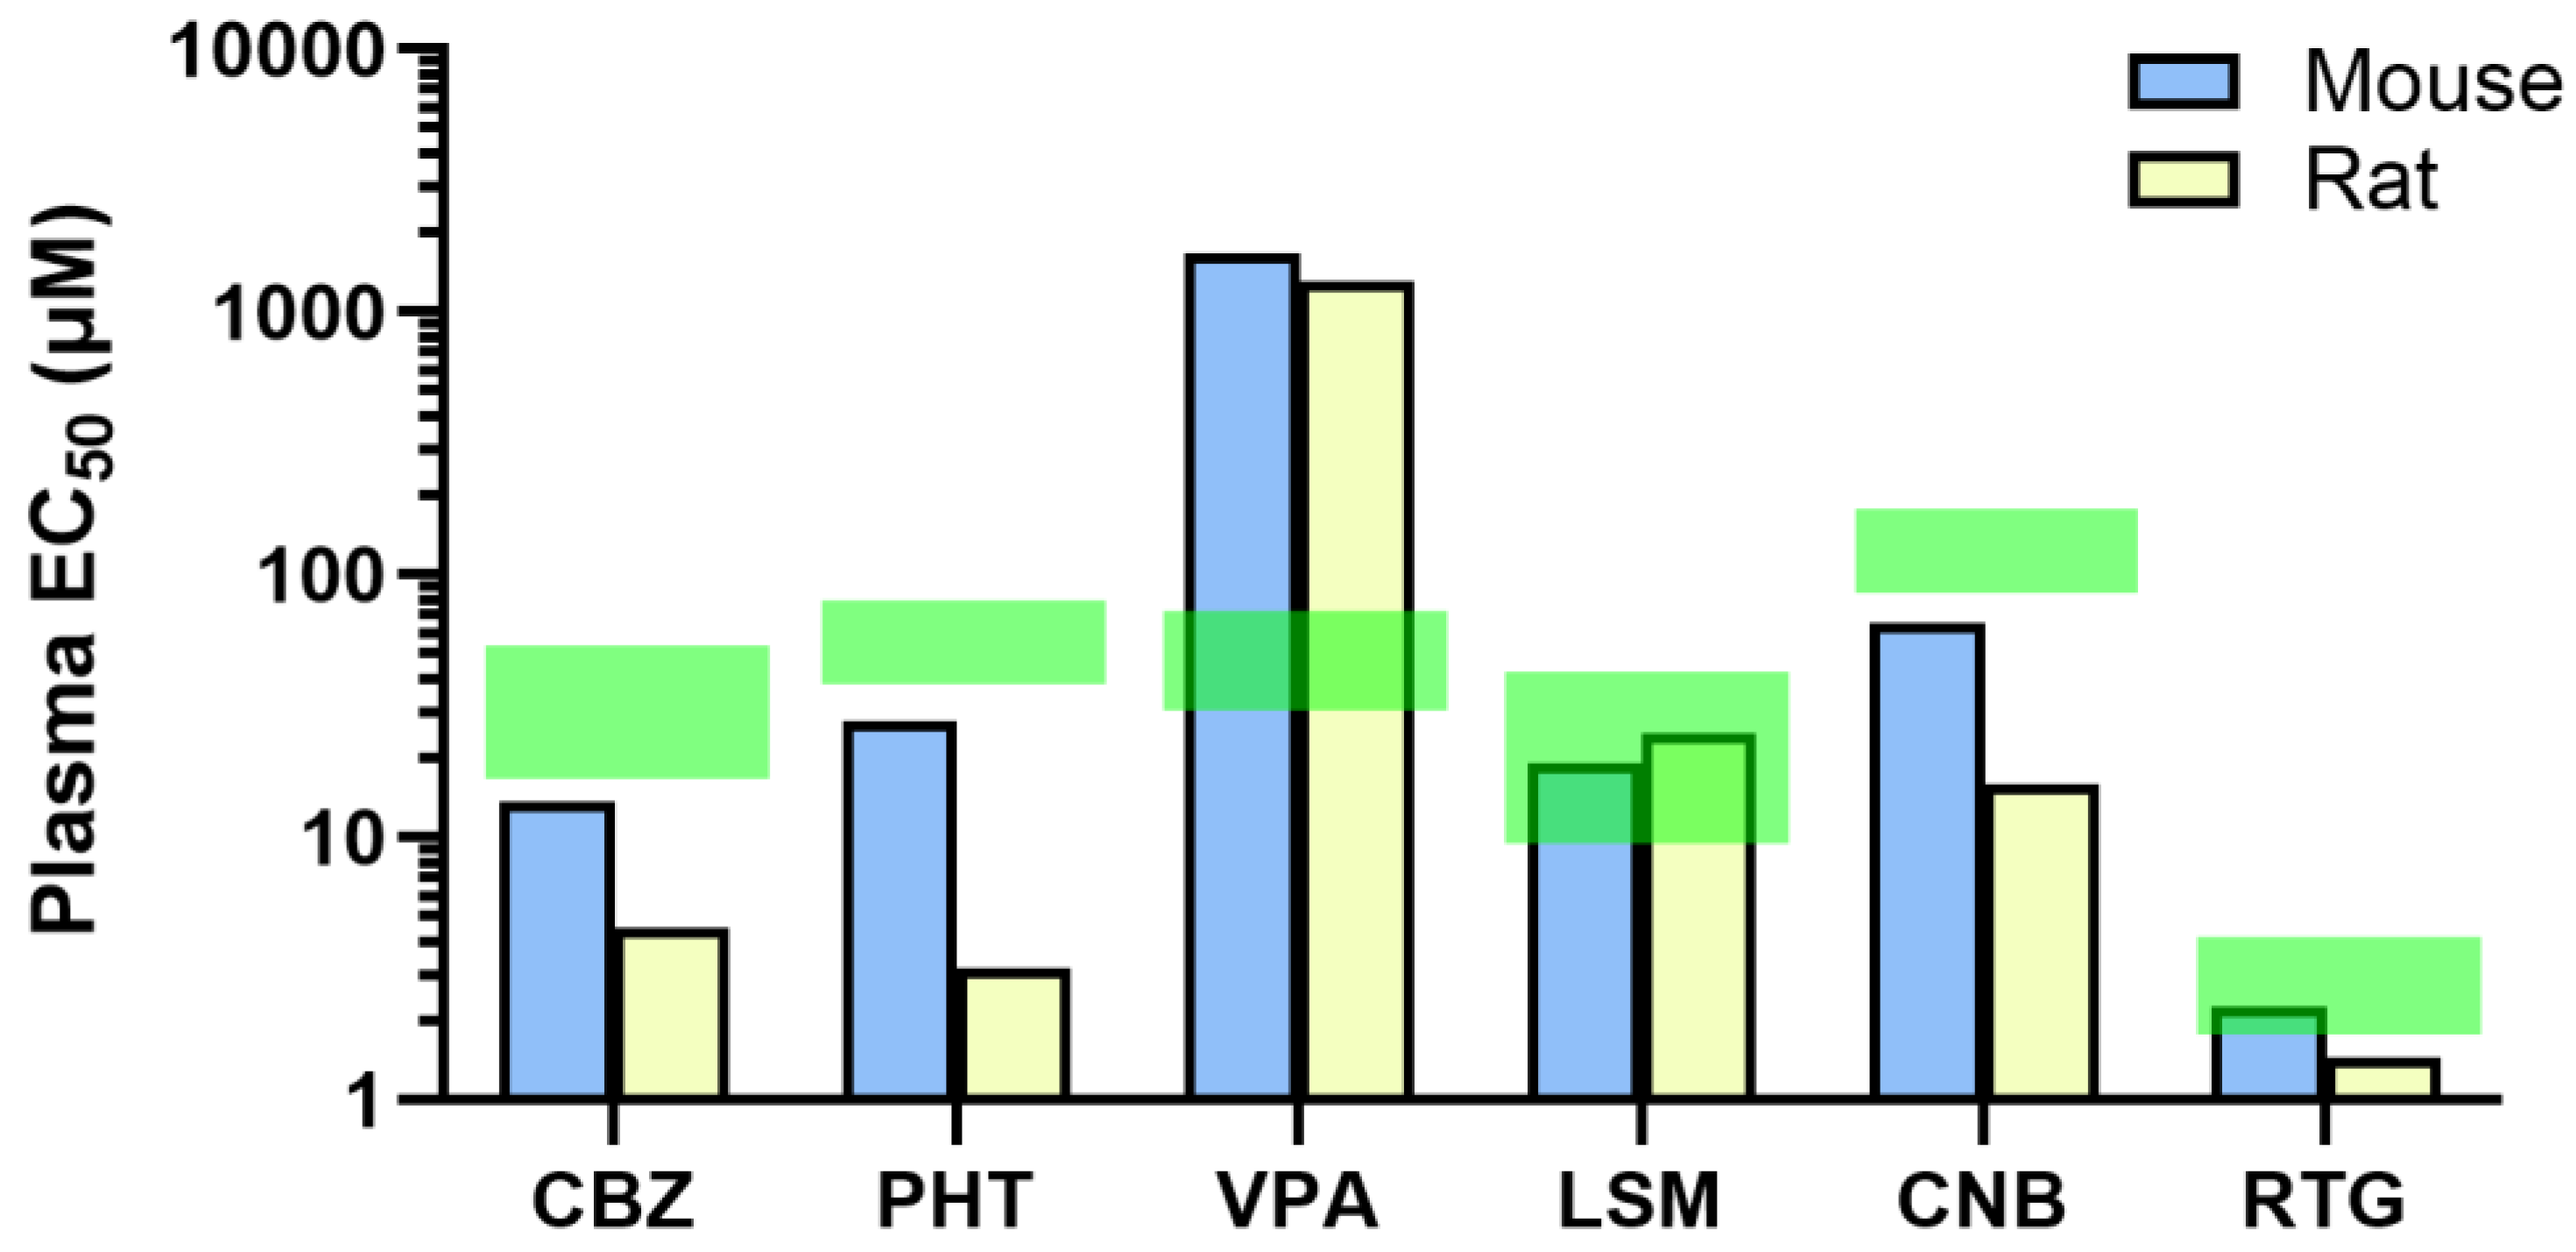

Table 1.
Potency of conventional ASMs in the rodent MES.
| Drug |
Mechanism of action |
Species |
ED50 (mg/kg) |
EC50 (µM) Plasma |
EC50 (µM) Brain |
B/P ratio | Therapeutic plasma concentration range (µM) |
| CBZ | Sodium channel blockade |
Mouse | 9.67 | 13.8 | 32.5 | 2.36 | 17-51 |
| Rat | 4.39 | 4.55 | 4.70 | 1.03 | |||
| Mouse/rat fold | 2.20 | 3.03 | 6.91 | 2.28 | |||
| PHT | Sodium channel blockade |
Mouse Rat Mouse/rat fold |
9.81 16.9 0.58 |
27.6 3.20 8.63 |
30.6 2.66 11.5 |
1.11 0.83 1.33 |
40-79 |
| VPA | GABA potentiation |
Mouse | 196 | 1668 | 630 | 0.38 | |
| Rat | 366 | 1306 | 307 | 0.24 | 346-693 | ||
| Mouse/rat fold | 0.54 | 1.28 | 2.05 | 1.61 | |||
| LSM | Sodium channel blockade/CRMP2 binder |
Mouse | 15.2 | 19.3 | 14.8 | 0.77 | |
| Rat Mouse/rat fold |
9.80 1.55 |
24.9 0.78 |
12.2 1.21 |
0.49 1.57 |
10-40 | ||
| CNB | Sodium channel blockade/GABA potentiation suggested | Mouse Rat Mouse/rat fold |
7.05 6.00 1.18 |
66.0 15.9 4.15 |
24.9 10.7 2.33 |
0.38 0.67 0.56 |
89.3-170 |
| RTG | Kv7 potassium Channel potentiator |
Mouse Rat Mouse/rat fold |
42.9 13.9 3.09 |
2.26 1.46 1.55 |
3.58 3.01 1.19 |
1.58 2.06 0.77 |
1.98-3.99 |
Footnote: ASMs: antiseizure medications; B/P: brain-to-plasma; CNB: cenobamate; CBZ: carbamazepine; EC50: half maximal effective concentration; ED50: median effective dose; LSM: lacosamide; MES: maximal electroshock seizure; PHT: phenytoin; RTG: retigabine; VPA: valproic acid.
Table 2.
Dosing times and routes of administration used to investigate the PK/PD profile of ASMs.
| Drug | Mouse MES | Rat MES | |||
| Route |
Pre-treatment time (h) |
Route |
Pre-treatment time (h) |
||
| CBZ | PO | 0.5 | PO PO PO PO PO PO |
2 2 1 2 2 0.5 |
|
| PHT VPA LSM CNB RTG |
IP IP PO PO PO |
1 0.25 2 2 0.5 |
|||
Footnote: ASMs: antiseizure medications; CNB: cenobamate; CBZ: carbamazepine; IP: intraperitoneal; LSM: lacosamide; MES: maximal electroshock seizure; PHT: phenytoin; PK/PD: pharmacokinetic/pharmacodynamics; PO: per os; RTG: retigabine; SD: Sprague-Dawley; VPA: valproic acid.
Disclaimer/Publisher’s Note: The statements, opinions and data contained in all publications are solely those of the individual author(s) and contributor(s) and not of MDPI and/or the editor(s). MDPI and/or the editor(s) disclaim responsibility for any injury to people or property resulting from any ideas, methods, instructions or products referred to in the content. |
© 2025 by the authors. Licensee MDPI, Basel, Switzerland. This article is an open access article distributed under the terms and conditions of the Creative Commons Attribution (CC BY) license (http://creativecommons.org/licenses/by/4.0/).
Copyright: This open access article is published under a Creative Commons CC BY 4.0 license, which permit the free download, distribution, and reuse, provided that the author and preprint are cited in any reuse.


