
Submitted:
14 May 2025
Posted:
15 May 2025
You are already at the latest version
Abstract
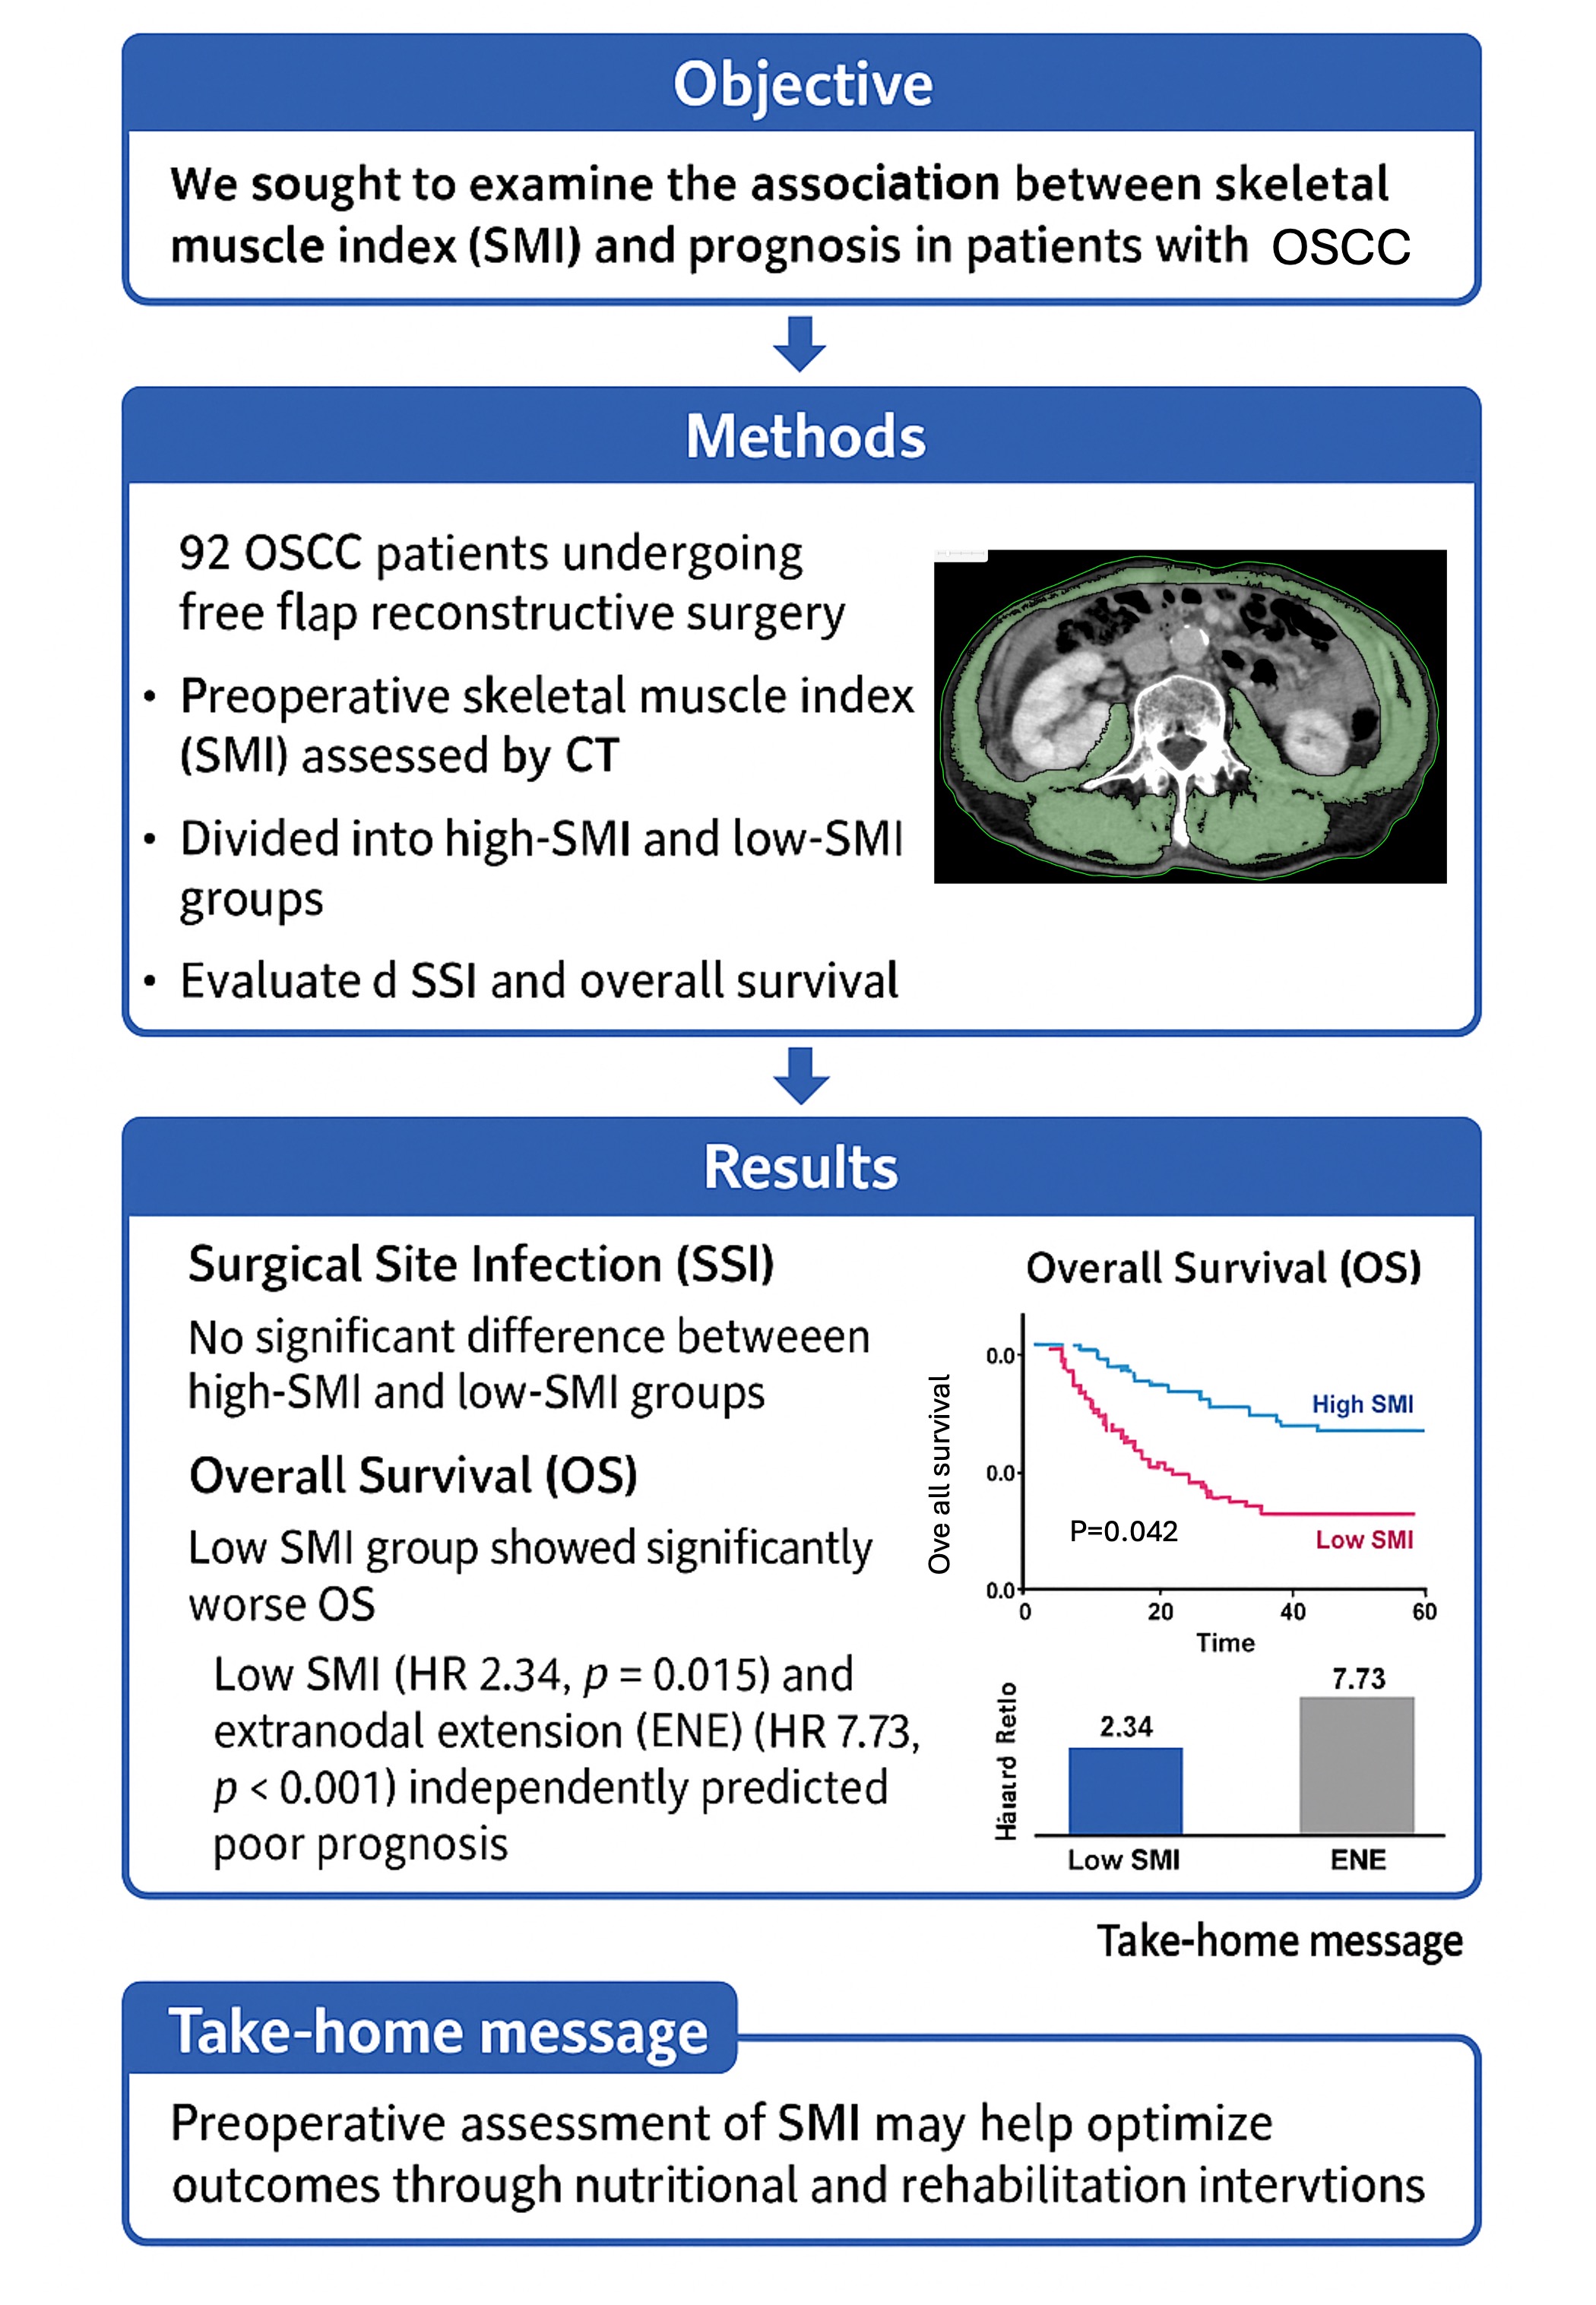
Factors influencing oral squamous cell carcinoma (OSCC) prognosis include local and systemic factors, such as nutritional status. Skeletal muscle mass (SMM) loss is a poor prognostic factor not only in elderly patients, but also in cancer patients. We investigated SMM index (SMI), surgical site infection (SSI), and prognosis of patients who underwent resection and free flap reconstructive surgery (FFRS). Ninety-two patients (59 males and 33 females) underwent FFRS between 2013 and 2021. SMM at L3 was measured using preoperative computed tomography. The optimal cutoff for SMM was 49.29 cm2/m2 in males (AUC 0.639) and 41.08 cm2/m2 in females for overall survival (OS) (AUC 0.535). Patients were classified into low and high SMI groups and OS was statistically evaluated. Sixty-three (68.5%) and 29 (31.5 %) patients had low and high SMI, respectively. SSI occurred in 11 (12.0%) patients, and wound dehiscence and delayed wound healing were observed in 22 (23.9%). SSI showed no significant difference between low- and high-SMI groups. In contrast, OS showed significance by age, pathological N (pN), extra nodal extension (ENE), and SMI (high of 89.7%, low of 61.8%). Univariate analyses demonstrated significant associations between OS and age (≥65 vs. <65), SMI (low vs. high), pN (present vs. none), ENE (present vs. none), and albumin (<4.0 vs. ≥4.0). Cox multivariate analysis included SMI (low vs. high; HR: 5.898, 95% CI: 1.691-20.565; P=0.005) and ENE (present vs. none; HR: 9.843, 95% CI: 3.781-25.629; P<0.001). SMI and ENE were independent predictive factors of OS in patients undergoing FFRS for OSCC.
Keywords:
oral squamous cell carcinoma (OSSC)
; free flap reconstructive surgery (FFRS)
; skeletal muscle mass index (SMI)
; overall survival (OS)
; surgical site infection (SSI)
; extra nodal extension (ENE)
1. Introduction
Factors influencing the prognosis of oral squamous cell carcinoma (OSCC) include not only local factors as clinical cancer stage but also systemic factors such as nutritional status. The skeletal muscle mass (SMM) loss has been reported as a poor prognostic factor not only in elderly patients but also in cancer patients. There have been reports of an association between SMM index (SMI) and OSCC prognosis [1,2,3]. Moreover, free flap complications including surgical site infection (SSI) were associated with SMI [4,5,6]. Although there have been some reports on these factors in OSCC, an evidence-based report has not yet been presented. Therefore, we investigated the association between SMI and SSI, prognosis in patients who underwent resection and free flap reconstructive surgery (FFRS) for OSCC and reviewed with previous reports. Then the purpose of this study was to clarify the association between SMI and prognosis of OSCC.
2. Materials and Methods
2.1. Study Design and Sample
This retrospective cohort study included patients undergoing resection and FFRS between 2013 and 2021 at the Department of Oral and Maxillofacial Surgery, University of Tsukuba Hospital (Ibaraki, Japan). The inclusion criteria were the patients undergoing their first surgery with FFRS for OSCC, without preoperative radiotherapy or chemotherapy and complete imaging data including abdominal enhancement CT. Exclusion criteria include recurrent lesions, non-SCC histological diagnosis, follow up less than 36 months and incomplete medical records.
Muscle mass was measured by secondary analysis of electronically stored CT images that had been used for diagnostic purposes. The third lumbar vertebra (L3) was selected as the standard landmark, and the extension from L3 to the iliac crest was selected to measure the muscle cross-sectional area. Skeletal muscle was identified and quantified by use of Hounsfield unit (HU) thresholds (-29 to +150). The L3 region contains the psoas, paraspinal muscles (erector spinae and quadratus lumborum), and abdominal wall muscles (transversus abdominis, external and internal obliques, and rectus abdominis). Images were analyzed using OsiriX Lite. The cross-sectional area (cm2) of the sum of all the muscles was computed for each image (Figure 1). This value is linearly related to whole-body muscle mass and was therefore normalized for stature (L3 skeletal muscle index, cm2/m2).
Main initial treatments were surgery for the patients with resectable and operative general condition, including six preoperative chemoradiotherapy. According to postoperative pathological results, high risk group (extra nodal extension (ENE) +, Lymph node (LN) counts ≥2, close or positive margin) were treated with adjuvant radiotherapy (60~66Gy) and/or chemotherapy (CDDP 100mg/m2, 2 or 3cources).
The pathological diagnosis of the primary tumor was based on histological grading. Based on the pathological results, postoperative therapy was performed using chemoradiotherapy for positive margins and ENE, and radiotherapy for high-risk close margins and pathological node (pN) 2b, according to the patient’s general condition and acceptance [7,8].
The following inflammatory and nutritional markers were calculated in the preoperative blood examination: neutrophil-to-lymphocyte ratio (NLR); lymphocyte/monocyte ratio (LMR); platelet-to-lymphocyte ratio (PLR); prognostic nutritional index (PNI); monocyte/albumin ratio (MAR); and C-reactive protein/albumin ratio (CAR).
This study was conducted in accordance with the Declaration of Helsinki and was approved by the Institutional Review Board of the University of Tsukuba Hospital. The requirement for informed consent was waived due to the retrospective nature of the study (no. R05-158).
2.2. Study Variables
The SMI was identified as the primary predictive variable in this study. The primary outcome variables included overall survival (OS), disease-free survival (DFS), and surgical site infection (SSI). The analysis also incorporated additional variables, such as patient characteristics including age, body mass index (BMI), clinical tumor classification, surgical margin, positive LN, pN classification, and ENE.
2.3. Data Analyses
Patients were stratified into two groups based on SMI cutoff values, and the χ2 test or Fisher's exact probability test was used to compare the subgroups. Continuous variables in the subgroups were compared using the Mann–Whitney U test. Survival curves were calculated using the Kaplan–Meier method, and differences in OS and DFS were analyzed using the log-rank test. OS was calculated from the date of first diagnosis to death from any cause. DFS was calculated from the initial diagnosis until the development of any signs of cancer. The cutoff date for patients who had not yet succumbed was May 2024.Univariate and multivariate analyses of OS were performed using Cox proportional hazards models. All statistical analyses were performed using SPSS software version 29 for Macintosh (SPSS, Chicago, IL, USA). A P-value of less than 0.05 was considered statistically significant.
3. Results
3.1. Patient Characteristics
Among the 92 patients (59 males, 33 females) with OSCC who underwent FFRS, the average age was 66.0 (34–86) years. The median of Eastern Cooperative Oncology Group (ECOG) performance status (PS) was 0 (range 0-1) (Table 1).
The primary site and clinical TN classification was presented in Table 1. The clinical stage was II in 9 (9.9%) patients, III in 11 (12.0%), IVa in 58 (63.0%), and IVb in 14 (15.2%) (Table 1). The free flap types were the anterolateral thigh flap (ALT) in 37 (40.2%) patients, the fibula flap (FF) in 31 (33.7%), and the rectus abdominis myocutaneous flap (RAMF) in 24 (26.1%). Surgical site infection occurred in 11 (13.0%) patients, and wound dehiscence and delayed wound healing were observed in 22 (23.9%) patients. Reoperation due to thrombosis occurred in five (5.4%) patients and three (3.3%) were rescued. Partial necrosis occurred in seven patients (7.6%) and complete necrosis in two (2.2%). Systemically, delirium occurred in 27 (29.3%) and postoperative pneumonia in 21 (22.8%) patients. The pathological results of the primary site and neck are presented in Table 1 and Table 2, respectively. The median follow-up duration was 44.6 (range 5.1–132.4) months. The prognosis included primary recurrence in 14 patients (15.2%), neck recurrence in 11 patients (12.0%), and distant metastasis in 20 patients (21.7%) (Table 1).
3.2. Clinical Characteristics of the Patients Included in the Study Dichotomized with SMI Cutoff Value
The cutoff values were determined using median value of the SMI was 45.94 cm2/m2 in males and 38.03 cm2/m2 in females. According to these cutoff values, the low and high SMI groups were dichotomized. and Forty-seven (51.1%) patients had a low SMI and 45 (48.9 %) had a high SMI. BMI ≥18.5 was observed in 39 (83.0%) patients with low SMI and in 42 (93.3%) patients with high SMI. A significant difference in the age between <65 and ≥65 was observed (P=0.037; Table 1). No significant difference was observed in SMI between the presence and absence of SSI and postoperative pneumonia. This study revealed no statistically significant differences between SSI and the following variables: age, PS, BMI, presence of DM, albumin level, preoperative irradiation, or smoking. A statistically significant discrepancy was identified between the groups that only consumed alcohol and those that did not, as indicated by the SSI (P=0.049).
The continuous variable analysis presented in the SMI showed a median bleeding count of 374 mL (126-1,031 mL) with low SMI and 510 mL (70-1,278 mL) with high SMI; a significant difference was observed (P=0.004). The duration of HCU and hospital stay was 7 (4-10) and 38 (22-152) days with the low-SMI group and 7 (5-12) and 36 (19-98) days in high SMI. There were no significant differences in inflammatory and nutritional markers (Table 1).
3.3. Association Between Clinical Factors and OS and DFS
The associations between the study variables, and OS and DFS are shown in Table 2. Significant differences in OS were observed when patients were dichotomized by age, with those aged ≥65 years having an OS of 60.1% compared with those aged <65 years having an OS of 86.1% (P=0.013, Figure 2), and by SMI classification, with a high of 81.1% and low of 60.2% (P=0.042, Figure 3). At the primary site, a significant difference was observed in OS when patients were stratified by the tongue, lower gingiva, and other sites (P<0.001).
Significant differences were observed in OS when patients were stratified according to pathological N status (P<0.001, Figure 4). Moreover, there were significant differences in OS with N1-3b or N0 in pN (P=0.007) and with or without ENE (P<0.001, Figure 5). Similarly, significant differences were observed in OS when patients were categorized by albumin<4.0 vs. albumin≥ 4.0 (P=0.001, Figure 6).
At the primary site, a significant difference was observed in DFS when patients were stratified by the tongue, lower gingiva, and other sites (P<0.001). The DFS was significantly different when patients were stratified according to pN classification (P<0.001). Significant differences were observed in the DFS with pN (N1-3b or N0) and ENE (P<0.001). Similarly, significant differences were observed in DFS when patients were categorized by albumin<4.0 vs. albumin≥ 4.0 (P=0.018).
3.4. Cox Multivariate Regression Analysis
Univariate analyses demonstrated significant associations between OS and age (≥65 vs. <65; P=0.019), SMI (low vs. high; P=0.048), pN (present vs. none; P=0.010), ENE (present vs. none; P<0.001), and albumin (<4.0 vs. ≥4.0; P=0.003). Subsequent to the implementation of Cox multivariate analysis, which incorporated the parameters identified through univariate and logistic multivariate analyses employing a stepwise forward selection approach, three independent predictive factors for OS were determined: ENE (P=0.004), SMI (P=0.013) and albumin (P=0.034). The counts of outcomes for OS were 25, and two ENE and SMI independent factors were selected. The results included SMI (low vs. high; HR: 2.339, 95% CI: 1.008-5.429; P=0.015) and ENE (present vs. absent; HR: 7.727, 95% CI: 3.083-19.368; P<0.001) (Table 3).
Conversely, the Cox multivariate analysis, utilizing parameters selected through univariate and logistic multivariate analysis with the stepwise forward selection method, identified independent variables and one independent predictive factor for DFS: pN (present vs. none; HR: 4.248, 95% CI: 1.813-9.953; P< 0.001) (Table 4).
4. Discussion
The previous studies reported that recipient site SSI occurred in about 25% and lower SMI was a significant risk factor for SSI [4,9]. There was no significant difference in the SSI between the low- and high-SMI groups in patients undergoing FFRS for OSCC in the present study. In contrast, significant differences in OS were observed when patients were dichotomized by age, pathological N, ENE, and SMI. The SMI and ENE were independent predictive factors for OS in Cox multivariate analysis. From these results, to improve OS of the OSCC, low-SMI patients diagnosed with preoperative CT need the poor nutritional status improving program.
Most studies have reported an association between cancer prognosis and sarcopenia [1,2,3]. Skeletal muscle loss in the postoperative acute phase might be a new predictor for long-term prognosis after highly invasive surgery such as esophageal squamous cell carcinoma surgery [10]. Compared to patients without sarcopenia, patients with sarcopenia had significantly poorer OS and DFS [3]. Bonavolonta et al. reported that sarcopenia did not cause a statistically significant reduction in the OS in patients with OSCC; however, sarcopenic obesity showed a meaningful negative prognostic impact [11]. Other authors reported significant differences in OS, but not in DFS, between patients with low and high SMM in prognosis [1]. In this study, the independent predictor of DFS was found to be pN.In contrast to OS, the factors influencing DFS may not be systemic factors such as sarcopenia, but rather locoregional factors.
Our results correspond to this result, with a significant difference in OS and without it in DFS. A systematic review and meta-analysis of the association of sarcopenia with oncologic outcomes of primary treatment among patients with OSCC summarized that the cutoff value of SMI in L3 was 36.02-52.4 cm2/m2 in males and 30.6-47.5 cm2/m2 in females from 10 studies. The percentage of patients with sarcopenia was 23-67% from the cutoff value of stage I to IVB, excluding one article. They concluded that over one-third of OSCC patients may present with sarcopenia and that pretreatment sarcopenia is associated with significantly worse OS and DFS [3]. Our cutoff values of SMI were 45.94 cm2/m2 in males and 38.03 cm2/m2 in females for OS, which is within the range of previous reports. The frequency of sarcopenia from these cutoff values in OSCC indicates that 16-67% of patients with stage I to IVB disease, excluding one article, were reported to be sarcopenic [3,6]. In contrast, our study showed that 51.1% of patients had sarcopenia, and our result was higher than that of previous reviews. Patients who received FFRS and had a higher clinical stage were included, and sarcopenia patients were included because of dysfunction of oral intake.
A low SMM is reported to be a strong predictive factor for complications of FFRS and other postoperative complications in patients undergoing fibular free-flap reconstruction [1]. The previous studies reported that occurrence of recipient site SSI and lower SMI was a significant risk factor for SSI [4,9]. They suggested that increasing SMM by exercise or nutrition before surgery may prevent recipient-site SSI after OSCC resection and subsequent FFRS. A meta-analysis assessing the association between low SMM and surgical complications was mainly performed using the Clavien–Dindo classification after FFRS in patients with HANC. The prevalence of low SMM among the studies ranged from 24.6% to 61.5%. The meta-analysis showed an OR for complications after surgery of 2.42 (95% CI 1.53–3.32). Therefore, this study concluded that SMM is an independent risk factor for SSI and postoperative complications in patients undergoing HANC reconstructive surgery [6]. In contrast, a previous study investigated the predictive value of a low SMM for postoperative complications in patients with T1–2 OSCC who underwent neck dissection. This result indicates that a low SMM was not predictive of postoperative complications [12]. In our study, SSI occurred in only 12.0% of patients, and wound dehiscence and delayed wound healing were observed in 23.9% of the patients. The occurrence rate of SSI was lower than that reported in a previous study, and there was no significant difference in SSI between the low- and high-SMI groups. The diagnostic criteria for SSI at the recipient site within 30 days postoperatively were the same as those described in previous reports. SSI was identified as purulent drainage from the incision, an incision that was deliberately opened or underwent spontaneous dehiscence due to infection, evidence of an abscess or deep infection on examination or imaging, or a diagnosis of an SSI by the surgeon [13]. Moreover, our study revealed no statistically significant differences between SSI and the following variables: age, PS, BMI, presence of DM, albumin level and preoperative irradiation. These discrepancies might include our patients were good general condition for FFRS and superior surgical procedure and prevention of SSI procedure during the perioperative period.
SMM is usually assessed using abdominal CT at the L3 level. However, abdominal CT is not routinely included in preoperative management protocols for patients with OSCC and is often only available in a subset of patients with advanced disease and an increased risk of distant metastasis [1]. The C3 cross-sectional area (CSA) was not precisely evaluated because it included metastatic lymph nodes and metal artifacts of the teeth according to the head position. Lu et al. constructed a formula to predict the L3 skeletal muscle CSA from the C3 CSA 13. Regarding the data constructed from the formula, some authors reported a lack of usefulness of the C3 CSA data. Therefore, C3 SMM has not been reported to be a strong predictor of L3 SMM in sarcopenia patients with HNC [14,15]. In contrast, Bril et al. reported that SMM measurements at the C3 level were highly correlated with those at L3. The assessment of SMM on head and neck CT is feasible and may be an alternative to abdominal CT imaging. This method allows the assessment of sarcopenia using routinely performed scans without additional imaging or patient burden [16,17].
In the present study, we evaluated the association between systemic inflammatory markers such as NLR, LMR, PLR, PNI, MAR, CAR, and SMI. PLR and PNI showed significant differences between high and low SMI in the continuous variable. In the multivariate analysis, sarcopenia was significantly associated with poor OS, and high PLR ≥170.9 was an independent predictor for sarcopenia [18]. Our results showed a median PLR of 149.54 in the SMI and 123.43 in high SMI and agreement with this previous report. Systemic inflammation is significantly associated with sarcopenia. The survival and oncological effects of sarcopenia were enhanced when PLR was high. Thus, the combination of these two parameters is useful for identifying patients with OSCC at risk of poor survival outcomes.
This study was limited by the few available cases and the bias in the patients selected for FFRS with retrospective and single-institute design. In addition, multiple primary sites of oral cancer were included, and selecting cases with a tongue or lower gingiva were desired. Therefore, a prospective multi-center study will be required to validate the preliminary findings of the present report with large sample size. Furthermore, although the Quality of Life (QOL) is a critical factor in oral cancer management, this study did not evaluate whether patients with low SMI could eat before surgery or their postoperative nutritional intake and oral function, because of its retrospective nature. A study of exercise and nutrition interventions with progressive resistance training and oral nutritional supplements during and after radiotherapy in head and neck cancer patients demonstrated that such interventions are feasible and effective in mitigating muscle loss [19]. In the gastrointestinal surgery, perioperative recommendations for malnutrition and sarcopenia have been reported as prognostic factors. If there is a high metabolic risk or severe malnutrition, surgery should be postponed and nutrition therapy should be administered enterally for 10-14 days, if possible, and prehabilitation should be considered. Preoperative use of oral nutrition for at least 7 days may reduce the rate of infectious complications and length of hospital stay. In patients with gastrointestinal cancer, preoperative immunonutrition for 5-7 days may reduce infectious complications [20].
Consequently, interventions designed to preserve muscle mass, such as multimodal preoperative rehabilitation programs that incorporate physical therapy and nutritional intervention prior to surgery, have been shown to be effective in enhancing SMM and outcomes. The development of a specific nutritional management program is imperative, given the temporal constraints that emerge prior to surgery in the future.
5. Conclusions
SMI and ENE were independent predictive factors for OS in patients who underwent resection and FFRS for OSCC. Screening for sarcopenia has the potential to be used as a tool to plan treatment strategies and monitor nutritional support during cancer treatment, including postoperative ENE management, which may improve patient outcomes.
Author Contributions
Conceptualization, K.Y. and A.N.; methodology, S.F.; validation, N.I.-K. and S.T.; formal analysis, F.U. and S.F.; investigation, K.S.; data curation, N.A.; writing—original draft preparation, K.Y.; writing—review and editing, K.Y. and A.N.; visualization, A.N.; supervision, M.S. and H.B. All authors have read and agreed to the published version of the manuscript.
Funding
This research received no external funding.
Institutional Review Board Statement
The study was conducted in accordance with the Declaration of Helsinki, and approved by the Institutional Review Board of the University of Tsukuba Hospital (no. R05-158). The requirement for informed consent was waived due to the retrospective nature of the study.
Informed Consent Statement
Patient consent was waived due to due to the retrospective nature of the study.
Data Availability Statement
Data are unavailable due to privacy or ethical restrictions.
Acknowledgments
We would like to thank Editage (www.editage.jp) for English language editing.
Conflicts of Interest
The authors declare no conflicts of interest. The funders had no role in the design of the study; in the collection, analyses, or interpretation of data; in the writing of the manuscript; or in the decision to publish the results.
References
- Ansari, E.; Chargi, N.; van Gemert, J.T.M.; van Es, R.J.J.; Dieleman, F.J.; Rosenberg, A.J.W.P.; Van Cann, E.M.; de Bree, R. Low skeletal muscle mass is a strong predictive factor for surgical complications and a prognostic factor in oral cancer patients undergoing mandibular reconstruction with a free fibula flap. Oral Oncol 2020, 101, 104530. [Google Scholar] [CrossRef] [PubMed]
- Makiguchi, T.; Yamaguchi, T.; Nakamura, H.; Yamatsu, Y.; Hirai, Y.; Shoda, K.; Kurozumi, S.; Ibaragi, S.; Harimoto, N.; Motegi, S.I.; Shirabe, K.; Yokoo, S. Evaluation of overall and disease-free survival in patients with free flaps for oral cancer resection. Microsurgery 2020, 40, 859–867. [Google Scholar] [CrossRef] [PubMed]
- Graves, J.P.; Daher, G.S.; Bauman, M.M.J.; Moore, E.J.; Tasche, K.K.; Price, D.L.; Van Abel, K.M. Association of sarcopenia with oncologic outcomes of primary treatment among patients with oral cavity cancer: A systematic review and meta-analysis. Oral Oncol 2023, 147, 106608. [Google Scholar] [CrossRef] [PubMed]
- Makiguchi, T.; Yamaguchi, T.; Nakamura, H.; Suzuki, K.; Harimoto, N.; Shirabe, K.; Yokoo, S. Impact of skeletal muscle mass volume on surgical site infection in free flap reconstruction for oral cancer. Microsurgery 2019, 39, 598–604. [Google Scholar] [CrossRef] [PubMed]
- Chargi, N.; Breik, O.; Forouzanfar, T.; Martin, T.; Praveen, P.; Idle, M.; Parmar, S.; de Bree, R. Association of low skeletal muscle mass and systemic inflammation with surgical complications and survival after microvascular flap reconstruction in patients with head and neck cancer. Head Neck 2022, 44, 2077–2094. [Google Scholar] [CrossRef] [PubMed]
- Ansari, E.; Ganry, L.; Van Cann, E.M.; de Bree, R. Impact of low skeletal muscle mass on postoperative complications in head and neck cancer patients undergoing free flap reconstructive surgery – A systematic review and meta-analysis. Oral Oncol 2023, 147, 106598. [Google Scholar] [CrossRef] [PubMed]
- Bernier, J.; Domenge, C.; Ozsahin, M.; Matuszewska, K.; Lefèbvre, J.L.; Greiner, R.H.; Giralt, J.; Maingon, P.; Rolland, F.; Bolla, M.; Cognetti, F.; Bourhis, J.; Kirkpatrick, A.; van Glabbeke, M.; European Organization for Research and Treatment of Cancer Trial 22931. Postoperative irradiation with or without concomitant chemotherapy for locally advanced head and neck cancer. N Engl J Med 2004, 350, 1945–1952. [Google Scholar] [CrossRef] [PubMed]
- Cooper, J.S.; Pajak, T.F.; Forastiere, A.A.; Jacobs, J.; Campbell, B.H.; Saxman, S.B.; Kish, J.A.; Kim, H.E.; Cmelak, A.J.; Rotman, M.; Machtay, M.; Ensley, J.F.; Chao, K.S.; Schultz, C.J.; Lee, N.; Fu, K.K.; Radiation Therapy Oncology Group 9501/Intergroup. Postoperative concurrent radiotherapy and chemotherapy for high-risk squamous-cell carcinoma of the head and neck. N Engl J Med 2004, 350, 1937–1944. [Google Scholar] [CrossRef] [PubMed]
- Nakamura, H.; Makiguchi, T.; Yamaguchi, T.; Suzuki, K.; Yokoo, S. Impact of sarcopenia on postoperative surgical site infections in patients undergoing flap reconstruction for oral cancer. Int J Oral Maxillofac Surg 2020, 49, 576–581. [Google Scholar] [CrossRef] [PubMed]
- Maeda, N.; Shirakawa, Y.; Tanabe, S.; Sakurama, K.; Noma, K.; Fujiwara, T. Skeletal muscle loss in the postoperative acute phase after esophageal cancer surgery as a new prognostic factor. World J Surg Oncol 2020, 18, 143. [Google Scholar] [CrossRef] [PubMed]
- Bonavolontà, P.; Improta, G.; Dell'Aversana Orabona, G.; Goglia, F.; Abbate, V.; Sorrentino, A.; Piloni, S.; Salzano, G.; Iaconetta, G.; Califano, L. Evaluation of sarcopenia and sarcopenic obesity in patients affected by oral squamous cell carcinoma: A retrospective single-center study. J Craniomaxillofac Surg 2023, 51, 7–15. [Google Scholar] [CrossRef] [PubMed]
- Ansari, E.; Chargi, N.; van Es, R.J.J.; Dieleman, F.J.; Van Cann, E.M.; de Bree, R. Association of preoperative low skeletal muscle mass with postoperative complications after selective neck dissection. Int J Oral Maxillofac Surg 2022, 51, 1389–1393. [Google Scholar] [CrossRef] [PubMed]
- Mangram, A.J.; Horan, T.C.; Pearson, M.L.; Silver, L.C.; Jarvis, W.R. Guideline for Prevention of Surgical Site Infection, 1999. Centers for Disease Control and Prevention (CDC) Hospital Infection Control Practices Advisory Committee. American journal of infection control 1999, 27, 97–134. [Google Scholar] [CrossRef] [PubMed]
- Vangelov, B.; Bauer, J.; Moses, D.; Smee, R. The effectiveness of skeletal muscle evaluation at the third cervical vertebral level for computed tomography-defined sarcopenia assessment in patients with head and neck cancer. Head Neck 2022, 44, 1047–1056. [Google Scholar] [CrossRef] [PubMed]
- Yoon, J.K.; Jang, J.Y.; An, Y.S.; Lee, S.J. Skeletal muscle mass at C3 may not be a strong predictor for skeletal muscle mass at L3 in sarcopenic patients with head and neck cancer. PLoS One 2021, 16, 0254844. [Google Scholar] [CrossRef] [PubMed]
- Swartz, J.E.; Pothen, A.J.; Wegner, I.; Smid, E.J.; Swart, K.M.; de Bree, R.; Leenen, L.P.; Grolman, W. Feasibility of using head and neck CT imaging to assess skeletal muscle mass in head and neck cancer patients. Oral Oncol 2016, 62, 28–33. [Google Scholar] [CrossRef] [PubMed]
- Bril, S.I.; Wendrich, A.W.; Swartz, J.E.; Wegner, I.; Pameijer, F.; Smid, E.J.; Bol, G.H.; Pothen, A.J.; de Bree, R. Interobserver agreement of skeletal muscle mass measurement on head and neck CT imaging at the level of the third cervical vertebra. Eur Arch Otorhinolaryngol 2019, 276, 1175–1182. [Google Scholar] [CrossRef] [PubMed]
- Yamahara, K.; Mizukoshi, A.; Lee, K.; Ikegami, S. Sarcopenia with inflammation as a predictor of survival in patients with head and neck cancer. Auris Nasus Larynx 2021, 48, 1013–1022. [Google Scholar] [CrossRef] [PubMed]
- Sandmael, J.A.; Bye, A.; Solheim, T.S.; Stene, G.B.; Thorsen, L.; Kaasa, S.; Lund, J.Å.; Oldervoll, L.M. Feasibility and preliminary effects of resistance training and nutritional supplements during versus after radiotherapy in patients with head and neck cancer: A pilot randomized trial. Cancer 2017, 123, 4440–4448. [Google Scholar] [CrossRef] [PubMed]
- Wobith, M.; Weimann, A. Oral Nutritional Supplements and Enteral Nutrition in Patients with Gastrointestinal Surgery. Nutrients 2021, 13, 2655. [Google Scholar] [CrossRef] [PubMed]
Figure 1.
The third lumbar vertebra (L3) was selected as the standard landmark, and the extension from L3 to the iliac crest was selected to measure the muscle cross-sectional area. Skeletal muscle was identified and quantified by use of Hounsfield unit (HU) thresholds (-29 to +150).
Figure 1.
The third lumbar vertebra (L3) was selected as the standard landmark, and the extension from L3 to the iliac crest was selected to measure the muscle cross-sectional area. Skeletal muscle was identified and quantified by use of Hounsfield unit (HU) thresholds (-29 to +150).
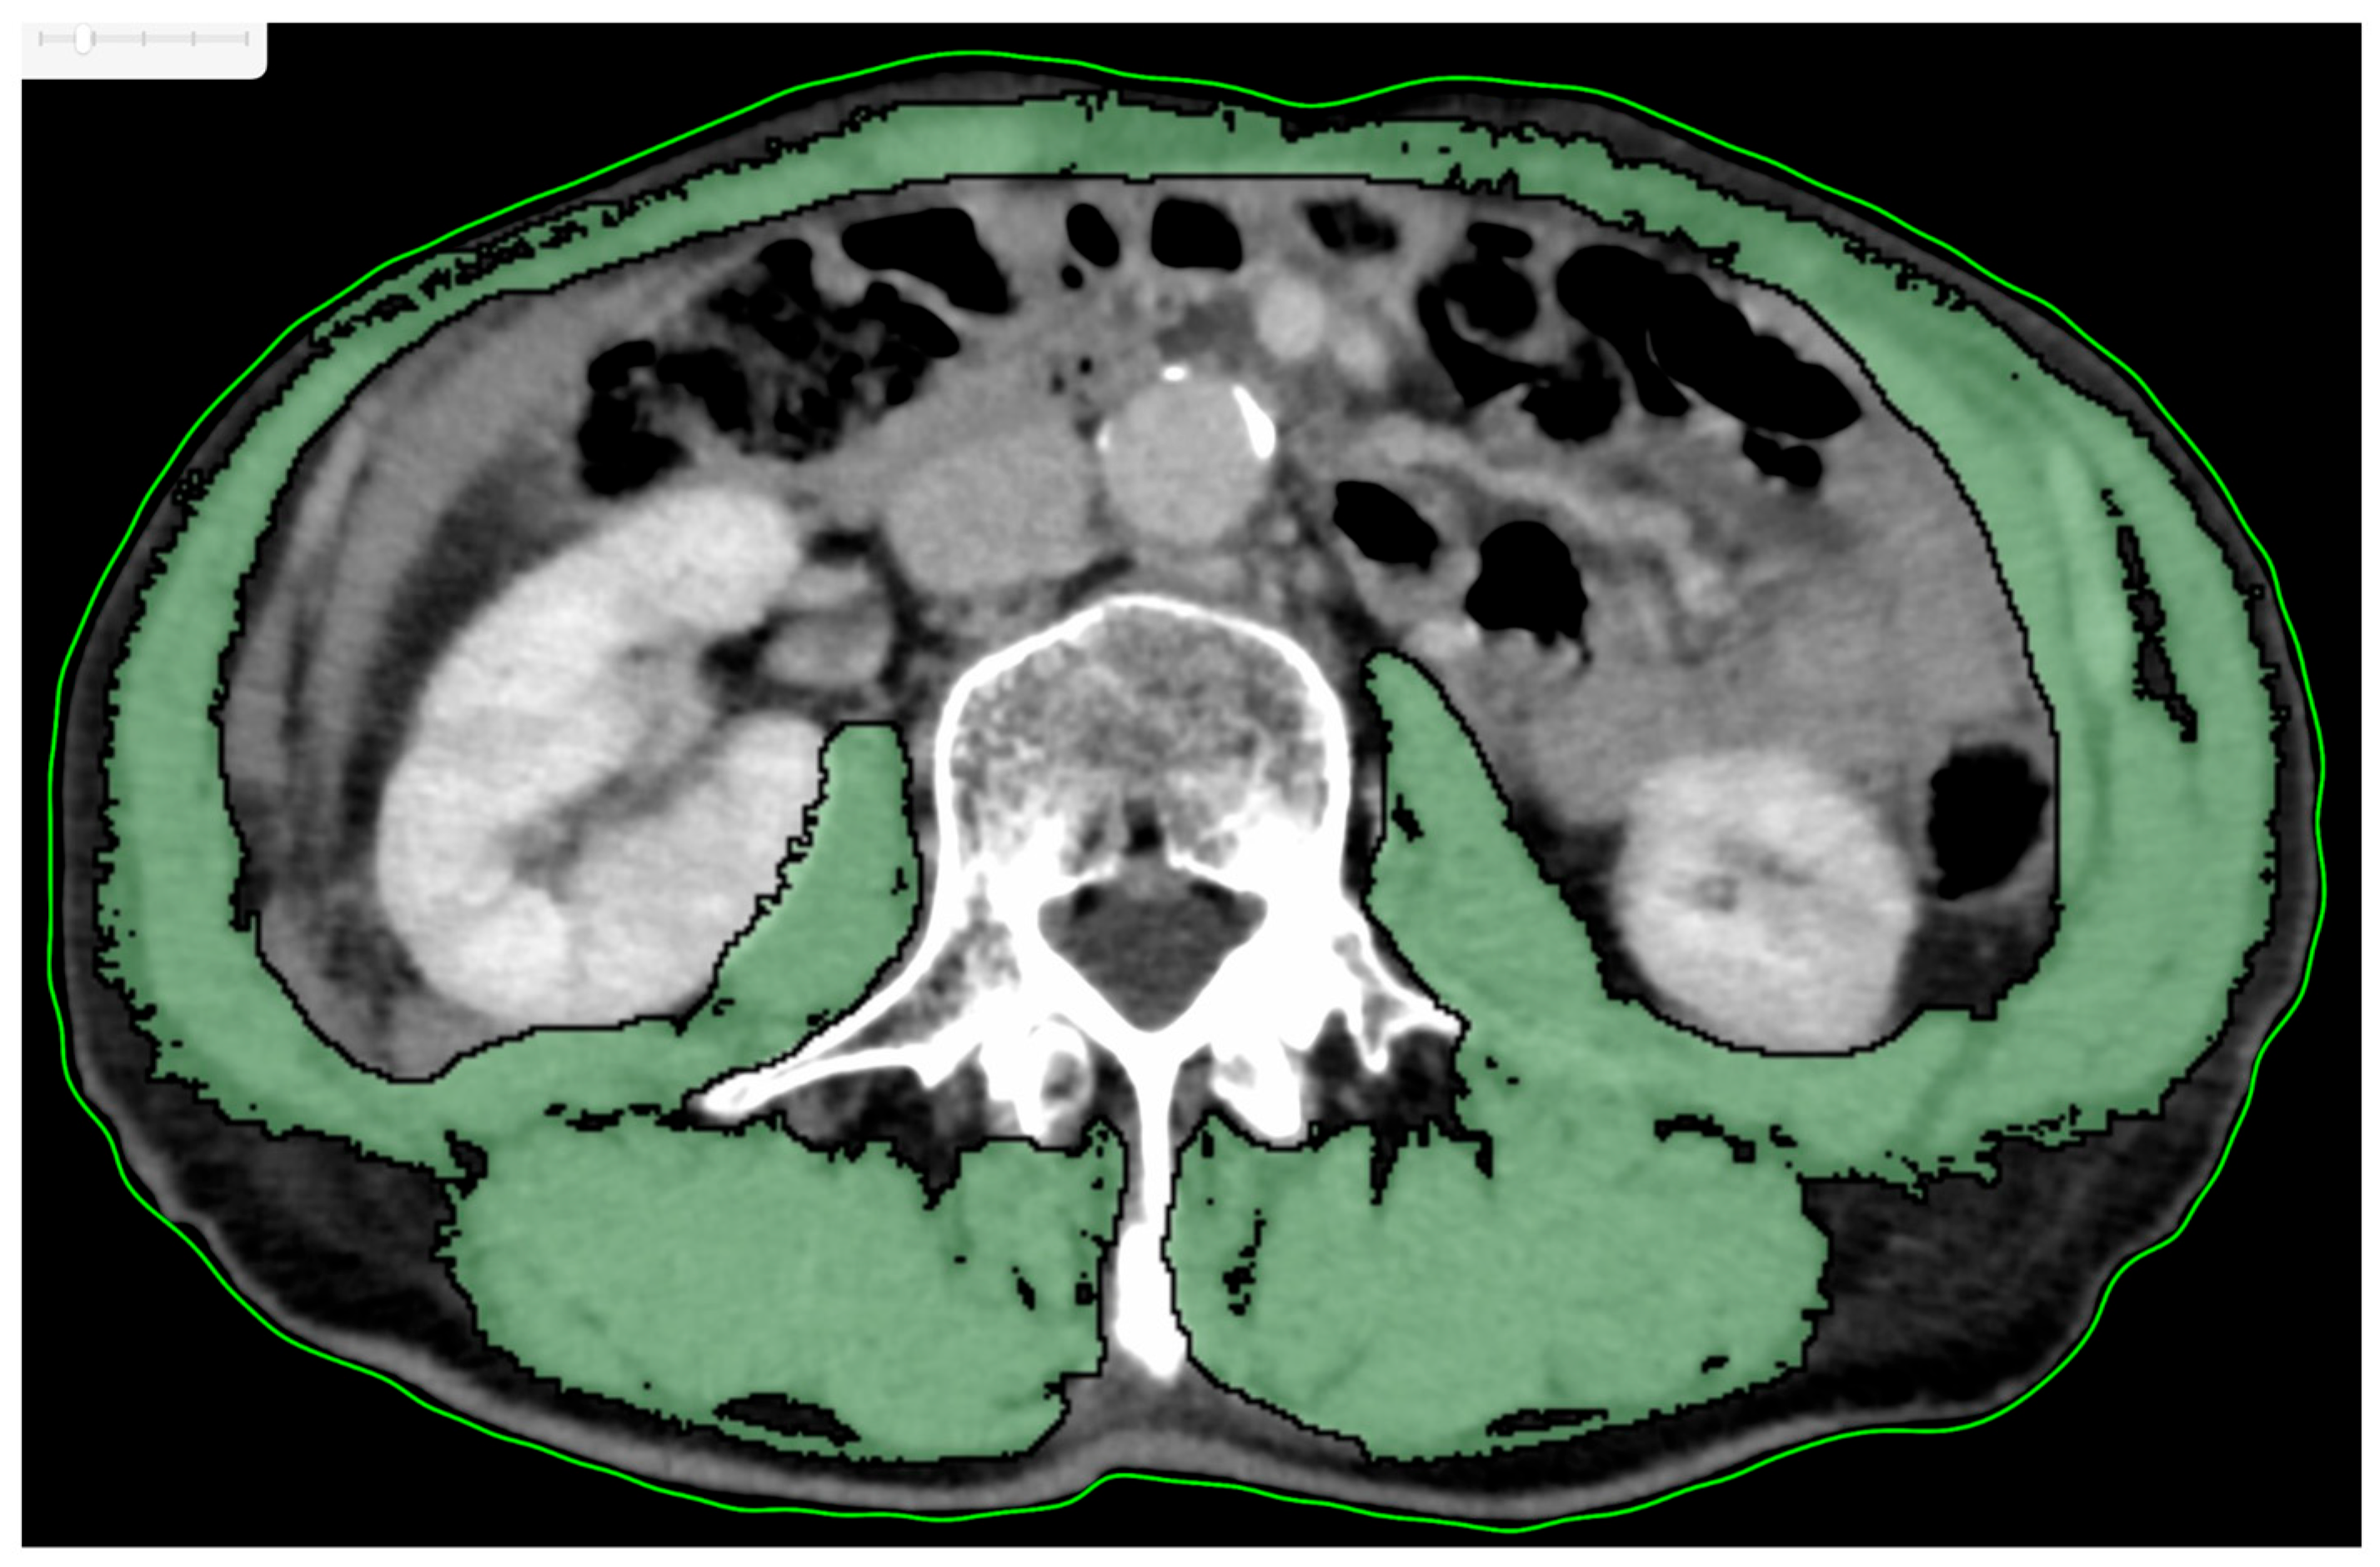
Figure 2.
Overall survival rate according to age. There was a significant difference between <65years and ≥65years (P=0.013). The OS rate was 86.1% with <65years and 60.1% with ≥65 years.
Figure 2.
Overall survival rate according to age. There was a significant difference between <65years and ≥65years (P=0.013). The OS rate was 86.1% with <65years and 60.1% with ≥65 years.
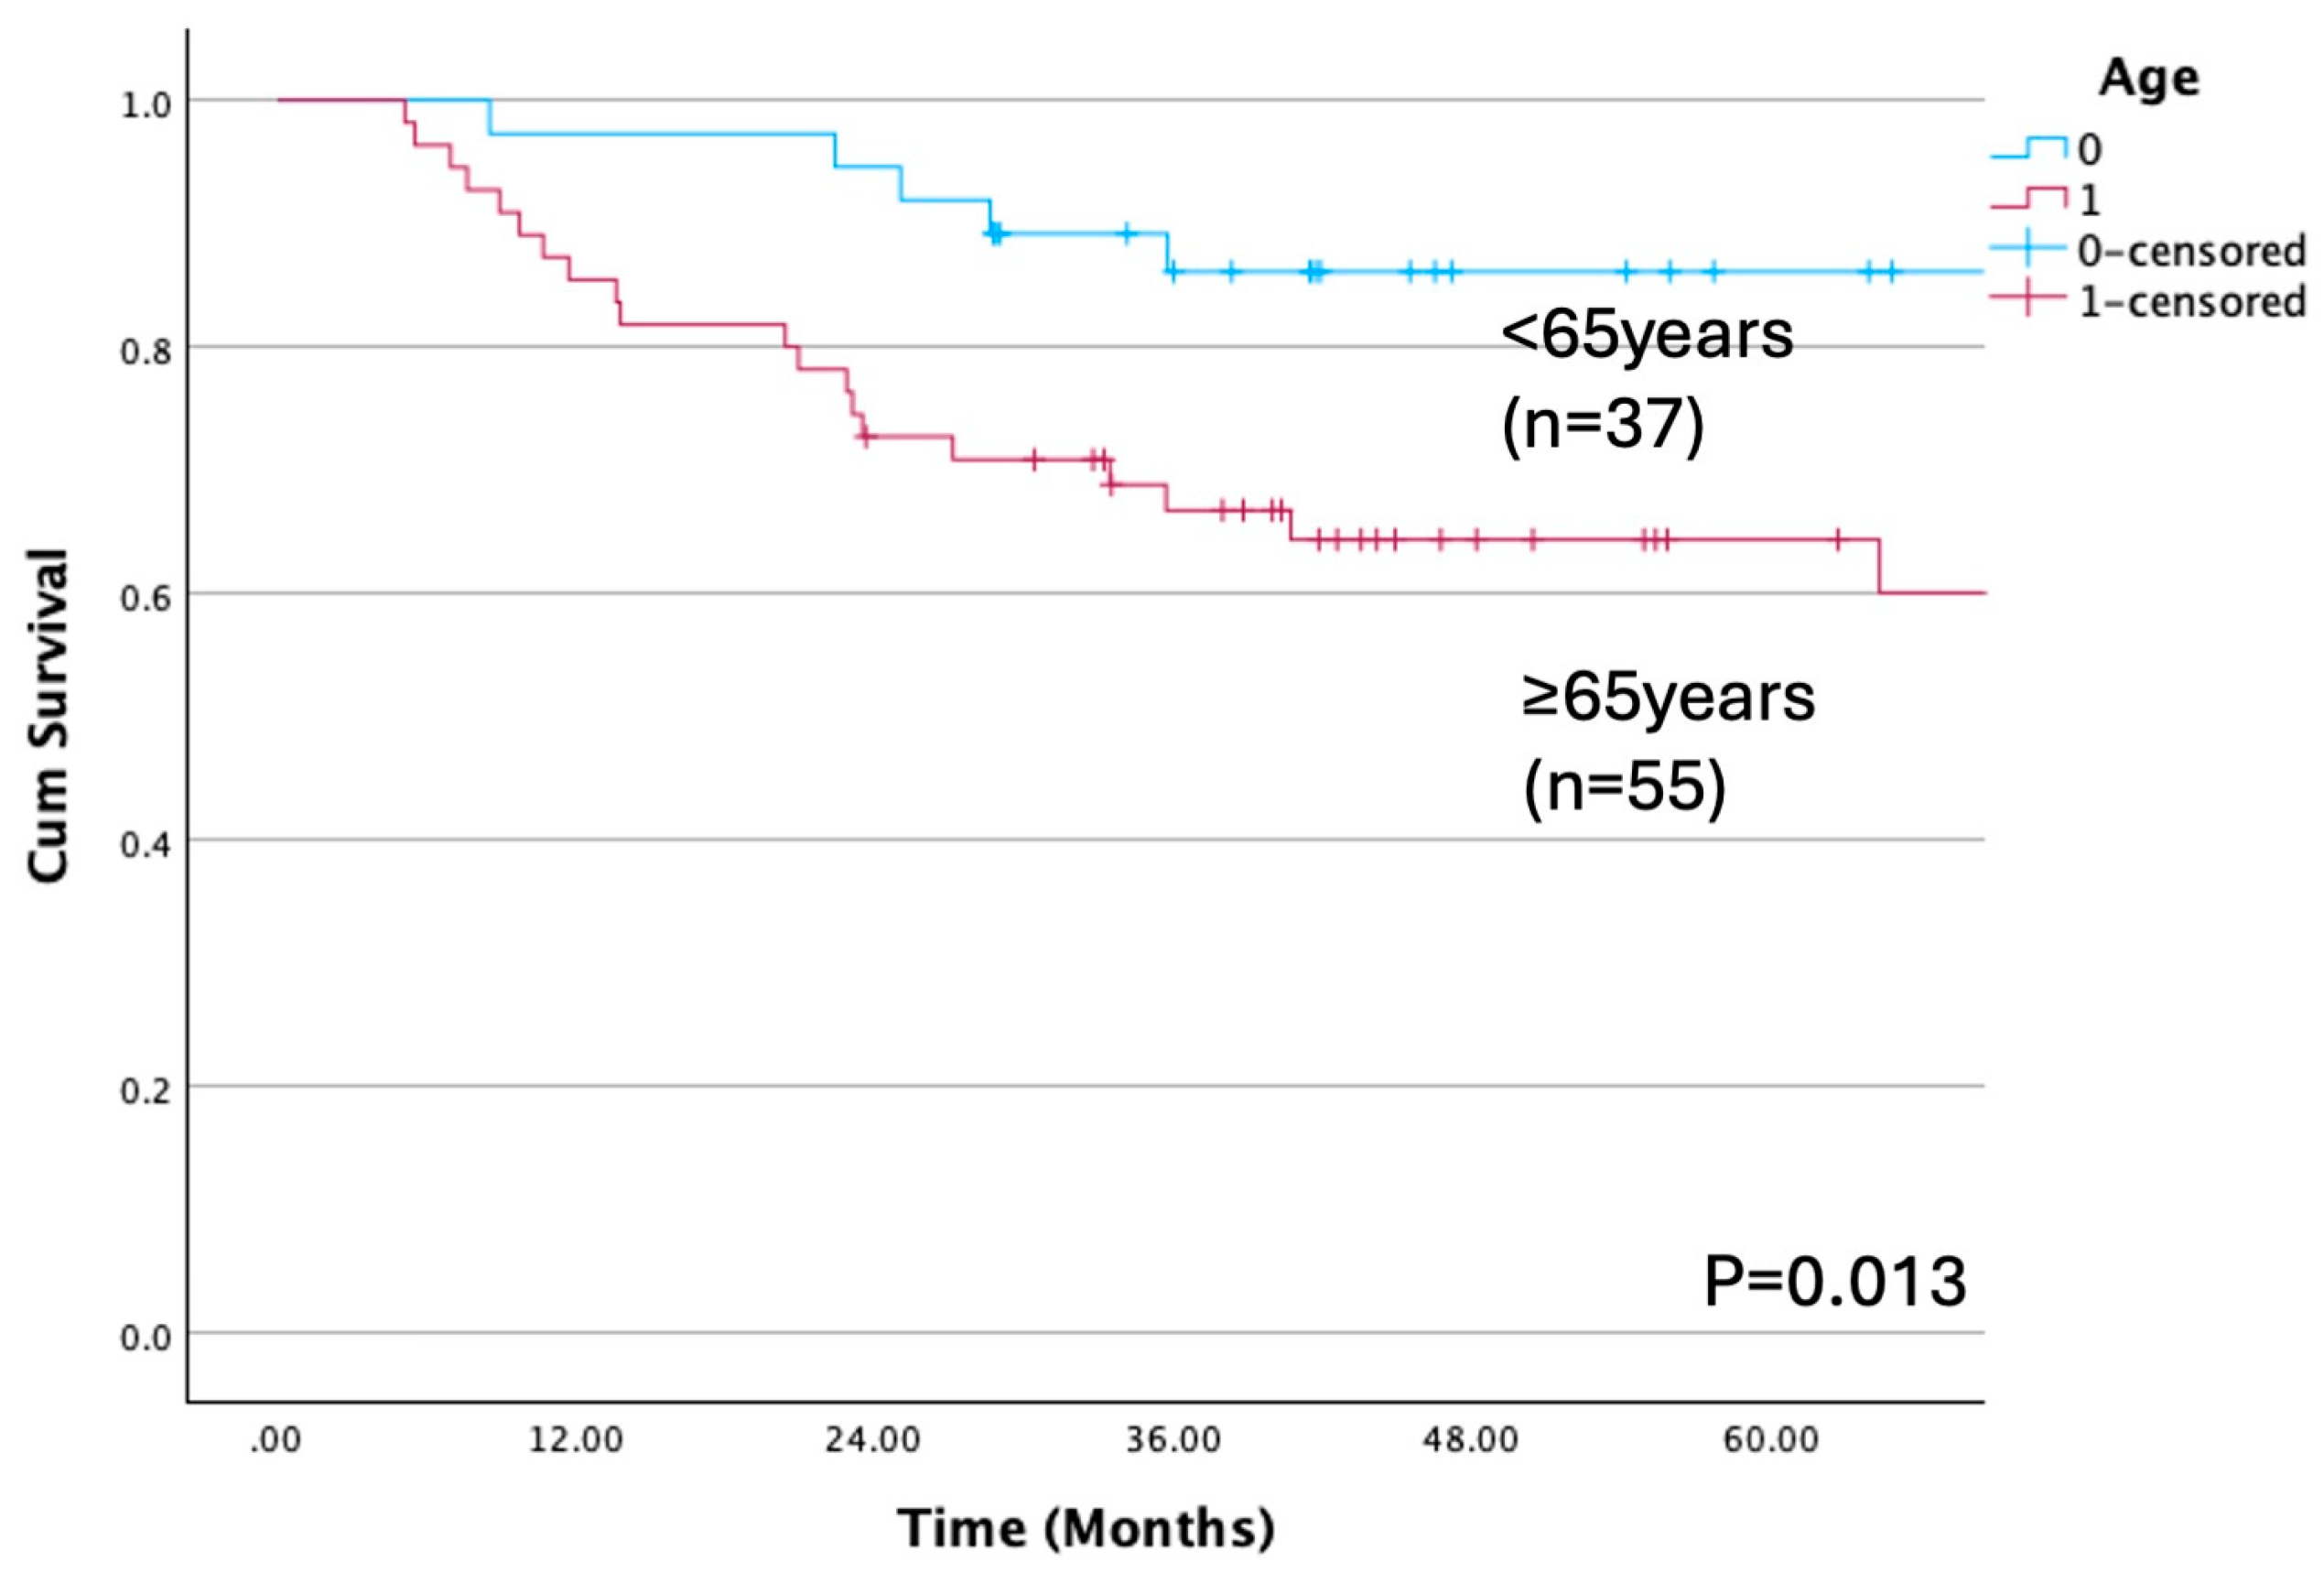
Figure 3.
Overall survival rate according to SMI cutoff. There was a significant difference between low and high SMI (P=0.042). The OS rate was 60.2% with low SMI and 81.1% with high SMI.
Figure 3.
Overall survival rate according to SMI cutoff. There was a significant difference between low and high SMI (P=0.042). The OS rate was 60.2% with low SMI and 81.1% with high SMI.
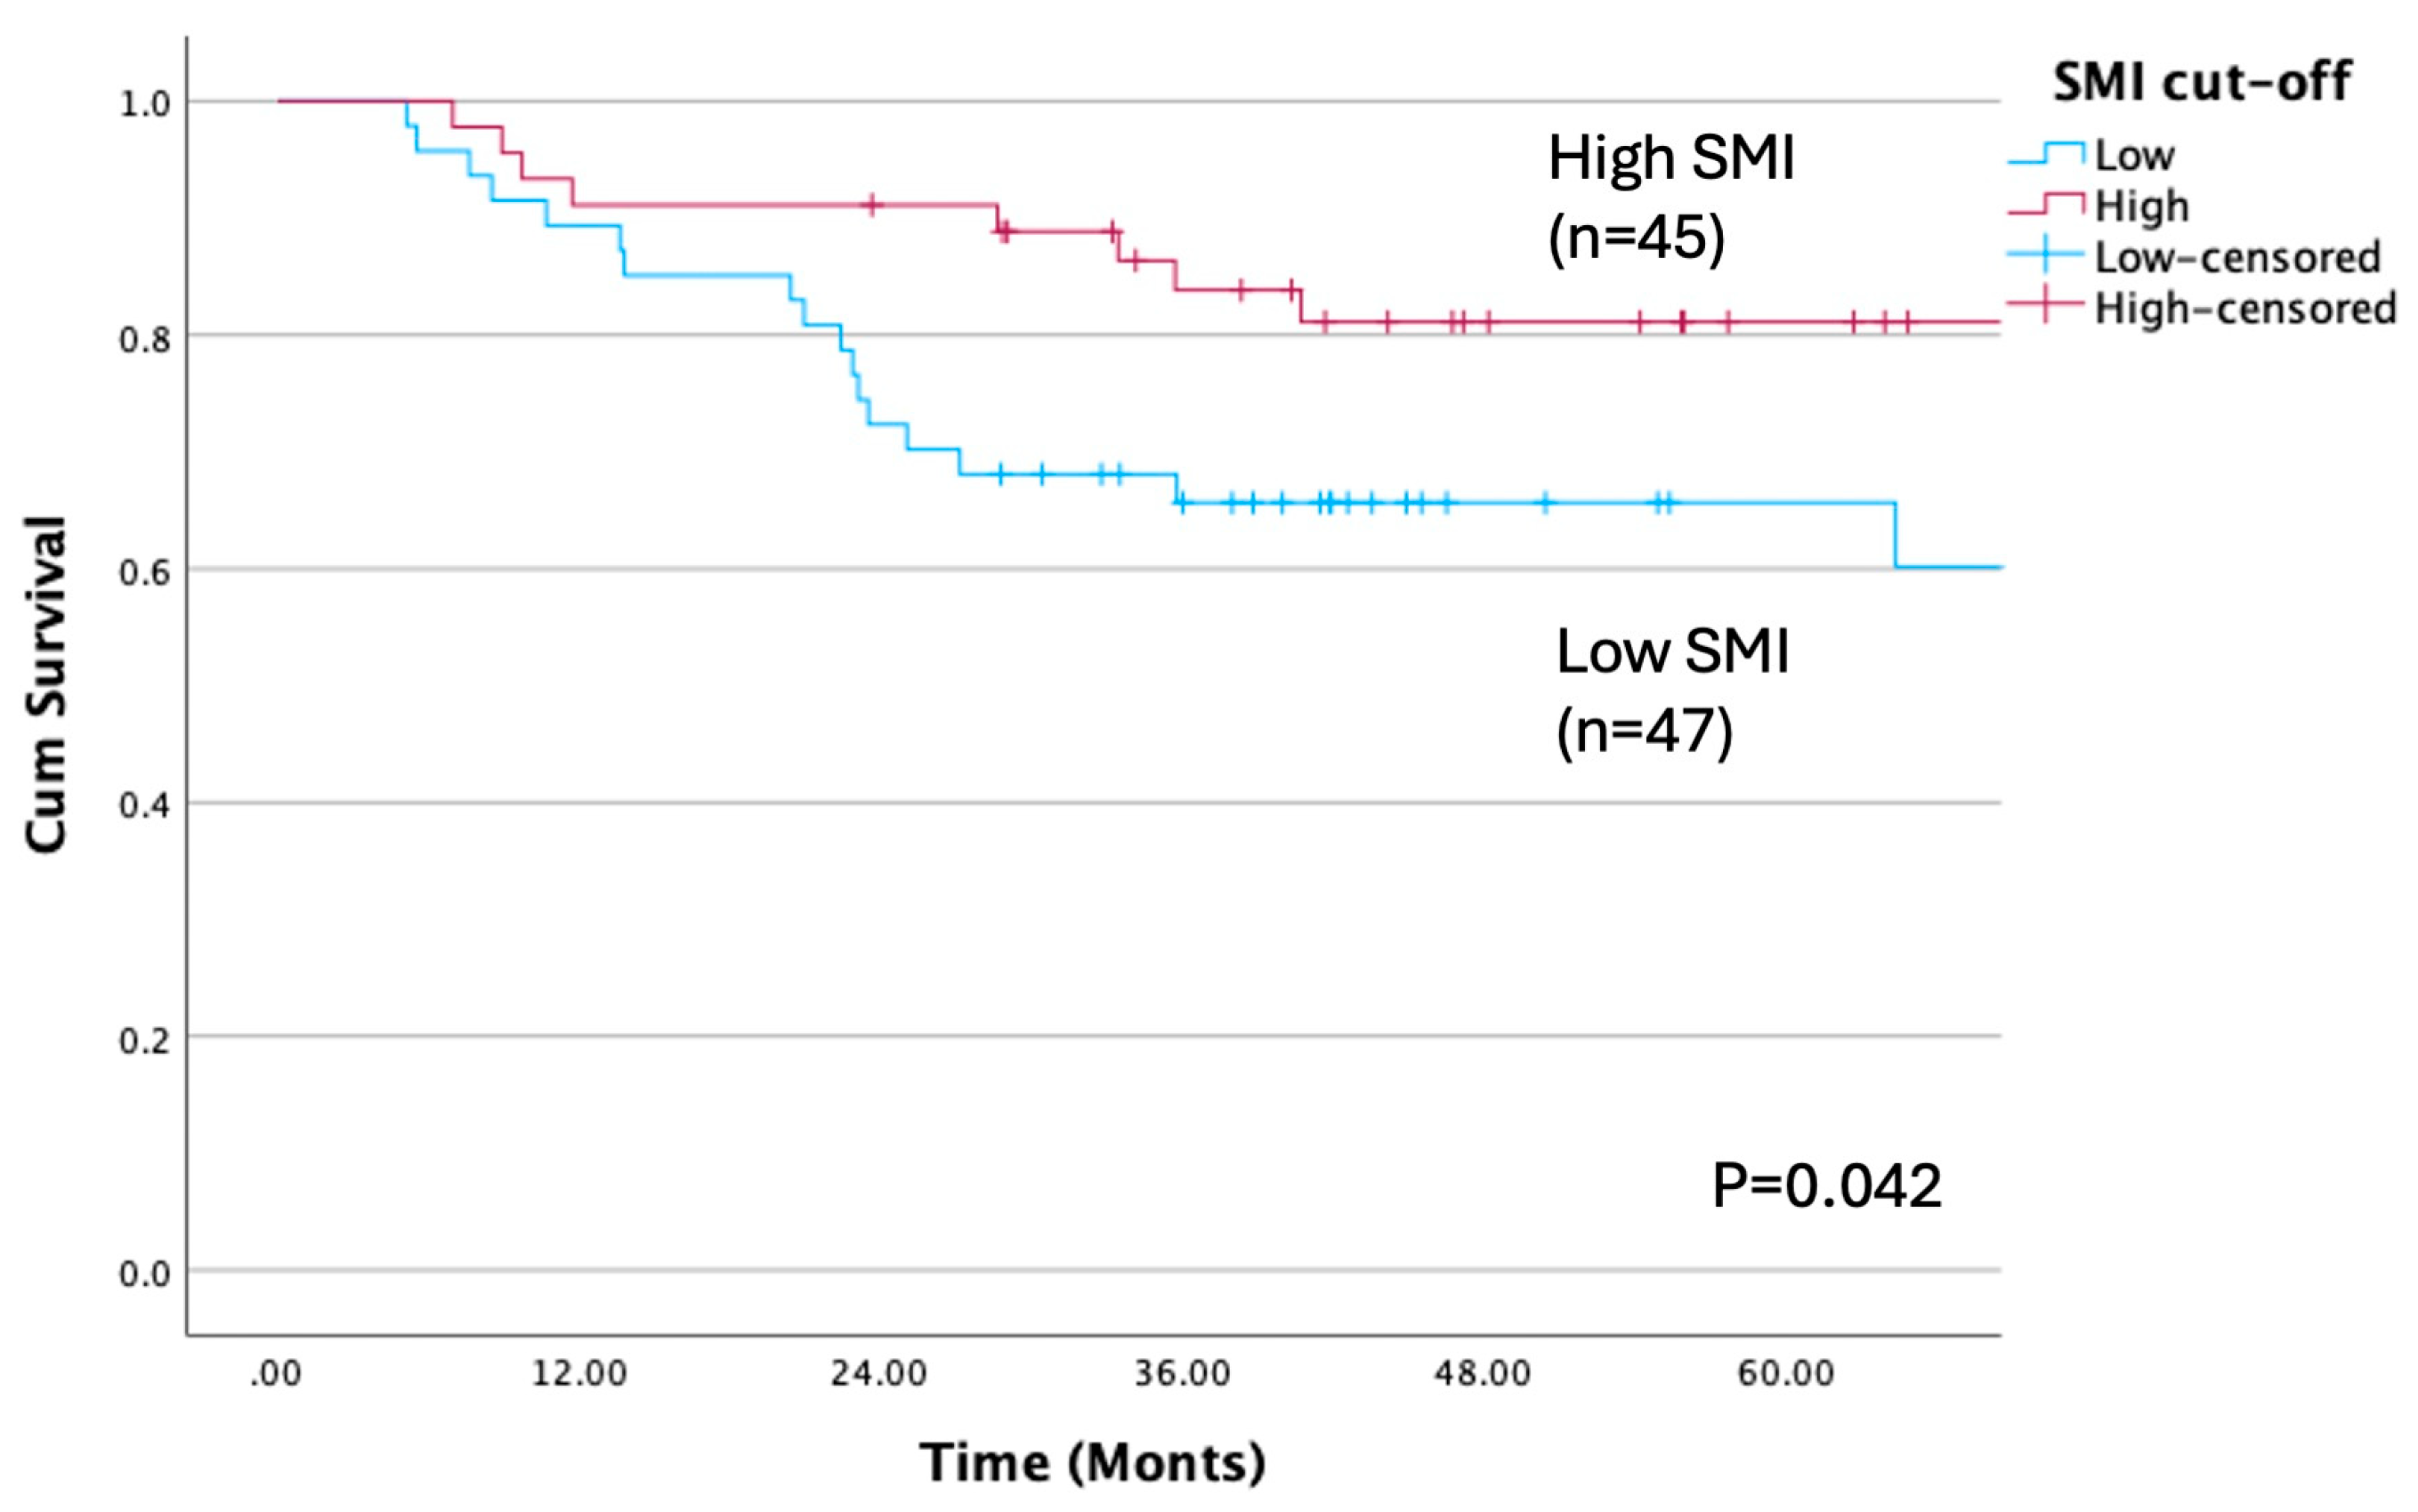
Figure 4.
Overall survival rate according to pN grade (P<0.001). There was a significant difference between pN grade. The OS rate was 83.4% of N0, 57.1% of N1, 72.2% of N2b, 0% of N2c and 22.2% of N3.
Figure 4.
Overall survival rate according to pN grade (P<0.001). There was a significant difference between pN grade. The OS rate was 83.4% of N0, 57.1% of N1, 72.2% of N2b, 0% of N2c and 22.2% of N3.
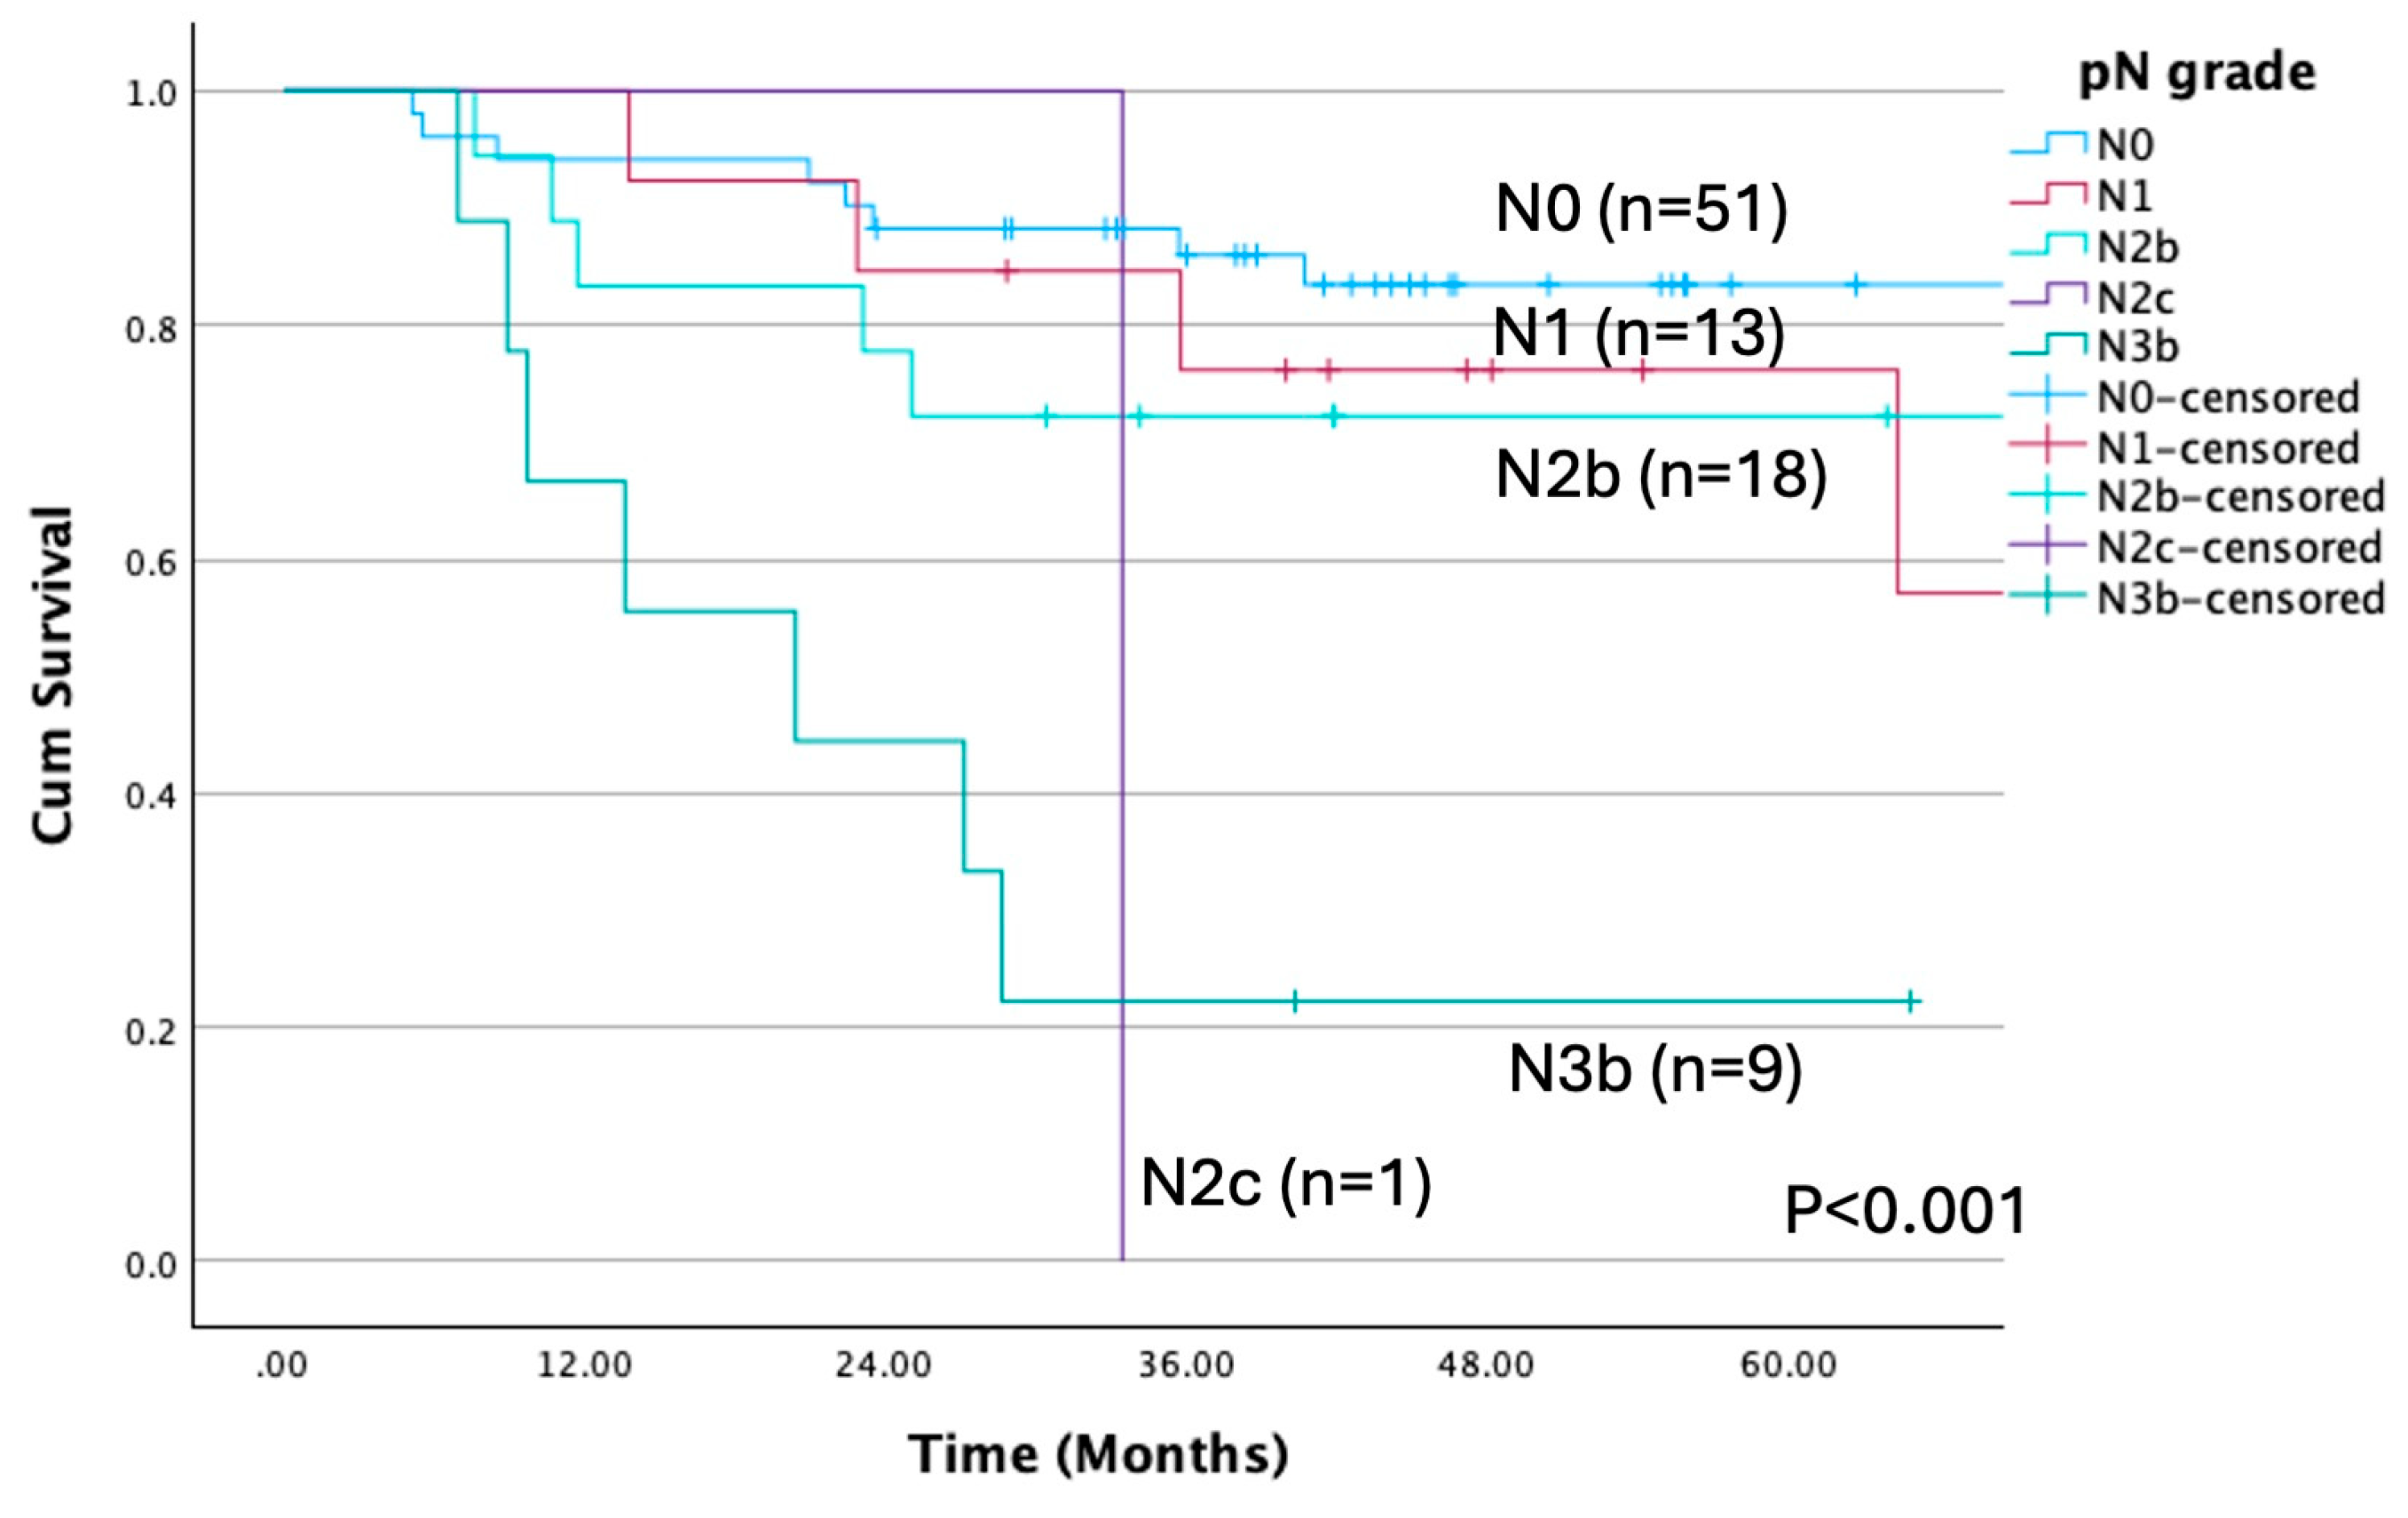
Figure 5.
Overall survival rate according to ENE. There was a significant difference between present and none (P<0.001). The OS rate was 22.2% with present and 76.1% with none.
Figure 5.
Overall survival rate according to ENE. There was a significant difference between present and none (P<0.001). The OS rate was 22.2% with present and 76.1% with none.
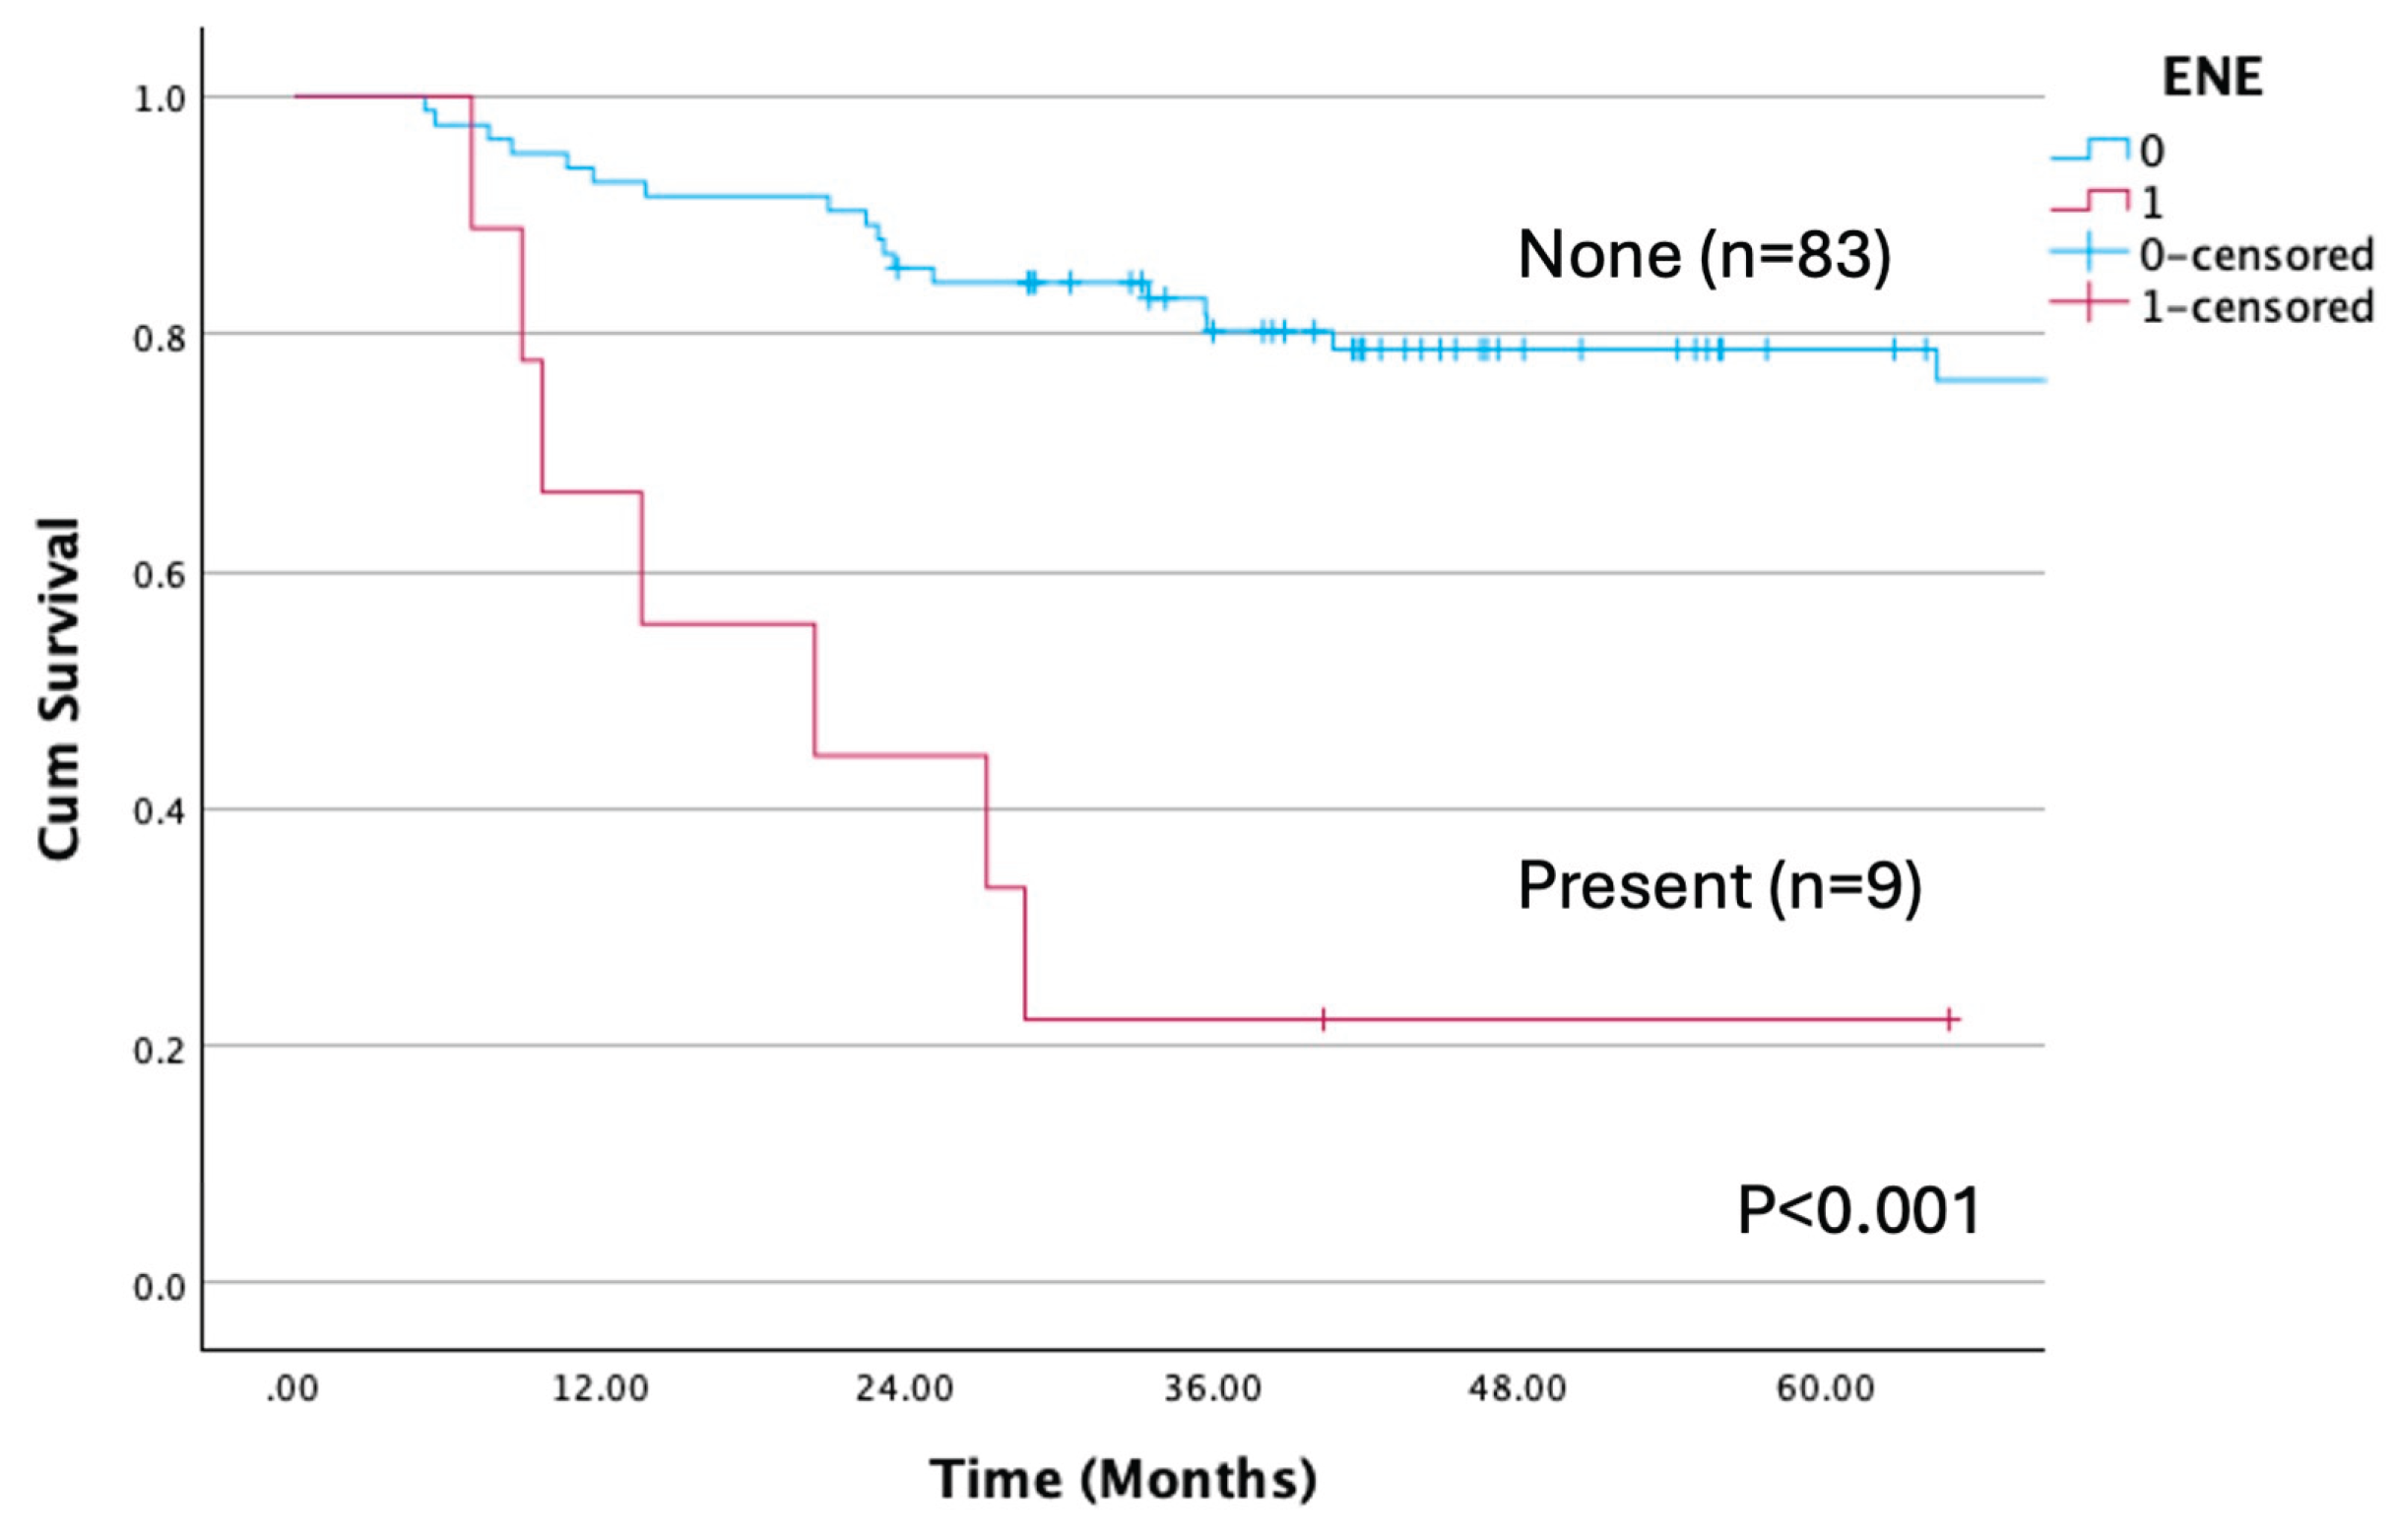
Figure 6.
Overall survival rate according to albumin cutoff. There was a significant difference between <4.0mg/dL and ≥4.0mg/dL (P=0.001). The OS rate was 43.2% with low and 77.7% with high albumin.
Figure 6.
Overall survival rate according to albumin cutoff. There was a significant difference between <4.0mg/dL and ≥4.0mg/dL (P=0.001). The OS rate was 43.2% with low and 77.7% with high albumin.
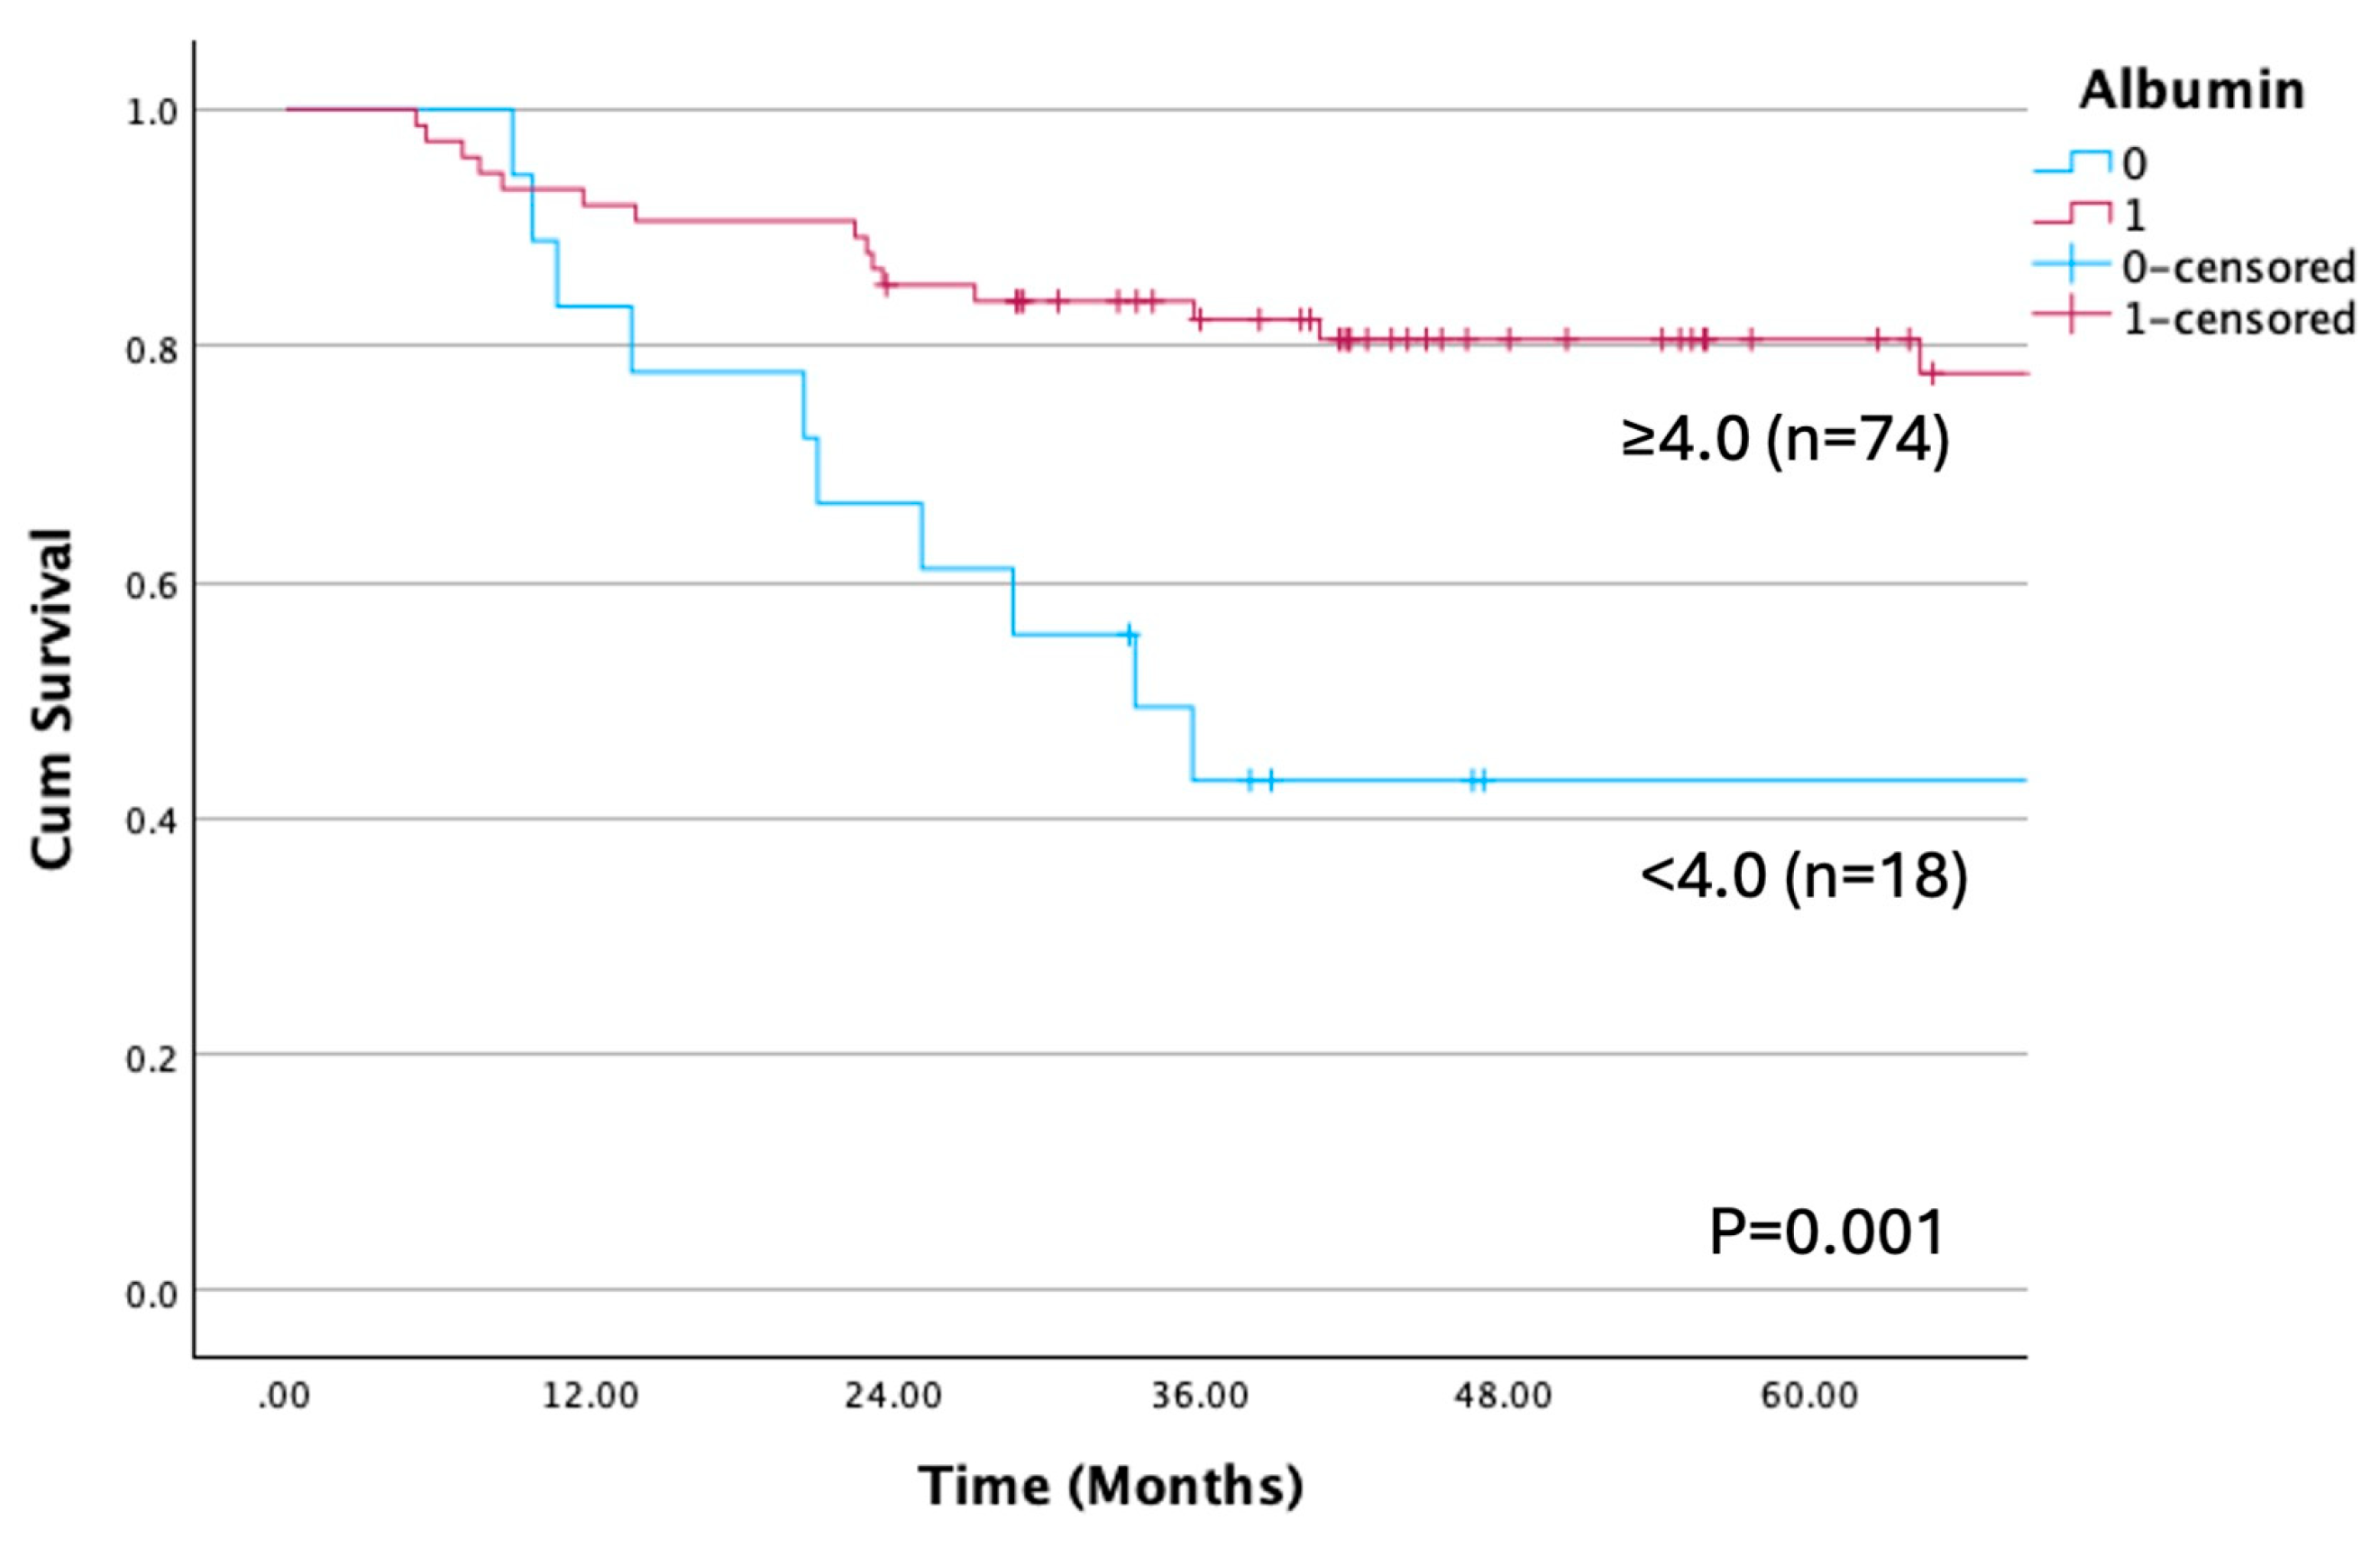

Table 1.
Clinical characteristics of the patients included in the study dichotomized with low and high skeletal muscle index.
Table 1.
Clinical characteristics of the patients included in the study dichotomized with low and high skeletal muscle index.
| Variable | Total no. of patients |
Low SMI No. of patients (%) n=47 |
High SMI No. of patients (%) n=45 |
P-value† | |
|---|---|---|---|---|---|
| Sex |
Male Female |
59 33 |
30(63.8) 17(36.2) |
29(64.4) 16(35.6) |
0.951 |
| Age (years) |
<65 ≥65 |
37 55 |
14(29.8) 33(70.2) |
23(51.1) 22(48.9) |
0.037* |
| BMI (kg/m2) |
<18.5 ≥18.5 |
11 81 |
8(17.0) 39(83.0) |
3(6.7) 42(93.3) |
0.199 |
| Tabaco consumption | Ever Never |
45 47 |
25(53.2) 22(46.8) |
20(44.4) 25(55.6) |
0.401 |
| Alcohol consumption | Present Absent |
44 48 |
24(51.1) 23(48.9) |
20(44.4) 25(55.6) |
0.525 |
| Primary site |
Tongue Lower gingiva Buccal mucosa Floor of the mouth Upper gingiva |
41 35 8 7 1 |
25(53.2) 15(31.9) 3(6.4) 4(8.5) 0(0) |
16(35.6) 20(44.4) 5(11.1) 3(6.7) 1(2.2) |
0.368 |
| Clinical T classification |
T2 T3 T4a T4b |
17 15 47 13 |
9(19.1) 9(19.1) 24(51.1) 5(10.6) |
8(17.8) 6(13.3) 23(51.1) 8(17.8) |
0.722 |
| Clinical N classification | N0 N1 N2b N2c N3b |
41 11 35 4 1 |
25(53.2) 3(6.4) 15(31.9) 3(6.4) 1(2.1) |
16(35.6) 8(17.8) 20(44.4) 1(2.2) 0(0) |
0.140 |
| Stage classification | II III IVa IVb |
9 11 58 14 |
5(10.6) 7(14.9) 29(61.7) 6(12.8) |
4(8.9) 4(8.9) 29(64.4) 8(17.8) |
0.760 |
| Histological grade |
G1 G2 G3 |
49 34 9 |
21(44.7) 19(40.4) 7(14.9) |
28(62.2) 15(33.3) 2(4.4) |
0.122 |
| Preoperative radiotherapy | Present Absent |
6 86 |
3(6.4) 44(93.6) |
3(6.7) 42(93.3) |
1.000 |
| Pathological N classification | N0 N1 N2b N2c N3b |
51 13 18 1 9 |
27(57.4) 7(14.9) 10(21.3) 0(0) 3(6.4) |
24(53.3) 6(13.3) 8(17.8) 1(2.2) 6(13.3) |
0.657 |
| Surgical site infection | Present Absent |
11 81 |
5(10.6) 42(89.4) |
6(13.3) 39(86.7) |
0.690 |
| Delirium | Present Absent |
27 65 |
15(31.9) 32(68.1) |
12(26.7) 33(73.3) |
0.581 |
| Postoperative pneumonia | Present Absent |
21 71 |
8(17.0) 39(83.0) |
13(28.9) 32(71.1) |
0.175 |
| Primary recurrence | Present Absent |
14 78 |
9(19.1) 38(80.9) |
5(11.1) 40(88.9) |
0.283 |
| Neck recurrence | Present Absent |
11 81 |
8(17.0) 39(83.0) |
3(6.7) 42(93.3) |
0.199 |
| Distant metastasis | Present Absent |
20 72 |
13(27.7) 34(72.3) |
7(15.6) 38(84.4) |
0.159 |
| Free flap type | ALT FF RAMF |
37 31 24 |
23(48.9) 13(27.7) 11(23.4) |
14(31.1) 18(40.0) 13(28.9) |
0.210 |
| Variable (continuous) |
Low SMI Median (range) |
High SMI Median (range) |
P-value†† | ||
| HCU duration | (days) | 7 (4-10) | 7 (5-12) | 0.411 | |
| Hospital stay duration | (days) | 38(22-152) | 36(19-98) | 0.537 | |
| PS | 0 (0-1) | 0 (0-1) | 0.692 | ||
| ASA |
2 (1-3) | 2 (1-3) | 0.540 | ||
| Bleeding count | (mL) | 374(126-1,031) | 510(70-1,278) | 0.004** | |
| Operative time | (hour: minute) | 11:05(8:24-15:15) | 11:47(8:20-15:31) | 0.133 | |
| Albumin | (mg/dL) | 4.2(3.3-5.1) | 4.2(3.2-4.8) | 0.820 | |
| NLR | 2.74 (1.09-11.70) |
2.39 (0.93-15.23) |
0.246 | ||
| LMR | 4.38 (1.14-11.15) |
5.43 (1.81-8.80) |
0.060 | ||
| PLR | 149.54 (73.03-529.79) |
134.81 (34.52-291.06) |
0.193 | ||
| PNI | 116.90 (63.01-228.00) |
127.45 (89.50-222.00) |
0.119 | ||
| MAR | 88.64 (0-200.00) |
90.24 (34.55-160.98) |
0.919 | ||
| CAR | 0.0200 (0.0063-0.1921) |
0.0136 (0.0063-0.6641) |
0.379 |
† By Chi-square analysis or Fisher’s exact probability test. † † By Mann-Whitney’s U test. * P < 0.05, Statistically significant difference. **P < 0.01, Statistically significant difference. SMI, Skeletal muscle index; BMI, Body mass index; T, Tumor; N, Node; RAMF, rectus abdominis myocutaneous flap; ALT, anterolateral thigh flap; FF, fibula flap; HCU, high care unit; PS, performance status; ASA, American society of anesthesiologists; NLR neutrocyte/lymphocyte ratio, LMR, lymphocyte/monocyte ratio; PLR, platelet/lymphocyte ratio; PNI, prognostic nutritional index; MAR, monocyte/albumin ratio; CAR, C-reactive protein/albumin ratio.
Table 2.
Characteristics of patients with oral squamous cell carcinoma in relation to cumulative overall and disease-free survival.
Table 2.
Characteristics of patients with oral squamous cell carcinoma in relation to cumulative overall and disease-free survival.
| Variables | No. of patients (%) | OS (%) | P † | DFS (%) | P † | |
|---|---|---|---|---|---|---|
| Age | ≥65 | 55(59.8) | 60.1 | 0.013* | 58.0 | 0.057 |
| (years) | <65 | 37(40.2) | 86.1 | 78.4 | ||
| Sex | Male | 59(64.1) | 68.4 | 0.658 | 66.1 | 0.665 |
| Female | 33(35.9) | 74.8 | 67.3 | |||
| BMI (kg/m2) | <18.5 | 11 (12.0) | 54.5 | 0.051 | 54.5 | 0.231 |
| ≥18.5 | 81 (88.0) | 73.2 | 68.1 | |||
| SMI | High | 45(48.9) | 81.1 | 0.042* | 81.4 | 0.070 |
| Low | 47(51.1) | 60.2 | 65.4 | |||
| Tobacco consumption | Ever | 45(48.9) | 74.3 | 0.535 | 64.4 | 0.601 |
| Never | 47(51.1) | 68.4 | 68.7 | |||
| Alcohol consumption | Ever | 44(47.8) | 76.3 | 0.442 | 68.2 | 0.804 |
| Never | 48(52.2) | 66.5 | 65.2 | |||
| Diabetes melitus | Present | 21(22.8) | 71.4 | 0.929 | 66.7 | 0.965 |
| None | 71(77.2) | 70.2 | 66.5 | |||
| Cardiovascular disease | Present | 7( 7.6) | 47.6 | 0.284 | 57.1 | 0.442 |
| None | 85(92.4) | 73.3 | 67.3 | |||
| Cerebrovascular disease | Present | 8( 8.7) | 87.5 | 0.320 | 100 | 0.062 |
| None | 84(91.3) | 69.0 | 63.3 | |||
| History of cancer | Present | 16(17.4) | 80.2 | 0.400 | 80.8 | 0.241 |
| None | 76(82.6) | 69.0 | 63.6 | |||
| Preoperative radiotherapy | Present | 6( 6.5) | 66.7 | 0.829 | 83.3 | 0.381 |
| Absent | 86(93.5) | 70.8 | 65.3 | |||
| Primary site | Tongue | 41 (44.6) | 67.5 | <0.001** | 63.4 | <0.001** |
| Lower gingiva | 35 (38.1) | 100 | 100 | |||
| Buccal mucosa | 8 (8.7) | 75.0 | 0 | |||
| Floor of the mouth | 7 (7.6) | 0 | 42.9 | |||
| Upper gingiva | 1 (1.1) | 100 | 100 | |||
| Clinical T classification | T2 | 17 (18.5) | 74.9 | 0.871 | 64.7 | 0.904 |
| T3 | 15 (16.3) | 80.0 | 64.0 | |||
| T4a | 47 (51.1) | 67.8 | 68.0 | |||
| T4b | 13 (14.1) | 68.4 | 61.5 | |||
| Clinical N classification | N0 | 41 (44.6) | 77.4 | 0.014* | 78.0 | 0.018* |
| N1 | 11 (12.0) | 77.9 | 53.0 | |||
| N2b | 35 (38.0) | 70.4 | 65.7 | |||
| N2c | 4 (4.3) | 25.0 | 25.0 | |||
| N3b | 1 (1.1) | 0 | 0 | |||
| Clinical stage classification | II | 9 (9.8) | 77.8 | 0.803 | 66.7 | 0.830 |
| III | 11 (12.0) | 72.7 | 54.5 | |||
| IVA | 58 (63.0) | 71.6 | 70.6 | |||
| IVB | 14 (15.2) | 63.5 | 57.1 | |||
| Pathological surgical margin (mm) | ≥5 | 51 | 73.3 | 0.059 | 69.0 | 0.076 |
| <5 | 34 | 73.5 | 67.6 | |||
| Positive | 5 | 0 | 20.0 | |||
| pN classification | N0 | 51 (55.4) | 83.4 | <0.001** | 86.2 | <0.001** |
| N1 | 13 (14.1) | 57.1 | 61.5 | |||
| N2b | 18 (19.6) | 72.2 | 42.9 | |||
| N2c | 1 (1.1) | 0 | 0 | |||
| N3b | 9(9.8) | 22.2 | 22.2 | |||
| pN | N1-3b | 41(44.6) | 55.8 | 0.007** | 42.5 | <0.001** |
| N0 | 51(55.4) | 83.4 | 86.2 | |||
| ENE | Present | 9(9.8) | 22.2 | <0.001** | 22.2 | <0.001** |
| None | 83(90.2) | 76.1 | 71.3 | |||
| Histological grade | G1 | 49(53.3) | 74.9 | 0.829 | 69.3 | 0.974 |
| G2 | 34(37.0) | 67.1 | 63.0 | |||
| G3 | 9 (9.8) | 66.7 | 66.7 | |||
| Albumin | <4.0 | 18(19.6) | 43.2 | 0.001** | 44.4 | 0.018* |
| (mg/dL) | ≥4.0 | 74(80.4) | 77.7 | 72.0 |
† By log-rank test. * P < 0.05 Statistically significant difference. **P < 0.01 Statistically significant difference. BMI, Body mass index; SMI, skeletal muscle index; OS, Overall survival; DFS, Disease-free survival; T, Tumor; N, node; pN, Pathological node; ENE, extranodal extension.
Table 3.
Univariate and multivariate Cox regression analyses for overall survival in the primary cohort.
Table 3.
Univariate and multivariate Cox regression analyses for overall survival in the primary cohort.
| Univariate analysis | Multivariate analysis | |||
|---|---|---|---|---|
| Variables | HR (95% CI) | P values † | HR (95% CI) | P values † |
| Age (years) | 3.225 (1.209-8.602) | 0.019* | ||
| ≥65 vs. <65 | ||||
| SMI | ||||
| Low vs. High | 2.339 (1.008-5.429) | 0.048* | 2.900(1.226-6.862) | 0.015** |
| pN | ||||
| N0 vs. N1-3b | 3.008 (1.297-6.976) | 0.010* | ||
| ENE | ||||
| Present vs. Absent | 6.147 (2.527-14.949) | <0.001** | 7.727 (3.083-19.368) | <0.001** |
| Albumin (mg/dL) | ||||
| <4.0 vs. ≥4.0 | 3.429 (1.532-7.676) | 0.003** |
† By Cox regression analyses. * P < 0.05 Statistically significant difference. **P < 0.01 Statistically significant difference. BMI, Body mass index; SMI, skeletal muscle index; pN, Pathological node; ENE, extranodal extension.
Table 4.
Univariate and multivariate Cox regression analyses for disease-free survival in the primary cohort.
Table 4.
Univariate and multivariate Cox regression analyses for disease-free survival in the primary cohort.
| Univariate analysis | Multivariate analysis | |||
| Variables | HR (95% CI) | P values † | HR (95% CI) | P values † |
| pN | ||||
| N0 vs. N1-3b | 4.445 (1.903-10.379) | <0.001* | 4.248 (1.813-9.953) | <0.001** |
| ENE | ||||
| Present vs. Absent | 3.384 (1.435-7.980) | 0.005** | ||
| Albumin (mg/dL) | ||||
| <4.0vs. ≥4.0 | 2.294 (1.069-4.921) | 0.033* | 2.039 (0.944-4.406) | 0.070 |
† By Cox regression analyses. * P < 0.05 Statistically significant difference. **P < 0.01 Statistically significant difference. pN, Pathological node; ENE, extranodal extension.
Disclaimer/Publisher’s Note: The statements, opinions and data contained in all publications are solely those of the individual author(s) and contributor(s) and not of MDPI and/or the editor(s). MDPI and/or the editor(s) disclaim responsibility for any injury to people or property resulting from any ideas, methods, instructions or products referred to in the content. |
© 2025 by the authors. Licensee MDPI, Basel, Switzerland. This article is an open access article distributed under the terms and conditions of the Creative Commons Attribution (CC BY) license (http://creativecommons.org/licenses/by/4.0/).
Copyright: This open access article is published under a Creative Commons CC BY 4.0 license, which permit the free download, distribution, and reuse, provided that the author and preprint are cited in any reuse.


