Submitted:
13 May 2025
Posted:
14 May 2025
You are already at the latest version
Abstract
This article extensively examines the correlation between environmental, social, and governance (ESG) scores and credit ratings across diverse geographic regions and industrial sectors. The study reveals that despite obtaining higher ESG scores, European corporations frequently receive lower credit ratings for combined ESG scores and components such as Human Rights and Governance Pillar scores. Conversely, Resource Use and Shareholder Engagement positively correlate with credit ratings in non-European regions. The analysis of the sectors demonstrates that superior environmental performance positively impacts credit ratings in the Healthcare sector, while effective controversy management is essential in the consumer defense sector. The study delves into the components of ESG, emphasizing that different factors influence credit ratings differently across regions and sectors. Utilizing a dataset from 2013 to 2023, the research examines 188 companies from Europe and non-Europe with consistent ESG scores. An ordered probit model is employed to assess the influence of ESG ratings on credit ratings while accounting for control variables such as leverage, size, profitability, sales growth, and dividend yield. The findings indicate that incorporating ESG factors into credit rating assessments necessitates a region and sector-specific approach. Policymakers, regulators, and investors must consider these differences when making decisions. The study suggests further research on the role of stakeholder pressure in the ESG-credit rating relationship. This investigation aims to provide constructive insights into corporate strategy, policy decisions, and investment practices, empowering the audience with practical knowledge.
Keywords:
ESG scores
; credit ratings
; accounting
; Geographic regions
; Industrial sectors
; Ordered probit model
1. Introduction
Credit rating targets measure any entity's creditworthiness (corporation, organization, or country). It mostly concerns the ability to pay back the debt and the likelihood of default, via the evaluation of qualitative and quantitative information. They are assigned by credit rating agencies, where higher ratings indicate higher creditworthiness or lower probability of default or credit event. The ratings market has an oligopolistic structure internationally, with Fitch, Standard & Poor’s, and Moody’s making up most of the market. Rating agencies, via a through-the-cycle approach, use quantitative and qualitative information from financial statements, any published information about an entity, and judgments [1]. They face governmental regulation [2]. The official role of credit ratings is voluntary internationally [2]. The unique informational set of ratings is as important for corporations as the publication of accounting data. As geographical economic entities, the USA and the EU have heavily emphasized the role of credit ratings in economies and financial markets internationally. The role of credit ratings in both the USA and the EU is depicted by policymakers and regulators [3]. The 2000 Fair Disclosure regulation in the USA gave credit agencies access to more confidential information and made credit ratings more important for policymakers, regulators, and investors [4]. Credit ratings inform investors about default and credit risks, while debt issuers refer to the magnitude of investment risk and transparency [5,6]. Any change (upgrade or downgrade) in credit rating results in changes in the entity’s cost of capital.
Apart from the role of credit ratings in default risk and the market reactions to changes in credit ratings, another important stream in the literature is the determinants of credit ratings. These determinants are financial and non-financial, as credit ratings incorporate financial and non-financial information [7,8]. The former concerns information from financial statements, and the latter concerns corporate social responsibility (CSR) [9,10]. The former are consistent mostly from firm-specific factors (as peroxided by financial ratios) and macroeconomic factors (like GDP growth) [11,12]; whereas, the latter refers to corporate CSR. The credit-risk and ratios literature started from the prediction of bankruptcy using financial ratios [13]; to the prediction of credit ratings [14]. There was a statistically significant effect of ratios on credit ratings; this effect varies with the ratios employed [15]. Such a relation exists because ratings and ratios contain distinct information sets.
The relation of credit ratings with CSR has recently been evident in the literature. Both are important to policymakers, regulators, and investors. The EU’s 2018 Sustainable Finance Action Plan [16] emphasized the incorporation of ESG (environment, social, and governance) activities to credit ratings. CSR activities decrease the risk of information asymmetry [17]. Governance mechanisms that affect the ESG features of an entity can improve credit ratings [18]. Corporate boards affect ratings, as they motivate and monitor management [19]. Corporate governance may be expressed as rules, procedures, management philosophy, and organizational structure, among others [10]. It enables the reduction of bankruptcy and credit event risks via an adequate internal environment and control system. Its impact on credit ratings is statistically significant and positive [20].
We contribute to the literature in the following ways. First, we examine the relation between ESG scores and credit ratings internationally. Second, we reveal the differences between Europe and non-Europe.
2. Literature Review
2.1. The Multi-Dimensional Impact of ESG Scores on International Credit Ratings
The “effect” of ESG scores on international credit ratings varies across sectors and geographical regions. Research is consistent that higher ESG scores, in general, are associated with higher credit ratings [21]. This relationship arises from the perspective that superior ESG practices enhance risk management, operations effectiveness, and stakeholder confidence for a firm, collectively reducing credit risk [22,23]. For instance, firms with strong ESG performance had lower credit default swap (CDS) spreads, especially for countries with high sustainability scores. This testifies to the role of governance mechanisms in preventing credit risk [24].
There are also noted sectoral differences. Things take a unique dynamic in industries with high environmental impacts, such as carbon-intensive sectors in BRICS countries [25]. Whereas better ESG scores spell out lower credit ratings in some cases, in others, they boost shareholder expectations and, at the same time, enterprise value [26,27]. High ESG scores are found to be more beneficial to firms based in countries with weaker legal environments, as these scores can easily substitute for tight regulations. The substitution effect helps reduce the cost of capital and improves creditworthiness [28].
Shifting from public to private debt among ESG-rated firms further clarifies the impact of ESG ratings on a firm's debt structure. This shift reduces the information asymmetry and optimizes leverage ratios [29]. Likewise, through empirical studies related to the Chinese A-share companies, it was demonstrated that a higher ESG score significantly reduced credit risk by improving stock liquidity, reducing financing costs, and enhancing internal controls [30]. In South Korea, ESG management is increasingly considered the key element of long-term growth in raising credit scores for improvements in risk management [31].
However, a lack of consensus among ESG rating agencies—a situation known as ESG rating disagreement—adds an additional degree of complexity.
In other words, firms in more favorable institutional settings will be confronted with lower levels of disagreement and thus more likely to have an optimal impact of high ESG scores on firm value [28]. Incorporating ESG factors in investment approaches links the portfolios to sustainability goals and improves risk-adjusted returns for long-term value and financial security [32]. This detailed assessment highlighted the role of ESG scores in determining credit ratings for companies operating in various sectors in different regions.
It further emphasizes the call for standardized ESG metrics and strong governance practices to operationalize the full potential benefits of ESG integration in assessing credit risk.
2.2. How ESG Scores Affect Credit Ratings Globally
Based on the ESG environmental aspects, ESG performance scores significantly positively affect credit ratings, particularly in industries such as mining and quarrying. Those firms within these sectors that can deal with environmental risks well are considered more resilient and, therefore, attract more credit ratings [33]. In Taiwan, improved ESG performance leads to lower credit risk and financial instability, except for carbon emissions and water use. This implies that the other important factor in a better credit rating is strong ESG practices [34].
In the case of Europe, the European Commission's promise to include ESG parameters within the financial system has given particular importance to governance in mediating the effects of traditional financial indicators on credit ratings, even though the effect is relatively slight [35]. A study that compared the companies in South Korea listed in Kospi and Kosdaq indicated that there is a tendency for those companies with active ESG practices to receive better credit ratings; however, this tendency is more pronounced among larger, more profitable firms listed in Kospi [29]. The introduction of artificial intelligence into credit rating assessments has only emphasized the importance of ESG factors for improving credit models' accuracy, fairness, and explainability [36,37]. CRA continues to use AI techniques in their operational processes; by integrating the approach into credit analysis, mainly CRAs such as KBRA offer to add value to the CRA realization that good governance results and positive impacts on social and environmental issues will likely keep entities with stronger credit profiles [24,31,38]. In China, better ESG scoring was directly linked with enhanced accounting performance, which led to a further increase in credit scores due to operational efficiency and stakeholder trust [31]. Further, the impact of foreign ownership through interaction with ESG ratings substantially increases credit scores. This means that good ESG management practices alongside foreign investments decrease companies' risk and increase the chances of lending by companies [34,39]. These appraisals, based on the banks' environmental score, have shown that more significance is attached to outward signals of commitment to the cause of climate action than to previous behaviors concerning the determination of the ESG ratings. An indication is for a move towards more transparent disclosure of financing activities across carbon-intensive and low-carbon industries to reflect true environmental performance better [40,41]. These findings show the multiple dimensions of the impact of ESG scores on credit ratings in various regions and sectors and the growing relevance of sustainable practices for global financial assessments.
3. Data
The entire dataset was retrieved by Refinitiv, Reuters, consistent with other datasets [42,43]. A higher number in any ESG score or sub-score means better performance in any ESG factor. There are 16 ESG scores overall. These scores include: 2 overall (combined and total) ESG scores; 4 scores for the respective pillars (Environment, Social, and Governance) with Controversies score as well; 3 sub-scores for the Environmental pillar (resource use, emissions, and innovation); 4 sub-scores for the Social pillar (workforce, human rights, community, and product responsibility); and, three sub-scores for the Governance pillar (management, shareholders, and CSR strategy). Credit ratings are the ones that the Refinitiv database has [44]. The start and end dates are January 21, 2013, and January 19, 2023. The final number of companies used in the sample, and for completeness purposes, was 188; 136 were from non-European countries (also non-USA), and 52 were from Europe. Half of them are companies with ESG scores (in the entire sample period), and the other half are companies without consistent ESG scores (for the entire sample period). Most European countries have most of their companies complying with ESG (in the entire sample period), whereas the opposite happens for non-European countries. This is followed by the number of companies with and without ESG for Europe and non-Europe in the sample. The number of companies with and without ESG is, in most countries, equal. Data was also split into 20 sectors, the sectors with the highest liquidity across all countries in the sample. Each sector has an equal number of companies with and without ESG. Table 1 describes the data. We can see the importance of each sector in the sample, via the number of companies included. The most important sectors are “Pharmaceuticals” and “Real Estate Rental, Development & Operations”. Least important seem “Construction & Engineering”, “Gold”, and “Online services”.
4. Methodology
[45] tried different models for assessing the relation between CSR and credit risk. Following this paper, we use an ordered probit model for examining the impact of ESG ratings in credit ratings, where the dependent variable is credit ratings and independent is the various ESG scores. The model selection concerns the ordinal scale measurement of credit ratings. Both OLS and probit models are ordered methods; incorporating that ratings are ranked. A problem of the OLS, is that considers ratings as an interval scale in which there is an equal scaling among all rating classes. However, the probit model addresses this scaling problem. Nevertheless, both models assume that explanatory variables may influence the dependent evenly across all values of credit ratings. Moreover, the probit model cannot be used for forecasting ratings; as, it assumes a point-in-time perspective instead of the through-the-cycle approach (Amato and Furfine, 2004).
where
Cri,t is the credit rating, ESGi,t is any of the 16 ESG scores, and Xi,t are the control variables; for each company (or industry) i. Control variables are: leverage (total liabilities to total assets ratio), size (natural logarithm of total assets), profitability (operating income divided by total assets), sales growth (growth rate of sales), and dividend yield (dividend per share divided by share price). There are multiple multicollinearity issues because ESG and X variables have different information sets concerning non-financial and financial information, respectively. There should be no endogeneity as the frequency of analysis (annual) does not impose such issues.
5. Empirical Findings
5.1. Descriptive Analysis
We begin by examining the descriptive statistics for credit ratings and ESG scores between Europe and non-Europe, which are presented in Table 2A in (Appendix A1). The average credit rating is slightly higher in Europe (0.0011) than in non-Europe (-0.0074), suggesting a more favorable perception of creditworthiness in European companies. Additionally, the average ESG Combined Score is higher in Europe (66.61) than in non-Europe (61.48), indicating better ESG performance among European companies.
Table 2B-1 displays the average values of credit ratings and ESG scores across different sectors. The Basic Materials sector has one of the highest ESG Combined Scores (68.28), indicating strong ESG performance. In contrast, the Financial Services sector has the lowest ESG Combined Score (56.47). The health care sector demonstrates high scores in the Social Pillar Score (89.06) and Governance Pillar Score (75.07), indicating strong performance in these areas. Credit ratings vary significantly across sectors, with Energy showing positive average ratings (0.000652) and Financial Services showing negative average ratings (-0.0088).
Table 2B-2 shows the standard deviation of credit ratings and ESG scores across sectors. The standard deviation of ESG Combined Scores is highest in the Financial Services sector (19.11), indicating a wide range of ESG performance within this sector. In contrast, the Real Estate sector displays the lowest standard deviation (11.79), suggesting more uniform ESG performance. The standard deviation of credit ratings also varies, with the highest observed in the Energy sector (0.3204), indicating more dispersion in credit ratings.
Table 2B-3 provides the median values of credit ratings and ESG scores across sectors. Median values often align closely with averages, but the Real Estate sector stands out with a high median ESG Combined Score (75.00), indicating that more than half of the companies in this sector have strong ESG performance. Similarly, high medians in the Social Pillar Score for sectors like Health Care (100.00) reflect the sector’s focus on social responsibility.
Table 2B-4 indicates the skewness of credit ratings and ESG scores, which helps understand the asymmetry in the data distribution. Positive skewness in Emissions scores in the Energy sector (0.7599) suggests that more companies have lower emissions scores, with fewer companies having very high scores. Negative skewness in the Governance Pillar Score for Basic Materials (-2.1585) indicates that many companies have high governance scores, with fewer companies performing poorly.
Table 2B-5 presents kurtosis values. The high kurtosis value of 10.75 for Utilities credit ratings implies a distribution with a significant peak, indicating that a larger number of companies have ratings close to the average, while fewer companies have extreme values. Conversely, the lower kurtosis value of 1.68 for the Environmental Pillar Score in the Technology sector suggests a flatter distribution, which implies a broader range of values around the mean.
The descriptive statistics show considerable variability in the relationship between ESG scores and credit ratings across different regions and sectors. European companies generally exhibit higher average ESG scores and credit ratings, with less variability compared to non-European companies (see tables 2A, 2B-1, 2B-2, 2B-3, 2B-4, and 2B-5). Sectoral analysis reveals that sectors, such as Health Care and Basic Materials, perform better in ESG metrics, while others, like Financial Services, exhibit more variability and lower average scores. These disparities emphasize the need to consider regional and sector-specific contexts when evaluating ESG performance and its effect on credit ratings.
5.2. Correlation Analysis
This section presents the pairwise correlations between credit ratings and various ESG scores and control variables for European and non-European companies (Table 3). In Europe, the correlations between credit ratings and ESG scores are generally weak and mostly negative. The ESG Combined Score displays a very weak negative correlation of -0.0116, while the ESG Score has a negligible positive correlation of 0.0010. The Resource Use score shows a slight positive correlation of 0.0144 among the environmental scores, while Emissions is weakly negative at -0.0106. Social Pillar Scores, including Human Rights (-0.0472) and Community (-0.0228), exhibit weak negative correlations with credit ratings. The Governance Pillar Score and Management show almost no correlation with values of -0.00039 and 0.00049, respectively. Control variables such as Leverage (-0.0070), Size (-0.000625), and Profitability (-0.0319) also show weak correlations, suggesting a limited impact on credit ratings in Europe.
In non-European regions, the correlations are similarly weak but slightly more negative overall. The ESG Combined Score negatively correlates -0.0419 with credit ratings, while the ESG Score shows -0.0301. Environmental Pillar Scores like Resource Use and Emissions have weak negative correlations of -0.0050 and -0.0096, respectively. Social scores such as the Social Pillar Score and Human Rights display weak negative correlations of -0.0247 and -0.0351. The Governance Pillar Score and Management show weak negative correlations of -0.0477 and -0.0642, respectively. Among the control variables, Leverage (0.0205) and Sales Growth (0.0057) show weak positive correlations, whereas Size (-0.0237) and Profitability (-0.0135) show weak negative correlations.
As displayed in Table 4A, the pairwise correlations between credit ratings and ESG scores across different sectors are presented. In the Basic Materials sector, the ESG Combined and ESG Score exhibit weak negative correlations of -0.0837 and -0.0564, respectively. Additionally, the Environmental Pillar Score (0.0763) and Resource Use (0.0232) demonstrate a positive correlation, while Human Rights (-0.0496) and Governance Pillar Score (-0.1150) show weak negative correlations. The Communication Services sector reveals weak correlations with ESG scores, with the ESG Combined Score at 0.000098 and the ESG Score at 0.0254. Furthermore, Workforce (-0.1029) and Social Pillar Score (-0.0803) exhibit weak negative correlations, while Innovation (0.0582) displays a positive correlation.
In the Consumer Cyclical sector, the ESG Combined Score stands at -0.0188, and the ESG Score is 0.0341, demonstrating generally weak correlations. Social scores, such as Workforce (-0.1001), show a weak negative correlation. The ESG Combined Score (0.0443) and ESG Score (-0.0119) exhibit weak correlations in the Consumer Defensive sector. The Social Pillar Score (0.0224) and Workforce (-0.0489) reveal weak correlations, indicating minimal impact on credit ratings. In the Energy sector, the ESG Combined Score (0.0188) and ESG Score (0.0403) present weak positive correlations, while Human Rights (-0.0462) and Shareholders (-0.1623) show negative correlations. Also, the Financial Services sector exhibits weak negative correlations for the ESG Combined Score (-0.0338) and ESG Score (-0.0088), with governance scores such as Shareholders (-0.0467) and Management (0.0053) displaying varying correlations.
On the other hand, the healthcare industry shows a negative correlation in the ESG Combined Score (-0.1173) and a positive correlation in emissions (0.0921). Human Rights (-0.0369) and Management (-0.0365) exhibit weak negative correlations. The industrial sector displays weak negative correlations for the ESG Combined Score (-0.0378) and the ESG Score (-0.0266). Innovation (0.0112) and Shareholders (0.0029) exhibit positive correlations. The Real Estate sector shows positive correlations in the ESG Combined Score (0.0070) and ESG Score (0.1223). In the Technology sector, the ESG Combined Score (-0.0634) and ESG Score (-0.1163) display weak negative correlations, while Management (-0.0351) and Shareholders (-0.0687) exhibit negative correlations. The Utilities sector reveals weak positive correlations in the ESG Combined Score (0.0189) and ESG Score (0.0630), and negative correlations in the Governance Pillar Score (-0.1359) and Management (-0.1647).
Table 4B shows the correlations between credit ratings and control variables across different sectors. The Basic Materials sector exhibits weak positive correlations for Leverage (0.0078) and Profitability (0.0183), while Dividend Yield (-0.0712) shows a negative correlation. The Communication Services sector displays weak negative correlations for Leverage (-0.0268) and Sales Growth (-0.0529), while Size (0.0158) and Dividend Yield (0.0692) exhibit weak positive correlations. In the Consumer Cyclical sector, Leverage (0.1078) shows a positive correlation, while Profitability (-0.0382) and Size (-0.0485) exhibit negative correlations. The Consumer Defensive sector displays weak negative correlations for Leverage (-0.0399) and Size (-0.0075), while Profitability (0.0504) and Dividend Yield (0.0147) exhibit positive correlations. The Energy sector exhibits a positive correlation for Leverage (0.1189), while Size (-0.0532) and Profitability (-0.1447) show negative correlations. The Financial Services sector shows weak positive correlations for Leverage (0.0146) and Size (0.0485), while Profitability (-0.0589) exhibits a weak negative correlation. The Health Care Sector displays a weak positive correlation for leverage (0.0250), while size (-0.0688) and profitability (-0.0337) have weak negative correlations. The Industrials sector exhibits weak positive correlations for Leverage (0.0200) and Size (0.0290), while Profitability (-0.0082) and Sales Growth (-0.0017) show weak negative correlations. The Real Estate sector shows weak negative correlations for Leverage (-0.0056) and Size (-0.0693) while Dividend Yield (0.10.
The examination of the correlation between credit ratings and ESG scores/control variables across Tables 3, 4A, and 4B indicates that the associations between these factors vary by region and sector. In Europe, the correlations are generally feeble and predominantly negative, while non-European regions exhibit somewhat stronger negative correlations. A detailed analysis of the sectors demonstrates that the Basic Materials and Technology sectors display more pronounced negative correlations with specific ESG scores. On the other hand, the Utilities sector displays significant positive correlations for certain control variables. This variability emphasizes considering regional and sectoral contexts when evaluating the influence of ESG factors and control variables on credit ratings.
5.3. Granger Causality
The probability values from the Granger causality test, which examines whether ESG (Environmental, Social, and Governance) scores and control variables have predictive power for credit ratings in European and non-European regions, are shown in Table 5. The analysis indicates that the ESG combined score shows a probability value of 0.6171 for Europe, suggesting no significant Granger causality. However, in non-European regions, the probability value is 0.0633, indicating a weak significance at the 10% level, implying that the ESG combined score can weakly predict credit ratings outside Europe. The Governance Pillar Score has a probability value of 0.0175 in Europe, indicating significance at the 5% level, whereas in non-European regions, the probability value is 0.4769, indicating no significant Granger causality. The Management score has a probability value of 0.0601 in Europe, indicating a weak significance at the 10% level, while in non-European regions, the probability value is 0.3587, showing no significant relationship. The Shareholders' score in Europe has a probability value of 0.035, indicating significance at the 5% level, whereas in non-European regions, the probability value is 0.8298, showing no significant relationship. The Controversies score has a probability value of 0.5361 in Europe, indicating no significant relationship, while in non-European regions, the probability value is 0.0844, showing weak significance at the 10% level. The control variables (Leverage, Size, Profitability, Sales Growth, and Dividend yield) do not exhibit significant Granger causality in either region, as all their probability values are above conventional significance levels (0.05 or 0.10.
The study suggests that governance-related ESG scores, specifically the Governance Pillar Score and Shareholders, have a significant impact on European credit ratings. In contrast, the ESG combined score and controversies show weak significance in non-European countries. This implies that regional differences exist in how ESG factors affect credit ratings, emphasizing the need for tailored approaches when incorporating ESG factors into credit risk assessments. Table 6 also presents the probability values from the Granger causality test, which evaluates whether various ESG scores and control variables can predict credit ratings across different sectors. The analysis of the ESG Combined Score reveals that across all sectors, the probability values are above conventional significance levels, indicating no significant Granger causality of the ESG combined score on credit ratings in any sector. The ESG Score shows a weak significance at the 10% level in the Health Care sector, implying that the ESG score can weakly predict credit ratings in this sector. All sectors have probability values above significance levels for the Environmental Pillar Score, indicating no significant Granger causality. Regarding Resource Use, the Communication Services and Financial Services sectors show no significant relationship, with values of 0.6606 and 0.5101, respectively. The Health Care sector has a slightly more substantial but still insignificant relationship with a value of 0.4290.
The Emissions score serves as a significant predictor of credit ratings in the Health Care sector, exhibiting strong Granger causality at the 5% level. For Innovation, all sectors display varying degrees of insignificance, with values above 0.05, indicating no significant Granger causality across sectors.
The Social Pillar Score generally shows insignificant relationships across sectors, with all values above significance thresholds. Human Rights scores indicate no significant relationship across sectors, with the Financial Services, Industrials, and Health Care sectors displaying values of 0.3377, 0.6511, and 0.5254, respectively. The Community score has no significant Granger causality in any sector, with all values above significance levels. Similarly, Product Responsibility and Governance Pillar Scores display no significant relationship across sectors.
Management scores significantly predict credit ratings in the Communication Services sector, with a value of 0.0412, indicating strong Granger causality at the 5% level. Additionally, the Shareholders score is significant at the 5% level in the Communication Services sector with a value of 0.0442, and the Energy sector shows weak significance at the 10% level with a value of 0.0599.
CSR Strategy scores display no significant Granger causality across sectors. Controversy scores significantly predict credit ratings in the Consumer Defensive sector, with a value of 0.0061, indicating strong Granger causality at the 5% level. Furthermore, the Financial Services and industrial sectors show weak significance with values of 0.0339 and 0.0476, respectively. The control variables (Leverage, Size, Profitability, Sales Growth, and Dividend yield) generally display no significant Granger causality across most sectors, with values typically above conventional significance levels.
The evaluation presented previously suggests that emissions scores serve as important indicators for the Health Care industry, while management and shareholder scores have considerable predictive ability for credit ratings in the Communication Services sector. Controversy scores significantly impact credit ratings in the Consumer Defensive sector, demonstrating the diverse influence of ESG factors across different industries. This emphasizes the necessity of tailoring ESG considerations to specific sectors when assessing their impact on credit ratings.
5.4. Regression Output
Table 7 provides the regression coefficients for ESG scores and control variables that explain credit ratings, differentiating between European and non-European regions. In European regions, the ESG Combined and ESG Score coefficients are negative and significant, indicating that higher ESG scores are associated with lower credit ratings. Specifically, the ESG Combined Score has a coefficient of -1.22E-04**, and the ESG Score has a coefficient of -9.82E-05*\*. This suggests that higher overall ESG scores in Europe might negatively impact credit ratings. The Human Rights score is particularly notable, with a significant coefficient of -1.26E-04**, implying a strong negative relationship with credit ratings. Other significant factors include the Social Pillar Score (-9.03E-05*), Workforce (-8.26E-05*), and Management (-1.14E-04**), all showing negative relationships. The Governance Pillar Score also has a significant negative coefficient of -9.97E-05*. The control variable Size shows a significant negative coefficient of -0.0065*, indicating that larger firms tend to have lower credit ratings in Europe.
On the other hand, for non-European regions, the ESG Combined Score and the ESG Score both show positive but insignificant coefficients, suggesting no strong relationship with credit ratings. Resource Use and Shareholders have positive and significant coefficients (1.72E-05** and 2.08E-05**, respectively), indicating that better resource use and shareholder practices positively impact credit ratings. Human Rights, however, has a significant negative coefficient of -2.25E-05**, indicating a negative relationship. Profitability and Sales Growth also show significant negative relationships with credit ratings, with coefficients of -0.0010** and -9.00E-05**, respectively. The findings indicate that the model demonstrates a relatively higher fit for non-European regions, with the R-squared values suggesting that it explains 20.24% of the variance in credit ratings, as compared to 15.79% in Europe.
The regression analysis suggests that, in Europe, higher ESG scores generally have a negative impact on credit ratings. On the other hand, in non-European regions, specific ESG metrics, such as Resource Use and Shareholders, demonstrate positive impacts.
Table 8 provides a detailed breakdown of the regression coefficients for ESG scores and control variables, explaining credit ratings across various sectors. In the Basic Materials sector, the coefficients for ESG scores are generally positive but insignificant, indicating no strong relationship with credit ratings. Conversely, the Communication Services sector shows negative coefficients for the ESG Combined Score and other ESG metrics, with the Social Pillar Score having a significant negative coefficient of -4.85E-04**, suggesting that higher social performance negatively impacts credit ratings in this sector.
The Consumer Cyclical sector exhibits a significant negative coefficient for the ESG Combined Score (-7.95E-05*), indicating a negative relationship with credit ratings. The Consumer Defensive sector also shows significant negative coefficients for several ESG metrics, such as the Social Pillar Score (-8.49E-05**) and Governance Pillar Score (-9.06E-05**), indicating negative impacts on credit ratings.
The impact of environmental, social, and governance (ESG) factors on credit ratings varies significantly across different sectors, as demonstrated by the results of this analysis. The Energy sector has a positive relationship between the Human Rights score and credit ratings (1.01E-04*). Conversely, the Financial Services sector exhibits negative relationships for various ESG metrics, including the Social Pillar Score (-2.06E-04**) and Product Responsibility (-2.42E-04**).
In the Health Care sector, the ESG Combined Score (-8.36E-05**) and other ESG metrics have significant negative coefficients, indicating negative impacts on credit ratings. The Industrials sector does not show significant relationships for most ESG scores. Furthermore, the Real Estate sector shows significant negative coefficients for various ESG scores, particularly the Management score (-2.51E-04**). The Technology sector has significant negative relationships for several ESG scores, such as the Human Rights score (-1.20E-04*). Finally, the Utilities sector demonstrates significant positive coefficients for some ESG scores, indicating positive impacts on credit ratings.
The R-squared values differ significantly across sectors, with the Utilities sector having the highest R-squared value of 0.6262, suggesting that the model explains a substantial portion of the variance in credit ratings for this sector.
These results emphasize the importance of considering regional and sectoral contexts when assessing the impact of ESG factors on credit ratings. The findings indicate that some sectors show significant negative relationships between ESG scores and credit ratings, while others exhibit positive or insignificant relationships.
5. Conclusions
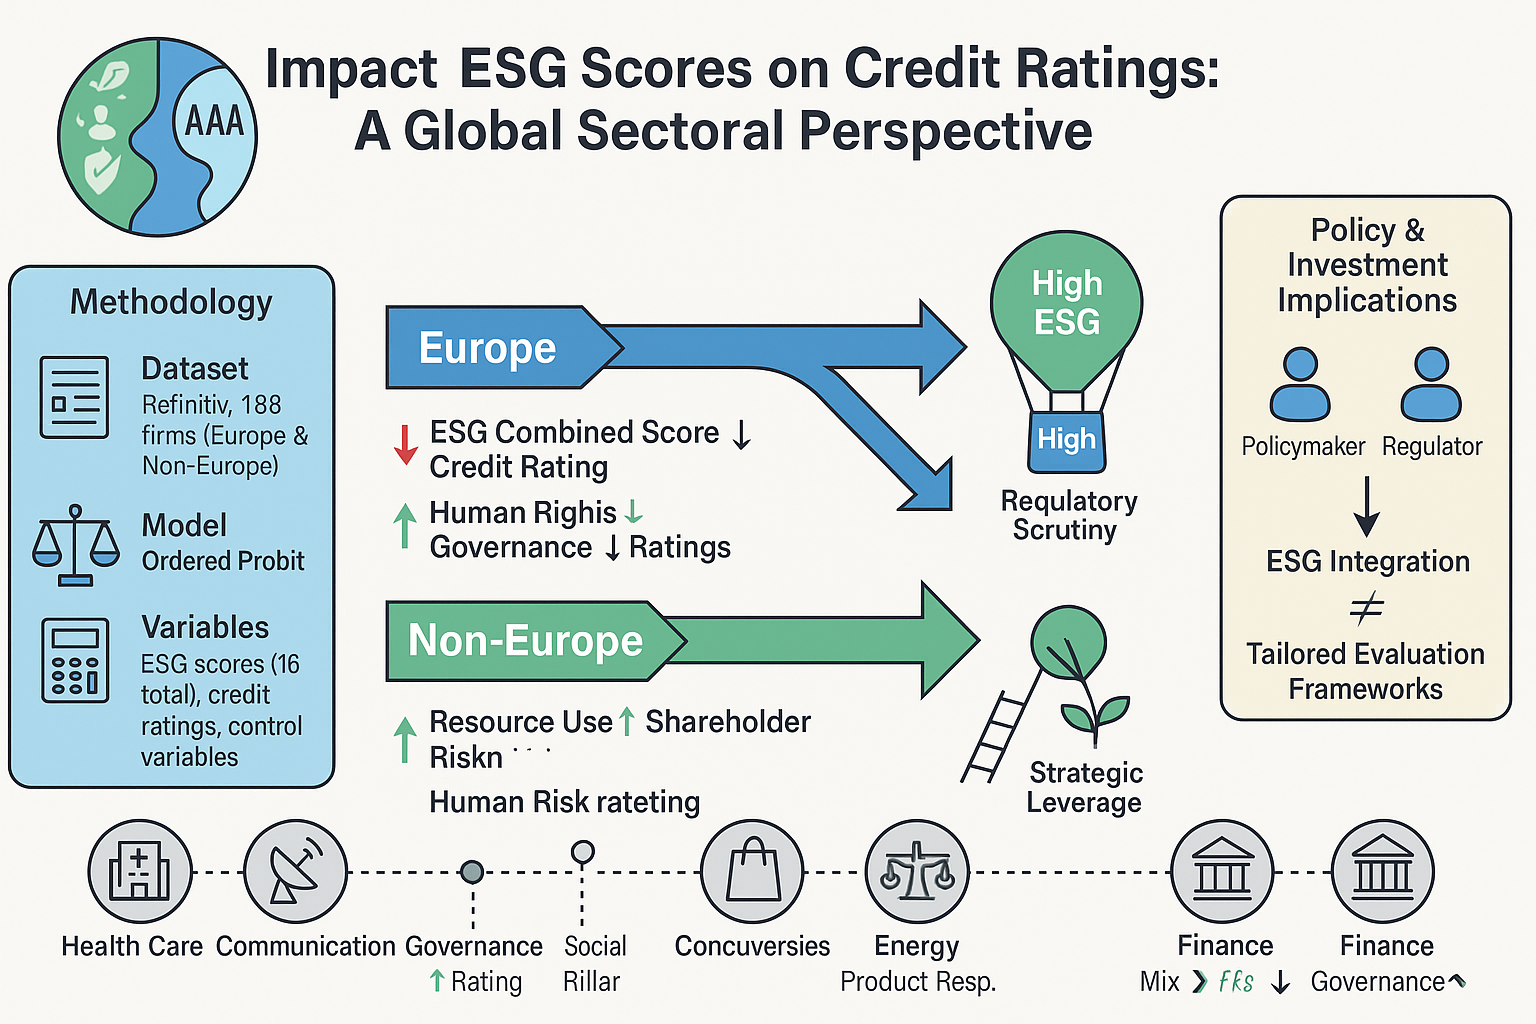
The formal tone analysis of this paper demonstrates the substantial effect of ESG scores on credit ratings across diverse geographical regions and sectors. Our results indicate that the relationship between ESG factors and credit ratings is intricate and varies considerably between European and non-European regions and among different industry sectors.
In European regions, the analysis unveils that higher ESG scores usually correspond to lower credit ratings, particularly for combined ESG scores and specific components such as the Human Rights and Governance Pillar scores. This suggests a potential risk aversion or heightened scrutiny by credit rating agencies towards higher ESG-rated entities, possibly due to stringent regulatory environments or greater stakeholder expectations regarding sustainability practices.
Conversely, specific ESG metrics like Resource Use and Shareholder engagement exhibit a positive relationship with credit ratings in non-European regions. This indicates that credit rating agencies favor better resource management and shareholder engagement in these regions, enhancing firms' creditworthiness. The significant negative coefficients for Human Rights in non-Europe suggest that poor performance in this area can negatively impact credit ratings, highlighting regional differences in the prioritization of ESG components.
The sectoral analysis further emphasizes the diversity of ESG impacts. For instance, the Health Care sector exhibits considerable negative coefficients for emissions scores, indicating that improved environmental performance may positively influence credit ratings. Management and shareholder scores are significant predictors of credit ratings in the Communication Services sector, emphasizing the importance of governance practices. The Consumer Defensive sector's credit ratings are conspicuously influenced by controversy scores, suggesting that public perception and controversy management are crucial in this sector.
These findings suggest that incorporating ESG factors into credit rating assessments requires a nuanced approach, considering regional and sectoral contexts. Policymakers, regulators, and investors must be mindful of these differences when developing strategies and making decisions based on credit ratings. The substantial influence of specific ESG scores on credit ratings implies that firms must strategically manage their ESG performance to enhance their creditworthiness, tailored to the expectations and priorities of their respective regions and sectors.
Future research may explore the role of stakeholder pressure, including investors, customers, and advocacy groups, on the relationship between ESG scores and credit ratings. Investigating how external pressures shape corporate ESG practices and their subsequent credit ratings can inform corporate strategy and policy decisions.
Author Contributions
Conceptualization, I.P. and D.V.; methodology, D.V.; software, D.V. and D.V.; validation, I.P., A.G. and C.L.; formal analysis, C.L.; investigation, I.P and A.G..; resources, D.V.; data curation, D.V and D.V.; writing—original draft preparation, I.P.; writing—review and editing, I.P.; visualization, A.G.; supervision, I.P.; project administration, I.P and A.G.; funding acquisition, C.L. All authors have read and agreed to the published version of the manuscript.
Funding
This research received no external funding.
Informed Consent Statement
Not applicable.
Conflicts of Interest
The authors declare no conflicts of interest.
Appendix A
Appendix A.1

Table A1.
Data description.
| Total | |
| Companies | 198 |
| Regions | |
| Europe | 100 |
| Non-Europe | 98 |
| Countries | |
| Sweden | 21 |
| Switzerland | 14 |
| UK | 65 |
| USA | 98 |
| Sectors | |
| Basic materials | 17 |
| Communication Services | 12 |
| Consumer Cyclical | 22 |
| Consumer Defensive | 27 |
| Energy | 6 |
| Financial Services | 17 |
| Health Care | 23 |
| Industrials | 37 |
| Real Estate | 4 |
| Technology | 13 |
| Utilities | 20 |
Notes. All companies had a continuous publicly available stream of information about ESGs, credit ratings and control variables; within the sample period.
Table A2.
Descriptive statistics (Europe Vs. non-Europe).
| Average | Std. deviation | Median | Skewness | Kurtosis | Jarque-Bera (Stat.) | |||||||
| Europe | non-Europe | Europe | non-Europe | Europe | non-Europe | Europe | non-Europe | Europe | non-Europe | Europe | non-Europe | |
| Credit ratings | 0.0011 | -0.0074 | 0.1228 | 0.1682 | 2.71E-16 | 2.98E-16 | -0.5738 | -1.36 | 4.79 | 12.51 | 182.27** | 3,202** |
| ESG scores | ||||||||||||
| ESG Combined Score | 66.61 | 61.48 | 16.76 | 16.21 | 66.67 | 58.33 | -0.34 | -0.11 | 2.46 | 2.23 | 30.63** | 21.24** |
| ESG Score | 71.58 | 68.57 | 17.19 | 15.68 | 75.00 | 75.00 | -0.64 | -0.65 | 2.86 | 2.87 | 66.65** | 56.33** |
| Environmental Pillar Score | 69.95 | 64.45 | 23.47 | 23.64 | 75.00 | 75.00 | -0.71 | -0.89 | 2.53 | 2.93 | 91.40** | 104.73** |
| Resource Use | 77.26 | 71.48 | 26.45 | 28.27 | 83.33 | 83.33 | -1.11 | -0.91 | 3.22 | 2.75 | 200.97** | 110.67** |
| Emissions | 75.74 | 70.57 | 23.93 | 26.00 | 83.33 | 75.00 | -1.00 | -0.86 | 3.14 | 2.91 | 162.28** | 97.53** |
| Innovation | 50.90 | 42.00 | 33.88 | 30.99 | 50.00 | 33.33 | -0.01 | 0.37 | 1.44 | 1.71 | 98.36** | 72.05** |
| Social Pillar Score | 74.52 | 71.20 | 19.30 | 18.85 | 75.00 | 75.00 | -0.80 | -0.56 | 3.03 | 2.48 | 103.94** | 49.80** |
| Workforce | 83.84 | 75.24 | 16.72 | 21.35 | 91.67 | 83.33 | -1.09 | -0.73 | 3.80 | 2.76 | 219.89** | 71.79** |
| Human Rights | 69.44 | 56.51 | 30.96 | 32.56 | 83.33 | 66.67 | -0.81 | -0.32 | 2.34 | 1.70 | 124.87** | 68.96** |
| Community | 73.42 | 87.00 | 26.55 | 14.74 | 83.33 | 91.67 | -0.80 | -1.21 | 2.40 | 3.98 | 118.60** | 222.29** |
| Product Responsibility | 66.90 | 66.16 | 29.86 | 26.20 | 75.00 | 75.00 | -0.58 | -0.41 | 2.09 | 1.98 | 87.12** | 56.45** |
| Governance Pillar Score | 69.47 | 67.90 | 20.15 | 19.02 | 75.00 | 66.67 | -0.59 | -0.50 | 2.70 | 2.45 | 59.44** | 42.34** |
| Management | 70.79 | 69.53 | 24.83 | 24.96 | 75.00 | 75.00 | -0.63 | -0.52 | 2.40 | 2.27 | 77.80** | 52.10** |
| Shareholders | 62.21 | 62.47 | 28.04 | 24.35 | 66.67 | 66.67 | -0.30 | -0.30 | 1.85 | 2.16 | 67.91** | 34.82** |
| CSR Strategy | 73.96 | 67.69 | 23.96 | 31.95 | 83.33 | 75.00 | -0.99 | -0.73 | 3.22 | 2.16 | 161.20** | 93.05** |
| Controversies | 83.08 | 75.39 | 28.54 | 32.59 | 100.00 | 100.00 | -1.52 | -0.98 | 3.83 | 2.37 | 402.35** | 138.93** |
| Control variables | ||||||||||||
| Leverage | 4.79 | 5.71 | 18.06 | 35.86 | 2.38 | 2.80 | 10.96 | 26.56 | 130.91 | 728.80 | 681,379** | 17,322,746** |
| Size | 0.81 | 0.88 | 0.54 | 0.78 | 0.71 | 0.64 | 1.88 | 3.06 | 9.90 | 14.46 | 2,499** | 5,515** |
| Profitability | 1.29 | 1.16 | 2.65 | 0.70 | 0.95 | 1.05 | 18.41 | 1.85 | 414.63 | 8.11 | 6,910,033** | 1,303** |
| Sales growth | 9.01 | 15.84 | 12.82 | 25.25 | 5.50 | 7.30 | 7.29 | 3.73 | 84.40 | 20.02 | 276,704** | 11,294** |
| Dividend yield | 0.48 | 0.46 | 0.24 | 0.22 | 0.47 | 0.44 | 0.10 | 0.06 | 2.26 | 2.11 | 24.03** | 26.67** |
Notes. Values concern all companies for each sector. ** and * indicate statistical significance at a 5% and 10% level.
Table A3.
B-1. Averages per sector.
| Basic materials | Communication Services | Consumer Cyclical | Consumer Defensive | Energy | Financial Services | Health Care | Industrials | Real Estate | Technology | Utilities | |
| Credit ratings | 0.0057 | -0.0020 | -0.0045 | -0.0069 | 6.52E-04 | -0.0088 | -0.0027 | 2.55E-04 | -0.0104 | -0.0053 | 1.96E-04 |
| ESG scores | |||||||||||
| ESG Combined Score | 68.28 | 68.89 | 62.99 | 67.82 | 62.08 | 56.47 | 65.54 | 68.09 | 75.00 | 62.82 | 58.33 |
| ESG Score | 73.82 | 67.22 | 65.87 | 70.51 | 70.42 | 53.24 | 73.66 | 69.19 | 79.61 | 62.56 | 69.17 |
| Environmental Pillar Score | 82.70 | 74.17 | 74.32 | 77.34 | 84.17 | 53.44 | 78.66 | 69.89 | 90.79 | 64.42 | 56.39 |
| Resource Use | 79.85 | 65.35 | 69.02 | 75.37 | 74.72 | 47.38 | 69.93 | 64.44 | 88.16 | 51.86 | 52.22 |
| Emissions | 55.05 | 44.72 | 46.02 | 54.62 | 53.75 | 35.88 | 30.83 | 51.44 | 78.51 | 39.49 | 36.94 |
| Innovation | 84.46 | 77.64 | 78.79 | 80.02 | 78.61 | 42.56 | 81.67 | 72.77 | 87.72 | 61.54 | 62.50 |
| Social Pillar Score | 79.41 | 73.33 | 72.65 | 81.30 | 88.61 | 66.05 | 89.06 | 82.18 | 75.00 | 81.09 | 66.67 |
| Workforce | 77.70 | 63.61 | 70.80 | 73.81 | 58.47 | 29.82 | 68.41 | 60.92 | 54.39 | 54.87 | 35.56 |
| Human Rights | 66.72 | 72.15 | 64.58 | 76.09 | 62.22 | 45.11 | 78.84 | 65.59 | 66.67 | 49.68 | 59.44 |
| Community | 77.50 | 72.71 | 71.44 | 77.97 | 72.78 | 56.27 | 80.83 | 72.75 | 78.29 | 65.90 | 53.06 |
| Product Responsibility | 79.85 | 82.64 | 81.10 | 79.90 | 85.14 | 65.84 | 86.63 | 81.98 | 95.18 | 71.03 | 54.17 |
| Governance Pillar Score | 85.34 | 74.65 | 71.36 | 79.65 | 84.58 | 45.04 | 75.07 | 65.56 | 88.16 | 51.28 | 81.67 |
| Management | 75.34 | 70.21 | 62.77 | 72.13 | 85.69 | 59.37 | 71.96 | 67.73 | 67.11 | 59.87 | 73.06 |
| Shareholders | 77.16 | 73.68 | 64.05 | 74.59 | 87.78 | 64.19 | 72.61 | 67.73 | 60.75 | 62.69 | 70.28 |
| CSR Strategy | 62.65 | 56.11 | 53.94 | 60.11 | 75.56 | 50.90 | 66.20 | 69.05 | 76.10 | 57.37 | 77.78 |
| Controversies | 86.86 | 79.17 | 79.36 | 70.91 | 58.33 | 91.39 | 68.44 | 86.44 | 100.00 | 80.13 | 90.83 |
| Control variables | |||||||||||
| Leverage | 2.43 | 4.26 | 4.23 | 5.26 | 3.10 | 16.74 | 3.05 | 6.55 | 1.73 | 3.15 | 2.04 |
| Size | 0.80 | 0.76 | 1.18 | 1.29 | 0.86 | 0.43 | 0.51 | 0.82 | 0.22 | 0.61 | 1.10 |
| Profitability | 1.27 | 1.07 | 0.95 | 0.70 | 1.03 | 2.92 | 1.26 | 1.17 | 1.14 | 1.59 | 1.47 |
| Sales growth | 7.15 | 5.57 | 24.07 | 21.34 | 8.77 | 9.11 | 5.47 | 7.18 | 7.02 | 11.47 | 33.47 |
| Dividend yield | 0.34 | 0.54 | 0.41 | 0.40 | 0.35 | 0.51 | 0.61 | 0.46 | 0.69 | 0.64 | 0.28 |
Notes. Values concern all companies for each sector.
Table A4.
B-2. Std. deviations per sector.
| Basic materials | Communication Services | Consumer Cyclical | Consumer Defensive | Energy | Financial Services | Health Care | Industrials | Real Estate | Technology | Utilities | |
| Credit ratings | 0.1339 | 0.1158 | 0.1719 | 0.1159 | 0.3204 | 0.1412 | 0.1062 | 0.1348 | 0.1627 | 0.1285 | 0.2116 |
| ESG scores | |||||||||||
| ESG Combined Score | 16.85 | 13.00 | 15.26 | 15.16 | 13.41 | 19.11 | 16.51 | 15.15 | 11.79 | 16.25 | 18.05 |
| ESG Score | 15.45 | 18.10 | 15.45 | 16.84 | 21.34 | 16.78 | 15.57 | 16.86 | 6.34 | 16.61 | 14.70 |
| Environmental Pillar Score | 17.74 | 22.62 | 20.09 | 21.10 | 18.07 | 26.21 | 24.38 | 25.14 | 8.17 | 35.81 | 27.04 |
| Resource Use | 14.24 | 19.74 | 19.69 | 21.63 | 16.23 | 25.37 | 22.55 | 23.78 | 9.42 | 27.30 | 28.28 |
| Emissions | 37.38 | 29.23 | 35.00 | 31.54 | 33.66 | 34.34 | 25.09 | 32.99 | 18.14 | 23.31 | 32.14 |
| Innovation | 15.67 | 23.79 | 21.12 | 23.63 | 21.61 | 31.31 | 25.10 | 26.83 | 16.30 | 36.05 | 33.60 |
| Social Pillar Score | 14.82 | 27.28 | 26.09 | 21.95 | 10.06 | 30.58 | 19.14 | 21.64 | 25.19 | 19.63 | 19.20 |
| Workforce | 25.94 | 25.97 | 29.40 | 26.59 | 34.67 | 28.23 | 27.72 | 33.31 | 32.00 | 37.87 | 32.31 |
| Human Rights | 25.68 | 29.02 | 27.59 | 24.57 | 31.91 | 25.34 | 24.21 | 27.36 | 35.99 | 24.03 | 34.72 |
| Community | 15.88 | 17.35 | 18.02 | 16.61 | 20.35 | 18.36 | 19.03 | 17.53 | 13.22 | 22.55 | 18.63 |
| Product Responsibility | 18.79 | 18.29 | 14.93 | 20.19 | 15.88 | 20.20 | 14.81 | 17.09 | 6.01 | 24.86 | 28.26 |
| Governance Pillar Score | 18.94 | 24.64 | 27.24 | 22.97 | 23.86 | 28.29 | 25.36 | 25.84 | 8.36 | 37.03 | 15.38 |
| Management | 18.89 | 16.19 | 19.90 | 17.76 | 11.07 | 19.88 | 18.02 | 19.36 | 19.27 | 22.44 | 18.66 |
| Shareholders | 22.10 | 22.32 | 24.15 | 22.22 | 15.15 | 25.68 | 23.82 | 26.16 | 27.53 | 28.21 | 26.41 |
| CSR Strategy | 25.63 | 27.05 | 27.98 | 26.67 | 19.22 | 26.65 | 26.97 | 22.41 | 17.02 | 28.95 | 13.90 |
| Controversies | 25.80 | 28.52 | 32.33 | 33.45 | 37.30 | 21.22 | 33.99 | 25.28 | 0.00 | 30.72 | 22.67 |
| Control variables | |||||||||||
| Leverage | 0.60 | 4.23 | 9.82 | 6.16 | 2.11 | 48.81 | 3.67 | 51.48 | 0.53 | 5.07 | 0.53 |
| Size | 0.36 | 0.83 | 0.54 | 1.08 | 0.80 | 0.37 | 0.15 | 0.33 | 0.35 | 0.29 | 0.65 |
| Profitability | 0.60 | 0.59 | 0.58 | 0.48 | 0.33 | 6.73 | 0.72 | 1.49 | 0.65 | 0.85 | 0.77 |
| Sales growth | 3.73 | 2.63 | 24.58 | 28.62 | 4.39 | 20.11 | 1.57 | 6.82 | 7.69 | 27.63 | 45.20 |
| Dividend yield | 0.14 | 0.19 | 0.21 | 0.18 | 0.24 | 0.30 | 0.17 | 0.23 | 0.11 | 0.21 | 0.03 |
Notes. Values concern all companies in each sector.
Table A5.
B-3. Median per sector.
| Basic materials | Communication Services | Consumer Cyclical | Consumer Defensive | Energy | Financial Services | Health Care | Industrials | Real Estate | Technology | Utilities | |
| Credit ratings | 4.13E-16 | 3.61E-16 | 1.77E-16 | 3.75E-16 | 0.075775 | 0 | 3.16E-16 | 1.67E-16 | 3.09E-16 | 3.4E-16 | 3.37E-16 |
| ESG scores | |||||||||||
| ESG Combined Score | 66.67 | 66.67 | 66.67 | 66.67 | 58.33 | 58.33 | 66.67 | 66.67 | 75.00 | 62.50 | 66.67 |
| ESG Score | 75.00 | 75.00 | 66.67 | 75.00 | 75.00 | 50.00 | 75.00 | 75.00 | 79.17 | 66.67 | 75.00 |
| Environmental Pillar Score | 83.33 | 75.00 | 75.00 | 83.33 | 91.67 | 58.33 | 83.33 | 75.00 | 91.67 | 75.00 | 50.00 |
| Resource Use | 83.33 | 66.67 | 75.00 | 83.33 | 75.00 | 50.00 | 75.00 | 66.67 | 91.67 | 58.33 | 50.00 |
| Emissions | 66.67 | 54.17 | 33.33 | 58.33 | 83.33 | 8.33 | 16.67 | 50.00 | 83.33 | 41.67 | 20.83 |
| Innovation | 83.33 | 83.33 | 83.33 | 91.67 | 83.33 | 41.67 | 91.67 | 75.00 | 91.67 | 66.67 | 75.00 |
| Social Pillar Score | 83.33 | 83.33 | 83.33 | 91.67 | 91.67 | 75.00 | 100.00 | 91.67 | 83.33 | 83.33 | 66.67 |
| Workforce | 83.33 | 66.67 | 83.33 | 83.33 | 66.67 | 8.33 | 75.00 | 66.67 | 58.33 | 66.67 | 16.67 |
| Human Rights | 75.00 | 83.33 | 66.67 | 83.33 | 75.00 | 41.67 | 83.33 | 70.83 | 91.67 | 41.67 | 62.50 |
| Community | 83.33 | 75.00 | 75.00 | 83.33 | 75.00 | 58.33 | 91.67 | 75.00 | 75.00 | 75.00 | 50.00 |
| Product Responsibility | 83.33 | 91.67 | 83.33 | 83.33 | 91.67 | 66.67 | 91.67 | 83.33 | 100.00 | 79.17 | 50.00 |
| Governance Pillar Score | 91.67 | 83.33 | 75.00 | 83.33 | 95.83 | 41.67 | 83.33 | 75.00 | 91.67 | 54.17 | 83.33 |
| Management | 83.33 | 75.00 | 66.67 | 75.00 | 83.33 | 58.33 | 75.00 | 66.67 | 66.67 | 66.67 | 75.00 |
| Shareholders | 83.33 | 75.00 | 66.67 | 75.00 | 91.67 | 66.67 | 75.00 | 70.83 | 58.33 | 66.67 | 70.83 |
| CSR Strategy | 58.33 | 58.33 | 50.00 | 66.67 | 75.00 | 50.00 | 75.00 | 75.00 | 79.17 | 58.33 | 75.00 |
| Controversies | 100.00 | 95.83 | 100.00 | 83.33 | 70.83 | 100.00 | 83.33 | 100.00 | 100.00 | 100.00 | 100.00 |
| Control variables | |||||||||||
| Leverage | 2.27 | 3.11 | 2.28 | 3.53 | 2.42 | 2.71 | 2.41 | 2.95 | 1.55 | 2.23 | 2.03 |
| Size | 0.81 | 0.50 | 1.14 | 0.94 | 0.47 | 0.38 | 0.50 | 0.83 | 0.05 | 0.53 | 1.24 |
| Profitability | 1.18 | 0.92 | 0.83 | 0.58 | 0.99 | 1.39 | 1.09 | 1.05 | 1.03 | 1.27 | 1.36 |
| Sales growth | 6.30 | 5.15 | 13.20 | 10.10 | 8.05 | 4.80 | 5.55 | 5.20 | 3.70 | 5.80 | 6.60 |
| Dividend yield | 0.37 | 0.57 | 0.34 | 0.42 | 0.31 | 0.56 | 0.68 | 0.42 | 0.70 | 0.63 | 0.27 |
Notes. Values concern all companies for each sector.
Table A6.
B-4. Skewness per sector.
| Basic materials | Communication Services | Consumer Cyclical | Consumer Defensive | Energy | Financial Services | Health Care | Industrials | Real Estate | Technology | Utilities | |
| Credit ratings | -0.3555 | -0.5573 | -1.1511 | -0.4064 | -1.4414 | -0.5376 | -0.2243 | -0.5138 | -1.7791 | -0.8530 | -2.2300 |
| ESG scores | |||||||||||
| ESG Combined Score | -0.6756 | -0.3956 | -0.4391 | -0.1950 | 0.4967 | -0.0037 | -0.2549 | -0.2564 | -0.8134 | 0.0774 | -0.4351 |
| ESG Score | -0.9335 | -1.1481 | -0.5320 | -0.3178 | -0.5097 | -0.1652 | -0.5065 | -0.3375 | 0.1941 | -0.3593 | -0.9261 |
| Environmental Pillar Score | -1.2135 | -0.4484 | -0.9154 | -0.9185 | -0.9544 | -0.3152 | -1.4358 | -0.6938 | -0.4857 | -0.4914 | 0.3296 |
| Resource Use | -0.9191 | -0.5185 | -0.6074 | -1.1847 | -0.1054 | 0.1671 | -1.0978 | -0.4467 | -0.1416 | -0.4792 | 0.2140 |
| Emissions | -0.1323 | -0.1702 | 0.2451 | -0.0821 | -0.4185 | 0.7599 | 0.5559 | 0.0617 | -2.0197 | -0.1607 | 0.6907 |
| Innovation | -0.8384 | -0.7330 | -0.7836 | -1.2938 | -0.8436 | 0.2568 | -1.5870 | -0.7752 | -1.1830 | -0.3415 | -0.3723 |
| Social Pillar Score | -1.5115 | -0.8997 | -0.6730 | -1.1981 | -0.6079 | -0.4950 | -2.3592 | -1.3214 | -0.7976 | -0.9867 | 0.0860 |
| Workforce | -1.2584 | -0.5293 | -0.8517 | -1.1451 | -0.3695 | 1.0951 | -1.0071 | -0.3512 | -0.2065 | -0.1862 | 0.8022 |
| Human Rights | -0.7392 | -0.9119 | -0.6886 | -1.1354 | -0.0789 | 0.5764 | -1.1022 | -0.4287 | -0.6816 | 0.5097 | -0.1016 |
| Community | -0.9536 | -1.0889 | -0.9374 | -0.6339 | -0.4761 | 0.0447 | -1.1582 | -0.4753 | -0.3814 | -0.4743 | 0.3956 |
| Product Responsibility | -0.7618 | -0.8611 | -0.7247 | -1.0602 | -0.9361 | -0.3176 | -0.9700 | -0.8395 | -0.8144 | -0.5961 | 0.2833 |
| Governance Pillar Score | -2.1585 | -0.7304 | -1.0239 | -1.4494 | -1.7601 | 0.2165 | -1.0617 | -0.6465 | -0.5446 | 0.0486 | -0.5381 |
| Management | -0.9188 | -0.5349 | -0.1817 | -0.7221 | -0.8371 | -0.4357 | -0.5956 | -0.4232 | -0.4368 | -0.2546 | -0.1527 |
| Shareholders | -1.0499 | -0.6755 | -0.2549 | -0.7218 | -1.5056 | -0.3347 | -0.5831 | -0.4498 | -0.2952 | -0.3519 | -0.0421 |
| CSR Strategy | 0.0331 | -0.0442 | 0.0877 | -0.2508 | -0.8681 | 0.3333 | -0.4148 | -0.6240 | -0.3730 | -0.1721 | -0.1798 |
| Controversies | -1.9171 | -1.1530 | -1.2692 | -0.7727 | -0.1738 | -2.5883 | -0.5331 | -1.8325 | NA | -1.2959 | -2.4106 |
| Control variables | |||||||||||
| Leverage | 0.8090 | 4.1102 | 10.2203 | 5.0186 | 2.8777 | 3.7304 | 11.0916 | 18.9904 | 2.3699 | 7.0934 | 0.2094 |
| Size | 0.9293 | 3.1269 | 0.4961 | 2.0488 | 1.4997 | 0.9505 | 1.9982 | 0.8591 | 1.9083 | 1.9905 | -0.0782 |
| Profitability | 1.2817 | 3.3838 | 1.1871 | 4.1280 | 1.3781 | 7.8268 | 2.6756 | 16.9202 | 1.3795 | 1.1626 | 1.1872 |
| Sales growth | 1.8525 | 0.4714 | 2.2603 | 2.4523 | 1.1343 | 7.8525 | 1.3377 | 4.8659 | 1.7470 | 6.4469 | 1.3433 |
| Dividend yield | -0.7030 | -0.0907 | 0.5028 | -0.0708 | 0.2835 | -0.1352 | -0.6745 | 0.3176 | -0.0895 | -0.3817 | 0.0658 |
Notes. Values concern all companies for each sector.
Table A7.
B-5. Kurtosis per sector.
| Basic materials | Communication Services | Consumer Cyclical | Consumer Defensive | Energy | Financial Services | Health Care | Industrials | Real Estate | Technology | Utilities | |
| Credit ratings | 3.43 | 4.19 | 10.15 | 3.68 | 7.44 | 5.29 | 5.40 | 4.43 | 7.79 | 9.56 | 10.75 |
| ESG scores | |||||||||||
| ESG Combined Score | 3.14 | 2.51 | 2.43 | 2.03 | 2.12 | 2.24 | 2.64 | 2.47 | 3.01 | 2.04 | 1.52 |
| ESG Score | 3.44 | 3.98 | 2.46 | 2.25 | 1.92 | 2.29 | 2.96 | 2.39 | 2.60 | 2.04 | 3.72 |
| Environmental Pillar Score | 3.95 | 2.20 | 3.48 | 3.33 | 2.81 | 2.06 | 4.30 | 2.50 | 2.24 | 1.65 | 1.68 |
| Resource Use | 3.31 | 2.38 | 2.69 | 3.60 | 1.54 | 1.94 | 3.48 | 2.41 | 1.67 | 1.69 | 1.51 |
| Emissions | 1.32 | 1.38 | 1.37 | 1.55 | 1.36 | 1.91 | 1.75 | 1.53 | 5.41 | 1.75 | 1.73 |
| Innovation | 2.90 | 2.22 | 2.68 | 3.73 | 2.27 | 1.67 | 4.69 | 2.62 | 3.02 | 1.53 | 1.43 |
| Social Pillar Score | 7.52 | 2.36 | 2.11 | 3.43 | 2.86 | 1.74 | 7.91 | 4.32 | 2.38 | 3.33 | 2.43 |
| Workforce | 3.82 | 2.39 | 2.52 | 3.40 | 1.67 | 3.03 | 3.02 | 1.69 | 1.72 | 1.33 | 2.08 |
| Human Rights | 2.50 | 2.55 | 2.49 | 3.47 | 1.38 | 3.02 | 3.27 | 1.98 | 1.81 | 2.55 | 1.46 |
| Community | 3.56 | 4.03 | 3.27 | 2.60 | 2.01 | 2.11 | 3.44 | 2.68 | 2.38 | 2.28 | 1.94 |
| Product Responsibility | 2.68 | 2.37 | 2.85 | 3.49 | 2.74 | 2.87 | 3.06 | 3.02 | 2.37 | 2.24 | 1.74 |
| Governance Pillar Score | 8.24 | 2.47 | 3.06 | 4.72 | 5.07 | 1.85 | 3.32 | 2.52 | 2.12 | 1.34 | 2.62 |
| Management | 3.28 | 2.79 | 2.19 | 3.23 | 3.76 | 2.61 | 2.95 | 2.30 | 2.37 | 1.98 | 1.41 |
| Shareholders | 3.38 | 2.52 | 2.07 | 2.68 | 5.30 | 2.11 | 2.45 | 2.10 | 2.17 | 1.97 | 1.30 |
| CSR Strategy | 1.79 | 1.81 | 1.77 | 1.89 | 3.26 | 2.02 | 2.00 | 2.55 | 1.89 | 2.04 | 1.94 |
| Controversies | 5.30 | 2.94 | 2.98 | 2.00 | 1.34 | 8.74 | 1.68 | 5.01 | - | 3.12 | 7.82 |
| Control variables | |||||||||||
| Leverage | 3.04 | 23.85 | 122.34 | 34.99 | 11.38 | 15.93 | 146.38 | 363.69 | 9.52 | 54.76 | 2.03 |
| Size | 5.00 | 11.82 | 2.43 | 6.95 | 4.49 | 3.93 | 16.09 | 4.39 | 5.52 | 6.57 | 1.73 |
| Profitability | 5.56 | 22.22 | 5.34 | 28.52 | 6.54 | 71.06 | 12.73 | 311.50 | 5.30 | 3.33 | 3.70 |
| Sales growth | 7.57 | 3.25 | 9.35 | 8.89 | 3.90 | 73.98 | 8.14 | 31.73 | 4.89 | 46.73 | 3.45 |
| Dividend yield | 2.89 | 2.10 | 2.12 | 2.47 | 1.62 | 2.25 | 2.60 | 2.10 | 1.92 | 2.08 | 2.35 |
Notes. Values concern all companies for each sector.
Table A8.
B-6. Jarque-Bera (Prob.) per sector.
| Basic materials | Communication Services | Consumer Cyclical | Consumer Defensive | Energy | Financial Services | Health Care | Industrials | Real Estate | Technology | Utilities | |
| Credit ratings | 0.0858* | 0.0013** | 0** | 0.0019** | 0** | 0** | 0** | 0** | 0** | 0** | 0** |
| ESG scores | |||||||||||
| ESG Combined Score | 0.0014** | 0.1159 | 0.0067** | 0.0023** | 0.1114 | 0.2324 | 0.1564 | 0.0150** | 0.1230 | 0.0783* | 0.1598 |
| ESG Score | 2.00E-06** | 0** | 0.0015** | 0.0047** | 0.0634* | 0.2101 | 0.0073** | 0.0017** | 0.7837 | 0.0204** | 0.0850* |
| Environmental Pillar Score | 0** | 0.0270** | 0** | 0** | 0.0101** | 0.0402** | 0** | 0** | 0.2996 | 5.07E-04** | 0.2566 |
| Resource Use | 5.00E-06** | 0.0257** | 7.48E-04** | 0** | 0.0651* | 0.0440** | 0** | 1.44E-04** | 0.2296 | 8.19E-04** | 0.2232 |
| Emissions | 3.40E-05** | 0.0011** | 2.00E-06** | 7.00E-06** | 0.0145** | 1.51E-04** | 1.00E-06** | 0** | 0** | 0.0108** | 0.1116 |
| Innovation | 4.60E-05** | 9.96E-04** | 8.00E-06** | 0** | 0.0146** | 0.0060** | 0** | 0** | 0.0119** | 8.43E-04** | 0.1504 |
| Social Pillar Score | 0** | 1.09E-04** | 6.00E-06** | 0** | 0.1538 | 0.0015** | 0** | 0** | 0.0984* | 2.00E-05** | 0.7991 |
| Workforce | 0** | 0.0240** | 1.00E-06** | 0** | 0.0550* | 6.00E-06** | 0** | 0** | 0.2381 | 3.48E-04** | 0.1174 |
| Human Rights | 1.80E-04** | 1.48E-04** | 5.20E-05** | 0** | 0.0365** | 0.0350** | 0** | 1.00E-06** | 0.0751* | 0.0350** | 0.2231 |
| Community | 1.00E-06** | 0** | 0** | 5.40E-05** | 0.0942* | 0.1351 | 0** | 4.25E-04** | 0.4657 | 0.0214** | 0.3348 |
| Product Responsibility | 1.85E-04** | 2.21E-04** | 6.00E-05** | 0** | 0.0115** | 0.3471 | 0** | 0** | 0.0893* | 0.0045** | 0.3010 |
| Governance Pillar Score | 0** | 0.0024** | 0** | 0** | 0** | 0.0217** | 0** | 0** | 0.2107 | 5.45E-04** | 0.4421 |
| Management | 5.00E-06** | 0.0512* | 0.0275** | 7.00E-06** | 0.0145** | 0.1006 | 1.10E-03** | 9.00E-05** | 0.3999 | 0.0304** | 0.1925 |
| Shareholders | 0** | 0.0058** | 0.0059** | 5.00E-06** | 0** | 0.0430** | 3.41E-04** | 4.00E-06** | 0.4406 | 0.0147** | 0.1625 |
| CSR Strategy | 0.0057** | 0.0284** | 8.02E-04** | 2.63E-04** | 0.0213** | 0.0294** | 3.11E-04** | 1.00E-06** | 0.2422 | 0.0591* | 0.4591 |
| Controversies | 0** | 2.00E-06** | 0** | 0** | 0.0276** | 0** | 1.00E-06** | 0** | - | 0** | 0** |
| Control variables | |||||||||||
| Leverage | 9.30E-05** | 0** | 0** | 0** | 0** | 0** | 0** | 0** | 0** | 0** | 0.4960 |
| Size | 0** | 0** | 0.0025** | 0** | 1.00E-06** | 1.30E-05** | 0** | 0** | 0** | 0** | 0.3573 |
| Profitability | 0** | 0** | 0** | 0** | 0** | 0** | 0** | 0** | 3.70E-05** | 0** | 0.0218** |
| Sales growth | 0** | 0.0921* | 0** | 0** | 5.77E-04** | 0** | 0** | 0** | 4.00E-06** | 0** | 0.0097** |
| Dividend yield | 8.75E-04** | 0.1240 | 2.77E-04** | 0.1888 | 0.0625* | 0.1994 | 7.50E-05** | 8.40E-05** | 0.387075 | 0.0205** | 0.7569 |
Notes. Values concern all companies for each sector.
Table A9.
Pairwise correlations between credit ratings and a) ESGs as well as b) control variables (Europe Vs. non-Europe).
Table A9.
Pairwise correlations between credit ratings and a) ESGs as well as b) control variables (Europe Vs. non-Europe).
| Europe | non-Europe | |
| ESG Combined Score | -0.0116 | -0.0419 |
| ESG Score | 0.0010 | -0.0301 |
| Environmental Pillar Score | 0.0041 | -0.0050 |
| Resource Use | 0.0144 | -0.0050 |
| Emissions | -0.0106 | -0.0096 |
| Innovation | -0.0026 | -0.0152 |
| Social Pillar Score | -0.0263 | -0.0247 |
| Workforce | 0.0050 | -0.0150 |
| Human Rights | -0.0472 | -0.0351 |
| Community | -0.0228 | -0.0288 |
| Product Responsibility | 0.0065 | -0.0076 |
| Governance Pillar Score | -3.90E-04 | -0.0477 |
| Management | 4.90E-04 | -0.0642* |
| Shareholders | 0.0128 | 0.0215 |
| CSR Strategy | -0.0268 | -0.0054 |
| Controversies | -0.0025 | -0.0262 |
| Leverage | -0.0070 | 0.0205 |
| Size | -6.25E-04 | -0.0237 |
| Profitability | -0.0319 | -0.0135 |
| Sales growth | -0.0188 | 0.0057 |
| Dividend yield | -0.0174 | -0.0230 |
Table A10.
A. Pairwise correlations between credit ratings and ESGs (in sectors).
| ESG Combined Score | ESG Score | Environmental Pillar Score | Resource Use | Emissions | Innovation | Social Pillar Score | Workforce | Human Rights | Community | Product Responsibility | Governance Pillar Score | Management | Shareholders | CSR Strategy | Controversies | |
| Basic materials | -0.0837 | -0.0564 | 0.0763 | 0.0232 | -0.0442 | 0.0159 | -0.1057 | -0.0711 | -0.0496 | -0.0413 | -9.27E-04 | -0.1150 | -0.1025 | -0.0941 | -0.0303 | -0.0480 |
| Communication Services | 9.80E-05 | 0.0254 | 0.0241 | 0.0351 | 0.0407 | 0.0582 | -0.0803 | -0.1029 | 0.0084 | -0.0727 | 0.0359 | -0.0047 | 0.0025 | -0.0136 | -0.0060 | 0.0881 |
| Consumer Cyclical | -0.0188 | 0.0341 | -0.0048 | -0.0210 | -0.0058 | -0.0395 | -0.0288 | -0.1001 | 0.0027 | -0.0519 | 0.0150 | 0.0056 | -0.0100 | -0.0149 | 0.0333 | 0.0030 |
| Consumer Defensive | 0.0443 | -0.0119 | 0.0288 | 0.0145 | -0.0165 | 0.0315 | 0.0224 | -0.0489 | 0.0010 | -0.0173 | 0.0070 | -0.0180 | -0.0215 | -0.0359 | -0.0029 | -0.0119 |
| Energy | 0.0188 | 0.0403 | 0.0120 | 0.0263 | -0.0145 | 0.0178 | -0.0841 | 0.0390 | -0.0462 | 0.0298 | 0.0416 | 0.0200 | -0.2142 | -0.1623 | -0.0255 | 0.0068 |
| Financial Services | -0.0338 | -0.0088 | -0.0454 | 0.0208 | -0.0159 | -0.0402 | -0.0015 | -0.0737 | -0.0620 | -0.0544 | -0.0250 | 0.0744 | 0.0053 | -0.0467 | 0.0631 | -0.1663* |
| Health Care | -0.1173 | -0.0130 | -0.0243 | -0.0230 | 0.0921 | -0.0061 | -0.0244 | -0.0296 | -0.0369 | -0.0220 | -0.0062 | -0.0365 | 0.0250 | 0.0359 | -0.0413 | -0.0650 |
| Industrials | -0.0378 | -0.0266 | -0.0264 | -0.0119 | -0.0150 | 0.0112 | -0.0612 | -0.0103 | 0.0734 | -0.0056 | 0.0094 | -0.0232 | 0.0075 | 0.0029 | 0.0420 | 0.0470 |
| Real Estate | 0.0070 | 0.1223 | 0.0325 | 0.1705 | -0.1200 | 0.2090 | 0.0305 | -0.0635 | -0.1013 | -0.0586 | -0.0504 | -0.1133 | -0.1517 | -0.1607 | -0.0628 | - |
| Technology | -0.0634 | -0.1163 | -0.0847 | -0.0358 | -0.0097 | -0.0283 | -0.0420 | -0.0500 | 0.0100 | -0.0516 | -0.0890 | -0.0351 | -0.0325 | -0.0687 | 0.0821 | -0.0699 |
| Utilities | 0.0189 | 0.0630 | -0.0201 | 0.0179 | -0.0188 | 0.0204 | -0.0881 | 0.0634 | 0.0286 | -0.0113 | -0.0164 | -0.1359 | -0.1647 | -0.2043 | 0.0325 | -0.0666 |
Table A11.
B. Pairwise correlations between credit ratings and control variables (in sectors).
| Leverage | Size | Profitability | Sales growth | Dividend yield | |
| Basic materials | 0.0078 | -0.0068 | 0.0183 | 0.0244 | -0.0712 |
| Communication Services | -0.0268 | 0.0158 | 0.0047 | -0.0529 | 0.0692 |
| Consumer Cyclical | 0.1078 | -0.0485 | -0.0382 | -0.0174 | -0.0525 |
| Consumer Defensive | -0.0399 | -0.0075 | 0.0504 | 0.0119 | 0.0147 |
| Energy | 0.1189 | -0.0532 | -0.1447 | -0.1218 | -0.0361 |
| Financial Services | 0.0146 | 0.0485 | -0.0589 | 0.0322 | 0.0458 |
| Health Care | 0.0250 | -0.0688 | -0.0337 | -0.0426 | -0.0464 |
| Industrials | 0.0200 | 0.0290 | -0.0082 | -0.0017 | -0.0184 |
| Real Estate | -0.0056 | -0.0693 | -0.2273 | -0.0598 | 0.1047 |
| Technology | -0.1623* | -0.0414 | -0.0129 | 0.0418 | -0.0428 |
| Utilities | 0.2700 | -0.2193 | -0.1083 | -0.0758 | -0.0193 |
Table A12.
ESGs and control variables Granger causing credit ratings (Europe Vs. non-Europe).
| Europe | non-Europe | |
| ESG Combined Score | 0.6171 | 0.0633* |
| ESG Score | 0.1321 | 0.5870 |
| Environmental Pillar Score | 0.1712 | 0.9099 |
| Resource Use | 0.1805 | 0.6888 |
| Emissions | 0.5611 | 0.9074 |
| Innovation | 0.2688 | 0.9015 |
| Social Pillar Score | 0.7546 | 0.6866 |
| Workforce | 0.6467 | 0.9117 |
| Human Rights | 0.6645 | 0.4749 |
| Community | 0.8049 | 0.7980 |
| Product Responsibility | 0.9909 | 0.7023 |
| Governance Pillar Score | 0.0175** | 0.4769 |
| Management | 0.0601* | 0.3587 |
| Shareholders | 0.035** | 0.8298 |
| CSR Strategy | 0.2798 | 0.6466 |
| Controversies | 0.5361 | 0.0844* |
| Leverage | 0.8185 | 0.6895 |
| Size | 0.3918 | 0.4162 |
| Profitability | 0.6229 | 0.8651 |
| Sales growth | 0.9768 | 0.5036 |
| Dividend yield | 0.1371 | 0.4778 |
Notes. The table reports the probability values of the Granger causality test.
Table A13.
ESGs and control variables Granger causing credit ratings (sectors).
| Basic materials | Communication Services | Consumer Cyclical | Consumer Defensive | Energy | Financial Services | Health Care | Industrials | Real Estate | Technology | Utilities | |
| ESG Combined Score | 0.6720 | 0.8840 | 0.9681 | 0.6171 | 0.7569 | 0.2078 | 0.5266 | 0.6549 | 0.8639 | 0.5820 | 0.7948 |
| ESG Score | 0.7357 | 0.8902 | 0.3112 | 0.6448 | 0.5047 | 0.1897 | 0.0949* | 0.4813 | 0.9222 | 0.4243 | 0.4343 |
| Environmental Pillar Score | 0.8477 | 0.7773 | 0.8833 | 0.2040 | 0.6019 | 0.9284 | 0.7302 | 0.5842 | 0.3743 | 0.3460 | 0.4053 |
| Resource Use | 0.3644 | 0.6606 | 0.8207 | 0.4575 | 0.9644 | 0.5101 | 0.4290 | 0.3813 | 0.9292 | 0.4131 | 0.3289 |
| Emissions | 0.8237 | 0.4793 | 0.1144 | 0.8778 | 0.7550 | 0.8481 | 0.0235** | 0.7683 | 0.6958 | 0.7270 | 0.5201 |
| Innovation | 0.3835 | 0.5765 | 0.6751 | 0.7987 | 0.9178 | 0.7195 | 0.7232 | 0.3488 | 0.7837 | 0.4252 | 0.4937 |
| Social Pillar Score | 0.3611 | 0.6529 | 0.8786 | 0.3888 | 0.5762 | 0.5850 | 0.6369 | 0.4674 | 0.6890 | 0.2776 | 0.8772 |
| Workforce | 0.9674 | 0.5892 | 0.0693* | 0.9793 | 0.4367 | 0.5169 | 0.8909 | 0.7641 | 0.5936 | 0.1512 | 0.4203 |
| Human Rights | 0.4220 | 0.5451 | 0.9173 | 0.6836 | 0.9254 | 0.3377 | 0.5254 | 0.6511 | 0.4957 | 0.6970 | 0.8489 |
| Community | 0.9770 | 0.2883 | 0.4184 | 0.9426 | 0.7373 | 0.9189 | 0.6319 | 0.8834 | 0.6468 | 0.2834 | 0.7189 |
| Product Responsibility | 0.8154 | 0.5511 | 0.3249 | 0.9949 | 0.8903 | 0.9082 | 0.7495 | 0.5072 | 0.4507 | 0.2468 | 0.5707 |
| Governance Pillar Score | 0.6980 | 0.5876 | 0.7923 | 0.6399 | 0.9535 | 0.4196 | 0.9177 | 0.7088 | 0.8049 | 0.5018 | 0.1964 |
| Management | 0.6280 | 0.0412** | 0.6215 | 0.4074 | 0.1354 | 0.5671 | 0.3046 | 0.4073 | 0.8259 | 0.8209 | 0.4720 |
| Shareholders | 0.3922 | 0.0442** | 0.4716 | 0.4795 | 0.0599* | 0.8351 | 0.3466 | 0.6821 | 0.8292 | 0.7954 | 0.7541 |
| CSR Strategy | 0.8567 | 0.9415 | 0.8157 | 0.1525 | 0.6506 | 0.3964 | 0.8358 | 0.3909 | 0.5610 | 0.4767 | 0.2608 |
| Controversies | 0.2870 | 0.7264 | 0.6566 | 0.0061** | 0.4838 | 0.0339** | 0.8060 | 0.0476** | - | 0.6327 | 0.1916 |
| Leverage | 0.3322 | 0.4395 | 0.3237 | 0.6756 | 0.3121 | 0.7246 | 0.7833 | 0.5320 | 0.5669 | 0.6362 | 0.8021 |
| Size | 0.3920 | 0.8652 | 0.1241 | 0.4520 | 0.9034 | 0.2929 | 0.3326 | 0.4039 | 0.7026 | 0.8568 | 0.6309 |
| Profitability | 0.4456 | 0.5327 | 0.6777 | 0.0178** | 0.6390 | 0.3808 | 0.9496 | 0.0218** | 0.0218** | 0.9982 | 0.9251 |
| Sales growth | 0.6298 | 0.4949 | 0.8843 | 0.6498 | 0.9704 | 0.3610 | 0.7094 | 0.6098 | 0.7113 | 0.3817 | 0.8901 |
| Dividend yield | 0.5560 | 0.2409 | 0.2263 | 0.3631 | 0.7268 | 0.8377 | 0.3099 | 0.2610 | 0.7669 | 0.6229 | 0.4180 |
Notes. The table reports the probability values of the Granger causality test.
Table A14.
Regression output for ESGs and control variables explaining credit ratings (Europe Vs. non-Europe).
Table A14.
Regression output for ESGs and control variables explaining credit ratings (Europe Vs. non-Europe).
| Europe | non-Europe | |
| Coefficients | ||
| ESG Combined Score | -1.22E-04** | 7.74E-06 |
| ESG Score | -9.82E-05* | 1.24E-05* |
| Environmental Pillar Score | -8.27E-05 | 1.47E-05 |
| Resource Use | -7.35E-05 | 1.72E-05** |
| Emissions | -7.82E-05 | 4.75E-06 |
| Innovation | -1.16E-04 | 1.18E-05 |
| Social Pillar Score | -9.03E-05* | -1.66E-06 |
| Workforce | -8.26E-05* | 1.13E-05 |
| Human Rights | -1.26E-04** | -2.25E-05** |
| Community | -6.77E-05 | -4.75E-06 |
| Product Responsibility | -7.85E-05 | 1.48E-05 |
| Governance Pillar Score | -9.97E-05* | 1.31E-05 |
| Management | -1.14E-04** | 1.45E-05 |
| Shareholders | -5.57E-05 | 2.08E-05** |
| CSR Strategy | -7.27E-05 | -4.39E-06 |
| Controversies | - | - |
| Leverage | 6.32E-05 | -7.12E-05 |
| Size | -0.0065* | 7.02E-04 |
| Profitability | -0.0045 | -0.0010** |
| Sales growth | -1.04E-04 | -9.00E-05** |
| Dividend yield | -0.0128 | -0.0014 |
| R-squared | ||
| 0.1579 | 0.2024 | |
Table A15.
Regression output for ESGs and control variables explaining credit ratings (sectors).
| Basic materials | Communication Services | Consumer Cyclical | Consumer Defensive | Energy | Financial Services | Health Care | Industrials | Real Estate | Technology | Utilities | |
| Coefficients | |||||||||||
| ESG Combined Score | 4.05E-05 | -2.75E-05 | -7.95E-05* | -7.47E-05 | 2.98E-05 | -1.31E-04 | -8.36E-05** | -1.22E-05 | -7.54E-05 | -1.10E-04 | 9.76E-05** |
| ESG Score | 5.34E-05 | -1.63E-05 | -4.54E-05 | -9.12E-05** | 5.86E-05* | -1.47E-04 | -3.89E-05 | -8.40E-06 | -5.88E-05 | -1.37E-04** | 2.69E-05* |
| Environmental Pillar Score | 9.09E-05** | 2.06E-04* | -7.43E-05* | -7.42E-05* | 3.13E-05 | -1.00E-04 | -4.52E-05 | -4.59E-06 | -5.61E-05 | -1.16E-04 | 9.51E-06 |
| Resource Use | 2.10E-05 | 2.83E-04** | -7.50E-05** | -6.20E-05 | 2.60E-05 | -1.67E-04* | -3.25E-05 | 9.83E-06 | -3.10E-05 | -8.94E-05 | 2.26E-05* |
| Emissions | 6.95E-05 | 1.23E-04 | -5.95E-05* | -6.63E-05 | 1.66E-05 | -1.57E-04* | -4.06E-05 | -1.29E-05 | -6.22E-05 | -1.34E-04** | -9.96E-06 |
| Innovation | 7.56E-05* | 1.61E-04* | -7.28E-05 | -1.07E-04** | -2.95E-05 | -1.29E-04 | 1.02E-04* | -1.44E-05 | -1.71E-04** | -1.13E-04 | -1.30E-05 |
| Social Pillar Score | 5.64E-05 | -4.85E-04** | -8.90E-05** | -8.49E-05** | 4.18E-05 | -2.06E-04** | -3.81E-05 | 9.37E-07 | -9.97E-05 | -1.02E-04 | 2.92E-06 |
| Workforce | 6.71E-05* | 2.27E-04* | -4.83E-05 | -7.30E-05* | 3.52E-05 | -1.32E-04* | -3.16E-05 | 6.05E-06 | -8.34E-05 | -1.16E-04** | -1.65E-05 |
| Human Rights | 2.92E-05 | -4.59E-04** | -1.40E-04** | -1.03E-04** | 1.01E-04* | -3.37E-04** | -4.99E-05* | -6.36E-06 | -2.11E-04* | -1.20E-04* | 4.90E-05* |
| Community | 3.72E-05 | -3.41E-04** | -7.67E-05** | -6.52E-05* | -2.62E-05 | -1.37E-04* | -3.50E-05 | -2.17E-05* | -4.02E-05 | -7.64E-05 | 1.62E-05 |
| Product Responsibility | 4.10E-05 | 3.37E-05 | -5.66E-05 | -7.73E-05** | -8.69E-05* | -2.42E-04** | -4.52E-05* | 5.68E-05** | -1.75E-04* | -7.58E-05 | 3.16E-05* |
| Governance Pillar Score | 2.82E-05 | -2.56E-05 | -7.34E-05* | -9.06E-05** | -9.26E-05** | -1.39E-04 | -2.67E-05 | 7.44E-06 | -1.79E-04* | -9.98E-05 | -9.20E-07 |
| Management | 2.51E-05 | -3.03E-05 | -7.50E-05* | -9.29E-05** | -9.04E-05** | -1.51E-04* | -1.82E-05 | 5.20E-06 | -2.51E-04** | -1.22E-04* | 1.70E-05 |
| Shareholders | 5.52E-05 | -3.32E-05 | -2.30E-05 | -8.98E-05* | -1.73E-05 | -9.02E-05 | -5.81E-05** | 2.74E-05* | -7.56E-05 | 3.90E-07 | |
| CSR Strategy | 2.55E-05 | -2.21E-05 | -5.09E-05 | -8.07E-05** | 2.66E-05 | -9.72E-05 | -4.79E-05* | -1.29E-05 | -8.79E-05 | -1.09E-04 | 8.44E-06 |
| Controversies | - | - | - | - | - | - | - | - | - | - | - |
| Leverage | 0.0023* | -5.95E-04* | 0.0014** | -9.86E-04** | 0.0058** | -6.36E-05 | 6.38E-05 | 5.21E-05** | -0.0048 | -0.0034** | 9.38E-04** |
| Size | 0.0055* | 0.0022 | -0.0058** | -0.0030 | -0.0094** | -0.0099 | -0.0088** | 0.0019* | -0.0363** | -0.0104 | -0.0133** |
| Profitability | 0.0044** | -0.0012 | -0.0065** | -0.0025 | -0.0122** | -0.0015* | -0.0028** | -3.73E-04 | -0.0103** | -0.0030 | -6.22E-04 |
| Sales growth | 8.12E-04** | -0.0023** | -1.54E-04* | -8.13E-05 | -0.0017** | -4.56E-05 | -6.76E-04* | 2.93E-06 | -0.0014** | 9.78E-05 | -2.24E-04** |
| Dividend yield | 0.0045 | 0.0418** | -0.0174** | -0.0121* | -0.0142* | -0.0132 | -0.0062* | -0.0017 | -0.0031 | -0.0099 | 0.0083** |
| R-squared | 0.3106 | 0.2928 | 0.5451 | 0.3505 | 0.5037 | 0.3820 | 0.3225 | 0.2575 | 0.4540 | 0.3744 | 0.6262 |
References
- Altman E, Rijken HA, Altman E, Rijken HA. How rating agencies achieve rating stability. J Bank Financ. 2004;28(11):2679-2714. Accessed May 12, 2025. https://EconPapers.repec.org/RePEc:eee:jbfina:v:28:y:2004:i:11:p:2679-2714.
- Stolper, A. Regulation of credit rating agencies. J Bank Financ, 2009. [Google Scholar] [CrossRef]
- Matthies, B. A. Empirical research on corporate credit-ratings: A literature review. SFB 649 Discussion Papers. Published online 2013. Accessed May 12, 2025. https://ideas.repec.org/p/zbw/sfb649/sfb649dp2013-003.html.
- SEC.gov | Selective Disclosure and Insider Trading. Accessed May 12, 2025. https://www.sec.gov/rules-regulations/2000/08/selective-disclosure-insider-trading.
- Cheliatsidou A, Sariannidis N, Garefalakis A, Passas I, Spinthiropoulos K. Exploring Attitudes towards Whistleblowing in Relation to Sustainable Municipalities. Administrative Sciences 2023, Vol 13, Page 199. [CrossRef]
- Kagias P, Sariannidis N, Garefalakis A, Passas I, Kyriakogkonas P. Validating the Whistleblowing Maturity Model Using the Delphi Method. Administrative Sciences 2023, Vol 13, Page 120. [CrossRef]
- Zopounidis C, Garefalakis A, Lemonakis C, Passas I. Environmental, social and corporate governance framework for corporate disclosure: a multicriteria dimension analysis approach. Management Decision. [CrossRef]
- Dillenburg S, Greene T, Erekson H. Approaching Socially Responsible Investment with a Comprehensive Ratings Scheme: Total Social Impact. Journal of Business Ethics. [CrossRef]
- Passas, I. The Evolution of ESG: From CSR to ESG 2.0. Encyclopedia 2024, Vol 4, Pages 1711-1720. [CrossRef]
- Passas, I. Accounting for integrity: ESG and financial disclosures: the challenge of internal fraud in management decision-making. Hellenic Mediterranean University; 2023. [CrossRef]
- Feng D, Gourieroux C, Jasiak J. The ordered qualitative model for credit rating transitions. J Empir Finance. [CrossRef]
- Ragazou K, Passas I, Garefalakis A, Zafeiriou E, Kyriakopoulos G. The Determinants of the Environmental Performance of EU Financial Institutions: An Empirical Study with a GLM Model. Energies 2022, Vol 15, Page 5325. [CrossRef]
- Altman, EI. Financial ratios, discriminant analysis and the prediction of corporate bankruptcy. J Finance 1968, 23, 589–609. [Google Scholar] [CrossRef]
- Kim Y, Sohn SY. Random effects model for credit rating transitions. Eur J Oper Res. [CrossRef]
- Mahlmann, T. Is There a Relationship Benefit in Credit Ratings? Rev Financ. [CrossRef]
- Sustainable finance: Commission’s Action Plan for a greener and cleaner economy. Accessed May 12, 2025. https://ec.europa.eu/commission/presscorner/detail/en/ip_18_1404.
- Vortelinos D, Passas I, Floros C, Garefalakis A. Corporate Social Responsibility and Country Governance: An International Comparative Study Amid the COVID-19 Pandemic. International Journal of Financial Studies 2024, Vol 12, Page 110. [CrossRef]
- Ashbaugh-Skaife H, Collins DW, LaFond R. The effects of corporate governance on firms’ credit ratings. Journal of Accounting and Economics. [CrossRef]
- Bhojraj S, Sengupta P. Effect of Corporate Governance on Bond Ratings and Yields: The Role of Institutional Investors and Outside Directors. Journal of Business. [CrossRef]
- Ashbaugh-Skaife H, Collins DW, LaFond R. The effects of corporate governance on firms’ credit ratings. Journal of Accounting and Economics. [CrossRef]
- Yiannoulis Y, Vortelinos D, Passas I. Exploring Audit Opinions: A Deep Dive into Ratios and Fraud Variables in the Athens Exchange. Accounting and Auditing 2025, Vol 1, Page 3. [CrossRef]
- Acar G, Coskun A. Environmental, social, and governance scores and earnings management in telecommunication companies: An international perspective. Financial Internet Quarterly. [CrossRef]
- Kevser M, Tunçel MB, Gürsoy S, Zeren F. The impact of environmental, social and governance (ESG) scores on stock market: evidence from G7 countries. Journal of Global Responsibility, 2023. [CrossRef]
- Bruno CC, Henisz WJ. Environmental, Social, and Governance (ESG) Outcomes and Municipal Credit Risk. Bus Soc. Published online November 1, 2024. [CrossRef]
- The ILO and the BRICS | International Labour Organization. Accessed May 12, 2025. https://www.ilo.org/about-ilo/ilo-and-brics.
- Zhang, L. The Impact of Environmental, Social and Governance (ESG) on Corporate Value Enhancement. Journal of Education, Humanities and Social Sciences. [CrossRef]
- Ragazou K, Lemonakis C, Passas I, Zopounidis C, Garefalakis A. ESG-driven ecopreneur selection in European financial institutions: entropy and TOPSIS analysis. Management Decision. [CrossRef]
- Priem R, Gabellone A. The impact of a firm’s ESG score on its cost of capital: can a high ESG score serve as a substitute for a weaker legal environment. Sustainability Accounting, Management and Policy Journal. [CrossRef]
- Kim, YH. The Effect of Environmental, Social and Governance(ESG) on Credit Ratings: A Comparative Study of Kospi and Kosdaq Firms. Gyeong’yeong gyoyug nonchong. [CrossRef]
- Kevser M, Tunçel MB, Gürsoy S, Zeren F. The impact of environmental, social and governance (ESG) scores on stock market: evidence from G7 countries. Journal of Global Responsibility. [CrossRef]
- Fang, Y. Can ESG Ratings impact Accounting Performance: Evidence from Chinese Companies. Published online 2023. [Google Scholar] [CrossRef]
- Nazir M, Akbar M, Yu X, Hussain A, Svobodová L. Environmental, social, and governance performance as an influencing factor of financial sustainability: Evidence from the global high-tech sector. Corp Soc Responsib Environ Manag. [CrossRef]
- Agosto A, Giudici P, Tanda A. How to combine ESG scores? A proposal based on credit rating prediction. Corp Soc Responsib Environ Manag. [CrossRef]
- Ding YJ, Guo JL, Tsai CW. The influence of ESG performance on credit risk and financial distress: an empirical study on Taiwan corporate sustainability. Appl Econ. [CrossRef]
- Chen HM, Kuo TC, Chen JL. Impacts on the ESG and financial performances of companies in the manufacturing industry based on the climate change related risks. J Clean Prod. [CrossRef]
- Deng G, Ma S, Yan J, Shuai C, Liu H. Dissecting the impact of the three E, S, G pillars on credit risk. Econ Anal Policy. [CrossRef]
- Agosto A, Giudici P, Tanda A. How to combine ESG scores? A proposal based on credit rating prediction. Corp Soc Responsib Environ Manag. Published online 2023. [CrossRef]
- Bai C, Sarkis J, Dou Y. Corporate sustainability development in China: Review and analysis. Industrial Management and Data Systems. [CrossRef]
- Fasano M, Guardabascio B, Stanghellini E. The Role of ESG on Credit Rating in the Banking Sector: A Mediation Analysis to Disentangle the Direct and Indirect Effects. Published online 2023:153-173. [CrossRef]
- Eng LL, Fikru M, Vichitsarawong T. Comparing the informativeness of sustainability disclosures versus ESG disclosure ratings. Sustainability Accounting, Management and Policy Journal. [CrossRef]
- Zafeiriou E, Garefalakis A, Passas I, Ragazou K. Illicit and Corruption Mitigation Strategy in the Financial Sector: A Study with a Hybrid Methodological Approach. Sustainability 2023, Vol 15, Page 1366. [CrossRef]
- Dorfleitner G, Halbritter G, Nguyen M. Measuring the level and risk of corporate responsibility - An empirical comparison of different ESG rating approaches. Journal of Asset Management. [CrossRef]
- Passas I, Ragazou K, Zafeiriou E, Garefalakis A, Zopounidis C. ESG Controversies: A Quantitative and Qualitative Analysis for the Sociopolitical Determinants in EU Firms. Sustainability 2022, Vol 14, Page 12879. [CrossRef]
- Davis, Jamie. Environmental, Social and Governance scores from LSEG Environmental, social and governance scores from LSEG 2. Published online 2024.
- Bannier CE, Bofinger Y, Rock B. Corporate social responsibility and credit risk. Financ Res Lett. [CrossRef]
Disclaimer/Publisher’s Note: The statements, opinions and data contained in all publications are solely those of the individual author(s) and contributor(s) and not of MDPI and/or the editor(s). MDPI and/or the editor(s) disclaim responsibility for any injury to people or property resulting from any ideas, methods, instructions or products referred to in the content. |
© 2025 by the authors. Licensee MDPI, Basel, Switzerland. This article is an open access article distributed under the terms and conditions of the Creative Commons Attribution (CC BY) license (http://creativecommons.org/licenses/by/4.0/).
Copyright: This open access article is published under a Creative Commons CC BY 4.0 license, which permit the free download, distribution, and reuse, provided that the author and preprint are cited in any reuse.


