
Submitted:
13 May 2025
Posted:
14 May 2025
You are already at the latest version
Abstract
The absence of α-carbonic anhydrase 2 (α-CA2) in Arabidopsis thaliana leads to higher contents of chlorophylls a and b, and to a reduced chlorophyll a/b ratio, suggesting an increased PSII antenna compared to wild type (WT). The evaluation of OJIP kinetics of chlorophyll fluorescence in leaves of WT and α-carbonic anhydrase 2 knockout (α-CA2-KO) plants revealed higher apparent photosystem II (PSII) light harvesting antenna size in the mutants. The higher levels of both Lhcb1 and Lhcb2 proteins in α-CA2-KO plants compared to WT plants were demonstrated, using immunoblotting. Gene expression analysis showed an increased lhcb1 expression levels in mutants, whereas lhcb2 and lhcb3 genes were downregulated. The content of hydrogen peroxide (H2O2) in leaves, as well as the production of H2O2 within the thylakoid membranes (“membrane” H2O2) were lower in α-CA2-KO plants as compared with WT plants. The expression levels of the genes encoding regulating proteins, which are involved in retrograde chloroplast-nucleus signaling was lower in α-CA2-KO than in WT. The changes of the PSII light-harvesting complex size in the absence of α-CA2 correlates with decreased accumulation of H2O2 in the leaves of mutants. It is suggested that this led to lower expression levels of the genes related to retrograde signal transduction from the chloroplast to the nucleus. The results of this study support previous conclusions regarding the involvement of α-CA2 in photosynthetic processes and its location within the chloroplasts of Arabidopsis.
Keywords:
carbonic anhydrase
; Arabidopsis thaliana
; photosynthesis
; light-harvesting complex
; hydrogen peroxide
; thylakoid membrane
1. Introduction
In the process of photosynthesis, CO2 molecules are initially incorporated into carbohydrate molecules, and then into organic molecules as a result of biochemical transformations. Carbonic anhydrases (CAs) are able to participate both in the entry of CO2 molecules from the environment into photosynthesizing cells and, possibly, in the act of direct supply them to Rubisco, the enzyme, which provides ribulose bisphosphate carboxylation in Calvin-Benson cycle. CAs catalyze the reversible reaction: CO2 + H2O ↔ HCO3⁻ + H⁺. They are classified into eight families: α, β, γ, δ, ζ, η, θ, and ι. In plants, the representatives of three of them: α, β, and γ were detected. Various CAs were found in different compartments of photosynthesizing plant cells: β-CA4 in the plasma membrane and in the cytoplasm [1,2], β-CA2 and β-CA3 in the cytoplasm [1]. Six sources of CA activity were revealed in chloroplasts, including soluble stromal β-CA1, β-CA5, and α-CA1 [3], as well as membrane-bound α-CA4 [4], and α-CA5 [5] in thylakoids. A CA of β-family was also found in the thylakoid lumen of pea and Arabidopsis chloroplasts [6,7]. Despite numerous assumptions about the physiological roles of CAs in plant cells [8], none of the hypotheses is considered proven.
Regarding the situation of α-CA2 in plant cells and its presence in different parts of plants, the data are rather contradictory. In 2007 it was shown [1] that the α-CA2 gene was expressed in Arabidopsis leaves only under reduced CO₂ levels, but Rudenko et al. [9] have found that this gene was expressed in Arabidopsis leaves under any growth conditions. It was demonstrated that high levels of OsαCA2 transcripts accumulate in flag leaves of rice and that α-CA2 was located in the plasma membrane [10]. Wang et al. [11] showed that LjaCA2 was highly expressed in the root nodules of Lotus japonicus, suggesting its potential role in maintaining nodule functioning. Weerasooriya et al. [12] have demonstrated that in Arabidopsis the gene of fluorescent protein fused with α-CA2 gene indicated the localization of this CA in the cell wall, while the expression of the correspondent gene was found in both roots and shoots. According to our previous data, one of the chloroplast CAs may be α-CA2 [13,14].
We have shown that α-CA2 mutants exhibited lower proton concentration difference across thylakoid membranes (ΔpH) compared to WT [14]. We have also previously shown that in α-CA2-KO the level of plastoquinone (PQ) pool reduction was lower than in WT plants [13]. This correlated with the lower donor side limitation of PSI (Y(ND)) parameter in these plants, as compared with WT. The content of hydrogen peroxide in the leaves of mutants lacking α-CA2 after 5 minutes of high-light illumination (500 μmol quanta m−2 s−1) was lower than in the leaves of WT [13]. Basing on photosynthetic characteristics of α-CA2-KO plants as well as of thylakoids isolated from their leaves, we hypothesized [13] that α-CA2 is situated on the stromal side of the thylakoid membrane, and may regulate proton concentration in the thylakoid lumen, thereby indirectly influencing on non-photochemical quenching of chlorophyll a fluorescence.
There are evidences that the redox state of the PQ pool induces signal transduction pathways of PSII light-harvesting complex (LHCII) size regulation [15,16]. Later it was found that H2O2 participates in the regulation of LHCII size [17]. The hydrogen peroxide, which is produced within thylakoid membranes as a result of reduction of superoxide radicals generated in PSI and PQ pool by molecules of plastoquinol, PQH2, but not the redox state of the PQ pool per se was proposed to be the actual carrier of the regulator signals [18]. This fraction of H2O2 can be conditionally referred to as “membrane” H2O2. Some data led to proposition that just this H2O2 plays priority role in above regulation of LHCII size [19].
Basing on data in [20,21,22] a scheme of the transduction of the signal of H2O2 level through the retrograde chloroplast-nucleus pathway of lhcb1 gene expression regulation has been suggested [19]. It was assumed that H2O2 alter the activity of one of the chloroplast serine proteases by diffusing through the chloroplast envelope [19]. According to the data [23,24] in Arabidopsis chloroplasts there are two serine proteases, which are the most likely participants of this mechanism: ASP – protease of the envelope, and SPPA1, which is a protease located in non-appressed thylakoid regions. SPPA1 may also be involved in hydrogen peroxide signaling in chloroplasts, since it has been shown that in Arabidopsis mutants with T-DNA insertion in SPPA gene the acclimation processes to high light was altered compared to WT [24]. Increase in activity of chloroplast protease, possibly of ASP, led to conversion of transcription factor (TF), PTM, a homeodomain TF associated with the chloroplast envelope, into a soluble form as a result of proteolysis of this TF, which leads to its detachment from the transmembrane domains. This form of PTM, which is released from the chloroplast envelope into the cytoplasm, moves into the nucleus, and activates the expression of the other TF, Abscisic Acid Insensitive 4 (ABI4). ABI4 is able to bind with the promoter sequences of lhcb genes in the nucleus, leading to block their expression [19]. Thus, the complete signal transduction pathway from chloroplast to nucleus during regulation of PSII antenna size can include the following components: hydrogen peroxide, mostly generated in the thylakoid membrane, chloroplast protease, PTM, ABI4, and lhcb genes located in the nucleus.
In the present study we investigated how α-CA2 gene knockout affected PSII antenna size and the possible role of α-CA2 in the described above mechanism of LHCII size regulation.
2. Results
2.1. Determination of Chlorophylls a and b Contents
Contents of chlorophylls a and b in mutant leaves was higher than in WT, while the chlorophyll a/b ratio was lower, suggesting a larger PSII antenna size in α-CA2-KO plants (Table 1). The decrease of Chl a/Chl b ratio resulted entirely of the higher 31-41% content of chlorophyll b compared to WT plants. No significant differences in carotenoid content were observed.
2.2. The Assessment of the Parameters of OJIP Kinetics
The assessment of the parameters of OJIP kinetics of chlorophyll a fluorescence of leaves has shown that the maximum quantum yield of PSII (Fv/Fm) in mutants of two lines studied did not noticeably differ from that parameter in WT (Figure 1 A). That means that the reaction center of PSII α-CA2-KO was not damaged. The parameters characterizing the apparent antenna size, ABS/RC, and energy dissipation into heat, DIo/RC, were slightly higher in line 8-3 and significantly higher in line 9-11 of mutants, compared to WT (Figure 1 B, C).
2.3. Estimation of the Amount of lhcb1, Lhcb2 and D1 Proteins and Evaluation of the Expression Level of Genes Encoding PSII Antenna Proteins
The contents of the major proteins of LHCII were estimated using Western blot analysis. In the α-CA2-KO plants, the content of Lhcb1 was slightly higher than in WT (Figure 2A, D), and the content of Lhcb2 was 2-4.5 times higher in both mutant lines than in WT plants (Figure 2B, E). At the same time, in α-CA2-KO plants the content of the protein D1, which is one of the two main proteins of PSII core complex, was the same as in WT (Figure 2C, F).
2.4. The Measurement of Hydrogen Peroxide Production
The expression level of the lhcb1 gene was higher in mutants than in WT plants, while the expression levels of the lhcb2 and lhcb3 genes were lower in both mutant lines compared to WT plants (Figure 3).
The measurement of total hydrogen peroxide production in the leaves of WT and mutant plants under illumination at the same light intensity as during the growth revealed that it was twice lower than in WT (Figure 4).
It has previously been shown that the rate of “membrane” hydrogen peroxide formation increased significantly with increasing light intensity [18]. Therefore, in the present study, high light intensity has been used to reveal more clearly the differences in the rate of “membrane” H2O2 formation between WT plants and α-CA2-KO plants under conditions of maximum rate of this hydrogen peroxide formation in thylakoids. To estimate the production of the “membrane” H2O2, the cytochrome C, an effective superoxide radical scavenger in water phase, was added in the thylakoid suspension at saturating concentration [18] (for more details see Materials and Methods). It turned out that while the total rate of H2O2 production was the same in WT and in α-CA2-KO thylakoids (Figure 5) the rate of “membrane” H2O2 formation was significantly, about 9 times, lower in the thylakoids from mutant plants than the WT plants (Figure 5). It is also worth noting that the effect of the absence of α-CA2 on the level of hydrogen peroxide production in the thylakoid membranes indicates that this CA is indeed situated in the chloroplasts.
2.5. Evaluation of the Expression Level of Genes Encoding Proteins Included in Retrograde Signalling
The expression levels of the genes encoding TFs ABI4 and PTM, as well as both chloroplast serine proteases, ASP and SPPA1, i.e. the regulation proteins, which were suggested to be the involved in the described retrograde H2O2 signalling from chloroplasts to cell nucleus (see Introduction), was determined. The expression levels of these genes were significantly, 2.5-6.7, times lower in mutant plants of both lines than in WT plants (Figure 6).
3. Discussion
A decrease in the Chl a/Chl b ratio usually corresponds with increasing size of the light-harvesting antenna [25,26,27], and the fact that Chl a/Chl b ratio in α-CA2-KO was lower than in WT (Table 1) imply the higher antenna size in these mutants than in the WT. Analysis of OJIP fluorescence kinetics revealed an increase of the apparent PSII antenna size in α-CA2-KO compared to WT, since the ABS/RC values in the leaves of mutants were higher, especially in plants of line 9-11. (Figure 1B). Previously, we suggested that the absence of α-CA2 in plants may lead to unregulated proton leakage from the thylakoid lumen into the stroma [14]. The decreased number of protons in the thylakoid lumen of mutants may signal about the lower light intensity than the actual one, prompting α-CA2-KO plants to increase antenna size for more efficient light harvesting.
There are two main types of dissipation of absorbed light energy into heat, regulated and unregulated. The latter type is energy dissipation during energy migration within pigment-protein complexes of PSII. OJIP parameter, DIo/RC, reflects the portion of absorbed energy that does not reach the reaction centers to drive photochemical reactions but is instead dissipated as heat [28]. In α-CA2-KO plants, the observed increase in DIo/RC may be associated with an enlarged LHCII size, which could result in a longer migration path for excitation energy and, consequently, greater energy dissipation as heat (Figure 1C).
The contents of Lhcb1 and Lhcb2 proteins, especially of the last one, were higher in mutants than in WT (Figure 2A, B, D, E). At that, the content of the main PSII core complex protein, D1, was not changed in α-CA2-KO plants compared to WT (Figure 2C, F), indicating the stability of the PSII reaction center with an increase of the LHCII size.
The knockout of α-CA2 had effect on the intensity of the expression of the genes encoding Lhcb1, Lhcb2 and Lhcb3. Specifically, the expression level of the lhcb1 gene was higher while the expression levels of lhcb2 and lhcb3 were lower in mutants, compared to WT (Figure 3). The opposite effect of CA gene knockout on Lhcb2 content and expression of the lhcb2 gene have been previously found in the study of Arabidopsis plants with knocked out gene encoding thylakoid α-CA4 [18]. These data are the evidence that the changes of antenna size as a result of the knockout of genes encoding CA may take place not only at the transcriptional, but also at the translational level.
Hydrogen peroxide has previously been shown to be involved in the regulation of expression of genes encoding LHCII proteins [29,30]. Previously, Zhurikova et al. [13] showed that in high light, the accumulation of hydrogen peroxide in the leaves of α-CA2 mutants was lower than in WT plants. The present study indicates that the effects of α-CA2 knockout on the LHCII size occurs also in low light used during plant growth. Under these light conditions the H2O2 content in the leaves of mutant plants was considerably lower than in WT plants (Figure 4).
As it is stated in Introduction, the level of H2O2 regulates LHCII size [19]. The lower level of H2O2 accumulation in the leaves of α-CA2-KO plants than in WT plants satisfactorily explains the increase in the PSII antenna size in mutants. It was proposed, that the “membrane” H2O2 may play an important role in the above regulation [18]. In experiments with isolated thylakoids, performed using high light illumination we revealed that with the total rate of H2O2 production almost equal in WT and mutant thylakoids, the level of the “membrane” H2O2 formation was significantly lower in the thylakoids of both α-CA2-KO plants lines than from WT plants (Figure 5). Thus, α-CA2 is able to affect the ratio of the level of H2O2 formed in reaction of superoxide radicals produced within thylakoid membrane in reaction with PQH2 and level of H2O2 formed in superoxide radicals dismutation reaction. If α-CA2 has the same effect on the ratio of H2O2 production ways in low light conditions during plant growth, then the higher light harvesting antenna size in α-CA2-KO plants confirms the assumption in [19] about the role of the “membrane” H2O2 in the regulation of this size.
H2O2 induces cell signaling cascades leading to triggering of specific defense responses, including the changes of the expression levels of various genes [31]. It has been shown that hydrogen peroxide is able to activate serine proteases from different organisms [32,33]. We have found that α-CA2-KO plants exhibited the reduced expression levels of genes encoding thylakoid serine protease, SPPA1, and serine protease in chloroplast envelope, ASP, as well as of genes encoding TFs: ABI4 and PTM (Figure 6). This correlates with the lower hydrogen peroxide production in leaves of mutant compared with WT (Figure 4). Since the ABI4 and PTM TFs repress the expression of lhcb genes, decreased gene expression of these TFs in α-CA2-KO plants compared with WT is expected to lead to an increase in the size of the PSII antenna of these mutants.
The results of our study indicate that α-CA2 is involved in the regulation of the size of the PSII light-harvesting antenna. Since antenna size is directly related to the efficiency of light capture, and adaptation to light, the role of α-CA2 can be of particular importance in the context of influence of variable light conditions in nature. It has previously been shown that the regulation of PSII antenna size is a universal adaptive mechanism that is triggered not only under high light conditions but also in response to other stresses, such as drought and salinity, even under low light intensity [17,34,35,36]. The increased hydrogen peroxide production and the onset of oxidative stress accompany the various abiotic stress factors. It is worth noting that changes in CO2 in the environment are likely to affect the functioning of CA, which catalyzes the reaction of reversible hydration of CO2. Based on this, it can be assumed that the observed effect of α-CA2 on hydrogen peroxide formation may play a certain role in plant adaptation not only to high light but to changed CO2 concentration in the environment.
4. Materials and Methods
4.1. Plant Material and Growth Conditions
A. thaliana plants of the Columbia ecotype (WT) and plants with knocked out At2g28210 gene encoding α-CA2 (α-CA2-KO) (homozygous line “9-11”, obtained from the SALK_120400 line and homozygous line “8–3”, derived from the SALK_080341C line) were used. Schematic representation of T-DNA insertions in the At2g28210 gene encoding α-CA2 is shown in Figure 1S. SALK_120400 is the position of the insertion in homozygous mutant plants “9-11” line (Figure 1S, A) and SALK_080341C is the position of the insertion in homozygous mutant plants, “8-3” line (Figure 1S, B).The results of the electrophoresis in 1.5% agarose gel of PCR products with the primers to α-CA2 gene according to [14] and cDNA obtained after the reverse transcription of RNA isolated from leaves of WT plants, 8–3 and 9-11 mutant lines showed the absence of α-CA2 gene transcripts in both mutant plant lines. (Figure 1S, C) The plant seeds were kindly provided by Prof. J.V. Moroney, (Louisiana State University, USA). After the formation of the first four true leaves, in 14-21 days of age, the plants were transplanted into 150 ml pots with soil. The plants were grown in a climate chamber at a constant temperature of 21-22°C, illumination of 50-70 μmol quanta m−2 s−1and a CO2 concentration of 450 ppm. For the experiments, 45-50 days-old plants were used.
4.3. Determination of Chlorophyll and Carotenoid Content
Chlorophyll content was determined in 96% ethanol extracts [37] .
4.4. Western Blot Analysis
Immunoblotting was performed as described in the protocol of BioRad laboratories. The separation of proteins of the thylakoid membrane, isolated from leaves of 5 to 6-week-old Arabidopsis plants of WT or α-CA2-KO, was carried out by electrophoresis in a 16% polyacrylamide gel in the Mini-PROTEAN Cell (BioRad, USA) under denaturing conditions. PageRuler™ Prestained Protein Ladder (10–180 kDa) (Thermo Fisher Scientific, USA) was used as protein molecular mass markers. After electrophoresis, proteins were transferred onto a PVDF membrane (BioRad, USA) using a wet blotting system Mini Trans-Blot Cell (BioRad, USA). Primary polyclonal rabbit antibodies against Lhcb1, Lhcb2 and D1 proteins (Agrisera, Sweden) were used. Goat anti-rabbit IgG, AP conjugated (BioRad, USA) were used as secondary antibodies. Alkaline phosphatase conjugate substrate kit (BioRad, USA) was used for visualization. Western-blot analysis results were obtained from six independent experiments. The membranes were scanned for further analysis. Quantification of bands on the blots was performed by the Image J software OriginPro package.
4.5. Quantitative Reverse Transcription PCR
Total RNA was extracted from frozen Arabidopsis leaves, using the kit R-plants (Biolabmix, Novosibirsk, Russia) with DNase treatment to eliminate any genomic DNA contamination. Complementary DNA synthesis was performed using the reverse transcription kit OT-1 (Sintol, Moscow, Russia) with oligo (dT) as a primer. Quantitative reverse transcription polymerase chain reaction (qRT-PCR) was performed with qPCRmix-HS SYBR (Evrogen, Moscow, Russia). The sequences of primer used in this study are presented in the Table 2. qRT-PCR data were normalized against the housekeeping Ubiquitin gene. PCR reactions were run in a LightCycler 96 Instrument, Roche Diagnostics GmbH.
4.6. Measurement of Hydrogen Peroxide Content in Leaves
To measure the H2O2 content, plant leaves were taken from the growth chamber after 3 hours of illumination, weighed and frozen in liquid nitrogen. Then they were ground in 0.4 ml of 2 M trichloroacetic acid (TCA) and the homogenate was transferred to test tubes with 3 ml of 0.05 M potassium phosphate buffer. Activated carbon was added to the test tubes to remove chlorophylls, pheophytin and carotenoids. After 1 hour of incubation at 4°C, the homogenate was centrifuged at 10.000 × g for 10 min. The supernatant was titrated with 2 M KOH to pH 7.0. The hydrogen peroxide content was measured in 50 μl of the supernatant using a Lum-101 device (Russia) by the luminescence of a mixture of 5 μM horseradish peroxidase and 50 mM luminol. When constructing the calibration curve, 50 µl of H2O2 of known concentration were used instead of the supernatant.
4.7. Measurement of the Light-Induced Changes of Oxygen Concentration in a Suspension of Isolated Thylakoids
Thylakoids were isolated from Arabidopsis leaves according to [38]. The rate of oxygen evolution/uptake was measured in a thermostatic glass cell with a volume of 0.3 mL at 21°C using Clark-type pO2-electrode connected to the computer via ADC. The reaction mixture in the рО2-electrode vessel was illuminated with red LED, light intensity of 450 μmol quanta m−2 s−1. The basic reaction mixture contained 0.1 M sucrose, 20 mM NaCl, 5 mM MgCl2, 50 mM HEPES-KOH (pH 7.6), and thylakoids corresponding to 10 μg Chl (mL)−1. The total O2 uptake was measured in the presence of the uncoupler gramicidin D (GrD) (1 μM). The production of “membrane” H2O2 was determined by measuring oxygen evolution rate in the thylakoid suspension in presence of cytochrome C at 60 μM concentration, as shown early at this concentration cytochrome C scavenges all superoxide radicals, preventing the formation of hydrogen peroxide in the aqueous phase [18]. In all experiments, 1 μM GrD, 60 μM cytochrome C and 100 units/ml catalase were used to assess “membrane” hydrogen peroxide. The difference between oxygen evolution rate in the presence and absence of catalase, was used to estimate the amount of “membrane” H2O2 formed within the thylakoid.
4.8. Statistical Analysis
Statistical analysis was performed using OriginPro software. Data are presented as mean values with standard errors of the mean. Statistical significance was assessed using analysis of variance (ANOVA) with a Paired Comparison Plot and the Holm-Bonferroni test.
5. Conclusions
The absence of α-CA2 led to an increase in the size of the PSII antenna, as evidenced by an increase in the Chl a/Chl b ratio and in the ABS/RC ratio, as well as by a higher content of the light-harvesting proteins Lhcb1 and Lhcb2. α-CA2 knockout also affected the expression of genes encoding the proteins of LHCII complex: Lhcb1, Lhcb2, and Lhcb3. It was found that the content of hydrogen peroxide in leaves of plants with knocked out α-CA2 encoding gene was lower as compared with WT plants and this presumably led to a change in the size of LHCII through retrograde H2O2 signaling pathways. It was shown that α-CA2 affects the share of H2O2 generated within thylakoid membrane. The revealed changes in the functioning and structure of the photosynthetic electron transport chain in Arabidopsis plants with α-CA2 knockout indicate that this CA is located in the chloroplasts of these plants.
Supplementary Materials
The following supporting information can be downloaded at the website of this paper posted on Preprints.org.
Author Contributions
Elena M. Nadeeva: Conceptualization, Methodology, Review and editing, Writing - Original draft preparation; Natalia N. Rudenko: Conceptualization, Methodology, Review and editing, Writing - Original draft preparation; Lyudmila K. Ignatova: Conceptualization, Methodology, Review and editing; Daria V. Vetoshkina: Conceptualization, Methodology; Boris N. Ivanov: Conceptualization, Review and editing, Writing - Original draft preparation. All authors have read and agreed to the published version of the manuscript.
Funding
This work was supported by The Ministry of Science and Higher Education of the Russian Federation, State Scientific Program, theme no. 075-00607-25-00. The results of Lhcb proteins estimation were obtained with the support by the Russian Science Foundation, grant number 22-74-10088.
Institutional Review Board Statement
Not applicable.
Informed Consent Statement
Not applicable.
Data Availability Statement
The datasets generated during and/or analyzed during the current study are available from the corresponding author on reasonable request.
Acknowledgments
The authors express their gratitude to J.V. Moroney of Louisiana State University for providing the seeds of homozygous lines of T-DNA insertion mutants with knocked out gene of α-CA2. The authors would like to thank Borisova-Mubarakshina M.M. for productive discussion of the results. The study was performed using the equipment of the Shared Core Facilities of the Pushchino Scientific Center for Biological Research (http://www.ckp-rf.ru/ckp/670266/.
Conflicts of Interest
The authors declare no conflicts of interest.
Abbreviations
| α-CA2-KO | α-CA2 knockout |
| WT | wild type |
| CA | carbonic anhydrase |
| LHCII | light-harvesting complex of photosystem II |
| PETC | photosynthetic electron transport chain |
| TF | transcription factor |
| PQ | plastoquinone |
| PQH2 | plastohydroquinone |
| PSII | photosystem II |
| PSI | photosystem I |
| Rubisco | Ribulose Bisphosphate Carboxylase/ oxygenase |
| ABI4 | absciscic acid insensitive 4 |
| GrD | gramicidin D |
References
- Fabre, N.; Reiter, I.M.; Becuwe-Linka, N.; Genty, B.; Rumeau, D. Characterization and Expression Analysis of Genes Encoding ? And ? Carbonic Anhydrases in Arabidopsis. Plant, Cell & Environment 2007, 30, 617–629. [Google Scholar] [CrossRef]
- DiMario, R.J.; Quebedeaux, J.C.; Longstreth, D.J.; Dassanayake, M.; Hartman, M.M.; Moroney, J.V. The Cytoplasmic Carbonic Anhydrases β CA2 and β CA4 Are Required for Optimal Plant Growth at Low CO2. Plant Physiol. 2016, 171, 280–293. [Google Scholar] [CrossRef] [PubMed]
- Villarejo, A.; Burén, S.; Larsson, S.; Déjardin, A.; Monné, M.; Rudhe, C.; Karlsson, J.; Jansson, S.; Lerouge, P.; Rolland, N.; et al. Evidence for a Protein Transported through the Secretory Pathway En Route to the Higher Plant Chloroplast. Nature Cell Biology 2005, 7, 1224–1231. [Google Scholar] [CrossRef]
- Ignatova, L.; Zhurikova, E.; Ivanov, B. The Presence of the Low Molecular Mass Carbonic Anhydrase in Photosystem II of C3 Higher Plants. Journal of Plant Physiology 2019, 232, 94–99. [Google Scholar] [CrossRef]
- Fedorchuk, T.P.; Kireeva, I.A.; Opanasenko, V.K.; Terentyev, V.V.; Rudenko, N.N.; Borisova-Mubarakshina, M.M.; Ivanov, B.N. Alpha Carbonic Anhydrase 5 Mediates Stimulation of ATP Synthesis by Bicarbonate in Isolated Arabidopsis Thylakoids. Frontiers in Plant Science 2021, 12. [Google Scholar] [CrossRef] [PubMed]
- Rudenko, N.N.; Ignatova, L.K.; Ivanov, B.N. Multiple Sources of Carbonic Anhydrase Activity in Pea Thylakoids: Soluble and Membrane-Bound Forms. Photosynthesis Research 2007, 91, 81–89. [Google Scholar] [CrossRef] [PubMed]
- Fedorchuk, T.; Rudenko, N.; Ignatova, L.; Ivanov, B. The Presence of Soluble Carbonic Anhydrase in the Thylakoid Lumen of Chloroplasts from Arabidopsis Leaves. Journal of Plant Physiology 2014, 171, 903–906. [Google Scholar] [CrossRef]
- Rudenko, N.N.; Ivanov, B.N. Unsolved Problems of Carbonic Anhydrases Functioning in Photosynthetic Cells of Higher C3 Plants. Biochemistry (Moscow) 2021, 86, 1243–1255. [Google Scholar] [CrossRef]
- Rudenko, N.N.; Vetoshkina, D.V.; Fedorchuk, T.P.; Ivanov, B.N. Effect of Light Intensity under Different Photoperiods on Expression Level of Carbonic Anhydrase Genes of the α- and β-Families in Arabidopsis Thaliana Leaves. Biochemistry (Moscow) 2017, 82, 1025–1035. [Google Scholar] [CrossRef]
- He, Y.; Duan, W.; Xue, B.; Cong, X.; Sun, P.; Hou, X.; Liang, Y.-K. OsαCA1 Affects Photosynthesis, Yield Potential, and Water Use Efficiency in Rice. IJMS 2023, 24, 5560. [Google Scholar] [CrossRef]
- Wang, L.; Liang, J.; Zhou, Y.; Tian, T.; Zhang, B.; Duanmu, D. Molecular Characterization of Carbonic Anhydrase Genes in Lotus Japonicus and Their Potential Roles in Symbiotic Nitrogen Fixation. IJMS 2021, 22, 7766. [Google Scholar] [CrossRef]
- Weerasooriya, H.N.; Longstreth, D.J.; DiMario, R.J.; Rosati, V.C.; Cassel, B.A.; Moroney, J.V. Carbonic Anhydrases in the Cell Wall and Plasma Membrane of Arabidopsis Thaliana Are Required for Optimal Plant Growth on Low CO2. Front. Mol. Biosci. 2024, 11, 1267046. [Google Scholar] [CrossRef] [PubMed]
- Zhurikova, E.M.; Ignatova, L.K.; Rudenko, N.N.; Mudrik, V.A.; Vetoshkina, D.V.; Ivanov, B.N. Participation of Two Carbonic Anhydrases of the Alpha Family in Photosynthetic Reactions in Arabidopsis Thaliana. Biochemistry (Moscow) 2016, 81, 1182–1187. [Google Scholar] [CrossRef] [PubMed]
- Nadeeva, E.M.; Ignatova, L.K.; Rudenko, N.N.; Vetoshkina, D.V.; Naydov, I.A.; Kozuleva, M.A.; Ivanov, B.N. Features of Photosynthesis in Arabidopsis Thaliana Plants with Knocked Out Gene of Alpha Carbonic Anhydrase 2. Plants 2023, 12, 1763. [Google Scholar] [CrossRef]
- Allen, J.F. [No Title Found]. Photosynthesis Research 2002, 73, 139–148. [Google Scholar] [CrossRef]
- Escoubas, J.M.; Lomas, M.; LaRoche, J.; Falkowski, P.G. Light Intensity Regulation of Cab Gene Transcription Is Signaled by the Redox State of the Plastoquinone Pool. Proc. Natl. Acad. Sci. U.S.A. 1995, 92, 10237–10241. [Google Scholar] [CrossRef]
- Borisova-Mubarakshina, M.M.; Vetoshkina, D.V.; Naydov, I.A.; Rudenko, N.N.; Zhurikova, E.M.; Balashov, N.V.; Ignatova, L.K.; Fedorchuk, T.P.; Ivanov, B.N. Regulation of the Size of Photosystem II Light Harvesting Antenna Represents a Universal Mechanism of Higher Plant Acclimation to Stress Conditions. Functional Plant Biol. 2020, 47, 959. [Google Scholar] [CrossRef] [PubMed]
- Mubarakshina, M.; Khorobrykh, S.; Ivanov, B. Oxygen Reduction in Chloroplast Thylakoids Results in Production of Hydrogen Peroxide inside the Membrane. Biochimica et Biophysica Acta (BBA) - Bioenergetics 2006, 1757, 1496–1503. [Google Scholar] [CrossRef]
- M. Borisova-Mubarakshina, M.; A. Naydov, I.; V. Vetoshkina, D.; A. Kozuleva, M.; V. Vilyanen, D.; N. Rudenko, N.; N. Ivanov, B. M. Borisova-Mubarakshina, M.; A. Naydov, I.; V. Vetoshkina, D.; A. Kozuleva, M.; V. Vilyanen, D.; N. Rudenko, N.; N. Ivanov, B. Photosynthetic Antenna Size Regulation as an Essential Mechanism of Higher Plants Acclimation to Biotic and Abiotic Factors: The Role of the Chloroplast Plastoquinone Pool and Hydrogen Peroxide. In Vegetation Index and Dynamics; Cano Carmona, E., Cano Ortiz, A., Quinto Canas, R., Maria Musarella, C., Eds.; IntechOpen, 2022 ISBN 978-1-83969-385-4.
- Sun, X.; Feng, P.; Xu, X.; Guo, H.; Ma, J.; Chi, W.; Lin, R.; Lu, C.; Zhang, L. A Chloroplast Envelope-Bound PHD Transcription Factor Mediates Chloroplast Signals to the Nucleus. Nat Commun 2011, 2, 477. [Google Scholar] [CrossRef]
- Zhang, Z.-W.; Zhang, G.-C.; Zhu, F.; Zhang, D.-W.; Yuan, S. The Roles of Tetrapyrroles in Plastid Retrograde Signaling and Tolerance to Environmental Stresses. Planta 2015, 242, 1263–1276. [Google Scholar] [CrossRef]
- Yurina, N.P.; Odintsova, M.S. Chloroplast Retrograde Signaling System. Russ J Plant Physiol 2019, 66, 509–520. [Google Scholar] [CrossRef]
- Wetzel, C.M.; Harmacek, L.D.; Yuan, L.H.; Wopereis, J.L.M.; Chubb, R.; Turini, P. Loss of Chloroplast Protease SPPA Function Alters High Light Acclimation Processes in Arabidopsis Thaliana L. (Heynh.). Journal of Experimental Botany 2009, 60, 1715–1727. [Google Scholar] [CrossRef] [PubMed]
- Adam, Z. Plastid Intramembrane Proteolysis. Biochimica et Biophysica Acta (BBA) - Bioenergetics 2015, 1847, 910–914. [Google Scholar] [CrossRef] [PubMed]
- Lindahl, M.; Yang, D.; Andersson, B. Regulatory Proteolysis of the Major Light-Harvesting Chlorophyll a/b Protein of Photosystem II by a Light-Induced Membrane-Associated Enzymic System. European Journal of Biochemistry 1995, 231, 503–509. [Google Scholar] [CrossRef]
- Frigerio, S.; Campoli, C.; Zorzan, S.; Fantoni, L.I.; Crosatti, C.; Drepper, F.; Haehnel, W.; Cattivelli, L.; Morosinotto, T.; Bassi, R. Photosynthetic Antenna Size in Higher Plants Is Controlled by the Plastoquinone Redox State at the Post-Transcriptional Rather than Transcriptional Level. Journal of Biological Chemistry 2007, 282, 29457–29469. [Google Scholar] [CrossRef]
- Ballottari, M.; Dall’Osto, L.; Morosinotto, T.; Bassi, R. Contrasting Behavior of Higher Plant Photosystem I and II Antenna Systems during Acclimation. Journal of Biological Chemistry 2007, 282, 8947–8958. [Google Scholar] [CrossRef]
- Stirbet, A. ; Govindjee On the Relation between the Kautsky Effect (Chlorophyll a Fluorescence Induction) and Photosystem II: Basics and Applications of the OJIP Fluorescence Transient. Journal of Photochemistry and Photobiology B: Biology 2011, 104, 236–257. [Google Scholar] [CrossRef]
- Borisova-Mubarakshina, M.M.; Ivanov, B.N.; Vetoshkina, D.V.; Lubimov, V.Y.; Fedorchuk, T.P.; Naydov, I.A.; Kozuleva, M.A.; Rudenko, N.N.; Dall’Osto, L.; Cazzaniga, S.; et al. Long-Term Acclimatory Response to Excess Excitation Energy: Evidence for a Role of Hydrogen Peroxide in the Regulation of Photosystem II Antenna Size. EXBOTJ 2015, 66, 7151–7164. [Google Scholar] [CrossRef]
- Borisova-Mubarakshina, M.M.; Vetoshkina, D.V.; Rudenko, N.N.; Shirshikova, G.N.; Fedorchuk, T.P.; Naydov, I.A.; Ivanov, B.N. The Size of the Light-Harvesting Antenna of Higher Plant Photosystem Ii Is Regulated by Illumination Intensity through Transcription of Antenna Protein Genes. Biochemistry Moscow 2014, 79, 520–523. [Google Scholar] [CrossRef]
- Foyer, C.H.; Noctor, G. Redox Regulation in Photosynthetic Organisms: Signaling, Acclimation, and Practical Implications. Antioxidants & Redox Signaling 2009, 11, 861–905. [Google Scholar] [CrossRef]
- Biver, S.; Portetelle, D.; Vandenbol, M. Characterization of a New Oxidant-Stable Serine Protease Isolated by Functional Metagenomics. SpringerPlus 2013, 2, 410. [Google Scholar] [CrossRef] [PubMed]
- Zmijewski, J.W.; Banerjee, S.; Bae, H.; Friggeri, A.; Lazarowski, E.R.; Abraham, E. Exposure to Hydrogen Peroxide Induces Oxidation and Activation of AMP-Activated Protein Kinase*. Journal of Biological Chemistry 2010, 285, 33154–33164. [Google Scholar] [CrossRef] [PubMed]
- Minagawa, J. Dynamic Reorganization of Photosynthetic Supercomplexes during Environmental Acclimation of Photosynthesis. Front. Plant Sci. 2013, 4. [Google Scholar] [CrossRef] [PubMed]
- Gomes, M.T.G.; Da Luz, A.C.; Dos Santos, M.R.; Do Carmo Pimentel Batitucci, M.; Silva, D.M.; Falqueto, A.R. Drought Tolerance of Passion Fruit Plants Assessed by the OJIP Chlorophyll a Fluorescence Transient. Scientia Horticulturae 2012, 142, 49–56. [Google Scholar] [CrossRef]
- Asrar, H.; Hussain, T.; Hadi, S.M.S.; Gul, B.; Nielsen, B.L.; Khan, M.A. Salinity Induced Changes in Light Harvesting and Carbon Assimilating Complexes of Desmostachya Bipinnata (L.) Staph. Environmental and Experimental Botany 2017, 135, 86–95. [Google Scholar] [CrossRef]
- Lichtenthaler, H.K. [34] Chlorophylls and Carotenoids: Pigments of Photosynthetic Biomembranes. In Methods in Enzymology; Elsevier, 1987; Vol. 148, pp. 350–382 ISBN 978-0-12-182048-0.
- Casazza, A.P.; Tarantino, D.; Soave, C. Preparation and Functional Characterization of Thylakoids from Arabidopsis Thaliana. Photosynthesis Research 2001, 68, 175–180. [Google Scholar] [CrossRef]
Figure 1.
Parameters derived from OJIP kinetics for A. thaliana leaves: Fv/Fm (A), ABS/RC (B), and DI0/RC (C) in WT (grey boxes) and α-CA2-KO plants (line 9-11 – green box, line 8-3 – purple box). Fv/Fm – the PSII maximal quantum yield, DIo/RC – the quantum yield of energy dissipation, and ABS/RC – characterizing the apparent antenna size. Data are presented as box charts where boxes are ranges of values that accounted for 50% of all measurements (between 25 and 75% quartiles); the mean values are indicated by dots inside the boxes; the horizontal line inside the box is the median. Different letters indicate significant differences at p < 0.05, n ≥ 20.
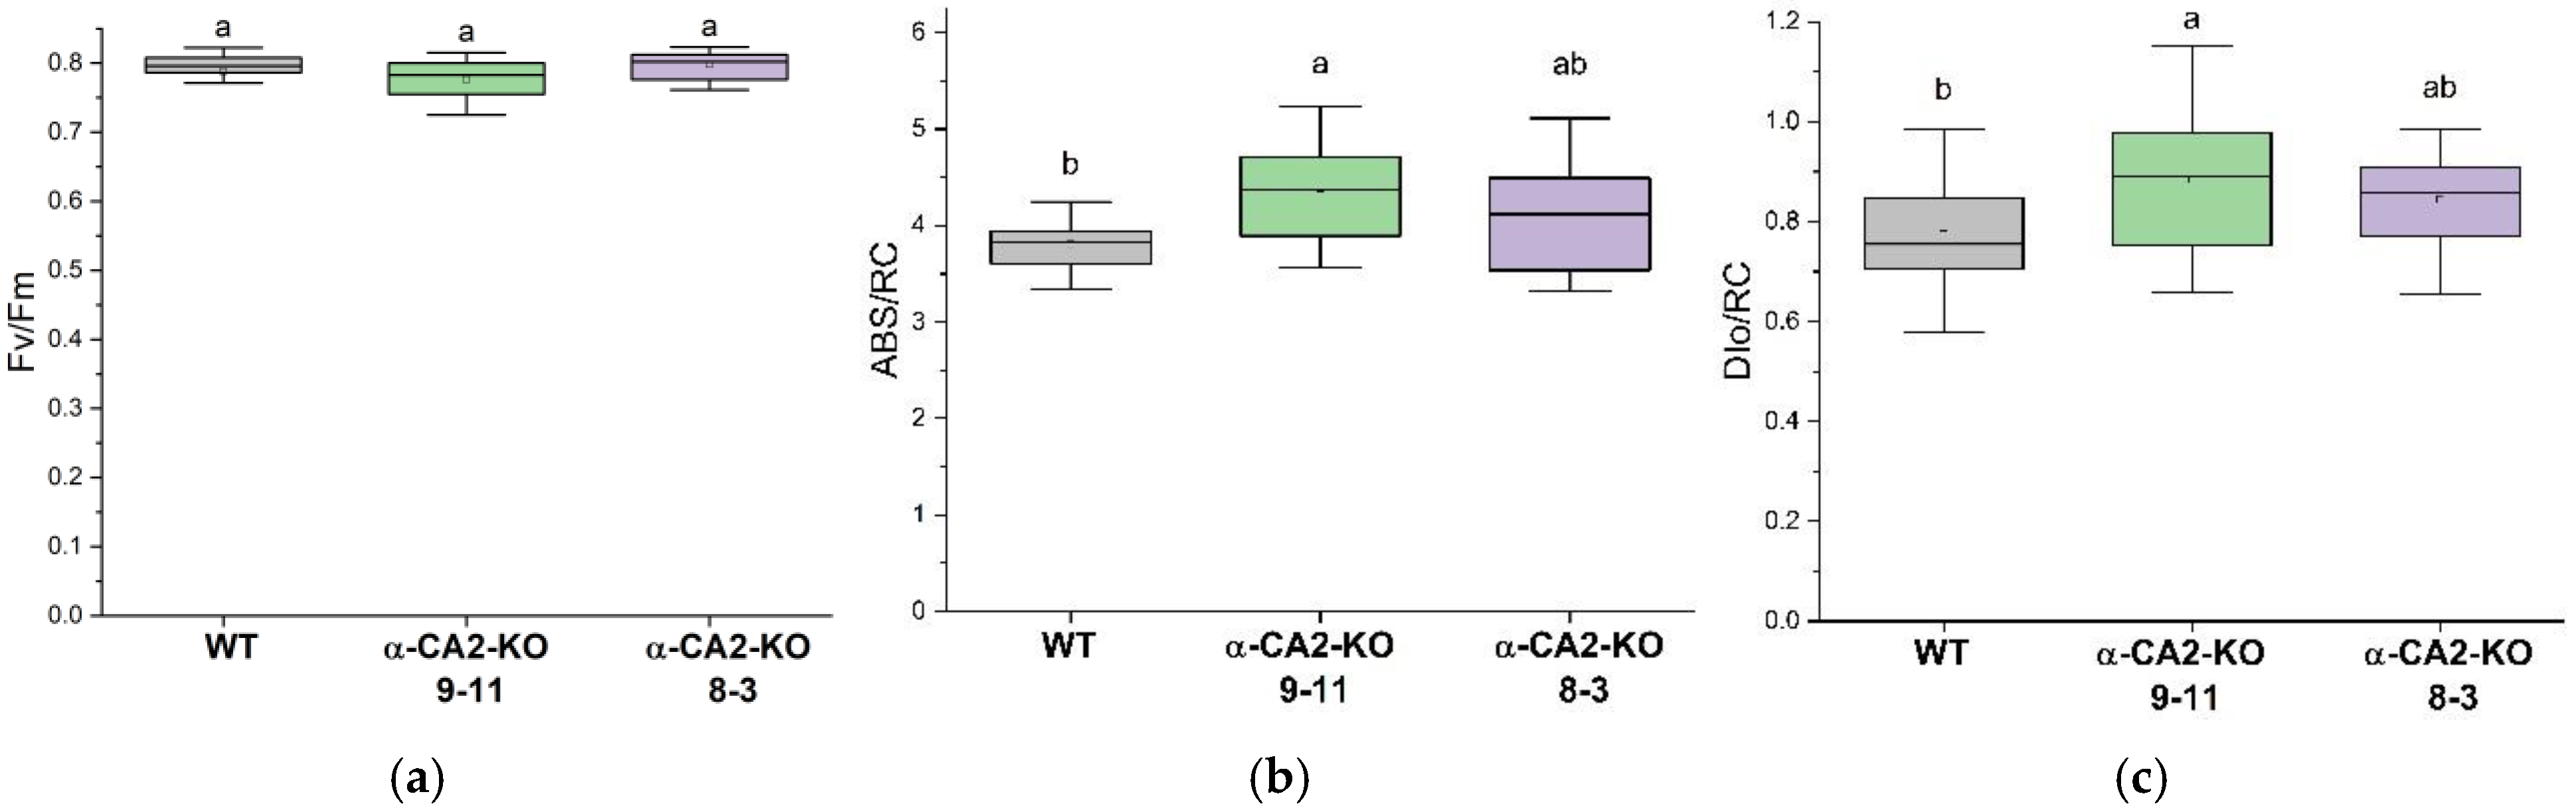
Figure 2.
The result of immunoblotting after denaturing electrophoresis of thylakoid membranes isolated from leaves of WT (grey bars) and α-CA2-KO plants (line 9-11 – green bars, line 8-3 – purple bars) grown at light intensity of 50 μmol quanta m-2 s-1, with antibodies against Lhcb1 (A), Lhcb2 (B) and the major protein of PSII, D1 (C). Numbers on the top of the photos of PVDF membranes indicate the chlorophyll contents (μg) in samples. The data for the mutant lines are given in % of those of WT. In panel A, thylakoid membranes from plants grown in two independent experiments are shown on the left and right sides of the dashed line. B and C – preparations of thylakoid membranes isolated from plants of one cultivation. The results of densitometric analysis of these proteins are presented as percentages in panels D, E, and F, respectively. The experiments were performed six times. Data are shown as mean ± the SE. Different letters indicate significant differences at p < 0.05.
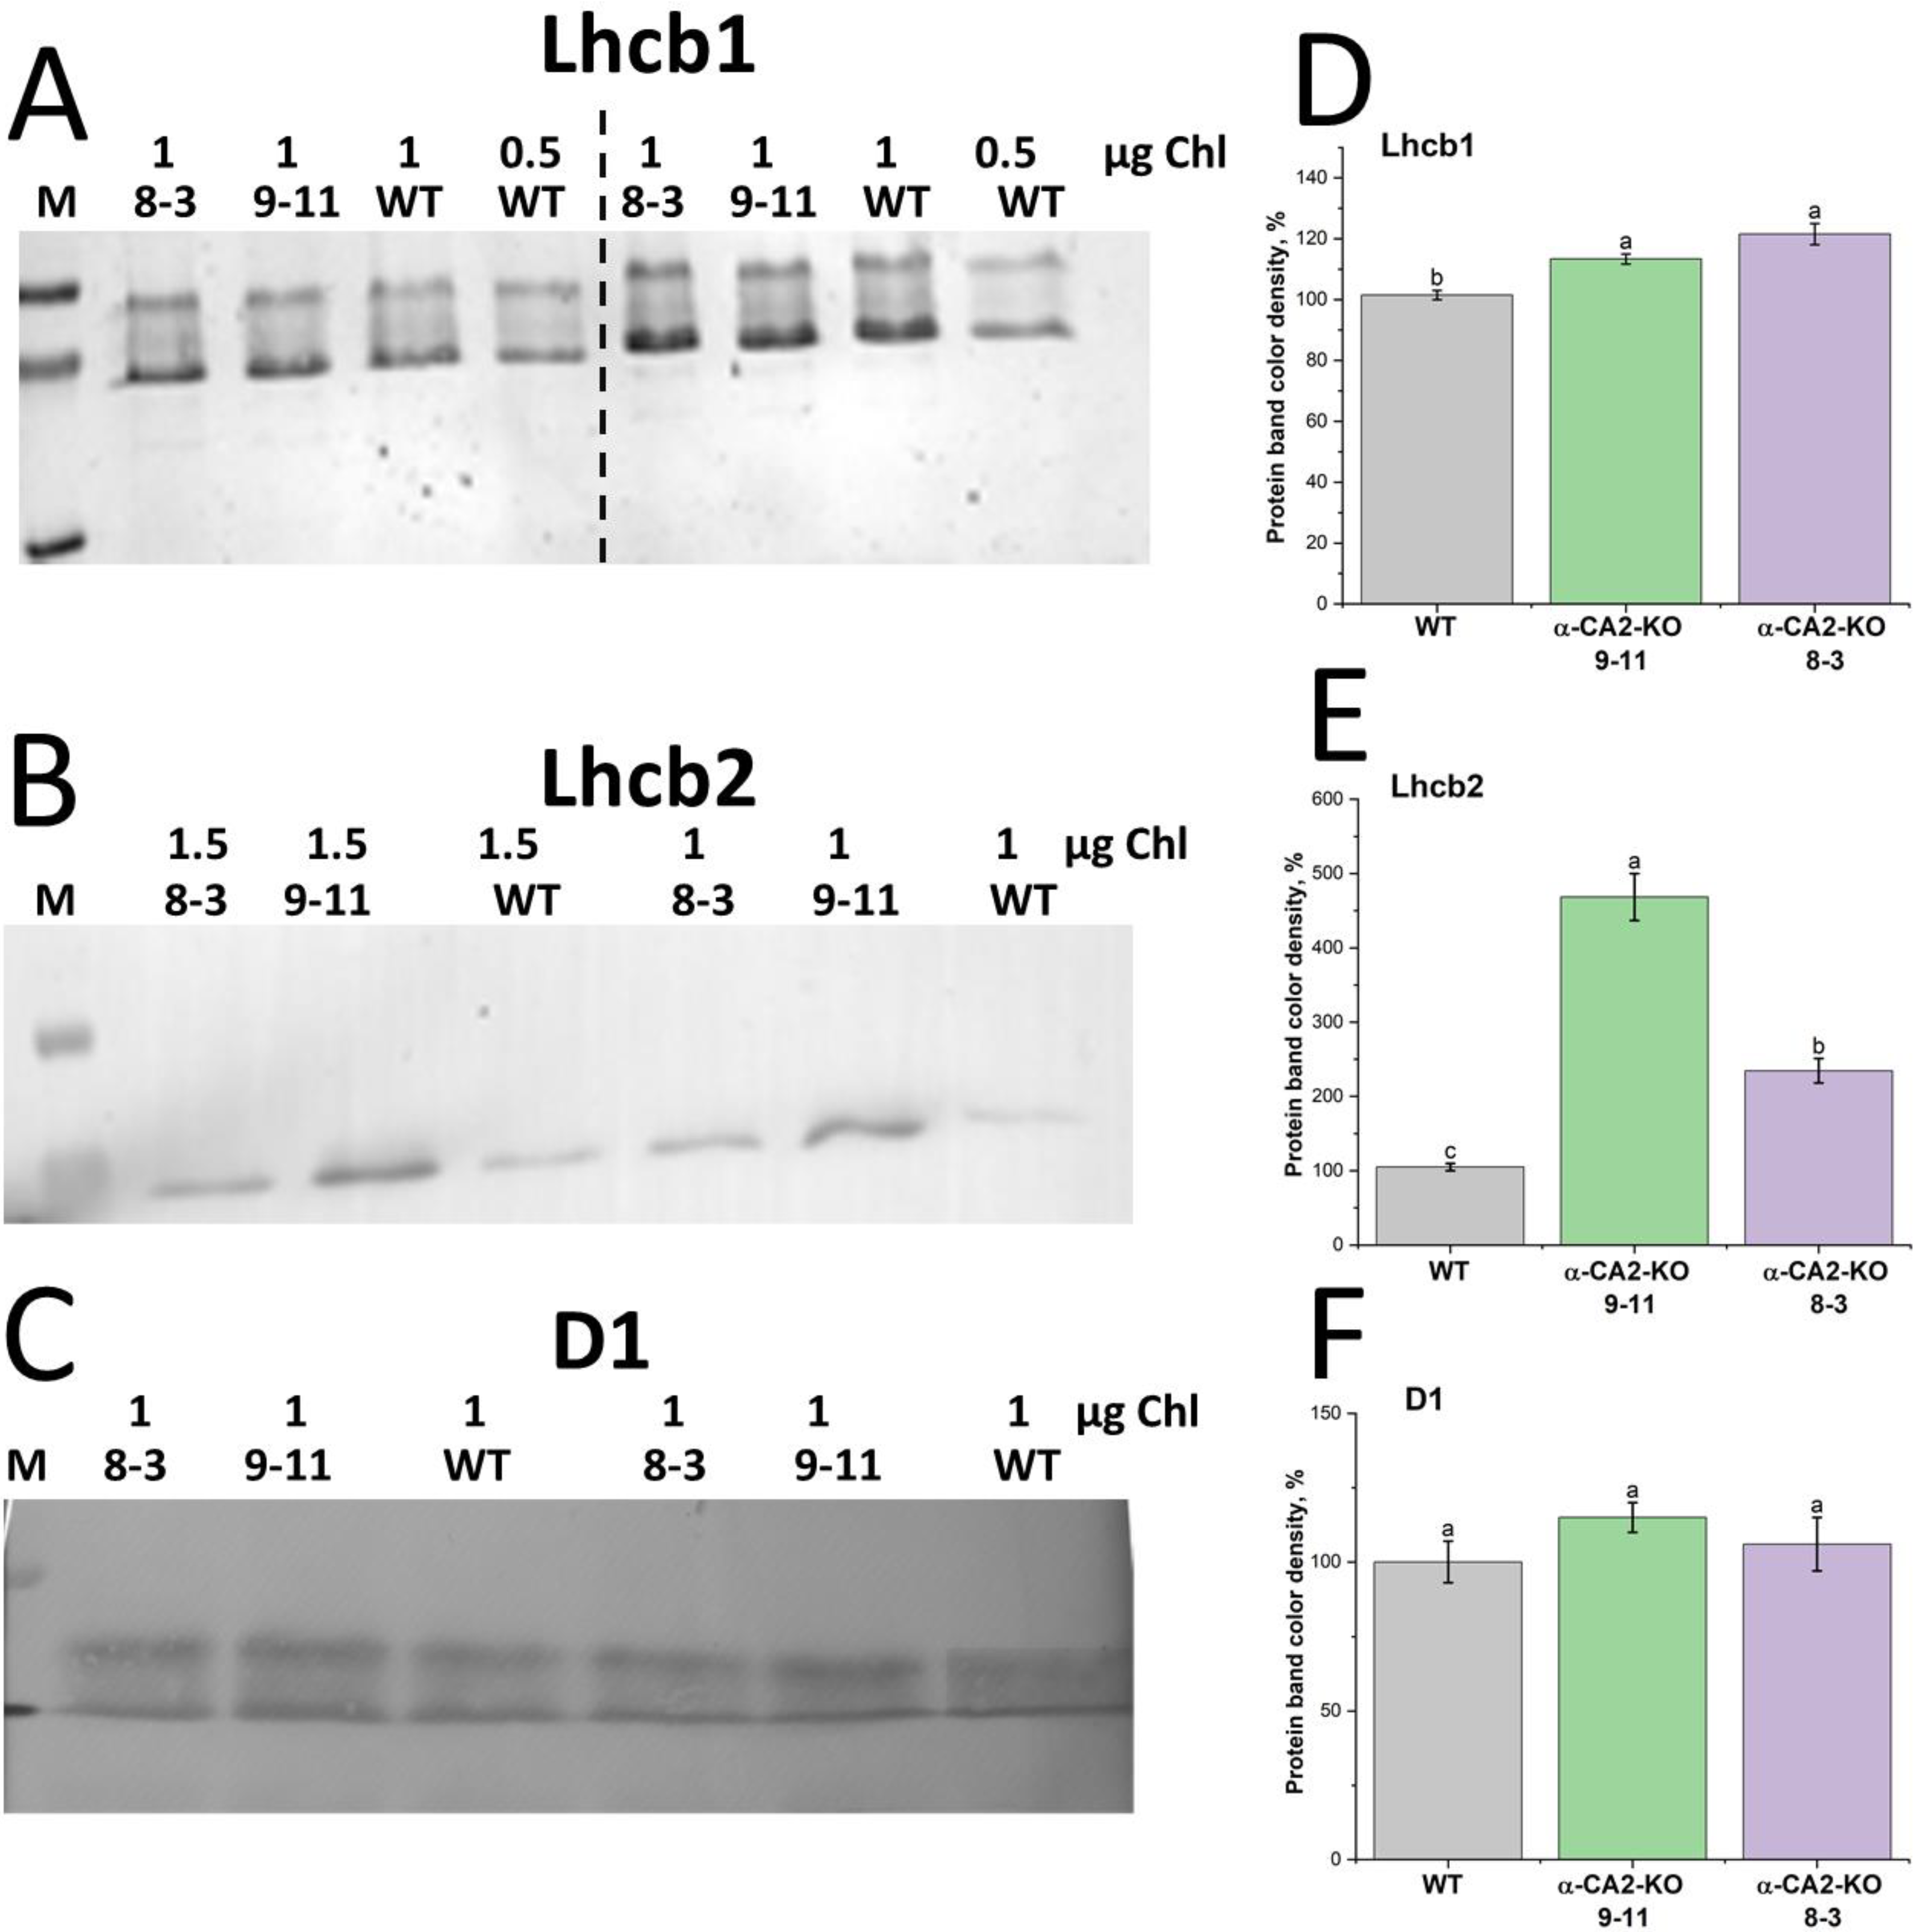
Figure 3.
Expression levels of genes encoding PSII light-harvesting complex proteins in WT plants (grey bars) and α-CA2-KO plants (line 9-11 – green bars, line 8-3 – purple bars) grown at 50 μmol quanta m−2 s−1. Data are shown as mean ± the SE. Different letters indicate significant differences at p < 0.05.
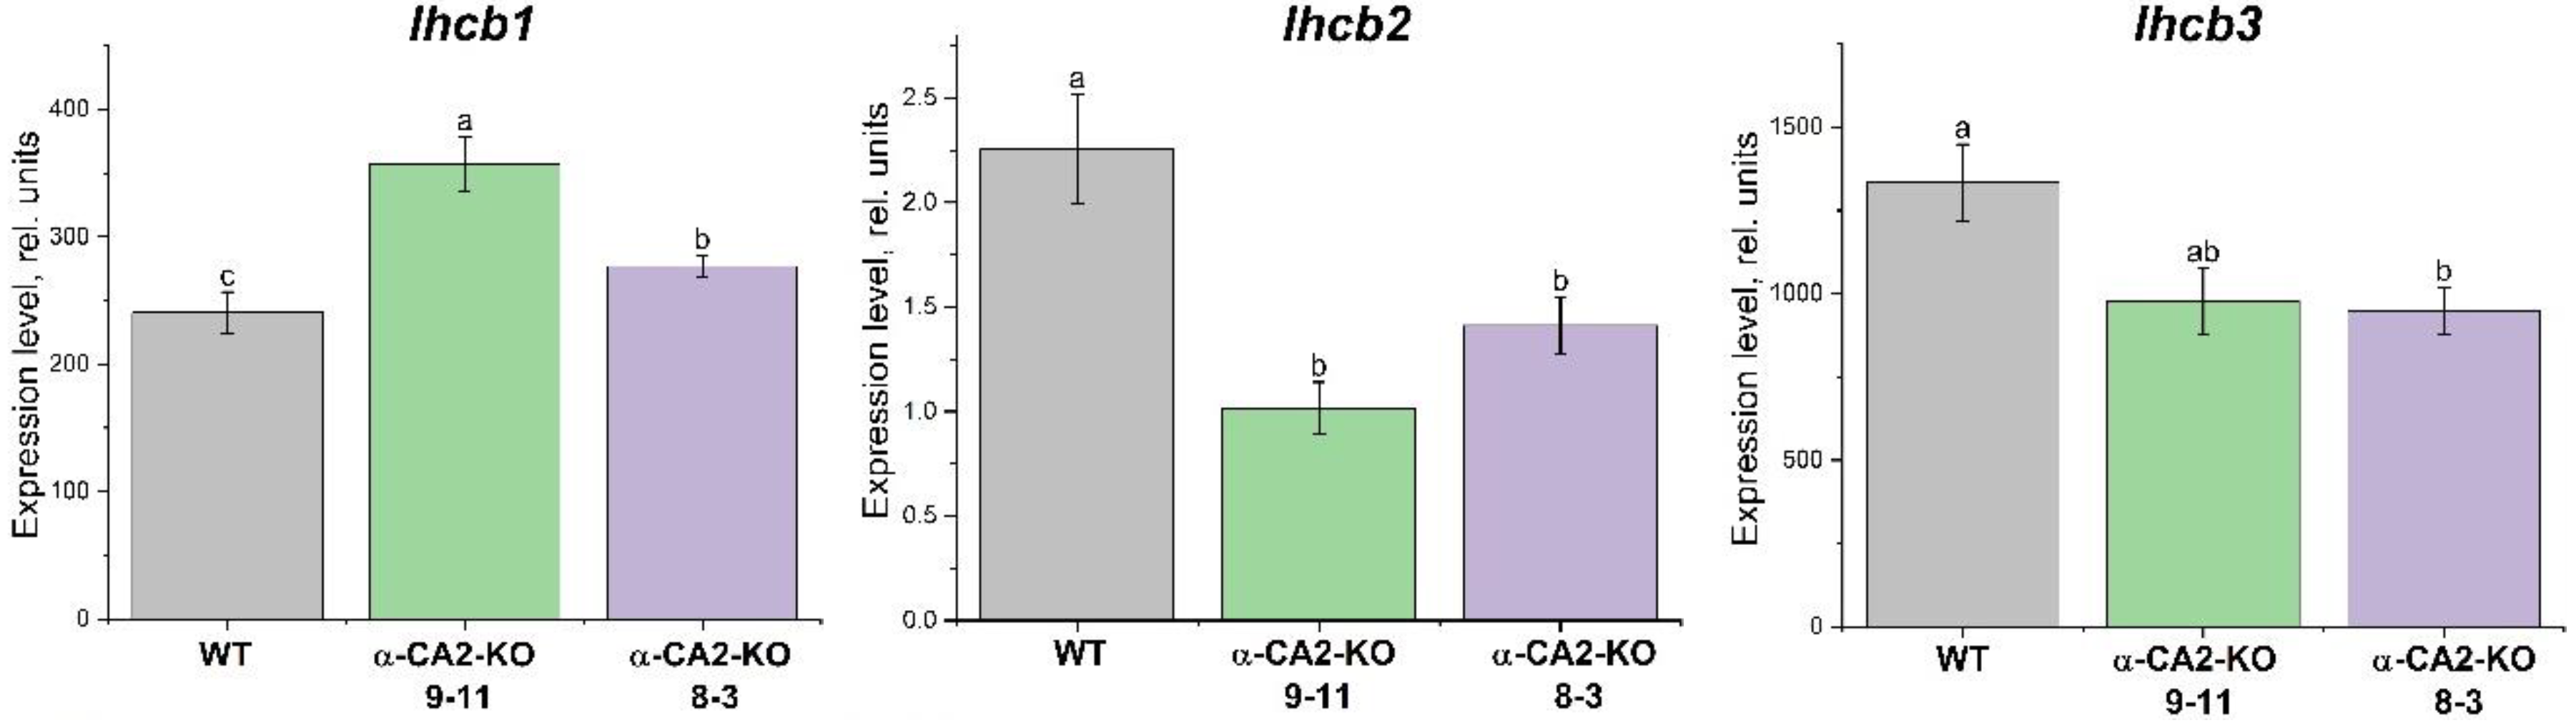
Figure 4.
The content of hydrogen peroxide in leaves of WT plants (grey bars) and α-CA2-KO plants (line 9-11 – green bars, line 8-3 – purple bars) after three hours of illumination at 50 μmol quanta m-2s-1. Data are shown as mean ± the SE. Different letters indicate significant differences at p < 0.05.
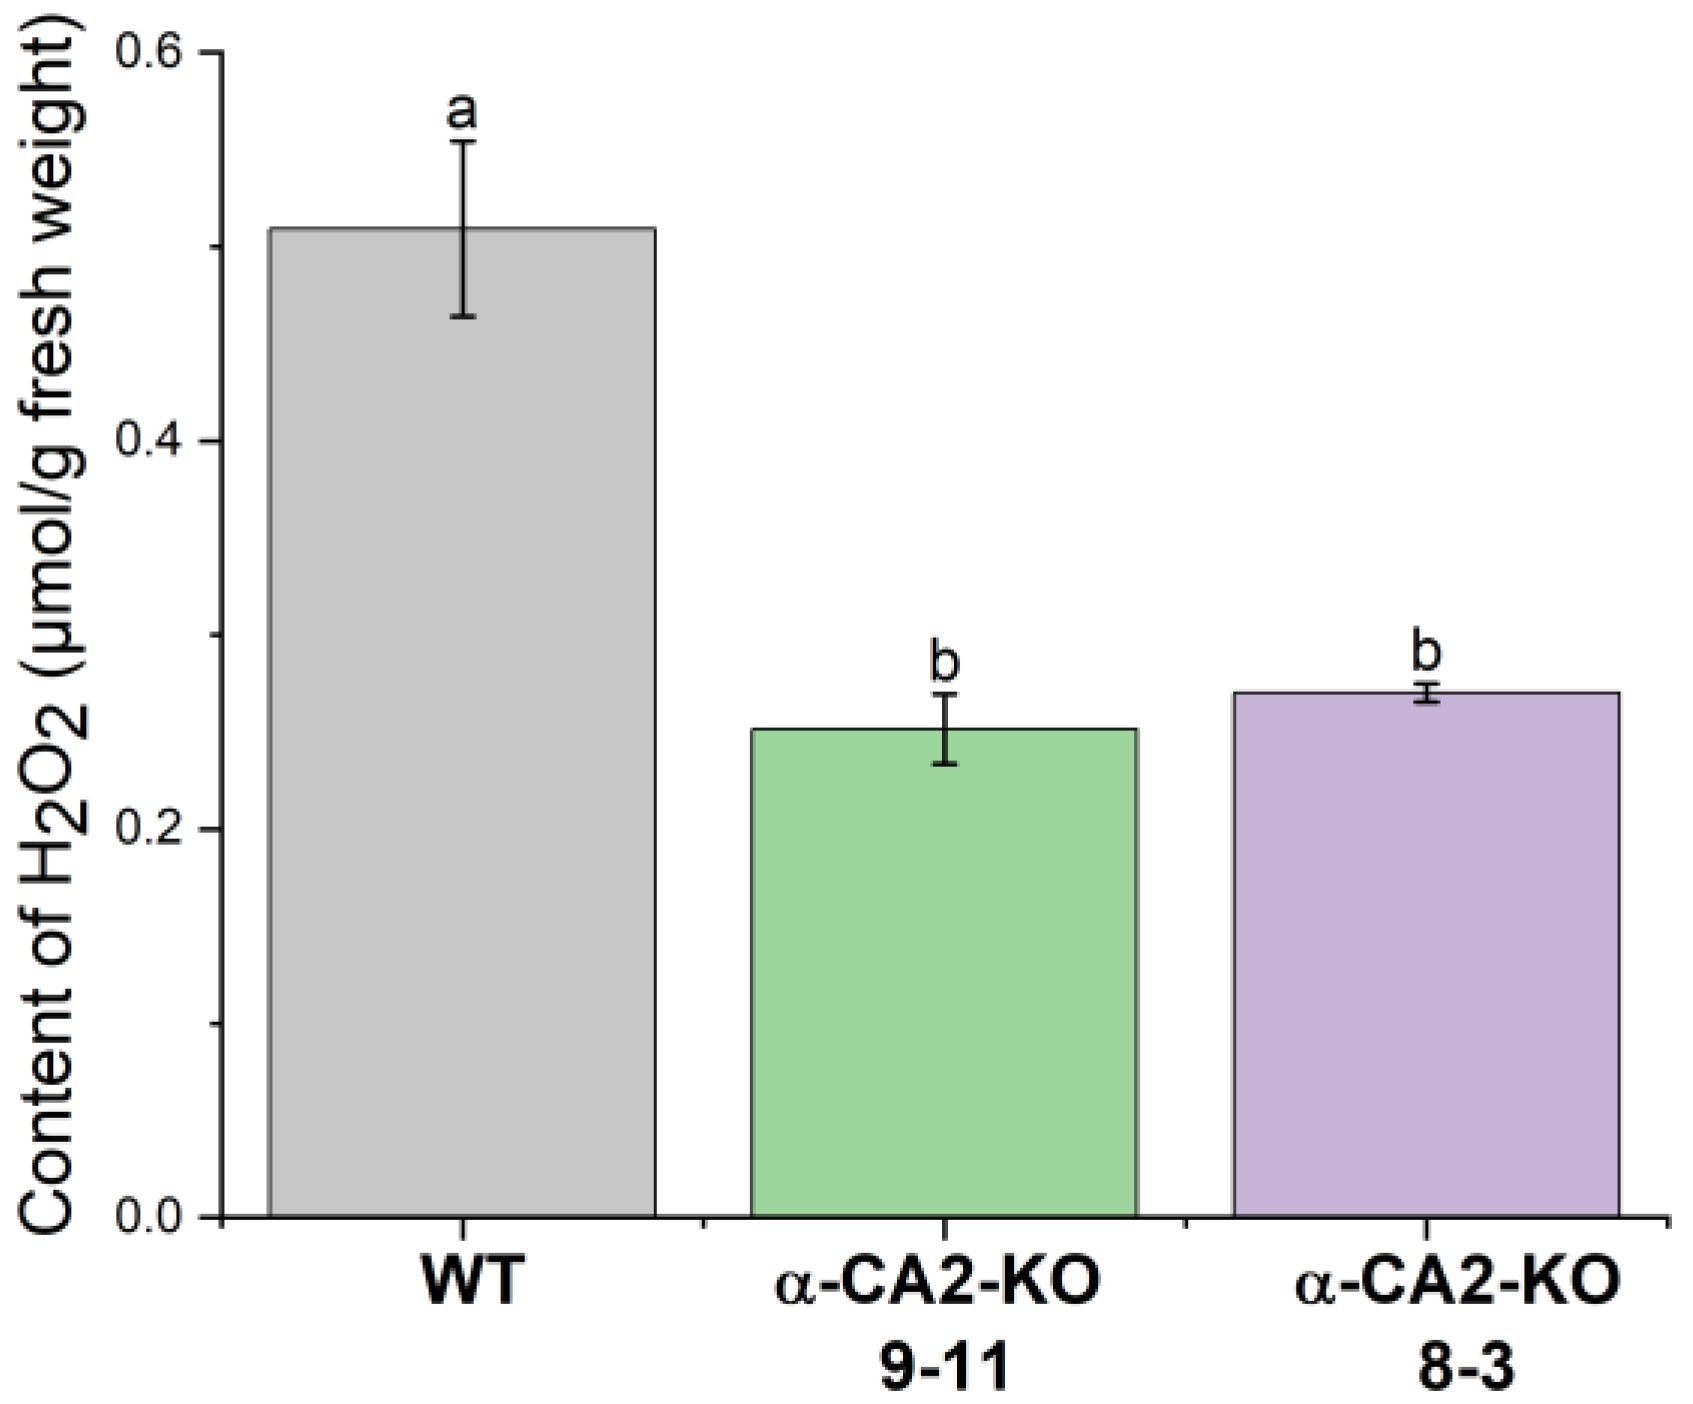
Figure 5.
The rate of H2O2 formation without (total H2O2) and in the presence of 60 μM cytochrome C (membrane H2O2) under high light illumination (500 μmol quanta m-2s-1) in the thylakoids isolated from WT plants (grey bars) and α-CA2-KO plants (line 9-11 – green bars, line 8-3 – purple bars) grown at 50 μmol quanta m-2s-1. Data are shown as mean ± the SE. Different letters indicate significant differences at p < 0.05.
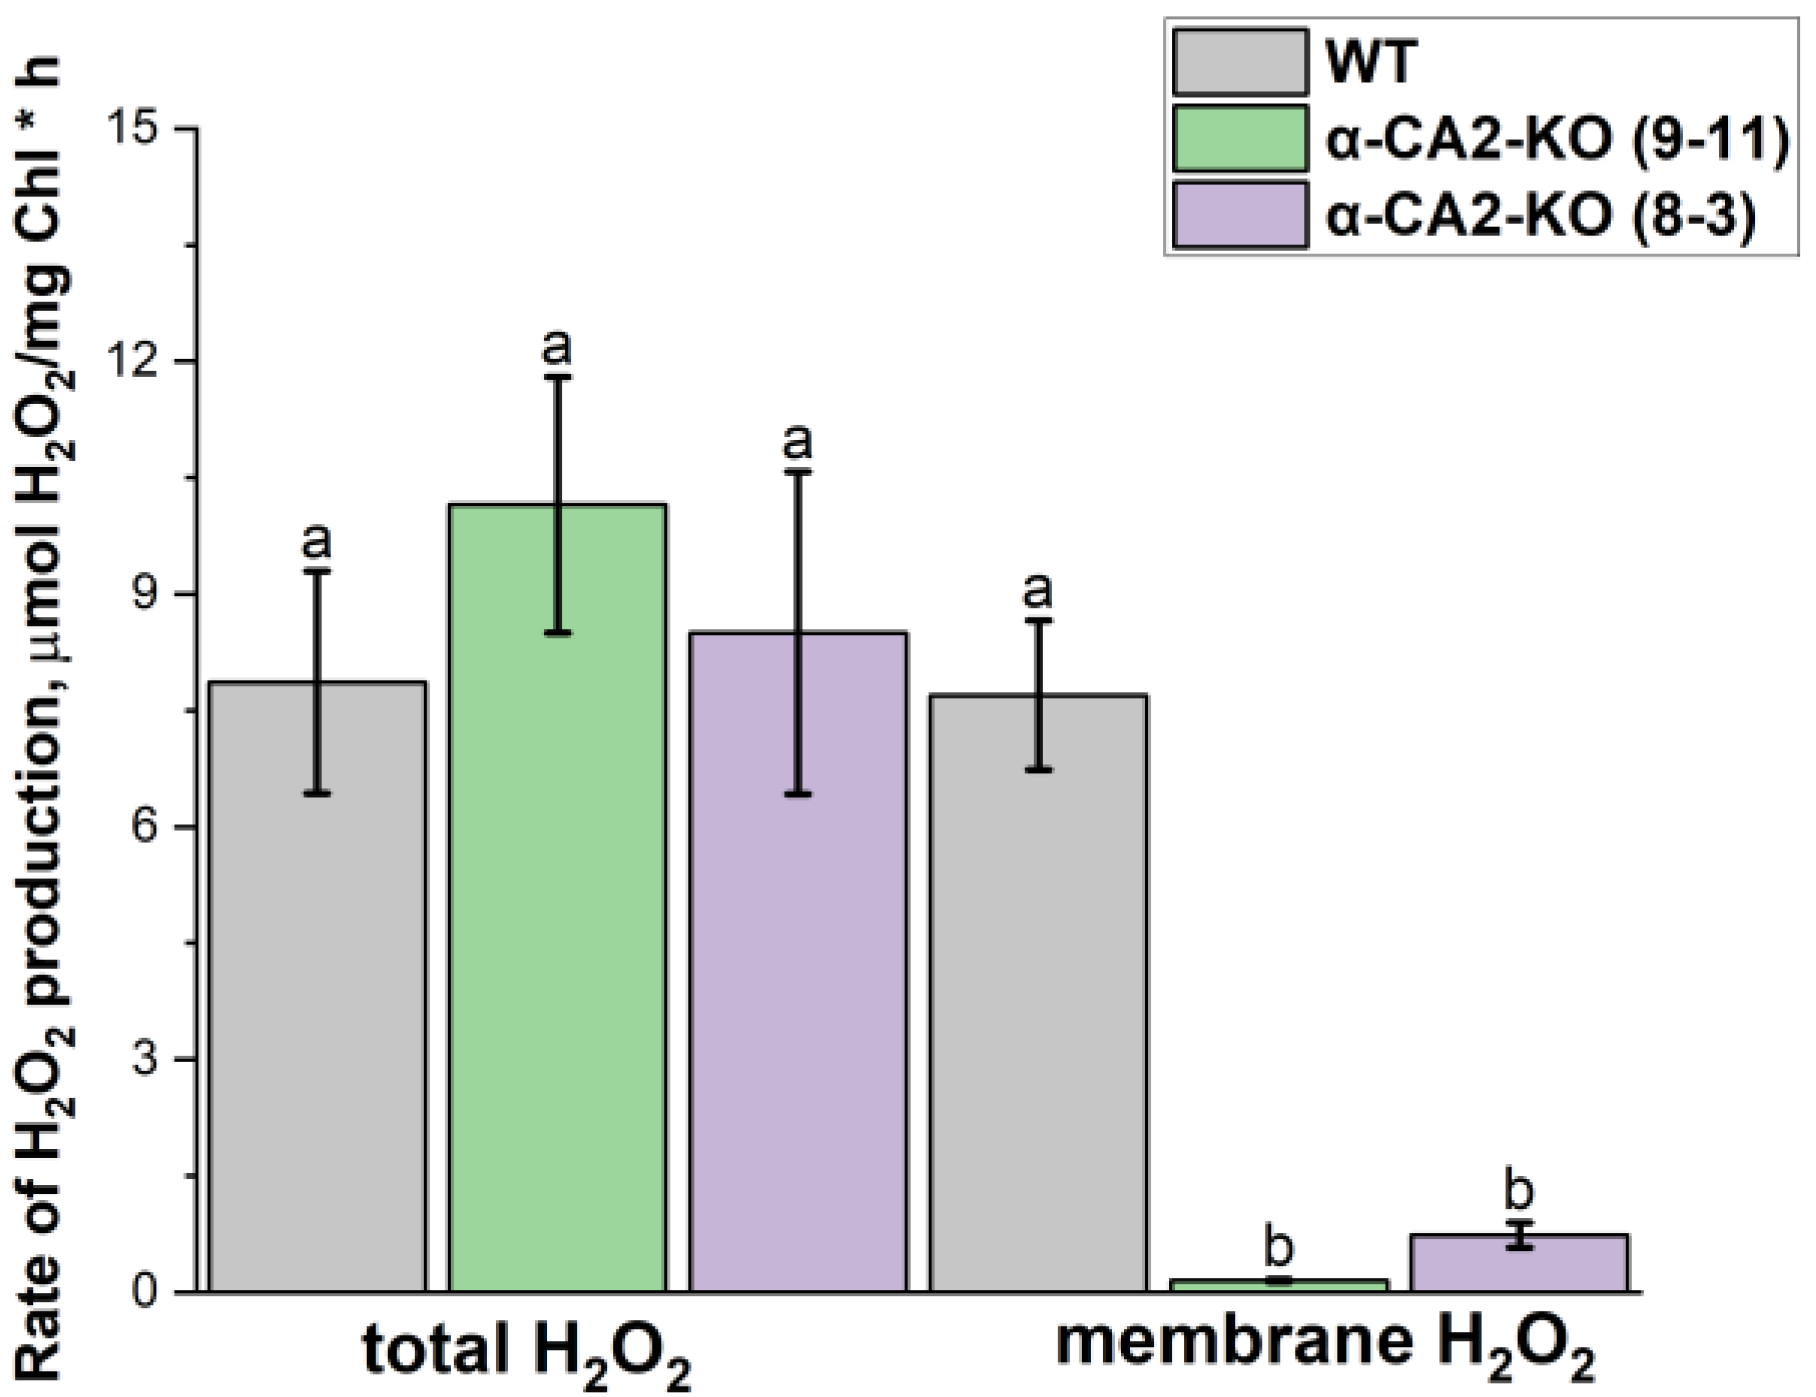
Figure 6.
Expression levels of the genes encoding ABI4, PTM, ASP and SPPA1 in WT plants (grey bars) and α-CA2-KO plants (line 9-11 – green bars, line 8-3 – purple bars) grown at 50 μmol quanta m-2s-1. Data are shown as mean ± the SE. Different letters indicate significant differences at p < 0.05.
Figure 6.
Expression levels of the genes encoding ABI4, PTM, ASP and SPPA1 in WT plants (grey bars) and α-CA2-KO plants (line 9-11 – green bars, line 8-3 – purple bars) grown at 50 μmol quanta m-2s-1. Data are shown as mean ± the SE. Different letters indicate significant differences at p < 0.05.
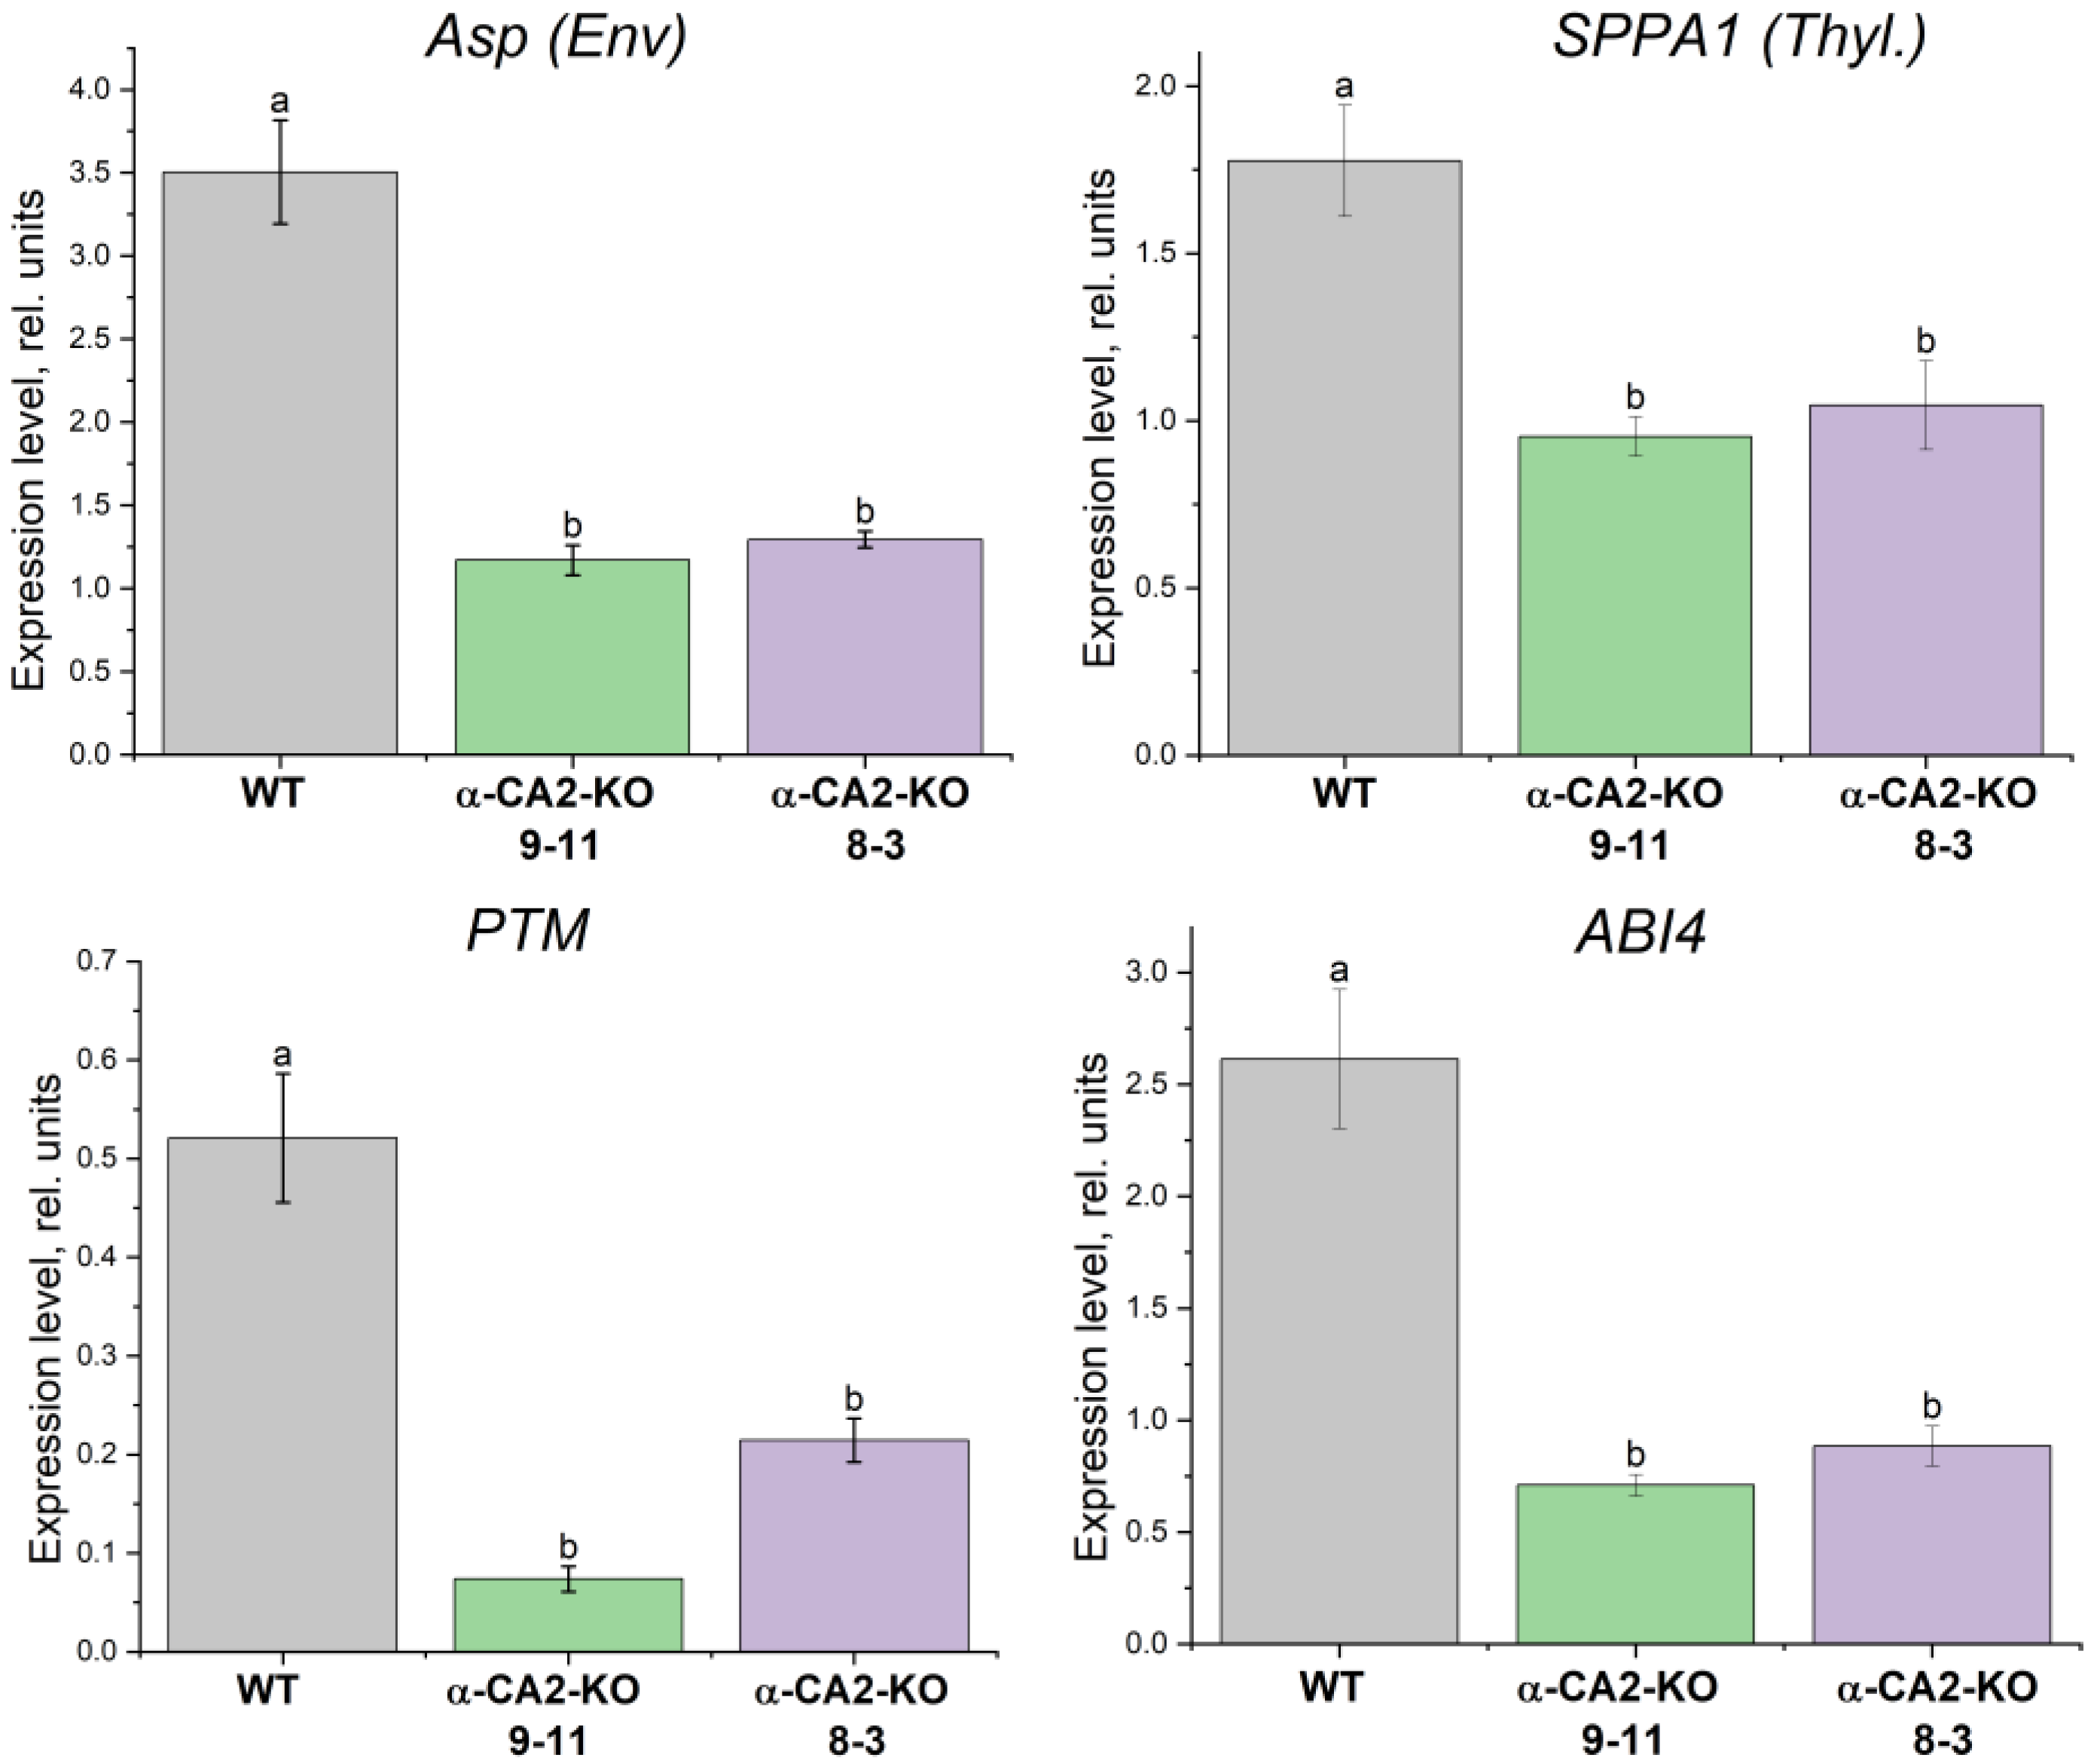

Table 1.
Content of Chl a, Chl b, carotenoids and Chl a/Chl b ratio in leaves of WT plants and α-CA2-KO mutants grown under illumination of 70 μmol quanta m-2s-1. Data are shown as mean ± the SE. Significant differences are indicated by *, p ≤ 0.05.
Table 1.
Content of Chl a, Chl b, carotenoids and Chl a/Chl b ratio in leaves of WT plants and α-CA2-KO mutants grown under illumination of 70 μmol quanta m-2s-1. Data are shown as mean ± the SE. Significant differences are indicated by *, p ≤ 0.05.
| Plants | Pigment Content (mg/g Fresh Weight) | |||
|---|---|---|---|---|
| Chl a | Chl b | Chl a/Chl b | Carotenoids | |
| WT | 0.71 ± 0.06 | 0.29 ± 0.02 | 2.45 ± 0.06 | 0.15 ± 0.02 |
| α-CA2-KO (9-11) | 0.87 ± 0.09 | 0.41 ± 0.04* | 2.12± 0.01 | 0.17 ± 0.02 |
| α-CA2-KO (8-3) | 0.89 ± 0.07 | 0.38 ± 0.02* | 2.34 ± 0.01 | 0.18 ± 0.02 |
Significant differences are indicated by *, p ≤ 0.05, n ≥ 3.
Table 2.
Primers used for qRT-PCR. F is the “forward” and R is the “reverse” primer.
| Genes | Nucleotide Sequences of Primers | |
|---|---|---|
| At1g73990Arabidopsis Serin Protease (SPPA) gene) | F | TCATTCTCGTGGTCTAATAGATGCTGTC |
| R | CGT CGA GCA GTC CTT TTA ATG TTC TG | |
| At2g32480 (Arabidopsis Serin Protease (ASP) gene) | F | TGTGGGAAGGGAGTTTATGGGG |
| R | GCTGCGAATTGGTAAAGCCC | |
| At5g35210 (Arabidopsis PTM gene) | F | TGA AAAGGGTCTGAGATATTCATATAA GAGATCA |
| R | GAGCACTCTGAGTCCAAGCAT | |
| At2g40220 (Arabidopsis ABI4 gene) | F | GTTGGAGATGGATCTTCGACCATTT |
| R | TTG ACC GAC CTT AGG GAT GCT | |
| At1g29930(Arabidopsis Lhcb1 gene) | F | AGCTCAAGAACGGAAGATTGG |
| R | GCCAAATGGTCAGCAAGGTT | |
| At2g05070(Arabidopsis Lhcb2 gene) | F | GTCCATACCAGATGCTTTGGGGAG |
| R | CTCACACTCTCTCTTCAATCCTTTCCTTTCAT | |
| At5g25760 (Arabidopsis Ubiquitin gene) | F | TGCTTGGAGTCCTGCTTGGA |
| R | TGTGCCATTGAATTGAACCCTCT | |
Disclaimer/Publisher’s Note: The statements, opinions and data contained in all publications are solely those of the individual author(s) and contributor(s) and not of MDPI and/or the editor(s). MDPI and/or the editor(s) disclaim responsibility for any injury to people or property resulting from any ideas, methods, instructions or products referred to in the content. |
© 2025 by the authors. Licensee MDPI, Basel, Switzerland. This article is an open access article distributed under the terms and conditions of the Creative Commons Attribution (CC BY) license (http://creativecommons.org/licenses/by/4.0/).
Copyright: This open access article is published under a Creative Commons CC BY 4.0 license, which permit the free download, distribution, and reuse, provided that the author and preprint are cited in any reuse.


