Submitted:
12 May 2025
Posted:
13 May 2025
You are already at the latest version
Abstract
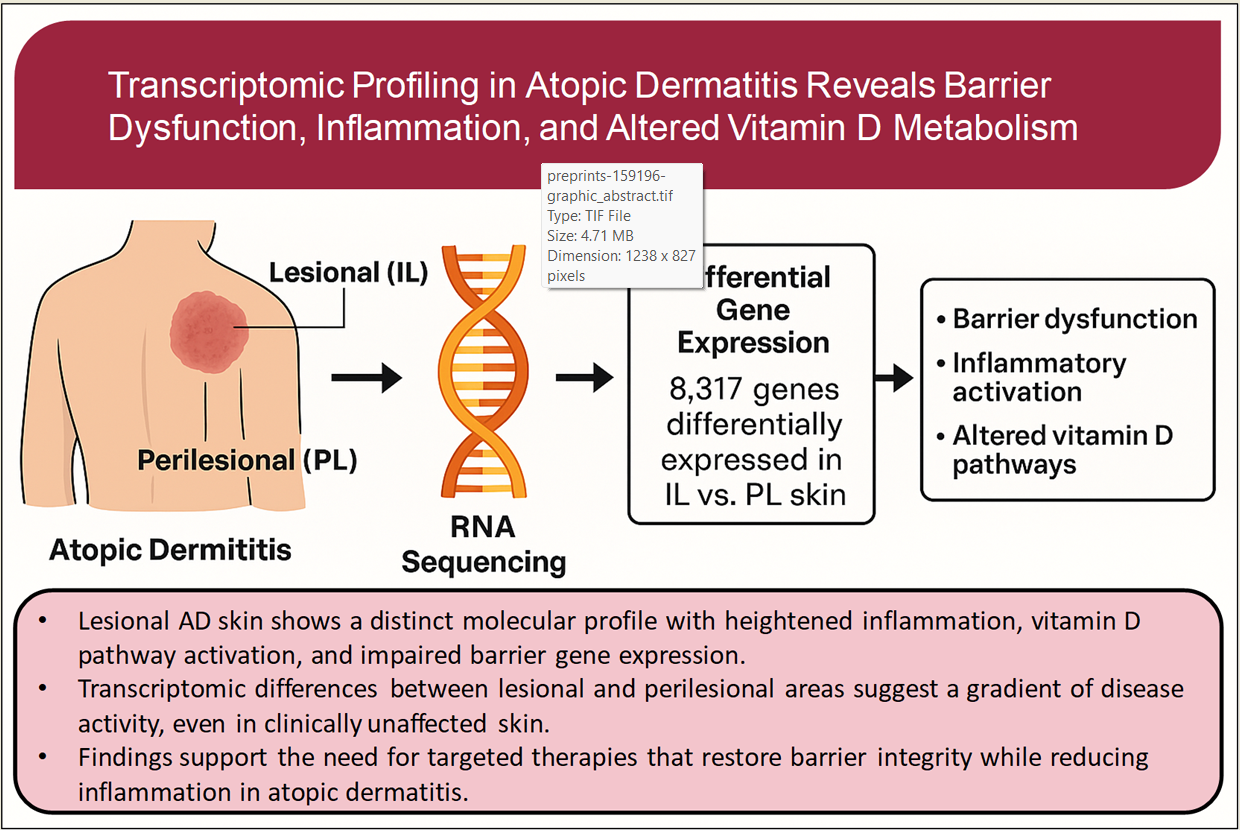
Atopic dermatitis (AD) is a chronic inflammatory skin disease marked by impaired barrier func-tion and immune dysregulation. This study explores transcriptomic differences between lesional (IL) and perilesional (PL) skin in patient with AD, focusing on barrier-related and vitamin D–associated pathways. RNA sequencing was performed on matched IL and PL biopsies from 21 adults with moderate-to-severe AD. Differential gene expression, pathway enrichment, and cor-relation analysis with clinical variables were assessed. A total of 8,817 genes were differentially expressed in IL versus PL skin (padj<0.05). Among genes with highest level of dysregulation, strong upregulation was observed for inflammatory mediators (IL-19, IL-8, CXCL6), and epi-dermal remodeling and barrier-disrupting proteins (MMP1, GJB2). Vitamin D pathway enzymes CYP27B1 and CYP24A1 were also significantly upregulated. In contrast, key barrier-related genes such as FLG2 and CGNL1 were markedly downregulated. While some patterns in gene expression showed subgroup-specific trends, no independent clinical predictors emerged in multivariate models. Reactome pathway analysis revealed enrichment of pathways involved in keratinization, cornified envelope formation, IL-4/IL-13 signaling, chemokine activity, and antimicrobial re-sponses, highlighting coordinated structural and immunologic dysregulation in lesional skin. Lesional skin in AD displays a distinct transcriptomic profile marked by barrier impairment, heightened inflammatory signaling, and activation of vitamin D–related pathways. These findings enhance our understanding of the molecular mechanisms underlying inflammation in AD.
Keywords:
atopic dermatitis
; vitamin D receptor
; skin barrier maintenance
; gene expression
1. Introduction
Atopic dermatitis (AD) is a chronic inflammatory skin disease that affects both children and adults, characterized by relapsing eczematous lesions, pruritus, and a significant impact on quality of life [1]. The pathogenesis of AD involves a complex interplay of epidermal barrier dysfunction, immune dysregulation, microbial colonization, and genetic predisposition [2]. A hallmark of AD is the dominance of a type-2 immune response, mediated primarily by Th2 cells and associated cytokines such as interleukin (IL)-4, IL-13, and IL-31, which drive inflammation, IgE production, and pruritus [3,4]. In skin lesions, these immune pathways are markedly upregulated, with proteomic and transcriptomic data showing increased expression of Th2 cytokines (e.g., IL-13, CCL17), matrix metalloproteinases, and inflammatory mediators that promote epidermal hyperplasia and immune cell infiltration, including eosinophils [4,5,6]. Parallel to immune dysregulation, epidermal barrier impairment is a central feature of AD. The stratum corneum is often compromised due to reduced expression of structural proteins such as filaggrin (FLG), filaggrin-2 (FLG2), loricrin [1], and components of the cornified envelope, as well as tight junction proteins such as CGNL1 and CLDN1 [7]. These abnormalities disrupt keratinocyte differentiation and compromise physical defense mechanisms, promoting transepidermal water loss and increased susceptibility to allergens and microbes [8]. Pathways involved in keratinization and cornified envelope formation are consistently found to be downregulated in lesional skin, and their expression is often inversely correlated with local Th2 cytokine activity [9].
In addition, vitamin D metabolism has emerged as a potentially important regulatory axis in AD. Active vitamin D (1,25-dihydroxyvitamin D) is produced locally in the skin through the action of the enzyme CYP27B1, and degraded by CYP24A1 [10]. This pathway plays a dual role: promoting keratinocyte differentiation and barrier repair, while also inducing antimicrobial peptides such as cathelicidin (LL-37), and modulating the immune response through the vitamin D receptor (VDR) [11,12]. A recent proteomic study by Grieco et al. (2024) [13] revealed that AD lesional skin displays higher expression of VDR, CYP27B1, CYP24A1, and CAMP compared to perilesional skin, particularly in patients with more severe disease, suggesting an attempt by the skin to counteract inflammation and microbial challenge.
A recent comprehensive review of Nakajima et al [6] has emphasized that transcriptomic studies, particularly those using RNA-seq, have uncovered widespread dysregulation of immune pathways (Th2, Th17, Th22), epidermal differentiation, and barrier function in AD skin. Notably, both lesional and non-lesional skin show altered gene expression compared to healthy skin, but lesional samples exhibit additional activation of inflammatory cytokines and barrier-associated defects [6]. Multiple transcriptomic studies have analyzed lesional versus healthy skin [9,14], or versus non-lesional skin areas from the same patients in both pediatric and adult AD cohorts [15,16,17]. To date, very few studies have directly compared lesional (intralesional, IL) and perilesional (PL) skin from the same AD patients [13,18]. Grieco et al. [13] remains the only proteomic study to explicitly analyze IL vs. PL skin, demonstrating that lesional sites show increased expression of pro-inflammatory, tissue remodeling, and vitamin D–related proteins, including CYP27B1, CYP24A1, and Vitamin D Receptor (VDR), compared to adjacent uninvolved skin. Their findings suggest that perilesional skin exhibits an intermediate, yet molecularly distinct, profile reflective of localized subclinical activation. However, no transcriptomic study to date has comprehensively characterized the IL–PL axis in adult AD using paired RNA-sequencing.
In this study, we aimed to fill this gap by performing bulk RNA-seq on matched IL and PL skin biopsies from adult patients with moderate-to-severe AD. Our goal was to identify gene expression differences and coordinated pathway alterations across key biological domains, including inflammation, epidermal barrier integrity, and vitamin D metabolism, thus providing a transcriptome-level view of the spatial organization of disease activity within affected skin.
2. Results
2.1. Patient Characteristics
Clinical and demographic characteristics of the study population (N=21) are summarized in Table 1. The majority of participants were male (61.9%), under 60 years of age (81.0%), with a mean BMI of 24.1±4.1. All patients presented with moderate-to-severe atopic dermatitis (EASI ≥16). The most common clinical phenotype involved generalised disease (47.6%), followed by head/neck (33.3%) and flexural sites (14.3%).
Disease onset occurred during childhood in 71.4% of cases. Comorbid asthma was reported in 71.4% of participants, while 33.3% had a history of allergic rhino-conjunctivitis. Skin prick test positivity was observed in 38.1% of patients. Elevated total serum IgE levels (≥100 IU/ml) were found in 66.7% of subjects. Regarding vitamin D status, 60.0% had 25(OH)D levels below 30 ng/mL. No statistically significant associations were observed between vitamin D deficiency status (<20 vs. ≥20 ng/ml or <30 vs. ≥30 ng/ml, depending on the cutoff applied) and a range of clinical variables (data not shown).
2.2. Differential Gene Expression in Lesional and Perilesional Skin Biopses
RNA-sequencing analysis revealed significant differences in gene expression between PL and IL skin biopsies, as illustrated by hierarchical clustering and principal component analysis (PCA) (Figure 1 and Figure 2).
A total of 8,817 genes were identified as significantly differentially expressed in IL samples compared to PL samples, based on an adjusted p-value (padj) <0.05. The log₂ fold change values ranged from upregulation of +6.43 to downregulation of −4.23. Using more stringent criteria (padj < 0.05 and an absolute log₂ fold change > 0.5) 50 most differentially expressed genes (DEGs) were selected, comprising the 25 most upregulated (highest positive log₂FC) and the 25 most downregulated (lowest negative log₂FC) transcripts in IL compared to PL samples (Figure 3, Supplementary Table S2). Notably, among these, a number of cytokines and chemokines, such as IL-19 (log₂FC=6.43), IL8 (log₂FC=4.31), and CXCL6 (log₂FC=5.33), were strongly upregulated in IL samples, reflecting an activated inflammatory environment. Likewise, MMP1 (log₂FC = 5.42), a matrix metalloproteinase involved in tissue remodeling, and GJB2 (log₂FC = 2.72), encoding connexin 26, a gap junction protein implicated in barrier regulation, showed elevated expression levels.
2.3. Expression Changes in Atopic Dermatitis-Related Genes
To further investigate the mechanisms underlying the observed gene expression changes, we focused on a subset of DEGs known to be involved in processes implicated in atopic dermatitis. These genes, presented in Table 2, are categorized by their primary biological function, including epithelial barrier integrity, vitamin D metabolism, and immune response/inflammation. In total, eight genes were significantly differentially expressed (padj <0.05). The most markedly downregulated genes were FLG2 and CGNL1, whose expression was reduced by approximately 2.3-fold (log₂FC=−1.17) and 2-fold (log₂FC=−1.02), respectively (Table 2, Supplementary Figure S3), suggesting compromised skin integrity in lesional areas. In contrast, CYP27B1 and CYP24A1, key enzymes involved in vitamin D metabolism, were upregulated by approximately 3.7-fold (log₂FC=1.89) and 3.5-fold (log₂FC=1.79), respectively (Table 2, Supplementary Figure S3), indicating a robust activation of the vitamin D pathway. Moreover, the antimicrobial peptide CAMP, involved in innate immune defense, showed a strong 5-fold upregulation (log₂FC=2.32) (Table 2, Supplementary Figure S3), consistent with enhanced immune activation in lesional skin. Other significantly, but less markedly, DEGs included CDH1, TJP1, and CTNNA1, which were modestly upregulated by approximately 1.4-fold (log₂FC=0.48), 1.16-fold (log₂FC=0.21), and 1.13-fold (log₂FC=0.18), respectively. In contrast, CLDN1 showed a mild downregulation of approximately 1.36-fold (log₂FC=−0.44). No significant differences were observed in the expression levels of CTNNB1, OCLN, and VDR (padj > 0.05) (Table 2, Supplementary Figure S3).
Co-expression analysis of genes involved in barrier function and vitamin D metabolism revealed fewer and weaker correlations in IL skin compared to PL skin (Supplementary Figure S2), possibly due to high interindividual variability or shifts in basal expression levels. Notably, in PL skin, CYP27B1 showed strong positive correlations with several epithelial barrier genes, including CTNNA1 (r=0.76, p<0.001), CDH1 (r=0.82, p<0.001), and TJP1 (r=0.81, p<0.001). In contrast, these associations were markedly attenuated in IL skin, where the correlations between CYP27B1 and the same genes were weaker or only partially significant: CTNNA1 (r=0.76, p<0.001), CDH1 (r=0.30, p=0.181), and TJP1 (r=0.59, p=0.005).
2.4. Association Between Gene Expression and Clinical Features of AD Patients
To explore whether clinical features of AD patients were associated with the expression of specific genes in IL and PL skin, we performed subgroup analyses stratifying samples by relevant variables. In PL samples (Figure 4A), the expression of CDH1 and VDR was significantly lower in patients with adult-onset compared to those with childhood-onset disease (p=0.008 and 0.023, respectively), whereas CGNL1 showed the opposite pattern (p=0.014). Additionally, VDR expression was lower in patients with comorbid asthma (p=0.036), and significantly reduced levels of OCLN (p=0.006), CTNNB1 (p=0.004), and FLG2 (p=0.046) were observed in patients with total serum IgE ≥100 IU/mL.
In IL skin (Figure 4B), CTNNB1 expression was significantly lower (p=0.018) and CGNL1 higher (p=0.023) in patients with adult-onset disease. A trend toward lower expression of CTNNA1 (p=0.056) and VDR (p=0.056) was observed in patients with head/neck involvement. Moreover, CTNNB1 was significantly downregulated in patients with a history of rhinoconjunctivitis (p=0.003). Despite these associations, univariate and multivariate linear regression analyses did not reveal any statistically significant relationships between gene expression and the clinical variables considered.
2.5. Dysregulation of Skin Barrier, Immunity, and Inflammation Pathways in Atopic Dermatitis
To identify the biological pathways most affected by gene expression changes in atopic dermatitis, we performed Reactome enrichment analysis on 8,817 DEGs (padj < 0.05) between IL and PL skin. The most significantly enriched pathways included “Keratinization” (p=1.10e-06, FDR=0.00060) and “Formation of the cornified envelope” (p=1.43e-04, FDR=0.01060), both involved in terminal keratinocyte differentiation and epidermal barrier function (Table 3).
The “Keratinization” pathway, in particular, showed upregulation of several key genes such as KRT6A, KRT16, and SPRR2F, all strongly linked to epidermal stress responses and AD pathophysiology. A detailed list of differentially expressed genes within this pathway is provided in Table 4 and also represented using a simplified schematic of the pathway (Supplementary Figure S3). In parallel, we observed significant enrichment of immune and inflammatory pathways, including “Interleukin-4 and Interleukin-13 signaling”, “Chemokine receptors bind chemokines”, and “Antimicrobial peptides” (Table 3).
3. Discussion
In this study, transcriptomic profiling of IL and PL skin samples from adult AD patients revealed extensive molecular alterations in lesional tissue. IL skin showed significant upregulation of inflammatory cytokines, chemokines, matrix remodeling enzymes, and vitamin D metabolism–related genes, alongside downregulation of key epidermal barrier components. Co-expression network analysis indicated a loss of transcriptional coordination in IL samples, particularly among barrier- and vitamin D–related genes. Pathway enrichment confirmed simultaneous activation of immune signaling and suppression of structural epidermal programs, highlighting the integrated immune–barrier dysregulation that defines AD lesions.
Transcriptomic profiling of IL and PL skin samples from adult AD patients revealed marked transcriptional differences, as reflected by the clear clustering of IL and PL samples. 8,817 genes were identified as significantly differentially expressed between IL and PL samples using a padj<0.05. In comparison, Dessie et al. (2024) [19] reported 441 DEGs in lesional vs. non-lesional AD skin. This discrepancy likely reflects methodological differences, as their study focused on co-expression networks and applied stricter inclusion criteria based on correlation strength (|R| ≥0.5) in addition to nominal p-values. Despite these differences, both studies converge on the conclusion that lesional AD skin exhibits extensive molecular remodeling relative to non-lesional tissue. Tsoi et al. [14] further supported this concept, demonstrating that non-lesional AD skin is not molecularly normal but displays mild pro-inflammatory and epidermal changes that are greatly intensified in lesions. Moreover, Möbus et al. [9] described a robust “core” eczema signature shared by both lesional and non-lesional skin, comprising altered expression of genes involved in keratinocyte differentiation and immune activation, with additional enrichment of inflammatory pathways in lesional areas.
Together, these studies reinforce the concept that AD lesions are defined by a unique and amplified disease-specific molecular program, distinct from the surrounding clinically uninvolved skin. Although they have primarily compared lesional to non-lesional skin, our direct comparison of IL and PL samples provides novel insight into the molecular heterogeneity within affected areas. By focusing on PL skin, a clinically uninvolved but spatially adjacent compartment, our study captures a more detailed view of the transcriptomic transition from subclinical to overt inflammation
Recent human omics studies have clearly demonstrated that AD lesions exhibit marked overexpression of pro-inflammatory cytokines, chemokines, and tissue remodeling enzymes [6,15,20]. In our dataset, lesional skin showed strong upregulation of cytokines genes such as IL-19 and IL-24, chemokines like CXCL6, and matrix metalloproteinases including MMP1. Elevated expression of cytokines such as IL-4, IL-13, IL-19, and IL-22 has been widely reported in AD skin and correlates with disease severity and inflammation [21]. These cytokines contribute to the characteristic features of AD, including eosinophilic infiltration, epidermal hyperplasia, pruritus, and microbial dysbiosis. IL-24, in particular, is produced by Th2 cells and keratinocytes in response to type 2 cytokines and plays a role in promoting skin barrier dysfunction, hyperplasia, inflammation, itch, and colonization by Staphylococcus aureus [22]. The concurrent overexpression of MMPs, especially MMP1, reflects active tissue remodeling. Zhu et al. [23] identified MMP1 as one of the most consistently upregulated genes in a meta-analysis of seven AD gene expression datasets comprising lesional and non-lesional biopsies. Recent findings by Wang et al. [24] demonstrated that keratinocytes exposed to Staphylococcus aureus, a bacterium frequently colonizing AD skin, respond by upregulating MMPs, thereby linking microbial colonization to enhanced proteolytic and inflammatory responses. Together, these data and recent literature reinforce the view of AD lesions as zones of pronounced immune activation and protease-driven matrix remodeling, perpetuating the chronic inflammatory cycle.
In parallel with the inflammatory response, we observed significant downregulation of barrier-related genes in IL samples, including FLG2 and CGNL1. Impaired expression of these cornified envelope components is a well-established hallmark of AD pathology [25]. We also noted reduced transcripts of CLDN1, a tight junction protein essential for maintaining epidermal integrity. CLDN1 is known to be diminished in both lesional and non-lesional AD skin, with expression inversely correlated with local inflammation [26]. Chronic Th2-driven inflammation plays a direct role in this barrier defect, as IL-4, IL-13, and IL-31 suppress keratinocyte differentiation and junctional gene expression [27]. Specifically, IL-4/IL-13 signaling downregulates FLG2, loricrin, involucrin, and CLDN1, thereby disrupting both the stratum corneum and tight junctions [27]. The cumulative effect is a weakened skin barrier in lesional tissue, which increases transepidermal water loss and facilitates the penetration of environmental allergens and microbial agents [28]. This barrier defect, in turn, promotes immune activation, creating a self-reinforcing inflammatory loop. The “outside-in and inside-out” paradigm has been widely recognized as central to AD pathogenesis, where barrier defects initiate immune responses, and ongoing inflammation exacerbates epidermal dysfunction [27]. The reduced expression of barrier-associated genes in IL skin that we observed provide molecular confirmation of this vicious cycle and are consistent with the clinical manifestations of xerosis, increased sensitivity, and barrier impairment in AD patients.
An important finding from our analysis was the significant upregulation of the vitamin D metabolism enzymes CYP27B1 and CYP24A1 in AD lesions. The simultaneous increase in both enzymes suggests enhanced local vitamin D metabolic activity in lesional skin. This observation is supported by a recent proteomic study, which found higher expression levels of CYP27B1, CYP24A1, and the VDR in IL skin of AD patients compared to PL areas [13]. Notably, higher EASI scores were associated with increased expression of these enzymes and the antimicrobial peptide CAMP, suggesting a compensatory activation of the vitamin D pathway during severe inflammation [13]. Our transcriptomic results corroborate these observations at the mRNA level, supporting the hypothesis that lesional skin may activate the vitamin D pathway as an endogenous mechanism to enhance antimicrobial defense and support barrier restoration. In response to injury or infection, keratinocytes upregulate CYP27B1 and VDR, leading to increased local production of active vitamin D, which in turn induces CAMP expression, thereby strengthening cutaneous immunity [29]. Clinically, vitamin D sufficiency has been linked to improved AD outcomes, and supplementation studies have shown increased lesional CAMP expression and reduced disease severity [30]. These results provide molecular evidence for the beneficial role of vitamin D in AD. However, the simultaneous increase in CYP24A1, which degrades active vitamin D, may limit this protective effect, suggesting a complex regulatory balance. The functional consequences and regulatory mechanisms behind this upregulation remain to be fully elucidated and warrant further investigation.
In adult-onset AD, we observed upregulation of the tight junction gene CGNL1 and downregulation of adherens junction genes CDH1 (in PL) and CTNNB1 (in IL), consistent with chronic epithelial remodeling [3,18,31]. VDR was selectively reduced in perilesional skin, particularly in patients with asthma or head/neck involvement, suggesting early impairment of vitamin D signaling [13,32]. Allergic comorbidities such as high IgE and rhinoconjunctivitis were associated with decreased CTNNB1, OCLN, and FLG2 in PL skin, indicating subclinical barrier weakness that may facilitate sensitization [26,33,34]. These findings support a model where non-lesional dysregulation of barrier genes contributes to systemic atopy, while inflammation in lesional skin may conceal these alterations.
Co-expression analysis revealed coordinated expression of vitamin D metabolism and barrier-related genes in perilesional skin, with CYP27B1 showing strong positive correlations with CDH1, CTNNA1, and TJP1. In lesional skin, these relationships were diminished, suggesting inflammation-driven disruption of gene network organization, consistent with prior studies showing altered co-expression architecture in AD lesions [35].
Compared to the findings of Grieco et al. [13], which analyzed the same atopic dermatitis–associated targets from a proteomic perspective using antibody microarrays, our RNA-seq–based transcriptomic sub-analysis revealed both overlapping and divergent molecular signatures across clinical subgroups. Discrepancies between gene and protein expression are a well-recognized phenomenon in molecular biology, particularly in complex diseases such as AD [36]. For example, Wilhelm et al. [37] reported a correlation coefficient of approximately 0.4 between mRNA and protein levels across human tissues, indicating that transcript abundance explains only ~16% of protein-level variance. Similarly, Perl et al. [38] showed that protein expression is often more conserved than mRNA levels across tissues, suggesting that post-transcriptional regulation plays a major role. This limited correlation is especially pronounced in genes involved in immune signaling, epithelial homeostasis, and barrier function, where protein levels are shaped by additional layers of regulation such as mRNA stability, translational efficiency, and protein turnover [36,39].
Consistently, proteomic studies in AD have identified elevated levels of keratins, S100 proteins, and metabolic enzymes that are not always mirrored at the transcript level—as seen in the differences between Goleva et al. [40] and transcriptomic studies such as Cole et al. [41]. Recent reviews [42,43] reinforce this notion, highlighting that significant changes in mRNA abundance do not necessarily result in proportional shifts in protein expression, and vice versa. These findings emphasise the importance of integrating proteomic and transcriptomic data to fully capture the complexity of molecular dysregulation in AD and avoid the limitations of single-layer analyses.
Another key distinction lies in the patient populations. All individuals in our cohort had moderate-to-severe AD (EASI ≥16), representing a more homogeneous, high-severity subgroup. In contrast, Grieco et al. included a broader severity spectrum. This difference likely contributed to the more marked gene expression stratification observed in our dataset—particularly in PL skin—whereas in Grieco, some barrier-related proteins appeared upregulated in lesional areas, possibly reflecting chronic tissue adaptation. Finally, while both studies highlighted the relevance of junctional and vitamin D–related pathways, our RNA-based approach allowed the detection of subtle, early transcriptional shifts (e.g., VDR downregulation in perilesional skin with asthma or head/neck involvement), which may precede protein-level compensation.
Together, these findings highlight the complementarity of proteomic and transcriptomic approaches in dissecting AD pathogenesis and support the use of multi-omics profiling to better define clinical–molecular endotypes.
Pathway analysis of the 8,817 DEGs in IL skin revealed two major categories of dysregulation: epidermal structural processes and immune/inflammatory responses. Pathways enriched in IL samples included those related to keratinization and cornified envelope formation, reflecting abnormalities in keratinocyte differentiation and epidermal barrier assembly. Concurrently, we observed significant enrichment of pathways associated with IL-4/IL-13 signaling, chemokine activity, and antimicrobial peptide expression, indicating active immune involvement. This perturbation of barrier and immune pathways is a hallmark of AD and has been reported in other transcriptomic studies [6,44]. This dual signature supports the well-established concept that AD pathogenesis is driven by both “outside-in” (barrier-driven) and “inside-out” (immune-driven) mechanisms, acting in concert to compromise the epithelial barrier [45] .
Recent literature further supports the interdependence between epidermal barrier dysfunction and Th2-driven inflammation in AD [21]. On one hand, inherited or acquired barrier defects—such as filaggrin deficiency, impaired cornification, or tight junction disruption—render the skin more susceptible to immunologic sensitization. On the other hand, chronic Th2/Th22-mediated inflammation suppresses the expression of key structural proteins (e.g., filaggrin, claudins) and disrupts lipid metabolism, further weakening the barrier [44]. This self-perpetuating loop of inflammation and structural impairment contributes to disease chronicity and flare-ups. Altogether, our findings support a model in which immune activation and barrier abnormalities are not independent events but represent tightly interconnected pathological processes in AD lesions. Moreover, consistent with our findings, recently Antonatos et al. [35] reinforce the molecular distinctiveness of lesional skin by combining transcriptome-wide association studies, differential expression meta-analyses, and co-expression networks. Their results identified key regulator genes involved in both inflammatory signaling and keratinization (e.g., LCE3E, LCE3D) specifically in lesional skin.
Together, these findings describe a lesional transcriptional landscape marked by the breakdown of the skin barrier, activation of inflammatory and antimicrobial pathways, and upregulation of vitamin D metabolism genes. The disruption of gene co-regulation in lesional skin further highlights the complexity of AD pathophysiology and highlights potential molecular targets for future therapeutic strategies.
3.1. Study Limitations
The limitations of this study are: first, the sample size, although adequate for paired transcriptomic comparisons, limits the statistical power to detect associations with clinical subgroups or disease severity. Second, RNA sequencing was performed on bulk tissue, which precludes cell type–specific resolution and may mask contributions from minor but functionally relevant cell populations. Future single-cell or spatial transcriptomic approaches could provide more granular insights into the cellular origin of the observed transcriptional changes. Third, the analysis was restricted to adult patients with moderate-to-severe AD; thus, the findings may not fully generalize to milder disease phenotypes. Finally, although vitamin D pathway activation was observed at the transcriptomic level, protein validation and functional assays are needed to confirm biological activity and define its clinical relevance.
3.2. Conclusion
This transcriptomic analysis highlights key molecular differences between IL and PL skin in adult atopic dermatitis. IL skin showed increased expression of inflammatory and vitamin D–related genes, along with reduced expression of genes involved in skin barrier function. These findings reflect the combined effects of immune activation and structural disruption that define AD lesions. The comparison of matched skin samples also reveals early changes in nearby, unaffected areas, suggesting a gradient of disease activity. While the upregulation of antimicrobial and vitamin D pathway genes may represent a local response to inflammation, further studies are needed to clarify their functional role.
Overall, this study provides new insights into the localized molecular changes in AD and supports the development of targeted treatments that address both inflammation and barrier repair.
4. Materials and Methods
4.1. Sample Collection and Ethics Approval
Skin biopsies were collected from patients enrolled at Azienda Ospedaliera Universitaria Policlinico Umberto I, UOS Dermatologia Allergologica Professionale e Malattie Sessualmente Trasmesse. The study protocol was approved by the relevant ethical review board, and all participants provided written informed consent. A total of 42 skin biopsy samples were obtained from both IL and PL sites of patients diagnosed with atopic dermatitis. The inclusion and exclusion criteria, as well as the main patient characteristics, have been detailed elsewhere [18]. In summary, the study enrolled male and female participants aged 18 years or older diagnosed with moderate-severe atopic dermatitis.
Exclusion criteria encompassed other inflammatory or autoimmune skin conditions, disorders affecting calcium or bone metabolism, recent use of corticosteroids, serious systemic illnesses, specific infections, history of organ transplantation, cognitive impairments (e.g., dementia, psychosis), substance abuse, pregnancy, anticoagulant therapy, and recent exposure to sunlight. Participants were not subjected to dietary limitations.
During the initial screening, demographic data (sex, age, BMI), clinical history, details on AD onset and phenotype, disease severity (evaluated using the Eczema Area and Severity Index – EASI [46]), and presence of comorbid allergic conditions such as asthma or allergic rhinitis were recorded. Blood samples were also obtained at this visit. Within ten days, participants returned for additional assessments, including skin biopsy procedures for the analysis of protein expression. The study received authorization from the Director of the Dermatological Clinic, Policlinico Umberto I, Sapienza University of Rome, and was conducted in compliance with the Declaration of Helsinki, Good Clinical Practice (GCP) standards, International Council for Harmonisation (ICH) guidelines, and national regulations. Ethical approval was granted by the institutional ethics committee (protocol ID: DERM/AT/01).
4.2. Biopsy Sampling
During the initial evaluation, each patient with AD underwent two skin biopsies: one taken directly from the lesion (intralesional, IL) and another from the peri-lesional area, approximately 3 cm away from the lesion edge, as previously reported [18], following antiseptic cleansing with povidone iodine, local anesthesia was achieved using 2% mepivacaine. A tissue specimen up to 10×5 mm in size was excised. The wound was then sutured using 1–3 nylon (3.0) stitches and covered with a medicated dressing. Patients received prophylactic antibiotics (amoxicillin 1 g with clavulanic acid) every 12 hours for five days. Suture removal was scheduled between 7 and 15 days after the procedure.
4.3. RNA Extraction and Quality Control
Total RNA was extracted from skin biopsy samples using the TRIzol reagent (Invitrogen) according to the manufacturer’s protocol, followed by purification with the RNeasy Mini Kit (Qiagen) to ensure high RNA integrity. RNA library preparation was performed using the KAPA RNA Hyperprep Kit with RiboErase (HMR) (Roche), following the manufacturer’s instructions. The quantity of RNA used for library preparation was 100 ng.
The quality and concentration of RNA were assessed using a Qubit RNA assay and a Bioanalyzer RNA assay. The RNA integrity number (RIN) and concentrations were evaluated to determine if they met the requirements for downstream analysis. Samples were sequenced using an Illumina NovaSeq 6000 platform with a paired-end read length of 2 x 100 bp. The sequencing parameters were established at a minimum Q30 value > 91.73%.
4.4. RNA Sequencing and Data Processing
Raw sequencing data were generated as FASTQ files, consisting of paired-end reads. Adapter sequences were removed, and quality trimming was performed using FastQC (version 0.11.5-cegat), then read data was trimmed accordingly. Reads were then aligned to the reference genome using a bioinformatics pipeline. Aligned reads are provided in BAM format, with corresponding index files (BAI).
4.5. Differential Gene Expression Analysis
Differential expression analysis between groups was performed with DESeq2 (version 1.24.0) in R (version 3.6.1) (R Core Team 2015). DESeq2 uses a negative binomial generalized linear model to test for differential expression based on gene counts. The raw counts derived from the mapping contain the number of reads that map to each geneID.
Based on these numbers the normalized counts are calculated. In the first step of the normalization DESeq2 calculates a fictive "reference sample" which is defined as the geometric mean for each gene across all samples regardless of group affiliation. The counts for each gene and sample are then divided by this reference value. In the next step the size factor is estimated for each sample by calculating the median of these ratios. To get the normalized counts, for each gene and sample the raw counts are divided by the sample's size factor. This normalization accounts for different library sizes and for biases if, e.g., in some samples only a few genes are very highly expressed. Genes with less than two reads over all samples were removed. This improves the detection power by making the multiple testing adjustment of the p-values less severe. Using normalized counts DESeq2 calculates the log2 fold change, where the p-value reports the statistical significance of this result (Wald test). Since we compare thousands of genes, we have to correct for multiple testing. For this, we use the Benjamini-Hochberg correction implemented in DESeq2 to adjust the p-value (padj). Hence, the padj value should be used to determine significant differences in gene expression
4.6. Data Visualization and Statistical Analysis
The clinical characteristics of the patients are presented as absolute numbers and percentages. Hierarchical clustering and principal component analysis (PCA) were employed to visualize relationships between samples based on gene expression data. For both analyses, variance-stabilizing transformation (rlog) was applied to the raw counts to reduce heteroscedasticity and ensure equal contribution of all genes to the sample distances, particularly suited for datasets with small sample sizes. The PCA plot displays the two principal components that explain the highest proportion of variance between the samples.
FASTQ file quality was assessed using FastQC (version 0.11.5-cegat). All plots were generated in R (version 3.6.1) using the ggplot2 and dendextend packages.
Statistical analyses were conducted using appropriate methods based on variable type and distribution. Fisher’s exact test was used to assess potential associations between vitamin D deficiency status (<20 vs. ≥20 ng/ml or <30 vs. ≥30 ng/ml, depending on the cutoff applied) and several binary categorical clinical variables, including sex (male vs. female), age group (<60 vs. ≥60 years), disease onset (childhood vs. adulthood), comorbidities (presence vs. absence of asthma and rhino-conjunctivitis), and sensitization status (positive vs. negative skin prick test, and total IgE <100 vs. ≥100 IU/ml). Comparisons between binary and continuous variables were performed using the Mann–Whitney U test. Relationships between continuous variables were evaluated using simple and multiple linear regression. Binomial logistic regression (both univariate and multivariate) was used to assess associations between continuous predictors and binary outcomes. Spearman’s rank correlation coefficient was used to explore co-expression relationships between selected genes, accounting for non-normal distributions. All statistical tests were two-tailed, and statistical significance was defined as p<0.05. Statistical analysis was performed using MedCalc Software (version 23.0.2, Broekstraat, 9030 Mariakerke, Belgium) or Graphpad Prism (version 9.0, GraphPad Software, Inc., San Diego, CA, USA).
Supplementary Materials
The following supporting information can be downloaded at the website of this paper posted on Preprints.org, Supplementary Figure S1: Expression levels of Atopic Dermatitis-related genes in Intralesional (IL) and Perilesional (PL) Skin Biopsies; Supplementary Figure S2: Significant gene expression correlation in Perilesional samples (A) and in Intralesional samples (B); Supplementary Figure S3: Keratinization pathway.
Author Contributions
Conceptualization: E.M., G.P., F.N., S.B. (Santina Battaglia), M.A., E.T., S.T., S.C., T.G., data collection: T.G., E.M., G.P., C.C., A.S., S.T., G.P., S.C., data analysis: C.G.E., E.M., G.P., M.M., S.T., S.B (Silvio Bonaretti) and S.C., writing—original draft preparation— C.G.E., E.M., G.P., M.M., S.B., S.C., S.T., writing—review and editing—all authors. All authors have read and agreed to the published version of the manuscript.
Funding
This work was supported by Abiogen Pharma S.p.A, Pisa, Italy.
Institutional Review Board Statement
This study was conducted according to the guidelines of the Declaration of Helsinki and approved by the head of Unit of the Dermatological Clinic of the Policlinico Umberto I, University of Rome La Sapienza.
Ethical Approval
The Study Protocol (No. 599/17, ref. 4637) received approval from the Ethics Committee (Azienda Ospedaliero Universitaria Policlinico Umberto I, Roma), Identification Code: DERM/AT/01 - Sponsor: Abiogen Pharma SPA - CRO: Ricerche Nuove Srl, on 22/06/2017.
Informed Consent Statement
The Study Protocol has received the approval of the Ethics Committee (Identification Code: DERM/AT/01 - Sponsor: Abiogen Pharma SPA - CRO: Ricerche Nuove Srl).
Data Availability Statement
No new data were created or analysed in this study. Data sharing is not applicable to this article.
Conflicts of Interest
The authors declare no conflicts of interest.
References
- Weidinger, S.; Beck, L.A.; Bieber, T.; Kabashima, K.; Irvine, A.D. Atopic Dermatitis. Nat Rev Dis Primers 2018, 4, 1. [Google Scholar] [CrossRef]
- Guttman-Yassky, E.; Renert-Yuval, Y.; Brunner, P.M. Atopic Dermatitis. The Lancet 2025, 405, 583–596. [Google Scholar] [CrossRef] [PubMed]
- Brunner, P.M.; Guttman-Yassky, E.; Leung, D.Y.M. The Immunology of Atopic Dermatitis and Its Reversibility with Broad-Spectrum and Targeted Therapies. J Allergy Clin Immunol 2017, 139, S65–S76. [Google Scholar] [CrossRef]
- Afshari, M.; Kolackova, M.; Rosecka, M.; Čelakovská, J.; Krejsek, J. Unraveling the Skin; a Comprehensive Review of Atopic Dermatitis, Current Understanding, and Approaches. Front Immunol 2024, 15, 1361005. [Google Scholar] [CrossRef]
- Pavel, A.B.; Zhou, L.; Diaz, A.; Ungar, B.; Dan, J.; He, H.; Estrada, Y.D.; Xu, H.; Fernandes, M.; Renert-Yuval, Y.; et al. The Proteomic Skin Profile of Moderate-to-Severe Atopic Dermatitis Patients Shows an Inflammatory Signature. J Am Acad Dermatol 2020, 82, 690–699. [Google Scholar] [CrossRef] [PubMed]
- Nakajima, S.; Nakamizo, S.; Nomura, T.; Ishida, Y.; Sawada, Y.; Kabashima, K. Integrating Multi-Omics Approaches in Deciphering Atopic Dermatitis Pathogenesis and Future Therapeutic Directions. Allergy 2024, 79, 2366–2379. [Google Scholar] [CrossRef] [PubMed]
- Benedetto, A.D.; Rafaels, N.M.; McGirt, L.Y.; Ivanov, A.I.; Georas, S.N.; Cheadle, C.; Berger, A.E.; Zhang, K.; Vidyasagar, S.; Yoshida, T.; et al. Tight Junction Defects in Patients with Atopic Dermatitis. Journal of Allergy and Clinical Immunology 2011, 127, 773–786.e7. [Google Scholar] [CrossRef]
- Otsuka, A.; Nomura, T.; Rerknimitr, P.; Seidel, J.A.; Honda, T.; Kabashima, K. The Interplay between Genetic and Environmental Factors in the Pathogenesis of Atopic Dermatitis. Immunol Rev 2017, 278, 246–262. [Google Scholar] [CrossRef]
- Möbus, L.; Rodriguez, E.; Harder, I.; Stölzl, D.; Boraczynski, N.; Gerdes, S.; Kleinheinz, A.; Abraham, S.; Heratizadeh, A.; Handrick, C.; et al. Atopic Dermatitis Displays Stable and Dynamic Skin Transcriptome Signatures. J Allergy Clin Immunol 2021, 147, 213–223. [Google Scholar] [CrossRef]
- Bikle, D.D. Vitamin D Metabolism, Mechanism of Action, and Clinical Applications. Chem Biol 2014, 21, 319–329. [Google Scholar] [CrossRef]
- Schauber, J.; Gallo, R.L. The Vitamin D Pathway: A New Target for Control of the Skin’s Immune Response? Exp Dermatol 2008, 17, 633–639. [Google Scholar] [CrossRef]
- Liu, P.T.; Stenger, S.; Li, H.; Wenzel, L.; Tan, B.H.; Krutzik, S.R.; Ochoa, M.T.; Schauber, J.; Wu, K.; Meinken, C.; et al. Toll-like Receptor Triggering of a Vitamin D-Mediated Human Antimicrobial Response. Science 2006, 311, 1770–1773. [Google Scholar] [CrossRef]
- Grieco, T.; Paolino, G.; Moliterni, E.; Chello, C.; Sernicola, A.; Egan, C.G.; Morelli, M.; Nannipieri, F.; Battaglia, S.; Accoto, M.; et al. Differential Expression of Proteins Involved in Skin Barrier Maintenance and Vitamin D Metabolism in Atopic Dermatitis: A Cross-Sectional, Exploratory Study. Int J Mol Sci 2024, 26, 211. [Google Scholar] [CrossRef]
- Tsoi, L.C.; Rodriguez, E.; Degenhardt, F.; Baurecht, H.; Wehkamp, U.; Volks, N.; Szymczak, S.; Swindell, W.R.; Sarkar, M.K.; Raja, K.; et al. Atopic Dermatitis Is an IL-13 Dominant Disease with Greater Molecular Heterogeneity Compared to Psoriasis. J Invest Dermatol 2019, 139, 1480–1489. [Google Scholar] [CrossRef]
- Sekita, A.; Kawasaki, H.; Fukushima-Nomura, A.; Yashiro, K.; Tanese, K.; Toshima, S.; Ashizaki, K.; Miyai, T.; Yazaki, J.; Kobayashi, A.; et al. Multifaceted Analysis of Cross-Tissue Transcriptomes Reveals Phenotype–Endotype Associations in Atopic Dermatitis. Nat Commun 2023, 14, 6133. [Google Scholar] [CrossRef]
- Mitamura, Y.; Reiger, M.; Kim, J.; Xiao, Y.; Zhakparov, D.; Tan, G.; Rückert, B.; Rinaldi, A.O.; Baerenfaller, K.; Akdis, M.; et al. Spatial Transcriptomics Combined with Single-Cell RNA-Sequencing Unravels the Complex Inflammatory Cell Network in Atopic Dermatitis. Allergy 2023, 78, 2215–2231. [Google Scholar] [CrossRef]
- Tsoi, L.C.; Rodriguez, E.; Stölzl, D.; Wehkamp, U.; Sun, J.; Gerdes, S.; Sarkar, M.K.; Hübenthal, M.; Zeng, C.; Uppala, R.; et al. Progression of Acute-to-Chronic Atopic Dermatitis Is Associated with Quantitative Rather than Qualitative Changes in Cytokine Responses. J Allergy Clin Immunol 2020, 145, 1406–1415. [Google Scholar] [CrossRef]
- Grieco, T.; Moliterni, E.; Paolino, G.; Chello, C.; Sernicola, A.; Egan, C.G.; Nannipieri, F.; Battaglia, S.; Accoto, M.; Tirotta, E.; et al. Association between Vitamin D Receptor Polymorphisms, Tight Junction Proteins and Clinical Features of Adult Patients with Atopic Dermatitis. Dermatol Pract Concept 2024, 14, e2024214. [Google Scholar] [CrossRef]
- Dessie, E.Y.; Ding, L.; Satish, L.; Mersha, T.B. Co-Expression Network and Machine Learning Analysis of Transcriptomics Data Identifies Distinct Gene Signatures and Pathways in Lesional and Non-Lesional Atopic Dermatitis. J Pers Med 2024, 14, 960. [Google Scholar] [CrossRef]
- Zhou, J.; Liang, G.; Liu, L.; Feng, S.; Zheng, Z.; Wu, Y.; Chen, X.; Li, X.; Wang, L.; Wang, L.; et al. Single-Cell RNA-Seq Reveals Abnormal Differentiation of Keratinocytes and Increased Inflammatory Differentiated Keratinocytes in Atopic Dermatitis. J Eur Acad Dermatol Venereol 2023, 37, 2336–2348. [Google Scholar] [CrossRef]
- Makowska, K.; Nowaczyk, J.; Blicharz, L.; Waśkiel-Burnat, A.; Czuwara, J.; Olszewska, M.; Rudnicka, L. Immunopathogenesis of Atopic Dermatitis: Focus on Interleukins as Disease Drivers and Therapeutic Targets for Novel Treatments. Int J Mol Sci 2023, 24, 781. [Google Scholar] [CrossRef]
- Vu, Y.H.; Furue, M.; Tsuji, G. The Role of Interleukin-24 in Atopic Dermatitis. Explor Immunol. 2021, 1, 4–15. [Google Scholar] [CrossRef]
- Zhu, J.; Wang, Z.; Chen, F. Association of Key Genes and Pathways with Atopic Dermatitis by Bioinformatics Analysis. Med Sci Monit 2019, 25, 4353–4361. [Google Scholar] [CrossRef]
- Wang, J.; Huang, Y.; Wu, X.; Li, D. MicroRNA-939 Amplifies Staphylococcus Aureus-Induced Matrix Metalloproteinase Expression in Atopic Dermatitis. Front. Immunol. 2024, 15. [Google Scholar] [CrossRef]
- Dębińska, A. New Treatments for Atopic Dermatitis Targeting Skin Barrier Repair via the Regulation of FLG Expression. J Clin Med 2021, 10, 2506. [Google Scholar] [CrossRef]
- Katsarou, S.; Makris, M.; Vakirlis, E.; Gregoriou, S. The Role of Tight Junctions in Atopic Dermatitis: A Systematic Review. J Clin Med 2023, 12, 1538. [Google Scholar] [CrossRef]
- Hatano, Y.; Elias, P.M. “Outside-to-inside,” “inside-to-Outside,” and “Intrinsic” Endogenous Pathogenic Mechanisms in Atopic Dermatitis: Keratinocytes as the Key Functional Cells Involved in Both Permeability Barrier Dysfunction and Immunological Alterations. Front. Immunol. 2023, 14. [Google Scholar] [CrossRef]
- Torres, T.; Mendes-Bastos, P.; Cruz, M.J.; Duarte, B.; Filipe, P.; Lopes, M.J.P.; Gonçalo, M. Interleukin-4 and Atopic Dermatitis: Why Does It Matter? A Narrative Review. Dermatol Ther (Heidelb) 2025, 15, 579–597. [Google Scholar] [CrossRef]
- Umar, M.; Sastry, K.S.; Al Ali, F.; Al-Khulaifi, M.; Wang, E.; Chouchane, A.I. Vitamin D and the Pathophysiology of Inflammatory Skin Diseases. Skin Pharmacol Physiol 2018, 31, 74–86. [Google Scholar] [CrossRef]
- Searing, D.A.; Leung, D.Y. Vitamin D in Atopic Dermatitis, Asthma and Allergic Diseases. Immunol Allergy Clin North Am 2010, 30, 397–409. [Google Scholar] [CrossRef]
- Pfisterer, K.; Wielscher, M.; Samardzic, D.; Weinzettl, P.; Symmank, D.; Shaw, L.E.; Campana, R.; Huang, H.-J.; Farlik, M.; Bangert, C.; et al. Non-IgE-Reactive Allergen Peptides Deteriorate the Skin Barrier in House Dust Mite-Sensitized Atopic Dermatitis Patients. Front Cell Dev Biol 2023, 11, 1240289. [Google Scholar] [CrossRef]
- Lu, R.; Peng, Z.; Lian, P.; Wazir, J.; Gu, C.; Ma, C.; Wei, L.; Li, L.; Pu, W.; Liu, J.; et al. Vitamin D Attenuates DNCB-Induced Atopic Dermatitis-like Skin Lesions by Inhibiting Immune Response and Restoring Skin Barrier Function. Int Immunopharmacol 2023, 122, 110558. [Google Scholar] [CrossRef] [PubMed]
- Margolis, D.J. Atopic Dermatitis: Filaggrin and Skin Barrier Dysfunction. Br J Dermatol 2022, 186, 396. [Google Scholar] [CrossRef] [PubMed]
- van der Wal, T.; van Amerongen, R. Walking the Tight Wire between Cell Adhesion and WNT Signalling: A Balancing Act for β-Catenin. Open Biol 2020, 10, 200267. [Google Scholar] [CrossRef]
- Antonatos, C.; Mitsoudi, D.; Pontikas, A.; Akritidis, A.; Xiropotamos, P.; Georgakilas, G.K.; Georgiou, S.; Tsiogka, A.; Gregoriou, S.; Grafanaki, K.; et al. Transcriptome-Wide Analyses Delineate the Genetic Architecture of Expression Variation in Atopic Dermatitis. HGG Adv 2025, 6, 100422. [Google Scholar] [CrossRef]
- Vogel, C.; Marcotte, E.M. Insights into the Regulation of Protein Abundance from Proteomic and Transcriptomic Analyses. Nat Rev Genet 2012, 13, 227–232. [Google Scholar] [CrossRef]
- Wilhelm, M.; Schlegl, J.; Hahne, H.; Gholami, A.M.; Lieberenz, M.; Savitski, M.M.; Ziegler, E.; Butzmann, L.; Gessulat, S.; Marx, H.; et al. Mass-Spectrometry-Based Draft of the Human Proteome. Nature 2014, 509, 582–587. [Google Scholar] [CrossRef]
- Perl, K.; Ushakov, K.; Pozniak, Y.; Yizhar-Barnea, O.; Bhonker, Y.; Shivatzki, S.; Geiger, T.; Avraham, K.B.; Shamir, R. Reduced Changes in Protein Compared to MRNA Levels across Non-Proliferating Tissues. BMC Genomics 2017, 18, 305. [Google Scholar] [CrossRef]
- Guillemin, A.; Kumar, A.; Wencker, M.; Ricci, E.P. Shaping the Innate Immune Response Through Post-Transcriptional Regulation of Gene Expression Mediated by RNA-Binding Proteins. Front. Immunol. 2022, 12. [Google Scholar] [CrossRef]
- Goleva, E.; Calatroni, A.; LeBeau, P.; Berdyshev, E.; Taylor, P.; Kreimer, S.; Cole, R.N.; Leung, D.Y.M. Skin Tape Proteomics Identifies Pathways Associated with Transepidermal Water Loss and Allergen Polysensitization in Atopic Dermatitis. Journal of Allergy and Clinical Immunology 2020, 146, 1367–1378. [Google Scholar] [CrossRef]
- Cole, C.; Kroboth, K.; Schurch, N.J.; Sandilands, A.; Sherstnev, A.; O’Regan, G.M.; Watson, R.M.; McLean, W.H.I.; Barton, G.J.; Irvine, A.D.; et al. Filaggrin-Stratified Transcriptomic Analysis of Pediatric Skin Identifies Mechanistic Pathways in Patients with Atopic Dermatitis. J Allergy Clin Immunol 2014, 134, 82–91. [Google Scholar] [CrossRef] [PubMed]
- Rusiñol, L.; Puig, L. Multi-Omics Approach to Improved Diagnosis and Treatment of Atopic Dermatitis and Psoriasis. Int J Mol Sci 2024, 25, 1042. [Google Scholar] [CrossRef] [PubMed]
- Bratu, D.; Boda, D.; Caruntu, C. Genomic, Epigenomic, Transcriptomic, Proteomic and Metabolomic Approaches in Atopic Dermatitis. Curr Issues Mol Biol 2023, 45, 5215–5231. [Google Scholar] [CrossRef] [PubMed]
- Furue, M.; Chiba, T.; Tsuji, G.; Ulzii, D.; Kido-Nakahara, M.; Nakahara, T.; Kadono, T. Atopic Dermatitis: Immune Deviation, Barrier Dysfunction, IgE Autoreactivity and New Therapies. Allergol Int 2017, 66, 398–403. [Google Scholar] [CrossRef]
- Elias, P.M.; Hatano, Y.; Williams, M.L. Basis for the Barrier Abnormality in Atopic Dermatitis: Outside-inside-Outside Pathogenic Mechanisms. J Allergy Clin Immunol 2008, 121, 1337–1343. [Google Scholar] [CrossRef]
- Hanifin, J.M.; Thurston, M.; Omoto, M.; Cherill, R.; Tofte, S.J.; Graeber, M. The Eczema Area and Severity Index (EASI): Assessment of Reliability in Atopic Dermatitis. EASI Evaluator Group. Exp Dermatol 2001, 10, 11–18. [Google Scholar] [CrossRef]
Figure 1.
Hierarchical clustering of biopsy samples according to their similarity of expression data on all genes that received at least two reads. Expression data were rlog-transformed and the Euclidean distance was calculated. The number indicates patient's code. PL, Peri-lesional samples; IL, Intra-lesional samples.
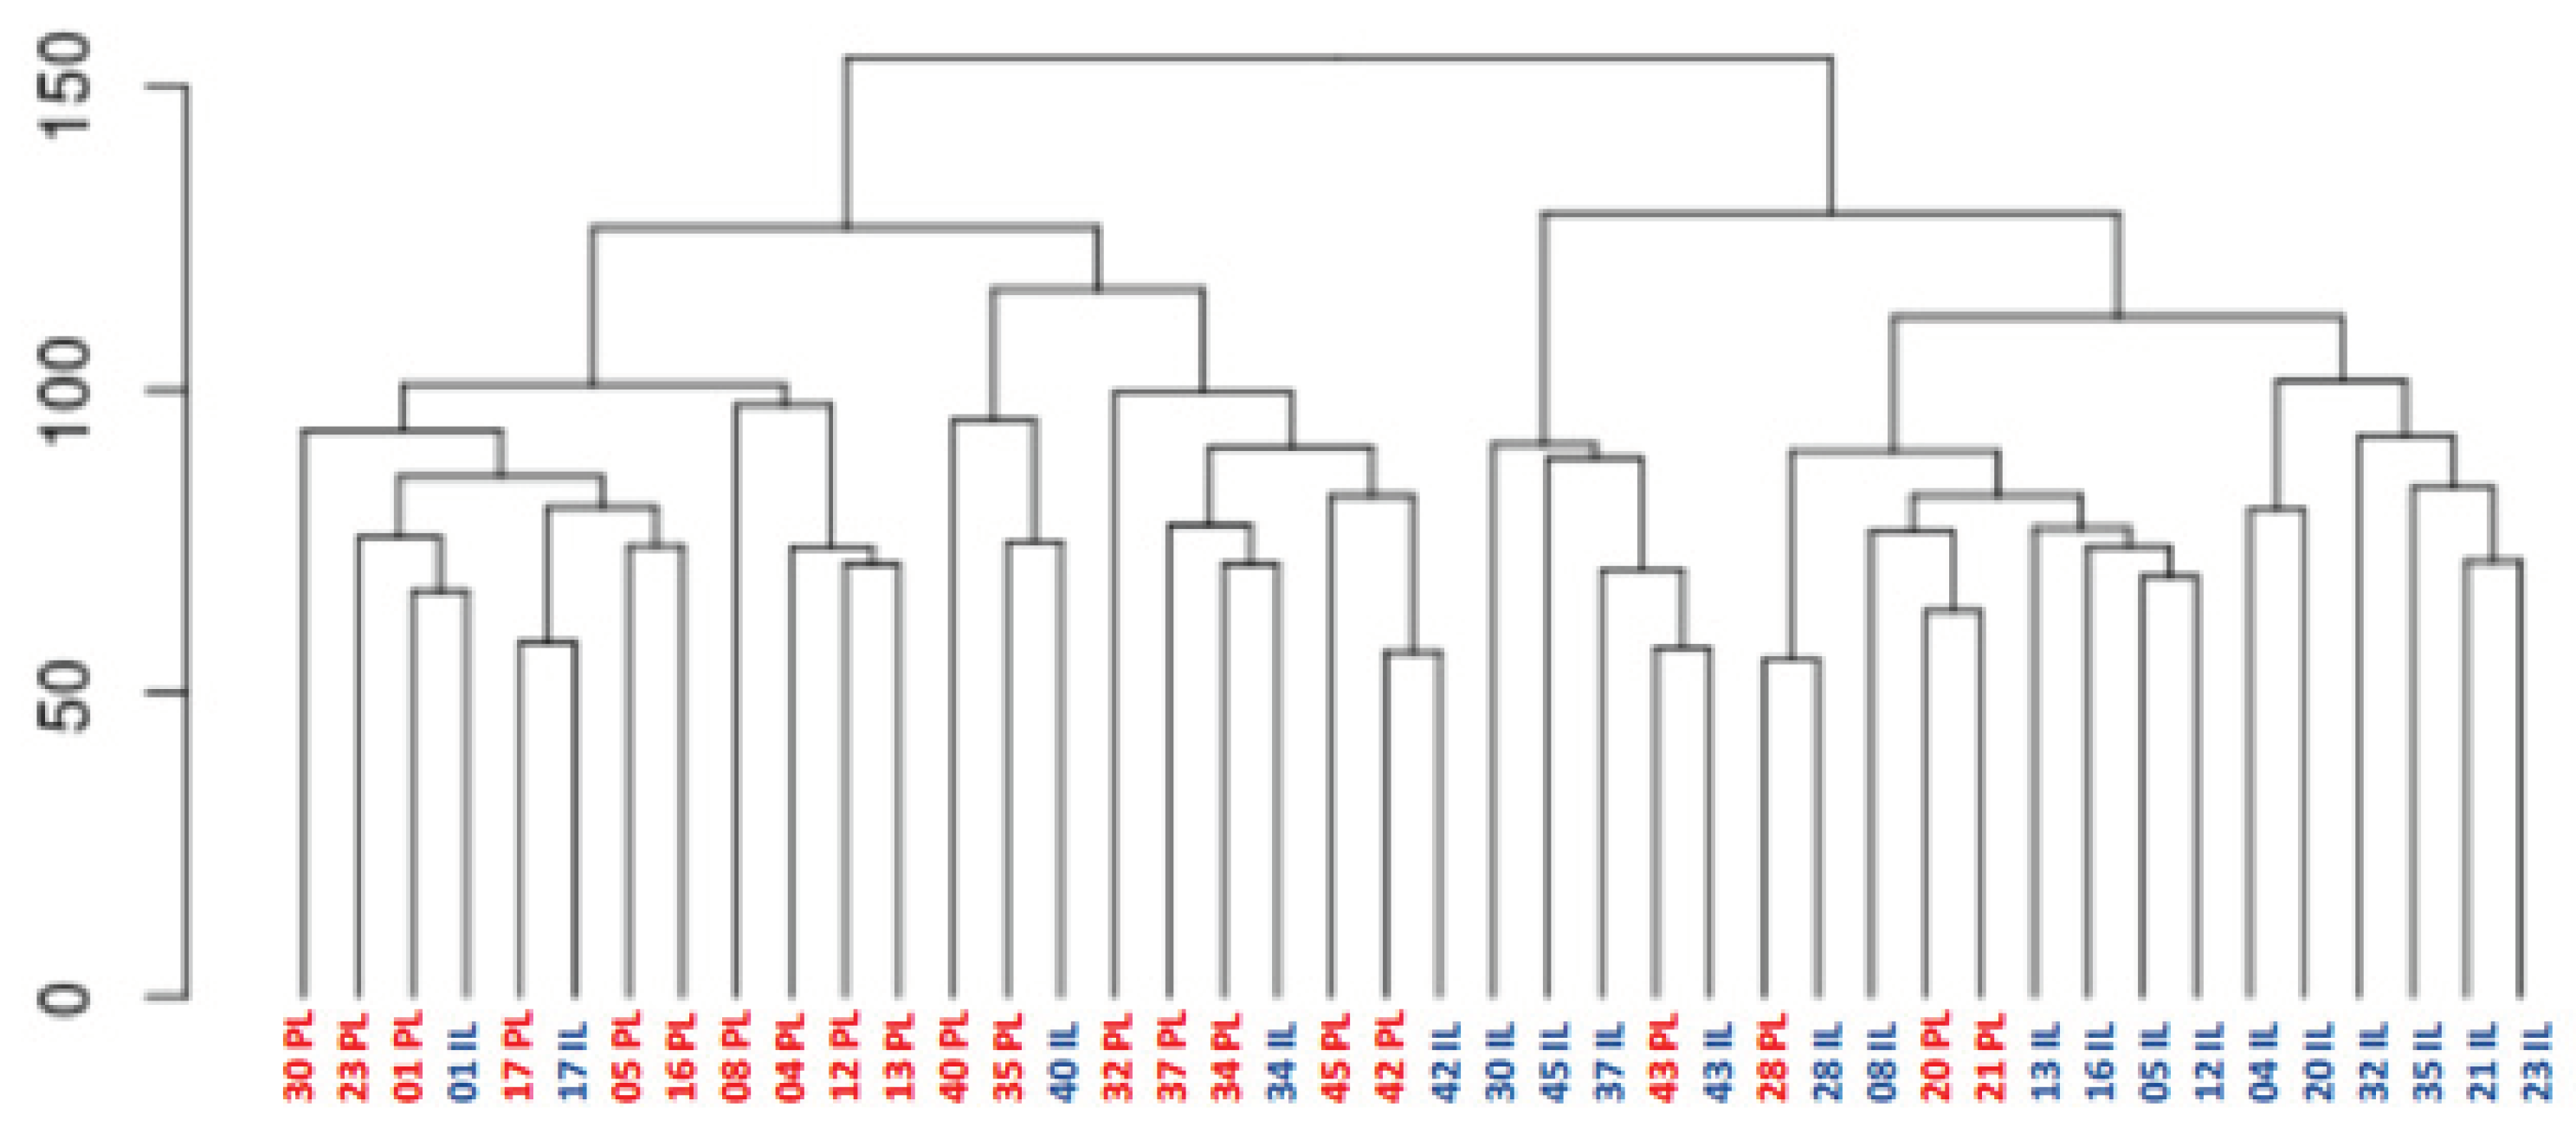
Figure 2.
Principal component analyses of rlog-transformed expression data of all genes that received at least two reads. The percentage values on the X- and Y-axes describe how much of the variance between samples is captured in this principal component. Samples are colored according to group. PL, Peri-lesional samples; IL, Intra-lesional samples. PC = Principal component.
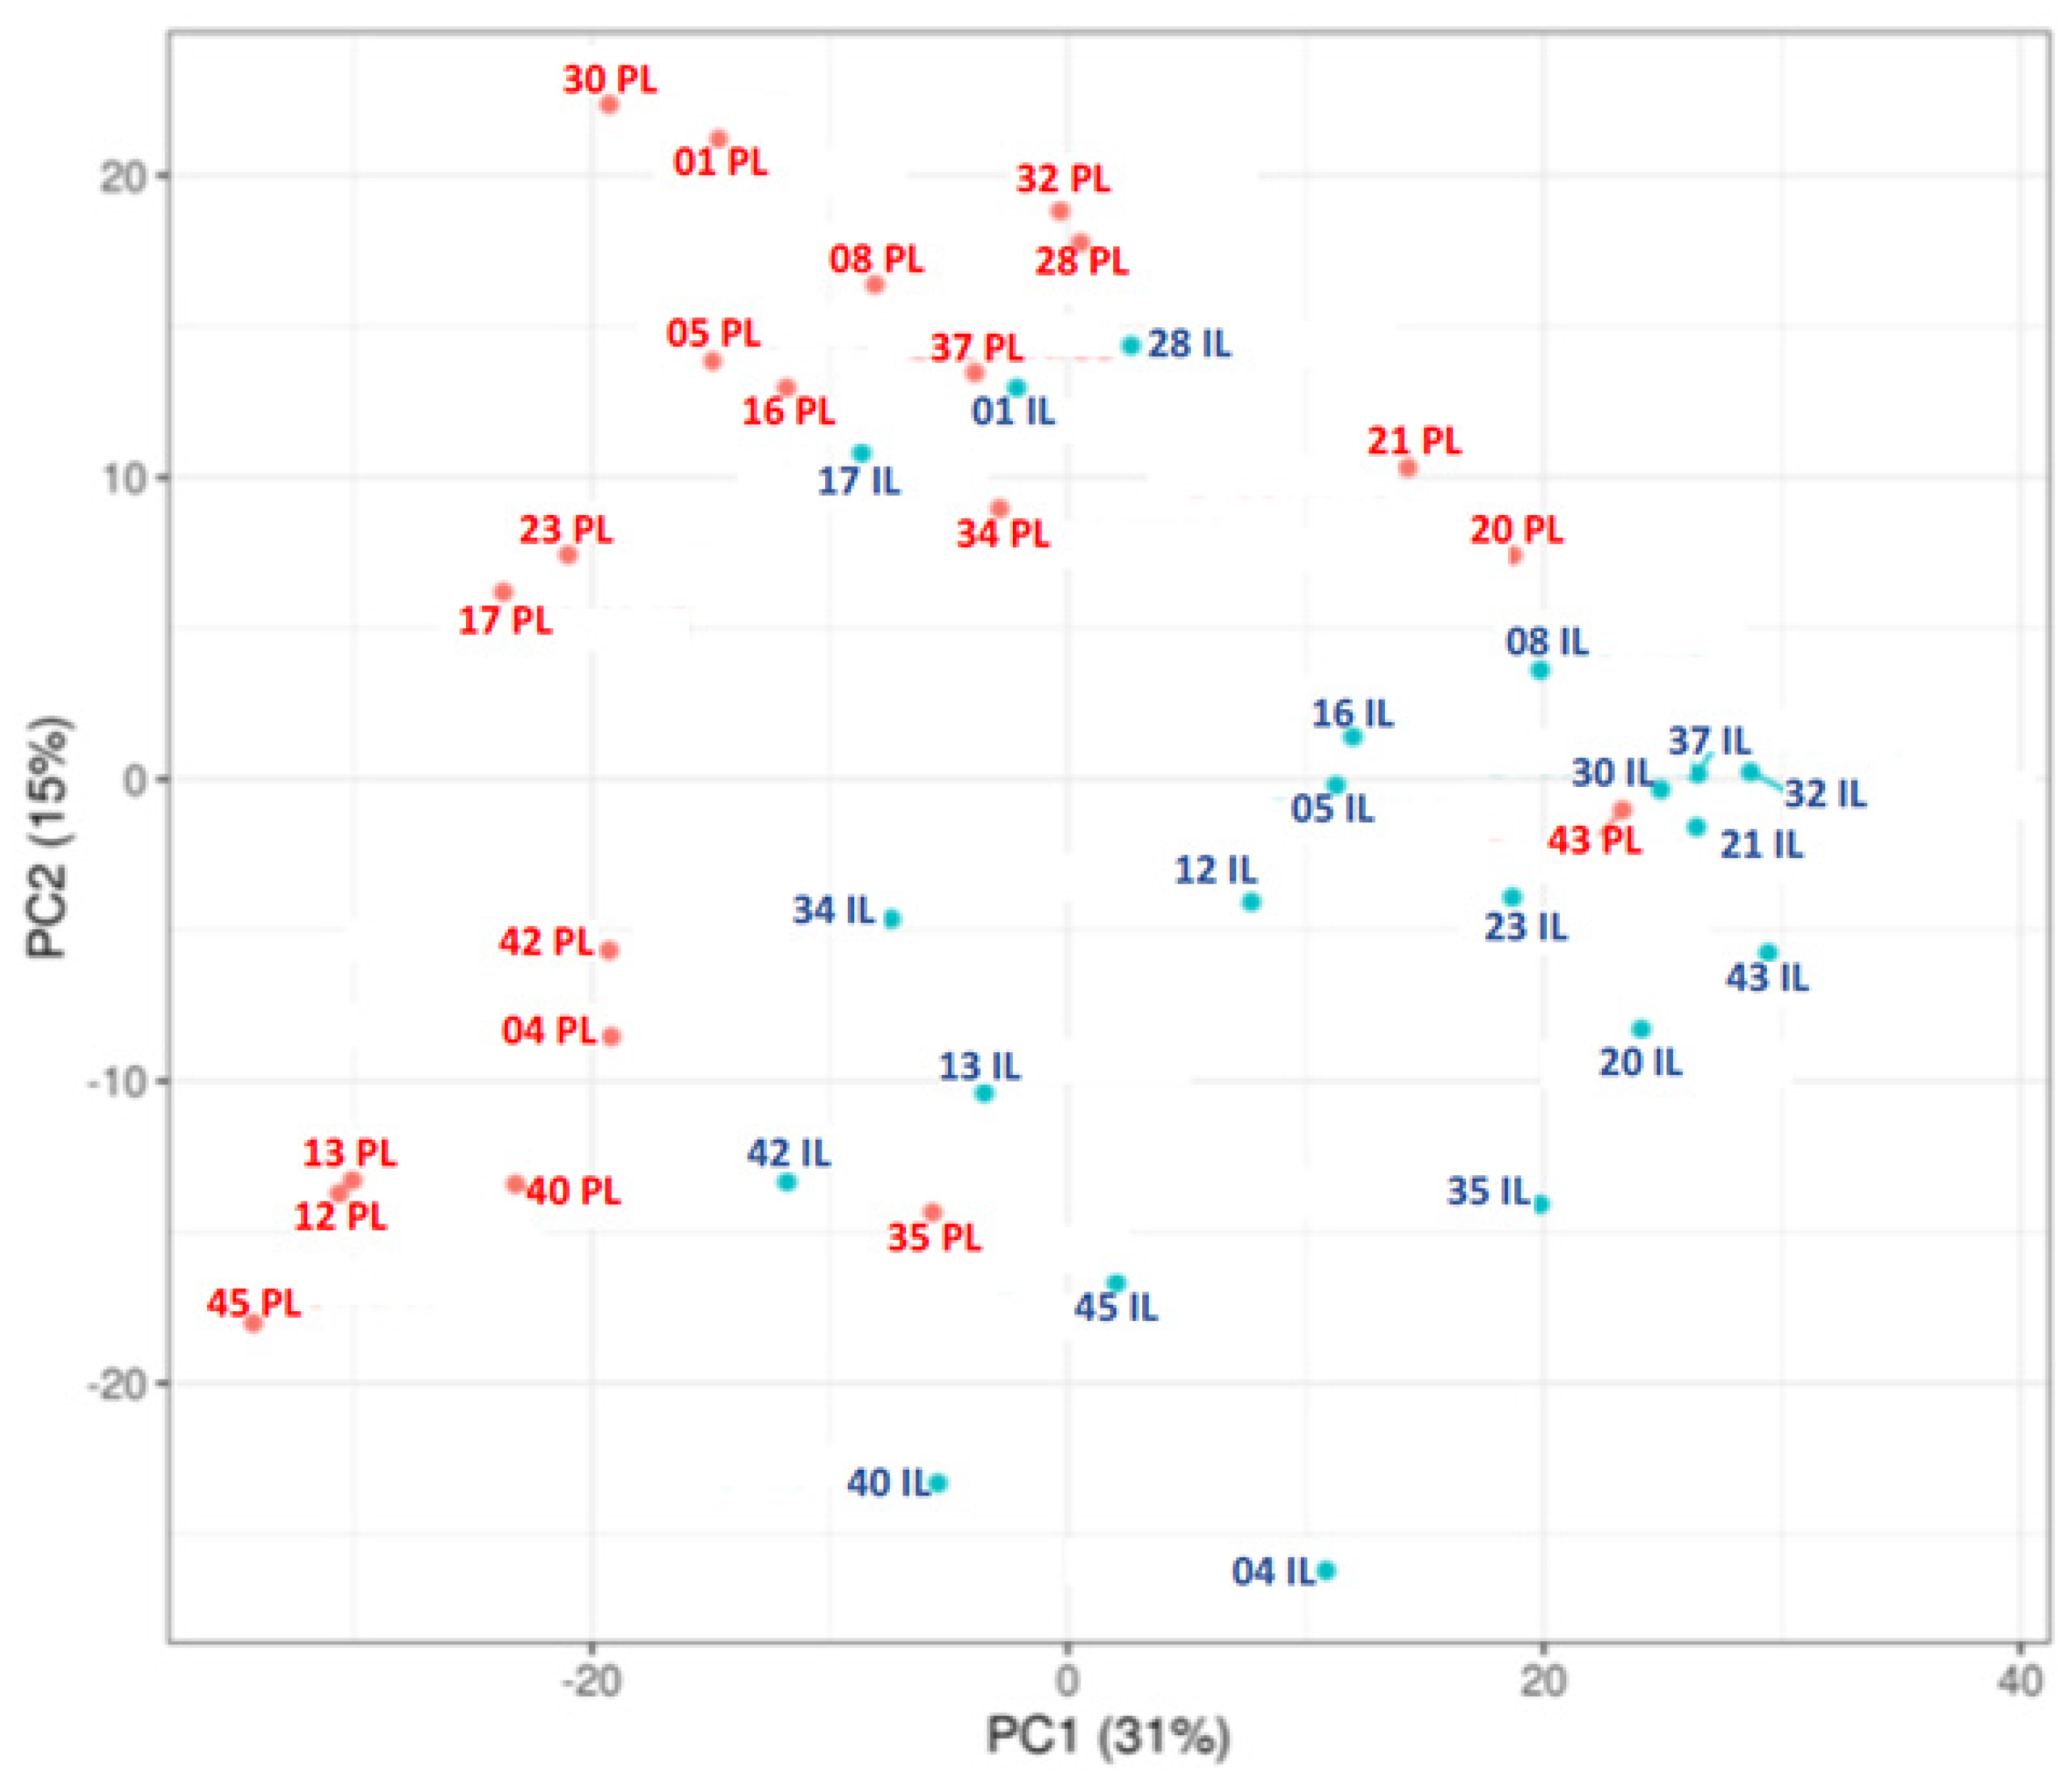
Figure 3.
Colour-coded heatmap representing the 50 most differentially expressed genes (25 upregulated, 25 downregulated) in Intralesional (IL) versus Perilesional (PL) skin biopsies from patients with AD, based on the following criteria: adjusted p-value (padj) <0.05 and absolute log2FoldChange > 0.5. The z-score of normalized counts was used.
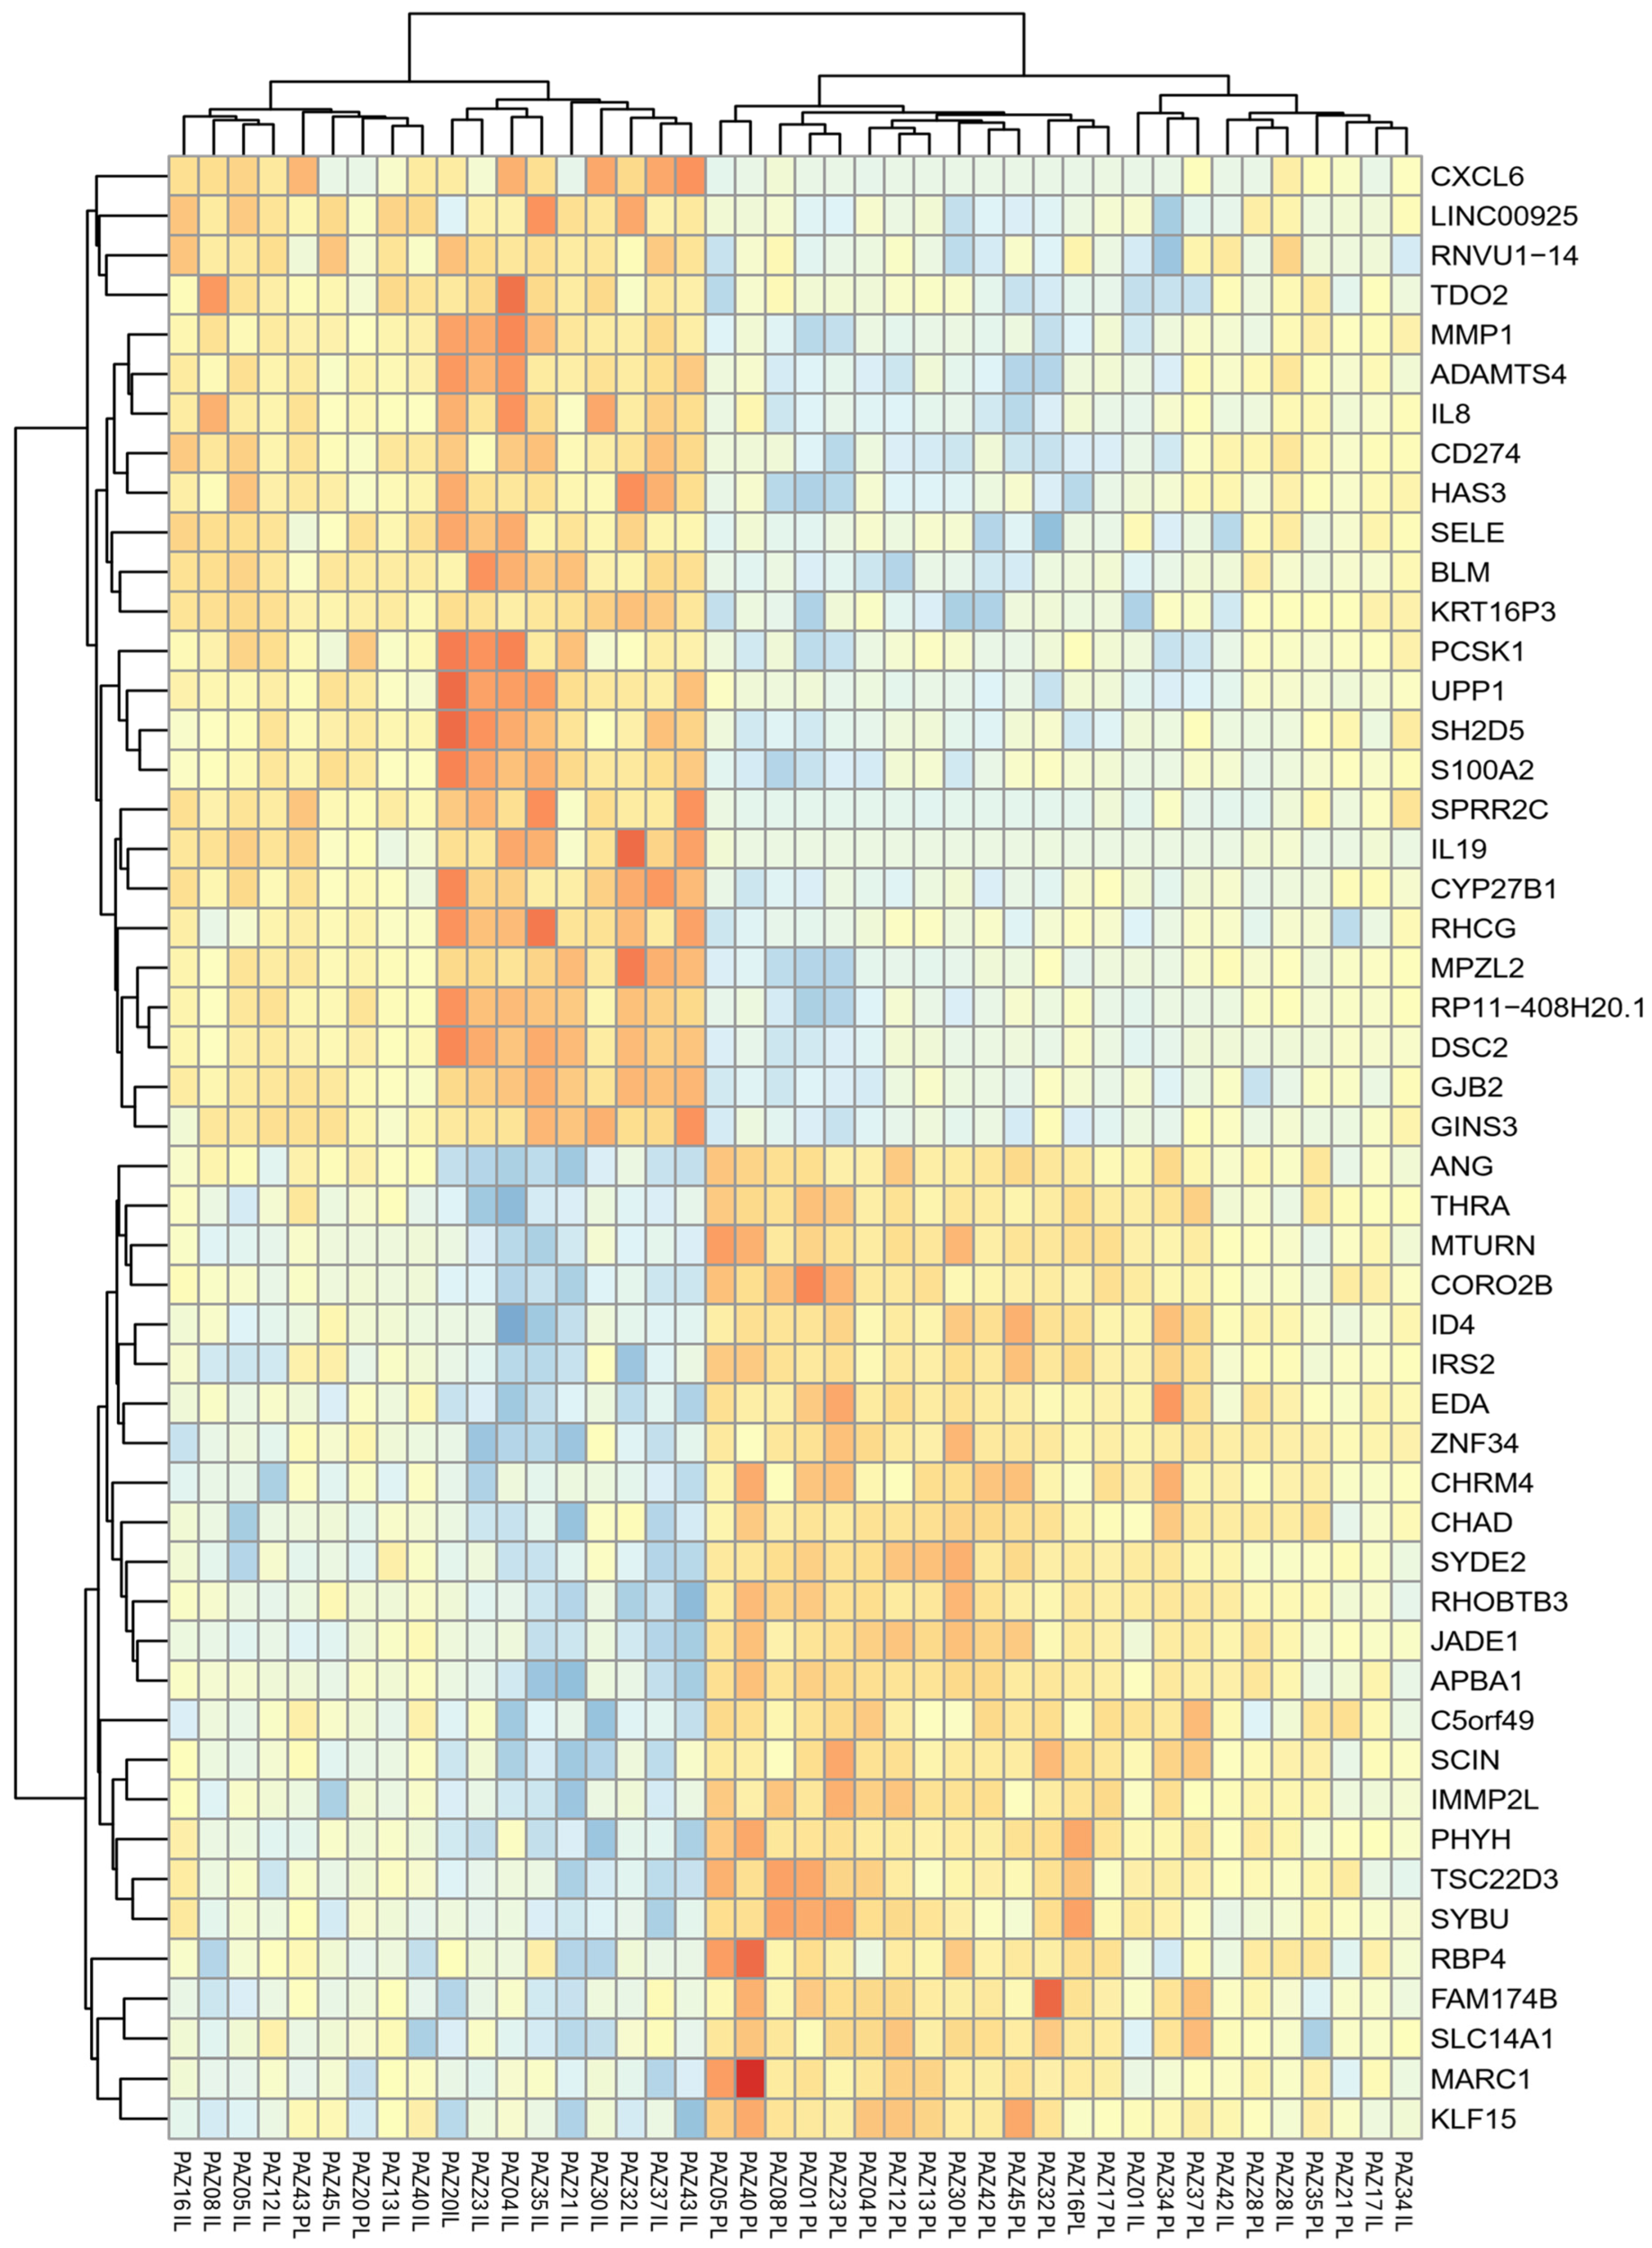
Figure 4.
Sub-analysis of AD-related gene expression in relation to clinical features in Perilesional, PL (A) and Intralesional, IL (B) skin samples. (A) Expression levels of selected genes in PL skin stratified by disease onset (childhood vs. adulthood), comorbid asthma (present vs. absent), and total serum IgE levels (≤100 IU/mL vs. >100 IU/mL). (B) Gene expression in IL skin stratified by disease onset, head/neck lesion involvement (present vs. absent), and history of rhinoconjunctivitis. Gene expression is shown as log₂ normalized counts. P-values indicate statistically significant differences between groups. Data are presented as box-and-whisker plots: boxes represent the interquartile range (IQR), horizontal lines indicate the median, and whiskers denote the minimum and maximum values).
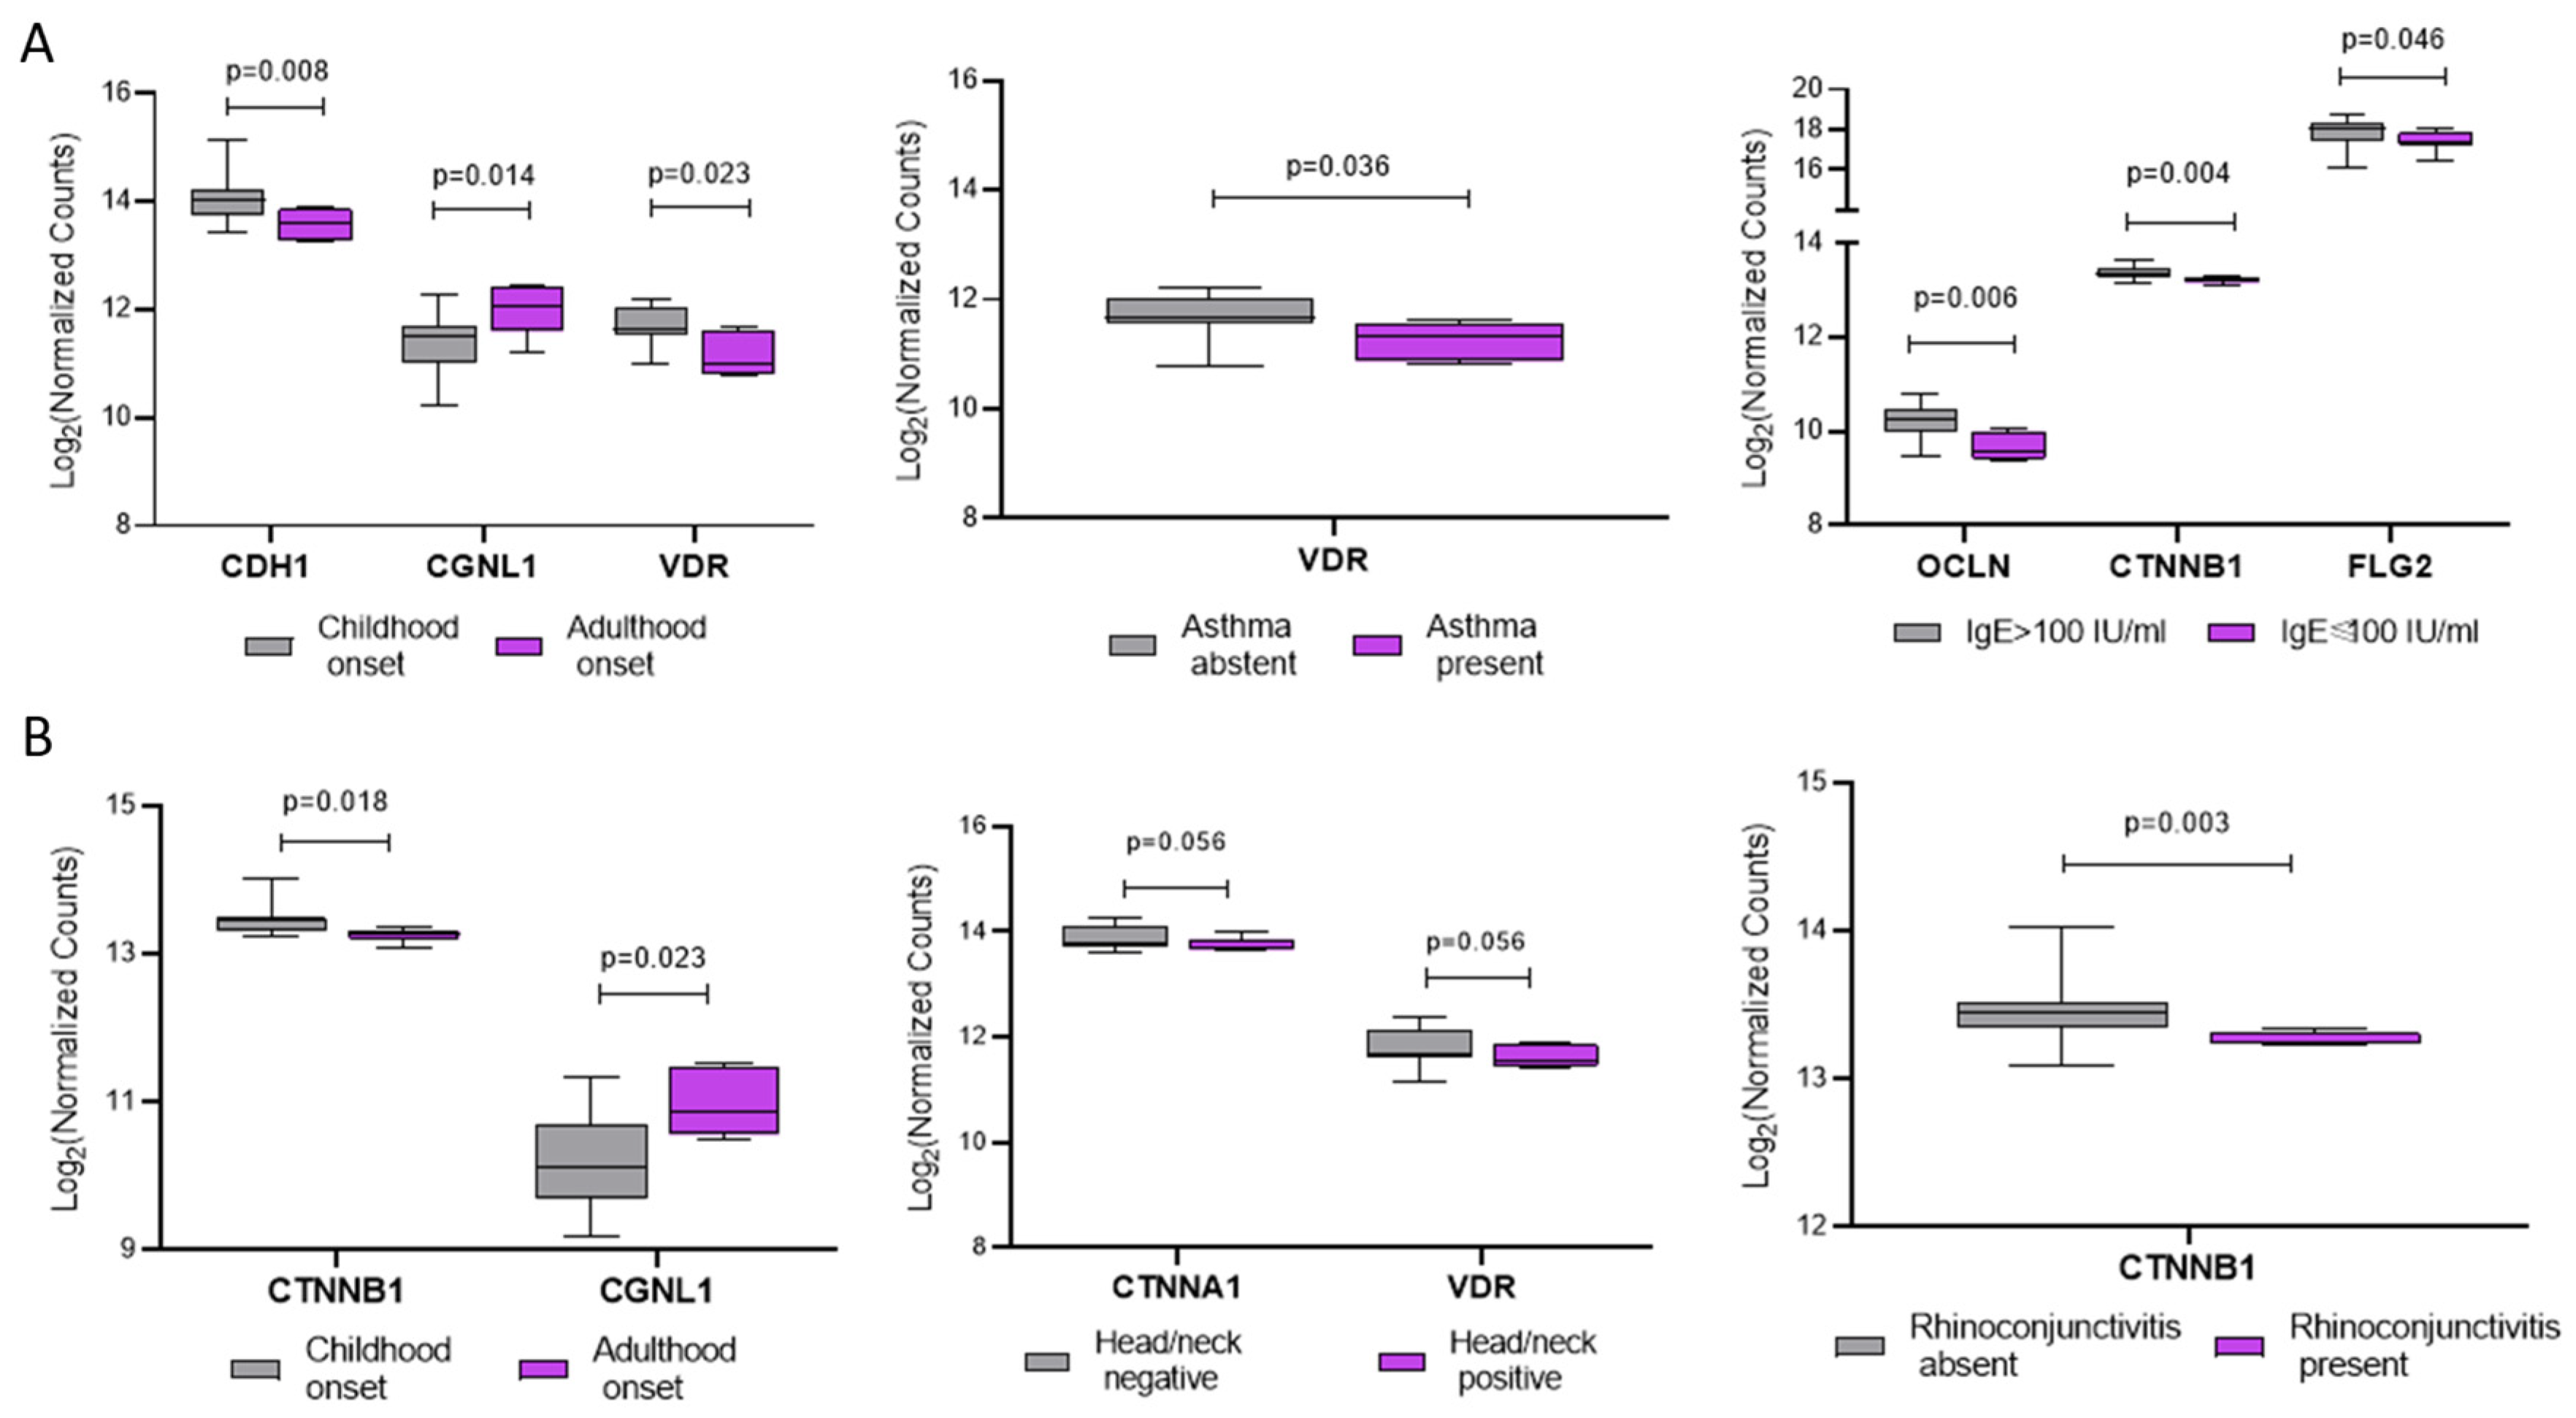

Table 1.
Clinical characteristics of AD patients (N=21).
| Characteristic | N (%) |
|---|---|
| Gender, n (%) | |
| Male | 13 (61.9) |
| Female | 8 (38.9) |
| Age | |
| <60 years | 17 (81.0) |
| ≥60 years | 4 (19.0) |
| BMI (Kg/m2), mean±SD | 24.1±4.1 |
| EASI score | |
| Mild (EASI <16) | 0 (0.0) |
| Moderate-to-severe (EASI ≥16) | 21 (100) |
| Phenotype (localisation), n (%) | |
| Flexural sites | 3 (14.3) |
| Generalised | 10 (47.6) |
| Head/neck | 7 (33.3) |
| Hands | 1 (4.8) |
| §Age of disease onset, n (%) | |
| Childhood | 15 (71.4) |
| Adulthood | 6 (28.6) |
| Asthma, n (%) | |
| Present | 15 (71.4) |
| Absent | 6 (28.6%) |
| Rhino conjunctivitis, n (%) | |
| Present | 7 (33.3) |
| Absent | 14 (66.7) |
| Skin prick test, n (%) | |
| Present | 8 (38.1) |
| Absent | 13 (61.9) |
| Total IgE (IU/ml), n (%) | |
| <100 IU/ml | 7 (33.3) |
| ≥100 IU/ml | 14 (66.7) |
| *25(OH)D vitamin D | |
| ≥30 ng/ml | 8 (40.0) |
| <30 ng/ml | 12 (60.0) |
EASI = Eczema Area and Severity Index. BMI, Body Mass Index. §Adult onset of AD was defined as diagnosis of AD at age of 18 years. Data are presented as number and % or mean and SD.
Table 2.
Genes involved in specific biological processes (Epithelial Barrier, Vitamin D metabolism, and Immune response/inflammation), differentially expressed between in Intralesional respect to Perilesional biopsies.
Table 2.
Genes involved in specific biological processes (Epithelial Barrier, Vitamin D metabolism, and Immune response/inflammation), differentially expressed between in Intralesional respect to Perilesional biopsies.
| Ensemble gene id | Gene | Log2 fold change | p-value | padj | Significance | Gene name | |
|---|---|---|---|---|---|---|---|
| Epithelial Barrier | ENSG0000039068 | CDH1 | 0.4809 | 0.0001 | 0.0013 | S | E-Caderin 1 |
| ENSG00000104067 | TJP1 | 0.2136 | 0.0083 | 0.0332 | S | Zonulin 1 | |
| ENSG00000044115 | CTNNA1 | 0.1762 | 0.0116 | 0.0428 | S | Alpha 1_Catenin | |
| ENSG00000168036 | CTNNB1 | 0.0797 | 0.1540 | 0.2883 | NS | Beta 1_Catenin | |
| ENSG00000163347 | CLDN1 | -0.4409 | 0.0047 | 0.0217 | S | Claudin | |
| ENSG00000128849 | CGNL1 | -1.0219 | 0.0000 | 0.0000 | S | Cingulin like | |
| ENSG00000143520 | FLG2 | -1.1688 | 0.0000 | 0.0002 | S | Filaggrin 2 | |
| ENSG00000197822 | OCLN | -0.0853 | 0.5005 | 0.6505 | NS | Occludin | |
| Vitamin D metabolism | ENSG00000111012 | CYP27B1 | 1.8934 | 0.0000 | 0.0000 | S | Cytochrome P450 Family 27 Subfamily B Member 1 |
| ENSG0000019186 | CYP24A1 | 1.7887 | 0.0000 | 0.0003 | S | Cytochrome P450 Family 24 Subfamily A Member 1 | |
| ENSG00000111424 | VDR | 0.1863 | 0.1175 | 0.2372 | NS | Vitamin D Receptor | |
| Immune response and inflammation | ENSG00000164047 | CAMP | 2.3195 | 0.0002 | 0.0020 | S | Cathelicidin Antimicrobial Peptide |
padj: Adjusted p-value using the Benjamini-Hochberg method to correct for multiple testing; Significance, Significance status with "S" indicating padj<0.05 and "NS" meaning not significant, padj>0.05.
Table 3.
Most significantly enriched Reactome pathways by the observed gene expression changes.
| Pathway name | p-value | FDR |
|---|---|---|
| Keratinization | 0.000001 | 0.000600 |
| Interleukin-4 and Interleukin-13 signaling | 0.000003 | 0.000600 |
| Antimicrobial peptides | 0.000072 | 0.006240 |
| Chemokine receptors bind chemokines | 0.000104 | 0.009230 |
| Formation of the cornified envelope | 0.000143 | 0.010600 |
| Calcitonin-like ligand receptors | 0.001230 | 0.077300 |
| Neutrophil degranulation | 0.001570 | 0.086200 |
| Regulation of TLR by endogenous ligand | 0.003630 | 0.178000 |
| NR1H2 & NR1H3 regulate gene expression linked to triglyceride lipolysis in adipose | 0.005900 | 0.236000 |
| Muscarinic acetylcholine receptors | 0.005900 | 0.236000 |
| Activation of Matrix Metalloproteinases | 0.007510 | 0.278000 |
| Collagen degradation | 0.009380 | 0.296000 |
| Interleukin-10 signaling | 0.010000 | 0.296000 |
| Defective SFTP2A causes IPF | 0.010200 | 0.296000 |
| TRKA activation by NGF | 0.012100 | 0.326000 |
| Beta defensins | 0.016100 | 0.401000 |
| Hormone ligand-binding receptors | 0.016700 | 0.401000 |
| Retinoid metabolism disease events | 0.020300 | 0.447000 |
| Defective SLC26A4 causes Pendred syndrome (PDS) | 0.020300 | 0.447000 |
| Defective SLC17A8 causes autosomal dominant deafness 25 (DFNA25) | 0.030400 | 0.607000 |
| Defective SLC5A5 causes thyroid dyshormonogenesis 1 (TDH1) | 0.030400 | 0.607000 |
| NR1H2 & NR1H3 regulate gene expression linked to gluconeogenesis | 0.036400 | 0.691000 |
| Defensins | 0.040200 | 0.724000 |
| Assembly of active LPL and LIPC lipase complexes | 0.048800 | 0.773000 |
FDR, false discovery rate.
Table 4.
Genes and proteins mapped to the keratinization pathway. Log2FoldChange indicated the upregulation of genes as positive values, and the downregulation of genes as negative values, in biopsy IL vs biopsy PL comparison.
Table 4.
Genes and proteins mapped to the keratinization pathway. Log2FoldChange indicated the upregulation of genes as positive values, and the downregulation of genes as negative values, in biopsy IL vs biopsy PL comparison.
| Gene_id | Gene name | Log2FoldChange | p-value | padj | UniProt Id | Function |
|---|---|---|---|---|---|---|
| ENSG00000170465 | KRT6C | 4.357463 | 0.0000000 | 0.0000018 | P04259 | Stress-inducible keratin, structural role in epidermal repair |
| ENSG00000163209 | SPRR3 | 3.469405 | 0.0001422 | 0.0016350 | Q9UBC9 | Cornified envelope protein, reinforces barrier |
| ENSG00000185479 | KRT6B | 3.323752 | 0.0000000 | 0.0000008 | P04259 | Stress-inducible keratin, part of intermediate filaments |
| ENSG00000244094 | SPRR2F | 3.158956 | 0.0000726 | 0.0010097 | Q96RM1 | Cornified envelope protein, cross-linker |
| ENSG00000186832 | KRT16 | 3.117222 | 0.0000026 | 0.0000949 | P08779 | Stress-inducible keratin, part of intermediate filaments |
| ENSG00000124102 | PI3 | 3.056438 | 0.0000013 | 0.0000593 | P19957 | Protease inhibitor (elafin), limits inflammation/desquamation |
| ENSG00000205420 | KRT6A | 2.984315 | 0.0000009 | 0.0000446 | P02538 | Stress-inducible keratin, part of intermediate filaments |
| ENSG00000178172 | SPINK6 | 2.808229 | 0.0005089 | 0.0041573 | Q6UWN8 | Serine protease inhibitor, regulates corneodesmosome degradation |
| ENSG00000186442 | KRT3 | 2.564823 | 0.0000021 | 0.0000839 | P12035 | Keratins in differentiating non-cornified epithelium |
| ENSG00000128422 | KRT17 | 2.393522 | 0.0000000 | 0.0000016 | Q04695 | Stress-inducible keratin, part of intermediate filaments |
| ENSG00000241123 | KRTAP10-5 | -2.199704 | 0.0130235 | 0.0467079 | P60370 | Keratin-associated protein, stabilizes keratin filaments |
| ENSG00000204572 | KRTAP5-10 | -2.257585 | 0.0002722 | 0.0026562 | Q6L8G5 | Keratin-associated protein, stabilizes keratin filaments |
| ENSG00000241598 | KRTAP5-4 | -2.299814 | 0.0033840 | 0.0170299 | Q6L8H1 | Keratin-associated protein, stabilizes keratin filaments |
| ENSG00000221859 | KRTAP10-10 | -2.405668 | 0.0074753 | 0.0308171 | P60014 | Keratin-associated protein, stabilizes keratin filaments |
| ENSG00000171396 | KRTAP4-4 | -2.601125 | 0.0038421 | 0.0186873 | Q9BYR3 | Keratin-associated protein, stabilizes keratin filaments |
Gene_id: Ensembl Gene Identifier; padj: Adjusted p-value using the Benjamini-Hochberg method to correct for multiple testing (False Discovery Rate); UniProt Id: Unique protein identifier from the UniProt database.
Disclaimer/Publisher’s Note: The statements, opinions and data contained in all publications are solely those of the individual author(s) and contributor(s) and not of MDPI and/or the editor(s). MDPI and/or the editor(s) disclaim responsibility for any injury to people or property resulting from any ideas, methods, instructions or products referred to in the content. |
© 2025 by the authors. Licensee MDPI, Basel, Switzerland. This article is an open access article distributed under the terms and conditions of the Creative Commons Attribution (CC BY) license (http://creativecommons.org/licenses/by/4.0/).
Copyright: This open access article is published under a Creative Commons CC BY 4.0 license, which permit the free download, distribution, and reuse, provided that the author and preprint are cited in any reuse.


