

Submitted:
12 May 2025
Posted:
12 May 2025
You are already at the latest version
Abstract
This study aimed to empirically examine the effects of a digital game-based physical activity program (AI-FIT) on improving health-related physical fitness among elementary school students. Specifically, the study sought to explore the potential of educational technology (EdTech) in physical education and to propose a practical intervention to address the decline in physical activity levels following the COVID-19 pandemic. The study was conducted over a 12-week period, from September to December 2024, with 40 students in grades 4 to 6 from an elementary school located in a mid-sized city in South Korea. The experimental group (n = 20) participated in the AI-FIT program, while the control group (n = 20) received regular physical education classes. To ensure baseline equivalence between the groups, propensity score matching was employed. Health-related physical fitness was assessed through pre- and post-tests, including body mass index (BMI), flexibility, muscular endurance, cardiorespiratory endurance, power, and Physical Activity Promotion System (PAPS) grade. Analyses were conducted using both statistical comparisons and effect size calculations (Cohen’s d). Results indicated that the AI-FIT program had a large effect on flexibility (d = 0.90) and muscular endurance (d = 0.80), and a moderate-to-large effect on BMI (d = 0.72) and PAPS grade (d = 0.69). In contrast, no statistically significant improvements were observed in cardiorespiratory endurance or power. These findings suggest that a digital program integrating AI-based personalized exercise prescriptions and gamification elements can effectively enhance the health-related fitness of elementary students. Moreover, the study supports the educational efficacy of EdTech-based interventions in physical education settings.
Keywords:
Digital game-based physical activity
; AI-FIT
; Health-related physical fitness
; Elementary school students
; Artificial intelligence
; Educational technology
; Physical education
1. Introduction
In recent years, the global decline in physical activity and physical fitness among children and adolescents has emerged as a critical educational concern, with potential implications not only for individual health but also for long-term socio-economic productivity [1,2]. The COVID-19 pandemic has exacerbated this issue by disrupting physical education (PE) classes and prolonging remote learning, thereby limiting physical activity opportunities during the developmental years and accelerating declines in muscular strength, cardiorespiratory endurance, and flexibility.
Meanwhile, advancements in cutting-edge digital technologies—such as artificial intelligence (AI), augmented reality (AR), virtual reality (VR), and mixed reality (MR)—have rapidly expanded across all sectors of society, including education. These technologies are now considered core drivers in the so-called VUCA era, characterized by volatility, uncertainty, complexity, and ambiguity [3,4]. However, despite their potential to drive innovation in education, such technologies also present a double-edged sword: they may contribute to increased sedentary behavior among children, thereby reducing physical activity and adversely affecting health [5].
In this context, there is an urgent need for strategic approaches that go beyond the mere use of technology to meaningfully integrate it into education in ways that promote children’s physical activity and fitness. Recently, educational technology (EdTech) combining digital game-based learning, immersive technologies (e.g., VR and AR), and AI has gained significant attention. These innovations have the potential to enhance learner engagement and autonomy while enabling personalized physical activity interventions, thus improving both the effectiveness and equity of educational outcomes [6,7,8].
Since Klaus Schwab’s discourse on the Fourth Industrial Revolution, the education sector has actively pursued the integration of EdTech. The COVID-19 pandemic accelerated this trend, leading to the widespread adoption of hyperconnected systems such as the Internet of Things (IoT), cloud platforms, and wireless networks, all of which facilitated remote learning and digital transformation. These changes underscored the necessity of not only adopting new technologies but also developing comprehensive digital competence among both teachers and students [9]. In physical education—particularly a practice-oriented subject—the integration of technology is directly linked to learning engagement, participation, and tangible fitness outcomes, reinforcing the importance of empirical research on EdTech-based PE interventions.
Previous studies have confirmed that VR-based instruction can positively influence learner immersion and motor skill development [10,11]. AR, in particular, has garnered attention for its ability to augment interactive information while maintaining real-world context, making it highly applicable in both indoor and outdoor settings [12]. Moreover, digital game-based physical activity has been shown to increase learner participation and continuity, thereby supporting improvements in physical fitness [13].
Nonetheless, the majority of prior research has focused on theoretical disciplines, with relatively limited application of immersive or AI-driven technologies in physical education [14]. Recently, AI-based technologies have demonstrated the potential to precisely analyze students’ physical activity records, fitness levels, and behavioral patterns, thereby providing individualized feedback and personalized exercise prescriptions [15,16]. Such technologies also support the development of automated feedback systems for analyzing student engagement and enhancing instructional strategies in PE classes [17]. These innovations suggest a shift from instrumental use of technology to embedded integration in instruction, offering the potential to fundamentally improve the quality of physical education [18].
Accordingly, the present study aims to empirically examine the effects of AI-FIT, a digital game-based physical activity program, on the health-related physical fitness of elementary school students over a 12-week period. Specifically, this study investigates whether the program yields significant improvements in muscular endurance, cardiorespiratory endurance, flexibility, power, body mass index (BMI), and PAPS (Physical Activity Promotion System) grade. By evaluating these outcomes, the study seeks to assess both the applicability and effectiveness of AI-powered EdTech interventions in physical education. The central research question is as follows: Does the AI-FIT program produce significant changes in the health-related fitness components—BMI, flexibility, muscular endurance, cardiorespiratory endurance, and overall PAPS grade—of elementary school students? This study offers practical implications for designing future-oriented PE instruction models and contributes to promoting educational equity through the strategic integration of EdTech in public education.
2. Materials and Methods
2.1. Participants and Research Design
This study employed a quasi-experimental design to verify the effects of a digital game-based physical activity program (AI-FIT) on the health-related physical fitness of elementary school students. The participants were 40 students in grades 4 to 6 from an elementary school located in City C, a mid-sized city in South Korea. The experimental group (n = 20) participated in the AI-FIT program, while the control group (n = 20) took part in the standard physical education curriculum.
To ensure baseline equivalence between the groups, propensity scores were calculated using logistic regression based on covariates including gender, grade level, height, weight, BMI, and pre-test scores on the Physical Activity Promotion System (PAPS). A 1:1 nearest-neighbor matching procedure was then applied. As a result of the matching, no statistically significant differences were observed between the experimental and control groups in baseline characteristics (gender, grade, height, weight, and BMI; p > .05), indicating that group homogeneity was secured.
This study was approved by the Institutional Review Board (IRB) of Korea National University of Education (Approval No.: KNUE-202410-SB-0601-01).
Figure 1.
Comparison of Height, Weight, and BMI between Experimental and Control Groups.
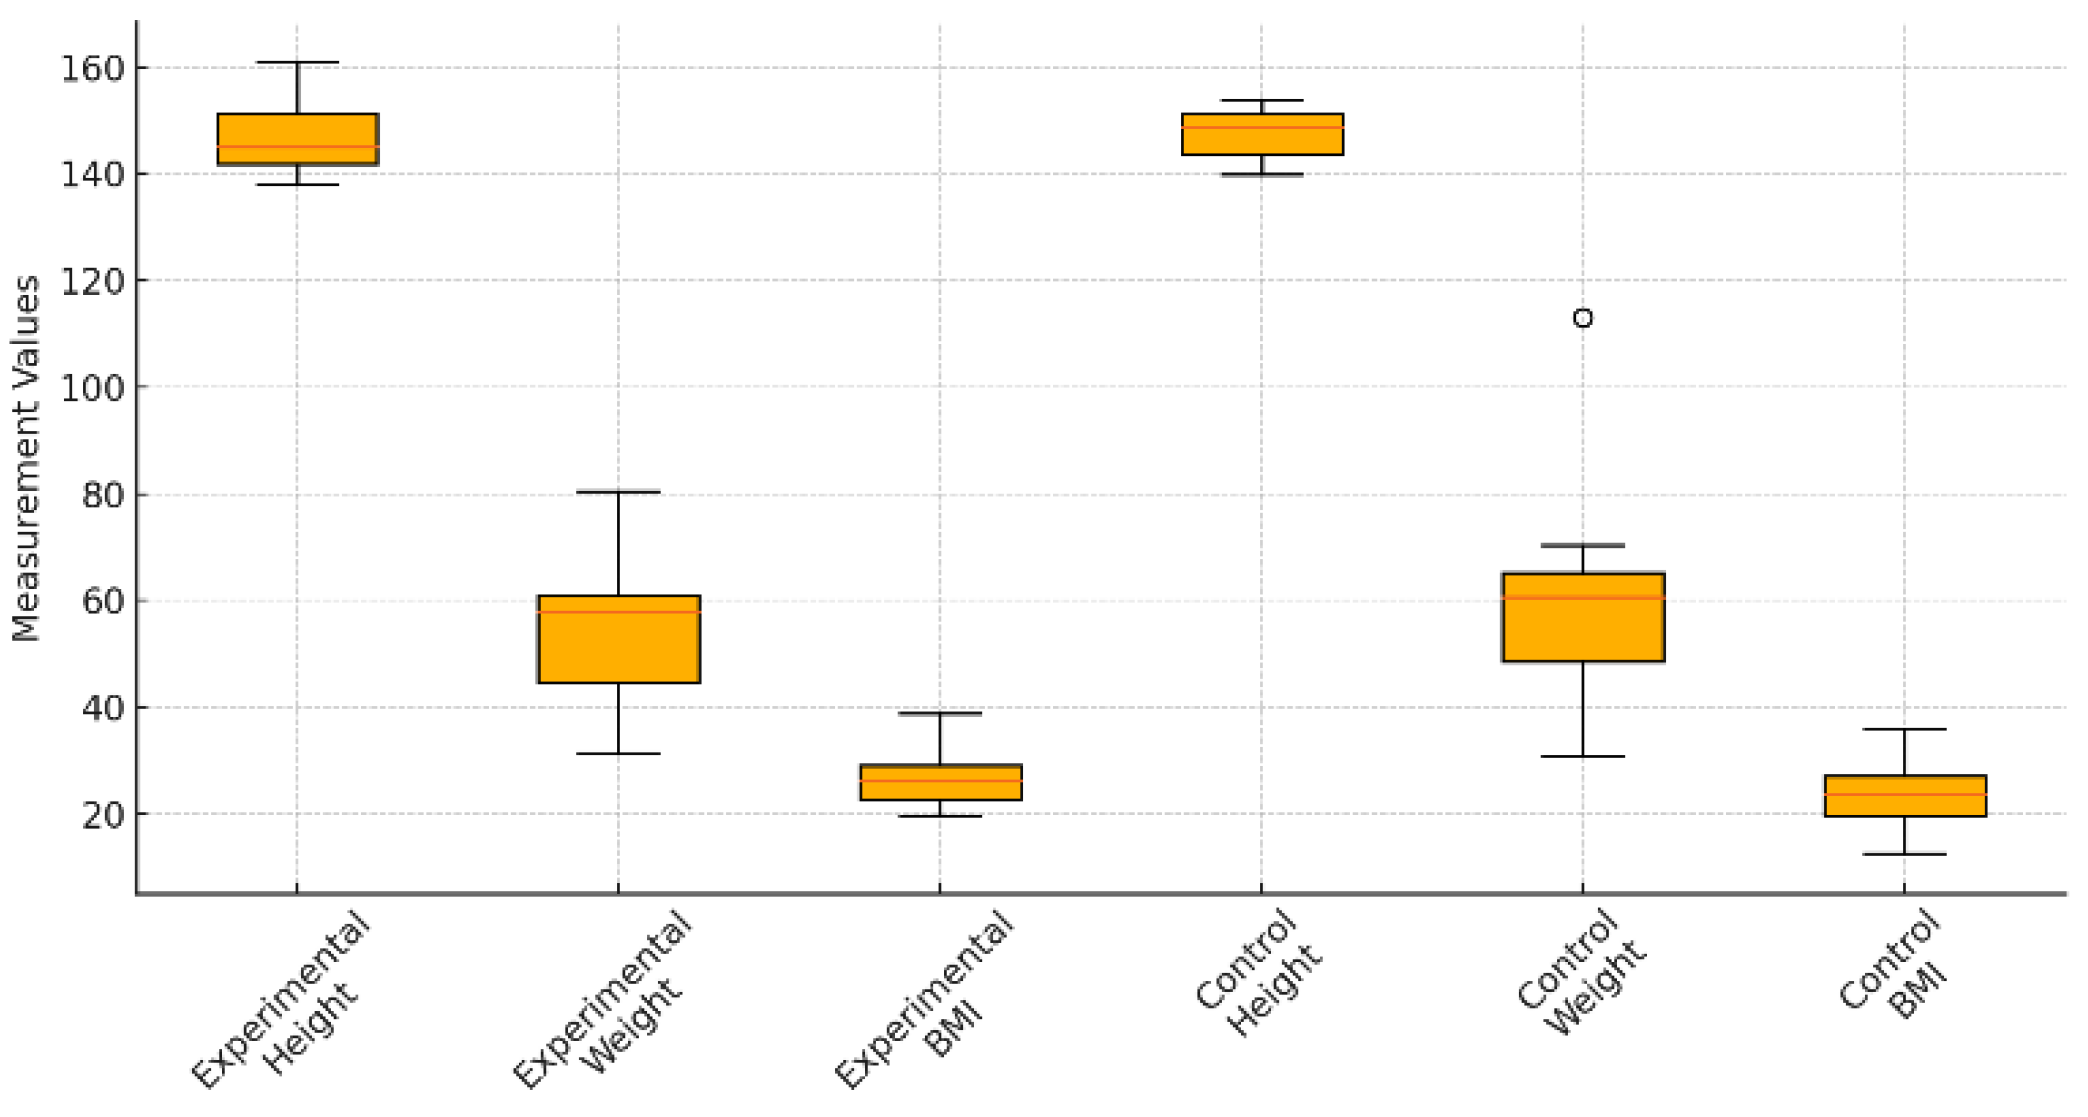

Table 1.
General Characteristics of the Participants.
| Variable |
Experimental Group(n = 20) |
Control Group(n = 20) |
Test Statistic | p-value |
| Gender (M/F) | 9 / 11 | 7 / 13 | χ²(1) = 0.45 | .502 |
| Grade (4/5/6) | 6 / 11 / 3 | 8 / 9 / 3 | χ²(2) = 0.21 | .765 |
| Height (cm) | 147.6 ± 6.1 | 148.8 ± 5.9 | t(40)= -0.59 | .560 |
| Weight (kg) | 54.2 ± 14.1 | 52.6 ± 15.7 | t(40) = 0.31 | .758 |
| BMI (kg/m²) | 24.7 ± 5.2 | 23.5 ± 5.4 | t(40) = 0.85 | .401 |
Additional participant characteristics are presented as follows: Among the total 40 participants, 16 were male (40%) and 24 were female (60%). By grade level, 14 students were in grade 4 (35%), 20 in grade 5 (50%), and 6 in grade 6 (15%). The average height was 148.2 cm (±6.02), average weight was 53.4 kg (±14.86), and the mean BMI was 24.09 (±5.28).
Statistical analyses confirmed no significant differences between the experimental and control groups in terms of gender, grade, height, weight, and BMI (p > .05), both before and after the application of propensity score matching. These findings support the appropriateness of group equivalence.
Although the total sample size (n = 40) was relatively small, the study ensured strict experimental control, applied propensity score matching to secure baseline homogeneity, and conducted effect size analyses (Cohen’s d). Accordingly, the study may be interpreted as a valid and empirically reliable comparative investigation [19,20]. This sample size is also consistent with those commonly used in pilot efficacy trials or small-scale early-phase health intervention studies involving digital physical activity programs.
2.2. Intervention Program: AI-FIT
The AI-FIT program utilized in this study is a digital physical activity system based on a mixed reality (MR) kiosk interface, designed to provide AI-driven, personalized exercise prescriptions tailored to the individual physical fitness levels of elementary school students. The program requires one or two students at a time to perform targeted movements for approximately 20 seconds by following a virtual interface projected onto the floor. Based on the students’ performance data, the AI algorithm dynamically adjusts the intensity and movement path in real time.
A key feature of AI-FIT is its capacity to offer individualized exercise tasks, rather than standardized activities for all participants. Exercise prescriptions are customized according to students’ grade level, gender, and baseline fitness level. The system incorporates gamification elements to enhance engagement and motivation, and it primarily consists of bodyweight exercises, making it suitable for both school and home use.
The AI-FIT system includes 16 types of bodyweight-based exercise programs, such as arm walking, planks, box runs, and speed steps. These exercises are designed to stimulate a range of fitness components, including muscular endurance, flexibility, cardiorespiratory endurance, and power. The program was implemented three times per week for 40 minutes per session over a 12-week period. The exercises were structured and categorized according to the targeted fitness components, as shown below.
Table 2.
Exercise Composition by Fitness Component in the AI-FIT Program.
| Fitness Component | Primary Exercises | Frequency per Week | Number of Sets | Duration per Set | Rest Interval |
| Muscular Endurance | Arm walking, Plank, Mountain climber, Shuttle run (Box run), Burpee | 3 times | 3 sets | 20 seconds | 1 minute |
| Cardiorespiratory Endurance | Speed step, Shuttle run (Box run), Mountain climber | 3 times | 4 sets | 20 seconds | 1 minute |
| Flexibility | Toe touch, Ground touch, Plank | 2 times | 2 sets | 20 seconds | 30 seconds |
| Power | Standing long jump, Burpee | 2–3 times | 3 sets | 20 seconds | 1–2 minutes |
The intervention was conducted over a 12-week period, from September 4 to November 29, 2024, targeting students in grades 4 to 6 at an elementary school located in City C, Chungcheongnam-do, South Korea. The experimental group participated in the AI-FIT program three times per week—on Mondays, Wednesdays, and Fridays—from 10:30 a.m. to 11:10 a.m., for 40 minutes per session. The intervention was implemented during regular physical education class hours, using mixed reality–based digital exercise equipment installed in the school gymnasium.
Each session included stretching and safety instruction before and after the main exercise. The intervention commenced only after informed consent was obtained from participants and guardians, and baseline fitness assessments were completed.
Exercise intensity was adjusted by the AI system according to the time of day and the developmental level and fitness status of each participant. The AI algorithm continuously adapted the exercise prescriptions to provide either high- or low-intensity activities based on real-time performance feedback. During the same 12-week period, the control group attended standard physical education classes only, without any digital exercise intervention such as AI-FIT.
2.3. Measurement Instruments and Assessment Variables
Health-related physical fitness was assessed using the following standardized methods. Body mass index (BMI) was calculated using height and weight (kg/m²). Flexibility was measured using the sit-and-reach test, and muscular endurance was assessed by the number of sit-ups performed in one minute, following standardized fitness testing protocols. Power was measured through the standing long jump, and cardiorespiratory endurance was evaluated using a standardized shuttle run test, known as the Physical Endurance Index (PEI). In this test, participants were required to run back and forth across a fixed distance within a designated time limit, and the number of completed laps was recorded to determine their endurance level.
For a comprehensive assessment of health-related fitness, this study employed the Physical Activity Promotion System (PAPS) grade, a nationally standardized physical fitness evaluation tool used in Korean school settings. Administered under the supervision of the Ministry of Education, PAPS assesses five components—cardiorespiratory endurance, muscular endurance, flexibility, power, and BMI—and provides a composite diagnostic score for students’ physical fitness. The instrument has been regarded as both reliable and valid [21] and has been widely applied to objectively evaluate the effectiveness of school-based physical activity programs [22].
PAPS classifies students into five performance levels, ranging from Grade 1 (Excellent) to Grade 5 (Needs Improvement), based on composite scores across the five fitness domains. In this study, the PAPS grade was treated as an interval variable to enable calculation of means and standard deviations for statistical analysis.
All assessments were conducted under consistent pre- and post-intervention conditions. Trained evaluators, who had completed prior instruction in the assessment protocols, were responsible for all measurements to ensure reliability.
2.4. Data Analysis
All data were analyzed using IBM SPSS Statistics version 28.0. Within-group pre- and post-intervention differences for both the experimental and control groups were analyzed using paired t-tests. Between-group differences in change scores were examined using independent t-tests.
Effect sizes for each physical fitness variable were calculated using Cohen’s d. Following Cohen’s (1988) guidelines, effect sizes were interpreted as small (≥ 0.2), medium (≥ 0.5), and large (≥ 0.8). In addition, a subgroup analysis was conducted within the experimental group to examine differences in program effects by gender; the control group was excluded from this analysis.
The level of statistical significance was set at p < .05 (*) and p < .01 (**). Furthermore, to confirm baseline equivalence between groups after propensity score matching, independent t-tests and chi-square (χ²) tests were conducted on the matched covariates. No statistically significant differences were found between the two groups across any variable (p > .05), indicating that baseline homogeneity was achieved.
3. Results
This study examined the effects of the AI-FIT digital game-based physical activity program on the health-related physical fitness of elementary school students by analyzing pre- and post-intervention changes in both the experimental and control groups. The results indicated that the experimental group showed significant improvements in multiple fitness indicators, including body mass index (BMI), flexibility, muscular endurance, and overall PAPS grade. In contrast, the control group demonstrated little to no improvement in most variables and, in some cases, even a decline in performance. The key findings are summarized as follows.
3.1. Changes in Body Mass Index (BMI)
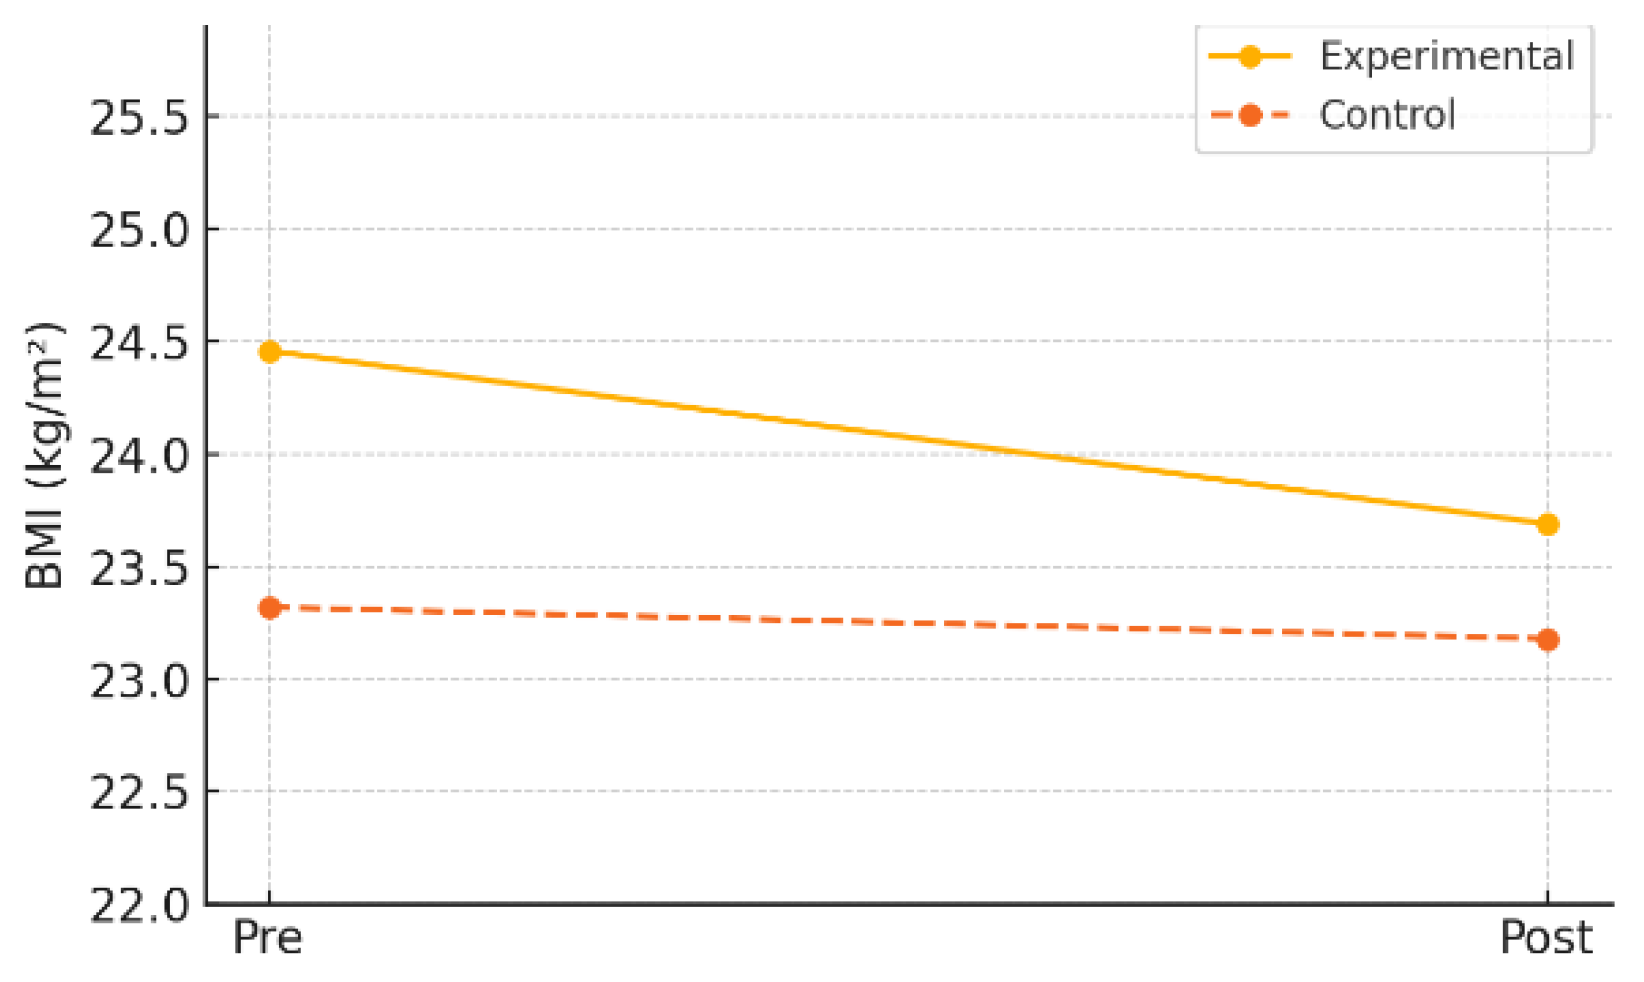
Analysis of BMI changes revealed a statistically significant improvement in the experimental group. The mean BMI decreased from 24.46 (±5.06) kg/m² at pre-test to 23.69 (±5.21) kg/m² at post-test (t = 3.13, p = .006), with a mean change of –0.77 (±1.08). The effect size (Cohen’s d) was 0.72, indicating a moderate-to-large effect.
In contrast, the control group showed no statistically significant change in BMI, with pre- and post-test means of 23.32 (±5.69) kg/m² and 23.18 (±5.90) kg/m², respectively (t = 0.71, p = .487). The effect size was –0.17, considered negligible.
These results suggest that the AI-FIT program had a positive effect on improving body composition among elementary school students.
Table 3.
Pre–post comparison of BMI changes between the experimental and control groups following participation in the AI-FIT program.
Table 3.
Pre–post comparison of BMI changes between the experimental and control groups following participation in the AI-FIT program.
| Variable | Group | Pre_Mean_Exp (SD) | Post_Mean_Exp (SD) | Δ(Post–Pre) | t | p-value | Cohen's d |
| BMI (kg/m²) | Experimental | 24.46 ± 5.06 | 23.69 ± 5.21 | -0.77 ± 1.08 | 3.13 | 0.006** | -0.72 |
| Control | 23.32 ± 5.69 | 23.18 ± 5.90 | -0.14 ± 0.86 | 0.71 | 0.487 | -0.17 |
Δ = Post – Pre, SD = Standard Deviation, d = Cohen’s effect size, p < .05(*), p < .01 (**), p < .001(***).
Figure 2.
Pre-post changes in BMI by group.
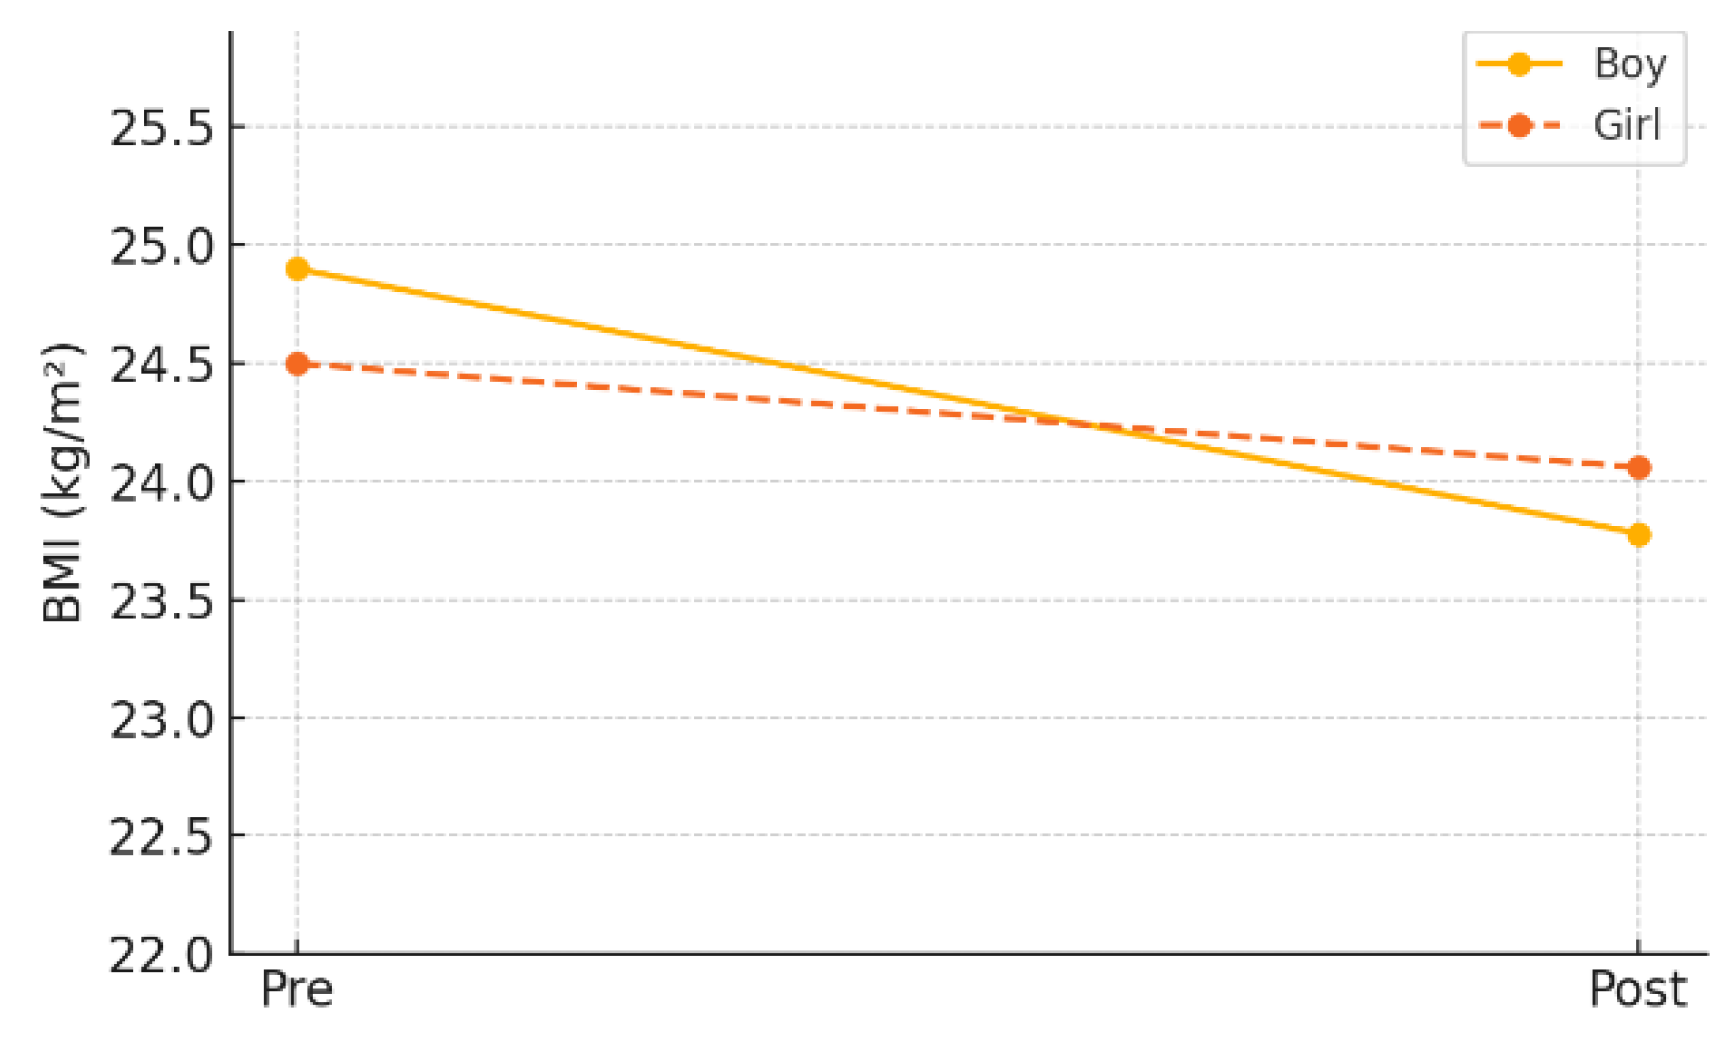
In the gender-specific subgroup analysis within the experimental group, male students showed a statistically significant reduction in BMI, decreasing from a pre-test mean of 24.90 kg/m² (±5.30) to a post-test mean of 23.78 kg/m² (±5.01) (p = .003). Female students also exhibited a decrease in BMI, from 24.50 kg/m² (±5.40) to 24.06 kg/m² (±5.33), but the change did not reach statistical significance (p = .056). These findings suggest that the AI-FIT program had a more pronounced effect on improving body composition in male students.
Table 4.
Pre–post comparison of BMI between male and female subgroups within the experimental group.
Table 4.
Pre–post comparison of BMI between male and female subgroups within the experimental group.
| Variable | Boy | p-value | Girl | p-value | |||
| Pre_Mean_Boy (SD) | Post_Mean_Boy (SD) | Pre_Mean_Girl (SD) | Post_Mean_Girl (SD) | ||||
| BMI (kg/m²) | 24.9 ± 5.3 | 23.78 ± 5.01 | .003 ** | 24.5 ± 5.4 | 24.06 ± 5.33 | .056 | |
p < .05(*), p < .01 (**), p < .001(***).
Figure 3.
Pre-post changes in BMI by gender (experimental group).
3.2. Changes in Flexibility
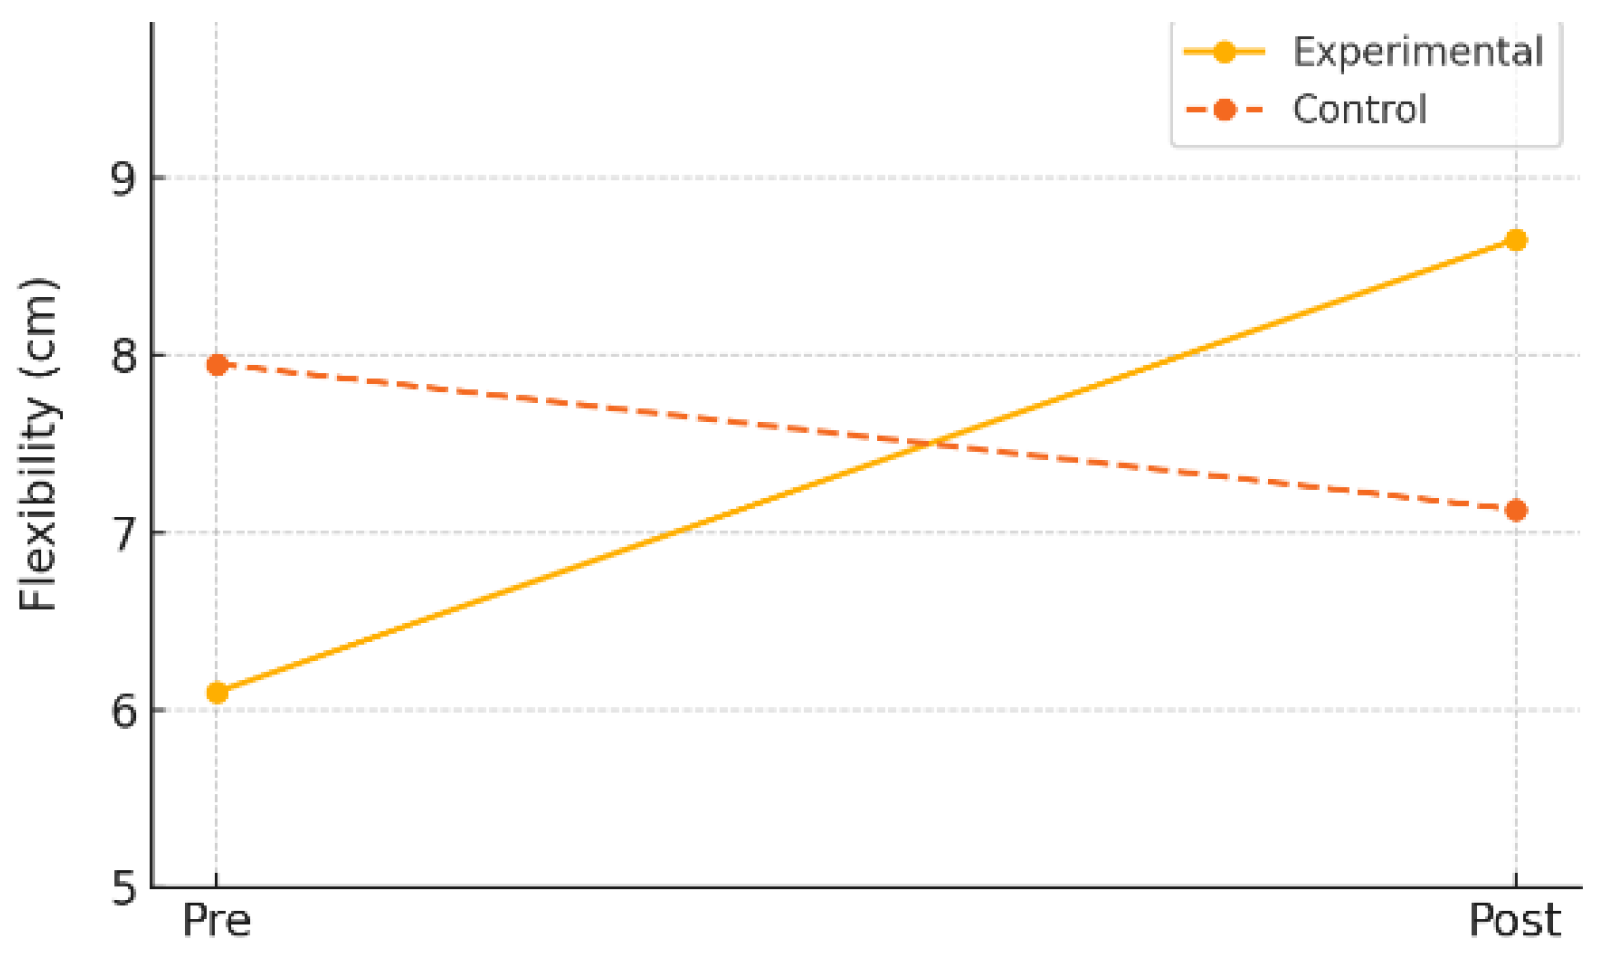
Flexibility was assessed using the sit-and-reach test. In the experimental group, the mean flexibility score significantly increased from 6.10 cm (±6.33) at pre-test to 8.65 cm (±5.89) at post-test (t = –4.03, p = .001), with a mean change of +2.55 cm (±2.83). The effect size (Cohen’s d) was 0.90, indicating a large effect.
In contrast, the control group showed a slight decrease in flexibility from 7.95 cm (±7.83) to 7.13 cm (±8.82), which was not statistically significant (t = 0.70, p = .491). The effect size was –0.16, indicating a negligible effect.
These results suggest that digital game-based physical activity can be particularly effective in improving flexibility among children.
Table 5.
Pre–post comparison of flexibility changes between the experimental and control groups following participation in the AI-FIT program.
Table 5.
Pre–post comparison of flexibility changes between the experimental and control groups following participation in the AI-FIT program.
| Variable | Group | Pre_Mean_Exp (SD) | Post_Mean_Exp (SD) | Δ(Post–Pre) | t | p-value | Cohen's d |
| Flexibility (cm) | Experimental | 6.10 ± 6.33 | 8.65 ± 5.89 | +2.55 ± 2.83 | -4.03 | 0.001*** | 0.90 |
| Control | 7.95 ± 7.83 | 7.13 ± 8.82 | -0.82 ± 5.23 | 0.70 | 0.491 | -0.16 |
Δ = Post – Pre, SD = Standard Deviation, d = Cohen’s effect size, p < .05(*), p < .01 (**), p < .001(***).
Figure 4.
Pre-post changes in flexibility by gender (experimental group).
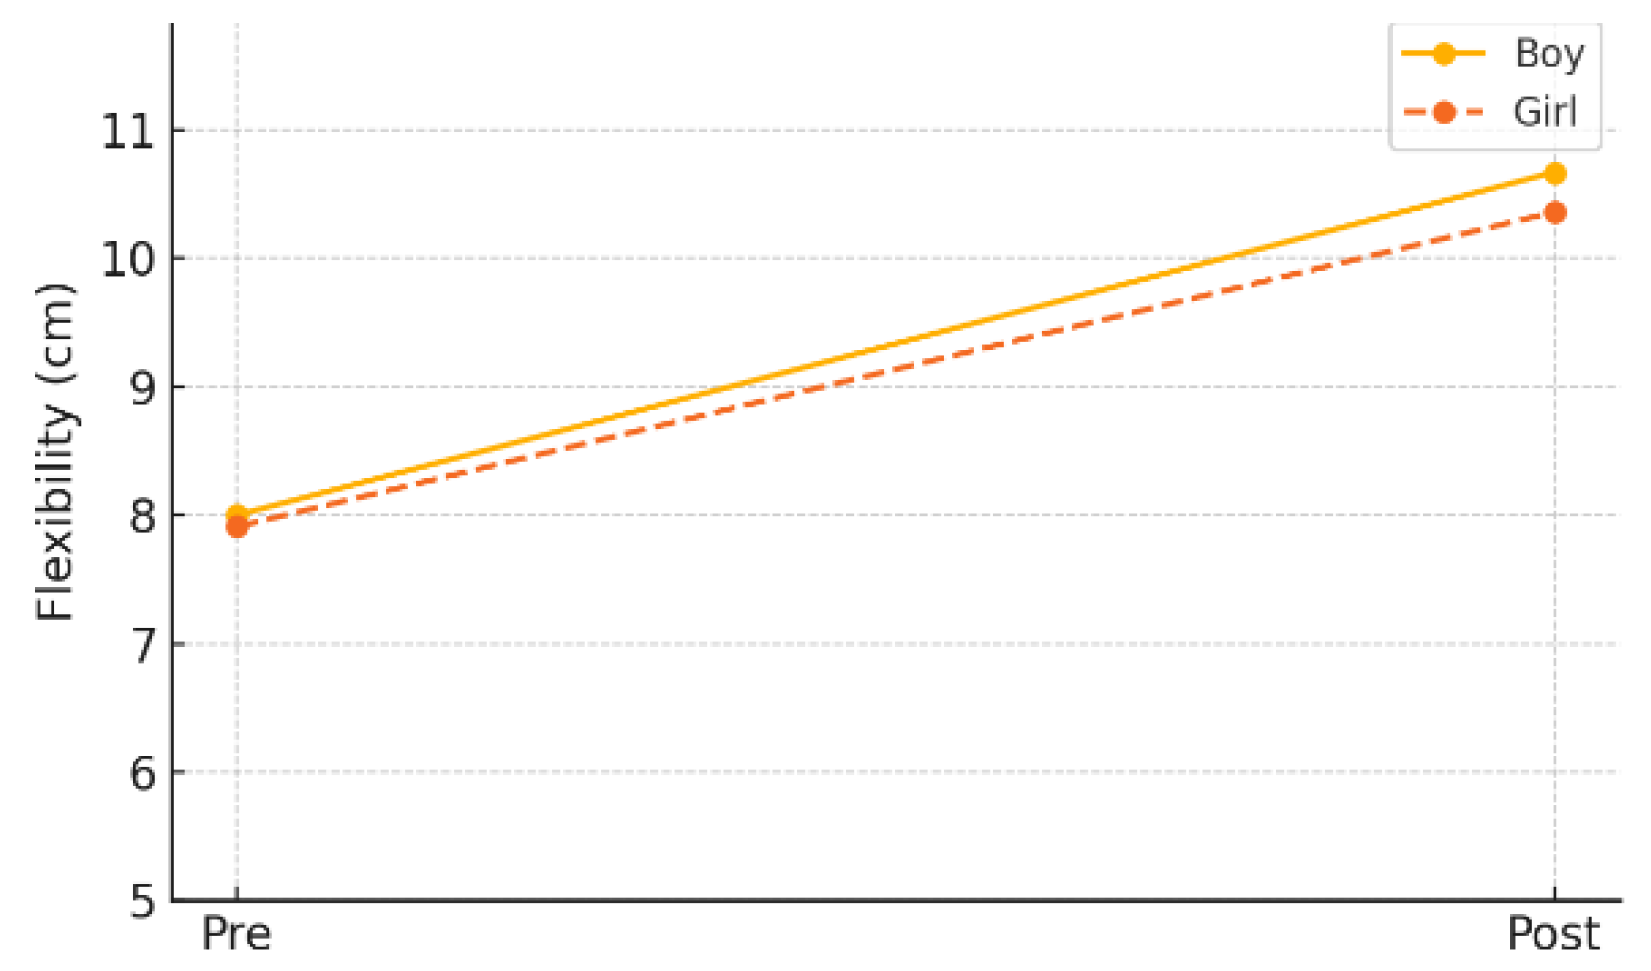
In the gender-specific subgroup analysis within the experimental group, both male and female students demonstrated statistically significant improvements in flexibility. Male students improved from a pre-test mean of 8.00 cm (±5.21) to a post-test mean of 10.67 cm (±4.97) (p = .019), while female students improved from 7.91 cm (±5.81) to 10.36 cm (±6.38) (p = .003). These findings suggest that the AI-FIT program consistently had a positive effect on enhancing flexibility in children, regardless of gender.
Table 6.
Pre–post comparison of flexibility between male and female subgroups within the experimental group.
Table 6.
Pre–post comparison of flexibility between male and female subgroups within the experimental group.
| Variable | Boy | p-value | Girl | p-value | |||
| Pre_Mean_Boy (SD) | Post_Mean_Boy (SD) | Pre_Mean_Girl (SD) | Post_Mean_Girl (SD) | ||||
| Flexibility (cm) | 8.00 ± 5.21 | 10.67 ± 4.97 | .019 * | 7.91 ± 5.81 | 10.36 ± 6.38 | .003 ** | |
p < .05(*), p < .01 (**), p < .001(***).
Figure 5.
Pre-post changes in flexibility by group.
3.3. Changes in Muscular Endurance
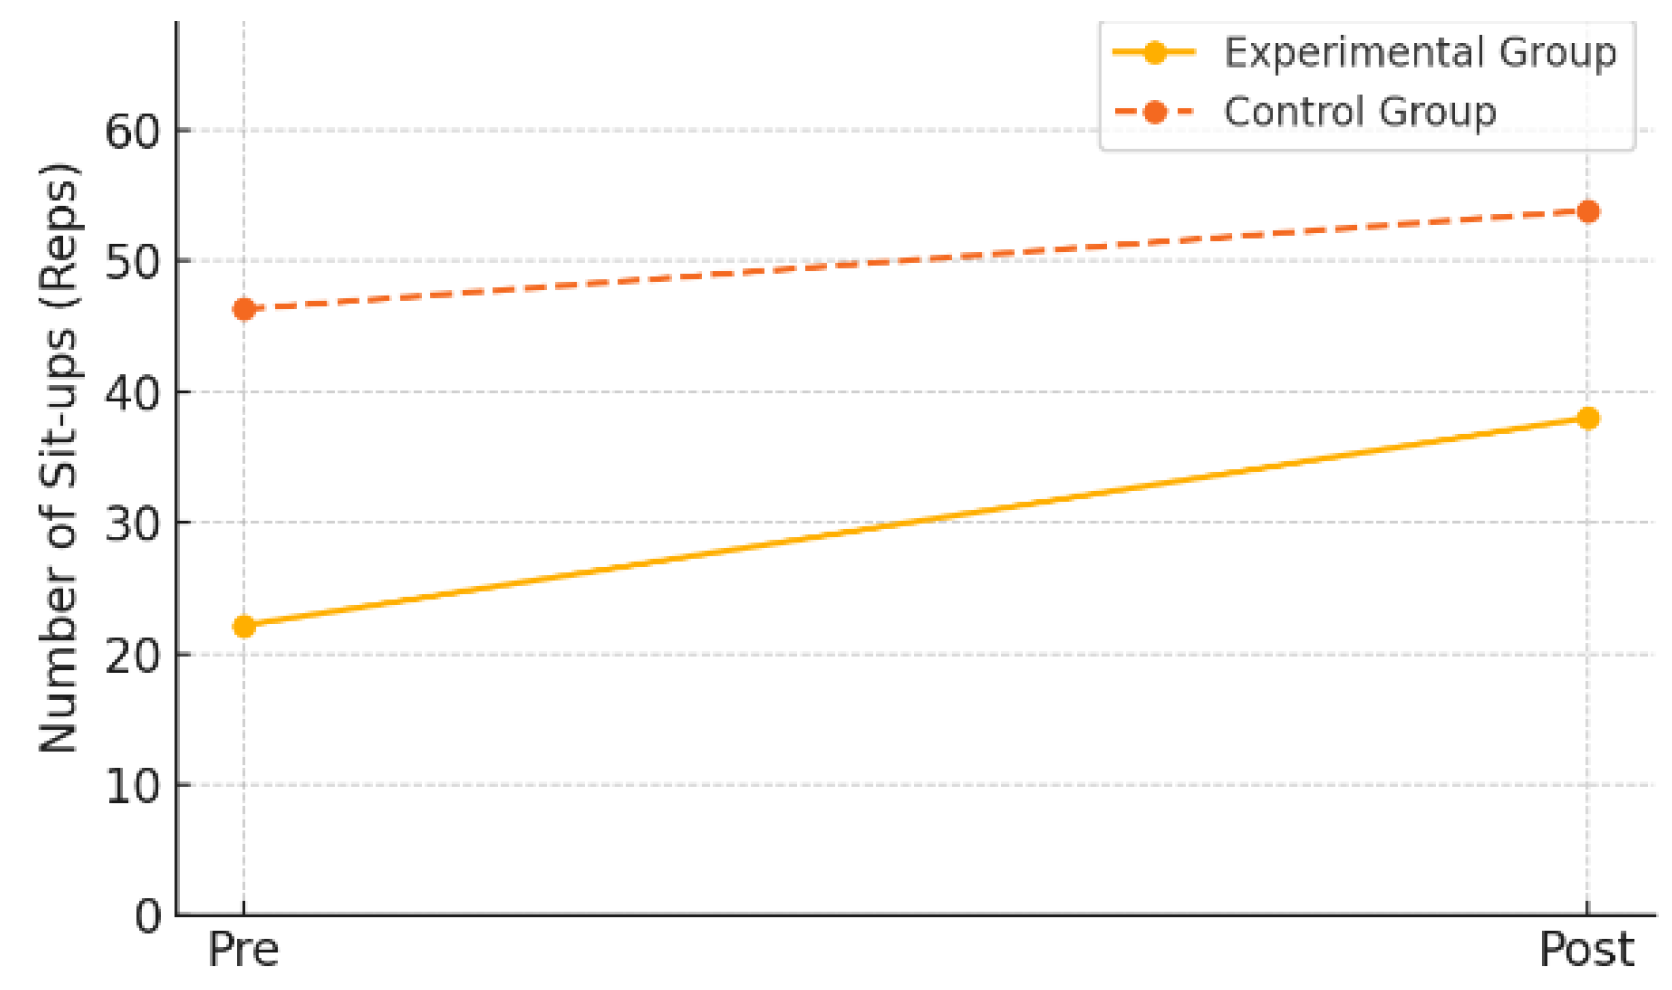
Muscular endurance was assessed by the number of sit-ups performed within one minute. In the experimental group, the mean number of sit-ups significantly increased from 22.15 (±11.95) at pre-test to 38.00 (±26.49) at post-test (t = –3.58, p = .002), with a mean change of +15.85 (±19.78). The effect size (Cohen’s d) was 0.80, indicating a large effect.
In contrast, the control group showed an increase from 46.32 (±36.03) to 53.84 (±60.81), but the difference was not statistically significant (t = –0.54, p = .597), and the effect size was only 0.12, indicating a negligible effect.
These findings suggest that the AI-FIT program had a positive effect on improving muscular endurance in elementary school students.
Table 7.
Pre–post comparison of muscular endurance changes between the experimental and control groups following participation in the AI-FIT program.
Table 7.
Pre–post comparison of muscular endurance changes between the experimental and control groups following participation in the AI-FIT program.
| Variable | Group | Pre_Mean_Exp (SD) | Post_Mean_Exp (SD) | Δ(Post–Pre) | t | p-value | Cohen's d |
| muscular endurance(rep) | Experimental | 22.15 ± 11.95 | 38.00 ± 26.49 | +15.85 ± 19.78 | -3.58 | 0.002** | 0.80 |
| Control | 46.32 ± 36.03 | 53.84 ± 60.81 | +7.53 ± 60.98 | -0.54 | 0.597 | 0.12 |
Δ = Post – Pre, SD = Standard Deviation, d = Cohen’s effect size, p < .05(*), p < .01 (**), p < .001(***).
Figure 6.
Pre-post changes in muscle endurance by group.
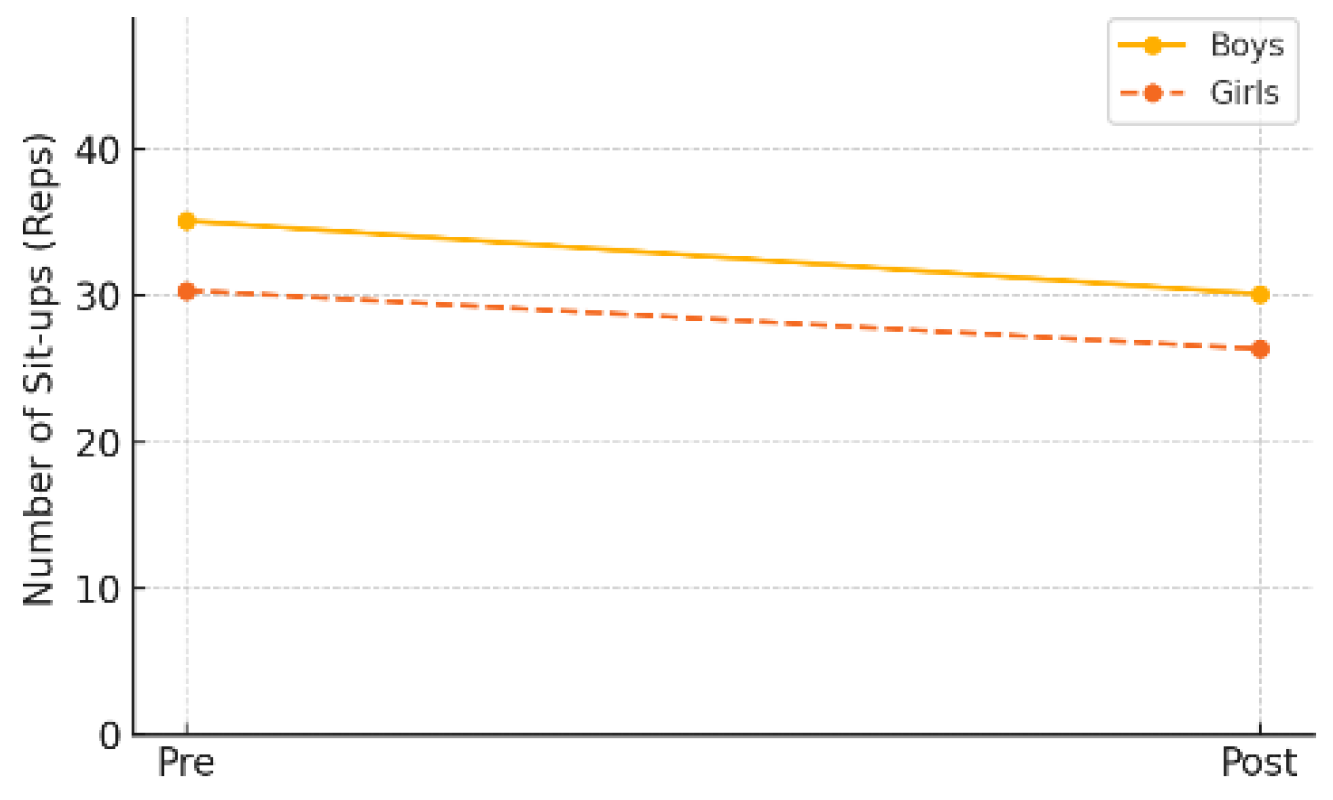
In the gender-specific subgroup analysis within the experimental group, changes in muscular endurance were not statistically significant for either male or female students. Male students showed a decrease from a pre-test mean of 35.11 repetitions (±16.62) to a post-test mean of 30.11 repetitions (±15.35), which was not statistically significant (p = .083). Female students also demonstrated a decline, from 30.36 repetitions (±13.32) to 26.36 repetitions (±13.63), with the result approaching but not reaching statistical significance (p = .058).
These findings suggest that while muscular endurance significantly improved at the overall experimental group level, statistically significant changes were not observed within gender-specific subgroups.
Table 8.
Pre–post comparison of muscular endurance between male and female subgroups within the experimental group.
Table 8.
Pre–post comparison of muscular endurance between male and female subgroups within the experimental group.
| Variable | Boy | p-value | Girl | p-value | |||
| Pre_Mean_Boy (SD) | Post_Mean_Boy (SD) | Pre_Mean_Girl (SD) | Post_Mean_Girl (SD) | ||||
| muscular endurance | 35.11 ± 16.62 | 30.11 ± 15.35 | .083 | 30.36 ± 13.32 | 26.36 ± 13.63 | .058 | |
p < .05(*), p < .01 (**), p < .001(***).
Figure 7.
Pre-post changes in muscle endurance by gender (experimental group).
3.4. Changes in Overall Physical Fitness (PAPS Grade)
Although the PAPS grade is an ordinal scale ranging from 1 to 5, it was treated as an interval scale in this study to allow for the calculation of means and standard deviations. The PAPS (Physical Activity Promotion System) consists of five levels, where Grade 1 indicates excellent physical fitness and Grade 5 indicates poor fitness. Thus, a decrease in the PAPS grade represents an improvement in overall health-related fitness.
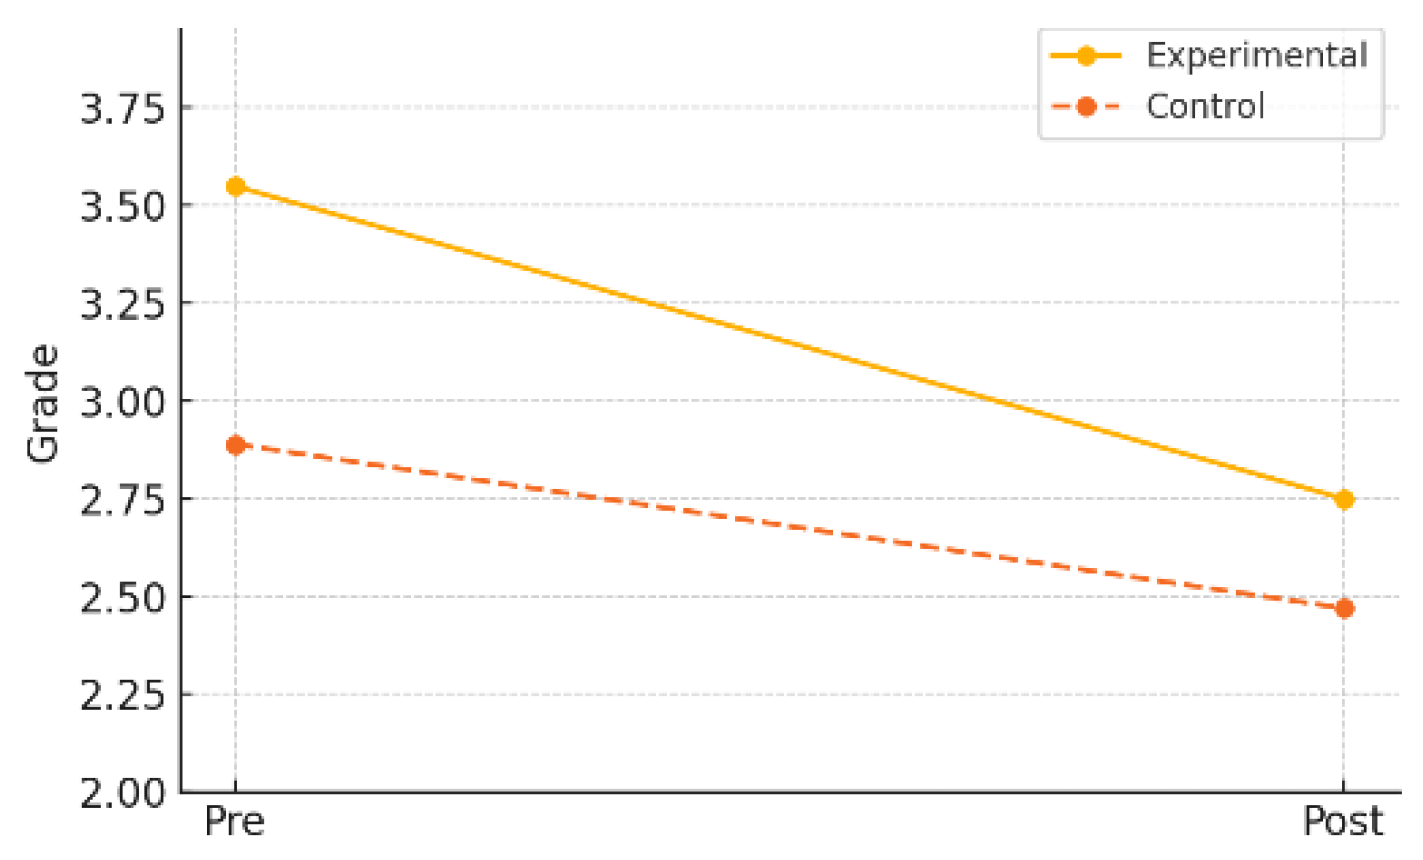
In the experimental group, the mean PAPS grade significantly improved from 2.90 (±0.64) at pre-test to 2.75 (±0.53) at post-test (t = 3.11, p = .006), with an effect size (Cohen’s d) of 0.69, indicating a moderate-to-large effect. In contrast, the control group showed no significant change, with the mean grade slightly increasing from 2.80 (±0.65) to 2.85 (±0.70) (t = –0.41, p = .684), and a negligible effect size of –0.07.
Additionally, a nonparametric Wilcoxon signed-rank test was conducted to further validate the findings. The results revealed a statistically significant improvement in the experimental group (Z = –3.720, p < .001), reinforcing the reliability of the observed enhancement in overall physical fitness as measured by the PAPS grade.
Table 9.
Pre–post comparison of overall physical fitness (PAPS grade) between the experimental and control groups following participation in the AI-FIT program.
Table 9.
Pre–post comparison of overall physical fitness (PAPS grade) between the experimental and control groups following participation in the AI-FIT program.
| Variable | Group | Pre_Mean_Exp (SD) | Post_Mean_Exp (SD) | Δ(Post–Pre) | t | p-value | Cohen's d |
| PAPS Score | Experimental | 3.55 ± 0.60 | 2.75 ± 0.91 | -0.80 ± 1.15 | 3.11 | 0.006** | -0.69 |
| Control | 2.89 ± 0.74 | 2.47 ± 1.17 | -0.42 ± 0.77 | 2.39 | 0.028* | -0.55 |
Δ = Post – Pre, SD = Standard Deviation, d = Cohen’s effect size, p < .05(*), p < .01 (**), p < .001(***).
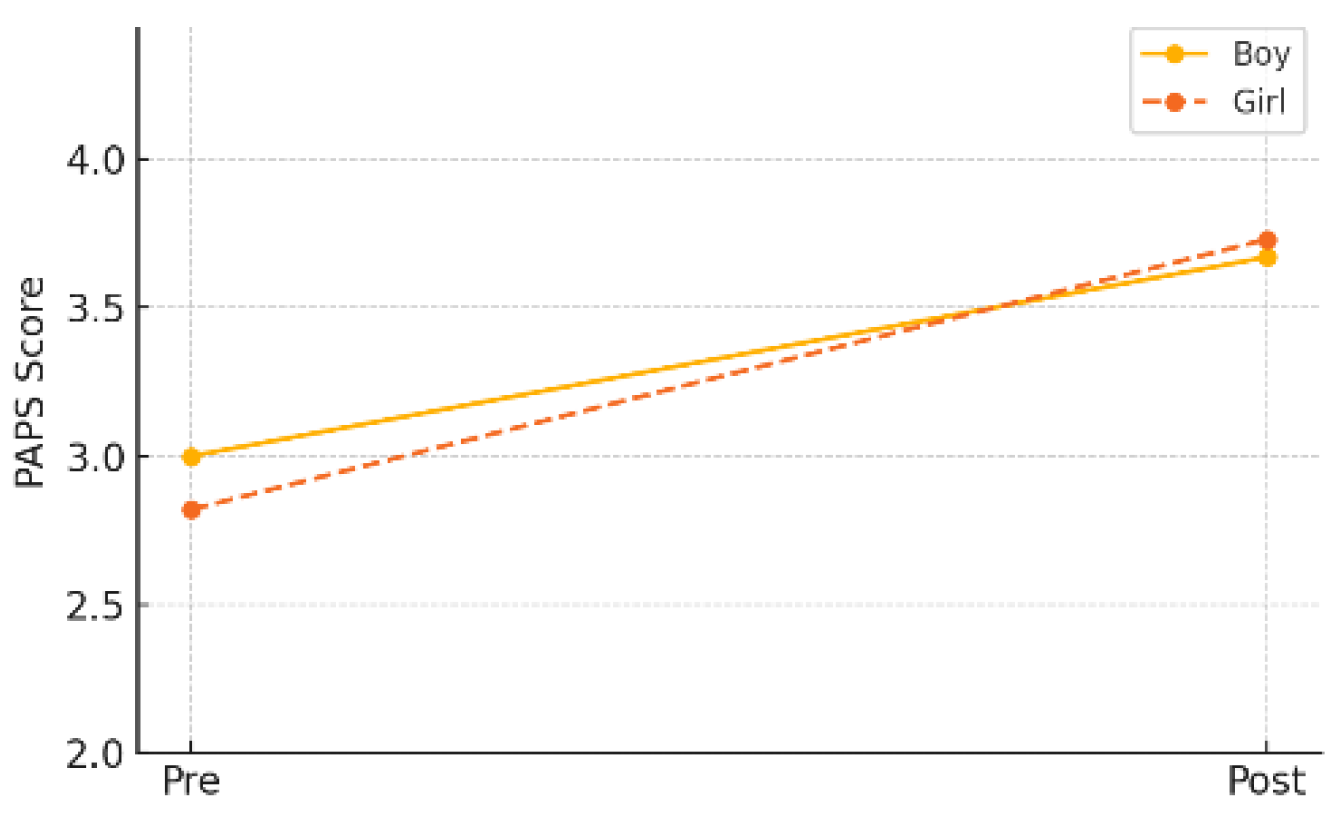
Figure 8.
Pre-post changes in PAPS grade by group.
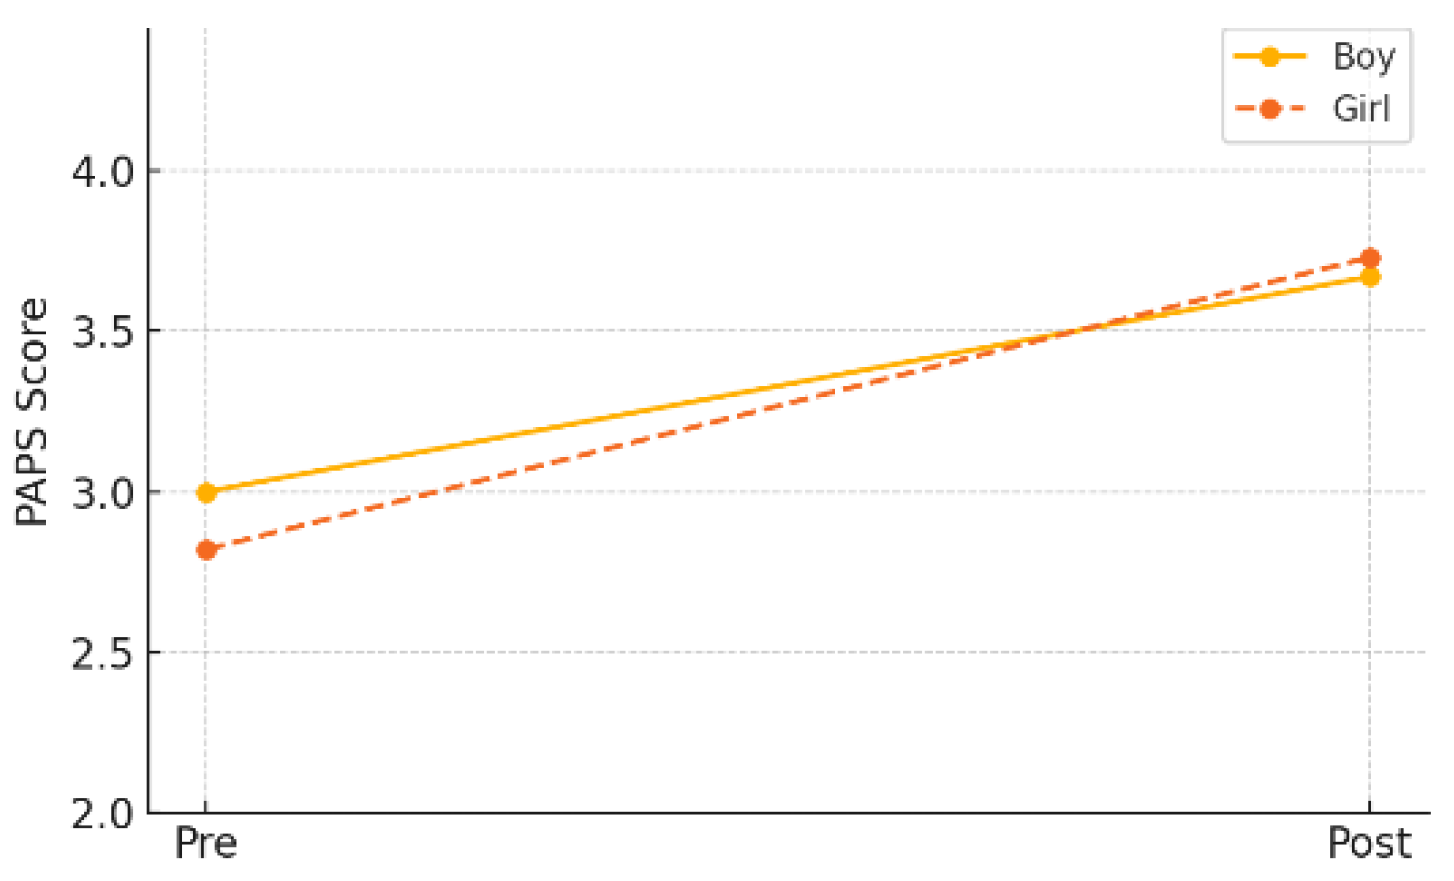
In the gender-specific subgroup analysis within the experimental group, both male and female students demonstrated statistically significant improvements in PAPS grade. Male students improved from a pre-test mean of 3.00 (±0.87) to a post-test mean of 2.67 (±0.87) (p = .013), while female students showed an even greater improvement, from 2.82 (±0.70) to 2.73 (±0.74) (p = .001). These results suggest that the AI-FIT program had a positive effect on enhancing overall physical fitness in children, regardless of gender.
Table 10.
Pre–post comparison of overall physical fitness (PAPS grade) between male and female subgroups within the experimental group.
Table 10.
Pre–post comparison of overall physical fitness (PAPS grade) between male and female subgroups within the experimental group.
| Variable | Boy | p-value | Girl | p-value | ||
| Pre_Mean_Boy (SD) | Post_Mean_Boy (SD) | Pre_Mean_Girl (SD) | Post_Mean_Girl (SD) | |||
| PAPS Score | 3.00 ± 0.87 | 3.67 ± 0.87 | .013 * | 2.82 ± 0.70 | 3.73 ± 0.74 | .001 *** |
p < .05(*), p < .01 (**), p < .001(***).
Figure 9.
Pre-post changes in PAPS grade by gender (experimental group).
3.5. Changes in Cardiorespiratory Endurance
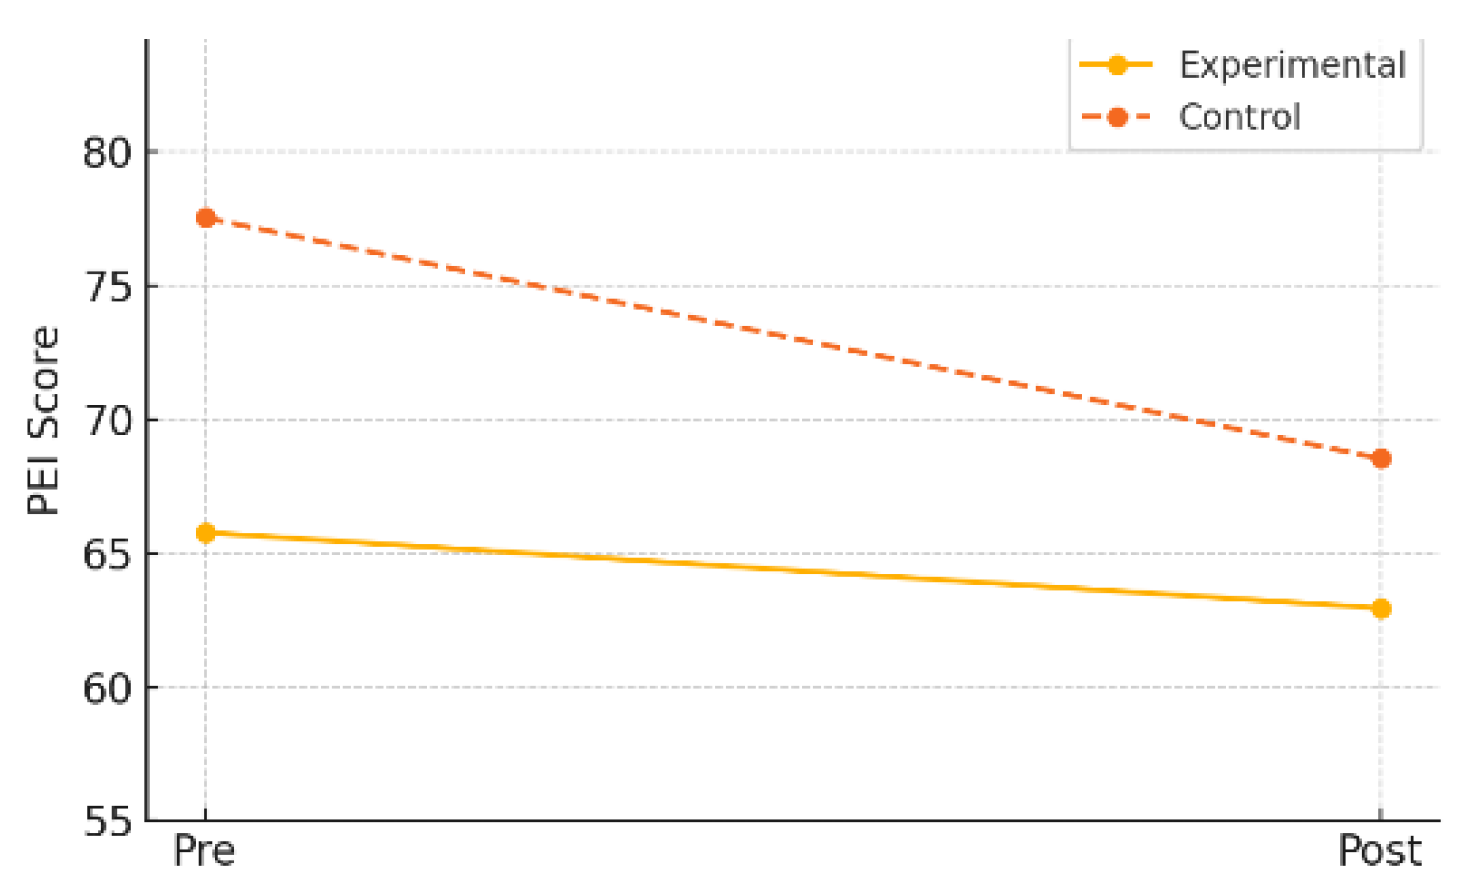
Cardiorespiratory endurance was assessed using a standardized shuttle run test (Physical Endurance Index, PEI). In the experimental group, the mean score slightly decreased from 65.77 (±21.98) at pre-test to 62.95 (±18.88) at post-test, but this change was not statistically significant (t = 0.52, p = .607). The mean change was –2.82 (±23.54), and the effect size (Cohen’s d) was –0.12, indicating a negligible effect.
In contrast, the control group showed a statistically significant decrease, with the mean score dropping from 77.54 (±17.28) to 68.50 (±17.22) (t = 3.36, p = .002). The mean change was –9.04 (±17.20), and the effect size was –0.56, indicating a moderate decline.
These findings suggest that while the AI-FIT program did not lead to significant improvements in cardiorespiratory endurance, it may have played a role in mitigating the decline observed in the control group.
Table 11.
Pre–post comparison of cardiorespiratory endurance between the experimental and control groups following participation in the AI-FIT program.
Table 11.
Pre–post comparison of cardiorespiratory endurance between the experimental and control groups following participation in the AI-FIT program.
| Variable | Group | Pre_Mean_Exp (SD) | Post_Mean_Exp (SD) | Δ(Post–Pre) | t | p-value | Cohen's d |
| Endurance (PEI) | Experimental | 65.77 ± 21.98 | 62.95 ± 18.88 | -2.82 ± 23.54 | 0.52 | 0.607 | -0.12 |
| Control | 77.54 ± 17.28 | 68.54 ± 36.03 | -9.00 ± 30.50 | 1.22 | 0.241 | -0.30 |
Δ = Post – Pre, SD = Standard Deviation, d = Cohen’s effect size, p < .05(*), p < .01 (**), p < .001(***).
Figure 10.
Pre-post changes in cardiorespiratory endurance by group.
In the gender-specific subgroup analysis within the experimental group, male students showed a slight, non-significant increase in cardiorespiratory endurance, from a pre-test mean of 30.33 repetitions (±11.42) to a post-test mean of 31.11 repetitions (±13.18) (p = .683). Female students also demonstrated an upward trend, increasing from 28.45 repetitions (±15.13) to 33.00 repetitions (±13.98), but the change did not reach statistical significance (p = .091). These results indicate that no clear improvements in cardiorespiratory endurance were observed in either gender subgroup.
Table 12.
Pre–post comparison of cardiorespiratory endurance between male and female subgroups within the experimental group.
Table 12.
Pre–post comparison of cardiorespiratory endurance between male and female subgroups within the experimental group.
| Variable | Boy | p-value | Girl | p-value | |||
| Pre_Mean_Boy (SD) | Post_Mean_Boy (SD) | Pre_Mean_Girl (SD) | Post_Mean_Girl (SD) | ||||
| Endurance (count) | 30.33 ± 11.42 | 31.11 ± 13.18 | .683 | 28.45 ± 15.13 | 33.00 ± 13.98 | .091 | |
p < .05(*), p < .01 (**), p < .001(***).
Figure 11.
Pre-post changes in cardiorespiratory endurance by gender (experimental group).
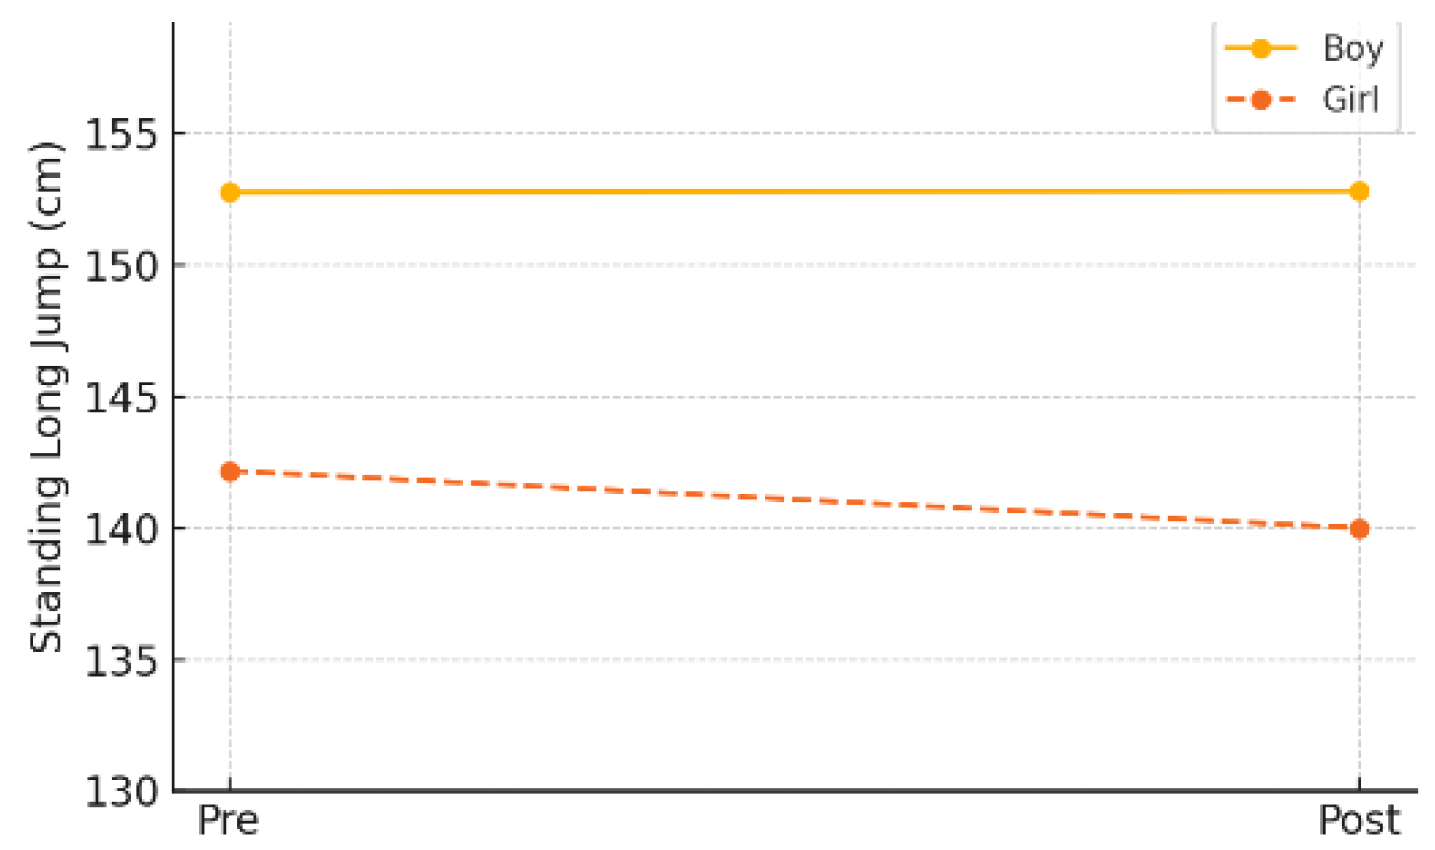
3.6. Changes in Power
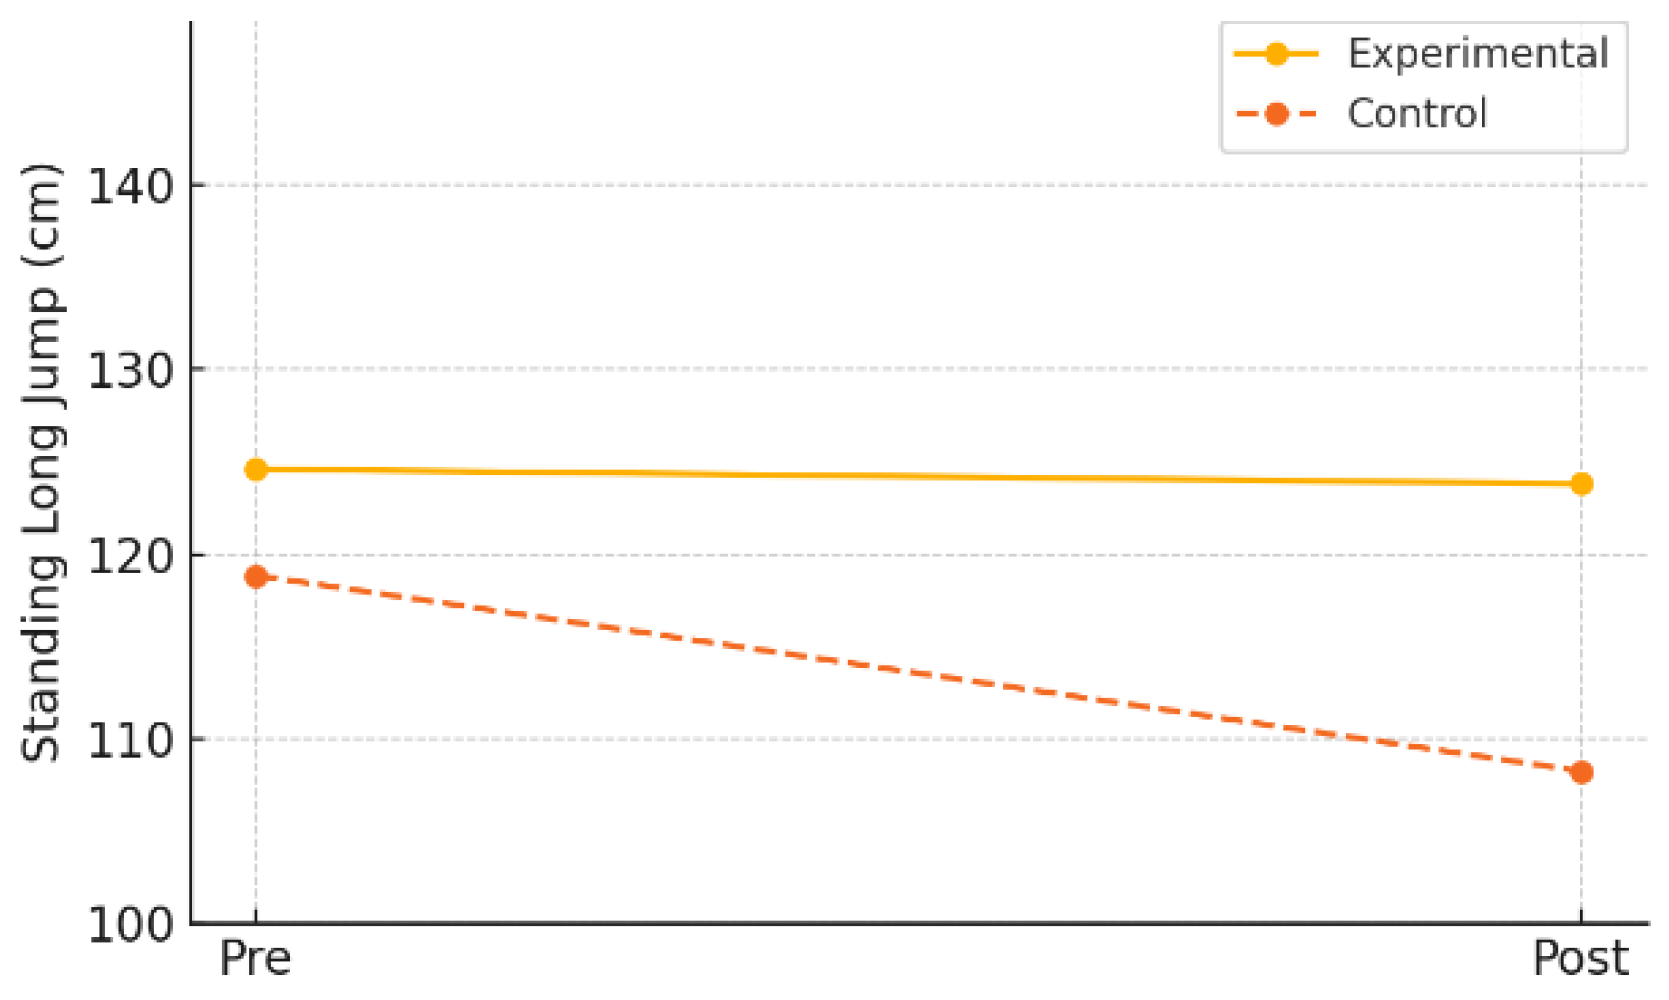
Power was evaluated using the standing long jump test. In the experimental group, the mean jump distance slightly decreased from 124.60 cm (±25.30) at pre-test to 123.80 cm (±47.08) at post-test, but this change was not statistically significant (t = 0.07, p = .941). The mean change was –0.80 cm (±47.76), and the effect size (Cohen’s d) was –0.02, indicating virtually no effect.
Similarly, the control group showed a decline from a pre-test mean of 118.85 cm (±34.10) to a post-test mean of 108.25 cm (±51.06), which also was not statistically significant (t = 0.72, p = .480). The mean change was –10.60 cm (±65.73), and the effect size was –0.16, suggesting only a minimal effect.
These findings suggest that the digital game-based physical activity program used in this study may not have been sufficient to produce measurable improvements in power within a short-term intervention period.
Table 13.
Pre–post comparison of power between the experimental and control groups following participation in the AI-FIT program.
Table 13.
Pre–post comparison of power between the experimental and control groups following participation in the AI-FIT program.
| Variable | Group | Pre_Mean_Exp (SD) | Post_Mean_Exp (SD) | Δ(Post–Pre) | t | p-value | Cohen's d |
| Power (cm) | Experimental | 124.60 ± 25.30 | 123.80 ± 47.08 | -0.80 ± 47.76 | 0.07 | 0.941 | -0.02 |
| Control | 118.85 ± 34.10 | 108.25 ± 51.06 | -10.60 ± 65.73 | 0.72 | 0.480 | -0.16 |
Δ = Post – Pre, SD = Standard Deviation, d = Cohen’s effect size, p < .05(*), p < .01 (**), p < .001(***).
Figure 12.
Pre-post changes in power by group.
In the gender-specific subgroup analysis within the experimental group, male students showed virtually no change in power, with a pre-test mean of 152.78 cm (±30.15) and a post-test mean of 152.83 cm (±31.02) (p = .999). Female students showed a slight decline, from 142.18 cm (±25.80) to 140.00 cm (±21.48), but the change was not statistically significant (p = .414). These findings indicate that the program did not have a notable effect on improving power in either gender subgroup.
Table 14.
Pre–post comparison of power between male and female subgroups within the experimental group.
Table 14.
Pre–post comparison of power between male and female subgroups within the experimental group.
| Variable | Boy | p-value | Girl | p-value | |||
| Pre_Mean_Boy (SD) | Post_Mean_Boy (SD) | Pre_Mean_Girl (SD) | Post_Mean_Girl (SD) | ||||
| Power (cm) | 152.78 ± 30.15 | 152.83 ± 31.02 | .999 | 142.18 ± 25.80 | 140.00 ± 21.48 | .414 | |
p < .05(*), p < .01 (**), p < .001(***).
Figure 13.
Pre-post changes in power by gender (experimental group).
4. Discussion
This study aimed to examine the effects of a digital game-based physical activity program (AI-FIT) on health-related physical fitness indicators in elementary school students, including body mass index (BMI), flexibility, muscular endurance, overall physical fitness (PAPS grade), cardiorespiratory endurance, and power. The main findings are discussed as follows.
4.1. Interpretation of Findings
4.1.1. Changes in Body Composition (BMI)
In this study, the experimental group that participated in the AI-FIT program demonstrated a statistically significant reduction in mean BMI. This result contrasts with the post-COVID-19 trend in South Korea, where children and adolescents have shown increasing BMI levels due to reduced physical activity and disrupted daily routines [23].
The AI-FIT program incorporates multiple components of physical fitness—such as muscular endurance, cardiorespiratory endurance, flexibility, and power—while employing an AI-driven feedback system to deliver personalized and adaptive exercise prescriptions based on learner data. This iterative and progressive approach aligns with core principles of exercise prescription and proved effective in improving body composition.
According to a meta-analysis [17], active video games (AVGs) can positively influence BMI reduction in youth. However, many previous studies have focused primarily on game participation itself, rather than integrating scientific exercise planning. In contrast, the present study combined exercise science with a real-time AI feedback system, which contributed to tangible improvements in body composition.
Kolanowski and Ługowska [24] also demonstrated that school-based fitness interventions can be effective in reducing BMI, aligning with the findings of this study. Notably, this research exemplifies the practical potential of AI-FIT as a digital health intervention.
The gender subgroup analysis further revealed that BMI significantly decreased among male students, while female students showed a trend toward reduction that did not reach statistical significance. This may be attributed to gender-based differences in motivation and engagement with digital games. Previous studies have found that boys tend to have more favorable attitudes toward games and spend more time engaging with them compared to girls [25,26]. Nikken and Jansz [27] also noted that boys are more responsive to competitive elements in games.
In contrast, girls generally show lower preferences for competition-focused games and lower immersion levels [28], which may have affected their participation and engagement in the program. Therefore, future program designs should consider incorporating collaborative, story-driven, and socially interactive elements to enhance engagement among female students.
In conclusion, the AI-FIT program was effective in improving body composition overall, with a more pronounced effect observed among male students who tended to participate more actively in digital game-based activities. Understanding and integrating such gender differences into program design is essential for enhancing the effectiveness of digital physical education interventions.
4.1.2. Changes in Flexibility
The AI-FIT program also proved to be an effective intervention for enhancing flexibility. Although flexibility is often overlooked among fitness components, this program successfully promoted active participation and repeated execution through a combination of digital game-based elements and structured exercise prescriptions, ultimately resulting in meaningful physical improvements. These changes are not merely attributable to the program’s gamified appeal, but rather to its structured inclusion of lower-body and core-centered stretching exercises (e.g., toe touches, ground touches, planks), which were delivered with a specific frequency and number of sets, and progressively intensified based on AI-monitored performance data.
This intervention model differs significantly from conventional physical education classes by providing a systematic framework for repetition and individualization in flexibility training. Particularly, flexibility tends to improve more rapidly than muscular or cardiorespiratory endurance, making it a suitable focus in early stages of intervention to promote self-efficacy [29]. Ahmed Khan, Ansari, and Azeemi [30] also found that improvements in flexibility serve as a psychological facilitator by boosting children's self-confidence and sustained motivation for physical activity.
Furthermore, considering developmental characteristics of children, the upper elementary years (grades 4 to 6) may represent an optimal period for targeted flexibility interventions. Buhari and Joseph [31] reported that a gymnastics-based intervention for children aged 9–12 significantly improved flexibility in both boys and girls, with no statistically significant gender differences. This supports the findings of the present study, in which the AI-FIT program effectively enhanced flexibility regardless of gender.
Similarly, Comeras-Chueca et al. [32], in a systematic review, reported that active video games positively influence movement-related functionality such as flexibility in children and adolescents with healthy weight. Staiano and Calvert [33] also emphasized that immersive game-based activities promote exercise adherence and repetition, contributing to physical fitness improvements. The present study provides empirical support for these findings by demonstrating that AI-driven digital interventions can improve fundamental fitness components such as flexibility.
Additionally, the consistent improvement observed across gender subgroups in this study suggests that the AI-FIT program functioned equitably, without favoring specific populations, and adapted effectively to a range of physical conditions. This reinforces its potential as a gender-inclusive intervention model for future fitness education programs.
In conclusion, by integrating immersive game-based elements with structured exercise content, the AI-FIT program contributed meaningfully to improving flexibility—a frequently underestimated component of physical fitness. These findings further underscore the educational potential of digital feedback-based interventions in school-based physical education.
4.1.3. Changes in Muscular Endurance
The experimental group participating in the AI-FIT program showed a statistically significant improvement in muscular endurance, as measured by the number of sit-ups performed in one minute. The effect size was large (Cohen’s d = 0.80), indicating that the digital game-based intervention effectively enhanced muscular endurance by promoting repeated physical activity among children. In particular, AI-FIT included multiple sets of bodyweight exercises focused on the upper body and core—such as arm walking, planks, mountain climbers, box runs, and burpees—which are well-suited to improving muscular endurance in elementary students, who are generally unfamiliar with resistance-based stimuli.
These findings are consistent with previous studies on resistance training. Faigenbaum et al. [34] demonstrated that high-repetition, moderate-intensity resistance training significantly improved muscular endurance in elementary school children. Similarly, a meta-analysis [35] confirmed that strength training programs for youth can be increasingly effective depending on the level of repetition and duration of intervention. Resaland et al. [36] also validated the potential of a school-based physical activity intervention (ASK) to improve muscular endurance through a cluster randomized controlled trial. These studies collectively support the notion that structured exercise programs contribute to fitness development and habit formation in children.
However, in the gender-specific subgroup analysis, both male and female students showed either slight decreases or minimal changes in muscular endurance, and the results did not reach statistical significance. Rather than indicating an absence of effect, these results are likely due to reduced statistical power caused by the smaller sample sizes within subgroups and increased variance relative to the observed changes. Statistical power is closely related to sample size, and smaller samples are more vulnerable to Type II errors [37]. Resaland et al. [36] also emphasized the importance of sufficient sample sizes and cluster design for ensuring statistical robustness in school-based exercise trials.
Additionally, the possibility of a ceiling effect in subgroups with higher initial performance (e.g., male students), or limited improvement due to low baseline endurance and slower adaptation among female students, should be considered.
In conclusion, while the AI-FIT program effectively improved muscular endurance at the whole-group level, the lack of significance in gender subgroups likely reflects the influence of factors such as sample size, variance, and initial fitness levels. Future studies should aim to ensure adequate sample sizes, consider gender-specific training loads, and extend the intervention period to better capture subgroup-specific effects.
4.1.4. Changes in Overall Physical Fitness (PAPS Grade)
The AI-FIT program demonstrated a positive effect on overall physical fitness in children. The experimental group showed significant improvements in the PAPS grade, a composite indicator of health-related fitness. This suggests that the program not only improved individual fitness components but also contributed to an overall enhancement of physical health. By incorporating various fitness elements—muscular endurance, flexibility, power, and cardiorespiratory endurance—and adjusting training intensity through an AI-based feedback system, the program delivered structured and engaging training experiences tailored to each participant’s performance level.
Game-based physical activity programs have also been shown to promote not only fitness improvement but also emotional engagement, thereby enhancing children’s participation and adherence. According to a recent systematic review [38], game-based physical education programs significantly enhance enjoyment among children and adolescents, which serves as a key driver of sustained physical activity participation and self-determined motivation. Rather than focusing solely on repetitive task completion, structured physical activities grounded in play offer children a sense of psychological satisfaction and success, thereby fostering more positive attitudes toward physical exercise.
In contrast, conventional repetition-focused physical education may neglect these emotional dimensions. Overly disciplined or performance-driven approaches can undermine children's motivation for physical activity. Gu and Zhang [39] warned that children's motivation for physical education tends to decline as grade level increases, which may adversely affect their willingness to engage in long-term physical activity.
To address the limitations of using ordinal scale data, this study supplemented analysis with non-parametric testing (Wilcoxon signed-rank test), thereby improving the reliability of the findings. Furthermore, gender-specific subgroup analyses showed significant improvements in overall physical fitness for both boys and girls, suggesting that the AI-FIT program is a universally effective instructional model, regardless of gender.
In conclusion, the AI-FIT program combined the engaging elements of game-based learning with scientifically grounded instructional design to effectively enhance children’s overall physical fitness and intrinsic motivation. These findings highlight the educational value of immersive digital interventions and underscore the need to actively incorporate such approaches into future physical education programs to increase student enjoyment and participation.
4.1.5. Changes in Cardiorespiratory Endurance
In this study, the experimental group did not show a statistically significant change in cardiorespiratory endurance, as measured by the Physical Endurance Index (PEI), following participation in the AI-FIT program (t = 0.52, p = .607), with a negligible effect size (Cohen’s d = –0.12). In contrast, the control group experienced a significant decline in PEI scores over the same period (t = 3.36, p = .002), with a medium-to-large effect size (d = –0.56). These findings suggest that although the AI-FIT program may not have directly enhanced cardiorespiratory endurance, it may have played a protective role in buffering against fitness deterioration.
Previous research on the effects of active video games (AVGs) on cardiorespiratory endurance has yielded mixed results. According to a meta-analysis by Gao et al. (2015), AVGs were found to be less effective than traditional exercise programs in improving cardiorespiratory endurance, potentially due to insufficient exercise intensity or duration. Similarly, Comeras-Chueca et al. [32] suggested that interventions aiming to improve cardiorespiratory endurance through AVGs should last at least 18 weeks to achieve meaningful outcomes. Given that the AI-FIT program in this study was implemented over 12 weeks, the duration may have been insufficient to elicit measurable gains in this fitness domain.
The gender-specific subgroup analysis also revealed no statistically significant improvements in cardiorespiratory endurance for either boys or girls, indicating that AVGs do not appear to produce differential effects by gender in this domain among children.
In conclusion, while the AI-FIT program did not directly improve cardiorespiratory endurance, it may have served as a mitigating factor against performance decline. Future studies should consider increasing the program’s duration and intensity to more clearly assess its potential to enhance cardiorespiratory endurance in children.
4.1.6. Changes in Power
In this study, no statistically significant changes were observed in power—as measured by standing long jump performance—in either the experimental or control group. This suggests that short-term digital game-based physical activity interventions may have limited effects on improving explosive strength.
Power is a complex fitness component that requires high-intensity muscular force and rapid neuromuscular responses. These characteristics make it difficult to improve through moderate- or low-intensity exercise within a short period. According to a meta-analysis [40], while active video games (AVGs) have shown positive effects on children’s flexibility and cardiorespiratory endurance, their impact on high-intensity strength components such as power appears limited.
Lloyd and Oliver [41] emphasized that the development of power and muscular strength in children and adolescents requires not only progressive overload and repeated training, but also targeted technical instruction. This implies that digital exercise programs alone may not provide the sufficient training stimuli or biomechanical guidance necessary for developing explosive strength.
In conclusion, the AI-FIT program in this study did not produce significant improvements in power. This may be attributed to multiple factors, including insufficient exercise intensity, lack of repetition, and the absence of technical instruction within the program design. To enhance power outcomes, future interventions should incorporate high-intensity training elements, skill-based instruction, and possibly extend the duration of the program. Moreover, including tasks specifically designed to target power development would strengthen the effectiveness of such interventions.
4.2. Practical Implications of the Study
This study empirically confirmed that the AI-FIT digital game-based physical activity program had medium-to-large positive effects on several components of health-related physical fitness among elementary school students, including flexibility, muscular endurance, BMI, and overall physical fitness (PAPS grade). Specifically, the effect sizes (Cohen’s d) were largest for flexibility (d = 0.90), followed by muscular endurance (d = 0.80), BMI (d = 0.72), and overall fitness grade (d = 0.69), indicating that even a relatively short 12-week intervention can lead to meaningful improvements in certain fitness domains. In contrast, no significant changes were observed for cardiorespiratory endurance (d = –0.12) and power (d = –0.02), suggesting differential responsiveness among fitness components.
These findings may be interpreted through the lens of both program structure and the interaction of fitness components. The AI-FIT program consists of 16 bodyweight-based exercises, many of which are repetitive and dynamic activities that primarily target muscular endurance but also contribute to flexibility improvement [42,43]. This may explain why flexibility showed the largest gains and supports the notion that the program's structure simultaneously enhanced multiple fitness attributes.
By contrast, cardiorespiratory endurance and power are fitness domains that typically require more intensive exercise stimuli and longer intervention durations to improve. Aerobic capacity, for instance, demands sustained effort at elevated heart rates [44], while improvements in power often depend on high-intensity plyometric training and technical coaching [45]. The moderate-intensity interval-based structure of the current program may not have been sufficient to elicit improvements in these areas. Future iterations of the program should consider differentiated designs that reflect the specific responsiveness of each fitness component.
Gender subgroup analyses revealed no significant differences in most fitness outcomes, likely due to the physiological similarity of prepubescent children [46]. However, a larger effect size was observed for BMI in boys (d = 0.92), potentially reflecting boys' greater preference for and immersion in digital game content, which may have positively influenced weight control behaviors [47]. These findings highlight the importance of gender-sensitive design in future intervention programs.
Beyond physical fitness enhancement, the AI-FIT program demonstrated educational value in three key areas. First, it achieved personalization by providing AI-driven customized exercise prescriptions based on each learner’s physical characteristics and performance level [48]. Second, the program’s real-time feedback system supported self-directed learning by encouraging self-monitoring and correction [49,50]. Third, gamification elements promoted engagement and sustained participation [51].
Notably, the AI-FIT program offers a practical model for digitally transforming elementary physical education by integrating adaptive task assignment, personalized feedback, and autonomous participation. Moreover, it contributes theoretically by embodying the integrated application of technological, pedagogical, and content knowledge (TPACK) as proposed by Mishra and Koehler [52].
In conclusion, this study provides empirical and theoretical evidence that AI-based digital exercise programs can transform teaching and learning in elementary physical education. It offers a foundation for future advancements in personalized fitness education, immersive instruction, and digital feedback system development.
4.3. Limitations and Scope for Further Research
Despite the positive implications of this study, several limitations must be acknowledged. First, this study employed a relatively small sample of 40 students in grades 4 to 6 from a single elementary school located in Cheonan, Chungcheongnam-do, South Korea. Although propensity score matching was used to ensure group homogeneity, the generalizability of the findings is limited. Larger-scale follow-up studies encompassing diverse regions, age groups, and cultural contexts are needed to validate these results [20,38].
Second, the study did not systematically control for external variables that may influence exercise outcomes, such as dietary habits, sleep duration, and daily physical activity levels. Future research should rigorously measure and control for these factors to more precisely isolate the pure effects of digital physical activity interventions.
Third, this study did not include an in-depth analysis of qualitative factors such as students’ exercise immersion, motivation, or perceptions of the program. This limits understanding of the underlying mechanisms driving program effectiveness. Future studies should adopt qualitative or mixed-methods approaches incorporating interviews, observations, and self-reports to explore participants’ subjective experiences.
Fourth, the study did not sufficiently account for structural changes in students’ lifestyles post-COVID-19, such as reduced physical activity levels and increased online learning. Future research should consider these socio-environmental factors and examine how shifts in daily routines after the pandemic may influence the relationship between physical activity and health-related fitness.
In light of these limitations, future research should: (1) recruit more diverse and representative samples to enhance the generalizability of findings; (2) adopt more sophisticated study designs that control for external variables such as nutrition, sleep, and baseline activity levels; (3) incorporate psychological and social factors—such as exercise immersion, self-efficacy, and peer interactions—through qualitative or mixed-methods research; and (4) empirically investigate how digital exercise interventions function within the altered educational and lifestyle environments of the post-pandemic era.
Finally, although this study provides initial empirical support for the effectiveness of a digital game-based physical activity program, future research should expand to include comparative studies across different digital exercise platforms, long-term follow-up studies, and design-based research aimed at refining and improving such interventions.
5. Conclusions
This study applied a quasi-experimental design using propensity score matching to examine the effects of the AI-FIT digital game-based physical activity program on elementary school students’ health-related fitness. The findings highlight several key outcomes.
First, the AI-FIT program demonstrated large effect sizes for improving muscular endurance and flexibility (Cohen’s d ≥ 0.80), and medium to large effects for BMI and overall physical fitness (PAPS grade) (Cohen’s d ≈ 0.69–0.72). These results suggest that digital game-based physical activity can serve as an effective educational tool for enhancing children’s fitness. Notably, the AI-driven feedback and personalized exercise prescription system provided age- and ability-appropriate stimuli through repeated exposure, resulting in substantial short-term gains. However, no significant improvements were observed in cardiorespiratory endurance and power, indicating the need for adjustments in intervention duration, intensity, or task design for those components.
Second, the core value of this study lies in its empirical validation of AI-FIT as an edtech program based on artificial intelligence and mixed reality. By operating personalized fitness improvement programs tailored to students' physical profiles, AI-FIT serves as a leading case demonstrating the potential of AI-based physical education models.
Third, the incorporation of game mechanics and real-time feedback in AI-FIT indirectly suggests its positive influence on learner motivation. This supports the potential of edtech-integrated physical education classes to address motivational deficits and instructional rigidity often found in traditional PE settings.
Nevertheless, this study has limitations. It was a short-term intervention (12 weeks) conducted at a single elementary school in a mid-sized city, which limits the generalizability of the findings. The small sample size also constrained the ability to perform detailed subgroup analyses by gender or grade level. Future research should involve multicenter, long-term follow-up studies across diverse regions and school contexts. In addition, refining the AI algorithm and developing grade-specific instructional content will be essential.
In conclusion, AI-FIT is one of the first empirically validated edtech programs designed to improve health-related fitness in elementary school children. It provides foundational evidence for future-oriented physical education models incorporating AI-based personalized feedback, real-time data-driven diagnostics, and immersive learning environments. Educational policymakers and school administrators should build upon these results to support the digital transformation of physical education through systemic policy, teacher training, and infrastructure investment—ultimately advancing individualized fitness instruction for all students.
Author Contributions
Conceptualization: S.-W.P.; methodology, Y.-O.H.; data collection, D.-H.L., J.-H.K., S.-H.K.; analysis, Y.-O.H.; investigation, D.-H.L., J.-H.K., S.-H.K.; writing—original draft preparation, S.-W.P.; writing—review, and editing, Y.-O.H.; supervision, S.-W.P. All authors read and agreed to the published version of the manuscript.
Funding
This study received no external funding.
Institutional Review Board Statement
The study was conducted according to the guidelines of the Declaration of Helsinki and approved by Korea National University of Education (KNUE-202410-SB-0601-01).
Data availability statement: The data presented in this study are available upon request from the corresponding author. The data were not publicly available because of the protection of personal information.
Acknowledgments
The authors thank the study participants, who generously volunteered to participate in the present study.
Conflicts of Interest
The authors declare no conflicts of interest.
References
- Dunton, G. F.; Do, B.; Wang, S. D. Early Effects of the COVID-19 Pandemic on Physical Activity and Sedentary Behavior in Children Living in the U.S. BMC Public Health 2020, 20, 1351. [Google Scholar] [CrossRef] [PubMed]
- Neville, R. D.; Lakes, K. D.; Hopkins, W. G.; Tarantino, G.; Draper, C. E.; Beck, R.; Madigan, S. Global Changes in Child and Adolescent Physical Activity During the COVID-19 Pandemic: A Systematic Review and Meta-Analysis. JAMA Pediatr 2022, 176(9), 886–894. [Google Scholar] [CrossRef] [PubMed]
- Fadel, C.; Bialik, M.; Trilling, B. Four-Dimensional Education: The Competencies Learners Need to Succeed; Center for Curriculum Redesign: Boston, MA, 2015. [Google Scholar]
- Schwab, K. The Fourth Industrial Revolution; World Economic Forum: Geneva, Switzerland, 2016. [Google Scholar]
- Keeley, T.J.H.; Fox, K.R. The Impact of Physical Activity and Fitness on Academic Achievement and Cognitive Performance in Children. Int Rev Sport Exerc Psychol 2009, 2, 198–214. [Google Scholar] [CrossRef]
- Huang, H.M.; Rauch, U.; Liaw, S.S. Investigating Learners' Attitudes Toward Virtual Reality Learning Environments: Based on a Constructivist Approach. Comput Educ 2010, 55, 1171–1182. [Google Scholar] [CrossRef]
- Klopfer, E.; Sheldon, J. Augmenting Your Own Reality: Student Authoring of Science-Based Augmented Reality Games. New Dir Youth Dev 2010, 2010(128), 85–94. [Google Scholar] [CrossRef] [PubMed]
- Deutsch, J.E.; Borbely, M.; Filler, J.; Huhn, K.; Guarrera-Bowlby, P. Use of a Low-Cost, Commercially Available Gaming Console (Wii) for Rehabilitation of an Adolescent with Cerebral Palsy. Phys Ther 2008, 88(10), 1196–1207. [Google Scholar] [CrossRef] [PubMed]
- Farías-Gaytán, S.; Aguaded, I.; Ramírez-Montoya, M.S. Digital Transformation and Digital Literacy in the Context of Complexity within Higher Education Institutions: A Systematic Literature Review. Humanit Soc Sci Commun 2023, 10(1), 386. [Google Scholar] [CrossRef]
- Steuer, J. Defining Virtual Reality: Dimensions Determining Telepresence. J Commun 1993, 42(4), 73–93. [Google Scholar] [CrossRef]
- Finkenberg, M.E.; Mohnsen, B. Virtual Reality Applications in Physical Education. J Phys Educ Recreat Dance 2003, 74(9), 13–15. [Google Scholar] [CrossRef]
- Van Krevelen, D.W.F.; Poelman, R. A Survey of Augmented Reality Technologies, Applications and Limitations. Int J Virtual Real 2010, 9(2), 1–20. [Google Scholar] [CrossRef]
- Squire, K.; Klopfer, E. Augmented Reality Simulations on Handheld Computers. J Learn Sci 2007, 16(3), 371–413. [Google Scholar] [CrossRef]
- Elbadiansyah, E.; Aziz, A.L.; Sain, Z.H.; Lawal, U.S. The Implementation of Technology in Physical Education Learning for Elementary School Students: Challenges and Opportunities. ALSYSTECH J Educ Technol 2025, 3(2), 128–135. [Google Scholar] [CrossRef]
- Dergaa, I.; Ben Saad, H.; El Omri, A.; Glenn, J.M.; Clark, C.C.T.; Washif, J.A.; Guelmami, N.; Hammouda, O.; Al-Horani, R.A.; Reynoso-Sánchez, L.F.; et al. Using Artificial Intelligence for Exercise Prescription in Personalised Health Promotion: A Critical Evaluation of OpenAI’s GPT-4 Model. Biol Sport 2024, 42, 221–241. [Google Scholar] [CrossRef] [PubMed]
- Shin, D.; Hsieh, G.; Kim, Y.-H. PlanFitting: Tailoring Personalized Exercise Plans with Large Language Models. arXiv, 2023; arXiv:2309.12555. [Google Scholar]
- Gao, X.; et al. From Motion Signals to Insights: A Unified Framework for Student Behavior Analysis and Feedback in Physical Education Classes. arXiv 2025, arXiv:2503.06525. [Google Scholar]
- Harris, J.; Mishra, P.; Koehler, M. J. Teachers’ Technological Pedagogical Content Knowledge and Learning Activity Types: Curriculum-Based Technology Integration Reframed. J. Res. Technol. Educ. 2009, 41(4), 393–416. [Google Scholar] [CrossRef]
- Hertzog, M. A. Considerations in Determining Sample Size for Pilot Studies. Res. Nurs. Health 2008, 31(2), 180–191. [Google Scholar] [CrossRef] [PubMed]
- Leon, A. C.; Davis, L. L.; Kraemer, H. C. The Role and Interpretation of Pilot Studies in Clinical Research. J. Psychiatr. Res. 2011, 45(5), 626–629. [Google Scholar] [CrossRef] [PubMed]
- Chang, B.-K. Examining the Degree of Changes in Korean Elementary Schools’ Physical Activity Promotion System Grades Amidst the COVID-19 Pandemic. Iran. J. Public Health 2022, 51(5), 1010–1019. [Google Scholar] [CrossRef] [PubMed]
- Lee, E.-J.; So, W.-Y.; Youn, H.-S.; Kim, J. Effects of School-Based Physical Activity Programs on Health-Related Physical Fitness of Korean Adolescents: A Preliminary Study. International Journal of Environmental Research and Public Health 2021, 18(6), 2976. [Google Scholar] [CrossRef] [PubMed]
- Choi, J. E., Lee, H. A., Park, S. W., Lee, J. W., Lee, J. H., Park, H., & Kim, H. S. (2023). Increase of prevalence of obesity and metabolic syndrome in children and adolescents in Korea during the COVID-19 pandemic: A cross-sectional study using the KNHANES. Children, 10(7), 1105.
- Kolanowski, W., & Ługowska, K. (2024). The effectiveness of physical activity intervention at school on BMI and body composition in overweight children: A pilot study. Applied Sciences, 14(17), 7705.
- Ceranoglu, T. A. (2010). Video games in psychotherapy. Review of General Psychology, 14(2), 141–146.
- Zagal, J. P., & Bruckman, A. (2008). The Game Ontology Project: Supporting learning while contributing authentically to game studies. In G. Kanselaar, V. Jonker, P. A. Kirschner, & F. J. Prins (Eds.), Proceedings of the 8th International Conference of the Learning Sciences (ICLS 2008) (Vol. 2, pp. 499–506). International Society of the Learning Sciences.
- Nikken, P., & Jansz, J. (2006). Parental mediation of children's videogame playing: A comparison of the reports by parents and children. Learning, Media and Technology, 31(2), 181–202. [CrossRef]
- Lucas, K., & Sherry, J. L. (2004). Sex differences in video game play: A communication-based explanation. Communication Research, 31(5), 499–523. [CrossRef]
- Kumar, R., & Zemková, E. (2022). The effect of 12-week core strengthening and weight training on muscle strength, endurance and flexibility in school-aged athletes. Applied Sciences, 12(24), 12550. [CrossRef]
- Ahmed Khan, U., Ansari, B., & Azeemi, H. I. (2025). Effect of exercise therapy on endurance and flexibility in young school children. Journal of Physical Sports and Allied Health Sciences, 3(1), Article 03. [CrossRef]
- Buhari, S. M., & Joseph, G. (2024). Relationship of gymnastics exercise and hip flexibility on elementary school children. International Journal of Physical Education, Sports and Health, 11(3), 390–393.
- Comeras-Chueca, C., Marin-Puyalto, J., Matute-Llorente, Á., Vicente-Rodríguez, G., Casajús, J. A., & González-Agüero, A. (2021). The effects of active video games on health-related physical fitness and motor competence in children and adolescents with healthy weight: A systematic review and meta-analysis. International Journal of Environmental Research and Public Health, 18(13), 6965. [CrossRef]
- Staiano, A. E., & Calvert, S. L. (2011). Exergames for physical education courses: Physical, social, and cognitive benefits. Child Development Perspectives, 5(2), 93–98. [CrossRef]
- Faigenbaum, A. D., Westcott, W. L., Loud, R. L., & Long, C. (1999). The effects of different resistance training protocols on muscular strength and endurance development in children. Pediatrics, 104(1), e5. [CrossRef]
- Behringer, M., Vom Heede, A., Yue, Z., & Mester, J. (2010). Effects of resistance training in children and adolescents: A meta-analysis. Pediatrics, 126(5), e1199–e1210. [CrossRef]
- Resaland, G. K., Aadland, E., Moe, V. F., Aadland, K. N., Skrede, T., Stavnsbo, M., & Andersen, L. B. (2019). Effects of the Active Smarter Kids (ASK) physical activity intervention on children's physical activity levels: A cluster randomized controlled trial. Preventive Medicine, 118, 1–8. [CrossRef]
- Sullivan, G. M. (2020). Type I and Type II errors and statistical power. StatPearls Publishing.
- Mo, W., Saibon, J. B., Li, Y., Li, J., & He, Y. (2024). Effects of game-based physical education program on enjoyment in children and adolescents: A systematic review and meta-analysis. BMC Public Health, 24, 517. [CrossRef]
- Gu, X., & Zhang, T. (2016). Changes of children’s motivation in physical education and physical activity: A longitudinal perspective. Advances in Physical Education, 6(3), 205–212. [CrossRef]
- Gao, Z., Chen, S., Pasco, D., & Pope, Z. (2015). A meta-analysis of active video games on health outcomes among children and adolescents. Obesity Reviews, 16(9), 783–794. [CrossRef]
- Lloyd, R. S., & Oliver, J. L. (2012). The youth physical development model: A new approach to long-term athletic development. Strength and Conditioning Journal, 34(3), 61–72. [CrossRef]
- Behm, D. G., Blazevich, A. J., Kay, A. D., & McHugh, M. (2016). Acute effects of muscle stretching on physical performance, range of motion, and injury incidence in healthy active individuals: A systematic review. Applied Physiology, Nutrition, and Metabolism, 41(1), 1–11. [CrossRef]
- Kay, A. D., & Blazevich, A. J. (2012). Effect of acute static stretch on maximal muscle performance: A systematic review. Medicine and Science in Sports and Exercise, 44(1), 154–164. [CrossRef]
- Malina, R. M., Bouchard, C., & Bar-Or, O. (2004). Growth, maturation, and physical activity (2nd ed.). Human Kinetics.
- Carter, J. B., Banister, E. W., & Blaber, A. P. (2003). Effect of endurance exercise on autonomic control of heart rate. Sports Medicine, 33(1), 33–46. [CrossRef]
- Katzmarzyk, P. T., Malina, R. M., Song, T. M., & Bouchard, C. (1998). Physical activity and health-related fitness in youth: A multivariate analysis. Medicine & Science in Sports & Exercise, 30(5), 709–714. [CrossRef]
- Bryant, M. J., Lucove, J. C., Evenson, K. R., & Marshall, S. (2007). Measurement of television viewing in children and adolescents: A systematic review. Obesity Reviews, 8(3), 197–209. [CrossRef]
- Roschelle, J. M., Pea, R. D., Hoadley, C. M., Gordin, D. N., & Means, B. M. (2000). Changing how and what children learn in school with computer-based technologies. The Future of Children, 10(2), 76–101. [CrossRef]
- Inan, F. A., Lowther, D. L., Ross, S. M., & Strahl, J. D. (2010). Pattern of classroom activities during students’ use of computers: Relations between instructional strategies and computer applications. Teaching and Teacher Education, 26(3), 540–546. [CrossRef]
- Fleer, M. (2017). Digital pedagogy: How teachers support digital play in the early years. In Digital technologies and learning in the early years (pp. 114–126). SAGE Publications Ltd.
- Earle, R. S. (2002). The integration of instructional technology into public education: Promises and challenges. ET Magazine, 42(1), 5–13.
- Mishra, P., & Koehler, M. J. (2006). Technological pedagogical content knowledge: A framework for teacher knowledge. Teachers College Record, 108(6), 1017–1054. [CrossRef]
Disclaimer/Publisher’s Note: The statements, opinions and data contained in all publications are solely those of the individual author(s) and contributor(s) and not of MDPI and/or the editor(s). MDPI and/or the editor(s) disclaim responsibility for any injury to people or property resulting from any ideas, methods, instructions or products referred to in the content. |
© 2025 by the authors. Licensee MDPI, Basel, Switzerland. This article is an open access article distributed under the terms and conditions of the Creative Commons Attribution (CC BY) license (http://creativecommons.org/licenses/by/4.0/).
Copyright: This open access article is published under a Creative Commons CC BY 4.0 license, which permit the free download, distribution, and reuse, provided that the author and preprint are cited in any reuse.


