Submitted:
09 May 2025
Posted:
12 May 2025
You are already at the latest version
Abstract
The use of UV filters is a well-established strategy for preventing skin cancer and photoaging. Among inorganic filters, titanium dioxide (TiO2) provides excellent protection against both UVA and UVB radiation. Moreover, the use of such inorganic filter at the nanosized scale has increased their acceptability because it ensures the cosmetically desired transparency in sunscreens that consumers demand. However, concerns remain regarding the potential toxicity of TiO2 nanoparticles and discussion about its use in pharmaceuticals and cosmetics is still in progress. Their increased (bio)reactivity compared to bulk materials may lead to DNA damage, and their ability to penetrate dermal, respiratory, or gastrointestinal barriers is still under discussion. For this reason, the present study is focused on comparing the toxic behavior of two commercially available titanium (IV) oxides, one at the microscale and the other at the nanoscale. First, the morphology and hydrodynamic diameter of the TiO2 nanoparticles were characterized. Then, potential interactions and/or interferences of these nanoparticles with the methods used to evaluate cytotoxic behavior were studied. Finally, the hemocompatibility, cytotoxicity, phototoxicity and genotoxicity of both micro- and nano-sized TiO2 were evaluated using human keratinocytes.
Keywords:
TiO2 nanoparticles
; Hemocompatibility
; toxicity
1. Introduction
Ultraviolet (UV) radiation exposure is associated with multiple adverse effects on the skin, notably the induction of skin carcinogenesis and photoaging. Skin cancers are the most diagnosed group of cancers worldwide and among them malignant melanomas accounted for around 330,000 new cases worldwide in 2022 [1] and expecting more than 500,000 per year in 2040 [2]. Robust evidence demonstrates that the use of sunscreen significantly reduces the risk of developing both melanoma and nonmelanoma skin cancers.
Sunscreens are intricate formulations comprising both active and inactive ingredients, delivered through various vehicles. The photoprotective properties of these products are predominantly conferred by their incorporated UV filters. Titanium oxide (TiO2) is a commonly used inorganic UV filter in sunscreen formulations [3] because of its protective range and broad-spectrum protection, covering both UVA and UVB rays [4]. Moreover, TiO2 is regarded as a safe molecule being used in higher concentrations than organic UV filters. The use of micro-sized TiO2 (0.1-10.0 μm) as an inorganic sunscreen filter often raises aesthetic concerns, particularly due to the white cast it leaves on the skin, which is especially noticeable on darker skin tones. This drawback can be addressed by replacing micro-sized titanium dioxide (TiO₂) with its nano-sized counterpart. Particle size plays a critical role in determining how much UV radiation is scattered or reflected: larger particles scatter more UV radiation but also reflect more visible light, resulting in a noticeable white appearance. In contrast, nanoparticles (NPs) reflect less visible light, therefore appearing nearly transparent, compared to the white appearance of larger particles but, although the opaqueness of inorganic filters in sunscreens is reduced when the particle size decreases to 10-20 nm, the UVA absorption decreases and shifts more toward the UVB range [5,6]. In summary, substituting micro-TiO2 with NPs ensures the cosmetically desired transparency in sunscreens, but at the expense of broad UVA protection.
Nevertheless, given that the surface area to volume ratio of particles increases as the particle diameter decreases, NPs may be more (bio)reactive compared to normal bulk materials. That is why the safety of cosmetic products containing NPs has been frequently discussed. The capacity of nano-sized TiO2 to modulate inflammation, cell proliferation, apoptosis, and carcinogenesis by Reactive Oxygen Species (ROS) is described by different authors [7,8]. Moreover, nano-TiO2 can increase the production of ROS when exposed to light because it is a photoreactive molecule [9], but this issue has been addressed by coating nanoparticles with alumina or silica to quench the production of ROS that also enhances the dispersion of TiO2 nanoparticles and their compatibility with other ingredients in sunscreens formulations [10].
A critical concern associated with the ultrafine dimensions of nano-TiO2, implies their potential to traverse physiological barriers such as the skin, respiratory epithelium, or gastrointestinal tract. Such penetration raises the possibility of systemic distribution and subsequent toxicological effects, thereby representing a potential risk to human health [11,12]. Moreover, some studies found that, after a prolonged application of TiO2 NPs sunscreens in healthy human skin, these NPs were detected in the epidermis and dermis, indicating that the TiO2 NPs could, in fact, penetrate deeper layers of the skin [13]. The use of some formulations such as aerosol sprays allows TiO2 NPs to enter via inhalation and ingestion to the body and induce harmful effects to organic internal systems and organs. In this sense, toxic effects of TiO2 NPs in respiratory, endocrine and reproductive system have been reported using animal models [14]. Finally, regarding the potential risks that TiO2 nanoparticles may induce in the gastrointestinal tract, its use as a food additive was banned recently [15] by being its use in pharmaceuticals and cosmetics an open debate still in progress [16].
The present study aims to comparatively evaluate the toxicological profiles of two commercially available titanium (IV) oxide formulations at the micro- and nanoscale. First, TiO2 nanoparticles were morphologically observed and their hydrodynamic diameter determined in various media. Then, the potential interactions and/or interferences of such NPs on the methods used to evaluate cytotoxic behavior were studied. Finally, the hemocompatibility of titanium (IV) oxide as well as their cytotoxicity, genotoxicity and phototoxicity using human keratinocytes is assessed.
2. Materials and Methods
2.1. Chemicals, reagents and culture media
TiO2 nano- and micro-sized particles were supplied by Sigma-Aldrich (Madrid, Spain). Dimethyl sulfoxide (DMSO), Thiazolyl Blue Tetrazolium Bromide (MTT), Neutral Red Solution (NR), Trypan Blue Solution and Ethanol and Acetic Acid, used to prepare the extinction solution, all of them were acquired from Sigma-Aldrich (Madrid, Spain). Dulbecco’s Modified Eagle Medium (DMEM) 4.5 g/L glucose, trypsin protease solution and Sterile Phosphate Buffer Saline Solution (PBS) were purchased at Cytiva (Marlborough, Massachusetts, USA). L-glutamine 2 mM and penicillin-streptomycin solution (10,000 U/mL penicillin and 10 mg/mL streptomycin) were obtained from Corning (USA). 10% Hyclone Fetal Bovine Serum (FBS) was supplied by BioLab (Barcelona, Spain).
Phosphate Buffered Saline at pH 7.4 was prepared in house with extra pure potassium dihydrogen phosphate, synthesis grade sodium chloride (Scharlau, Sentmenat, Spain) and di-Sodium hydrogen phosphate anhydrous (Panreac, Castellar del Vallés, Spain).
Cytotoxicity Detection Kit (Roche 11644793001, Sigma-Aldrich, Madrid, Spain), Bovine Serum Albumin (≥96%) and fibrinogen (50-70% protein, ≥80% of protein is clottable) were acquired at Sigma-Aldrich (Madrid, Spain).
Reagents for comet assay: agarose type 1, low melting agarose, N-Lauroylsarcosine sodium salt, NaCl, EDTA, Tris, NaOH, Triton X-100, and 4′,6-diamidino-2-phenylindole (DAPI) were acquired from Sigma-Aldrich (Madrid, Spain).
2.2. Morphometric characterization of TiO2 nanoparticles
2.2.1. Transmission Electron Microcopy (TEM)
Nanoparticle samples were prepared by dispersing 100 μg/mL of the material in distilled water, followed by sonication in an ultrasonic bath for 3 minutes to ensure adequate dispersion. A single drop of the resulting suspension was then deposited onto a Holey Carbon-Copper grid and allowed air dry. Transmission electron microscopy (TEM) analysis was performed using a JEOL JEM-2100 microscope at “Centres Científics i Tecnològics de la Universitat de Barcelona” (CCiTUB).
2.2.2. Dynamic Light Scattering
Following the protocol described in a previous work [17], the mean hydrodynamic diameter (HD) and polydispersity index (PDI) of TiO₂ nanoparticles in different media were determined using dynamic light scattering (DLS) with a Malvern Zetasizer ZS (Malvern Instruments, UK) at a scattering angle of 173° and a refractive index of 2.614, specific to TiO₂. The nanoparticles (1.0 mg/mL) were incubated in phosphate-buffered saline (PBS, pH 7.4), PBS with albumin or fibrinogen (2 mg/mL), or DMEM with 5% FBS for 2 and 24 hours at 37°C. Measurements were taken using a 10×10 mm quartz cuvette (Hellma Analytics, Germany) in three sets of five readings.
2.3. Hemocompatibility studies
2.3.1. Blood collection and preparation of erythrocyte suspension
Fresh human blood was obtained via venipuncture from healthy non-smokers, abstained from alcohol consumption and were not undergoing any form of pharmacological treatment at the time of donation. Blood collection was performed using tubes containing EDTA or sodium citrate as anticoagulants. Alls procedures were conducted after obtaining informed consent and approval of Bioethics Committee at University of Barcelona, Spain (15 February 2021).
Blood extracted with EDTA was centrifuged for 10 min at 3,000 rpm to remove plasma traces, buffy coat, and platelets, leaving only erythrocytes. Immediately, the isolated red blood cells (RBC) or erythrocytes were suspended in twice the volume of saline solution (PBS, pH 7.4) and the washing procedure (centrifugation/discarding plasma/washing with PBS) was carried out three more times until a transparent and colorless supernatant was obtained. The final RBC suspension was adjusted by adding the adequate volume of PBS to obtain a maximal hemoglobin absorbance at 575 nm of 1.8-2.1.
Plasma for coagulation studies was collected from the blood samples extracted in the presence of sodium citrate and after centrifugation for 10 min at 3,000 rpm.
2.3.2. Hemolytic Activity.
The capacity of TiO2 particles to induce erythrocyte lysis was evaluated by incubating 1.0, 0.5 and 0.25 mg/mL of the particles with 25 μL of RBC in PBS at room temperature for 24 h, as reported previously [17] and in dark conditions. The hemolytic capacity of the particles was then evaluated by the absorption of hemoglobin released in the supernatant at 540 nm (Shimadzu UV-Vis 160, Japan) after rapid centrifugation (10,000 rpm, 5 min, Nahita Blue, high-speed centrifuge 2624/2, Sudelab S.L., Spain). Each experiment was repeated at least three times in triplicate and appropriate controls consisting of RBC incubated in PBS pH 7.4 (negative control or basal hemolysis) and in deionized water (positive control or total hemolysis) were included.
The percentage of RBC hemolysis was calculated using formula 1:
where A is the absorbance obtained for each sample or control, 0% refers to negative control (basal hemolysis) and 100% states for positive control or total hemolysis in hypotonic water.
Hemolysis % = [ASample – A0%]/[A100% – A0%] x 100,
Before studying the hemolytic activity of TiO2 particles, potential interferences and interactions of the particles with the assays measurements and reagents were discarded.
2.3.3. Coagulation Assays
Fresh human plasma was incubated for 30 minutes at 37°C under soft rotation in the absence (PBS, pH 7.4) and in the presence of different concentrations (0.1, 0.5 and 1.0 mg/mL) of TiO2 particles. Then, in a similar way as previously described [17], we have studied how TiO2 particles modify the coagulation process by determining the prothrombin time (PT, RecombiPlasTin 2G, HemosIL kit, Werfen, Spain) and the activated partial thromboplastin time (aPTT, SynthASil, HemosIL kit, Werfen, Spain) as a measure of extrinsic and intrinsic coagulation pathways, respectively [18].
Each experiment was repeated at least three times with plasma of different donors.
2.4. Cell culture and cytotoxicity studies
Human keratinocyte cell line HaCaT (Eucellbank, Celltec UB, Universitat de Barcelona, Barcelona, Spain) were grown and maintained in DMEM medium (4.5 g/L glucose) supplemented with 10% (v/v) FBS (Fetal Bovine Serum), 2 mM L-glutamine, 100 U/mL penicillin and 100 µg/mL streptomycin in an incubator at 37°C, 5% CO2.
Briefly, when cultures reached 80% confluence, culture medium was discarded, and cells were detached with trypsin solution. From the cell suspension obtained, cell density was determined in an aliquot treated with the vital dye Trypan Blue. Cell density was adjusted at 1 x 10⁵ cells/mL and cells were seeded in 96 well plates and maintained for 24 hours in an incubator at 37°C, 5% CO2. Then, cytotoxic activity was investigated exposing cells for 24 hours at different concentrations of TiO2 particles ranging from 0.78 to 100 µg/mL prepared from a freshly solution of 1.0 mg/mL in DMEM medium with 5% FBS, 2 mM L-glutamine, and 1% antibiotic. Before applying the treatment, the medium was aspirated, and then the cells were exposed to the compounds at decreasing concentrations. For each plate and experiment, untreated cells remaining with DMEM medium were included as viability controls. Finally, the plates were incubated for 24 hours at 37°C, 5% CO2. The assessment of the cytotoxic potential of TiO2 particles was performed using three different methods: lactate dehydrogenase (LDH) determination, reduction of the 2,5 diphenyl-3-(4,5-dimethyl-2-thiazolyl) tetrazolium bromide (MTT) dye, and the neutral red uptake (NRU) assay.
To avoid surface nanoparticle adsorption, LDH was detected in cell free supernatant without previous centrifugation [19]. Thus, the supernatant of each sample was introduced in a clear plate and mixed with the same volume of the reaction mixture following the instructions of a commercially available kit (Roche 11644793001). The plate was incubated at room temperature protected from light for up 15 minutes and finally, absorbance at 492 nm (reference wavelength of 600 nm) was measured in a Tecan Sunrise microplate reader (Männedorf, Switzerland). In each experiment controls of spontaneous cytotoxicity (untreated cells) and high cytotoxicity (1% Triton-X 100 treated cells) were included. Cytotoxicity was calculated according to the supplier’s instructions following formula 2:
where AEV is the absorbance of treated cells, ALC corresponds to low cytotoxicity values of untreated cells and AHC is the absorbance obtained for Triton-X 100 treated cells or high control cytotoxicity. Background absorbance (medium without cells) was subtracted for all samples before calculating cytotoxicity. Then cell viability will be (formula 3):
Cytotoxicity (%) = [([AEV – ALC]/[AHC – ALC]) x 100]
Cell viability (%) = 100 -Cytotoxicty (%)
For the MTT and NR uptake assays, we followed the protocols previously outlined by our research group [17]. After removing the supernatant, 100 µL of a 0.5 mg/mL MTT solution or 0.05 mg/mL NR solution in serum-free DMEM was added to each well and the plate was incubated for at least 3 hours at 37°C with 5% CO2. In the case of MTT, the resulting formazan crystals were dissolved in 100 µL of dimethyl sulfoxide (DMSO), whereas for the NRU an acidic ethanol destain solution was added to dissolve NR taken up by viable cells. Then, the plate was shaken for 10 minutes at 100 rpm to ensure even distribution of the contents. Absorbance was then measured at 550 nm using a Tecan Sunrise microplate reader (Männedorf, Switzerland), and cell viability was calculated (formula 4) as a percentage, with untreated cells representing 100% viability.
where ATC is the absorbance of treated cells, and AUC corresponds to the absorbance of untreated cells.
Cell viability (%) = [ATC/AUC] x 100]
2.5. Phototoxic behavior
The potential capacity of TiO2 to induce phototoxicity was studied in HaCaT cells following the official guideline OECD 432 [20], with slightly adaptations.
As detailed in the previous section, cells were seeded in 96 well plates in complete medium (DMEM 10% FBS, 2 mM L-glutamine, and 1% antibiotic.) and maintained in 37°C and 5% CO2 for 24 h to form a monolayer. After that, HaCaT cells were treated for one hour with increasing concentrations of TiO2 micro or nano-sized (1.95 - 250 µg/mL) diluted in sterile PBS before cells were concomitantly exposed to light. For each experiment and condition, two plates were prepared, one was exposed to 4 J/cm2 of UVA and the other maintained in dark conditions for comparative purposes. At the end of irradiation, supernatants were discarded and replaced by fresh complete medium, and plates were incubated overnight (37°C and 5% CO2). Cytotoxicity was determined by MTT and NRU assays as described above. Each condition was assayed in triplicate and cells not treated with TiO2 were included in all plates.
A photo-irritation-Factor (PIF) was calculated for each method by the following formula 5:
where IC50 is the concentration of the test chemical by which the cell viability is reduced by 50% in dark or non-irradiated conditions (−Irr) and in UV exposed or irradiated conditions (+Irr).
PIF = [IC50 (-Irr)/IC50 (+Irr)]
A PIF value greater than 5 indicates phototoxicity, a value between 2 and 5 suggests probable phototoxicity, and a value below 2 indicates non-phototoxicity.
Irradiation was performed in a photostability UV chamber (58 x 34 x 28 cm) equipped with three UVA lamps Actinic BL 15W/10 FAM/10X25BOX (Philips®, 15 W) as described in [21]. Lamps were systematically checked before irradiation by a photoradiometer Delta OHM provided with a UVA probe (HD2302 – Italy). Irradiation dose was calculated by formula 6:
where E stands for ultraviolet dose, t represents the time expressed in seconds and, finally, P is the lamp potency.
E(J/cm2) = t(s) x P(W/cm2)
2.6. Genotoxicity
The procedure described in [22] with some modifications was used [17]. Cells were treated with TiO2 micro or nano-sized at three non-cytotoxic concentrations (IC < 30%) calculated from the cytotoxicity studies.
The comet assay, also known as single-cell gel electrophoresis, is a sensitive technique used to detect DNA damage in individual cells. In this assay, cells are embedded in agarose gel on a microscope slide, lysed to remove membranes and proteins, and then subjected to electrophoresis. Damaged DNA fragments migrate out of the cell, forming a “tail” that resembles a comet, while undamaged DNA remains in the “head.” The length and intensity of the tail reflect the extent of DNA damage, making the comet assay useful for assessing genotoxicity and repair processes at the single-cell level.
At the end of exposure cells were washed with 2xPBS and detached with trypsin/EDTA (0.05%, 6 min, 37ºC). Then, cells were mixed at 1:2 with 0.9% low melting point (LMP) agarose at 37ºC and spread on slides previously coated with 1% normal melting point agarose using a format of 8 mini gels per slide, with 2-gels per concentration. Following overnight incubation at 4°C in fresh lysis solution (2.5 M NaCl, 0.1 M Na2EDTA, 10 mM Tris, 1% Triton X-100, 1% lauryl sarcosine and pH 10), slides underwent unwinding in an electrophoresis tank by immersing the slides in cold electrophoresis alkaline buffer (300 mM NaOH, 1 mM Na2EDTA) for 40 minutes at 4°C. Afterwards, electrophoresis was conducted for 30 minutes at 300 mA and 0.8V/cm. Slides were then washed with a neutralizing solution (1 M Tris, pH 7.5) three times and allowed to dry. Before the observation of the comets, slides must be hydrated by submerging 10 min in Milli-Q water. 20 μL of 5 μg/mL DAPI solution was added to dye DNA, as this compound binds to the adenine-thymine regions of the DNA, acting as a fluorochrome. This compound has a maximum absorption wavelength around 340 nm (UV) and a maximum emitting wavelength at 448 nm (blue) [23].
Under a Nikon TS100 epifluorescent microscope comets were analyzed using the semi-automated image analysis system Comet Assay IV (Perspective Instruments, Instem UK). The DNA damage was quantified as the percent of DNA intensity in tail and tail moment. Three independent experiments (n = 3) were performed with duplicates and 60 randomly selected comet were analyzed on each sample. The five extreme values for tail intensity and tail moment are discarded to ensure a valid representation of the DNA damage, in doing so reducing the high cell-to-cell variability in each slide. As a positive control for genotoxic damage, cells were treated with 250 µM methyl methanesulfonate (MMS) for 24h.
2.7. Statistical Analysis
Experimental replication is established at minimum of three with triplicates for each condition. Then, results are expressed as mean ± standard error of the mean. A two-way analysis of variance (ANOVA) followed by a two-tailed Student’s t-test, Bonferroni or Dunnett post-hoc test for multiple comparisons were used to determine the differences between the data set, using the SPSS® program (SPSS Inc., Chicago, IL, USA). In cases of one-way ANOVA was performed is indicated in the Figure caption. Differences were considered significant for p< 0.05 or p< 0.01 as indicated in figure or table footnotes.
3. Results
3.1. Transmission elecctronic microscopy (TEM)
Observation of TiO2 nanoparticles with TEM (Figure 1), indicates that nano-TiO2 is a mixture of 80% anatase and 20% rutile with a particle size of about 21 nm, corroborating the specifications provided by the commercial supplier. As reported by other authors, TiO2 in rutile phase consists of both spherical and rod shape; on the contrary, the particle of TiO2 in anatase phase has mostly spherical morphology [24,25].
3.2. Studies of dynamic light scattering (DLS)
3.2.1. Hydrodynamic diameter of TiO2 and proteins influence
Hydrodynamic diameter high values obtained for both TiO2 nano- and micro-sized particles in the different media studied indicate the existence of agglomerates, corroborating our TEM observations in the case of NPs and observations of other researchers [26,27]. This particle agglomeration is not affected by time in the case of nanoparticles, but it is observed in the case of microparticles when suspended in PBS and PBS with BSA (Table 1). Systems have been described in the literature where stability is apparently reached after 1 hour of incubation [28], corroborating this observation in the case of this oxide.
In the same way as it happened with our previous studies with ZnO [17], the diameters obtained in the absence of proteins, regardless of the incubation time, are slightly higher than in their presence, although statistical differences were not recorded in all cases some differences were observed. Moreover, comparing our DLS values at 24 hours (288.2 nm) with those previously reported with free FBS DMEM (472.0 nm) [26] corroborates this hypothesis. The possible justification for this fact is that the addition of proteins can prevent the formation of agglomerates [29] and that the presence of proteins has a stabilizing effect related not to electrostatic repulsion but to steric repulsion [30].
It could be said that the behavior between the nanometric and micrometric size has quite a lot of similarities. The only noteworthy difference to consider is the stability of the nanoparticle in the environment, since in the case of the 21nm NPs they have a smaller diameter in DMEM while for micrometric TiO2 it is in the presence of BSA.
Another variable analyzed here was polydispersity (PdI). Our samples hold a PdI ranging from 0.4 to 0.6, thus indicating that suspensions have a high PdI and are therefore quite heterogeneous [31].
The conclusions we can draw from this test is that, in general, proteins act as aggregating or disaggregating agents.
3.2. Hemocompatibility of TiO2
3.2.1. Hemolytic activity of TiO2
We have studied the hemolytic capacity of 0.25, 0.50 and 1 mg/mL TiO2 nano- and micro-sized particles (Figure 2) after being in contact with RBC suspension for 24h at room temperature and in dark conditions. Hemolysis provoked by titanium oxide was determined by spectrometric reading of free hemoglobin.
In the case of micro-sized TiO2 no hemolytic effect is observed while for nano-sized less than 30% hemolysis is calculated at the maximal concentration assessed (1 mg/mL) (Figure S1). A larger contact surface in the case of nanoparticles facilitates greater contact with the erythrocyte membrane, especially at the highest concentration, and would explain the slight differences in hemolysis observed here for both different types of particles. [32,33]. However, other characteristics should be regarded because studies with 4-8 nm TiO2 nanoparticles showed non-hemolytic effect [34]. The relationship between hemolytic capacity and zeta potential also presents contradictory aspects as both positively and negatively charged NPs can induce lysis of the erythrocyte plasma membrane. Moreover, other factors that can explain the NP hemolytic ability involve the source and nature of the RBCs and the existence of mechanical stress [33]. The conclusion is that further research is needed, and each nanoparticle should be characterized.
3.2.2. Effect of TiO2 on prothrombin and activated partial thromboplastin time
Our data shows that in the case of PT, independently of the size of the particles, there is a decrease in coagulation time with increasing concentrations of TiO2 (Figure 3, p<0.01), favoring clot formation [35]. On the contrary, TiO2 behaves differently in the case of aPTT depending on the particle size. NPs induce an increase of clotting time inversely proportional to concentration, showing the highest value at the lowest concentration. The presence of micrometric TiO2 increases coagulation time with increasing concentrations. For this reason, it has not been possible to establish a relationship between particle size and coagulation time. However, regardless of the trend, it can be said that the influence of TiO2 on coagulation time is dose-dependent [17,36].
Each nanoparticle has unique physicochemical and morphological characteristics, and its interactions with different components of the coagulation system can vary, even among nanomaterials within the same category [37]. For example, authors have reported that Ag NPs mostly affected aPTT time [38], while in the case of ZnO both pathways are affected depending on the size of NP and concentration [17]. In the case of TiO2, [34] have described a dose-dependent delay in clot formation in the case of aPTT in contrast to our findings, but a decrease in PT like our results, which was independent of the concentration assayed. This different behavior can account for particle size (4-8 nm vs 21 nm), the presence of rutile crystals included in our sample or the use of different vehicles for the study instead of PBS. It has been described as a lower hydrodynamic diameter for TiO2 NPs in RPMI 1640 medium (43%) than the value reported here in PBS, and thus less agglomeration of particles that could account in a different way to interact with coagulation factors.
The fact that nano-sized TiO2 affects dissimilarly extrinsic and intrinsic coagulation pathways indicates that further investigation should analyze which protein or factor is compromised in each specific coagulation pathway [39].
3.3. Cytotoxity and phototoxicity of TiO2 particles
3.3.1. Study of potential interactions or interferences of TiO2 NPs with cytotoxic assays
The potential interferences of TiO2 with reagents used in MTT, NRU and LDH methods as well as potential interferences in readings have been investigated under cell-free conditions using concentrations of particles ranging from 500 to almost 2 μg/mL. Special attention has been given to potential MTT reduction to formazan or absorption of NR.
In this preliminary study, we observed an increase of absorbance for MTT for both nano- and micro-TiO2 independently of the concentration assessed (Figure S2A), however this low increase does not interfere with results (Figure S2B).
In the case of NRU (Figure S3) we found an increase in absorbance in parallel to the concentration tested of TiO2 but substantially higher in the case of NPs. One explanation for this phenomenon could be that the solvent used to dissolve the neutral red is a mixture of aqueous solutions that favors the precipitation of TiO2 NPs. In contrast, in the MTT assay, NPs remain solubilized or in stable clear suspension because the solvent used to dissolve the formazan salt is DMSO, and thus NPs do not interfere with absorbance determination.
In the case of LDH no interactions or interferences were found (Figure S4).
According to these observations, the maximum concentration studied when assessing cell viability with MTT and NRU was set at 100 µg/mL and supernatant was transferred to another plate to avoid reading interferences.
3.3.2. Cytotoxicity of TiO2 particles on HaCaT cells
Viability of HaCaT cells was studied by MTT, NRU and LDH after 24 hours incubation with TiO2 particles (Figure 4). As observed, from 25 µg/mL to higher concentrations of TiO2 21 nm cell viability is reduced (p< 0.01) when assessed by LDH but not with NRU or MTT, this later assay presenting high dispersion although no interferences or interactions were detected at the concentrations assessed. In the case of micrometric particles, no alterations are detected with the MTT or NRU assays, but some very low cytotoxicity is detected with LDH at the maximal concentration assayed (about 20% decrease of cell viability, p< 0.05). Our results of cytotoxicity by the MTT assay at 100 μg/ml are like the ones recently obtained by other authors with TiO2 of 15 and 30 nm [40] who calculated that the inhibitory concentration 50 was higher than 500 μg/ml.
However, depending on the method used to assess membrane integrity, cytotoxicity may be affected. In other words, the functionality of the lysosomes is unchanged while the presence of nanoparticles favors the release of the enzyme lactate dehydrogenase (a greater number of living cells and therefore, lower percentage of viability).
It has been described in the literature that cells begin to release LDH when exposed to TiO2 NPs at 100 μg/ml [41]. Here, we have found that the increase of LDH release starts at 25 μg/ml reaching a 25% of cytotoxicity at 100 μg/ml, which is a higher value than the one described by these authors [41] but lower than the amount detected by [40].
3.3.3. Phototoxicity of TiO2 particles on HaCaT cells
Phototoxic behavior was evaluated for both nano- and micro-sized TiO2 by the calculation of PIF (Table 2) for each cellular viability method (Figure 5). For this objective, cells with treatments of micro and nano-sized TiO2 were exposed to UVA light at 4 J/cm2. The PIF for nanoparticles was greater (MTT) or equal (NRU) than 3, demonstrating that TiO2 NPs can cause phototoxicity in HaCaT cell line. In contrast, micro TiO2 results on PIF of 1.3 for MTT and NRU showing non-phototoxic potential as expected. Our results agree with [42] where micro-sized TiO₂ samples did not induce phototoxicity, contrary to TiO₂ nanoparticles of varying sizes, which exhibited phototoxic effects. Their study revealed that anatase TiO2 showed more phototoxicity than rutile TiO2, being the mixture of anatase/rutile TiO2 NPs the most phototoxic. Moreover, the phototoxic potential seems to be correlated with ROS generation depending on the nanoparticle’s size (specific area of particles) and shape [42,43] and that ROS generation is stimulated via lysosomal membrane permeabilization [44]. Nevertheless, some studies reveal the non-phototoxic effect of TiO2 on epidermis models regardless of the crystalline type [45,46].
3.4. Genotoxicity of TiO2 particles on HaCaT cells.
Genotoxic potential of TiO2 particles was investigated by evaluating DNA strand breaks using the comet assay. After 24h of cell exposure, results show that only micro-TiO2 particles produced a significant DNA damage at 12.5, 50 and 100 µg/mL when the damage was measured as the % of DNA in tail. Notably, significant increase in DNA damage was also observed in cells exposed to micro-TiO2 12.5 µg/mL when damage was measured using tail moment. In contrast, TiO2 nanoparticles did not elicit any significant genotoxic genotoxic effects under the conditions tested (Figure 6).
Numerous studies have investigated the effects of TiO₂ nanoparticles on various in vitro cell models, yet the findings remain controversial, as reviewed by Fulanito. The inconsistencies in reported outcomes—ranging from positive to negative—may be attributed to differences in the physicochemical properties of the TiO₂ particles, including particle size, crystal structure, surface area, and surface charge, as well as variations in experimental protocols such as exposure time, concentration, and cell type.umerous studies have investigated the impact of TiO2 nanoparticles on various in vitro cell models, yet the findings remain controversial, as reviewed by [47]. The disparity of reported positive and negative results could be attributed to differences in the physicochemical properties of the TiO2 particles, including particle size, crystal structure, surface area, and surface charge, as well as variations in experimental protocols such as exposure time, concentration, and cell type. [48]. Our results do not indicate a genotoxic potential for nano-TiO2, consistent with [49], who reported similar results using a 25 nm anatase-rutile mixture of TiO2 in HaCat cells. In contrast, the observed genotoxicity for TiO2 microparticles is likely linked to oxidative stress and mechanical damage associated with cellular uptake. When mammalian cells encounter insoluble particles such as TiO2 they may internalize them through phagocytosis and generate ROS, leading to oxidative damage, including lipid peroxidation and DNA strand brakes [50,51]. However, further studies are needed to verify whether oxidative stress is indeed the primary mechanism involved in these genotoxic effects.
4. Conclusions
Sunscreen formulations usually contain TiO2, regarded as a safe molecule and for its capacity to protect from UVA and UVB rays. Currently formulations commonly use nano-sized instead of micro-sized titanium oxide to avoid aesthetic complaints. However, several studies questioned the safety of TiO2 NPs for its capacity to promote ROS generation and the potential adverse effects related to them. Here we have compared different toxic properties of 21 nm TiO2 particles with micro-sized ones. Our findings indicate that although NPs were more hemolytic than micro-sized TiO2, the hemolysis induced is low and at a very high concentrations difficult to find on circulation. Moreover, the effects on coagulation cascade observed here are independent of particle size. In the case of cytotoxicity and phototoxicity, 21 nm TiO2 tends to be more cytotoxic at concentrations equal or higher of 25 µg/mL but attention should be paid with the capacity to induce phototoxic reactions, and this aspect needs further investigation. Finally, our results do not indicate a genotoxic potential associated with 21 nm TiO2. We concluded that 21 nm TiO2 shows slightly cytotoxic behavior, their potential phototoxicity being the aspect that should be studied in depth to confirm consumer’s safety.
Supplementary Materials
The following supporting information can be downloaded at the website of this paper posted on Preprints.org, Figure S1: Hemolytic activity observed after 24 hours of incubation with 1 mg/mL of TiO2 21 nm (A) and microparticles (B) at room temperature in dark conditions; Figure S2. Interferences of nano- and micro-sized TiO2 with MTT assay; Figure S3. Interferences of nano- and micro-sized TiO2 with NRU assay; Figure S4. Interferences of nano- and micro-sized TiO2 with LDH assay.
Author Contributions
Conceptualization, A.S.M., E.T., M.M. and M.P.V.; methodology, A.S.M., E.T., L.G., and M.M.; formal analysis, A.S.M. L.G., and C.C.; investigation, A.S.M. and C.C.; data curation A.S.M., C.C.; resources, E.T., M.M. and M.P.V.; writing—original draft preparation, A.S.M., E.T. and M.M.; writing—review and editing, A.S.M., M.M., E.T. L.G., and M.P.V.; supervision, M.M., E.T. and M.P.V.; funding acquisition, M.M., E.T. and M.P.V.; project administration M.M. and M.P.V.; All authors have read and agreed to the published version of the manuscript.
Funding
This research was funded by Ministerio de Economía y Competitividad–Spain and FEDER, the European Union, grant number MAT2012-38047-C02-01 and Proyecto PID2020-113186RB-I00 fund by MCIN/AEI/10.13039/501100011033.
Institutional Review Board Statement
The study was conducted according to the guidelines of the Declaration of Helsinki and approved by the Bioethics Committee of the University of Barcelona, Spain (protocol code IRB00003099, 15 February 2021).
Informed Consent Statement
Informed consent was obtained from all subjects involved in the study.
Data Availability Statement
The raw data supporting the conclusions of this article will be made available by the authors on request.
Acknowledgments
We acknowledge the Centres Científics i Tecnològics of Universitat de Barcelona (CCiT UB) for their help and assistance on the microscopy studies. Also, we are indebted to Ms. Laura Marics and Laura Bescós for their technical support in the experimental sections.
Conflicts of Interest
The authors declare no conflicts of interest.
Abbreviations
The following abbreviations are used in this manuscript:
| aPTT | Activated partial thromboplastin time |
| CCiTUB | Centres Científics i Tecnològics de la Universitat de Barcelona” |
| DLS | Dynamic light scattering |
| DMSO | Dimethyl sulfoxide |
| FBS | Fetal Bovine Serum |
| HD | Hydrodynamic diameter |
| LDH | Lactate dehydrogenase |
| MTT | Thiazolyl Blue Tetrazolium Bromide |
| NPs | Nanoparticles |
| NR | Neutral Red Solution |
| NRU | Neutral Red Uptake |
| PBS | Phosphate Buffer Saline Solution |
| PDI | Polydispersity index |
| PIF | Photo-irritation-Factor |
| PT | Prothrombin time, |
| RBC | Red blood cells |
| ROS | Reactive Oxygen Species |
| TEM | Transmission Electron Microcopy |
| UV | Ultraviolet |
References
- WHO, Skin cancer. https://www.iarc.who.int/cancer-type/skin-cancer/ (accessed on 08/10/2024).
- Arnold, M., Singh, D., Laversanne, M., Vignat, J., Vaccarella, S., Meheus, F., Cust, A.E., de Vries, E., Whiteman, D.C., Bray, F. Global Burden of Cutaneous Melanoma in 2020 and Projections to 2040. JAMA Dermatol. 2022, 158(5), 495-503. [CrossRef]
- Chaiyabutr, C., Sukakul, T., Kumpangsin, T., Bunyavaree, M., Charoenpipatsin, N., Wongdama, S., Boonchai, W. Ultraviolet filters in sunscreens and cosmetic products-A market survey. Contact Dermatitis. 2021, 85(1), 58-68. [CrossRef]
- National Academies of Sciences, Engineering, and Medicine. Review of Fate, Exposure, and Effects of Sunscreens in Aquatic Environments and Implications for Sunscreen Usage and Human Health. 2022. Washington (DC): National Academies Press (US). [CrossRef]
- Jiménez Reinosa, J., Leret, P., Álvarez-Docio, C.M., del Campo, A., Fernández, J.F. Enhancement of UV absorption behavior in ZnO–TiO2 composites. Bol. Soc. Esp. Cerám. Vidr., 2016, 55 (2), 55-62. [CrossRef]
- Borrás, M.C., Sluyter, R., Barker, P.J., Konstantinov, K., Bakand, S. Y2O3 decorated TiO2 nanoparticles: Enhanced UV attenuation and suppressed photocatalytic activity with promise for cosmetic and sunscreen applications. J. Photochem. Photobiol. B, 2020, 207,111883. [CrossRef]
- Kong, L., Barber, T., Aldinger, J., Bowman, L., Leonard, S., Zhao, J., Ding, M. ROS generation is involved in titanium dioxide nanoparticle-induced AP-1 activation through p38 MAPK and ERK pathways in JB6 cells. Environ Toxicol. 2022, 37(2), 237-244. [CrossRef]
- Wang, Q., Yang, Y., Li, P., Dong, R., Sun, C., Song, G., Wang, Y. Titanium dioxide nanoparticles induce apoptosis through ROS-Ca2+-p38/AKT/mTOR pathway in TM4 cells. J. Appl. Toxicol. 2024, 44(6), 818-832. [CrossRef]
- Hongbo, M., Brennan, A., Diamond, S. A. Photocatalytic reactive oxygen species production and phototoxicity of titanium dioxide nanoparticles are dependent on the solar ultraviolet radiation spectrum. Environmental Toxicology and Chemistry, 2012, 31(9), 2099–2107.
- Dréno, B., Alexis, A., Chuberre, B., Marinovich, M. Safety of titanium dioxide nanoparticles in cosmetics. J. Eur. Acad. Dermatol. Venereol. 2019, 33 (7), 34-46. [CrossRef]
- Larese Filon, F., Mauro, M., Adami, G., Bovenzi, M., Crosera, M. Nanoparticles skin absorption: New aspects for a safety profile evaluation. Regul Toxicol Pharmacol. 2015, 72(2), 310-22. [CrossRef]
- SCCS (Scientific Committee on Consumer Safety), Opinion on Titanium dioxide (TiO2), preliminary version of 7 August 2020, final version of 6 October 2020, SCCS/1617/20. https://health.ec.europa.eu/system/files/2021-11/sccs_o_238.pdf.
- Sanches, P.L., Geaquinto, L.R.O., Cruz, R., Schuck, D.C., Lorencini, M., Granjeiro, J.M., Ribeiro, A.R.L. Toxicity Evaluation of TiO2 Nanoparticles on the 3D Skin Model: A Systematic Review. Front. Bioeng. Biotechnol. 2020, 8, 575. [CrossRef]
- Xuan, L., Ju, Z., Skonieczna, M., Zhou, P.K., Huang, R. Nanoparticles-induced potential toxicity on human health: Applications, toxicity mechanisms, and evaluation models. MedComm. 2020, 4(4), e327. [CrossRef]
- Commission Regulation (EU) 2022/63 of 14 January 2022 amending Annexes II and III to Regulation (EC) No 1333/2008 of the European Parliament and of the Council as regards the food additive titanium dioxide (E 171).
- Pokharkar, V., Chandak, S., Pawar, R., Khandke, A. The implications of the EU ban on titanium dioxide: A comprehensive review of safety concerns and alternatives. Ann. Pharm. Fr. 2024, 15, S0003-4509(24)00167-6. [CrossRef]
- Mitjans, M., Marics, L., Bilbao, M., Maddaleno, A.S., Piñero, J.J., Vinardell, M.P. Size Matters? A Comprehensive In Vitro Study of the Impact of Particle Size on the Toxicity of ZnO. Nanomaterials. 2023, 13, 1800. [CrossRef]
- Park, S., Park, J.K. Back to basics: the coagulation pathway. Blood Res. 2024, 59(1), 35. [CrossRef]
- Guadagnini, R., Halamoda Kenzaoui, B., Walker, L., Pojana, G., Magdolenova, Z., Bilanicova, D., Saunders, M., Juillerat-Jeanneret, L., Marcomini, A., Huk, A., Dusinska, M., Fjellsbø, L.M., Marano, F., Boland, S. Toxicity screenings of nanomaterials: challenges due to interference with assay processes and components of classic in vitro tests. Nanotoxicology. 2015, 9(1), 13-24. [CrossRef]
- OECD. OECD Test No. 432: In vitro 3T3 NRU Phototoxicity Test. OECD Guidelines for the Testing of Chemicals, 2019, Section 4. OECD Publishing, Paris. [CrossRef]
- Martínez, V., Galbiati, V., Corsini, E., Martin-Venegas, R., Vinardell, M.P., Mitjans, M. Establishment of an in vitro photoassay using THP-1 cells and IL-8 to discriminate photoirritants from photoallergens. Toxicology in Vitro. 2013, 27, 1920-1927. [CrossRef]
- Singh, N.P., McCoy, M.T., Tice, R.R., Schneider, E.L. A Simple Technique for quantitation of low levels of DNA damage in individual cells. Exp Cell Res. 1988, 175, 184–191. [CrossRef]
- Krishan, A., Dandekar, P.D. DAPI Fluorescence in Nuclei Isolated from Tumors. J. Histochem. Cytochem. 2005, 53 (8), 1033–1036. [CrossRef]
- Natarajan, V., Wilson, C.L., Hayward, S.L., Kidambi, S. Titanium Dioxide Nanoparticles Trigger Loss of Function and Perturbation of Mitochondrial Dynamics in Primary Hepatocytes. PLOS ONE. 2015, 10(8), e0134541. [CrossRef]
- Leroux, M.M., Doumandji, Z., Chézeau, L., Gaté, L., Nahle, S., Hocquel, R., Zhernovkov, V., Migot, S., Ghanbaja, J., Bonnet, C., Schneider, R.R., Rihn, B.H., Ferrari, L., Joubert, O. Toxicity of TiO2 Nanoparticles: Validation of Alternative Models. Int. J. Mol. Sci. 2020, 21, 4855. [CrossRef]
- Carrillo-Romero, J., Mentxaka, G., García-Salvador, A., Katsumiti, A., Carregal-Romero, S., Goñi-de-Cerio, F. Assessing the Toxicity of Metal- and Carbon-Based Nanomaterials In Vitro: Impact on Respiratory, Intestinal, Skin, and Immune Cell Lines. Int. J. Mol. Sci. 2024, 25(20), 10910. [CrossRef]
- Niska, K., Muszyńska, B., Kowalski, S., Tomaszewska, E., Narajczyk, M., Pawłowska, M., Majewski, P.W., Augustin, E., Inkielewicz-Stepniak, I. Cytotoxicity of ZnO nanoparticles in human melanocyte cells in the presence or absence of UV radiation: A preliminary comparative study with TiO2 nanoparticles. Toxicol In Vitro. 2025, 106, 106051. [CrossRef]
- Fornaguera, C., Calderó, G., Mitjans, M., Vinardell, M.P., Solans, C., Vauthier, C. Interactions of PLGA nanoparticles with blood components: protein adsorption, coagulation, activation of the complement system and hemolysis studies. Nanoscale. 2015, 7(14), 6045-58. [CrossRef]
- Murugadoss, S., Brassinne, F., Sebaihi, N., Petry, J., Cokic, S.M., Van Landuyt, K.L., Godderis, L., Mast, J., Lison, D., Hoet, P.H., van den Brule, S. Agglomeration of titanium dioxide nanoparticles increases toxicological responses in vitro and in vivo. Part. Fibre Toxicol. 2020, 17, 10. [CrossRef]
- Allouni, Z. E., Gjerdet, N. R., Cimpan, M. R. i Høl, P. J. The effect of blood protein adsorption on cellular uptake of anatase TiO2 nanoparticles. Int. J. Nanomedicine. 2015, 10, 687-695. [CrossRef]
- https://www.malvernpanalytical.com/en/learn/knowledge-center/insights/polydispersity-what-does-it-mean-for-dls-and-chromatography. 9/10/2024.
- Preedia Babu, E., Subastri, A., Suyavaran, A., Premkumar, K., Sujatha, V., Aristatile, B., Alshammari, G.M., Dharuman, V., Thirunavukkarasu, C. Size Dependent Uptake and Hemolytic Effect of Zinc Oxide Nanoparticles on Erythrocytes and Biomedical Potential of ZnO-Ferulic acid Conjugates. Sci. Rep. 2017, 7, 4203. [CrossRef]
- Yedgar, S., Barshtein, G., Gural, A. Hemolytic Activity of Nanoparticles as a Marker of Their Hemocompatibility. Micromachines (Basel). 2022, 13(12), 2091. [CrossRef]
- Lozano-Fernández, T., Dobrovolskaia, M., Camacho, T., González-Fernández, A., Simón-Vázquez, R. Interference of Metal Oxide Nanoparticles with Coagulation Cascade and Interaction with Blood Components. Part. Part. Syst. Charact. 2019, 36, 1800547. [CrossRef]
- Huang, H.H., Chen, Z.H., Nguyen, D.T., Tseng, C.M., Chen, C.S., Chang, J.H. Blood Coagulation on Titanium Dioxide Films with Various Crystal Structures on Titanium Implant Surfaces. Cells. 2022, 11(17), 2623. [CrossRef]
- Kushida, T., Saha, K., Subramani, C., Nandwana, V., Rotello, V.M. Effect of nano-scale curvature on the intrinsic blood coagulation system. Nanoscale. 2014, 6(23), 14484-7. [CrossRef]
- Ilinskaya, A.N., Dobrovolskaia, M.A. Nanoparticles and the blood coagulation system. Part II: safety concerns. Nanomedicine (Lond). 2013, 8(6), 969-81. [CrossRef]
- Martínez-Gutierrez, F. , Thi, E.P., Silverman, J.M., de Oliveira, C.C., Svensson, S.L., Vanden Hoek, A., Sánchez, E.M., Reiner, N.E., Gaynor, E.C., Pryzdial, E.L., Conway, E.M., Orrantia, E., Ruiz, F., Av-Gay, Y., Bach, H. Antibacterial activity, inflammatory response, coagulation and cytotoxicity effects of silver nanoparticles. Nanomedicine. 2012, 8(3), 328-36. [CrossRef]
- Soddu, L., Trinh, D.N., Dunne, E., Kenny, D., Bernardini, G., Kokalari, I., Marucco, A., Monopoli, M.P., Fenoglio, I. Identification of physicochemical properties that modulate nanoparticle aggregation in blood. Beilstein J. Nanotechnol. 2020, 11, 550-567. [CrossRef]
- Fu, W., Liu, M., Wang, Y., Yang, H., Ye, A., Wu, J., Li, Y., Yu, Z., Qiu, Y., Xu, L. Nano titanium dioxide induces HaCaT cell pyroptosis via regulating the NLRP3/caspase-1/GSDMD pathway. Toxicol Lett. 2024, 402, 27-37. [CrossRef]
- Horie, M., Sugino, S., Kato, H., Tabei, Y., Nakamura, A., Yoshida, Y. Does photocatalytic activity of TiO2 nanoparticles correspond to photo-cytotoxicity? Cellular uptake of TiO2 nanoparticles is important in their photo-cytotoxicity. Toxicol. Mech. Methods. 2016, 26(4), 284-94. [CrossRef]
- Yin, J.J., Liu, J., Ehrenshaft, M., Roberts, J.E., Fu, P.P., Mason, R.P., Zhao, B. Phototoxicity of nano titanium dioxides in HaCaT keratinocytes--generation of reactive oxygen species and cell damage. Toxicol. Appl. Pharmacol. 2012, 263(1), 81-8. [CrossRef]
- Xiong, S., George, S., Ji, Z., Lin, S., Yu, H., Damoiseaux, R., France, B., Ng, K.W., Loo, S.C. Size of TiO2 nanoparticles influences their phototoxicity: an in vitro investigation. Arch. Toxicol. 2013, 87(1), 99-109. [CrossRef]
- Kim, I.Y., Lee, T.G., Reipa, V., Heo, M.B. Titanium Dioxide Induces Apoptosis under UVA Irradiation via the Generation of Lysosomal Membrane Permeabilization-Dependent Reactive Oxygen Species in HaCat Cells. Nanomaterials. 2021, 11(8), 1943. [CrossRef]
- Park, Y.H., Jeong, S.H., Yi, S.M., Choi, B.H., Kim, Y.R., Kim, I.K., Kim, M.K., Son, S.W. Analysis for the potential of polystyrene and TiO2 nanoparticles to induce skin irritation, phototoxicity, and sensitization. Toxicol. In Vitro. 2011, 25(8),1863-9. [CrossRef]
- Tang, Y., Cai, R., Cao, D., Kong, X., Lu, Y. Photocatalytic production of hydroxyl radicals by commercial TiO2 nanoparticles and phototoxic hazard identification. Toxicology. 2018, 406-407, 1-8. [CrossRef]
- Carriere, M., Arnal, M.E., Douki, T. TiO2 genotoxicity: An update of the results published over the last six years. Mutat. Res. Genet. Toxicol. Environ. Mutagen. 2020, 854-855, 503198. [CrossRef]
- Charles, S., Jomini, S., Fessard, V., Bigorgne-Vizade, E., Rousselle, C., Michel, C. Assessment of the in vitro genotoxicity of TiO2 nanoparticles in a regulatory context. Nanotoxicology. 2018, 12(4), 357-374. [CrossRef]
- Fenoglio, I., Ponti, J., Alloa, E., Ghiazza, M., Corazzari, I., Capomaccio, R., Rembges, D., Oliaro-Bosso, S., Rossi, F. Singlet oxygen plays a key role in the toxicity and DNA damage caused by nanometric TiO2 in human keratinocytes. Nanoscale. 2013, 5(14), 6567-76. [CrossRef]
- Rashid, M.M., Forte Tavčer, P., Tomšič, B. Influence of Titanium Dioxide Nanoparticles on Human Health and the Environment. Nanomaterials. 2021, 11, 2354. [CrossRef]
- Johnston, H.J., Hutchison, G.R., Christensen, F.M., Peters, S., Hankin, S., Stone, V. Identification of the mechanisms that drive the toxicity of TiO2 particulates: the contribution of physicochemical characteristics. Part. Fibre. Toxicol. 2009, 6, 33. [CrossRef]
Figure 1.
Aspect of commercial TiO2 nanoparticles in distilled water when observed at TEM. The sample, consisting in one drop deposited and dried on a Holey Carbon-Cu grid, was observed and analyzed with a JEOL JEM LaB6-2100 microscope at CCiT UB. Scale bars show micrographs magnification.
Figure 1.
Aspect of commercial TiO2 nanoparticles in distilled water when observed at TEM. The sample, consisting in one drop deposited and dried on a Holey Carbon-Cu grid, was observed and analyzed with a JEOL JEM LaB6-2100 microscope at CCiT UB. Scale bars show micrographs magnification.
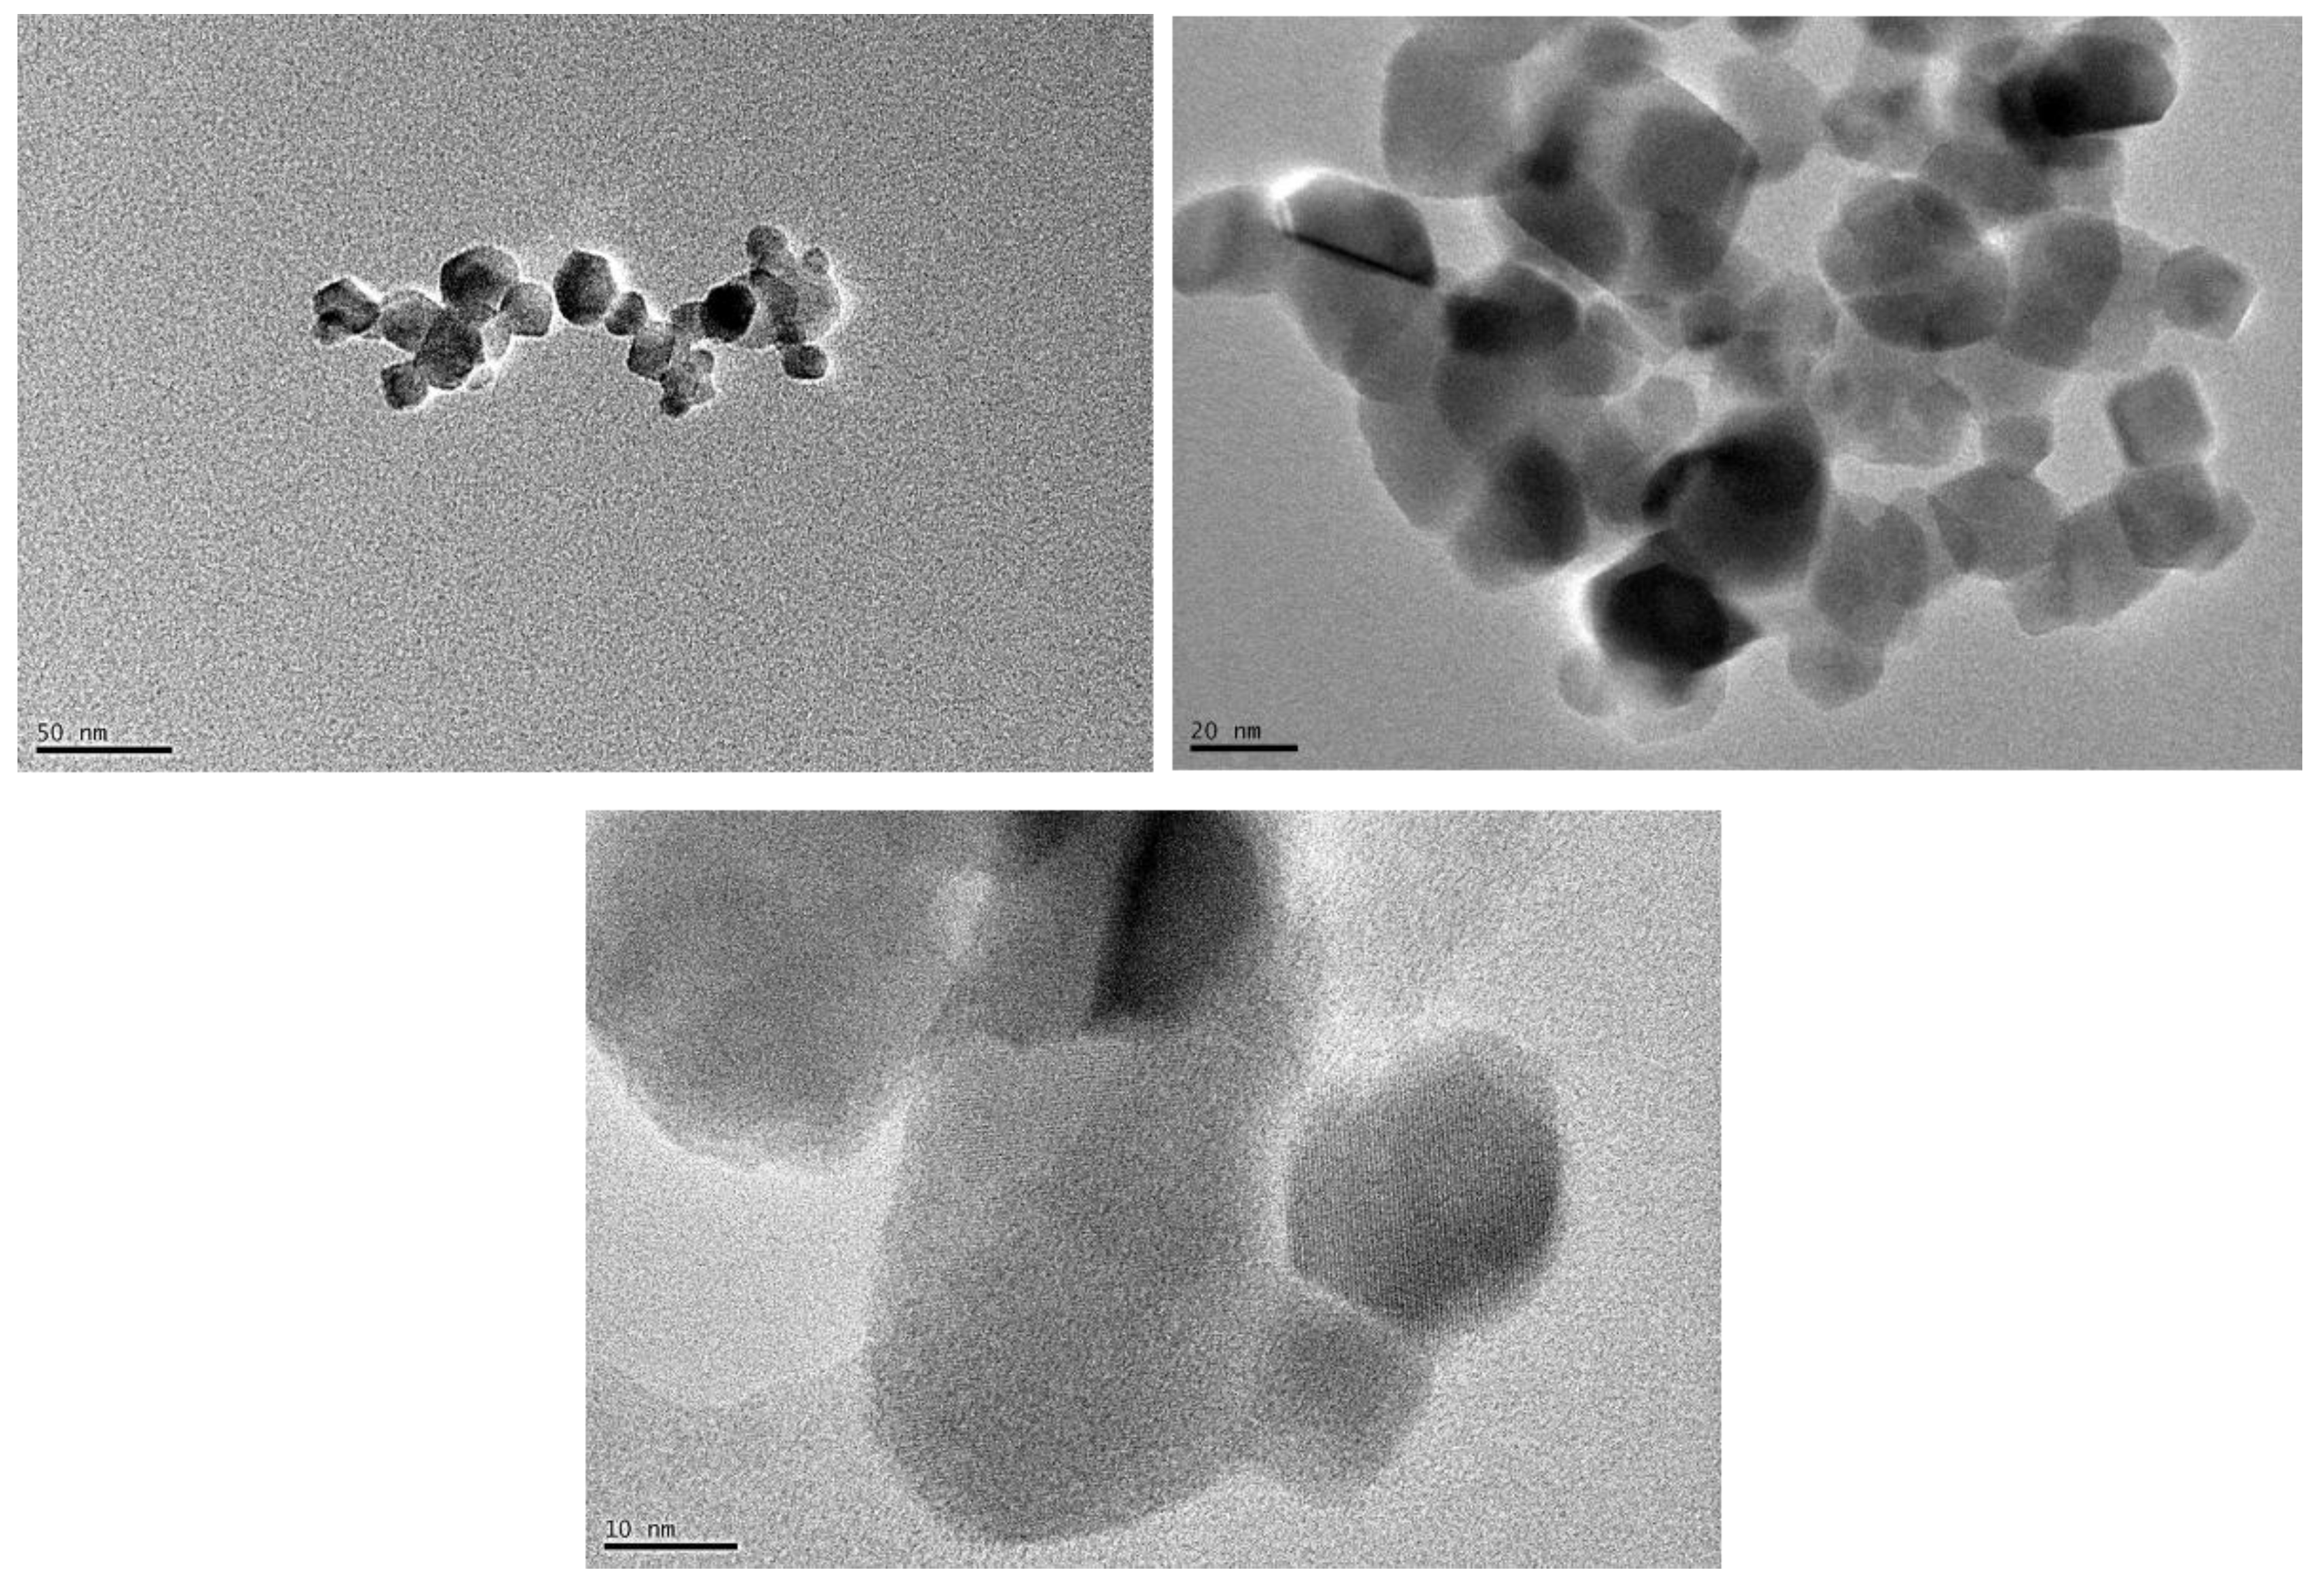
Figure 2.
Hemolyitic activity of TiO2 nano and microparticles after 24 hours of incubation at romm temperature and dark conditions. Results are expressed as mean ± SEM of three independent assays. Positive control consisted in red blood cells incubated with distilled water at the same conditions as samples with the metal oxide. Statistical differences were assessed by a one-way ANOVA followed by a Student’s t test to assess the effect of particle size (#p< 0.05 and ##p<0.01).
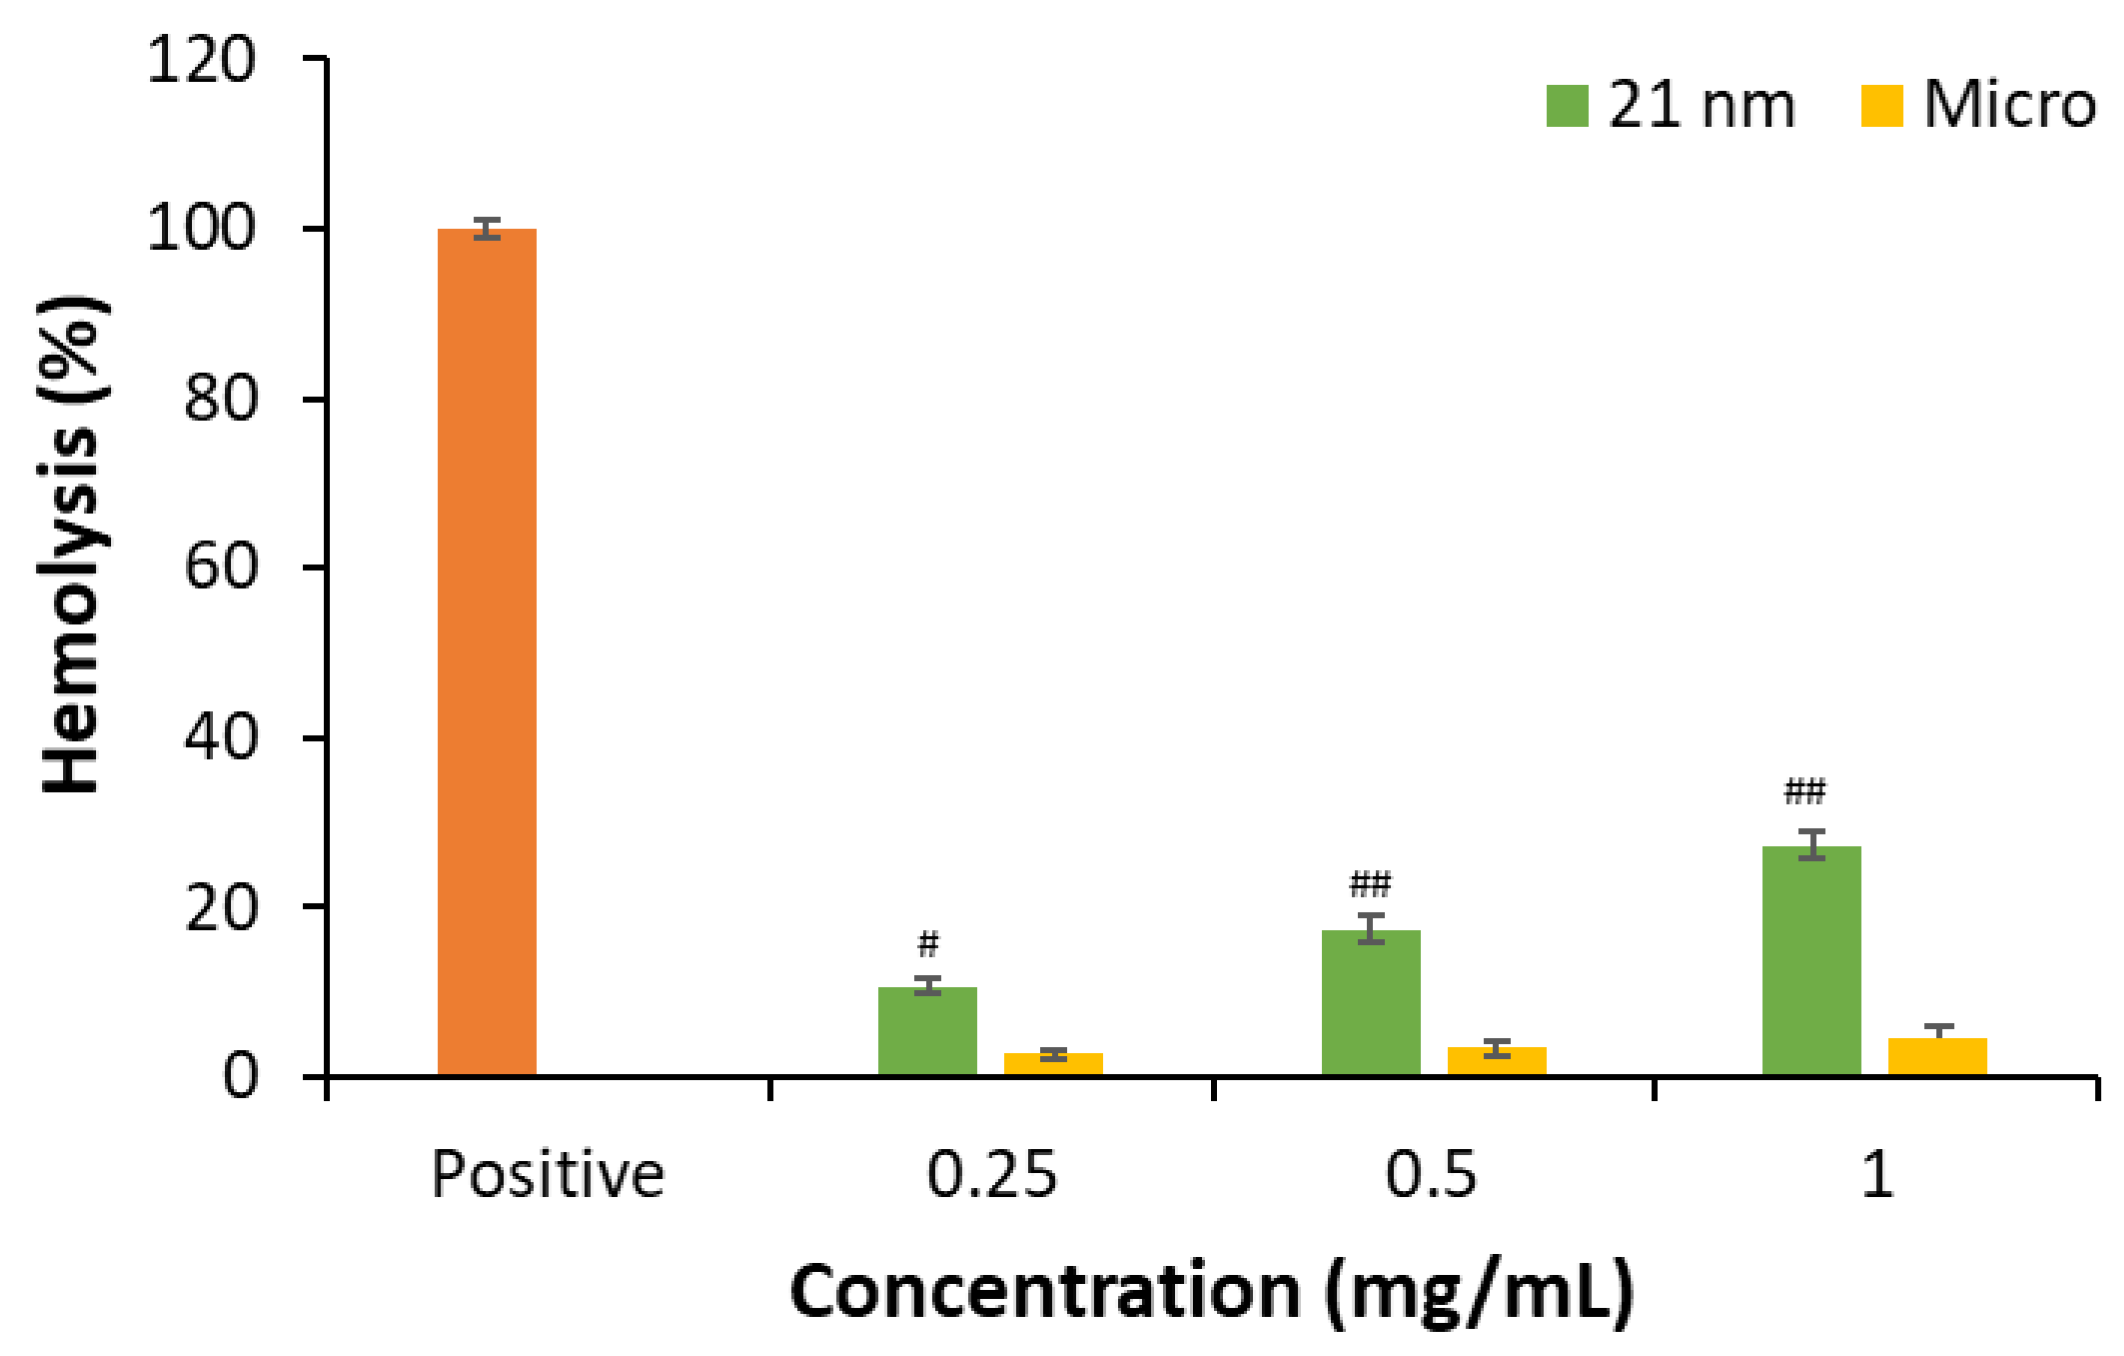
Figure 3.
Influence of TiO2 21 nm nanoparticles and microparticles on extrinsic and intrinsic coagulation pathway measured as prothrombin time (PT) and activated partial thromboplastin time (aPTT). Results are expressed as mean ± SEM of three independent assays. Statistical differences on coagulation time respect to control was assessed by a two-way ANOVA followed by a Bonferroni post-hoc test. Differences are shown by *p< 0.05 and **p<0.01.
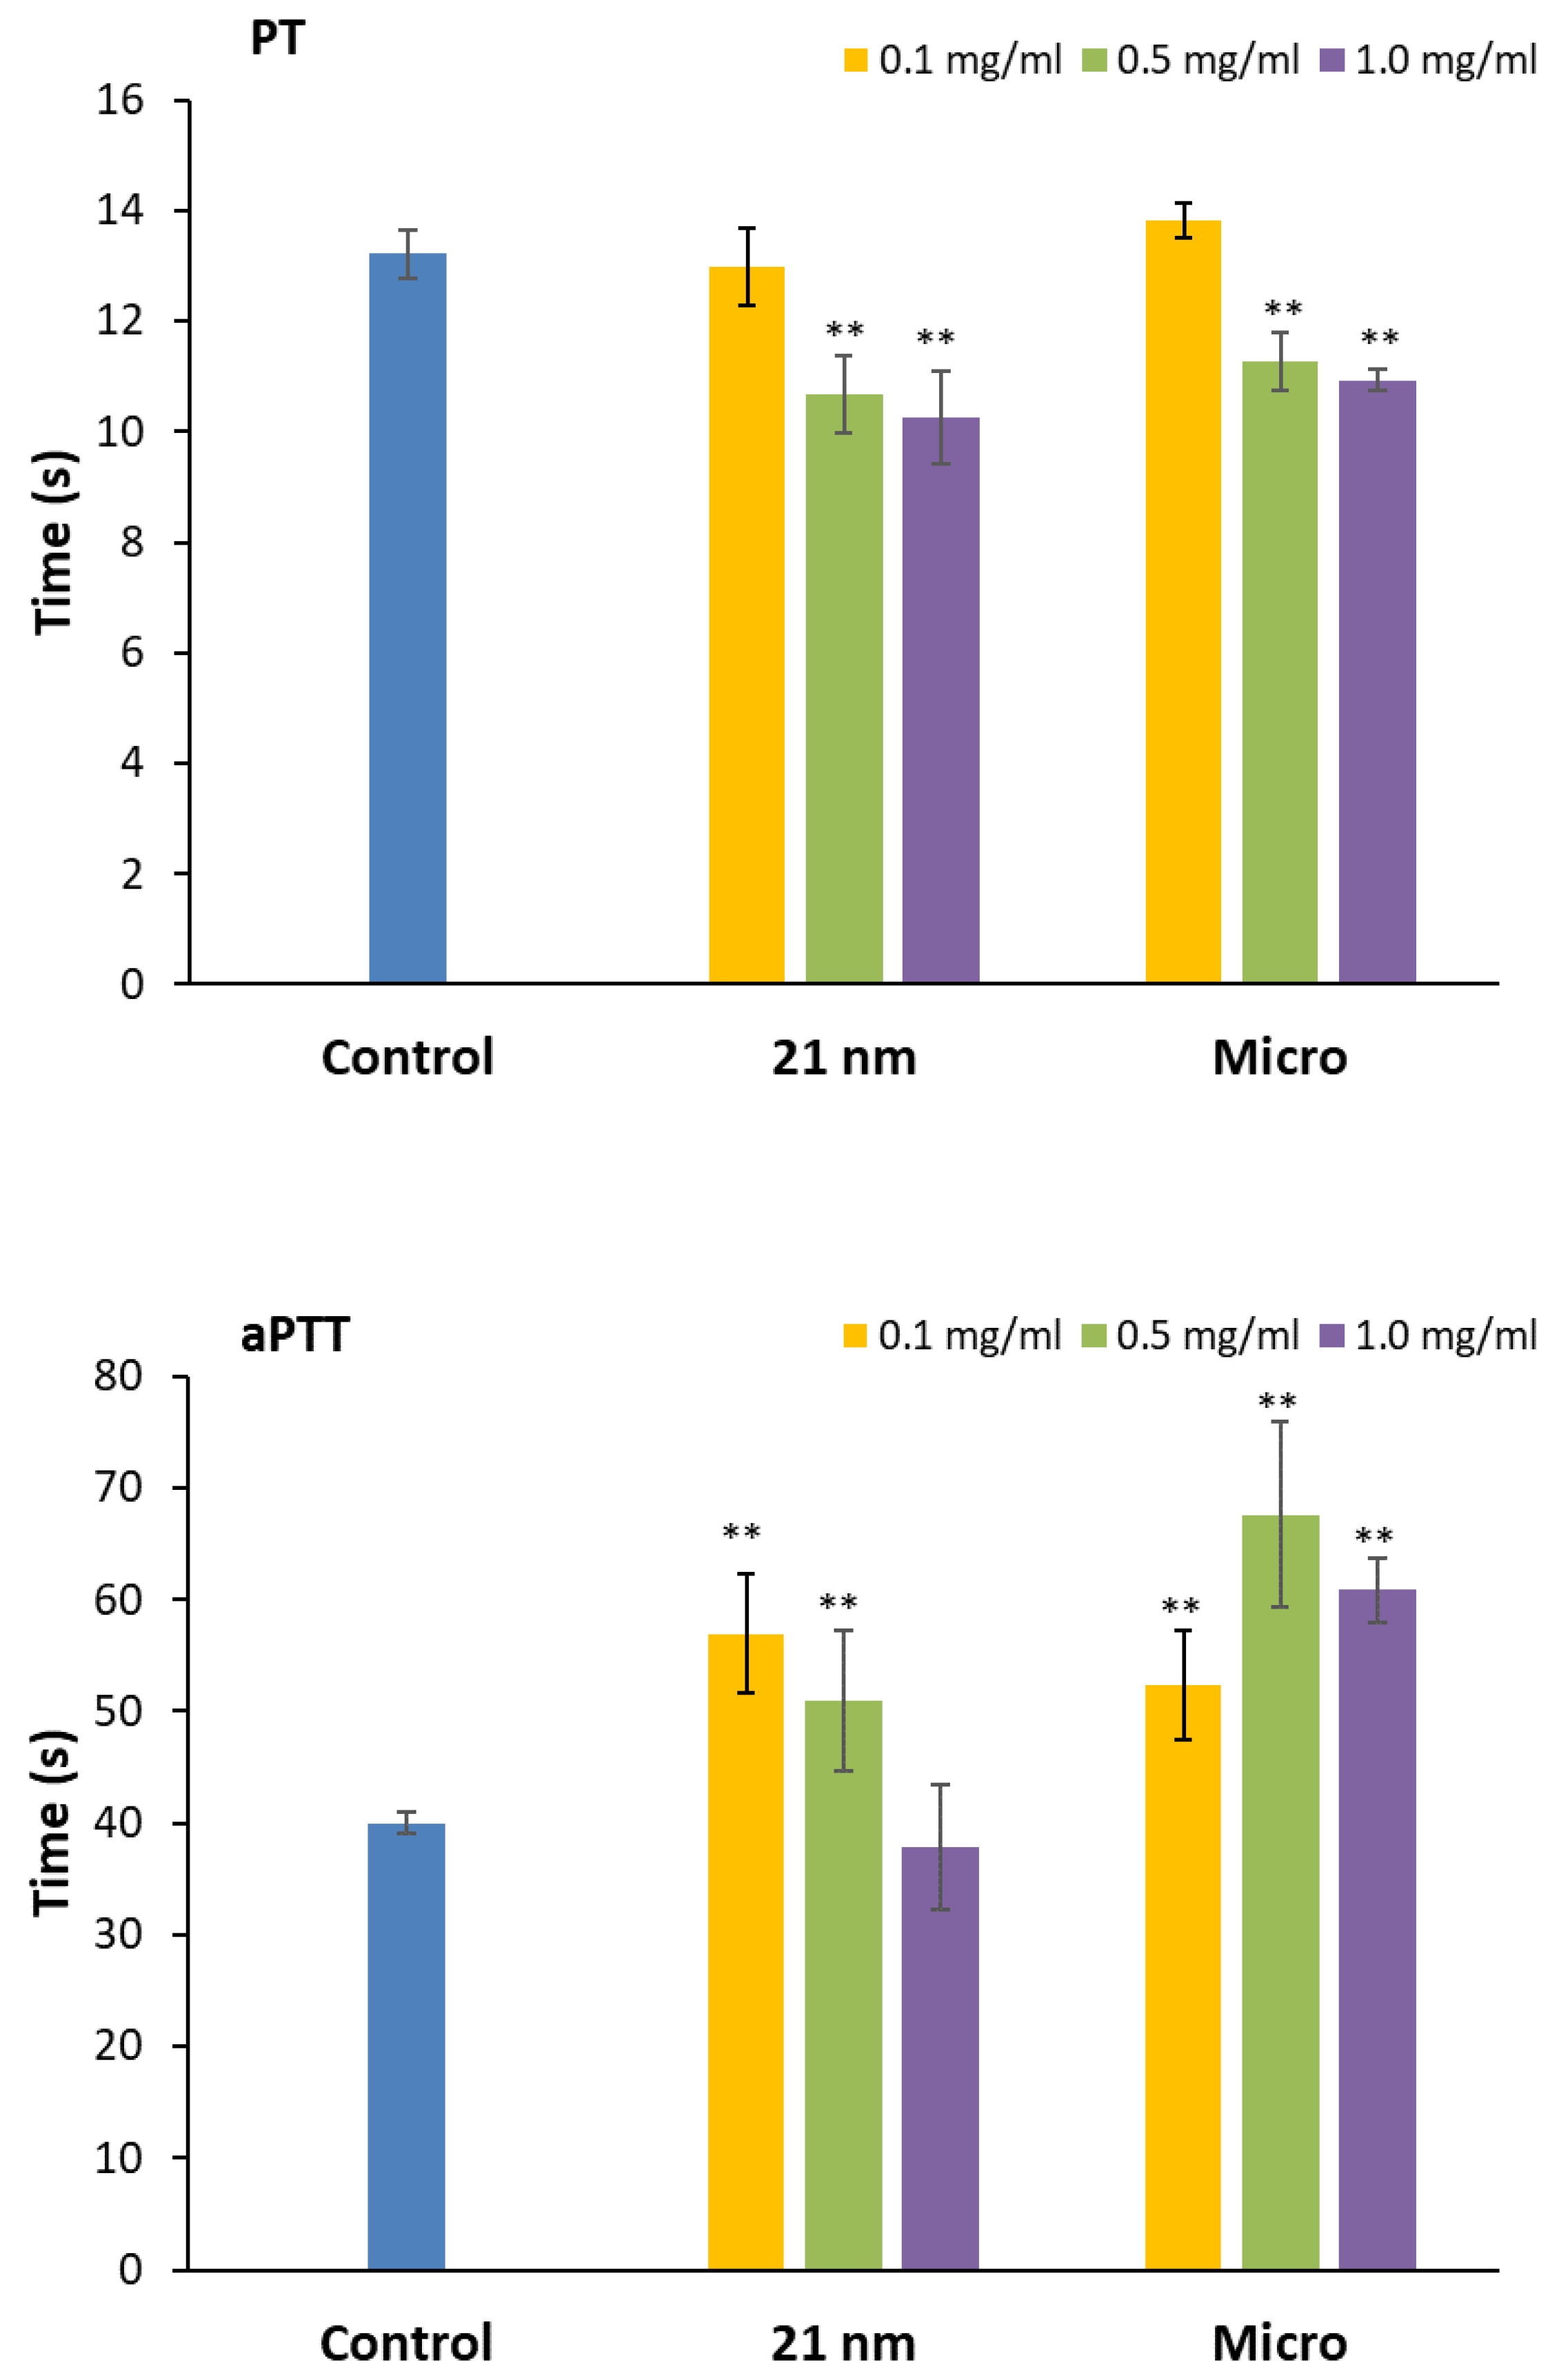
Figure 4.
Cell viability obtained by the MTT, NRU and LDH assays after 24 hours incubation with TiO2 21 nm or micro-sized particles. Cell viability is expressed as the percentage of viable cells relative to untreated HaCaT cells (100%). Results are expressed as mean ± SEM of at least three independent assays. Statistical differences were assessed by a one-way ANOVA followed by a Dunnett post-hoc test to determine the effect of different concentrations (*p< 0.05 and **p<0.01) or Student’s t test to assess the effect of particle size (#p< 0.05 and ##p<0.01).
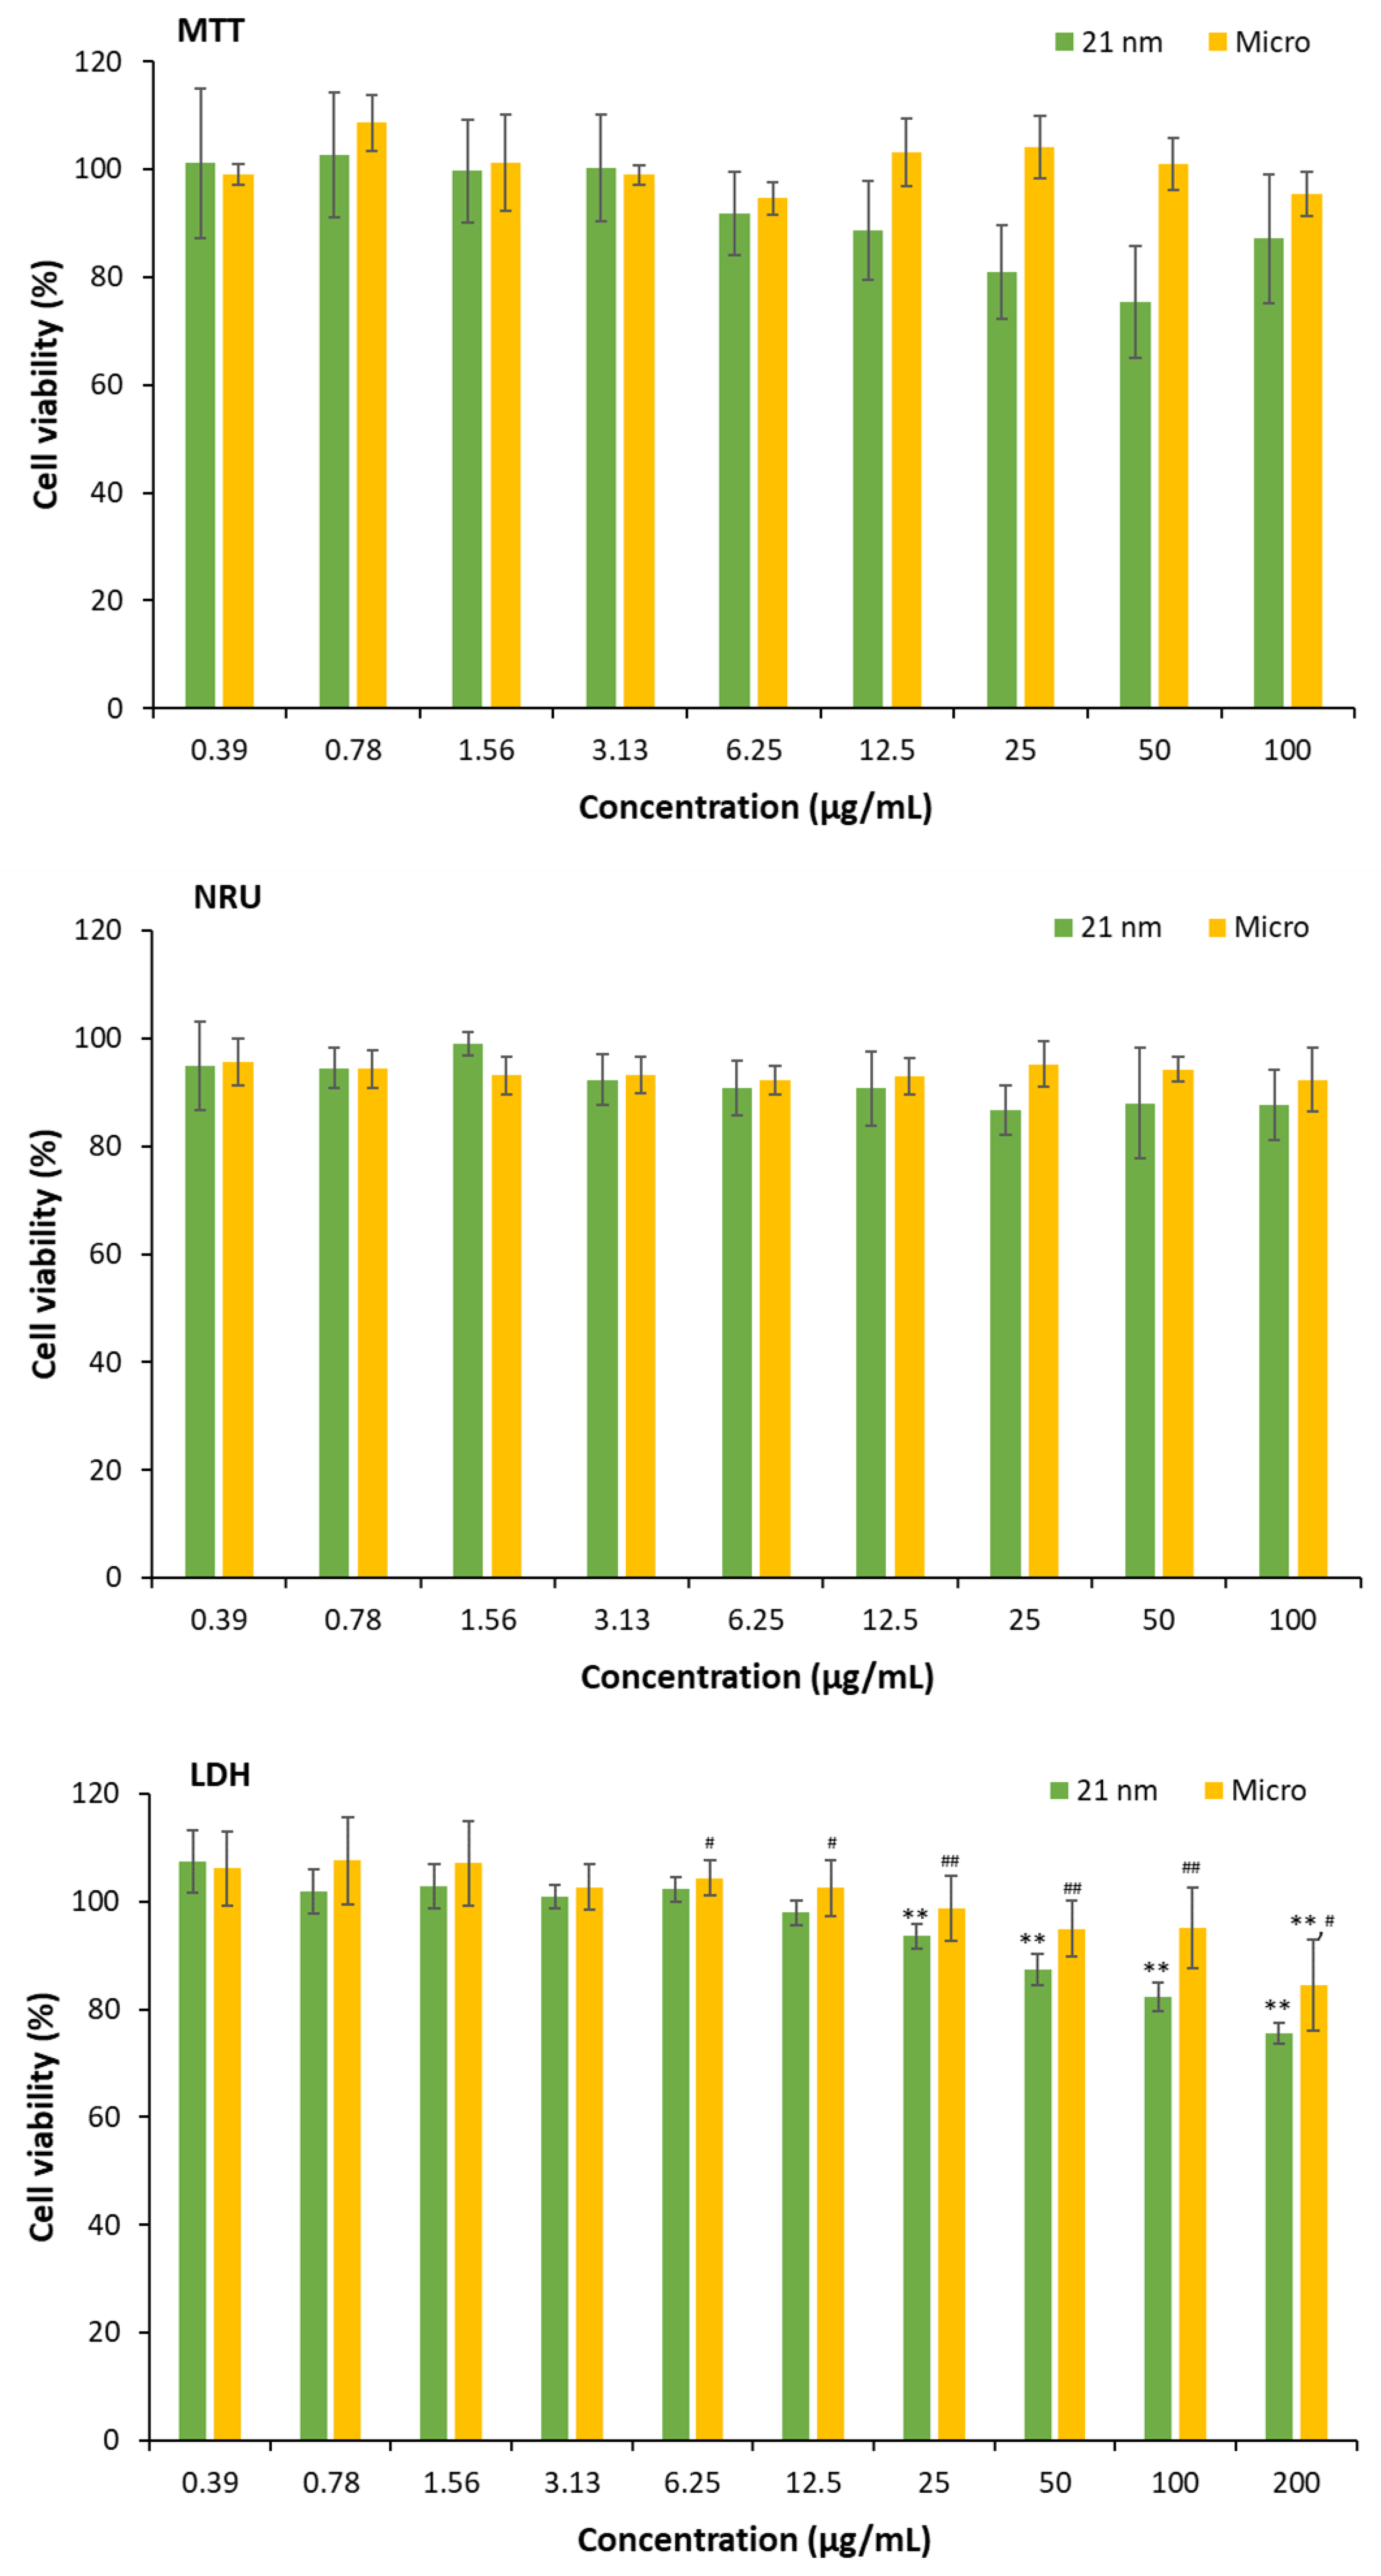
Figure 5.
Phototoxicity of TiO2 nano and micro-sized particles evaluated by the MTT (circle) and NRU (triangle) assays after 24 hours of being exposed at 4 J/cm2 of UVA (orange) or maintained in dark conditions (blue). Cell viability is expressed as the percentage of viable cells relative to untreated HaCaT cells. Results are expressed as mean ± SEM for at least three independent assays. Statistical differences were assessed by a two-way ANOVA followed by a Dunnett post-hoc test to determine the effect of different concentrations (*p< 0.05 and **p<0.01) or Student’s t test to assess the effect of irradiation (#p< 0.05 and ##p<0.01). IC50 (half-maximal inhibitory concentration) was calculated by the best correlation between independent and dependent variables (R2) only in the case of UVA conditions.
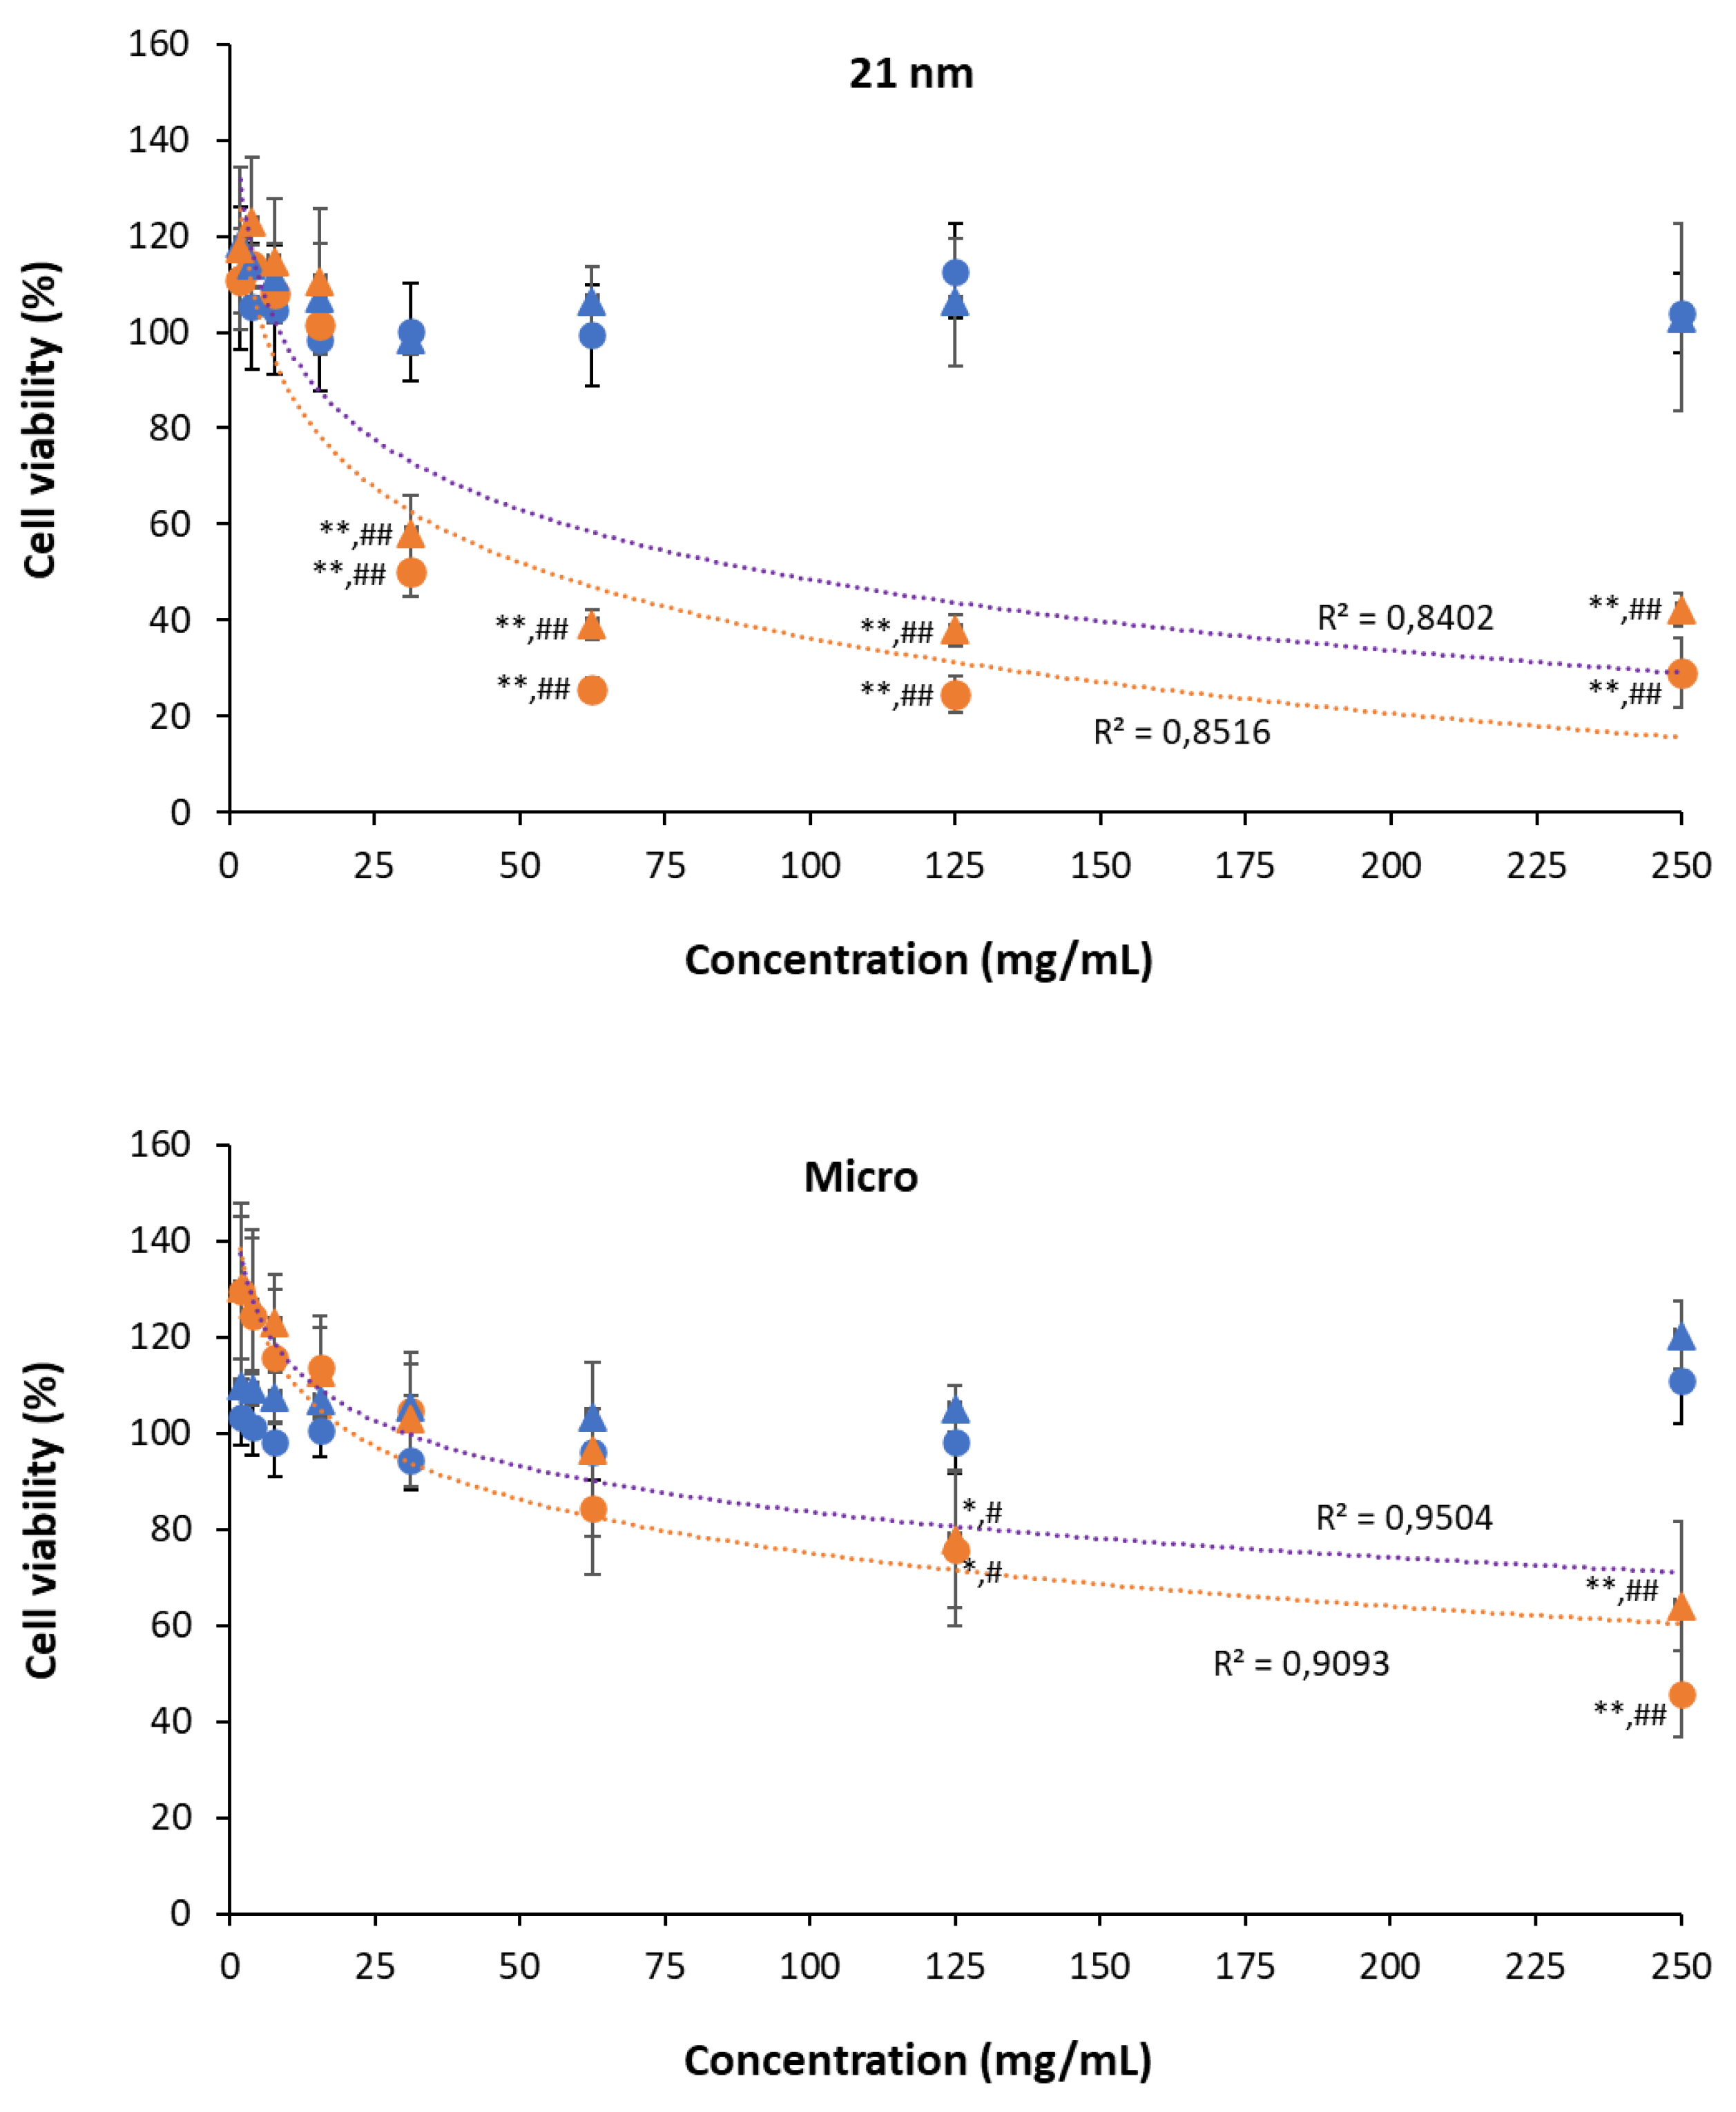
Figure 6.
Genotoxicity of TiO2 nano and micro-sized particles in HaCat cells determined by the comet assay during 24h exposure. Data represents the mean percentatge of tail intensity (A) and tail moment (B) of three independent experiments (50 cells/concentration). Error bars represent standard errors of the mean (SEM). Statistical differences were assessed by a two-way ANOVA followed by Student’s t-test. Significant differences between conditions and controls were set at *p < .05 and **p < .01.
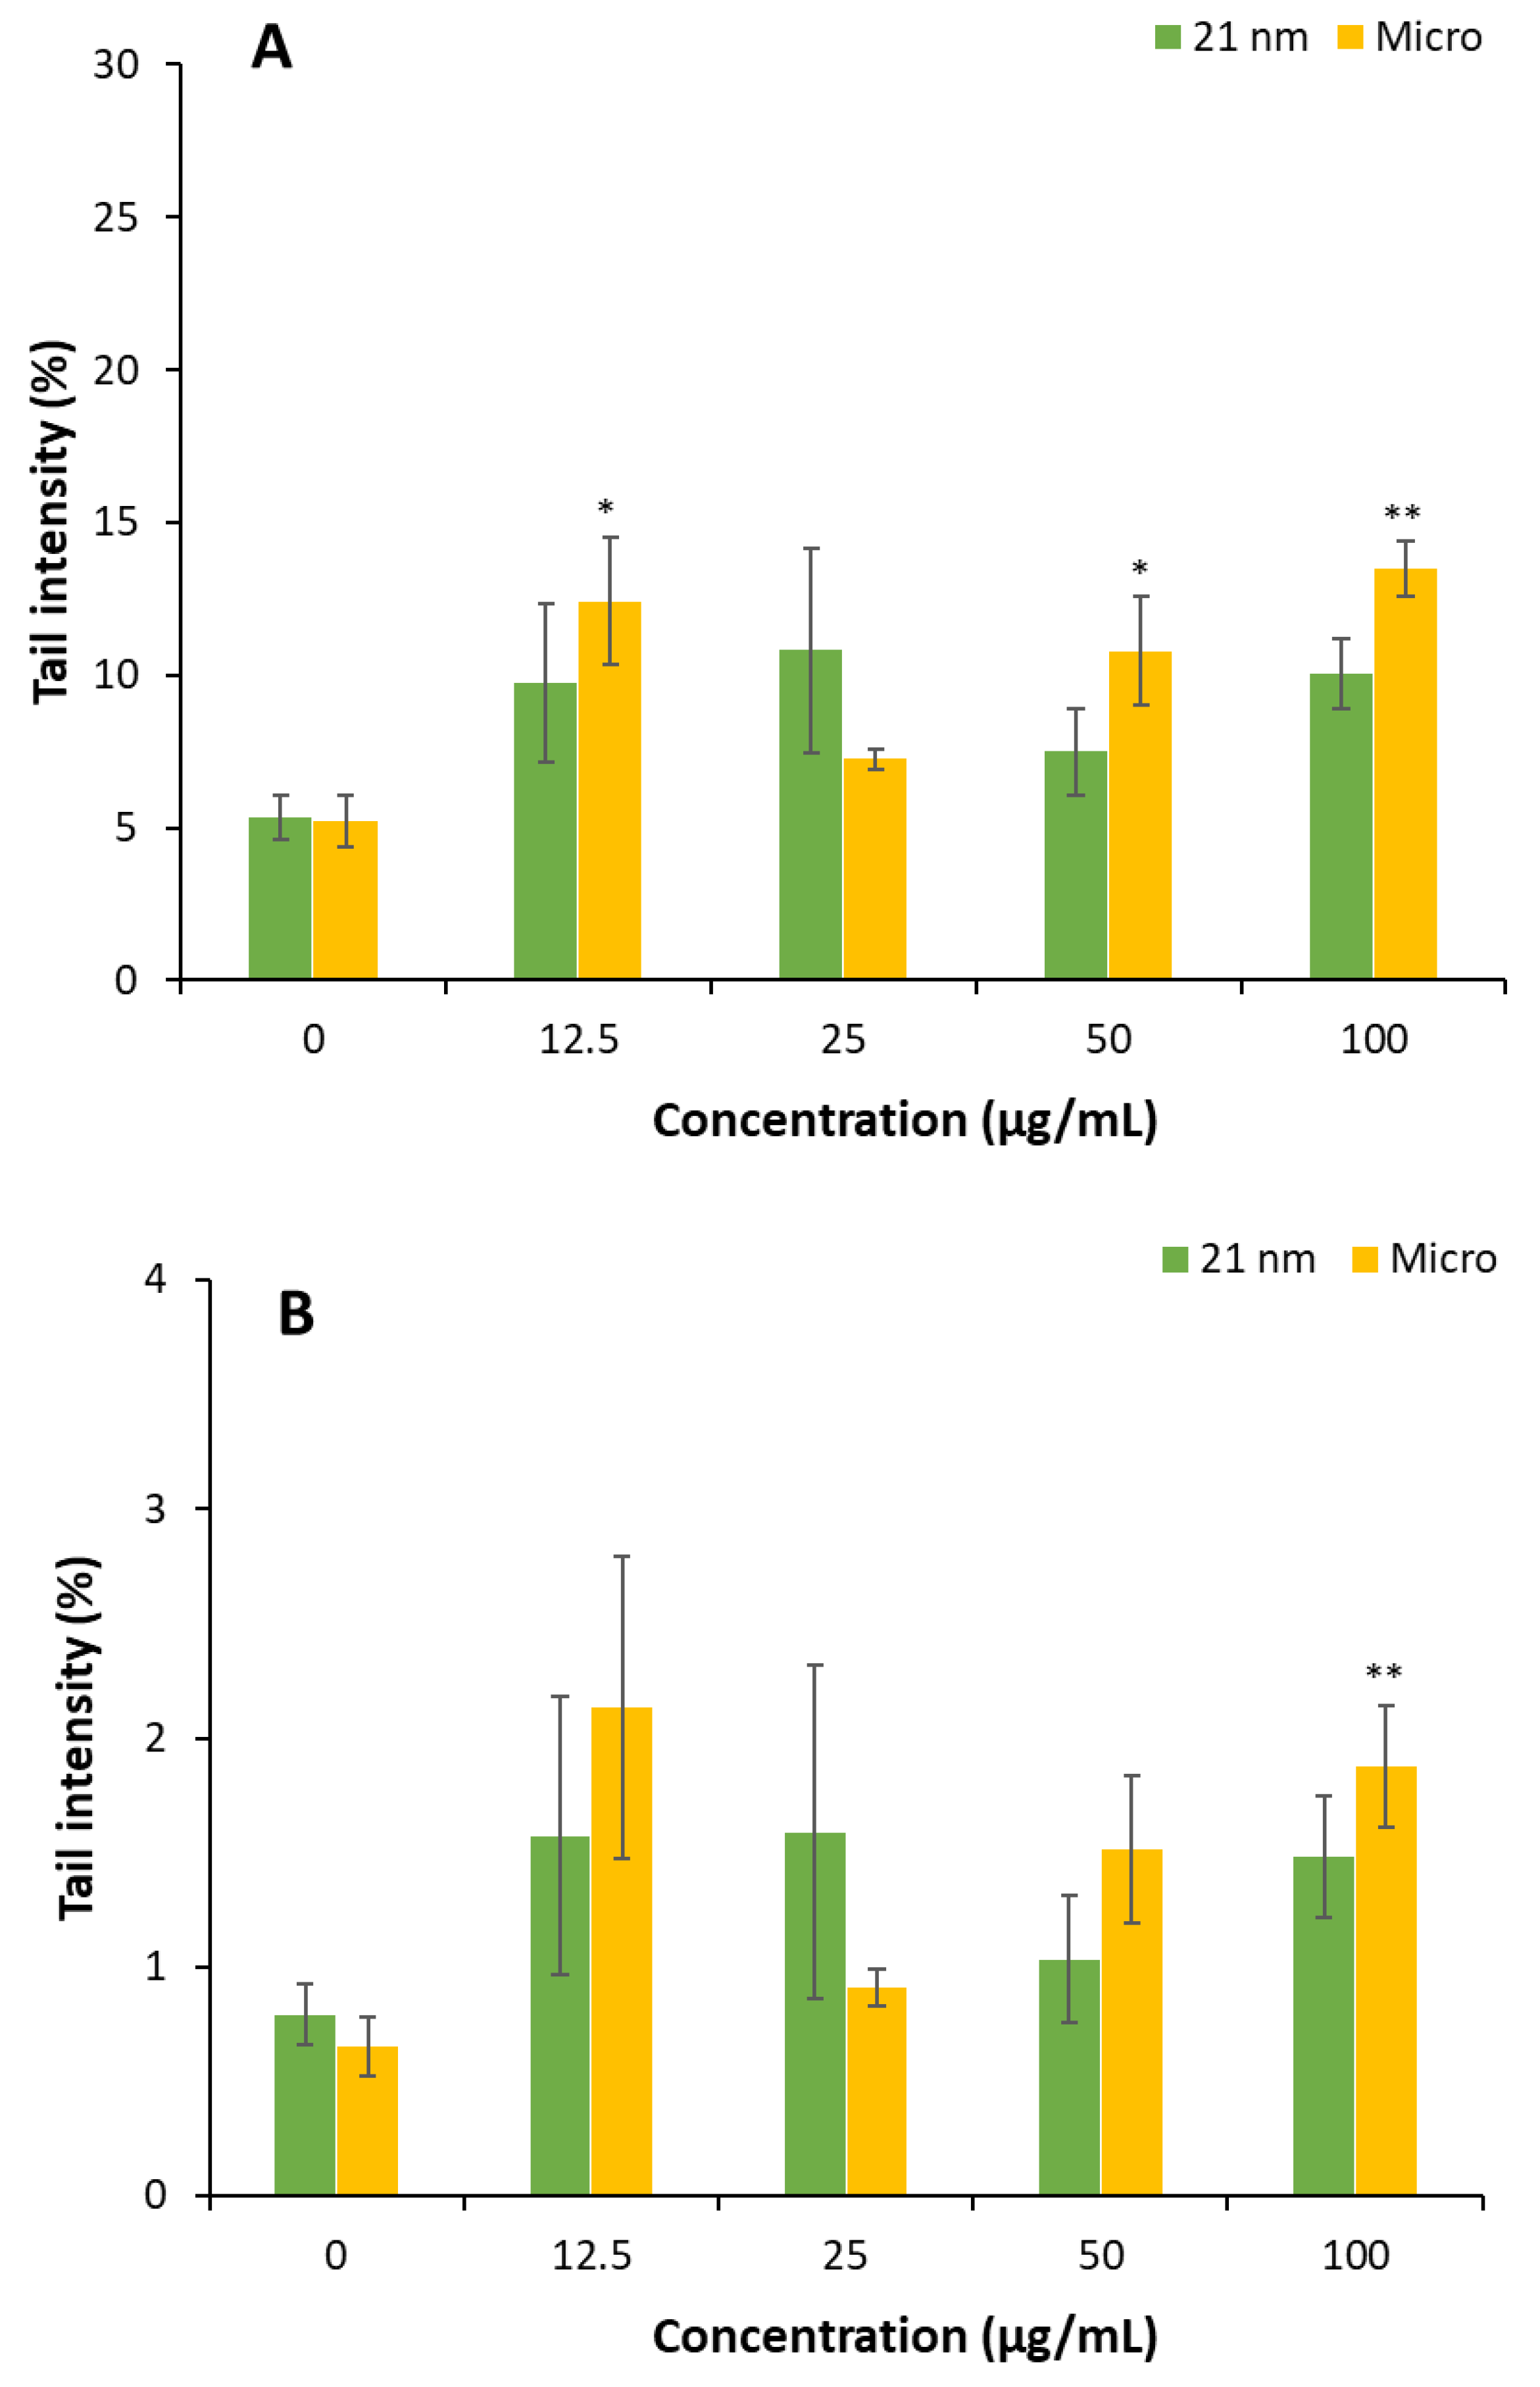

Table 1.
Hydrodynamic diameter (nm) of TiO2 particles after incubation in different media for 2 h and 24 h.
Table 1.
Hydrodynamic diameter (nm) of TiO2 particles after incubation in different media for 2 h and 24 h.
| Particle Size | Incubation Time | PBS* | PBS + BSA* | PBS + Fib* | DMEM* |
|---|---|---|---|---|---|
| 21 nm | 2 hours | 458.0 ± 6.0 | 362.8 ± 16.4 | 403. 5 ± 33.8 | 311.4 ± 7.2¥ |
| 24 hours | 485.4 ± 15.1 | 348.1 ± 6.6¥¥ | 404.7 ± 57.1 | 288.2 ± 17.2¥¥ | |
| Micro | 2 hours | 478.5 ± 20.5 | 236.3 ± 20.6¥¥ | 402.5 ± 16.18 | 280.6 ± 12.4¥¥ |
| 24 hours | 606.3 ± 11.4$$ | 158.8± 10.9¥¥, $$ | 428.4 ± 5.1¥¥ | 280.0 ± 2.9¥¥ |
* Results are expressed as mean ± standard error of the mean (SEM) of 3 independent experiments. Nanoparticles (1.0 mg/mL) were incubated in phosphate-buffered saline (PBS, pH 7.4), in PBS containing 2 mg/mL of albumin (PBS + BSA) or fibrinogen (PBS + Fib), or in DMEM with 5% FBS for 2 and 24 hours at 37°C. To compare the effect of media on hydrodynamic diameter, a two-way ANOVA analysis was performed followed by a Bonferroni post-hoc test to compare with PBS and ($p< 0.05 and $$p< 0.01) Student’s t test to evaluate the effect of time in each condition (¥p<0.05 and ¥¥ p<0.01).
Table 2.
Photo-irritation-Factor (PIF*) obtained for TiO2 particles by MTT and NRU assay.
| Particle Size | MTT | NRU |
|---|---|---|
| 21 nm | 4.6 ± 0.5 | 3.0 ± 0.5 |
| Micro | 1.3 ± 0.3 | 1.3 ± 0.3 |
* Results are expressed as mean ± standard error of the mean (SEM) of at least 3 independent experiments.
Disclaimer/Publisher’s Note: The statements, opinions and data contained in all publications are solely those of the individual author(s) and contributor(s) and not of MDPI and/or the editor(s). MDPI and/or the editor(s) disclaim responsibility for any injury to people or property resulting from any ideas, methods, instructions or products referred to in the content. |
© 2025 by the authors. Licensee MDPI, Basel, Switzerland. This article is an open access article distributed under the terms and conditions of the Creative Commons Attribution (CC BY) license (http://creativecommons.org/licenses/by/4.0/).
Copyright: This open access article is published under a Creative Commons CC BY 4.0 license, which permit the free download, distribution, and reuse, provided that the author and preprint are cited in any reuse.


