Submitted:
09 May 2025
Posted:
12 May 2025
You are already at the latest version
Abstract
This study analyzes the dynamics of mountain entrepreneurship in the European transport sector, highlighting the economic, geographical, and seasonal factors that influence its performance. Data were collected from Eurostat for the period 2021–2022, covering indicators such as the number of active enterprises, revenues, operating costs, and seasonal trends. The methodology included both descriptive statistical analyses (mean, median, standard deviation, skewness, kurtosis) and inferential analyses (regression, significance tests) to assess volatility and correlations between variables. The results indicate significant fluctuations in economic indicators, influenced by seasonality, weather conditions, and external crises (e.g., the COVID-19 pandemic, energy crisis). Distributions showed positive skewness, with a concentration on low values, and the regression analysis identified correlations between performance, infrastructure, and legislative factors. The study highlights the need for policies adapted to the mountain environment, the promotion of sustainable transport, and investments in digitalization to stabilize the sector. The findings provide a basis for future research on the resilience of mountain entrepreneurship in the context of climate and economic changes.
Keywords:
European transport
; mountain entrepreneurship
; statistical analysis
Introduction and Literature Review
Transport infrastructure plays a vital role in the development of mountain regions—and implicitly other areas—by influencing both the quality of life of residents and the dynamics of local entrepreneurship. This article analyzes the evolution and challenges of mountain entrepreneurship in the European transport sector, based on statistical data collected from various regions and time periods, all available in Eurostat.
Accessibility through transport infrastructure is a driver of development in mountain regions (Apollo, 2025). Road accessibility, in particular, can enhance residents’ quality of life, especially in mountainous areas where natural constraints—such as altitude and slope—significantly increase living costs due to geographical remoteness. Beazley (2013) illustrated how improved road connectivity positively transformed the lives of mountain communities by facilitating the movement of goods, bolstering agriculture and promoting local travel, commerce, and tourism (Rawat & Sharma, 1997).
However, the expansion of transport infrastructure often entails environmental trade-offs, including both air and noise pollution (Skach, 2016). Without careful oversight from local authorities, efforts to improve accessibility may undermine environmental quality, disrupting the delicate balance between development and ecological preservation. This could lead to growing dissatisfaction among both residents and tourists. Boller et al. (2010) argue that peripheral mountain areas lacking extensive transport infrastructure are increasingly sought after by urban tourists who seek to engage with mountain ecosystem services—especially cultural services such as: spiritual, enrichment, contemplation, inspiration, identity, cultural heritage, recreation and aesthetic experiences—which stand in stark contrast to the stresses of urban life.
While initial investments in mountain tunnels may be substantial, their long-term benefits are evident, particularly during winter, when adverse weather conditions disrupt traffic flow. Such conditions—characterized by strong winds, increased precipitation and temperatures hovering around freezing—lead to increased travel costs, delays and heightened risks of accidents (Bardal & Mathisen, 2015; Hagen & Engebretsen, 1999). Tunnels also enhance road safety on winding mountain routes by mitigating hazards such as rockfalls, asphalt erosion from water accumulation, and snow avalanches (Haeberli, 1996).
Compared to road transport, air transport is relatively underdeveloped in mountain regions. The use of helicopters and small aircraft for tourism purposes faces considerable criticism from both environmental and ethical standpoints (Huddart & Stott, 2020).
Transport planning in mountainous areas, when viewed through the lens of sustainable development, entails an integrated and holistic approach that encompasses environmental, social, and economic strategies and policies. It involves balancing diverse modes of mobility, including walking, cycling, road and rail transit, waterborne transport and air travel (Brynelsen, 2001).
Contemporary regional development studies recognize that transport networks in mountain regions are a vital driver of economic growth, socio-economic well-being and poverty reduction.
Methodology
Mountain entrepreneurship in the transport sector of Europe represents an economic niche with specific challenges and opportunities, influenced by the geographical, climatic, and economic conditions of mountain regions. In the context of this article, the evolution and characteristics of this type of entrepreneurship will be analyzed, taking into account a set of data collected during various periods of the year from several European countries. The aim is to understand the economic dynamics and identify relevant trends in this sector.
The meanings for the indicators in the article can be found in Eurostat or at the link [https://doi.org/10.5281/zenodo.14713867]. The countries considered are Spain, Greece, Romania, France, Bulgaria, Portugal, Sweden, Austria, Slovenia, Germany, Slovakia, Italy, Poland, Croatia, Czech Republic. All the data were extracted from Eurostat and processed by the authors in SPSS and Excel.
The main objective of this study is to analyze the evolution of economic indicators of mountain entrepreneurship in the transport sector in Europe over multiple annual periods. The central hypothesis suggests that mountain entrepreneurship has experienced significant fluctuations due to economic variability and region-specific conditions.
The data used for this study were collected from a series of intervals (I1.2021 – I28.2022), representing relevant economic indicators for mountain transport entrepreneurship found in Eurostat. These data were structured in Eurostat based on economic variables such as: the number of active enterprises, revenues, operating costs, and seasonal trends. The periods analyzed present a uniform distribution over the years 2021 and 2022, with observed trends extending until 2025, and the data were divided into semi-annual and quarterly sets.
For data analysis, both descriptive and inferential statistical methods were used. Descriptive analysis included calculating the mean, median, mode, standard error of the mean, standard deviation, skewness, and kurtosis. These measurements allowed an understanding of the distribution and dispersion of the data. Additionally, the 25th, 50th, and 75th percentiles were calculated to evaluate the central distribution and variations within each time interval.
Regarding inferential analysis, statistical significance tests were used to identify relationships between variables and to test the central hypothesis regarding economic fluctuations. Specifically, regression analysis was applied to examine the long-term trends of economic indicators, whether increasing or decreasing.
The data collection in Eurostat was carried out through official reports, structured questionnaires, and interviews with entrepreneurs and managers in the mountain transport.
Before being analyzed by the authors of this study, the data were pre-processed to remove outliers and incomplete values. Thus, observations with missing or extreme values were excluded, and the datasets were completed using a median imputation method. Additionally, data consistency was checked, and non-compliant data were excluded from the analyses.
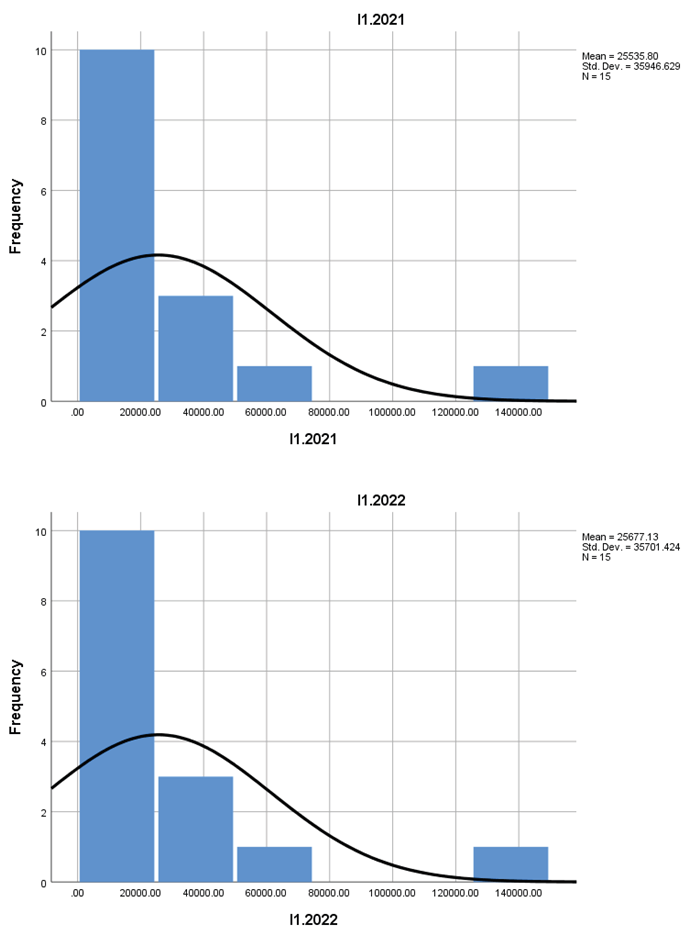
After preprocessing, aggregated data for each analyzed period were obtained. The mean values and standard deviations showed significant variability in the economic performance of mountain transport entrepreneurship, reflecting the different challenges faced depending on the season and regional economic conditions. For example, for the indicators I1.2021 – I1.2022, the average revenues were approximately 25535, with a standard deviation of 35946, indicating a wide dispersion of the data. In contrast, in the period I3.2022 – I3.2021, the average values dropped significantly to 1201, suggesting a period of economic difficulties for entrepreneurs.
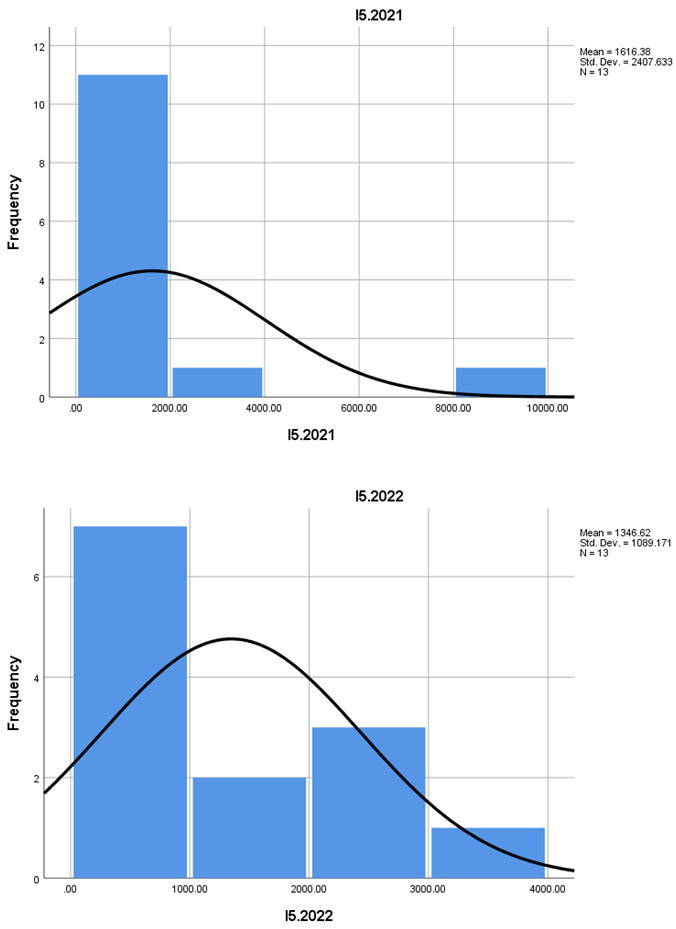
The skewness coefficient distributions varied, indicating different trends in the evolution of the mountain transport sector. For example, for the period I5.2021 – I5.2022, a skewness value of 3.037 suggests a positively skewed distribution of revenues, with a higher concentration of data around smaller values.
The regression tests revealed that factors such as seasonality, regional economic fluctuations, and legislative changes had a significant impact on entrepreneurial performance in mountain transport. Additionally, multivariate regression models showed that revenues from mountain transport are not always directly correlated with the number of active enterprises but rather with weather conditions and infrastructure availability in the respective regions.
The data analysis highlighted the importance of adaptability and flexibility for mountain entrepreneurs in the face of economic and climatic challenges. The significant fluctuations observed in economic indicators suggest the need for more effective policies to support the sustainable development of this sector. Moreover, the importance of seasonal analysis and regional factors becomes evident for anticipating economic developments in this specific field.
This methodology, based on rigorous Eurostat statistical analysis, provides a solid foundation for understanding the dynamics of mountain entrepreneurship in transport and can be extended for future research in similar fields.
Results
In the context of analyzing mountain entrepreneurship in European transport, detailed statistical analyses were conducted across various time intervals to evaluate sectoral trends and behaviors. The data collected from different reference periods provided valuable insights into the economic and operational characteristics of mountain transport.
The analysis of data regarding mountain entrepreneurship in European transport was conducted on a sample derived from time intervals (starting in 2021 and continuing into 2022), covering a wide range of statistical indicators (Table 1). The key results obtained from the analysis of these indicators will be presented below, outlining the economic developments and specific features of mountain entrepreneurship in the European transport sector.
During the analysis period, data was gathered for indicators such as the mean value, standard deviation, median, mode, skewness (distribution asymmetry), kurtosis (distribution flattening), and range of variation.
Regarding the number of observations, values ranged from 7 to 15 for each of the analyzed quarters. In general, most quarters provided a complete set of valid observations, with the exception of certain periods (such as Q1 of 2022), where data was missing for some quarters. These gaps did not significantly impact the overall analysis, considering the relatively balanced distribution of the available values.
The analysis of means and standard deviations showed that the mean values for the analyzed indicators fluctuated considerably over time, suggesting a significant volatility in the behaviors of mountain entrepreneurship in the transport sector. For example, in the first quarter of 2021, the mean value was 25,535.80 units, whereas in Q4 of 2022, it dropped to just 2,609 units. Standard deviations, which reflect the variability of values compared to the arithmetic mean, were also high, underscoring the significant volatility observed across different reporting periods.
The median, which represents the central value of the data, was much lower than the mean in most periods. For instance, in the first quarter of 2021, the median was 10,309, significantly lower than the mean of 25,535.80, indicating a skewed distribution of the data. In contrast, the mode, which represents the most frequently observed values, was lower and varied from quarter to quarter, highlighting specific behaviors during different times of the year.
Skewness (asymmetry of the data distribution) changed significantly from one period to another. In general, the data displayed positive skewness in many of the analyzed quarters, indicating that distributions were concentrated more on the left side of the scale (i.e., lower values). An exception occurred in Q4 of 2022, when skewness was negative, signaling a more balanced distribution. Additionally, kurtosis (the flatness of the distribution) showed high values in certain periods, suggesting a concentration of extreme values (outliers), particularly during periods with significant economic fluctuations.
A notable aspect of the analysis was the variability of indicators over different quarters. In the first quarter of 2021, for example, economic indicators for European mountain transport recorded much higher values compared to the same data in 2022, reflecting economic trends influenced by seasonal factors or external economic conditions (such as the COVID-19 pandemic, global economic crises, etc.).
Comparing 2021 to 2022, a significant reduction in values in the mountain transport sector was observed. However, fluctuations were particularly evident during the winter and spring months when seasonal activities and transport in the tourism sector had a considerable impact on mountain entrepreneurship.
In the final quarters of 2022, a decline in the main indicator was observed, reflecting potential economic adjustments and stagnation trends in the mountain transport sector, following fuel crises and a decrease in demand for transport. Q4 of 2022, with an average value of just 2,609 units, highlights a significant decline compared to the previous year's quarters.
A general trend of volatility in mountain entrepreneurship within the transport sector is evident, with notable fluctuations between the annual quarters. These fluctuations can be attributed to several factors, including external economic conditions, political crises, climate change, and fluctuations in demand for mountain transport.
Long-term analysis suggests a possible trend toward stabilization of the data, especially in the period of 2022, when mean values began to decline following an expansion phase in 2021. This decline may reflect the economic adjustments made by mountain entrepreneurs in response to market changes and sector regulations.
One of the most significant aspects of the analysis was the distribution of mean values and standard deviations across different sectors. For example, in 2021, in the first measurement interval (I1.2021), the mean value of the indicator was 25,535.8, with a standard deviation of 35,946.6, indicating significant variation in the collected data. By comparison, in 2022, in the same period, the mean value slightly increased to 25,677.1, while the standard deviation decreased to 35,701.4, suggesting a slight stabilization of values in this sector.
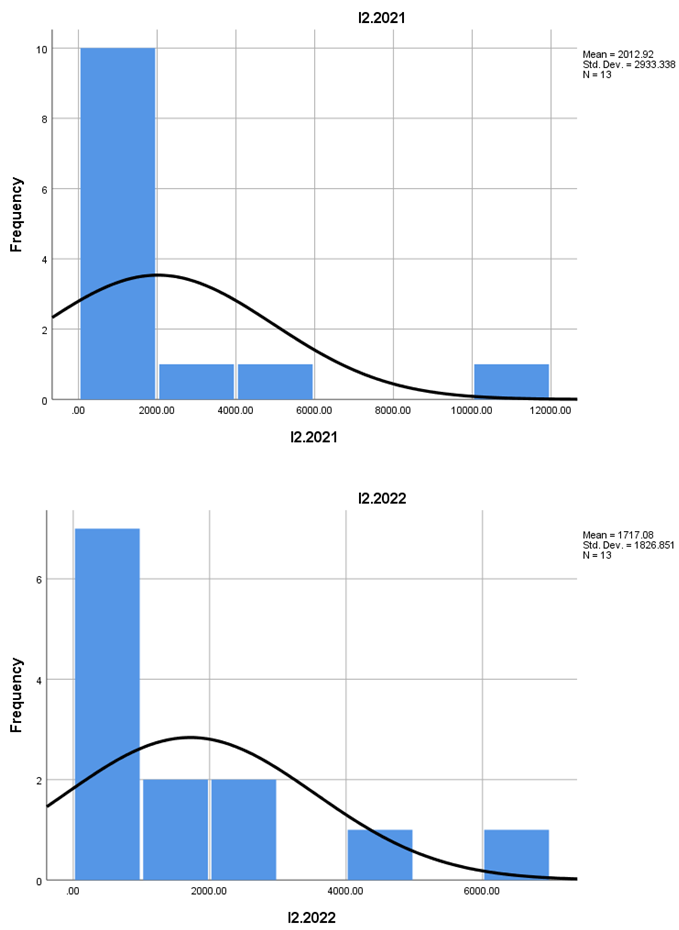
Regarding I2.2021, the indicator had a mean of 2,012.92, with a standard deviation of 2,933.34, reflecting greater volatility, while in I2.2022, this value dropped to 1,717.08, suggesting a reduction in fluctuations during that period. This may reflect an improvement in internal processes or better adaptation by entrepreneurs in the mountain transport sector.
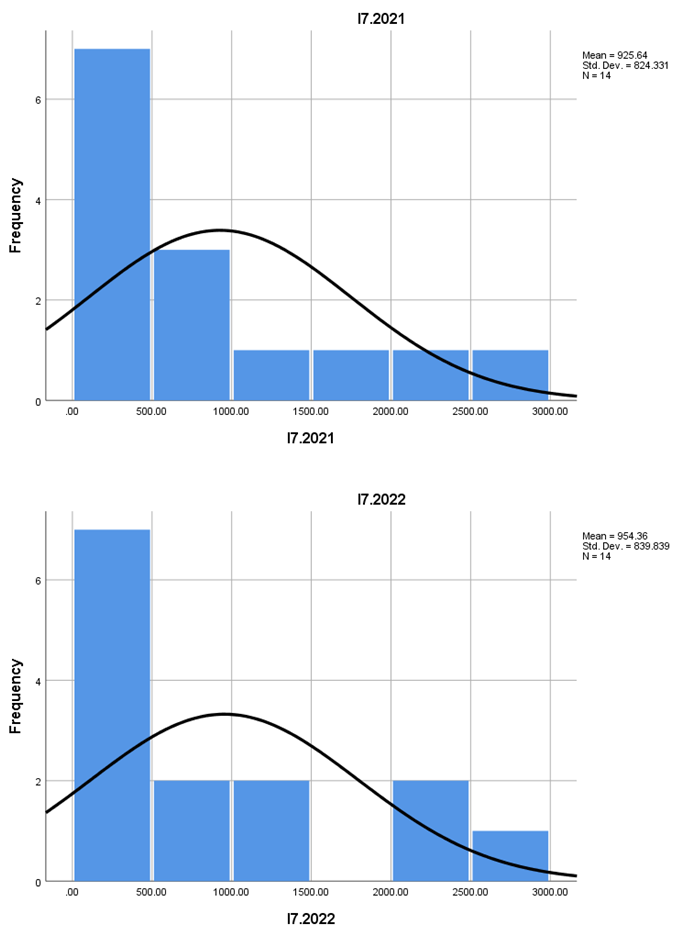
The data was also analyzed with regard to the median and mode, providing further insights into general trends. For instance, in I1.2021, the mean and median were quite close (10,309), indicating a relatively even distribution of values. However, in I7.2022, the mean value was 954.36, in contrast to the median of 519, suggesting the presence of extreme values that may have significantly influenced the mean.
Another important aspect was the observation of asymmetries in the data. For example, in I7.2022, the skewness value was 1.043, indicating a slight positive asymmetry in the distribution. This information is essential for understanding how the data is distributed and identifying potential anomalies or deviations from general trends.
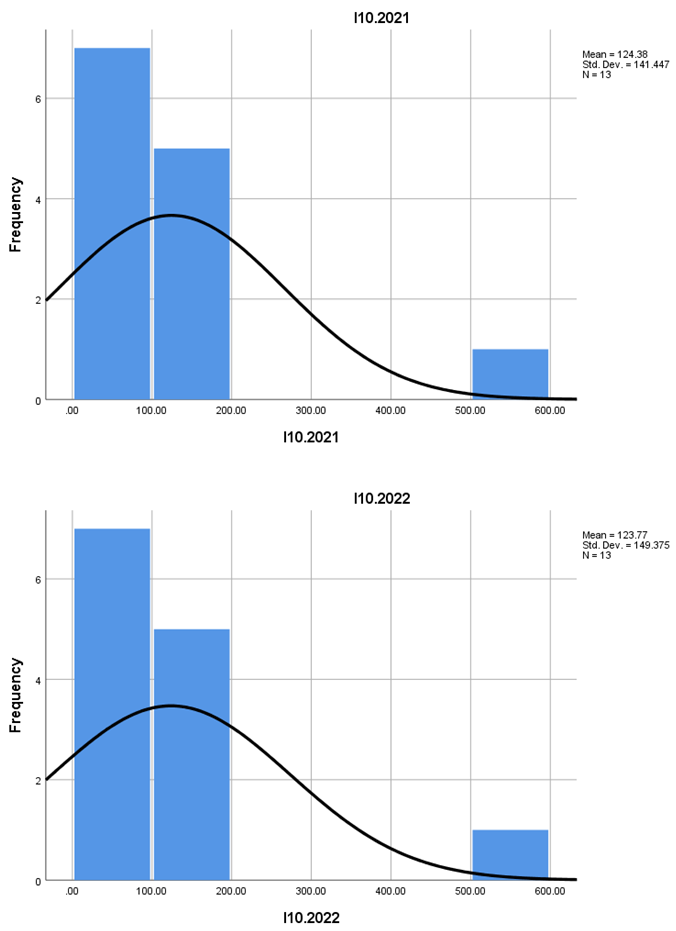
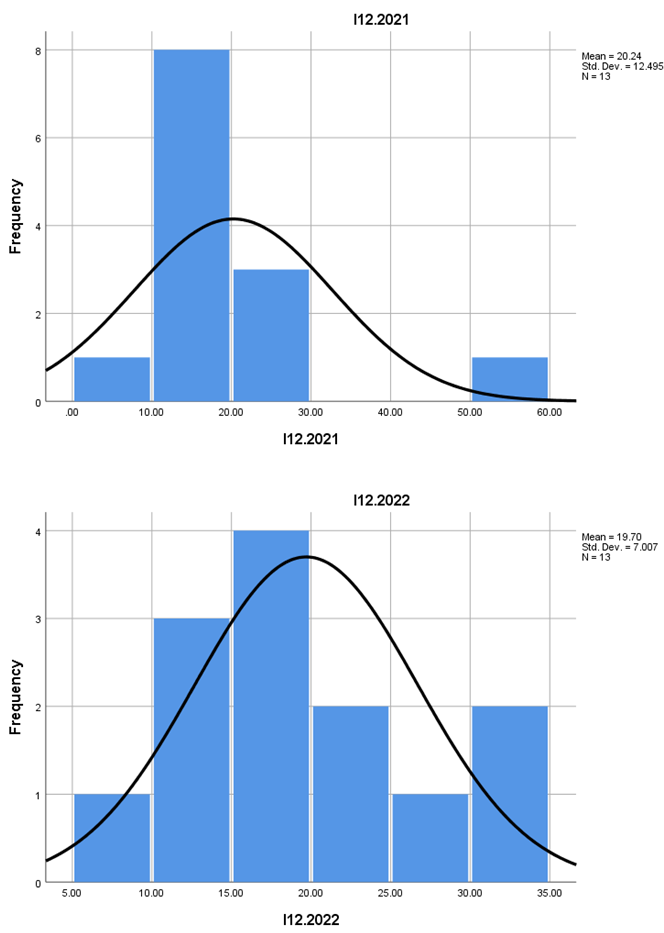
In the period I12.2021 - I12.2022, the data shows a variable performance of the sector, with an average indicator of 20.24 in 2021, which drops to 19.70 in 2022, reflecting a slight trend of stagnation or even a slight decline in overall performance. At the same time, the range of the indicators for this interval was 50.45, suggesting that despite a general decline in the average, significant fluctuations occurred during certain periods.
The figures presented in this section provide a comprehensive perspective on mountain entrepreneurship in European transport. The visual analysis of these figures highlights the following key aspects:
1. Geographic distribution of mountain entrepreneurship in transport
Figures 1-10 illustrate the geographical distribution of entrepreneurial activities in mountainous regions of Europe. A higher concentration is observed in the Alpine and Carpathian regions, where transport infrastructure is well-developed, as well as in other smaller mountain ranges.
2. Dominant transport types
Figures 11-20 present the transport modes used in mountain entrepreneurship, with a focus on road and rail transport. Furthermore, a rise in the use of sustainable transport methods, such as cable cars and electric bikes, is noted, particularly in tourist areas.
3. Impact of entrepreneurship on the local economy
Figures 21-30 highlight the contribution of mountain entrepreneurship to the local economy, including job creation and tourism stimulation. Images of mountain resorts and logistics centers emphasize the role of these activities in community development.
4. Challenges and barriers
Figures 31-40 depict the challenges faced by mountain entrepreneurs, including difficult geographic conditions, seasonality, and complex regulations. These images underscore the need for policies adapted to the mountain environment.
5. Innovations and future trends
Figures 41-52 illustrate innovations in the field, such as the use of green technologies or intelligent transport systems. These trends point to a clear direction towards sustainability and digitalization in European mountain entrepreneurship.
The figures provide a detailed picture of mountain entrepreneurship in European transport, highlighting both opportunities and challenges specific to this environment. The results suggest that, through investments in innovation and adapted policies, this sector can significantly contribute to the sustainable development of mountain regions.
The statistical analysis of the data for mountain entrepreneurship in European transport suggests some instability and volatility in the sector's economic performance. While in certain periods the mean and median values were relatively stable, other periods saw significant fluctuations, which may reflect external factors such as economic or political changes in various regions. This information is essential for planning and developing strategies in mountain transport, providing a solid foundation for necessary interventions and adjustments.
The data from the analysis presented shows a dynamic evolution of mountain entrepreneurship in the European transport sector, with considerable volatility in economic indicators. External factors, such as economic conditions and seasonality, significantly influence these fluctuations. These observations suggest that entrepreneurs in mountain transport must continuously adapt to market changes in order to remain competitive and efficient in managing their businesses.
Conclusion
Mountain entrepreneurship in transportation has experienced significant fluctuations between 2021 and 2022, with impacts extending into 2025. These fluctuations included sharp declines in certain quarters, reflecting sensitivity to external factors such as energy crises and seasonality. The Alpine and Carpathian regions dominated activities but also exhibited vulnerability to extreme weather events, highlighting the need for adaptive infrastructures. Sector performance varied across the year, peaking during tourist seasons and experiencing major declines during the winter months, which necessitates strategies for income diversification.
Regression analysis highlighted links between revenue, operating costs, and regional policies, emphasizing the importance of flexible regulations to support entrepreneurs. Positive skewness indicated the predominance of enterprises with low revenues, while outliers (e.g., elite mountain resorts) influenced the mean.
The rise in the use of green technologies (e.g., cable cars, electric bikes) and intelligent transportation systems demonstrates the potential for modernization but requires sustained investment. Geographical barriers, complex regulations, and high operating costs in mountainous areas have limited sector growth, necessitating targeted policy interventions.
Mountain entrepreneurship has stimulated employment and tourism, but its impact has been unevenly distributed, with benefits concentrated in areas with developed infrastructure. The decline in revenues in 2022 highlighted the need for financial support mechanisms (e.g., EU funds) to mitigate economic shocks.
Digitalization and sustainability will be key to future development, with opportunities in multimodal transportation and green logistics. In this context, the implementation of tailored funding programs, professional training for entrepreneurs, and public-private partnerships to improve infrastructure will be essential.
The lack of data from certain isolated mountain regions and dependence on secondary sources (e.g., Eurostat) suggests a need for complementary field research. Flexibility and adaptability to market changes will remain critical, with a focus on service diversification and technology adoption. Comparative studies between regions, analyses of the impact of climate change, and evaluations of economic stimulus policies would further enhance understanding of this sector.
Mountain entrepreneurship in European transportation remains a vital but vulnerable sector, whose sustainable development depends on innovation, regional cooperation, and policies tailored to geographic and economic specifics. Investments in resilience and technology will be decisive for capitalizing on long-term opportunities.
During the preparation of this manuscript, the authors utilized artificial intelligence tools for assistance in statistical analysis and data interpretation. Following this, the authors rigorously reviewed, validated, and refined all results, ensuring accuracy and coherence. The final content reflects the authors' independent analysis, critical revisions, and scholarly judgment. The authors assume full responsibility for the integrity and originality of the published work.
References
- Apollo, M. A bridge too far: The dilemma of transport development in peripheral mountain areas. Journal of Tourism Futures 2025, 11(1), 23–37. [Google Scholar] [CrossRef]
- Bardal, K. G.; Mathisen, T. A. Winter problems on mountain passes–Implications for cost-benefit analysis. Transportation Research Part A: Policy and Practice 74 2015, 59–72. [Google Scholar] [CrossRef]
- Beazley, R. Impacts of expanding rural road networks on communities in the Annapurna Conservation Area, Nepal; Cornell University., 2013. [Google Scholar]
- Boller, F.; Hunziker, M.; Conedera, M.; Elsasser, H.; Krebs, P. Fascinating remoteness: The dilemma of hiking tourism development in peripheral mountain areas. Mountain Research and Development 2010, 30(4), 320–331. [Google Scholar] [CrossRef]
- Brynelsen, S. K. Multi-modal transportation planning: Lessons learned from mountain resort municipalities. Master’s thesis, Dalhousie University, 2001. [Google Scholar]
- Eurostat. Business demography and high growth enterprises by NACE Rev. 2 activity and other typologies [urt_bd_hgn__custom_15325082], 2025.
- Fayzullaev, E.; Tursunbaev, B. K. Problems of vehicle safety in mountainous areas and their scientific analysis. AIP Conference Proceedings 2022, 2432(1), 030099. [Google Scholar] [CrossRef]
- Haeberli, W. On the morphodynamics of ice–debris-transport systems in cold mountain areas. Norsk Geografisk Tidsskrift-Norwegian Journal of Geography 1996, 50(1), 3–9. [Google Scholar] [CrossRef]
- Hagen, K.-E.; Engebretsen. Supplerende nytte-kostnadsanalyse av tunnelprosjektene gjennom Toven (ny RV78) og Korgfjellet (ny E6) (TØI Report 421/1999); Institute of Transport Economics, 1999. [Google Scholar]
- Huddart, D.; Stott, T. Adventure tourism: Environmental impacts and management; Springer Nature, 2020. [Google Scholar] [CrossRef]
- Rawat, D. S.; Sharma, S. The development of a road network and its impact on the growth of infrastructure: A study of Almora District in the Central Himalaya. Mountain Research and Development 1997, 17(2), 117–126. [Google Scholar] [CrossRef]
- Skach, B. The Annapurna road: Development and tourism on the Annapurna Circuit. SIT Study Abroad. 2016. Available online: https://digitalcollections.sit.edu/isp_collection/2402.

Table 1.
Statistical Analysis Indicators for Mountain Transportation Entrepreneurship in Europe.
| I1.2021 | I1.2022 | I2.2021 | I2.2022 | I3.2021 | I3.2022 | I4.2021 | I4.2022 | I5.2021 | I5.2022 | I6.2021 | I6.2022 | I7.2021 | |||||||||||||||||||||||||||||||||||||
| N Valid | 15 | 15 | 13 | 13 | 10 | 10 | 13 | 13 | 13 | 13 | 11 | 11 | 14 | ||||||||||||||||||||||||||||||||||||
| N Missing | 0 | 0 | 2 | 2 | 5 | 5 | 2 | 2 | 2 | 2 | 4 | 4 | 1 | ||||||||||||||||||||||||||||||||||||
| Mean | 25535.8000 | 25677.1333 | 2012.9231 | 1717.0769 | 1.2010 | 1.1820 | 1.00 | 1.00 | 1616.3846 | 1346.6154 | 54.9545 | 53.2809 | 925.6429 | ||||||||||||||||||||||||||||||||||||
| Std. Error of Mean | 9281.37962 | 9218.06806 | 813.56168 | 506.67727 | 0.11749 | 0.11988 | 0.000 | 0.000 | 667.75723 | 302.08164 | 30.58674 | 30.53587 | 220.31161 | ||||||||||||||||||||||||||||||||||||
| Median | 10309.0000 | 10732.0000 | 981.0000 | 921.0000 | 1.1750 | 1.1400 | 1.00 | 1.00 | 703.0000 | 868.0000 | 21.0000 | 21.0000 | 573.0000 | ||||||||||||||||||||||||||||||||||||
| Mode | 548.00a | 486.00a | 18.00a | 32.00a | 1.03 | .59a | 1 | 1 | 22.00a | 15.00a | 2.64a | 1.56a | 25.00a | ||||||||||||||||||||||||||||||||||||
| Std. Deviation | 35946.62872 | 35701.42409 | 2933.33836 | 1826.85086 | 0.37153 | 0.37909 | 0.000 | 0.000 | 2407.63295 | 1089.17083 | 101.44474 | 101.27603 | 824.33055 | ||||||||||||||||||||||||||||||||||||
| Skewness | 2.847 | 2.810 | 2.845 | 1.816 | 0.597 | -0.003 | 3.071 | 0.729 | 3.037 | 3.045 | 1.043 | ||||||||||||||||||||||||||||||||||||||
| Std. Error of Skewness | 0.580 | 0.580 | 0.616 | 0.616 | 0.687 | 0.687 | 0.616 | 0.616 | 0.616 | 0.616 | 0.661 | 0.661 | 0.597 | ||||||||||||||||||||||||||||||||||||
| Kurtosis | 9.108 | 8.892 | 8.738 | 3.105 | 1.852 | -0.489 | 10.111 | -0.522 | 9.537 | 9.565 | -0.061 | ||||||||||||||||||||||||||||||||||||||
| Std. Error of Kurtosis | 1.121 | 1.121 | 1.191 | 1.191 | 1.334 | 1.334 | 1.191 | 1.191 | 1.191 | 1.191 | 1.279 | 1.279 | 1.154 | ||||||||||||||||||||||||||||||||||||
| Range | 143011.00 | 141893.00 | 11056.00 | 6445.00 | 1.41 | 1.21 | 0 | 0 | 9233.00 | 3510.00 | 350.36 | 349.43 | 2649.00 | ||||||||||||||||||||||||||||||||||||
| Minimum | 548.00 | 486.00 | 18.00 | 32.00 | 0.57 | 0.59 | 1 | 1 | 22.00 | 15.00 | 2.64 | 1.56 | 25.00 | ||||||||||||||||||||||||||||||||||||
| Maximum | 143559.00 | 142379.00 | 11074.00 | 6477.00 | 1.98 | 1.80 | 1 | 1 | 9255.00 | 3525.00 | 353.00 | 350.99 | 2674.00 | ||||||||||||||||||||||||||||||||||||
| Sum | 383037.00 | 385157.00 | 26168.00 | 22322.00 | 12.01 | 11.82 | 13 | 13 | 21013.00 | 17506.00 | 604.50 | 586.09 | 12959.00 | ||||||||||||||||||||||||||||||||||||
| Percentiles 25 | 7368.0000 | 7368.0000 | 466.5000 | 553.0000 | 1.0075 | 0.9225 | 1.00 | 1.00 | 497.5000 | 491.5000 | 11.7900 | 9.3600 | 294.7500 | ||||||||||||||||||||||||||||||||||||
| Percentiles 50 | 10309.0000 | 10732.0000 | 981.0000 | 921.0000 | 1.1750 | 1.1400 | 1.00 | 1.00 | 703.0000 | 868.0000 | 21.0000 | 21.0000 | 573.0000 | ||||||||||||||||||||||||||||||||||||
| Percentiles 75 | 35202.0000 | 32774.0000 | 2222.5000 | 2489.5000 | 1.3700 | 1.5075 | 1.00 | 1.00 | 1595.0000 | 2127.5000 | 44.5900 | 36.7200 | 1602.0000 | ||||||||||||||||||||||||||||||||||||
| a. Multiple modes exist. The smallest value is shown | |||||||||||||||||||||||||||||||||||||||||||||||||
| I7.2022 | I8.2021 | I8.2022 | I10.2021 | I10.2022 | I12.2021 | I12.2022 | I13.2021 | I13.2022 | I14.2021 | I14.2022 | I15.2021 | I15.2022 | I16.2021 | ||||||||||||||||||||||||||||||||||||
| N Valid | 14 | 14 | 14 | 13 | 13 | 13 | 13 | 13 | 13 | 13 | 13 | 13 | 13 | 15 | |||||||||||||||||||||||||||||||||||
| N Missing | 1 | 1 | 1 | 2 | 2 | 2 | 2 | 2 | 2 | 2 | 2 | 2 | 2 | 0 | |||||||||||||||||||||||||||||||||||
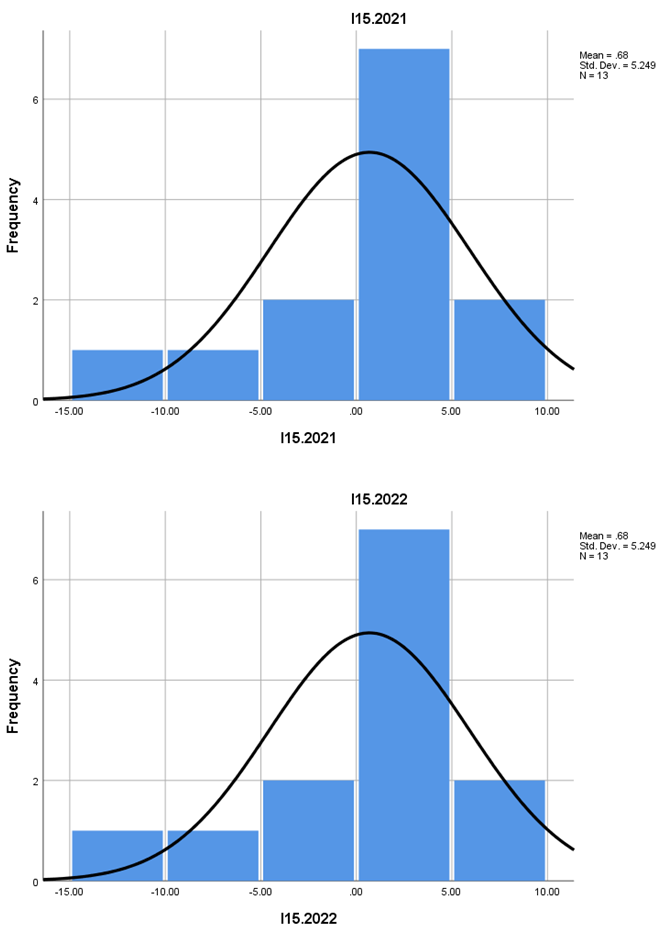
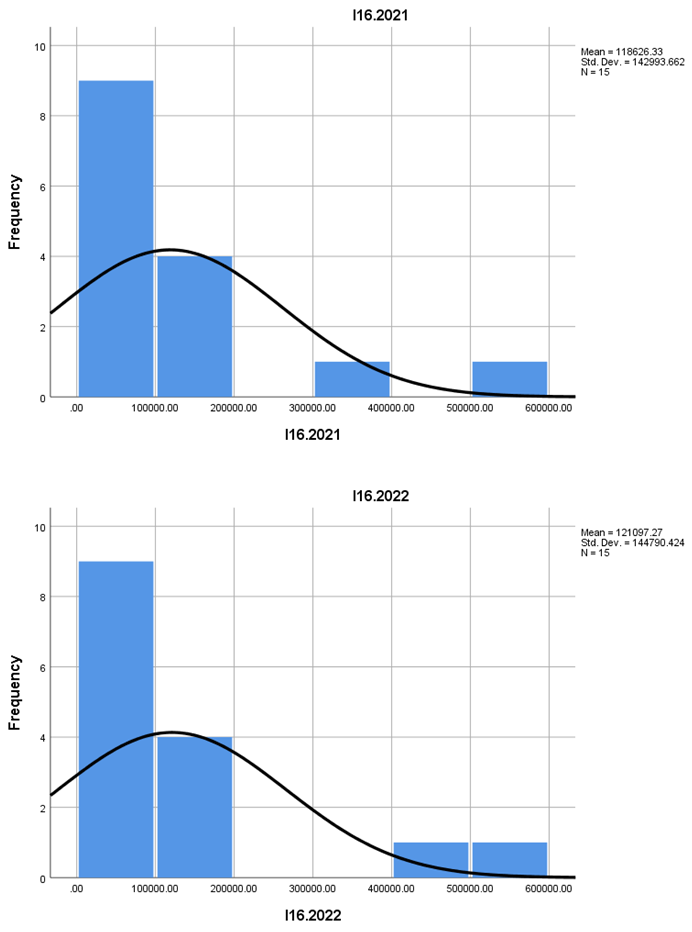
| Mean | 954.3571 | 5.4964 | 5.6757 | 124.3846 | 123.7692 | 20.2415 | 19.7000 | 11.1146 | 10.6669 | 9.1246 | 9.0331 | 0.6808 | 0.6808 | 118626.3333 | |||||||||||||||||||||||||||||||||||
| Std. Error of Mean | 224.45640 | 0.42160 | 0.48866 | 39.23034 | 41.42930 | 3.46562 | 1.94344 | 1.96989 | 1.14735 | 1.57218 | 1.17028 | 1.45572 | 1.45572 | 36920.80470 | |||||||||||||||||||||||||||||||||||
| Median | 519.0000 | 4.9950 | 5.5400 | 79.0000 | 68.0000 | 17.9200 | 19.1200 | 9.9900 | 10.3500 | 7.0900 | 7.6000 | 0.9600 | 0.9600 | 78882.0000 | |||||||||||||||||||||||||||||||||||
| Mode | 18.00a | 3.55a | 3.55a | 58.00a | 152.00 | 7.30a | 9.67a | 3.28a | 5.74a | 4.01a | 3.09a | -11.31a | -11.31a | 2250.00a | |||||||||||||||||||||||||||||||||||
| Std. Deviation | 839.83896 | 1.57749 | 1.82839 | 141.44701 | 149.37545 | 12.49545 | 7.00716 | 7.10254 | 4.13684 | 5.66858 | 4.21949 | 5.24868 | 5.24868 | 142993.66174 | |||||||||||||||||||||||||||||||||||
| Skewness | 1.043 | 0.289 | 0.333 | 2.789 | 2.920 | 2.475 | 0.295 | 2.089 | 0.780 | 2.610 | 0.726 | -1.072 | -1.072 | 2.170 | |||||||||||||||||||||||||||||||||||
| Std. Error of Skewness | 0.597 | 0.597 | 0.597 | 0.616 | 0.616 | 0.616 | 0.616 | 0.616 | 0.616 | 0.616 | 0.616 | 0.616 | 0.616 | 0.580 | |||||||||||||||||||||||||||||||||||
| Kurtosis | -0.199 | -1.536 | -1.474 | 8.839 | 9.489 | 7.532 | -0.890 | 5.747 | 0.435 | 7.834 | -0.672 | 1.117 | 1.117 | 4.168 | |||||||||||||||||||||||||||||||||||
| Std. Error of Kurtosis | 1.154 | 1.154 | 1.154 | 1.191 | 1.191 | 1.191 | 1.191 | 1.191 | 1.191 | 1.191 | 1.191 | 1.191 | 1.191 | 1.121 | |||||||||||||||||||||||||||||||||||
| Range | 2656.00 | 4.61 | 5.13 | 557.00 | 585.00 | 50.45 | 21.74 | 28.18 | 14.02 | 22.28 | 12.99 | 19.18 | 19.18 | 510151.00 | |||||||||||||||||||||||||||||||||||
| Minimum | 18.00 | 3.55 | 3.55 | 5.00 | 7.00 | 7.30 | 9.67 | 3.28 | 5.74 | 4.01 | 3.09 | -11.31 | -11.31 | 2250.00 | |||||||||||||||||||||||||||||||||||
| Maximum | 2674.00 | 8.16 | 8.68 | 562.00 | 592.00 | 57.75 | 31.41 | 31.46 | 19.76 | 26.29 | 16.08 | 7.87 | 7.87 | 512401.00 | |||||||||||||||||||||||||||||||||||
| Sum | 13361.00 | 76.95 | 79.46 | 1617.00 | 1609.00 | 263.14 | 256.10 | 144.49 | 138.67 | 118.62 | 117.43 | 8.85 | 8.85 | 1779395.00 | |||||||||||||||||||||||||||||||||||
| Percentiles 25 | 387.7500 | 3.8775 | 4.0050 | 56.5000 | 51.5000 | 12.6450 | 13.1150 | 6.1150 | 6.5250 | 6.1850 | 5.9750 | -1.6750 | -1.6750 | 37678.0000 | |||||||||||||||||||||||||||||||||||
| Percentiles 50 | 519.0000 | 4.9950 | 5.5400 | 79.0000 | 68.0000 | 17.9200 | 19.1200 | 9.9900 | 10.3500 | 7.0900 | 7.6000 | 0.9600 | 0.9600 | 78882.0000 | |||||||||||||||||||||||||||||||||||
| Percentiles 75 | 1628.7500 | 7.0000 | 7.2200 | 152.0000 | 152.0000 | 22.3100 | 25.1200 | 13.1150 | 12.8250 | 10.3000 | 13.0950 | 4.5350 | 4.5350 | 108219.0000 | |||||||||||||||||||||||||||||||||||
| a. Multiple modes exist. The smallest value is shown | |||||||||||||||||||||||||||||||||||||||||||||||||
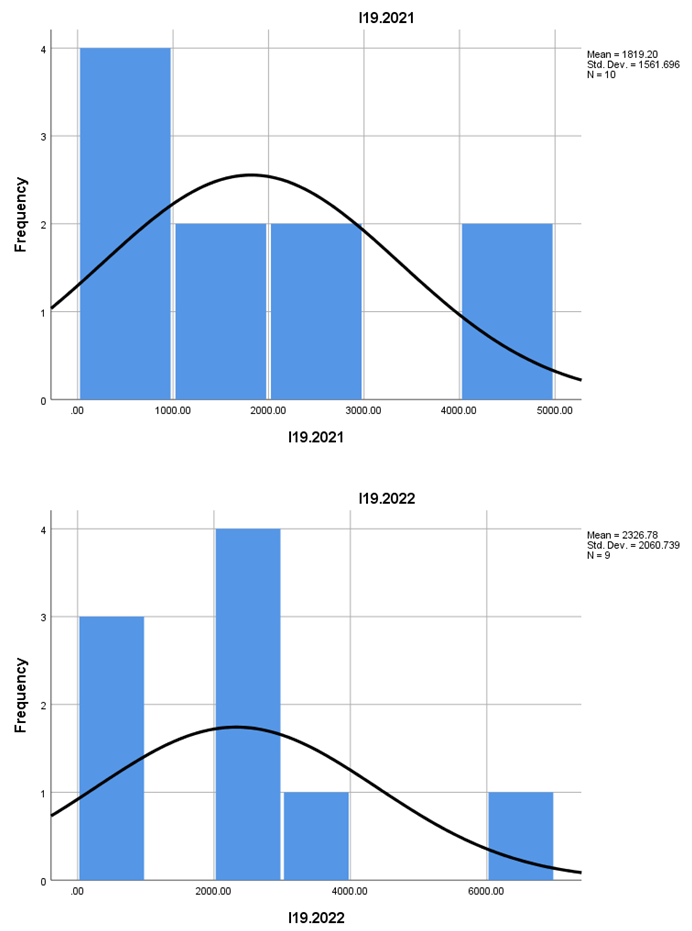
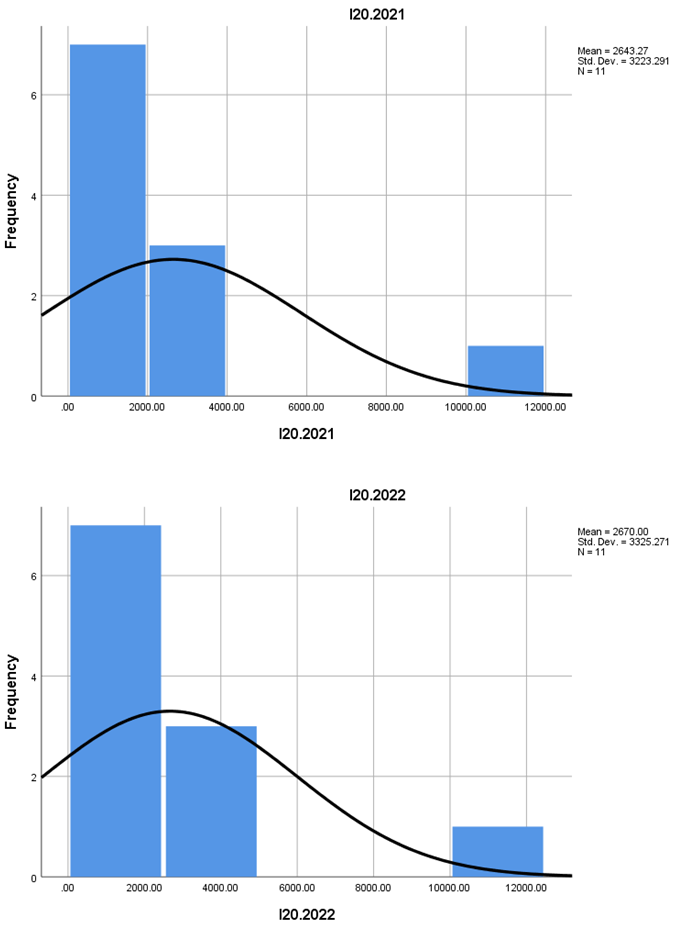
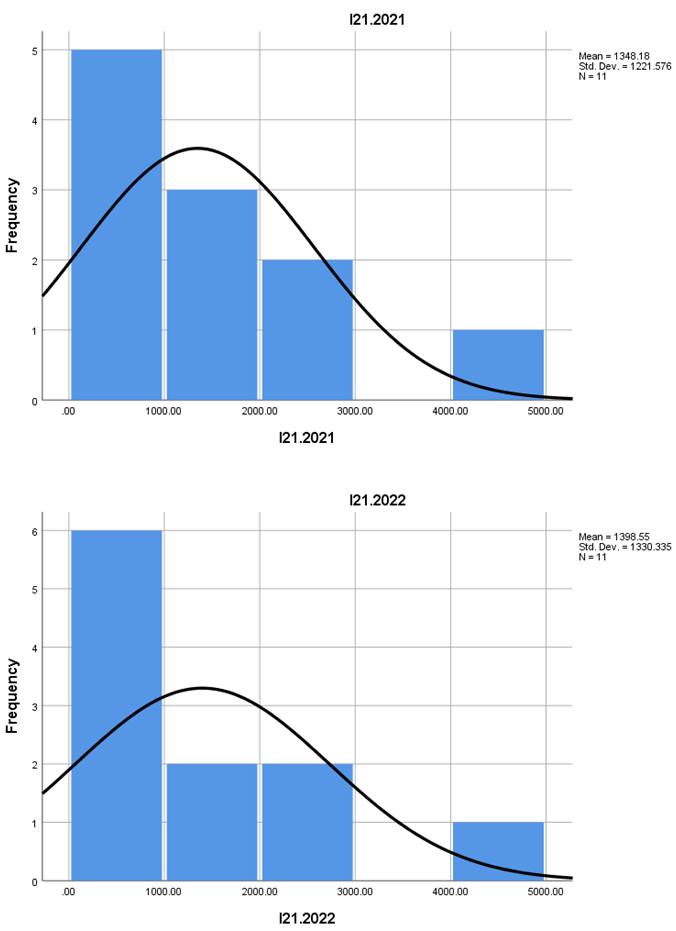
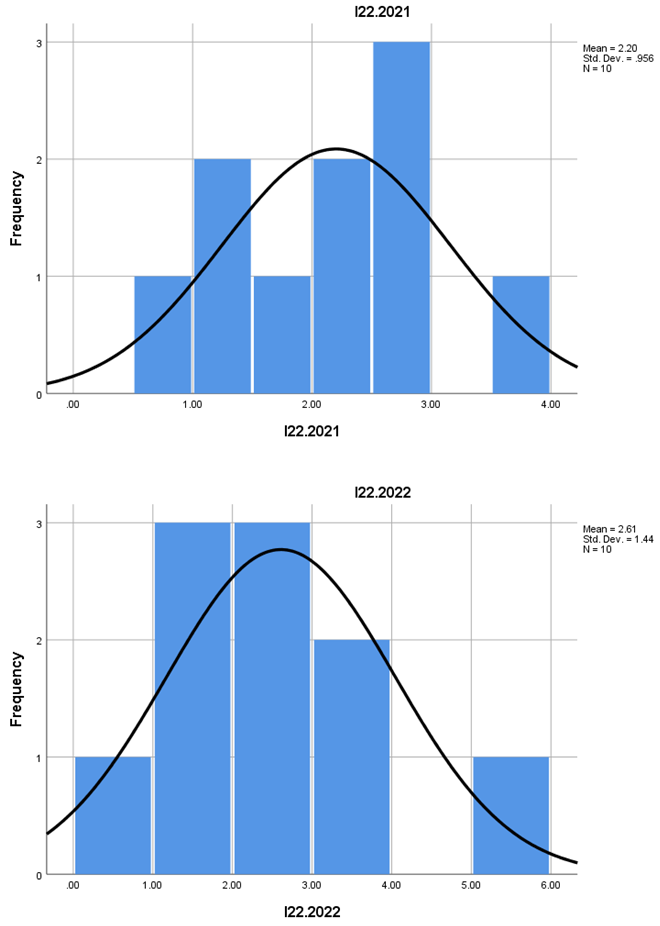
| I16.2022 | I17.2021 | I17.2022 | I18.2021 | I18.2022 | I19.2021 | I19.2022 | I20.2021 | I20.2022 | I21.2021 | I21.2022 | I22.2021 | ||||||||||||||||||||||||||||||||||||||
| N Valid | 15 | 10 | 10 | 10 | 10 | 10 | 9 | 11 | 11 | 11 | 11 | 10 | |||||||||||||||||||||||||||||||||||||
| N Missing | 0 | 5 | 5 | 5 | 5 | 5 | 6 | 4 | 4 | 4 | 4 | 5 | |||||||||||||||||||||||||||||||||||||
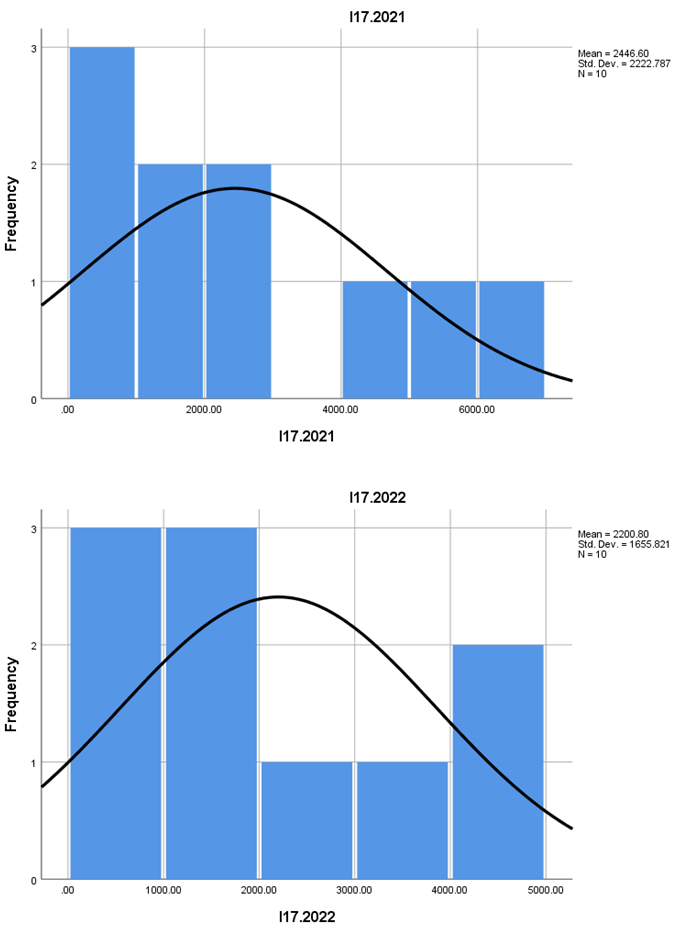
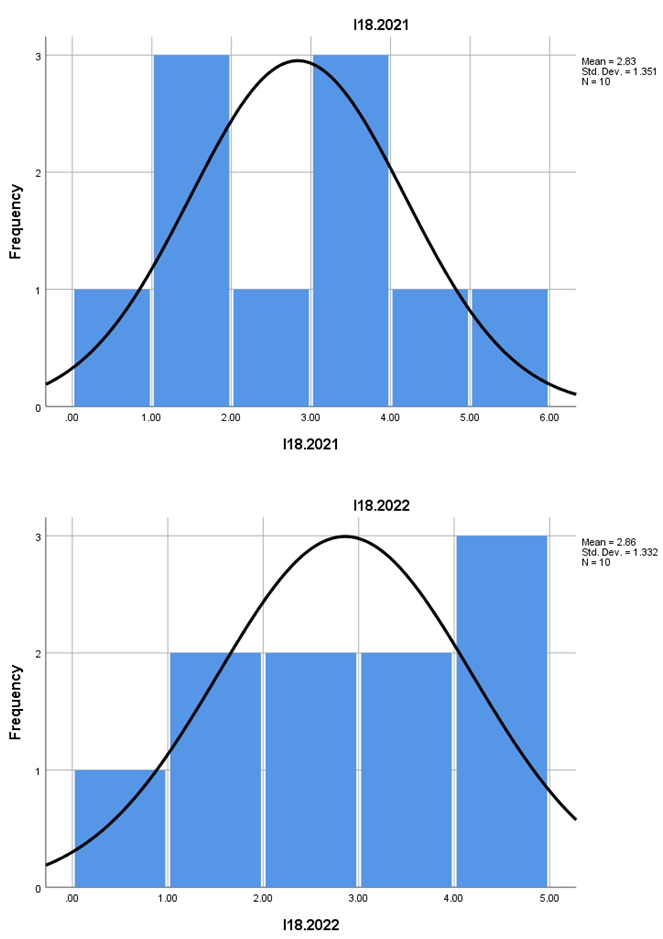
| Mean | 121097.2667 | 2446.6000 | 2200.8000 | 2.8340 | 2.8570 | 1819.2000 | 2326.7778 | 2643.2727 | 2670.0000 | 1348.1818 | 1398.5455 | 2.2020 | |||||||||||||||||||||||||||||||||||||
| Std. Error of Mean | 37384.72661 | 702.90692 | 523.61669 | 0.42735 | 0.42134 | 493.85153 | 686.91296 | 971.85889 | 1002.60679 | 368.31895 | 401.11108 | 0.30229 | |||||||||||||||||||||||||||||||||||||
| Median | 83876.0000 | 1594.0000 | 1806.0000 | 3.0650 | 2.7650 | 1477.5000 | 2115.0000 | 1558.0000 | 1393.0000 | 1095.0000 | 853.0000 | 2.1400 | |||||||||||||||||||||||||||||||||||||
| Mode | 2214.00a | 17.00a | 22.00a | .76a | .99a | 20.00a | 15.00a | 66.00a | 28.00a | 34.00a | 15.00a | .89a | |||||||||||||||||||||||||||||||||||||
| Std. Deviation | 144790.42356 | 2222.78685 | 1655.82137 | 1.35141 | 1.33240 | 1561.69565 | 2060.73887 | 3223.29130 | 3325.27055 | 1221.57577 | 1330.33495 | 0.95593 | |||||||||||||||||||||||||||||||||||||
| Skewness | 2.130 | 0.845 | 0.571 | 0.064 | -0.071 | 0.969 | 1.479 | 2.488 | 2.596 | 1.251 | 1.482 | 0.348 | |||||||||||||||||||||||||||||||||||||
| Std. Error of Skewness | 0.580 | 0.687 | 0.687 | 0.687 | 0.687 | 0.687 | 0.717 | 0.661 | 0.661 | 0.661 | 0.661 | 0.687 | |||||||||||||||||||||||||||||||||||||
| Kurtosis | 3.970 | -0.943 | -1.055 | -0.605 | -1.612 | -0.052 | 3.010 | 6.962 | 7.440 | 1.215 | 1.915 | -0.217 | |||||||||||||||||||||||||||||||||||||
| Std. Error of Kurtosis | 1.121 | 1.334 | 1.334 | 1.334 | 1.334 | 1.334 | 1.400 | 1.279 | 1.279 | 1.279 | 1.279 | 1.334 | |||||||||||||||||||||||||||||||||||||
| Range | 513517.00 | 6257.00 | 4696.00 | 4.35 | 3.53 | 4569.00 | 6955.00 | 11543.00 | 11995.00 | 4049.00 | 4476.00 | 3.10 | |||||||||||||||||||||||||||||||||||||
| Minimum | 2214.00 | 17.00 | 22.00 | 0.76 | 0.99 | 20.00 | 15.00 | 66.00 | 28.00 | 34.00 | 15.00 | 0.89 | |||||||||||||||||||||||||||||||||||||
| Maximum | 515731.00 | 6274.00 | 4718.00 | 5.11 | 4.52 | 4589.00 | 6970.00 | 11609.00 | 12023.00 | 4083.00 | 4491.00 | 3.99 | |||||||||||||||||||||||||||||||||||||
| Sum | 1816459.00 | 24466.00 | 22008.00 | 28.34 | 28.57 | 18192.00 | 20941.00 | 29076.00 | 29370.00 | 14830.00 | 15384.00 | 22.02 | |||||||||||||||||||||||||||||||||||||
| Percentiles 25 | 37281.0000 | 876.7500 | 924.7500 | 1.7900 | 1.6925 | 612.2500 | 695.0000 | 830.0000 | 1002.0000 | 458.0000 | 545.0000 | 1.2075 | |||||||||||||||||||||||||||||||||||||
| Percentiles 50 | 83876.0000 | 1594.0000 | 1806.0000 | 3.0650 | 2.7650 | 1477.5000 | 2115.0000 | 1558.0000 | 1393.0000 | 1095.0000 | 853.0000 | 2.1400 | |||||||||||||||||||||||||||||||||||||
| Percentiles 75 | 113748.0000 | 5028.5000 | 4044.5000 | 3.8800 | 4.2525 | 2778.2500 | 3107.5000 | 3380.0000 | 3380.0000 | 2090.0000 | 2090.0000 | 2.8675 | |||||||||||||||||||||||||||||||||||||
| a. Multiple modes exist. The smallest value is shown | |||||||||||||||||||||||||||||||||||||||||||||||||
| I22.2022 | I23.2021 | I23.2022 | I24.2021 | I24.2022 | I25.2021 | I25.2022 | I26.2021 | I26.2022 | I27.2021 | I27.2022 | I28.2021 | I28.2022 | |||||||||||||||||||||||||||||||||||||
| N Valid | 10 | 11 | 11 | 11 | 11 | 13 | 13 | 9 | 9 | 8 | 7 | 9 | 9 | ||||||||||||||||||||||||||||||||||||
| N Missing | 5 | 4 | 4 | 4 | 4 | 2 | 2 | 6 | 6 | 7 | 8 | 6 | 6 | ||||||||||||||||||||||||||||||||||||
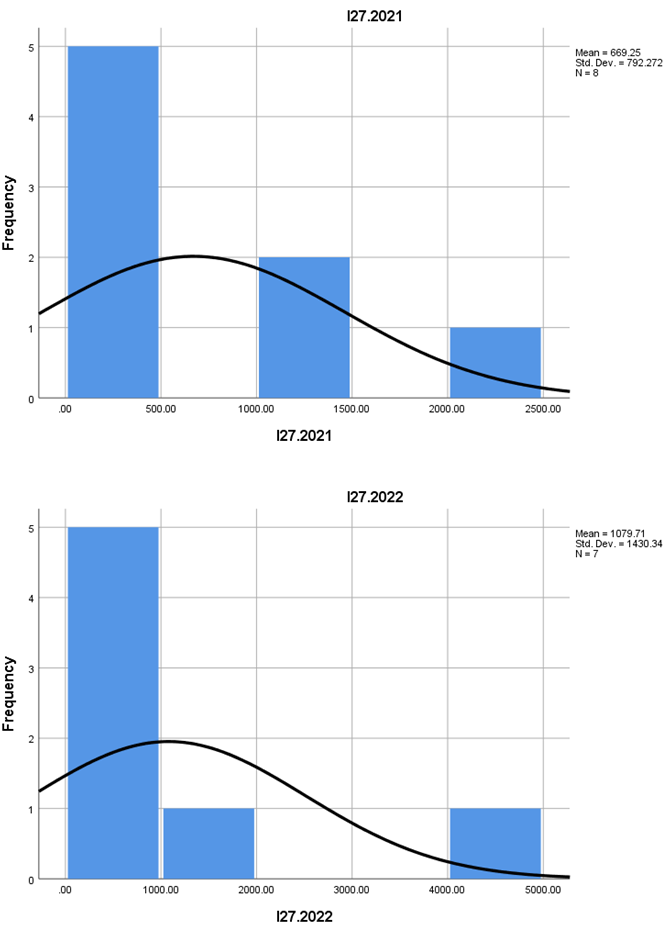
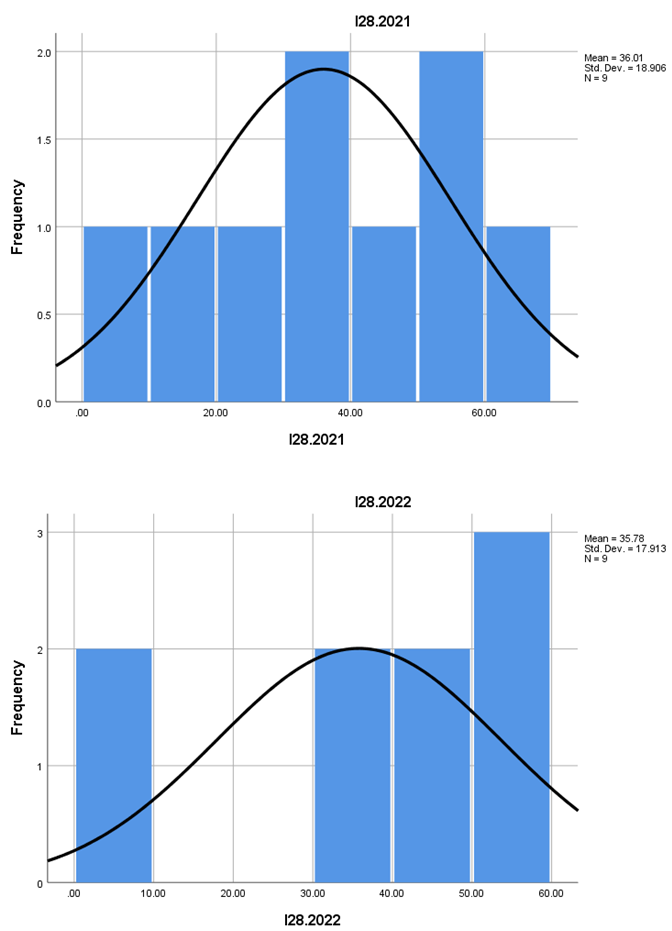
| Mean | 2.6090 | 3.0100 | 2.9818 | 82.9809 | 80.3164 | 102111.7692 | 104312.3846 | 909.2222 | 826.2222 | 669.2500 | 1079.7143 | 36.0067 | 35.7844 | ||||||||||||||||||||||||||||||||||||
| Std. Error of Mean | 0.45521 | 0.15541 | 0.28760 | 14.95420 | 12.55880 | 34086.77705 | 34836.70606 | 402.93247 | 311.36245 | 280.11029 | 540.61776 | 6.30190 | 5.97099 | ||||||||||||||||||||||||||||||||||||
| Median | 2.3000 | 2.9300 | 2.9900 | 61.7200 | 69.8300 | 44403.0000 | 43514.0000 | 299.0000 | 313.0000 | 336.0000 | 670.0000 | 35.2900 | 40.2800 | ||||||||||||||||||||||||||||||||||||
| Mode | .68a | 2.40a | 1.26a | 29.41a | 19.69a | 2011.00a | 2020.00a | 6.00a | 7.00a | 1.00a | 7.00a | 6.03a | 6.03a | ||||||||||||||||||||||||||||||||||||
| Std. Deviation | 1.43951 | 0.51542 | 0.95385 | 49.59746 | 41.65284 | 122901.62247 | 125605.52997 | 1208.79742 | 934.08736 | 792.27155 | 1430.34014 | 18.90569 | 17.91296 | ||||||||||||||||||||||||||||||||||||
| Skewness | 1.006 | 1.251 | 0.172 | 0.975 | 0.666 | 1.841 | 1.807 | 1.368 | 1.128 | 1.489 | 1.795 | -0.282 | -0.850 | ||||||||||||||||||||||||||||||||||||
| Std. Error of Skewness | 0.687 | 0.661 | 0.661 | 0.661 | 0.661 | 0.616 | 0.616 | 0.717 | 0.717 | 0.752 | 0.794 | 0.717 | 0.717 | ||||||||||||||||||||||||||||||||||||
| Kurtosis | 1.155 | 1.266 | 0.634 | 0.064 | 0.631 | 2.425 | 2.266 | 0.158 | -0.250 | 2.001 | 3.133 | -1.027 | -0.702 | ||||||||||||||||||||||||||||||||||||
| Std. Error of Kurtosis | 1.334 | 1.279 | 1.279 | 1.279 | 1.279 | 1.191 | 1.191 | 1.400 | 1.400 | 1.481 | 1.587 | 1.400 | 1.400 | ||||||||||||||||||||||||||||||||||||
| Range | 4.99 | 1.74 | 3.55 | 154.92 | 148.02 | 389914.00 | 394303.00 | 2983.00 | 2402.00 | 2319.00 | 3999.00 | 54.66 | 46.60 | ||||||||||||||||||||||||||||||||||||
| Minimum | 0.68 | 2.40 | 1.26 | 29.41 | 19.69 | 2011.00 | 2020.00 | 6.00 | 7.00 | 1.00 | 7.00 | 6.03 | 6.03 | ||||||||||||||||||||||||||||||||||||
| Maximum | 5.67 | 4.14 | 4.81 | 184.33 | 167.71 | 391925.00 | 396323.00 | 2989.00 | 2409.00 | 2320.00 | 4006.00 | 60.69 | 52.63 | ||||||||||||||||||||||||||||||||||||
| Sum | 26.09 | 33.11 | 32.80 | 912.79 | 883.48 | 1327453.00 | 1356061.00 | 8183.00 | 7436.00 | 5354.00 | 7558.00 | 324.06 | 322.06 | ||||||||||||||||||||||||||||||||||||
| Percentiles 25 | 1.6400 | 2.6700 | 2.3500 | 42.1300 | 52.2900 | 27768.0000 | 27723.0000 | 132.5000 | 116.5000 | 76.2500 | 70.0000 | 20.0550 | 20.0800 | ||||||||||||||||||||||||||||||||||||
| Percentiles 50 | 2.3000 | 2.9300 | 2.9900 | 61.7200 | 69.8300 | 44403.0000 | 43514.0000 | 299.0000 | 313.0000 | 336.0000 | 670.0000 | 35.2900 | 40.2800 | ||||||||||||||||||||||||||||||||||||
| Percentiles 75 | 3.5125 | 3.1300 | 3.7400 | 120.9600 | 110.7400 | 111777.5000 | 119028.5000 | 2029.0000 | 1672.0000 | 1096.0000 | 1825.0000 | 54.4250 | 51.0450 | ||||||||||||||||||||||||||||||||||||
| a. Multiple modes exist. The smallest value is shown | |||||||||||||||||||||||||||||||||||||||||||||||||
Disclaimer/Publisher’s Note: The statements, opinions and data contained in all publications are solely those of the individual author(s) and contributor(s) and not of MDPI and/or the editor(s). MDPI and/or the editor(s) disclaim responsibility for any injury to people or property resulting from any ideas, methods, instructions or products referred to in the content. |
© 2025 by the authors. Licensee MDPI, Basel, Switzerland. This article is an open access article distributed under the terms and conditions of the Creative Commons Attribution (CC BY) license (http://creativecommons.org/licenses/by/4.0/).
Copyright: This open access article is published under a Creative Commons CC BY 4.0 license, which permit the free download, distribution, and reuse, provided that the author and preprint are cited in any reuse.


