
Submitted:
08 May 2025
Posted:
09 May 2025
You are already at the latest version
Abstract
The objectives were to develop and evaluate a machine learning model based on a combination of biomechanics and image texture analysis, to improve the detection of high-risk carotid plaques.
Sixty-five patients, who underwent high-resolution, multi-contrast, magnetic resonance imaging (MRI) of the carotid artery wall within two weeks of a TIA or stroke, were assessed. The MR images were provided by the CARE-II multi-centre carotid imaging trial (ClinicalTrials.gov Identifier: NCT02017756). Following 3D artery construction, parametric maps of structural stress, wall shear stress, and inward remodeling were computed using a one-way fluid structure interaction (FSI) approach.
A radiomics pipeline was developed to derive image texture features from mechanics maps and the MR images. Machine learning models were then developed to distinguish non-culprit and culprit carotid plaques, where culprit plaques were deemed responsible for the symptoms associated with the TIA/stroke. The performance of a combined model, developed from the most predictive features of the mechanics map and MR image models, was compared with mechanics and MRI-based models individually.
Mechanics [Accuracy = 0.68, AUC = 0.75 ± 0.03] and MRI-based models [Accuracy = 0.67, AUC = 0.71 ± 0.04] showed greater predictive capabilities for culprit lesions than the measurement of vessel stenosis alone [Accuracy = 0.62, AUC = 0.57 ± 0.04] (p < 0.001). The combined mechano-radiomics model [Accuracy = 0.76, AUC= 0.82 ± 0.04] (p=0.037)
showed significant improvement in the prediction of culprit plaques compared with MRI and mechanics map features alone, as well as the clinically conventional measurement of vascular stenosis.
Keywords:
MRI
; biomechanics
; stress
; radiomics
; stroke
; atherosclerosis
; carotid
1. Introduction
Carotid disease is a major subset of cardiovascular diseases (CVD), which remains one of the leading causes of mortality worldwide (World Health Organization, 2021). The current gold standard for risk stratification, luminal stenosis, is typically assessed through linear measurements at the narrowest lumen and referenced to either the normal (NASCET) or estimated (ECST) vessel caliber (Mallarini and Saba, 2010). Patients with severe stenosis (≥70%) often undergo carotid endarterectomy (CEA) or carotid artery stenting (CAS). However, clinical events are more frequently associated with mild-to-moderate stenosis (<70%), where the benefits of surgical intervention are less clear (Naylor, 2008). This highlights an urgent need for advanced diagnostic methods capable of evaluating plaque vulnerability beyond the limitations of stenosis-based assessments.
Advancements in functional magnetic resonance imaging (MRI) have facilitated carotid plaque analyses, particularly in identifying inflammation-related biomarkers (Howarth et al., 2009; Sadat et al., 2011; Tang et al., 2009). Imaging features such as ultrasound-measured plaque area (Nicolaides, 2010) and MRI-detected intra-luminal thrombus (ILT) presence (Gupta et al., 2013) have been consistently recommended for identifying patients at heightened risk of stroke during best medical treatment (BMT) (Aboyans et al., 2017; Naylor et al., 2023). These imaging biomarkers may serve to refine surgical decision-making alongside patient-specific factors such as life expectancy and medication history in managing symptomatic and asymptomatic carotid artery disease.
This study introduces an integrative approach to carotid plaque vulnerability assessment, combining radiomics-based image texture analysis with mechanical modeling of the vessel wall. Radiomics is a data-driven technique that analyses imaging-derived features, such as pixel intensity distribution and heterogeneity, to characterize lesion phenotypes (Gillies, Hricak, and Kinahan, 2016). While extensively studied in oncology, radiomics has been underexplored in the context of carotid plaque analysis (DeMarco and Porambo, 2020; Saba et al., 2024; Vacca et al., 2024). By extracting texture features from MR images, machine learning classifiers can be developed to predict carotid plaque vulnerability, potentially paving the way toward personalized treatment strategies (Le et al., 2021; Meddings et al., 2024; Lambin et al., 2017).
While radiomic image texture features may help characterise lesion phenotypes, further insight into plaque stability may be provided by the biomechanical environment (Curcio et al, 2023; Mahmoud, 2019; Oyejide, 2023). Hemodynamic forces – particularly wall shear stress (WSS) - have long been associated with the destabilization of established plaques near regions of complex blood flow, such as the carotid bifurcation and regions of stenosis (Duerinckx and Shaaban, 2000). However, the exact role of WSS in both early-stage and late-stage atherosclerosis is largely unresolved (Gijsen et al, 2019), and it remains inconclusive as to whether low and/or oscillatory WSS triggers elevated, atherosclerosis-exacerbating, low-density lipoprotein (LDL) levels (Peiffer et al, 2013; Weinberg, 2022).
Another important aspect of the mechanics environment is the vessel structural stress (VSS), which represents the intra-mural forces acting within the plaque. These forces are associated with plaque rupture, which occurs when VSS overcomes the material strength of the arterial wall. This can lead to a stroke or TIA via an exposed necrotic core and subsequent thrombosis (Bentzon, 2014). Therefore, regions of high VSS may be associated with plaque vulnerability due to the potential for lesion rupture (Sadat et al, 2010; Tang et al, 2009).
This study aims to integrate vessel wall mechanics with radiomics-based texture analysis into a unified mechano-radiomic model for predicting plaque vulnerability. Mechanical stress maps derived from 3D computational models derived from multi-slice MR images are analysed alongside radiomics features extracted from the original imaging data. This combined approach seeks to enhance the understanding and prediction of plaque vulnerability, ultimately contributing to improved risk stratification and patient management strategies.
2. Materials and Methods
2.1. Patients and High-Resolution, Multi-Contrast MRI
Data from sixty-five patients from the CARE-II multicentre clinical trial were used in this study (ClinicalTrials.gov Identifier: NCT02017756) (Zhao et al, 2017). Patients in this study cohort had symptoms attributed to one of their carotid arteries, such that the dataset could be split evenly into culprit and non-culprit lesions. Culprit lesions were defined as the side deemed responsible, following clinical assessment and image analysis, for a transient ischaemic attack (TIA) or stroke. A summary of cohort demographics is provided by Table 1.
Patients underwent bilateral MRI of their carotid arteries with the following sequences: three-dimensional (3D) time-of-flight (TOF), T1-weighted (T1w) quadruple inversion recovery (QIR), T2-weighted (T2w) double inversion recovery (DIR), and Magnetisation Prepared - Rapid Acquisition Gradient Echo (MP-RAGE). Detailed MR parameters can be found in the reference paper for the CARE-II trial (Zhao et al, 2017).
2.2. CFD and FEA Methodology
The mechanical environment of the artery was simulated using a one-way fluid-structure-interaction (FSI) approach within the ADINA (Bentley Systems Incorporated, Exton, PA) software. Computational fluid dynamics (CFD) simulations were used to estimate wall shear stresses (WSS) and endothelium pressures. Pressure results were then carried forward from the CFD simulation to a finite element model ahead of a structural deformation finite element analysis (FEA) simulation. Forces derived from fluid dynamics were applied as boundary conditions in the structural model, without feedback from the structural simulation result.
The models which were used for CFD and solid deformation analysis were extrapolated from manually segmented contours of the lumen, outer wall boundaries and various atherosclerotic components including intra-plaque haemorrhage (IPH), lipid core and calcification. Segmentations were performed manually by with reference to T1-weighted, T2-weighted, TOF, and magnetisation-prepared rapid gradient-echo (MP-RAGE) image modalities. Segmentations were performed on a minimum of 16 axial slices and verified by a minimum of 2 reviewers. This process was supported by a custom-designed software (CASCADE; University of Washington, Seattle, USA) (Zhao et al, 2017).
Segmentations were conducted in a custom-built MATLAB interface (The MathWorks, Natick, MA). The endothelium surface was modelled by discrete 2D shell elements for CFD analysis. Using the finite element pre-processing software Hypermesh (Altair Engineering, Inc., USA), given the complexity of the geometries, 3D models were generated with an unstructured mesh protocol, consisting of tetrahedral elements. Proximity-based mesh density adjustments were made to allow for a greater number of elements in tight regions, such as thin walls. While 3D meshes were bespoke for each patient and artery side, the total number of elements were of the order 105. Grid-independence validation tests were done by adjusting the number of elements and checking for wall pressure convergence from identical CFD simulation conditions.
The incompressible Navier-Stokes equations were solved using a Lagrangian-Eulerian formulation in ADINA to simulate blood flow, where represents blood density, velocity, time, pressure and viscosity.
CFD simulations were performed based on time-varying blood pressure inlet and outlet boundary conditions, to simulate a cardiac cycle and an estimation of time-varying wall shear stress (WSS). WSS was computed at discrete points on the inner wall. The results were subsequently transposed onto a 2D mechanics image through a flattening procedure to provide a spatial representation. Blood pressure data was obtained from patient-specific systolic and diastolic measurements from the CARE-II dataset.
Wall pressures from the CFD simulations were applied to compute the intramural stresses and deformations in the artery. Slice-wise vessel structural stress (VSS) was calculated from finite element analysis (FEA). Stress measurements were based on local maxima observed during the cardiac cycle, capturing the peak structural stress experienced by the vessel.
The principal stress in the first direction (Stress-P1) was used to represent VSS, as it corresponds to the maximum tensile stress invariant. This stress is aligned with the material fiber orientation, which is indicative of fiber material strength and structural integrity. To model the arterial wall's behaviour accurately, a modified Mooney-Rivlin strain energy density function (SEDF) was employed. This provided a detailed distribution of structural stress across the artery, accounting for its non-linear elastic properties.
2.3. Boundary Conditions, Parameters and Assumptions
The computational fluid dynamics (CFD) and finite element analysis (FEA) simulations were based on several key boundary conditions, parameters, and assumptions:
- Inlet and outlet boundary conditions: Time-varying inlet pressure profiles based on patient-specific measurements were applied at the proximal end of the arterial segment. This pressure ranged between the patient’s diastolic and systolic blood pressure measurements, which were provided as part of the CARE-II dataset. A relatively small distal resistance assumption justified a grounded outlet pressure boundary condition.
- Blood flow characteristics: Blood flow was modelled as incompressible, viscous, and laminar. The blood was assumed to behave according to Newtonian fluid dynamics, which is a reasonable assumption for larger arteries. The viscosity of blood was set to 3.5 × 10⁻³ Pa·s, and the density was defined as 1000 kg/m³, reflecting typical physiological values for human blood.
- Wall conditions: The wall was modelled as rigid, and a no-slip boundary condition was imposed at the arterial walls. This means that the velocity of the blood at the wall was set to zero. The inner wall experienced loading defined by pressures extracted from the CFD simulations. Elements were free to move in radial and circumferential directions during loading.
- Solver and convergence settings: Transient CFD simulations were conducted under time-varying inlet and outlet pressures to simulate a cardiac cycle. An implicit Navier-Stokes solver was employed using the ADINA-F module. For FEA, an implicit, full-Newton, large strain and large displacement formulation was used within the ADINA-S module. Convergence criteria were set to 10-6 for both energy and displacement residuals. Time-steps of 0.009s for 0.9s long loading cycles were chosen following time-step independence testing to balance computational time with precision. Grid-independence testing was also employed to determine a mesh size which addressed a similar computational trade-off.
- Material properties: The carotid artery material’s hyper-elastic constitutive model which relates stress to strain was governed by a modified Mooney-Rivlin strain-energy density function (SEDF). The Mooney-Rivlin model has consistently been shown to provide adequate approximation to the behaviour of the artery wall when compared with other constitutive models (Teng et al, 2015). Finite element analysis (FEA) was employed to solve for stress. The SEDF was modified for each type of biological material: wall; lipid-rich necrotic core (LRNC); intra-plaque haemorrhage (IPH); fibrous tissue; and calcification. Properties were chosen based on previous uni-axial tension experiments (Teng et al, 2014).
These boundary conditions and assumptions were selected to balance computational efficiency with physiological realism, ensuring that the results provide insight into both fluid dynamics and structural stress without overly complicating the model.
2.4. Mechanics Post-Processing
Centrelines were extracted from the 3D artery models using the vascular modelling toolkit VMTK (Antiga et al, 2008). An inward remodelling (IR) index was calculated at each artery wall node by dividing its distance to the centreline by a reference length in the common carotid artery (CCA). The single stenosis measurement, typically the ratio of local diameter to reference diameter, is related but not equivalent to a local maxima on the inward remodelling map. Similarly, the wall shear stress (WSS) was calculated at each node on the inner wall. WSS and IR index sampling at each node was non-uniform due to uneven node clustering. To address this, a patching procedure was developed to convert the wall into a uniform set of discrete zones that included the common and internal carotid arteries. Each discrete zone reported the average values from the nodes within it.These zones can be interpreted as the pixels of a 2D map generated from the mechanics data. A radiomics-style analysis was then applied to these maps to evaluate the predictive potential of the IR index and WSS maps.
Vessel structural stress was calculated at critical regions of the artery wall, where localized high stress concentrations occurred, such as the bifurcation and plaque shoulder. VSS feature extraction focused on the single value of the critical VSS. The cross-section selected for analysis was the one where the critical VSS occurred—typically at local maxima at the bifurcation or plaque shoulder region. The patching and mapping procedure is further outlined in Figure 1, which presents a WSS map used for mechanics map feature extraction. Inward remodelling (IR) index maps were based on the same principle. A slice-wise VSS distribution, approximately perpendicular to the lumen centerline, is illustrated in Figure 2.
2.5. Radiomic Feature Extraction
The open source PyRadiomics package (v2.2.0) (van Griethuysen et al, 2017) was used to extract averaged radiomic features from multiple MR image slices, as well as from a single 2D mechanics map, for each artery. Features belonging to the following groups were determined: first-order intensity histogram statistics; Gray Level Co-occurrence Matrix features (GLCM) (Dinstein, Haralick and Shanmugan, 1973; Haralick, 1979; Rundo et al, 2019); Gray Level Run Length Matrix (GLRLM) (Galloway, 1975); Gray Level Size Zone Matrix (GLSZM) (Angulo, Meyer and Thibault, 2014); Gray Level Dependence Matrix (GLDM) (Sun and Wee, 1982); and Neighbouring Gray Tone Difference Matrix (NGTDM) (Amadasun, 1989). The default PyRadiomics values of 25 for fixed bin width, and 107 total features extracted, were used. No resampling was applied.
This study used features based on the T2-weighted modality. It has been shown (Meddings, 2024) that T2-weighted radiomic features may offer better sensitivity to variations in the region of interest.
2.6. Predictive Modelling
Logistic regression models were developed to classify arteries into culprit and non-culprit categories, using a combination of radiomics features and biomechanical parameters. The modeling process was designed to ensure rigor and reproducibility, employing both feature selection and robust cross-validation techniques.
Prior to modeling, features underwent pre-processing to ensure consistency and robustness. Radiomic features with poor intra-class correlation coefficients (Meddings, 2024) were excluded to minimize noise and variability. Remaining features were standardized to have zero mean and unit variance to prevent dominance by features with larger scales.
Feature selection was conducted using the least absolute shrinkage and selection operator (LASSO) regression. This analysis was used to develop sparser models and reduce over-fitting (Tibshirani, 1996), allowing for the retention only of those features with strong predictive capabilities. Hyperparameters for LASSO were optimized through cross-validation within the training folds to maximize predictive accuracy while maintaining model interpretability.
Combining five-fold cross validation and leave-out-out cross-validation (LOOCV) (Cheng, Fernando and Garrick, 2017) provided a comprehensive perspective on model performance. The application of LOOCV ensured that each test case remained unseen during model training without leakage, while the size of the training dataset was maximised. Five-fold cross-validation splits offered insights into the variability and generalizability of the models. These complementary validation strategies bolster confidence in the robustness of the mechano-radiomic model.
LOOCV was used to evaluate model performance, while five-fold cross-validation was used to generate receiver-operating characteristic (ROC) curves, and the area under the curve (AUC) for ROC evaluation. Model weights presented in subsequent analysis were average across all folds in the LOOCV scheme, which benefited from more training data – an important factor given the small cohort size. The overall schematic is illustrated in Figure 3 below.
2.7. Statistical Analysis
Results were considered statistically significant if p < 0.05. McNemar’s test for paired samples was used to compare error rates between the two classifiers. The null hypothesis is that the error rates are equal (Dietterich, 1998). Significance between two ROC curves were assessed using the DeLong test (DeLong, 1988).
3. Results
3.1. Model Evaluation
The evaluation of the predictive models was performed using both leave-one-out cross-validation (LOOCV) and five-fold cross-validation, as summarised in Table 2 and Table 3. In Figure 4, the receiver-operating characteristic (ROC) curves are plotted for the radiomics, mechanics, and combined mechano-radiomic models. These curves illustrate the trade-off between sensitivity and specificity for each model.
In summary, both mechanics [accuracy = 0.68, AUC = 0.75 0.03] and radiomics models [accuracy = 0.67, AUC = 0.71 0.04] showed greater predictive capabilities for culprit lesions than the conventional measurement of luminal stenosis alone [accuracy = 0.62, AUC = 0.57 0.04] (p < 0.001)]. The combined mechano-radiomic model [accuracy = 0.76, AUC = 0.82 0.04] provided a significant improvement over the radiomic-only model (p = 0.037).
3.2. Feature Selection
Models were built by minimising over-fitting using LASSO feature selection. This approach penalised less informative features, yielding sparser models can be more easily interpreted. The co-efficients of the more predictive features, as well as the results of some less predictive but commonly cited texture features from the radiomic, mechanics and mechano-radiomic models, are illustrated in Table 4, Table 5 and Table 6 respectively, based on the LOOCV scheme. Feature weights are presented as averages across all folds, along with a 95% confidence interval.
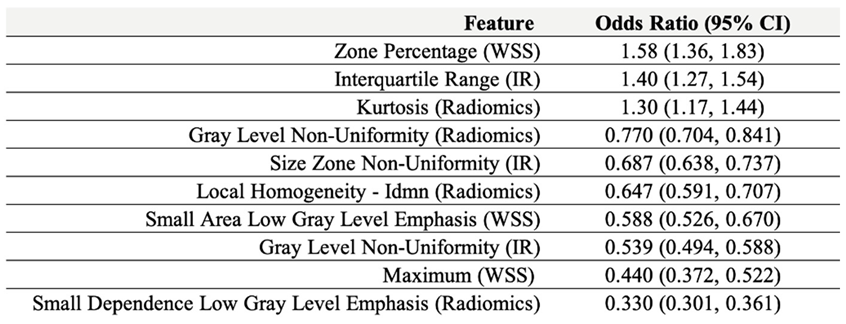
A mechano-radiomic signature may be represented by the top 10 weighted features across all cross-validation folds during model evaluation, which combined features from mechanics and radiomics models. This is presented in Table 7 as a set of features and odds ratios, derived from the logistic regression model weights The odds ratio, defined as , represents the predicted change in the odds of the outcome for a unit increase in the normalized predictor variable, if all other variables were to be held constant.
4. Discussion
The performance of models combining traditional medical image-based radiomic features with features derived from mechanics maps emphasises that integrating radiomics and a comprehensive biomechanical environment may significantly improve identification of culprit lesions compared with more conventional methods.
The predictive model contributions of shear stress (WSS) are particularly noteworthy: while maximum time-averaged wall shear stress (WSS) appeared to be a predictor of non-culprit plaques, the 3D distribution of the WSS map (WSS Zone Percentage) and the inward remodelling (IR) interquartile range measurements did demonstrate strong predictive capabilities, supporting the notion that distribution metrics of mechanical properties may serve as stronger predictors than single-point measurements, such as local minima or maxima. Although WSS might be more relevant to atherosclerosis development in earlier stages, it may still play a crucial role in determining plaque vulnerability in advanced stages of the disease.
Critical vessel structural stress (VSS) did not exhibit a strong multivariate odds ratio, as indicated by its low logistic regression coefficient. This is likely due to its dependence on patient-specific blood pressure levels. The culprit vessel may not necessarily experience higher stress for several reasons: tissue more fatigued under cyclical loading; more extensive vascular remodelling; ipsilateral plaque material strength is weaker; tissue is more erosion-prone; tissue has concentrations of micro-stresses; and other factors unaccounted for by the simulations.
The radiomic model in Table 4 is composed mainly of features which relate to image complexity, such as Local Homogeneity (GLCM), Small Dependence Low Gray Level Emphasis (GLDM), and the Local Homogeneity Idmn (GLCM) feature which was featured in the combined model signature in Table 7. The combined model utilises a wide range of texture features across the different image modalities, balancing size zone features of the WSS maps such as zone percentage (number of distinct WSS zones) with inward remodelling (IR) index map texture features such as Dependence Variance (GLCM). As with individual models, higher-order image texture features consistently had high weightings, indicating the predictive capabilities of radiomics in general. Our reported accuracy and AUC for radiomics are in line with similar studies. Using (Le, 2021) as an example, radiomics predictive capabilities on CT carotid images had mean AUC across 5 folds of 0.67, while the corresponding value in our study was 0.73. The improvement when combining radiomics with other biomarkers in this paper is demonstrated by an AUC of 0.73, so the combined AUC measurement of 0.82 is a positive development towards having a more comprehensive model of carotid risk management using AI-assisted high-resolution medical imaging.
The study is limited by its relatively small patient cohort and its retrospective design. The clinical goal of this research is to enable proactive diagnosis before a cardiovascular event occurs, with the potential to integrate it into screening protocols for both symptomatic and asymptomatic patients. An implicit assumption underlying this work is that the post-event mechanical and imaging structures resemble those present before the event.
Future work will be directed towards performing similar analyses for larger patient numbers, with an external test set to further validate the mechano-radiomic model. For example, selected features would benefit from stability analysis across larger cohorts or different populations. The presented model should be combined with further biomarkers, such as from functional MRI imaging, and deeper geometrical descriptions of arteries. Eventually, a deep learning method based on convolutional neural networks may facilitate a more efficient transition from imaging to mechanical analysis.
5. Conclusions
In conclusion, the mechano-radiomic model significantly improved plaque risk assessment over either of its constituent mechanics and radiomics methods alone, as well as the conventional stenosis measurement. Thus, in the context of carotid artery disease, combining image texture analysis from MR images with the mechanical environment offers a novel approach for risk stratification in plaque vulnerability assessment.
Acknowledgments
This research was supported by the NIHR Cambridge Biomedical Research Centre (NIHR203312). The views expressed are those of the authors and not necessarily those of the NIHR or the Department of Health and Social Care. ZM receives funding from the Cambridge Trust (10468740).
Abbreviations
| AUC | Area under the curve |
| CAS | Carotid artery stenting |
| CEA | Carotid endarterectomy |
| CFD | Computational fluid dynamics |
| CVD | Cardiovascular disease |
| FSI | Fluid-structure interaction |
| GLCM | Gray-level co-occurrence matrix |
| GLDM | Gray-level difference matrix |
| GLRLM | Gray-level run-length matrix |
| GLSZM | Gray-level size zone matrix |
| ICA | Internal carotid artery |
| IR | Inward remodelling |
| LASSO | Least absolute shrinkage and selection operator |
| LDL | Low-density lipoprotein |
| LOOCV | Leave-one-out cross-validation |
| MDIR | Multi-slice double inversion recovery |
| MP RAGE | Magnetization-prepared rapid gradient-echo |
| MRI | Magnetic resonance imaging |
| NGTDM | Neighbouring gray tone difference matrix |
| QIR | Quadruple inversion recovery |
| ROC | Receiver operating characteristic |
| SEDF | Strain-energy density function |
| TIA | Transient ischaemic attack |
| TOF | Time-of-flight |
| VSS | Vessel structural stress |
| WSS | Wall shear stress |
References
- Aboyans, V., Ricco, J. B., Bartelink, M. E. L., et al. 2017 ESC Guidelines on the Diagnosis and Treatment of Peripheral Arterial Diseases, in collaboration with the European Society for Vascular Surgery (ESVS): Document covering atherosclerotic disease of extracranial carotid and vertebral, mesenteric, renal, upper and lower extremity arteriesEndorsed by: the European Stroke Organization (ESO)The Task Force for the Diagnosis and Treatment of Peripheral Arterial Diseases of the European Society of Cardiology (ESC) and of the European Society for Vascular Surgery (ESVS). European heart journal, 39(9), 763–816. [CrossRef]
- Amadasun, M. King, R., 1989. Textural Features Corresponding to Textural Properties. IEEE Trans. Syst. Man Cybern. 19, 1264–1274. [CrossRef]
- Antiga, L. Piccinelli, M. Botti, L., et al, 2008. An image-based modeling framework for patient-specific computational hemodynamics. Medical and Biological Engineering and Computing, 46: 1097-1112, Nov 2008. [CrossRef]
- Bentzon, J.F. Otsuka, F. Virmani, R., et al, 2014. Mechanisms of plaque formation and rupture. Circ Res. 114(12):1852-1866. [CrossRef]
- Cheng, H. Garrick, D.J. Fernando, R.L., 2017. Efficient strategies for leave-one-out cross validation for genomic best linear unbiased prediction. J Anim Sci Biotechnol. May 2;8:38. [CrossRef]
- Curcio, N., Rosato, A., Mazzaccaro, D., 2023. 3D patient-specific modeling and structural finite element analysis of atherosclerotic carotid artery based on computed tomography angiography. Scientific reports, 13(1), 19911. [CrossRef]
- DeLong, E. DeLong, D. Clarke-Pearson, D.L., 1988. Comparing the areas under two or more correlated receiver operating characteristic curves: a nonparametric approach. Biometrics. Sep;44(3):837-45. [CrossRef] [PubMed]
- Dietterich, T., 1998. Approximate statistical tests for comparing supervised classification learning algorithms. Neural Computation, 10,1895-1923. [CrossRef]
- Galloway, M.M., 1975. Texture Analysis Using Gray Level Run Lengths. Comput. Graphics and Image Processing. 4, 172–179. [CrossRef]
- Gijsen, F. Katagiri, Y. Barlis, P., et al, 2019. Expert recommendations on the assessment of wall shear stress in human coronary arteries: existing methodologies, technical considerations, and clinical applications. European Heart Journal. 40(41):3421-3433. [CrossRef]
- Gillies, R.J. Kinahan, P.E. Hricak, H., 2016. Radiomics: Images Are More than Pictures, They Are Data. Radiology. Feb;278(2):563-77. Epub 2015 Nov 18. [CrossRef] [PubMed] [PubMed Central]
- Gupta, A. Baradaran, H. Schweitzer, A.D., et al. Carotid plaque MRI and stroke risk: a systematic review and meta-analysis. Stroke. 2013;44(11):3071-3077. [CrossRef]
- Haralick, R.M. Shanmugam, K. Dinstein, I., 1973. Textural Features for Image Classification. IEEE Transactions on Systems, Man, and Cybernetics. vol. SMC-3, no. 6, pp. 610-621, Nov. [CrossRef]
- Haralick, R.M., 1979. Statistical and structural approaches to texture. Proceedings of the IEEE, vol. 67, no. 5, pp. 786-804, May. [CrossRef]
- Howarth, S.P. Tang, T.Y. Trivedi, R., et al, 2009. Utility of USPIO-enhanced MR imaging to identify inflammation and the fibrous cap: A comparison of symptomatic and asymptomatic individuals. European Journal of Radiology. 70.3. issn:0720048X. [CrossRef]
- Lambin, P. Leijenaar, R.T.H., Deist, T.M., et al, 2017. Radiomics: the bridge between medical imaging and personalized medicine. Nat Rev Clin Oncol. 14(12):749-762. [CrossRef]
- Le, E. Rundo, L. Tarkin, J.M., et al, 2021. Assessing robustness of carotid artery CT angiography radiomics in the identification of culprit lesions in cerebrovascular events. Scientific Reports. Feb 10;11(1):3499. [CrossRef]
- Mahmoud, A. H., Hassan, N., & Mahmoud, A. M. 2019. Three dimensional fluid structure interaction analysis of carotid artery models with different calcification patterns. Annual International Conference of the IEEE Engineering in Medicine and Biology Society. IEEE Engineering in Medicine and Biology Society. Annual International Conference, 2019, 7019–7022. [CrossRef]
- Meddings, Z. Rundo, L. Sadat, U., et al, 2024. Robustness and classification capabilities of MRI radiomic features in identifying carotid plaque vulnerability. British Journal of Radiology. 2024;97(1158):1118-1124. [CrossRef]
- Naylor, A.R., Rantner, B., Ancetti, S., et al. 2023. Editor's Choice - European Society for Vascular Surgery (ESVS) 2023 Clinical Practice Guidelines on the Management of Atherosclerotic Carotid and Vertebral Artery Disease. European journal of vascular and endovascular surgery : the official journal of the European Society for Vascular Surgery, 65(1), 7–111. [CrossRef]
- Naylor, A.R., 2008. Occam's razor: Intervene early to prevent more strokes! Journal of Vascular Surgery. Oct;48(4):1053-9. Epub 2008 Aug 23. [CrossRef] [PubMed]
- Nicolaides, A. N., Kakkos, S. K., Kyriacou, E., et al, 2010. Asymptomatic internal carotid artery stenosis and cerebrovascular risk stratification. Journal of vascular surgery, 52(6), 1486–1496.e14965. [CrossRef]
- Oyejide, A. J., Awonusi, A. A., & Ige, E. O. 2023. Fluid-structure interaction study of hemodynamics and its biomechanical influence on carotid artery atherosclerotic plaque deposits. Medical engineering & physics, 117, 103998. [CrossRef]
- Peiffer, V. Sherwin, S.J. Weinberg, P.D., 2013. Does low and oscillatory wall shear stress correlate spatially with early atherosclerosis? A systematic review. Cardiovascular Research. 99(2):242-250. [CrossRef]
- Porambo, M.E. DeMarco, J.K., 2020. MR imaging of vulnerable carotid plaque. Cardiovasc Diagn Ther. 10(4):1019-1031. [CrossRef]
- Rundo, L.; Tangherloni, A.; Galimberti, S.; et al. GPU-powered Haralick feature extraction on medical images exploiting the full dynamics of gray-scale levels. In Proceedings of the International Conference on Parallel Computing Technologies (PaCT), Almaty, Kazakhstan, 19–23 August 2019; LNCS. Springer: Cham, Switzerland, 2019; Volume 11657, pp. 304–318. [Google Scholar]
- Saba, L. Mallarini, G., 2010. A comparison between NASCET and ECST methods in the study of carotids: evaluation using Multi-Detector-Row CT angiography. European Journal of Radiology. Oct;76(1):42-7. [CrossRef]
- Sadat, U. Taviani, V. Patterson, A.J., et al, 2011. Ultrasmall superparamagnetic iron oxide enhanced magnetic resonance imaging of abdominal aortic aneurysms-a feasibility study. European Journal of Vascular and Endovascular Surgery. 41.2. issn: 10785884. [CrossRef]
- Sadat, U. Teng, Z. Gillard, J.H., 2010. Biomechanical structural stresses of atherosclerotic plaques. Expert Rev Cardiovasc Ther. 8(10):1469-1481. [CrossRef]
- Scicolone, R., Vacca, S., Pisu, F., 2024. Radiomics and artificial intelligence: General notions and applications in the carotid vulnerable plaque. European journal of radiology, 176, 111497. [CrossRef]
- Shaaban, A.M. Duerinckx, A.J., 2000. Wall shear stress and early atherosclerosis: a review. AJR Am J Roentgenol. 174(6):1657-1665. [CrossRef]
- Sun, C. Wee, W.G., 1982. Neighboring Gray Level Dependence Matrix for Texture Classification. Comput. Graph. Image Process. 20, 297. [CrossRef]
- Tang, D. Teng, Z. Canton, G., et al, 2009. Sites of rupture in human atherosclerotic carotid plaques are associated with high structural stresses: an in vivo MRI-based 3D fluid-structure interaction study. Stroke. 40(10):3258-3263. [CrossRef]
- Tang, T.Y. Muller, K.H. Graves, M.J., et al, 2009. Iron oxide particles for atheroma imaging.Arteriosclerosis, Thrombosis, and Vascular Biology. Vol 29, No. 7. [CrossRef]
- Teng, Z., Yuan, J. J Feng, J, et al. 2015. The influence of constitutive law choice used to characterise atherosclerotic tissue material properties on computing stress values in human carotid plaques”. Journal of Biomechanics 48.14 (Nov. 2015), pp. 3912– 3921. issn: 00219290. [CrossRef]
- Teng, Z., Zhang, Y., Huang, Y., et al. 2014. Material properties of components in human carotid atherosclerotic plaques: A uniaxial extension study. Acta Biomaterialia 10.12 (Dec. 2014), pp. 5055–5063. issn: 17427061. [CrossRef]
- Thibault, G. Angulo, J. Meyer, F., 2014. Advanced statistical matrices for texture characterization: application to cell classification. IEEE Trans Biomed Eng. Mar;61(3):630-7. Epub 2013 Oct 4. [CrossRef] [PubMed]
- Tibshirani, R., 1996. Regression Shrinkage and Selection via the Lasso. Journal of the Royal Statistical Society. Series B (Methodological) vol. 58, no. 1, pp. 267–88. JSTOR, http://www.jstor.org/stable/2346178.
- Vacca, S., Scicolone, R., Gupta, A., et al. 2024. Atherosclerotic carotid artery disease Radiomics: A systematic review with meta-analysis and radiomic quality score assessment. European journal of radiology, 177, 111547. [CrossRef]
- van Griethuysen, J.J.M., et al, 2017. Computational Radiomics System to Decode the Radiographic Phenotype. Cancer Res. Nov 1;77(21):e104-e107. [CrossRef] [PubMed] [PubMed Central]
- Weinberg, P.D., 2022. Haemodynamic Wall Shear Stress, Endothelial Permeability and Atherosclerosis-A Triad of Controversy. Front Bioeng Biotechnol. 10:836680. Mar 7. [CrossRef]
- World Health Organization, 2021. “Cardiovascular diseases (CVDs) Fact Sheet.” Technical report.
- Zhao, X., et al, 2017. Chinese Atherosclerosis Risk Evaluation (CARE II) study: a novel cross-sectional, multicentre study of the prevalence of high-risk atherosclerotic carotid plaque in Chinese patients with ischaemic cerebrovascular events. Stroke Vascular Neurology. Feb 24;2(1):15-20. [CrossRef] [PubMed] [PubMed Central]
Figure 1.
Left: 3D wall results. Right: Corresponding unfurled WSS stress map based on the internal carotid artery, indicating a maximum value of 0.016 kPa.
Figure 1.
Left: 3D wall results. Right: Corresponding unfurled WSS stress map based on the internal carotid artery, indicating a maximum value of 0.016 kPa.
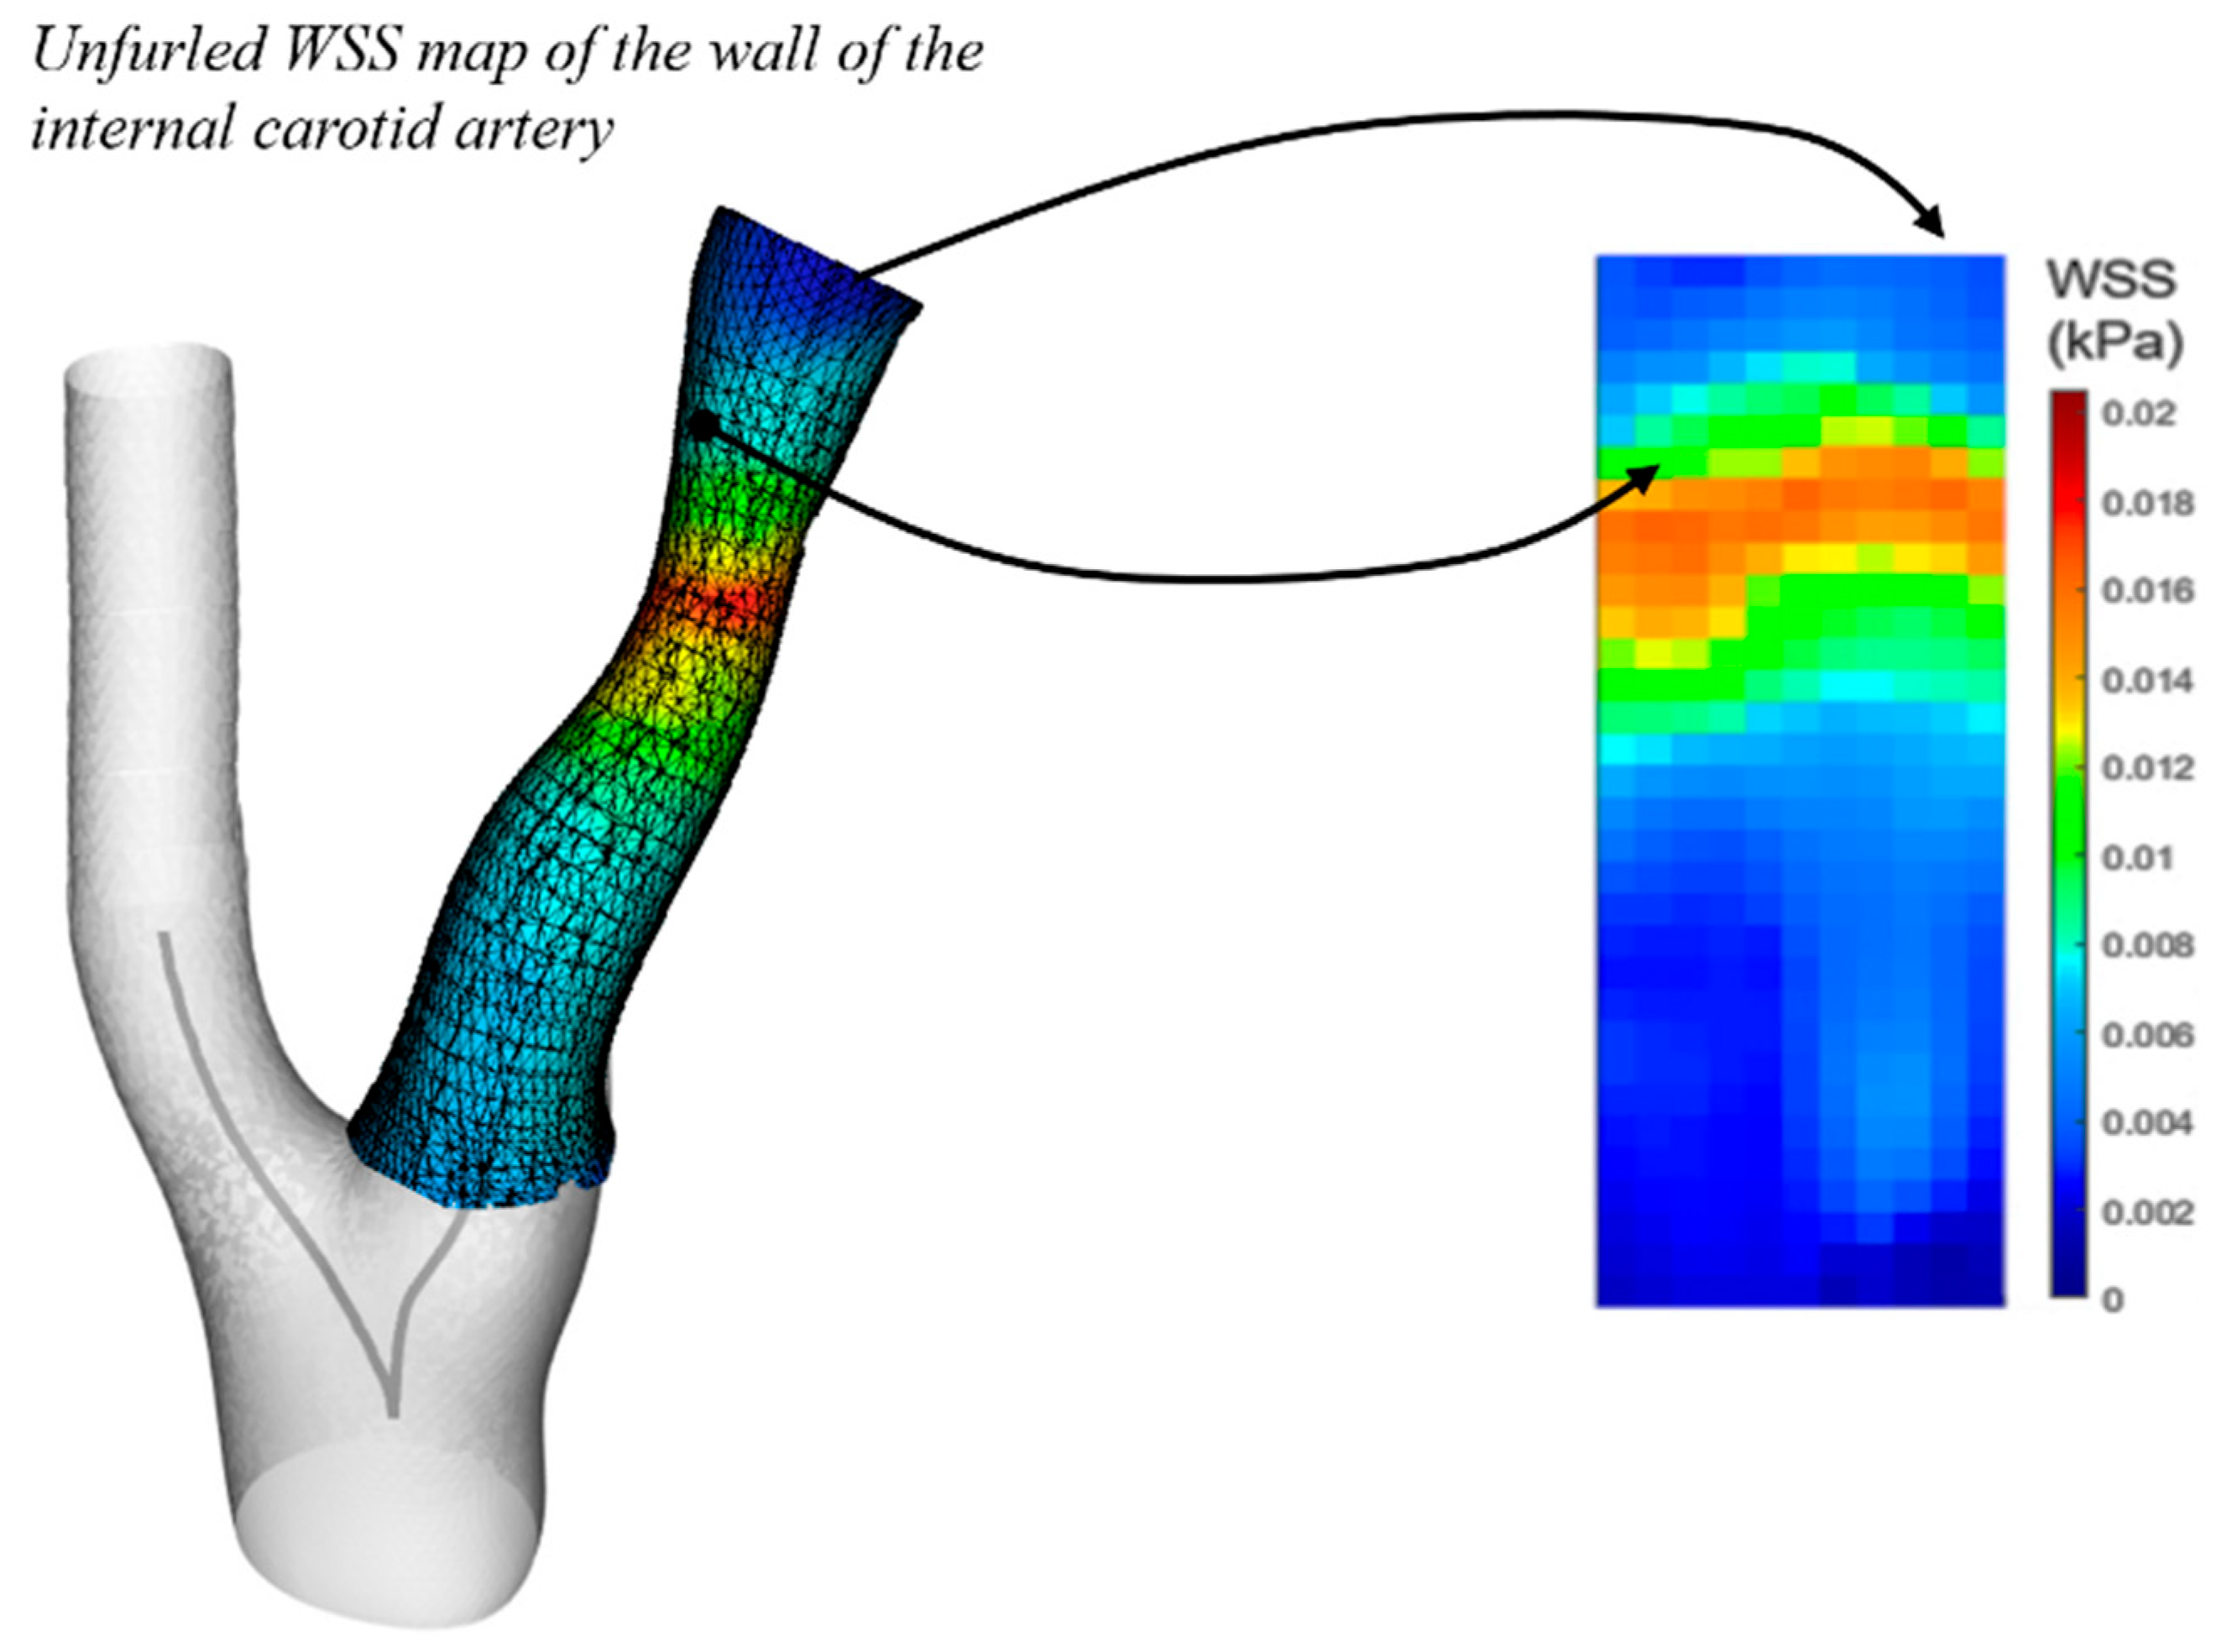
Figure 2.
Left: 3D model on the indicating slice-wise stress maps. Inset: one such VSS stress map with critical values of 80 kPa near to the plaque shoulder and 173 kPa near to the carotid bifurcation.
Figure 2.
Left: 3D model on the indicating slice-wise stress maps. Inset: one such VSS stress map with critical values of 80 kPa near to the plaque shoulder and 173 kPa near to the carotid bifurcation.

Figure 3.
Left: Predictive modelling procedure schematic. 2D image extraction was used for mapped wall results (WSS and IR), and 3D image feature extraction was used for standard radiomics. Right: leave-one-out cross validation schematic. 5-fold leaves out 20 percent of the original dataset.
Figure 3.
Left: Predictive modelling procedure schematic. 2D image extraction was used for mapped wall results (WSS and IR), and 3D image feature extraction was used for standard radiomics. Right: leave-one-out cross validation schematic. 5-fold leaves out 20 percent of the original dataset.
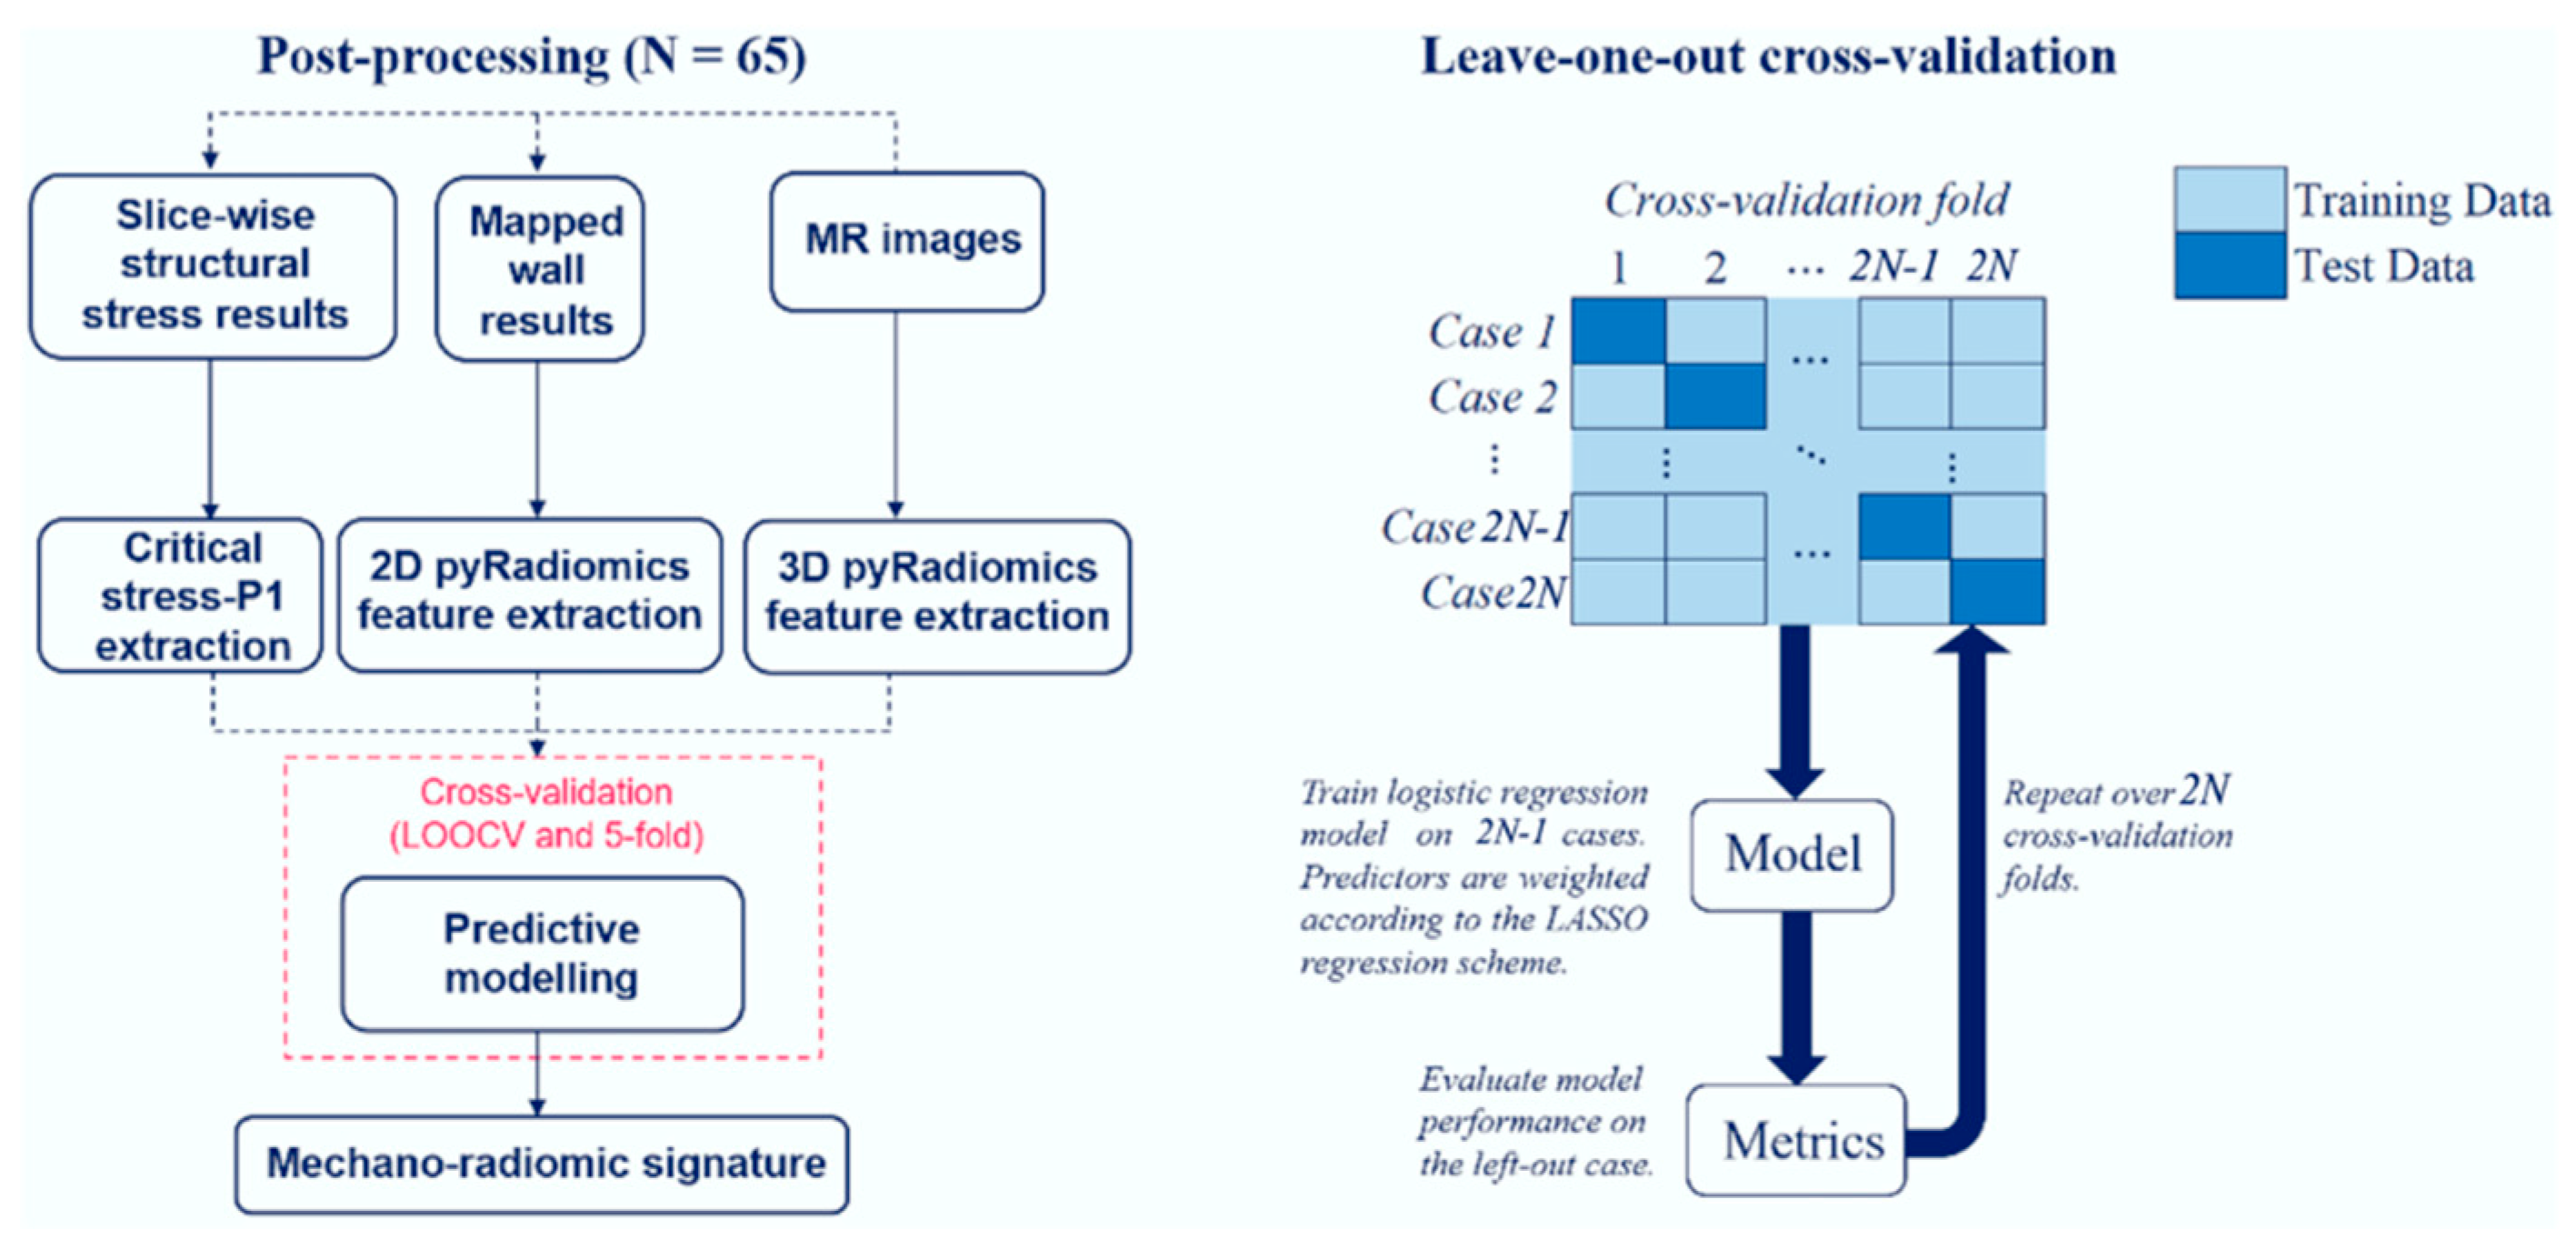
Figure 4.
Receiver operating characteristic plots of the radiomic model, mechanics model, and mechano-radiomic model predictive performance.
Figure 4.
Receiver operating characteristic plots of the radiomic model, mechanics model, and mechano-radiomic model predictive performance.
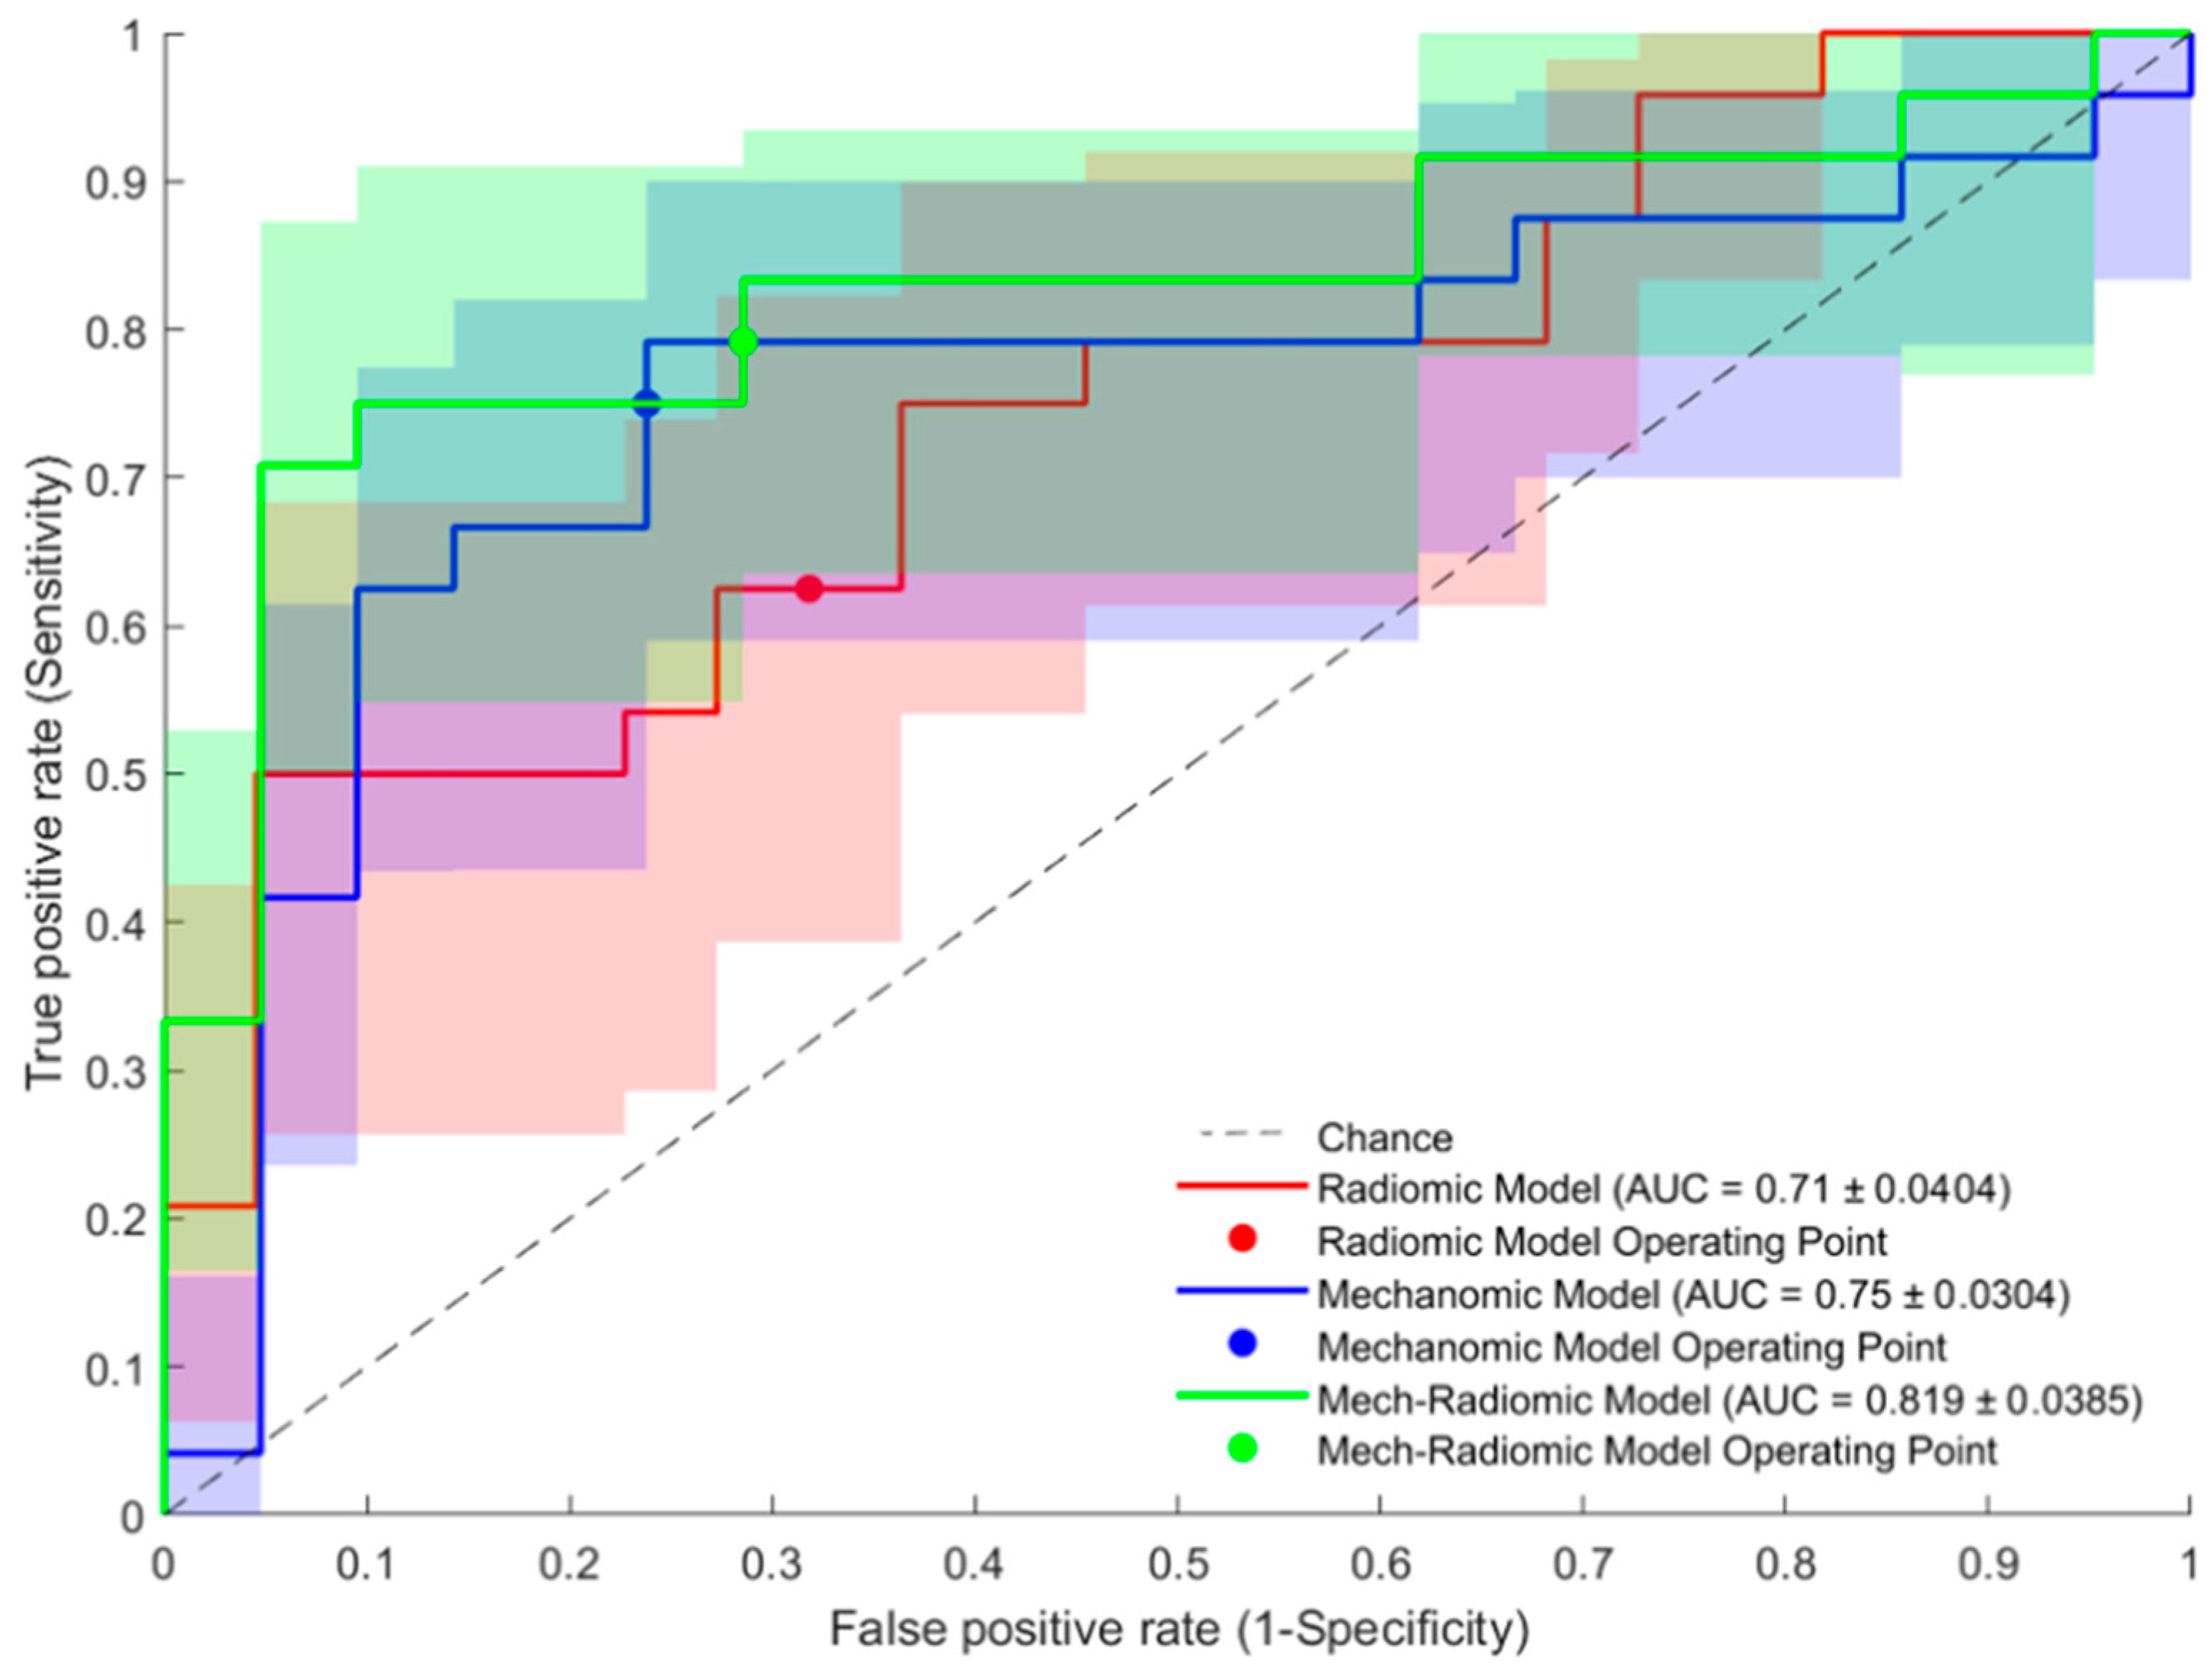

Table 1.
Baseline demographics of the study cohort, including: blood pressure profile; cardiovascular risk factors; lipid profile; and cardiovascular medication. SBP = Systolic blood pressure, DBP = Diastolic blood pressure, BMI = Body mass index, CVD = Cardiovascular disease.
Table 1.
Baseline demographics of the study cohort, including: blood pressure profile; cardiovascular risk factors; lipid profile; and cardiovascular medication. SBP = Systolic blood pressure, DBP = Diastolic blood pressure, BMI = Body mass index, CVD = Cardiovascular disease.
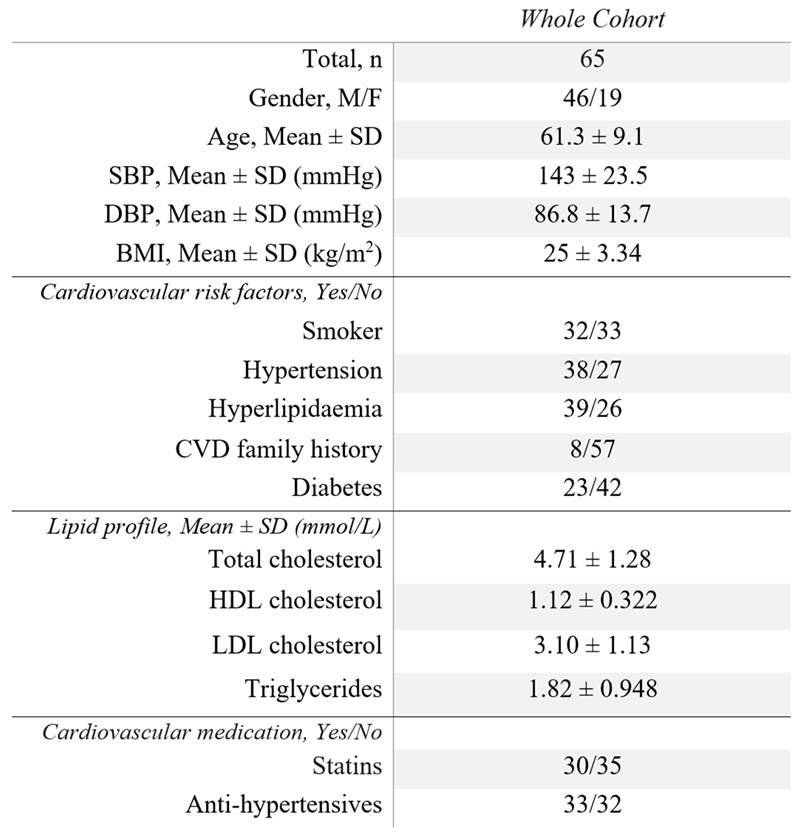
Table 2.
Models evaluated by training a model on all but one case, and testing on the hold-out case (LOOCV). PPV = Positive predictive value, NPV = Negative predictive value.
Table 2.
Models evaluated by training a model on all but one case, and testing on the hold-out case (LOOCV). PPV = Positive predictive value, NPV = Negative predictive value.
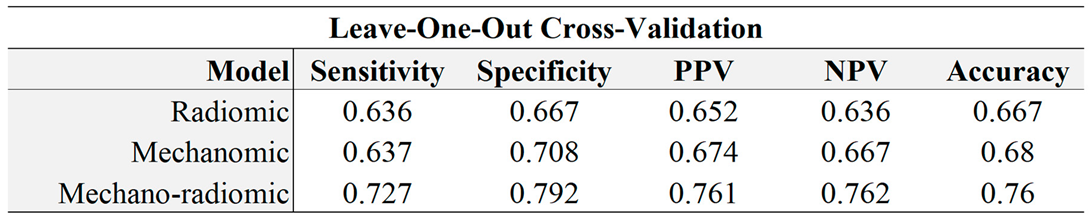
Table 3.
Models evaluated by training a model from four fifths of the data, and testing on the remainder of the dataset as per 5-fold cross-validation. PPV = Positive predictive value, NPV = Negative predictive value.
Table 3.
Models evaluated by training a model from four fifths of the data, and testing on the remainder of the dataset as per 5-fold cross-validation. PPV = Positive predictive value, NPV = Negative predictive value.
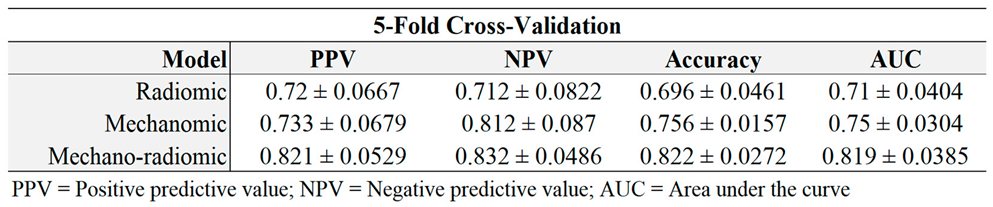
Table 4.
Feature co-efficients with a 95% confidence interval, within the radiomic model.
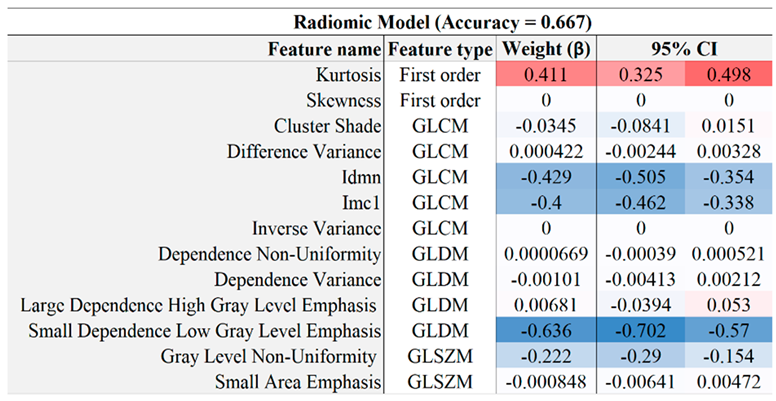
Table 5.
Mechanics model feature co-efficients with a 95% confidence interval.
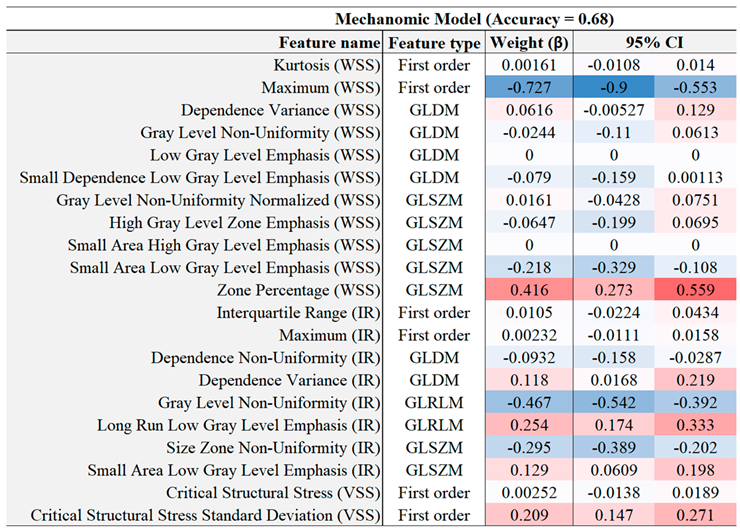
Table 6.
Combined model feature co-efficients with a 95% confidence interval.
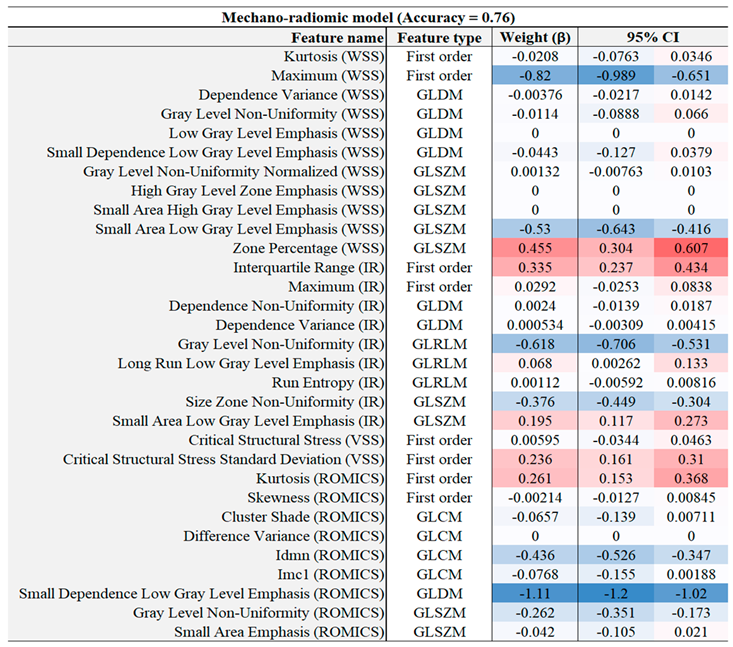
Table 7.
Features and average odds ratios (with 95% confidence intervals) in the combined mechanics and radiomics models.
Table 7.
Features and average odds ratios (with 95% confidence intervals) in the combined mechanics and radiomics models.
Disclaimer/Publisher’s Note: The statements, opinions and data contained in all publications are solely those of the individual author(s) and contributor(s) and not of MDPI and/or the editor(s). MDPI and/or the editor(s) disclaim responsibility for any injury to people or property resulting from any ideas, methods, instructions or products referred to in the content. |
© 2025 by the authors. Licensee MDPI, Basel, Switzerland. This article is an open access article distributed under the terms and conditions of the Creative Commons Attribution (CC BY) license (http://creativecommons.org/licenses/by/4.0/).
Copyright: This open access article is published under a Creative Commons CC BY 4.0 license, which permit the free download, distribution, and reuse, provided that the author and preprint are cited in any reuse.


