
Submitted:
07 May 2025
Posted:
13 May 2025
You are already at the latest version
Abstract
China’s accelerating industrialization has led to worsening air pollution, characterized by recurrent haze episodes. Accurate quantification of PM2.5 distribution is crucial for air quality assessment and public health management. Although traditional prediction models can effectively identify PM2.5 concentration fluctuations with moderate accuracy, their dependence rely heavily on extensive ground-based monitoring station data, limiting their applicability in areas with sparse monitoring coverage. To address this limitation, this study proposes a novel algorithm for high-precision PM2.5 concentration prediction, termed VDMS (Vision Transformer with DLSTM Multi-Head Self-Attention and Self-supervision). Based on the traditional Vision Transformer (ViT) architecture, VDMS incorporates a Double-Layered Long Short-Term Memory (DLSTM) network and a Multi-Head Self-Attention mechanism to enhance the model’s capacity to capture temporal sequence features and global dependencies. These enhancements contribute to greater stability and robustness in feature representation, ultimately improving prediction performance. Cross-validation experimental results show that the VDMS model outperforms benchmark models in PM2.5 concentration prediction tasks, achieving a coefficient of determination (R²) of 0.93, a root mean square error (RMSE) of 4.05 µg/m³, and a mean absolute error (MAE) of 3.23 µg/m³. Furthermore, experiments conducted in areas with sparse ground monitoring stations demonstrate that the model maintains high predictive accuracy, further validating its applicability and generalization capability in data-limited scenarios. Moreover, the VDMS model adopts a modular design, offering strong scalability that allows its architecture to be adjusted according to specific requirements. This adaptability renders it suitable for monitoring various atmospheric pollutants, providing essential technical support for precise environmental management and air quality forecasting.
Keywords:
PM2.5 prediction
; deep learning
; ViT
; contrastive learning
; multi-head self-attention
; environmental management
1. Introduction
Smog constitutes a serious environmental hazard, leading to degraded air quality, increased economic losses, and higher incidences of lung cancer and mortality [1,2,3]. In recent years, the frequency of smog events in China has risen, making the mitigation of fine particulate matter (PM2.5) a formidable challenge that demands considerable effort [4,5]. PM2.5—particles with diameters of 2.5 m or less—is recognized as a major contributor to smog [6]. Research indicates that PM2.5 not only exerts adverse effects on physical health, potentially causing asthma, bronchitis, and other cardiovascular diseases [7,8,9], but also negatively influences mental health [10]. Given China’s vast population, the monitoring and control of PM2.5 are critically important. High concentrations of PM2.5 further threaten the environment and agriculture by obstructing sunlight absorption by plants and weakening photosynthetic processes [11]. Effective monitoring of the concentration and spatiotemporal distribution of PM2.5 is essential to protect human health and improve living conditions. Although the government initially intended to improve PM2.5 surveillance through an extensive monitoring network [12], the rapid pace of urbanization and industrialization has outstripped the expansion of monitoring stations. The limited and uneven distribution of these stations fails to capture adequately the spatial and temporal heterogeneity of PM2.5 in China [13], thus challenging the effective monitoring and evaluation of its health effects. Therefore, acquiring high-resolution distribution maps of PM2.5 is essential to plan and implement effective pollution control measures. To address these challenges, advanced predictive models have been developed that integrate the capabilities of Vision Transformer (ViT) with double-layered LSTM (DLSTM) networks and multi-head self-attention mechanisms. This hybrid approach improves the modeling of temporal dynamics and global dependencies, thereby improving prediction accuracy even in regions with sparse monitoring data.
Previous studies have demonstrated that the integration of remote sensing data with statistical models is an effective approach to estimate PM2.5 concentrations [14]. Aerosol Optical Depth (AOD) derived from remote sensing products is often considered highly correlated with PM2.5 levels and has been widely utilized for PM2.5 simulation [15,16]. AOD-based products, using satellite remote sensing technology, have become a common tool for estimating PM2.5 concentrations [17,18,19]. In recent years, the moderate resolution imaging spectroradiometer (MODIS) AOD product has received significant attention due to its improved retrieval accuracy and finer spatial resolution [20]. Some studies have combined AOD data with linear mixed-effects models to enhance the spatial resolution of PM2.5 predictions [21,22]. However, these methods face several challenges in practical applications. AOD retrieval algorithms are highly susceptible to factors such as cloudy weather, snow coverage, and high surface reflectivity, which can lead to non-random missing data [23], resulting in high data loss rates that complicate PM2.5 estimation [24,25]. This data incompleteness inevitably introduces sampling biases, negatively impacting the accuracy of PM2.5 predictions [26]. Although traditional PM2.5 prediction methods based on ground monitoring data perform well in feature extraction, they often rely heavily on ground station data, making it difficult to model effectively the influence of geographic and meteorological factors on PM2.5 distribution. Furthermore, despite advancements in deep learning techniques that enhance the model’s self-learning and feature extraction abilities, challenges remain in effectively integrating multi-source data and reducing uncertainties caused by data gaps, particularly in complex spatiotemporal environments.
To address the influence of meteorological variations on experimental results and improve the precision and stability of PM2.5 concentration estimates, the present study integrates random trees embedding (RTE) with a random forest (RF) model. This combined approach imputes missing values in AOD datasets, thus increasing their spatial coverage, and incorporates additional spatiotemporal predictors to optimize PM2.5 estimation [26,27]. Furthermore, to reduce the reliance on ground-based monitoring data, we propose an innovative framework that synergistically merges several advanced methodologies. At its core, a ViT architecture is used for its robust self-attention capabilities, which efficiently extract spatial features from satellite imagery. This facilitates the capture of complex, long-range dependencies inherent in urban expansion and pollution source distributions, thereby improving prediction accuracy when integrated with meteorological data. Complementing the ViT, a DLSTM is utilized to model the temporal dynamics of PM2.5 concentrations. By stacking two LSTM layers, the model constructs a multilayer time-series processing architecture that is particularly adept at capturing long-term meteorological trends. In addition, the incorporation of the SimCLR self-supervised learning algorithm enables robust feature extraction from unlabeled data through contrastive learning. This enhances the generalizability of the model and increases its resilience to environmental variability. The framework further integrates a multi-head self-attention mechanism, which plays a pivotal role in fusing heterogeneous data sources such as meteorological variables and satellite imagery. By automatically identifying and prioritizing the most prominent features across these modalities, the mechanism improves the model’s capacity to capture complex spatiotemporal relationships. The adaptive calibration of predictive factors through attention-based interactions has been widely demonstrated to enhance both model performance and interpretability [28]. For example, attention-enhanced convolutional neural networks (CNNs) have shown improved classification performance by focusing on the most informative regions within images [29,30]. Similarly, in PM2.5 concentration forecasting, the integration of meteorological factors such as temperature, humidity, and wind speed (WS) with geographic information is essential to accurately model pollutant dispersion. In summary, the integration of ViT, DLSTM, multi-head self-attention, and SimCLR within our modeling framework strengthens spatial feature extraction and temporal pattern recognition and significantly enhances prediction accuracy and robustness, particularly in scenarios with sparse or difficult-to-label data.
2. Data
2.1. Ground-Level PM2.5 Data
Ground-based station data were obtained from the China National Environmental Monitoring (http://www.cnemc.cn/), covering the period from January 1, 2017, to December 31, 2022, with a temporal resolution of one hour (Figure 1). To better capture the spatiotemporal variations in PM2.5 concentrations, near-surface daily average PM2.5 data were selected as the primary research variable. Compared with hourly PM2.5 data, daily averages contain substantially less noise, providing greater stability during processing and reducing the interference of short-term meteorological fluctuations or transient factors. This approach ensures a more accurate depiction of overall PM2.5 variation trends. Moreover, as reported by Shen et al. [31], daily average PM2.5 levels tend to receive more attention than hourly data. Using hourly measurements would limit satellite-based PM2.5 retrievals to specific times, which could affect the practical applicability of the model. Additionally, according to the National Ambient Air Quality Standards (NAAQS) established by the U.S. Environmental Protection Agency (EPA), PM2.5 standards and attainment criteria are generally based on daily or annual averages rather than hourly measurements. To ensure data quality, station records with fewer than 12 hours of observations per day due to equipment problems were excluded. After data cleaning, the daily average PM2.5 concentrations were calculated for each monitoring station.
2.2. AOD Data
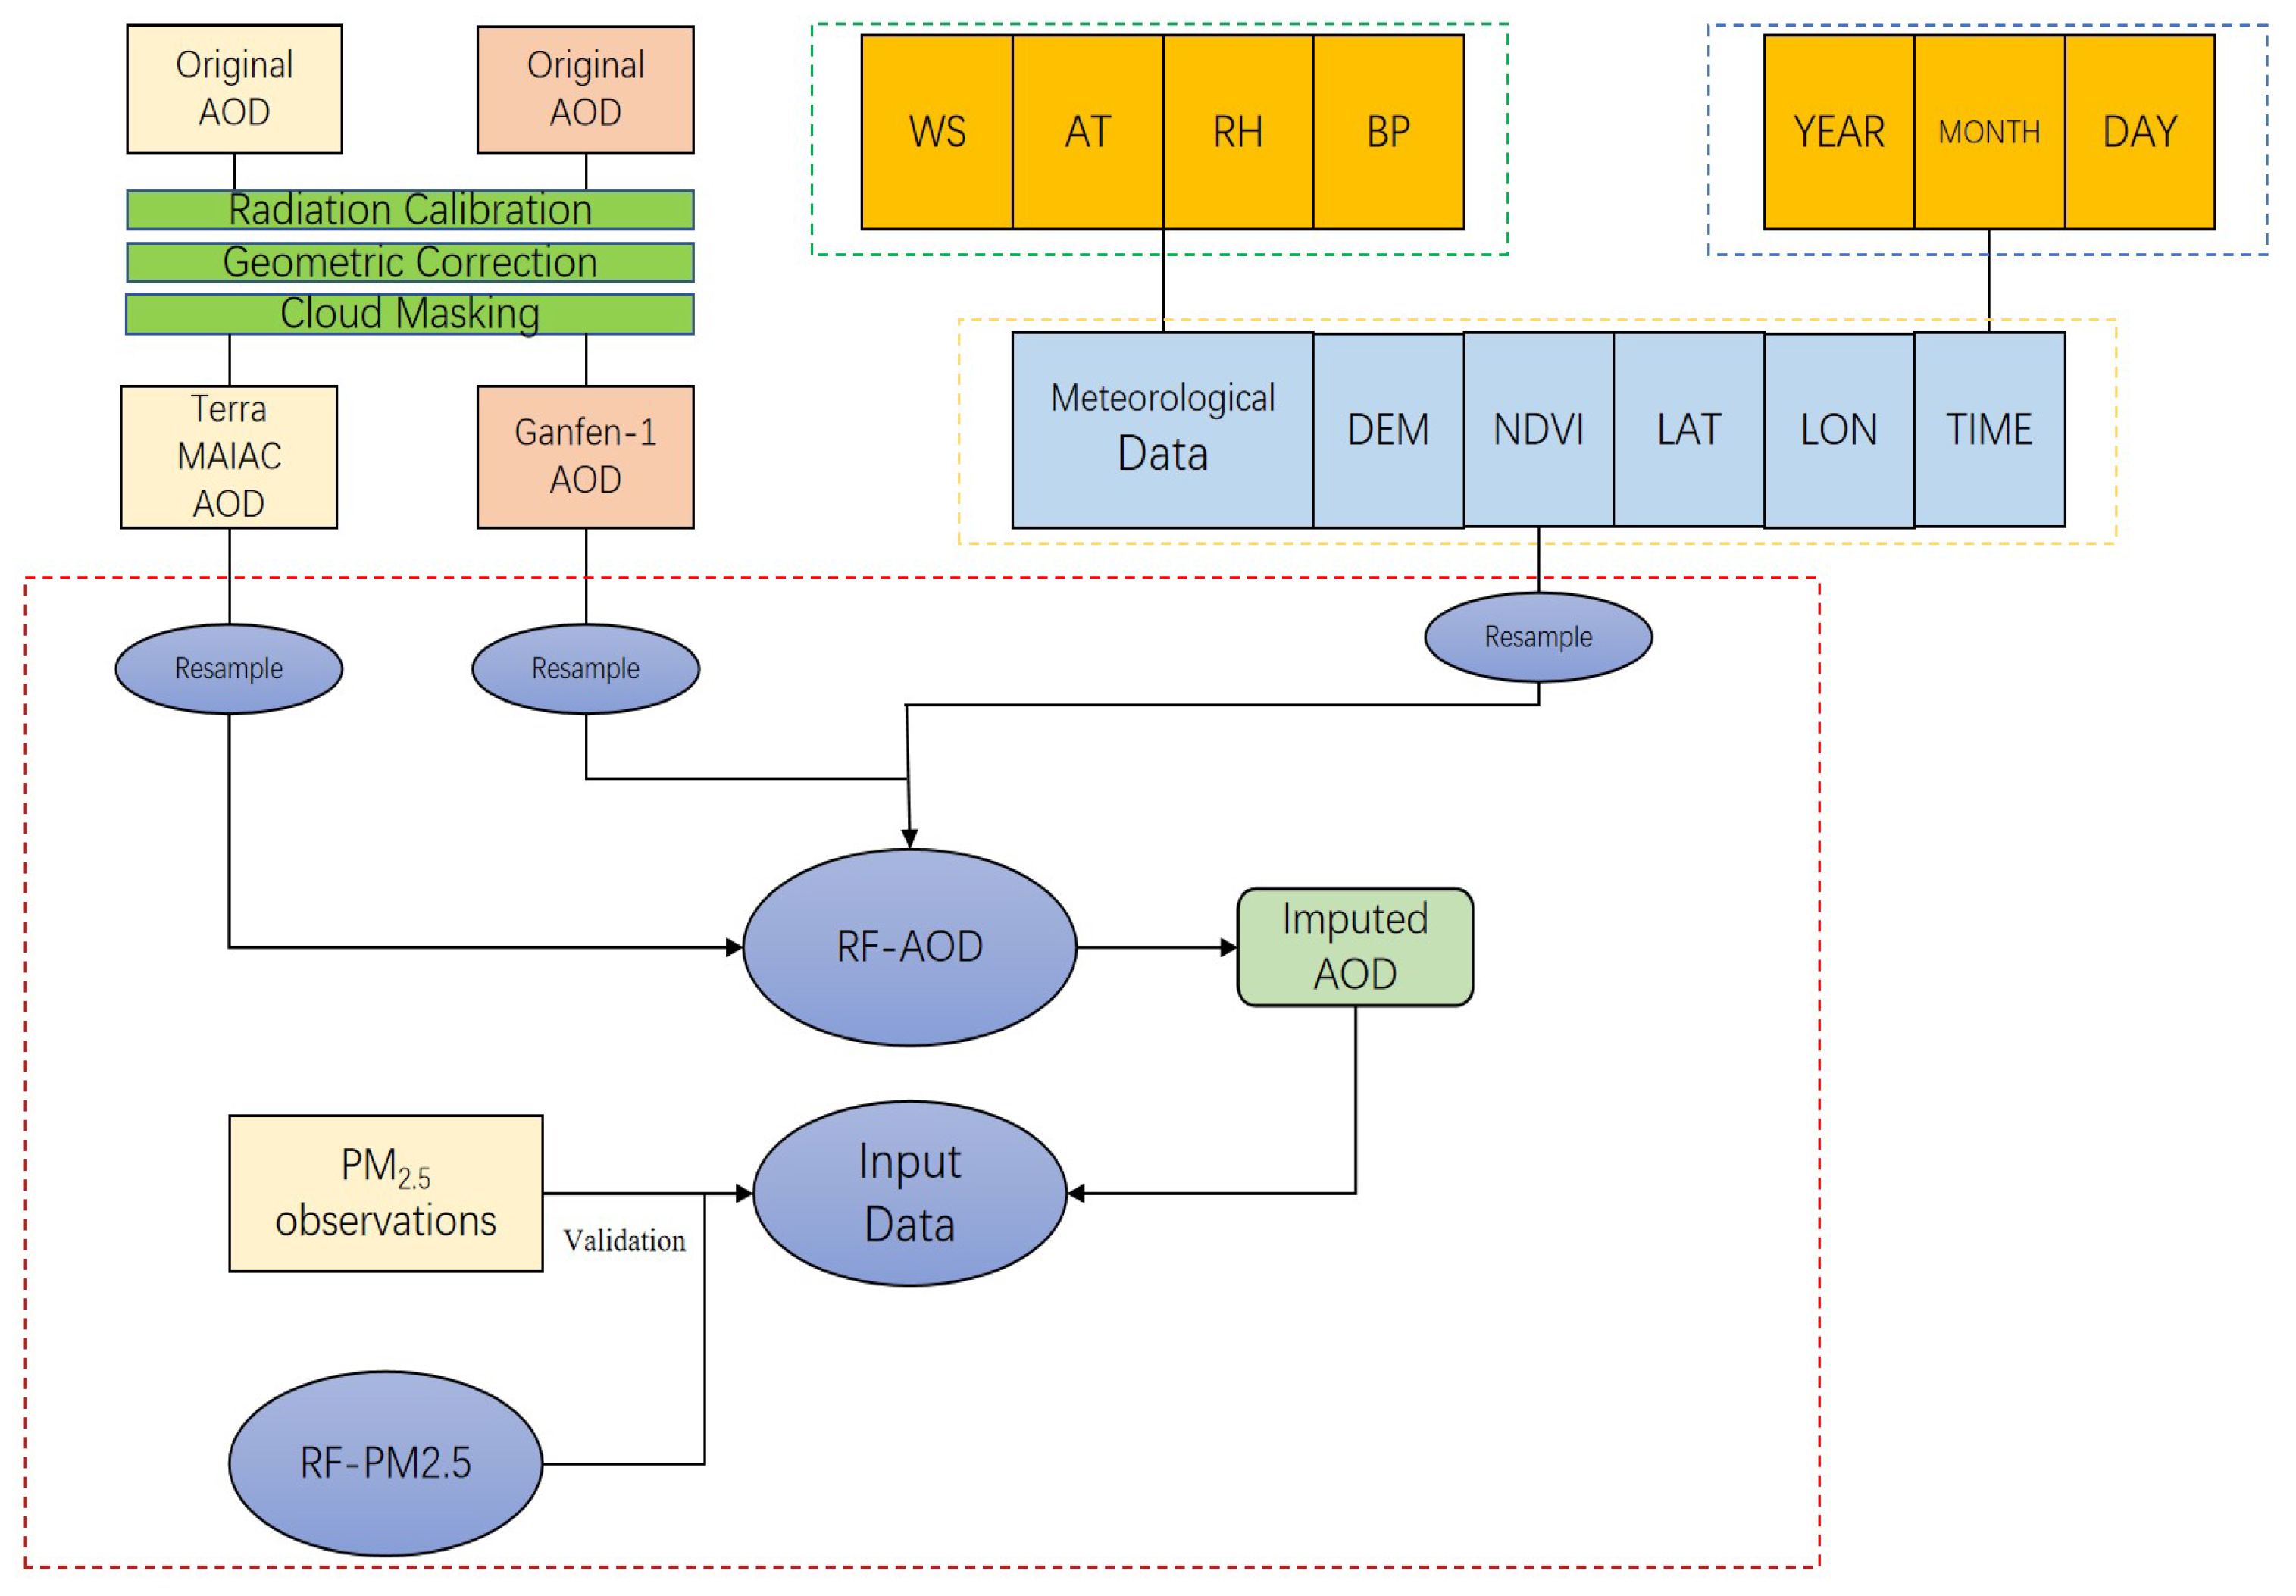
Gaofen satellites, developed by China, are a series of high-resolution remote sensing satellites designed to provide high-quality data for a range of applications including environmental monitoring, resource management, urban planning, and disaster surveillance. In this study, Gaofen-1 AOD data were obtained from the China Remote Sensing Satellite Ground Station (http://www.cresda.com), while the multi-angle implementation of atmospheric correction (MAIAC) AOD product with a spatial resolution of 1 km × 1 km was obtained from the MODIS Terra satellite (https://ladsweb.modaps.eosdis.nasa.gov/). Before use, raw AOD data, underwent preprocessing steps, including reprojection, mosaicking, clipping, and rescaling. To improve retrieval accuracy, the dark pixel method [32] was applied to correct for atmospheric interference. Interpolation was performed to achieve a more continuous AOD dataset. Two AOD datasets, aligned to the same spatial resolution, were subsequently merged to generate a comprehensive daily AOD time series. Finally, meteorological data, latitude, longitude, and time information were integrated with the satellite data to form a complete dataset for subsequent analysis.
2.3. Auxiliary Data
Multiple auxiliary datasets were integrated to support subsequent analyses. Meteorological data were obtained from the China Meteorological Administration Monitoring Data Network, providing baseline and daily observations from surface weather stations. These datasets, characterized by a spatial resolution of 1 km × 1 km, include key atmospheric parameters such as WS, air temperature (AT), relative humidity (RH), and atmospheric pressure (BP). High-resolution meteorological inputs are critical to accurately capture the spatiotemporal variability within the study area. Complementing these observations, normalized difference vegetation index (NDVI) data were sourced from the MOD13A3 vegetation product, available via NASA’s data repository. The NDVI dataset, with a 1 km × 1 km spatial resolution and monthly temporal resolution, provides valuable insights into vegetation dynamics, serving as a proxy for assessing land surface conditions and ecological processes. Additionally, a digital elevation model (DEM) was extracted from the Advanced Spaceborne Thermal Emission and Reflection Radiometer (ASTER) Global Digital Elevation Model Version 1. This dataset, featuring a 30 m spatial resolution, offers detailed topographic information that is indispensable for understanding terrain effects on meteorological conditions and vegetation distribution. By synthesizing these diverse datasets, the study constructs a robust framework for analyzing environmental interactions, ultimately enhancing the precision of modeling and interpretation of observed phenomena.
2.4. Data Preprocessing
In PM2.5 concentration prediction studies, rigorous data preprocessing is required to improve the quality and consistency of the input data for the model and to fully utilize the combined information from remote sensing satellite imagery and meteorological observations. For satellite imagery, radiometric calibration, geometric correction, and cloud masking are essential steps to minimize observational errors and ensure the physical authenticity of the images. Radiometric calibration converts raw digital numbers into physical radiance or surface reflectance, eliminating the effects of sensor gain, offset, and atmospheric conditions, and ensuring comparability of images across different times and locations. Geometric correction, aligns the images with a standard geographic coordinate system using ground control points (GCPs) and mathematical transformation models to ensure accurate matching with ground-based observations. Because cloud cover interferes with surface information acquisition, the Fmask algorithm is used in combination with shortwave infrared (SWIR) and thermal infrared (TIR) bands to identify cloud-contaminated pixels. Gaussian interpolation is then applied to fill cloud-occluded regions, mitigating the effects of data loss on subsequent analyses.
Meteorological data preprocessing includes data cleaning, spatial interpolation, and temporal alignment to ensure data integrity and accuracy. Meteorological observations often contain missing values and outliers; thus, the Z-score method is applied to remove outliers, and linear interpolation is used to fill missing values, reducing observational errors. Given the differences in temporal resolution between satellite imagery and meteorological data, temporal alignment is necessary. In this study, high-temporal-resolution meteorological data were downsampled using mean aggregation, and linear interpolation was performed based on the observation times of the satellite imagery. This ensures temporal consistency between the two datasets and improves the coherence and quality of model inputs.
Because of inconsistencies among various types of data, multisource heterogeneous data were integrated into a unified input feature matrix. This integration leverages the complementary advantages of different datasets, improving the predictive accuracy of the model. Given the differences in spatial resolution, a (∼1 km × 1 km) grid was established to facilitate data integration. All datasets were resampled to resolution using bilinear interpolation. Compared with the nearest-neighbor method, bilinear interpolation produces smoother interpolated values [33]. Daily average PM2.5 concentrations were assigned to the corresponding grid cells. If a grid contained two or more monitoring stations, their average value was calculated to represent the PM2.5 concentration within that cell.
3. Methods
The VDMS model represents an advanced development based on the standard ViT architecture. Initially, the model integrates the self-supervised SimCLR algorithm with ViT, followed by the incorporation of Long Short-Term Memory (LSTM) networks and multi-head self-attention mechanisms, resulting in the novel VDMS model. The core strength of VDMS lies in its ability to fuse multimodal data (i.e., images and meteorological variables) and extract features at multiple levels while effectively modeling the relationships between these features. This enhances both the robustness and expressive power of the model, making it substantially more powerful than traditional PM2.5 prediction methods such as CNNs or standalone LSTM models. The overall structure of the VDMS model can be represented as:
In this formulation, denotes the structural function of the VDMS model. The independent variables include AOD, DEM, NDVI, WS, AT, RH, BP, longitude (LON), latitude (LAT) and time-related variables (YEAR, MONTH, DAY). The dependent variable is the predicted PM2.5 concentration. By integrating this extensive set of variables, VDMS provides sophisticated and accurate PM2.5 predictions, accounting for both environmental and temporal dynamics.
A DLSTM network is introduced within the model to improve the representation of temporal sequence features. As a specialized form of recurrent neural network (RNN), LSTM addresses the challenges of vanishing and exploding gradients [34], making it suitable for modeling long-term dependencies. In the proposed model, ViT combined with SimCLR pretraining is used to extract high-dimensional image features. These features are then fed into a double-layered LSTM network for deeper temporal modeling. Compared with a single-layered LSTM, a double-layered LSTM (number of layers = 2) offers greater representational power, enabling more detailed extraction of complex temporal relationships [35]. The hidden layer dimension of the LSTM is set to 256 to balance sufficient capacity with computational efficiency and to mitigate overfitting. Because the temporal sequence length of the input features is relatively short, an input sequence length of 1 is adopted, allowing the LSTM to perform a nonlinear transformation rather than traditional sequential prediction. The final output of the LSTM is its last hidden state, which serves as the input to the fully connected layer. This approach preserves critical feature information while reducing computational complexity [34]. By incorporating LSTM, the model strengthens the temporal dependency of image features, and enhances nonlinear modeling capabilities, resulting in more stable and robust feature representations, particularly for PM2.5 prediction tasks where nonlinear effects are prominent.
The output from the LSTM layer is then passed through a multi-head self-attention mechanism to improve the model’s ability to capture global features. Self-attention, originally introduced by the Transformer architecture [28], enables the model to compute weighted relationships between different input positions, thereby capturing long-range dependencies. In VDMS, a 4-head multi-head attention mechanism (attention-heads = 4) is used, allowing the model to focus on different aspects of the feature space simultaneously [28]. The feature dimension input into the multi-head attention layer is set to 256, consistent with the hidden dimension of the LSTM, ensuring smooth information flow across the model components. The self-attention operation is mathematically described by the following equation:
In this formulation, the query (Q), key (K), and value (V) matrices are all derived from the same source, that is, query = key = value = lstm_output. This design enables the modeling of global relationships within the features processed by the LSTM. The attention mechanism thus operates within a single feature set effectively, capturing interdependencies among features. The final output of the attention mechanism retains a dimension of 256, ensuring consistent output formatting for subsequent layers, including LayerNorm and the fully connected layers. By incorporating the multi-head self-attention mechanism, the model’s capacity to capture global dependencies is substantially improved. This enhancement enables the model to learn long-range relationships between different features across time steps. Moreover, through the interaction of multiple attention heads, the model integrates information across diverse feature dimensions, further improving predictive accuracy. In contrast to directly using the LSTM outputs, the application of multi-head self-attention strengthens feature representations by reducing potential information loss, thereby ensuring that PM2.5 predictions are more precise and reliable [28].
The proposed model architecture includes three fully connected layers to facilitate the deep extraction and seamless integration of fused image and meteorological features, ultimately achieving precise regression predictions. The input to this system is a composite feature set constructed by concatenating the outputs of the ViT, which processes spatial image data, with representations derived from a two-layer LSTM network that captures the temporal dynamics of transformed meteorological attributes. This heterogeneous input is systematically processed through a three-layer fully connected framework to map it to a single predictive output. Specifically, the first fully connected layer projects the high-dimensional input into an intermediate dimensional space, initiating the integration of features. The second fully connected layer further compresses these features, refining the abstraction of the fused data. The third fully connected layer synthesizes the compressed representation into a single output value, producing the regression prediction. This three-tier configuration enables hierarchical dimensionality reduction, a critical mechanism for consolidating multi-source data, thereby improving the model’s ability to capture complex nonlinear relationships while maintaining an optimal balance between expressive capacity and generalization to prevent overfitting. Experimental evaluations demonstrate that this tri-layer design outperforms simpler single- or double-layer architectures, achieving superior predictive accuracy by effectively compressing high-dimensional heterogeneous inputs and modeling complex feature interactions. Following the first and second fully connected layers, the Rectified Linear Unit (ReLU) activation function is applied, defined as:
The incorporation of ReLU introduces nonlinearity by nullifying negative values while preserving positive ones. This transformation enables the network to learn complex patterns within the input features. A key advantage of ReLU lies in its constant derivative for positive inputs, mitigating the vanishing gradient problem and ensuring stable and efficient gradient propagation during backpropagation. Additionally, ReLU promotes sparsity within the network by zeroing inactive neurons, thereby reducing computational overhead and enhancing model efficiency and performance.
Figure 3.
Meteo Data Fusion.
4. Results
4.1. Model Validation and Comparison
Cross-validation (CV) is a widely used method for evaluating the predictive capability and robustness of models. In this study, the performance of the VDMS model was validated using ten-fold CV based on both samples and sites. The dataset was randomly partitioned into ten subsets; for sample-based CV (Sam-CV), each subset comprised 10% of the samples, while for station-based CV (Sta-CV), each subset consisted of 10% of the ground monitoring stations. The model was fitted over ten iterations, ensuring that all data were tested: in each iteration, one subset was designated as the test set while the remaining subsets served as the training set. Evaluation metrics included the coefficient of determination (R²), root mean square error (RMSE), and mean absolute error (MAE). During the experiments, the learning rate was fine-tuned, and an early stopping strategy was employed to ensure that the spatial RMSE reached a local minimum. A small batch size was utilized because larger batch sizes were observed to lead the model to converge to sharp local minima [36]. Given the overparameterization of the model, a stochastic gradient descent (SGD) optimizer with momentum was selected, with a weight decay of 0.1 [37]. Following the relationship between batch size and momentum coefficient proposed by Smith and Le [38], the momentum coefficient was set to 0.6 to further optimize the training process.
4.2. Model Estimation
Figure 4 presents a density scatter plot evaluating the performance of the VDMS model in air quality prediction, comparing scenarios with and without the incorporation of meteorological variables. Two CV techniques were used: Sam-CV and Sta-CV. When meteorological factors were integrated, the model exhibited superior predictive accuracy. In the Sam-CV setting (Figure 4(a)), the R² reached 0.93, with an RMSE of 4.05 µg/m³ and a MAE of 3.23 µg/m³. In the Sta-CV setting (Figure 4(b)), the corresponding values were an R² of 0.88, an RMSE of 5.57 µg/m³, and a MAE of 4.21 µg/m³. In contrast, excluding meteorological factors resulted in decreased performance. Under the Sam-CV approach (Figure 4(c)), the R² declined to 0.73, with an RMSE of 5.79 µg/m³ and a MAE of 4.61 µg/m³, whereas the Sta-CV approach (Figure 4(d)) yields an R² of 0.69, an RMSE of 7.96 µg/m³, and a MAE of 6.01 µg/m³. These results highlight the substantial improvement attributable to the incorporation of meteorological factors, particularly under the Sam-CV configuration where the R² increased by 27.4%, and the RMSE and MAE decreased by 30.1% and 29.9%, respectively. These findings demonstrate the critical role of meteorological data in refining the VDMS model’s air quality predictions.
Table 1 shows that, compared with CNN, SimCLR, and the ViT model, the VDMS model exhibits superior performance, as evidenced by a lower RMSE and higher R². Specifically, VDMS achieves an R² of 0.88, an RMSE of 4.05 µg/m³, and a MAE of 3.23 µg/m³. Table 2 further indicates that incorporating an LSTM module into the conventional ViT model increased the R², RMSE, and MAE to 0.58, 7.64 µg/m³, and 5.23 µg/m³, respectively. Although this incorporation provided some improvement, the enhancement was relatively limited. Subsequent introduction of a double-layered LSTM significantly improved performance, with R², RMSE, and MAE values rising to 0.73, 6.14 µg/m³, and 4.77 µg/m³, respectively, demonstrating a marked improvement over the single-layer LSTM. Finally, after the integration of a multi-head self-attention mechanism and a SimCLR module, the performance of the model was further optimized, with R², RMSE, and MAE improving from 0.85, 4.54 µg/m³, and 3.31 µg/m³ to 0.93, 4.05 µg/m³, and 3.23 µg/m³, respectively, achieving the best overall performance. These enhancements can be attributed to the improved integration and extraction of feature information, particularly through the inclusion of the multi-head self-attention mechanism and SimCLR module, which enable more precise modeling of complex input features.
This study forecasts PM2.5 concentrations across China for the period from 2017 to 2022 based on an established model, with related predictions depicted in Figure 5. Analysis of this figure indicates significantly higher PM2.5 concentrations in the western regions of China, particularly near Xinjiang, where it appears as a prominent red area. This suggests that air pollution in this region is more severe, likely influenced by both natural factors (such as sandstorms) and anthropogenic factors (such as industrial emissions). In contrast, PM2.5 concentrations in most other regions are lower, primarily represented in green or yellow, indicating better air quality. Notably, the southeastern coastal regions of China exhibit lower PM2.5 concentrations, likely associated with improved air circulation and more stringent pollution control measures in these areas. The visualization results of this study facilitate the identification of spatial distribution patterns of PM2.5 pollution across China, providing valuable insights for pollution source identification and regional air quality assessment. These findings not only serve as a foundation for subsequent environmental monitoring, but also offer scientific support for focusing on high-pollution areas and the formulation of pollution control strategies.
Table 3 presents the statistical results of annual and seasonal PM2.5 concentrations in Beijing. Data from Table 3 indicate a year-on-year decline from 2017 to 2022. The annual average PM2.5 concentration decreased from 58.14 µg/m³ in 2017 to 30.47 µg/m³ in 2022, signifying an improvement in air quality during this period. Seasonal variations reveal that PM2.5 pollution in Beijing is more severe in spring and winter, with the highest concentrations recorded in winter. Conversely, summer exhibits the lowest PM2.5 concentrations, indicating clear seasonal variation. The overall trend of annual PM2.5 concentrations follows a U-shaped curve, reflecting substantial seasonal fluctuations, while the three-year average PM2.5 concentration demonstrates a declining trend, indicative of long-term improvement in air quality.
5. Discussion
5.1. Analysis in Model Performance
In this study, the model leverages several advanced deep learning techniques, including ViT, DLSTM, and a multi-head self-attention mechanism. These techniques enhance model performance, particularly in processing spatiotemporal features and complex patterns, and confer several advantages.
LSTM networks are designed to process time series data, effectively capturing long-term dependencies within temporal sequences [39]. By utilizing gating mechanisms, LSTMs successfully capture these prolonged dependencies, enabling the model to handle temporal variations in PM2.5 concentrations more accurately. This results in improved prediction accuracy, especially in capturing dynamic changes in air pollution. However, single-layer LSTMs exhibit limitations in learning complex temporal dependencies, leading to only modest performance gains. To enhance performance, a double-layered LSTM is introduced. By increasing network depth, the double-layered LSTM captures short-term dependencies at lower layers and long-term dependencies at higher layers, providing a more comprehensive modeling of complex temporal dynamics. Therefore, this model processes complex time-series data more effectively, achieving significantly improved predictive accuracy compared to a single-layer LSTM.
The multi-head self-attention mechanism is a core component of the Transformer architecture, facilitating the capture of various relationships and dependencies within input data through the computation of multiple attention heads in parallel. Each attention head focuses on different subspaces, enabling the model to capture a broader range of features effectively. The incorporation of the multi-head self-attention mechanism in this study led to enhanced performance in processing the spatial features of PM2.5 concentrations. The self-attention mechanism selectively emphasizes different parts of the input data, weighting them according to their importance, thus allowing the model to identify key patterns and features. Moreover, by leveraging parallel processing across multiple attention heads, the multi-head mechanism further enriches the diversity of feature representations. Therefore, with this module integrated, the model can better capture the spatial variations of PM2.5 concentrations across different regions, particularly in areas with complex air pollution, therrby significantly enhancing its predictive capability and accuracy.
SimCLR is a contrastive learning-based model that learns improved data representations by maximizing the similarity between similar samples while minimizing the distance between dissimilar ones. The incorporation of the SimCLR module further optimizes the model’s feature learning capabilities. By employing a self-supervised learning approach, SimCLR enables the model to acquire more discriminative features without the need for labeled data, which is particularly crucial for managing complex environmental datasets. In the context of PM2.5 concentration prediction, SimCLR assists the model in discerning similarities and differences within the input data, enhancing its sensitivity to temporal and spatial variations in PM2.5 levels. Ultimately, the integration of SimCLR allows the model to adaptively capture latent features of the data, improving predictive accuracy, especially in high pollution areas and under complex environmental patterns, where SimCLR demonstrates robust feature extraction capabilities.
5.2. Analysis in Time and Space
According to the statistical analysis of seasonal PM2.5 concentrations in Beijing, notable seasonal variations are apparent, attributable to multiple factors. Winter serves as the heating season in Beijing, during which the demand for heating significantly increases, resulting in heightened energy consumption and pollutant emissions. Specifically, the reliance on coal and heating equipment contributes to a substantial accumulation of pollutants, including PM2.5, during this season. Moreover, the lower temperatures, reduced air circulation, and frequent occurrences of temperature inversions in winter facilitate the retention of pollutants near the ground, thereby exacerbating air pollution. Conversely, summer displays the lowest PM2.5 concentrations, marked by pronounced seasonal fluctuations. This is primarily due to elevated temperatures and improved air circulation during the summer months, which promote the dispersion and dilution of pollutants, thereby reducing PM2.5 accumulation. Moreover, increased precipitation during summer aids in the removal of suspended particulate matter from the atmosphere, further lowering PM2.5 levels. Despite the significant seasonal variations, the data reveal a gradual decline in PM2.5 concentrations over the three-year period, indicating substantial progress in Beijing’s ongoing efforts to enhance air quality. In recent years, the government has implemented a series of stringent regulatory measures targeting industrial emissions, traffic-related pollution, and energy consumption, including the promotion of clean energy, improved traffic management, and the enforcement of stricter emission standards. These measures have effectively reduced pollutant emissions and contributed to improve air quality to some extent. Furthermore, recent enhancements in Beijing’s air quality can also be partially attributed to climatic influences, such as stronger winds, increased precipitation during summer, and a decrease in extreme pollution events during winter.
From a spatial perspective, western China—particularly regions near Xinjiang—exhibits higher PM2.5 concentrations, primarily due to the combined effects of dust storms and industrial emissions. Frequent dust storms in the western region elevate the amount of particulate matter in the atmosphere, while ongoing industrialization in specific areas further aggravates pollution. In contrast, the eastern and southern regions of China show lower PM2.5 concentrations, largely due to improved air circulation, increased precipitation, and stringent pollution control measures that help mitigate pollutant accumulation. Moreover, the eastern region relies more heavily on clean energy and utilizes less coal, thereby reducing pollutant emissions. Despite these regional disparities, overall PM2.5 concentrations in China have demonstrated a gradual year-on-year decline from 2020 to 2022. This trend highlights the significant achievements in national pollution control efforts, particularly through the implementation of strict environmental policies and measures, such as promoting clean energy, reducing coal dependency and strengthening industrial emission regulations, which have consistently improved air quality. The effects of these policies are especially pronounced in the eastern and southern regions, while the reduction of PM2.5 concentrations in the western region is more contingent upon a decrease in the frequency of dust storms and improved local governance. As national pollution control policies continue to be enforced, PM2.5 concentrations across various regions in China are expected to further improve in the coming years.
5.3. Limitations and Improvements of the Model
Although our study provides valuable insights, it is subject to certain limitations that outline pathways for future refinement and investigation. Primarily, the quality of the data employed requires enhancement, particularly concerning its spatiotemporal resolution and spatial coverage. To address this limitation, we propose extending the application of our model to larger geographical domains and exploring innovative approaches to represent spatiotemporal dynamics more effectively. Additionally, our reliance on interpolation methods to impute missing data introduces a layer of uncertainty, as the assumptions embedded within these models may diverge from the actual patterns exhibited by the data. This misalignment could introduce biases into the estimation of PM2.5 concentrations. Furthermore, although our analysis distinguishes between spatial and temporal effects, it does not account for the possibility that spatial patterns may exhibit temporal variability. Future research should prioritize a more comprehensive examination of the spatiotemporal continuity associated with PM2.5 concentration changes, as well as a nuanced consideration of the heterogeneity inherent across both spatial and temporal dimensions.
6. Conclusions
Given the severe health risks posed by PM2.5 and the limited availability of ground monitoring stations, comprehensively monitoring PM2.5 concentrations across different regions presents a challenge. Therefore, accurately predicting the spatiotemporal distribution of PM2.5 is particularly critical. In this study, we propose an integrated model that combines the ViT with SimCLR self-supervised contrastive learning to effectively process complex data with spatiotemporal dependencies. Through a series of experiments, the model demonstrated significant advantages in feature extraction, temporal modeling, and capturing global dependencies. By leveraging the SimCLR self-supervised contrastive learning framework, the model effectively learns deep features from images even in the absence of extensive labeled data, thereby establishing a solid foundation for subsequent prediction tasks. Furthermore, the introduction of an LSTM layer enables the model to capture long-term dependencies in temporal data, enhancing its performance in time series forecasting. Additionally, the incorporation of a multi-head self-attention mechanism significantly bolsters the model’s ability to capture global dependencies among input features, resulting in outstanding performance in managing complex spatiotemporal data.
Experimental results indicate that, in predicting PM2.5 concentrations, the proposed model exhibits higher accuracy and greater generalizability compared to traditional CNNs and standard LSTM models. Moreover, comparisons with other advanced models such as RF and standard deep neural networks (DNNs) further validate the superiority of our model in handling spatiotemporally dependent data. Specifically, the model achieves significantly lower MAE and RMSE on the test set relative to benchmark models, demonstrating its robust performance in complex prediction tasks.
Overall, the integrated model based on ViT, SimCLR, LSTM, and self-attention mechanisms provides an effective solution for spatiotemporal data prediction tasks. Future research will focus on optimizing the model’s computational efficiency and extending its application to a broader range of real-world scenarios, applicable not only limited to PM2.5 detection but also to the monitoring of other pollutants.
Author Contributions
This manuscript was designed and written by T.Z., while M.Q. supervised the study and contributed to the analysis and discussion of the algorithm and experimental results. All authors have read and agreed to the published version of the manuscript.
Institutional Review Board Statement
Not applicable.
Informed Consent Statement
Not applicable.
Acknowledgments
This work is supported by the Shenzhen Fundamental Research Program under Grant (JCYJ20230807094104009).
Conflicts of Interest
The authors declare no conflict of interest regarding the publication of this paper.
References
- Chen, N.; Shi, X. Study on public habituation to haze based on factor analysis and entropy method. Journal of Arid Land Resources and Environment 2020, 34, 15–21. [Google Scholar] [CrossRef]
- Gu, S. Study on the assessment of indirect economic losses from haze pollution. Master’s thesis, Nanjing University of Information Science and Technology, 2016.
- Jiang, W.; Chen, D. Analysis of air quality status and meteorological conditions in Chongqing main urban area in 2015. Sichuan Environment 2016, 35, 90–93. [Google Scholar] [CrossRef]
- Maji, K.J.; Arora, M.; Dikshit, A.K. Premature mortality attributable to PM2. 5 exposure and future policy roadmap for ‘airpocalypse’affected Asian megacities. Process safety and environmental protection 2018, 118, 371–383. [Google Scholar] [CrossRef]
- Yao, L.; Sun, S.; Wang, Y.; Song, C.; Xu, Y. New insight into the urban PM2. 5 pollution island effect enabled by the Gaussian surface fitting model: A case study in a mega urban agglomeration region of China. International Journal of Applied Earth Observation and Geoinformation 2022, 113, 102982. [Google Scholar] [CrossRef]
- Zhou, L.; Zhou, C.; Yang, F.; Che, L.; Wang, B.; Sun, D. Spatio-temporal evolution and the influencing factors of PM 2.5 in China between 2000 and 2015. Journal of Geographical Sciences 2019, 29, 253–270. [Google Scholar] [CrossRef]
- Liu, Y.; Zhao, N.; Vanos, J.K.; Cao, G. Revisiting the estimations of PM2. 5-attributable mortality with advancements in PM2. 5 mapping and mortality statistics. Science of the Total Environment 2019, 666, 499–507. [Google Scholar] [CrossRef]
- Pun, V.C.; Kazemiparkouhi, F.; Manjourides, J.; Suh, H.H. Long-term PM2. 5 exposure and respiratory, cancer, and cardiovascular mortality in older US adults. American journal of epidemiology 2017, 186, 961–969. [Google Scholar] [CrossRef]
- Xie, Y.; Dai, H.; Hanaoka, T.; Masui, T. Health and economic impacts of PM2. 5 pollution in Beijing-Tianjin-Hebei Area. China Popul. Resour. Environ 2016, 26, 19–27. [Google Scholar]
- Ahmad, N.A.; Ismail, N.W.; Sidique, S.F.A.; Mazlan, N.S. Air pollution, governance quality, and health outcomes: evidence from developing countries. Environmental Science and Pollution Research 2023, 30, 41060–41072. [Google Scholar] [CrossRef]
- Li-juan, K.; Hai-ye, Y.; Mei-chen, C.; Zhao-jia, P.; Shuang, L.; Jing-min, D.; Lei, Z.; Yuan-yuan, S. Analyze on the Response Characteristics of Leaf vegetables to Particle Matters Based on Hyperspectral. SPECTROSCOPY AND SPECTRAL ANALYSIS 2021, 41, 236–242. [Google Scholar]
- Zhang, Q.; Zheng, Y.; Tong, D.; Shao, M.; Wang, S.; Zhang, Y.; Xu, X.; Wang, J.; He, H.; Liu, W.; et al. Drivers of improved PM2. 5 air quality in China from 2013 to 2017. Proceedings of the National Academy of Sciences 2019, 116, 24463–24469. [Google Scholar] [CrossRef]
- Park, S.; Lee, J.; Im, J.; Song, C.K.; Choi, M.; Kim, J.; Lee, S.; Park, R.; Kim, S.M.; Yoon, J.; et al. Estimation of spatially continuous daytime particulate matter concentrations under all sky conditions through the synergistic use of satellite-based AOD and numerical models. Science of the Total Environment 2020, 713, 136516. [Google Scholar] [CrossRef] [PubMed]
- Ma, Z.; Dey, S.; Christopher, S.; Liu, R.; Bi, J.; Balyan, P.; Liu, Y. A review of statistical methods used for developing large-scale and long-term PM2. 5 models from satellite data. Remote Sensing of Environment 2022, 269, 112827. [Google Scholar] [CrossRef]
- Guo, J.P.; Zhang, X.Y.; Che, H.Z.; Gong, S.L.; An, X.; Cao, C.X.; Guang, J.; Zhang, H.; Wang, Y.Q.; Zhang, X.C.; et al. Correlation between PM concentrations and aerosol optical depth in eastern China. Atmospheric Environment 2009, 43, 5876–5886. [Google Scholar] [CrossRef]
- Yang, Q.; Yuan, Q.; Yue, L.; Li, T.; Shen, H.; Zhang, L. The relationships between PM2. 5 and aerosol optical depth (AOD) in mainland China: About and behind the spatio-temporal variations. Environmental Pollution 2019, 248, 526–535. [Google Scholar] [CrossRef]
- Li, S.; Zou, B.; Fang, X.; Lin, Y. Time series modeling of PM2. 5 concentrations with residual variance constraint in eastern mainland China during 2013–2017. Science of the Total Environment 2020, 710, 135755. [Google Scholar] [CrossRef]
- Li, Z.; Zhang, Y.; Shao, J.; Li, B.; Hong, J.; Liu, D.; Li, D.; Wei, P.; Li, W.; Li, L.; et al. Remote sensing of atmospheric particulate mass of dry PM2. 5 near the ground: Method validation using ground-based measurements. Remote Sensing of Environment 2016, 173, 59–68. [Google Scholar] [CrossRef]
- Van Donkelaar, A.; Martin, R.V.; Park, R.J. Estimating ground-level PM2. 5 using aerosol optical depth determined from satellite remote sensing. Journal of Geophysical Research: Atmospheres 2006, 111. [Google Scholar] [CrossRef]
- Zhang, Z.; Wu, W.; Fan, M.; Wei, J.; Tan, Y.; Wang, Q. Evaluation of MAIAC aerosol retrievals over China. Atmospheric Environment 2019, 202, 8–16. [Google Scholar] [CrossRef]
- Xie, Y.; Wang, Y.; Bilal, M.; Dong, W. Mapping daily PM2. 5 at 500 m resolution over Beijing with improved hazy day performance. Science of the Total Environment 2019, 659, 410–418. [Google Scholar] [CrossRef]
- Zhang, T.; Zhu, Z.; Gong, W.; Zhu, Z.; Sun, K.; Wang, L.; Huang, Y.; Mao, F.; Shen, H.; Li, Z.; et al. Estimation of ultrahigh resolution PM2. 5 concentrations in urban areas using 160 m Gaofen-1 AOD retrievals. Remote Sensing of Environment 2018, 216, 91–104. [Google Scholar] [CrossRef]
- Xiao, Q.; Wang, Y.; Chang, H.H.; Meng, X.; Geng, G.; Lyapustin, A.; Liu, Y. Full-coverage high-resolution daily PM2. 5 estimation using MAIAC AOD in the Yangtze River Delta of China. Remote Sensing of Environment 2017, 199, 437–446. [Google Scholar] [CrossRef]
- Lee, H.J. Benefits of high resolution PM2. 5 prediction using satellite MAIAC AOD and land use regression for exposure assessment: California examples. Environmental Science & Technology 2019, 53, 12774–12783. [Google Scholar]
- Ma, Z.; Liu, Y.; Zhao, Q.; Liu, M.; Zhou, Y.; Bi, J. Satellite-derived high resolution PM2. 5 concentrations in Yangtze River Delta Region of China using improved linear mixed effects model. Atmospheric Environment 2016, 133, 156–164. [Google Scholar] [CrossRef]
- Zhang, R.; Di, B.; Luo, Y.; Deng, X.; Grieneisen, M.L.; Wang, Z.; Yao, G.; Zhan, Y. A nonparametric approach to filling gaps in satellite-retrieved aerosol optical depth for estimating ambient PM2. 5 levels. Environmental Pollution 2018, 243, 998–1007. [Google Scholar] [CrossRef]
- Shtein, A.; Kloog, I.; Schwartz, J.; Silibello, C.; Michelozzi, P.; Gariazzo, C.; Viegi, G.; Forastiere, F.; Karnieli, A.; Just, A.C.; et al. Estimating daily PM2. 5 and PM10 over Italy using an ensemble model. Environmental science & technology 2019, 54, 120–128. [Google Scholar]
- Ashish, V. Attention is all you need. Advances in neural information processing systems 2017, 30, I. [Google Scholar]
- Fu, Y.; Ye, Z.; Deng, J.; Zheng, X.; Huang, Y.; Yang, W.; Wang, Y.; Wang, K. Finer resolution mapping of marine aquaculture areas using worldView-2 imagery and a hierarchical cascade convolutional neural network. Remote Sensing 2019, 11, 1678. [Google Scholar] [CrossRef]
- Ye, Z.; Fu, Y.; Gan, M.; Deng, J.; Comber, A.; Wang, K. Building extraction from very high resolution aerial imagery using joint attention deep neural network. Remote Sensing 2019, 11, 2970. [Google Scholar] [CrossRef]
- Shen, H.; Li, T.; Yuan, Q.; Zhang, L. Estimating regional ground-level PM2. 5 directly from satellite top-of-atmosphere reflectance using deep belief networks. Journal of Geophysical Research: Atmospheres 2018, 123, 13–875. [Google Scholar]
- Kaufman, Y.J.; Sendra, C. Algorithm for automatic atmospheric corrections to visible and near-IR satellite imagery. International Journal of Remote Sensing 1988, 9, 1357–1381. [Google Scholar] [CrossRef]
- Zhao, C.; Wang, Q.; Ban, J.; Liu, Z.; Zhang, Y.; Ma, R.; Li, S.; Li, T. Estimating the daily PM2. 5 concentration in the Beijing-Tianjin-Hebei region using a random forest model with a 0.01× 0.01 spatial resolution. Environment international 2020, 134, 105297. [Google Scholar] [CrossRef] [PubMed]
- Hochreiter, S.; Schmidhuber, J. Long short-term memory. Neural computation 1997, 9, 1735–1780. [Google Scholar] [CrossRef] [PubMed]
- Graves, A.; Mohamed, A.r.; Hinton, G. Speech recognition with deep recurrent neural networks. In Proceedings of the 2013 IEEE international conference on acoustics, speech and signal processing. Ieee; 2013; pp. 6645–6649. [Google Scholar]
- Keskar, N.S.; Mudigere, D.; Nocedal, J.; Smelyanskiy, M.; Tang, P.T.P. On large-batch training for deep learning: Generalization gap and sharp minima. arXiv preprint arXiv:1609.04836, arXiv:1609.04836 2016.
- Poujois, A.; Woimant, F. Wilson’s disease: A 2017 update. Clinics and research in hepatology and gastroenterology 2018, 42, 512–520. [Google Scholar] [CrossRef]
- Smith, S.L.; Le, Q.V. A bayesian perspective on generalization and stochastic gradient descent. arXiv preprint arXiv:1710.06451, arXiv:1710.06451 2017.
- Lindemann, B.; Müller, T.; Vietz, H.; Jazdi, N.; Weyrich, M. A survey on long short-term memory networks for time series prediction. Procedia Cirp 2021, 99, 650–655. [Google Scholar] [CrossRef]
Figure 1.
Locations of the study area and ground PM2.5 monitoring stations.
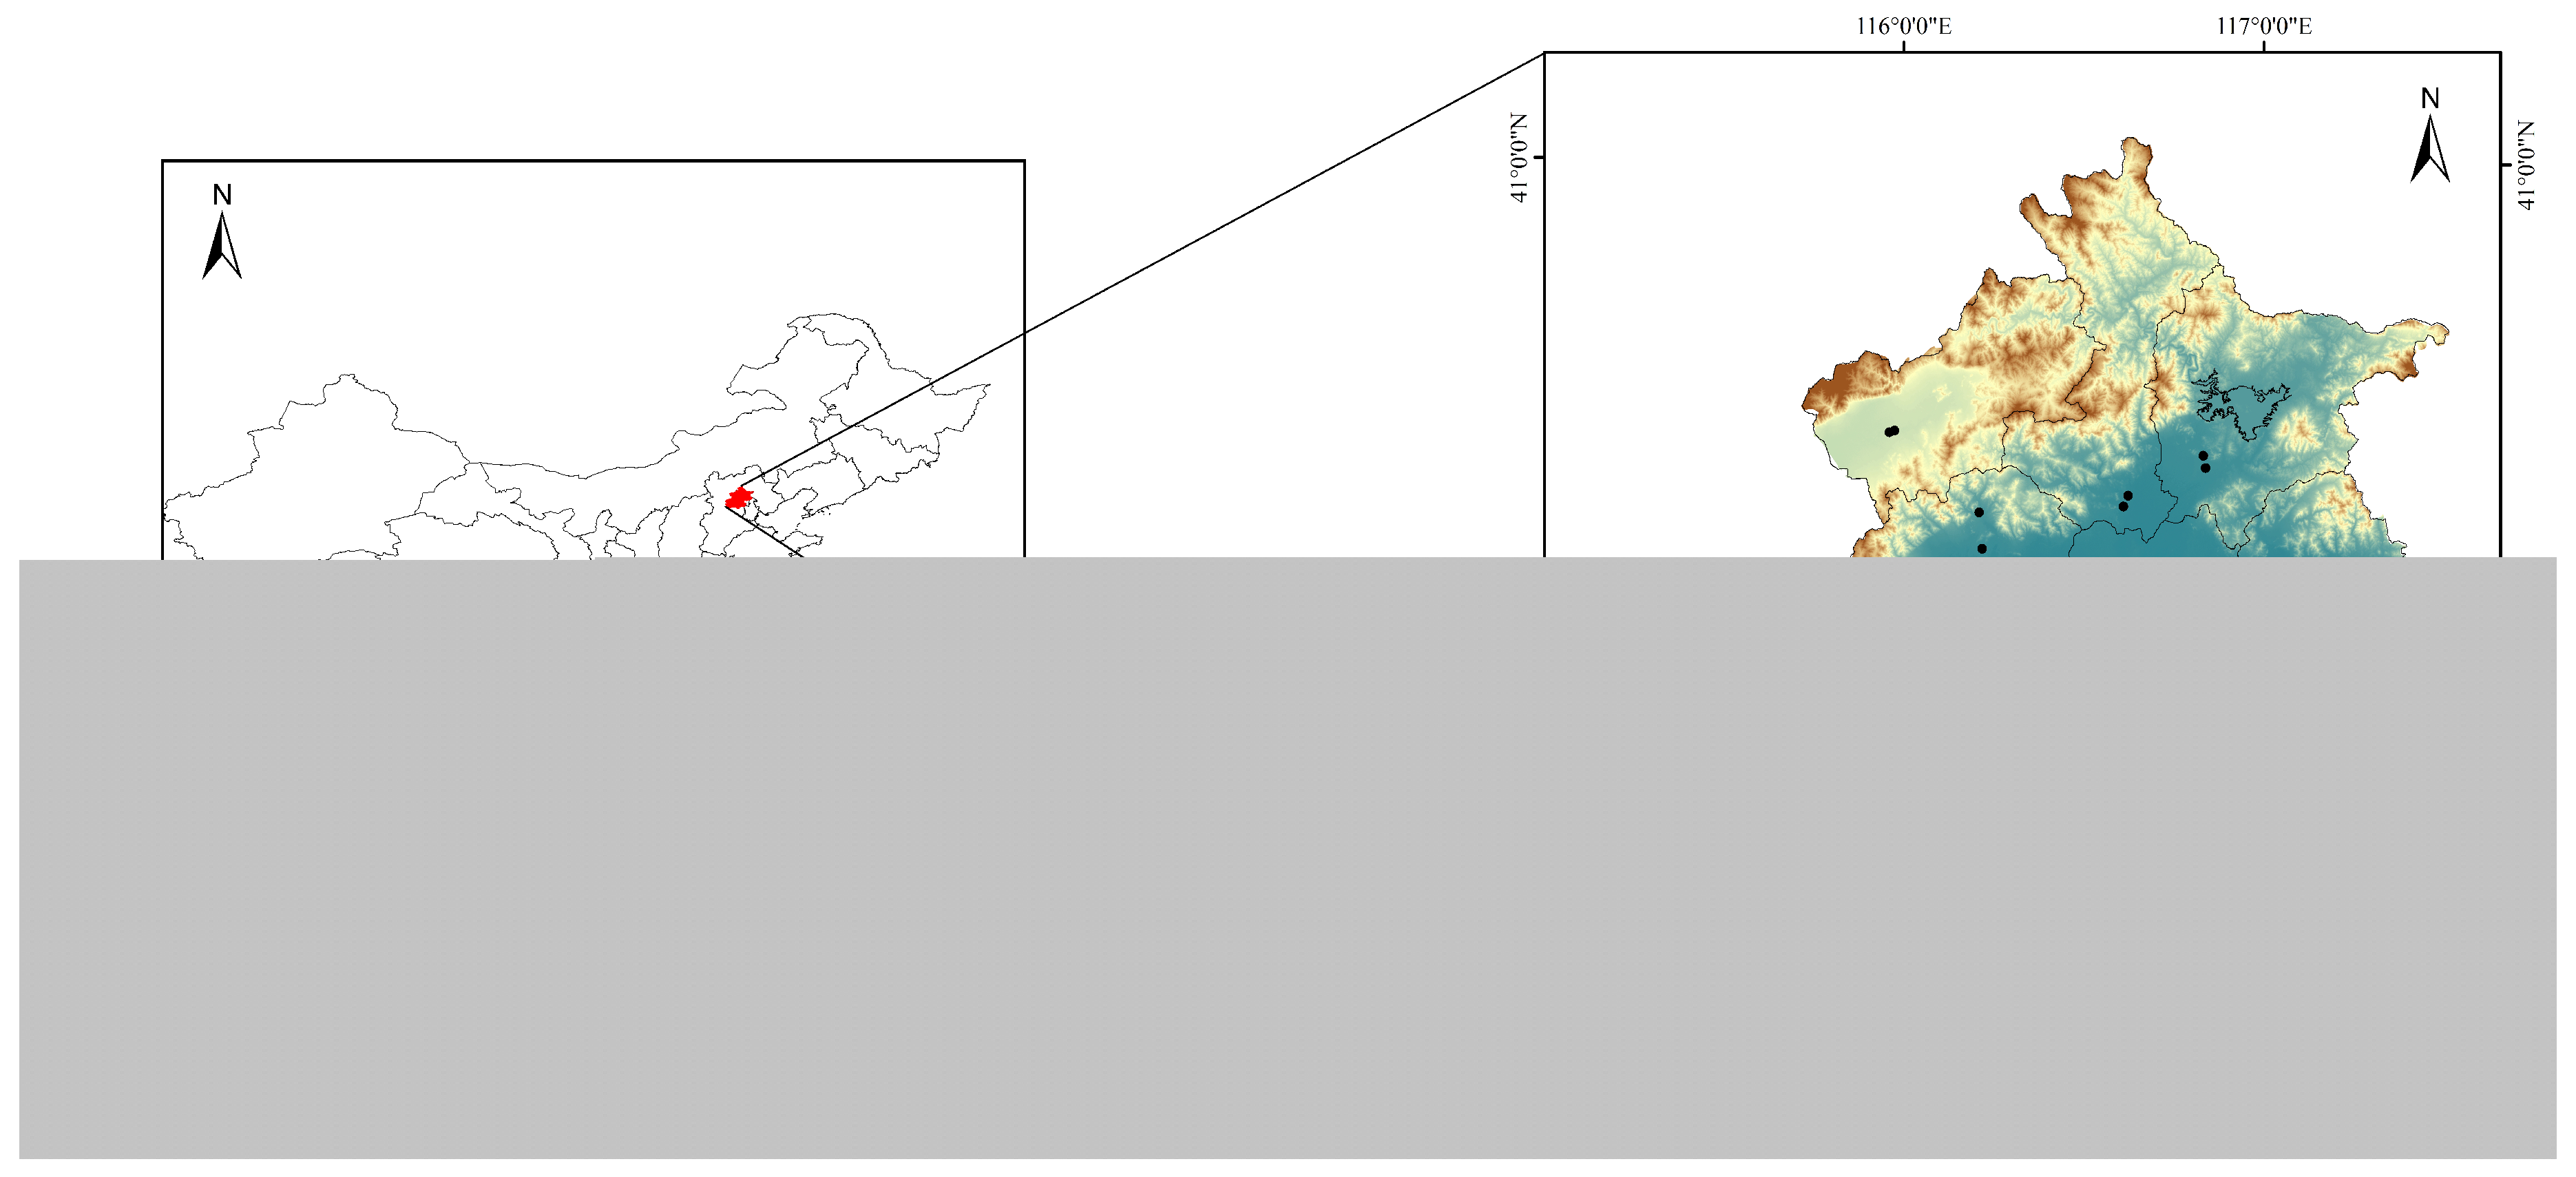
Figure 2.
VDMS model.
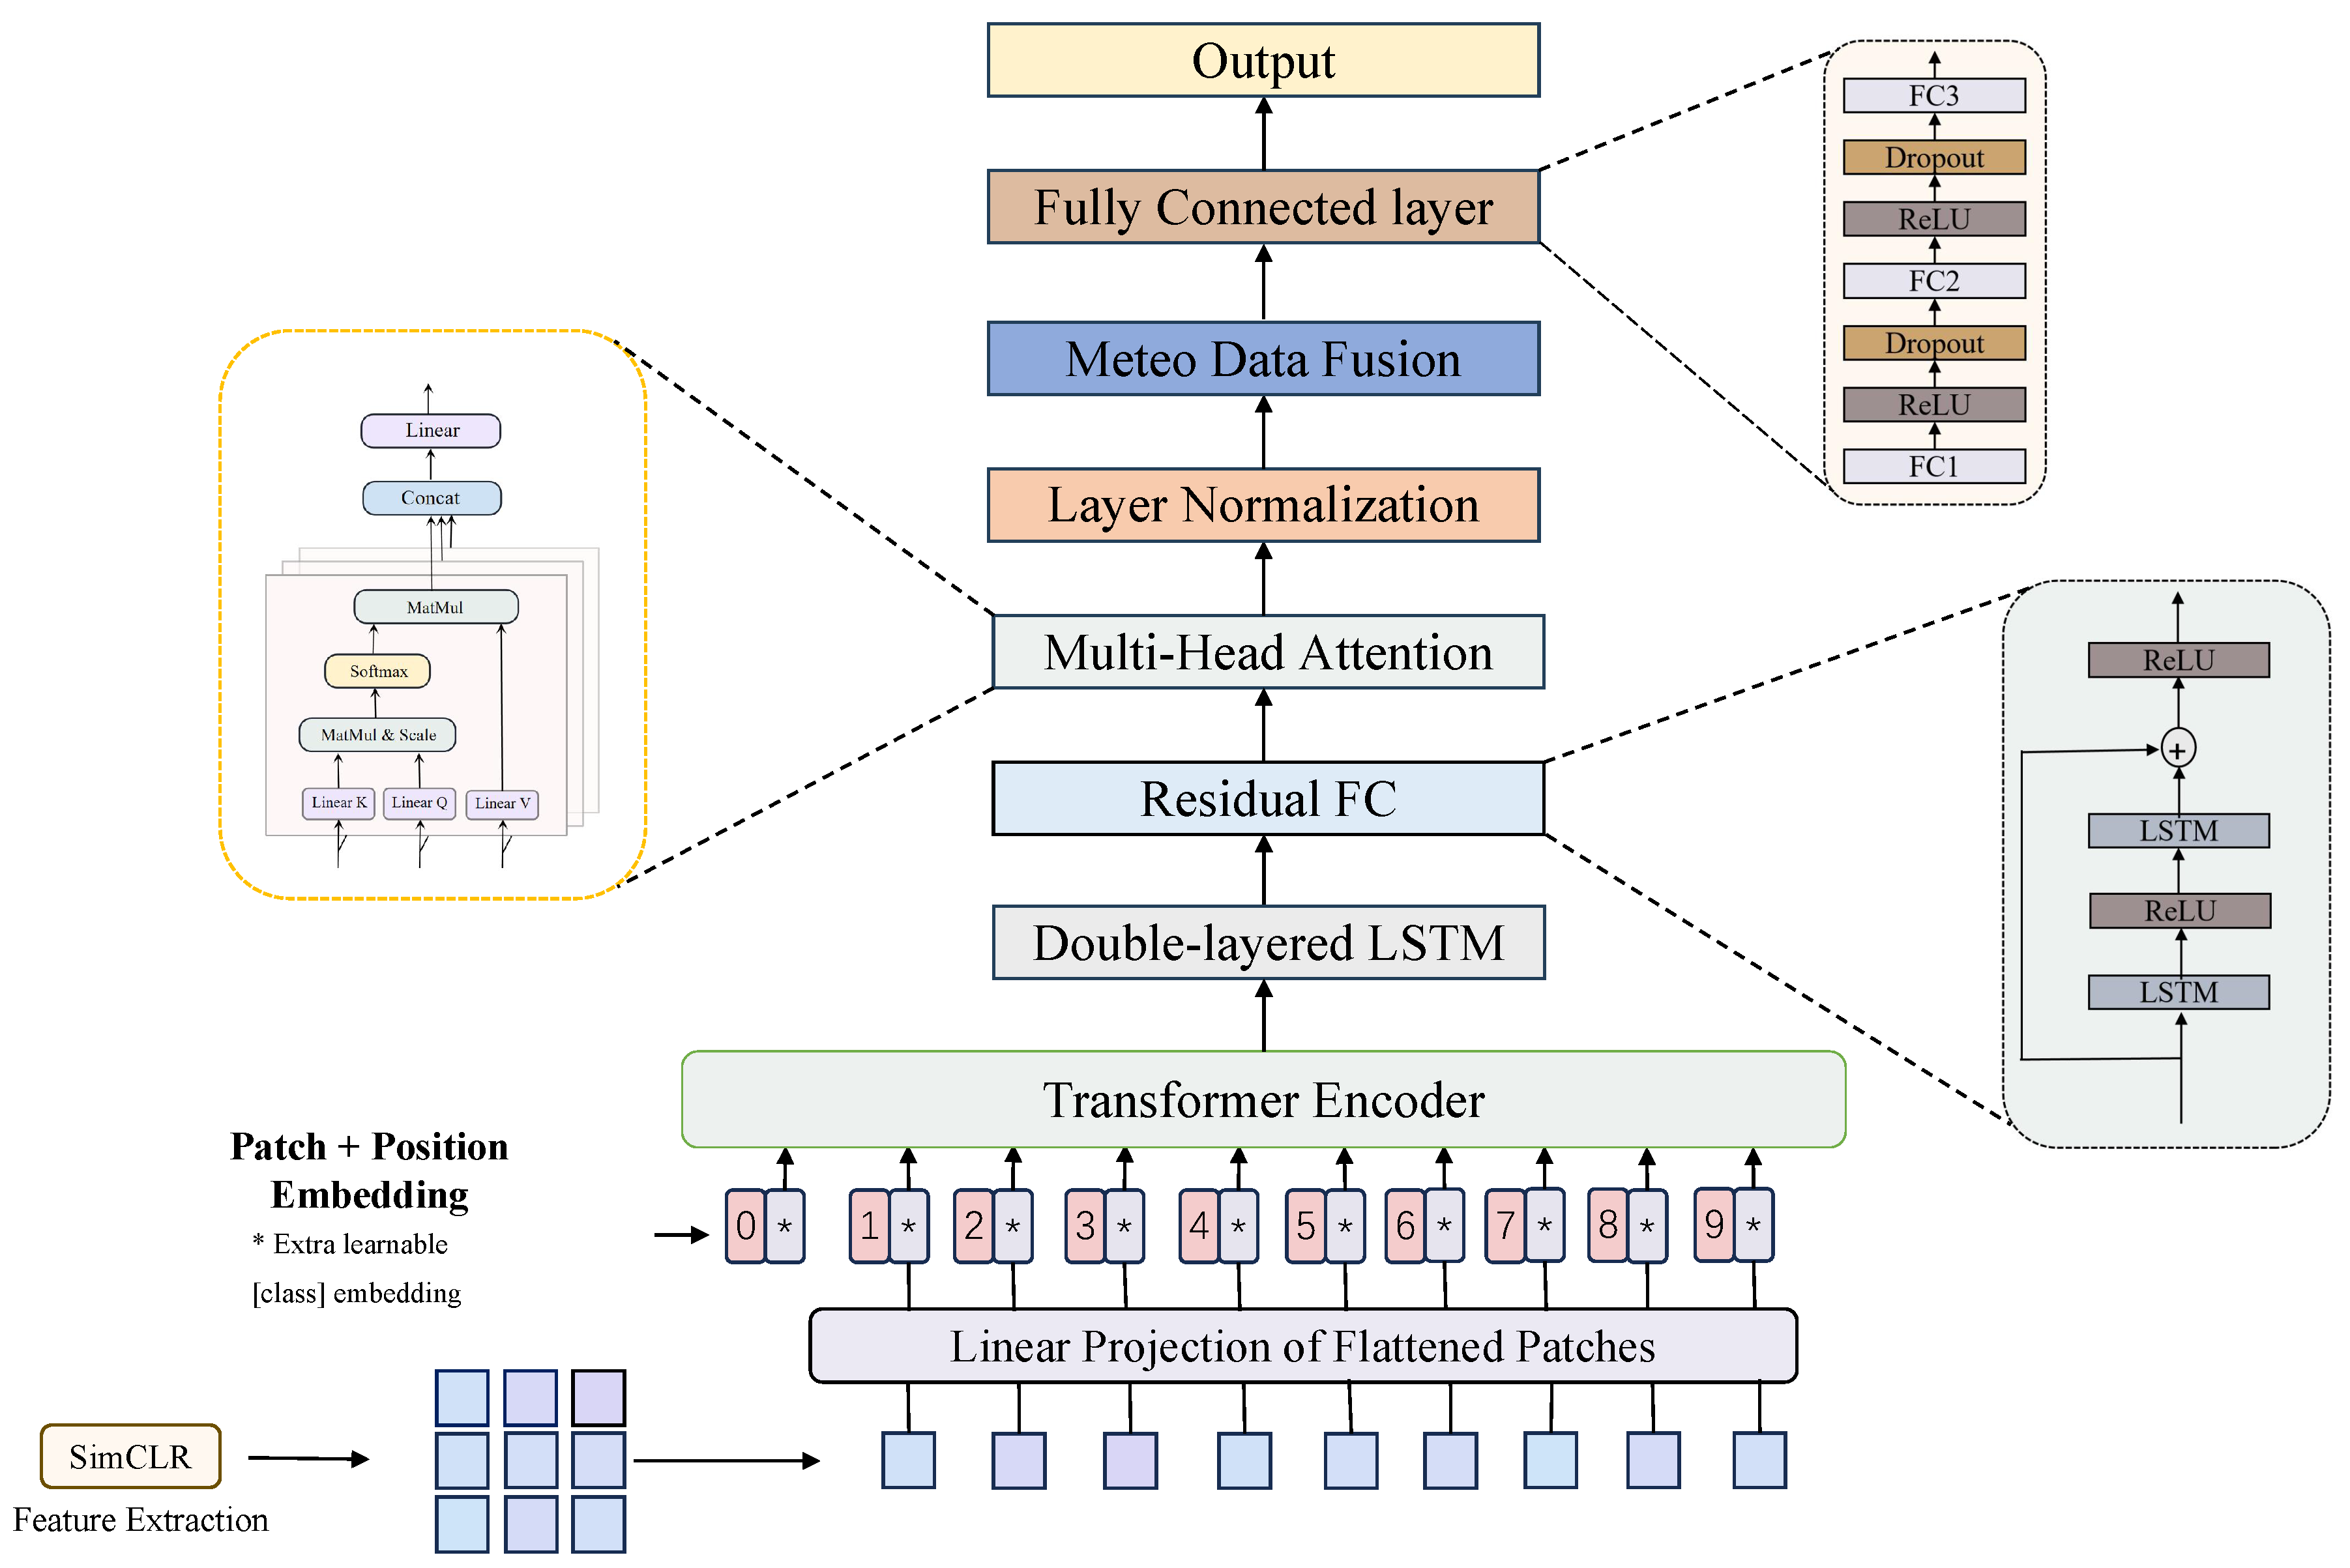
Figure 4.
Density scatter plots illustrating the performance of VDMS. Plots (a) and (b) show the Sam-CV and Sta-CV results, respectively, with integrated meteorological data. Plots (c) and (d) show the Sam-CV and Sta-CV results, respectively, without integrated meteorological data.
Figure 4.
Density scatter plots illustrating the performance of VDMS. Plots (a) and (b) show the Sam-CV and Sta-CV results, respectively, with integrated meteorological data. Plots (c) and (d) show the Sam-CV and Sta-CV results, respectively, without integrated meteorological data.
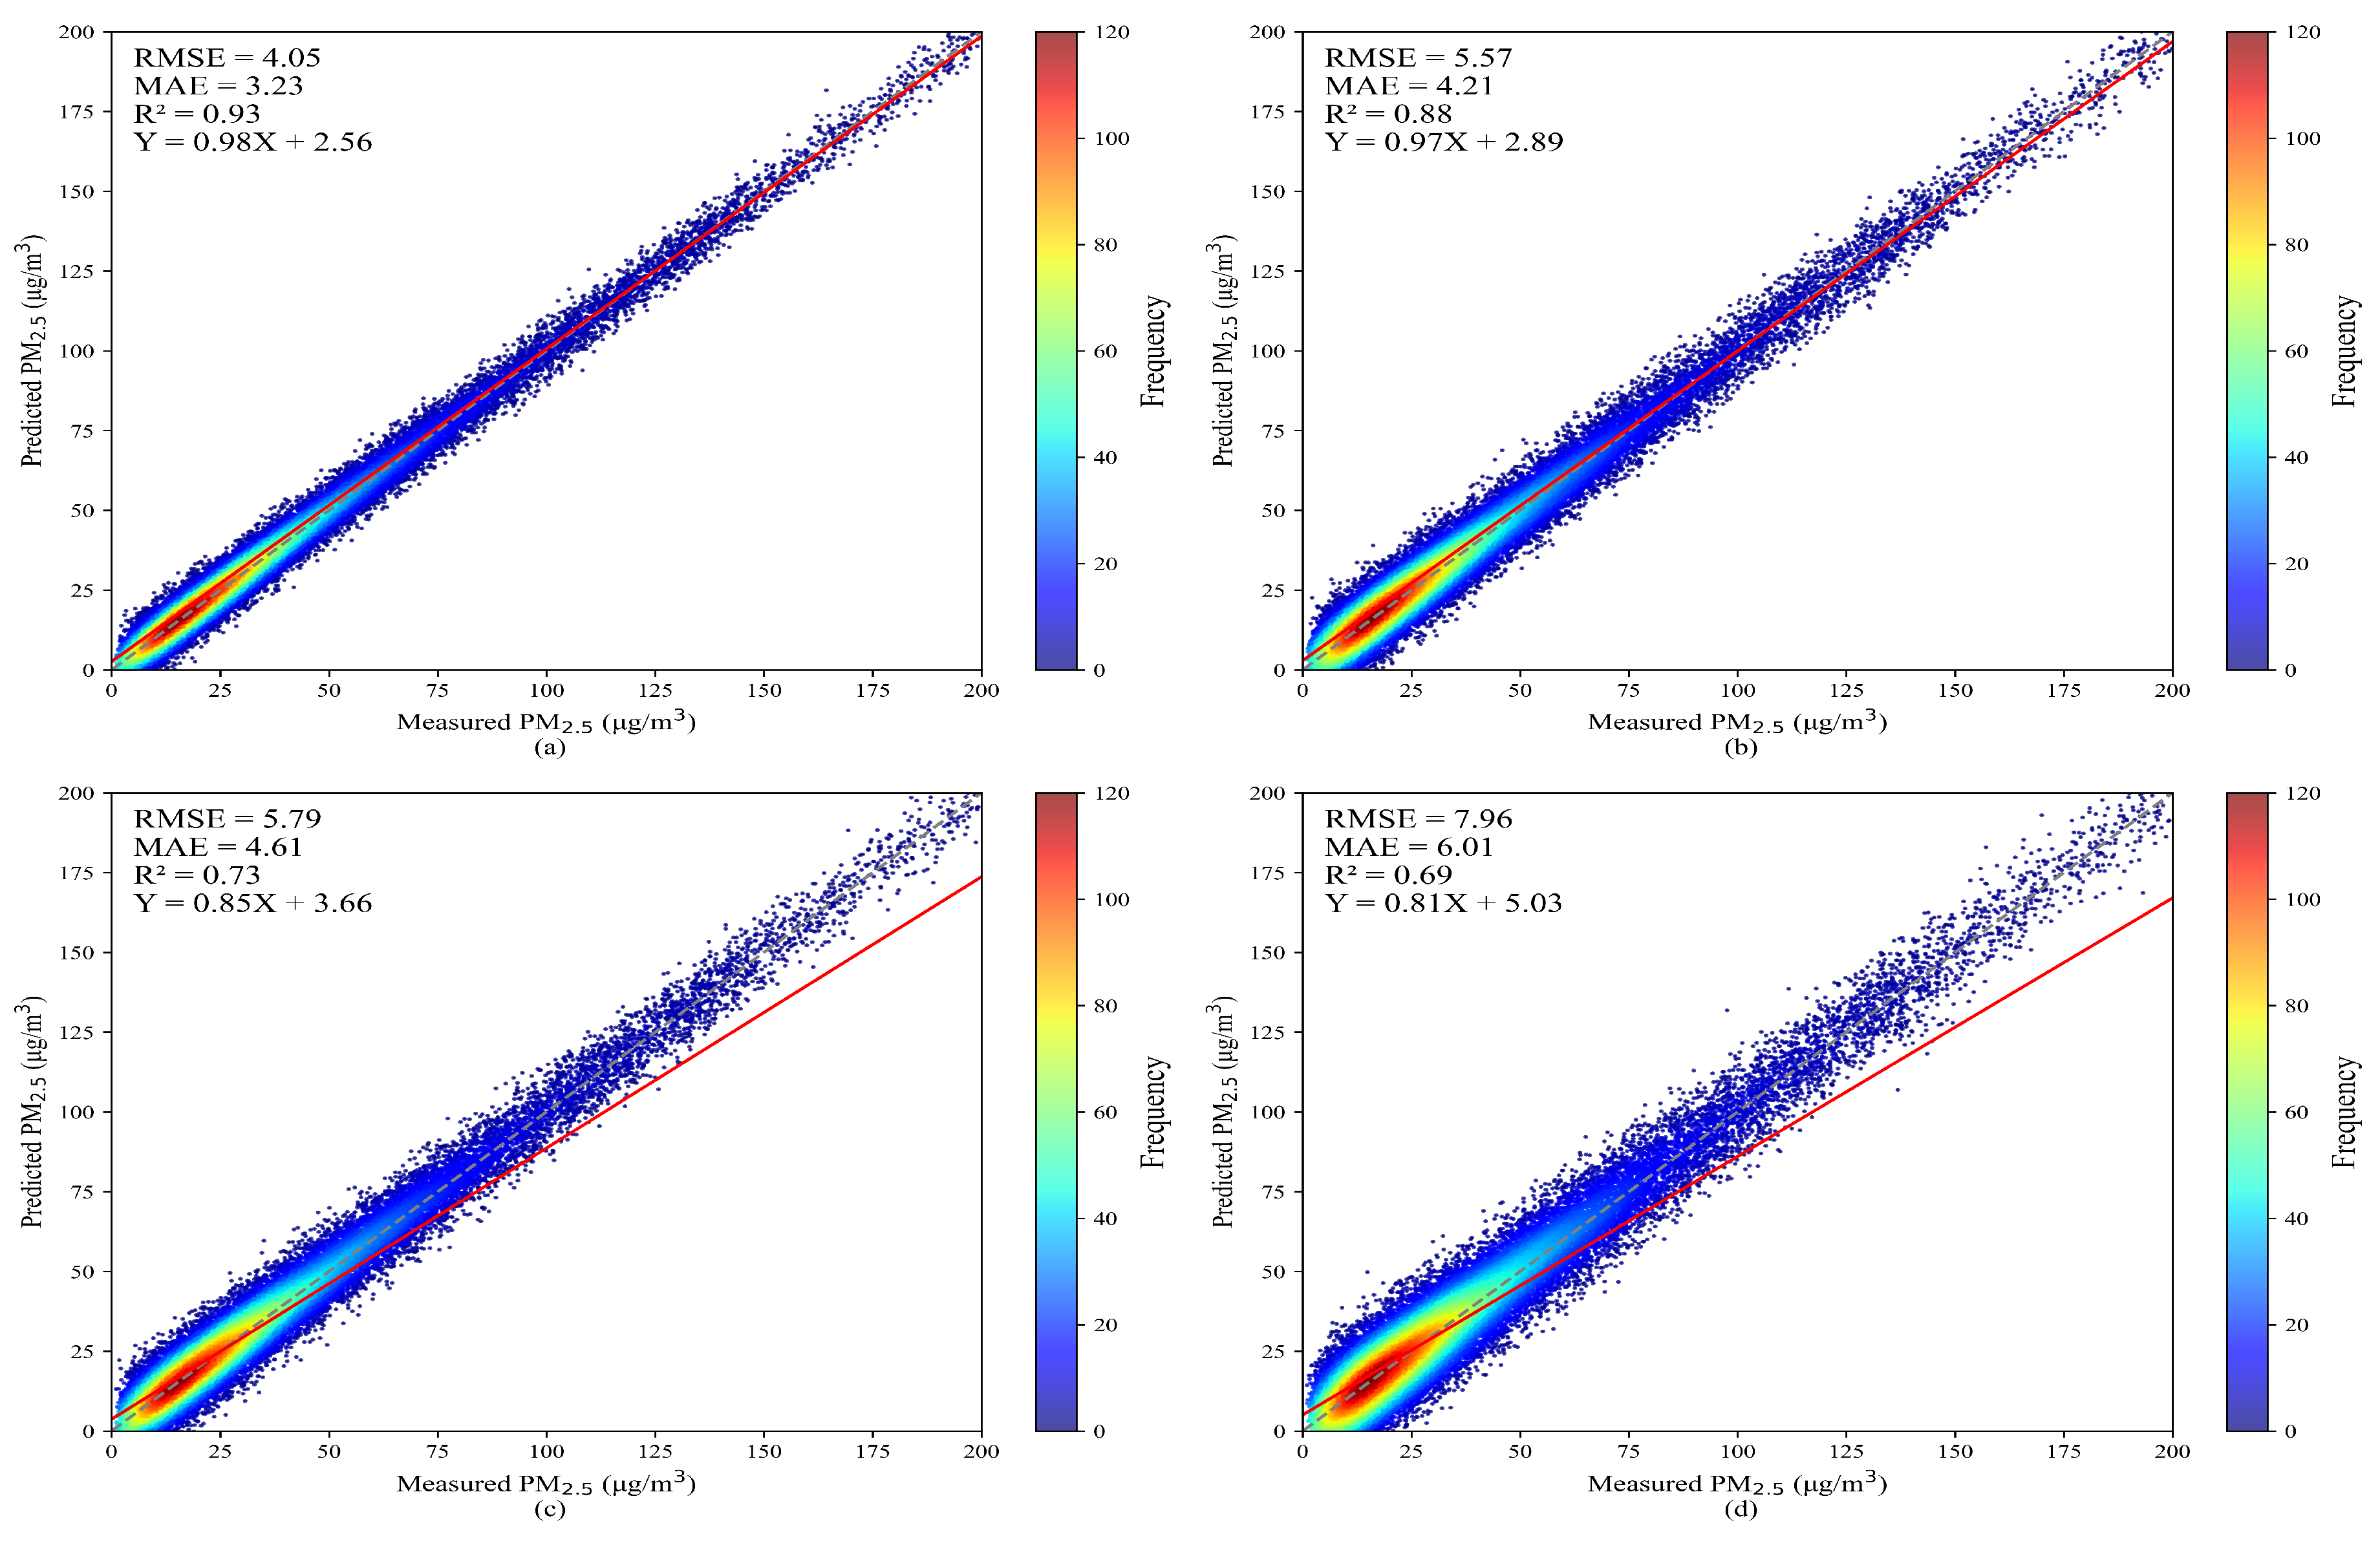
Figure 5.
Spatial distributions of the estimated PM2.5 concentrations in (a) 2017 to (f) 20022 across China.
Figure 5.
Spatial distributions of the estimated PM2.5 concentrations in (a) 2017 to (f) 20022 across China.
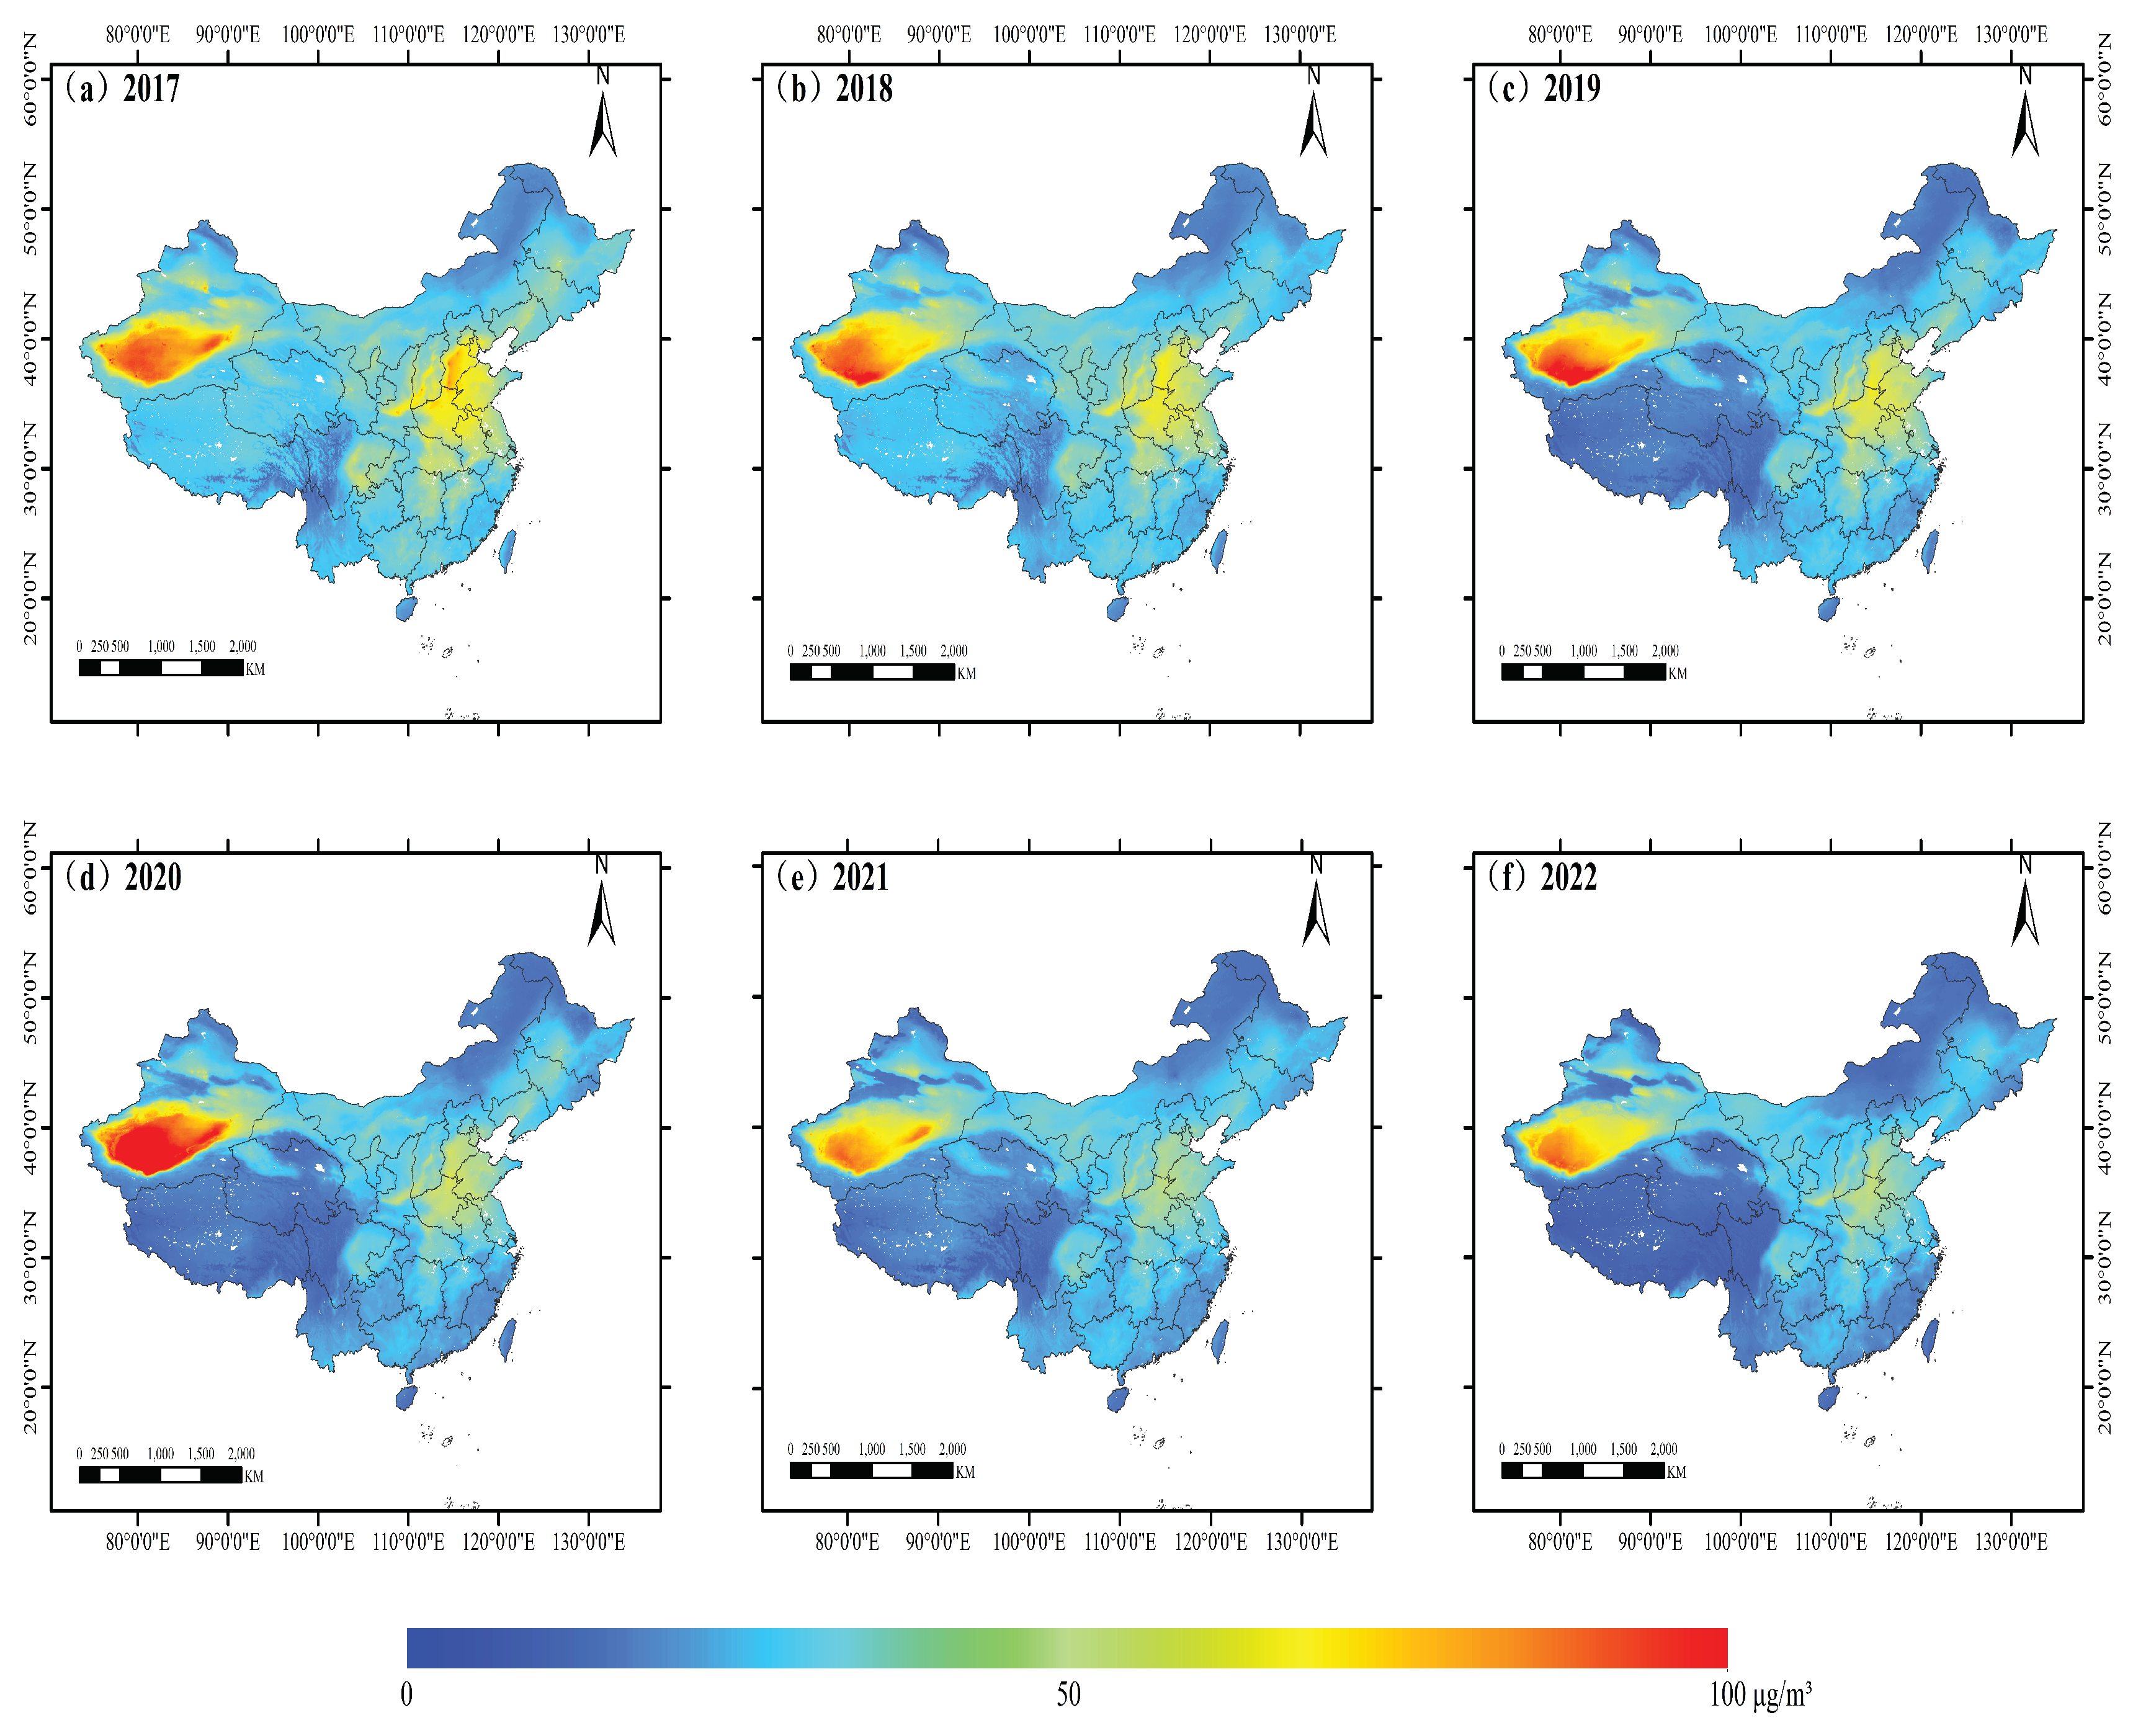

Table 1.
Comparison of the Sam-CV and Sta-CV results for various models.
| Model | Sam-CV | Sta-CV | ||||
|---|---|---|---|---|---|---|
| R | RMSE | MAE | R | RMSE | MAE | |
| CNN | 0.75 | 7.77 | 6.42 | 0.70 | 9.29 | 7.40 |
| ViT | 0.53 | 8.05 | 6.51 | 0.48 | 9.57 | 7.49 |
| SimCLR | 0.86 | 7.43 | 5.78 | 0.81 | 8.95 | 6.76 |
| VDMS | 0.93 | 4.05 | 3.23 | 0.88 | 5.57 | 4.21 |
Table 2.
Ablation study.
| Model | Sam-CV | Sta-CV | ||||
|---|---|---|---|---|---|---|
| R | RMSE | MAE | R | RMSE | MAE | |
| ViT-LSTM | 0.58 | 7.64 | 5.23 | 0.53 | 9.16 | 6.21 |
| ViT-DLSTM | 0.73 | 6.14 | 4.77 | 0.68 | 7.66 | 5.75 |
| VDM | 0.85 | 4.54 | 3.31 | 0.81 | 6.06 | 4.29 |
| VDMS | 0.93 | 4.05 | 3.23 | 0.88 | 5.57 | 4.21 |
Table 3.
Seasonal variation of PM2.5 concentration (µg/m³) from 2017 to 2022.
| Season\Year | 2017 | 2018 | 2019 | 2020 | 2021 | 2022 |
|---|---|---|---|---|---|---|
| Spring | 59.87 | 69.79 | 46.50 | 34.07 | 49.09 | 32.96 |
| Summer | 44.31 | 43.12 | 31.76 | 33.06 | 17.71 | 20.52 |
| Autumn | 51.98 | 45.23 | 39.97 | 33.54 | 29.74 | 29.17 |
| Winter | 76.40 | 43.29 | 48.30 | 49.44 | 43.18 | 39.21 |
| Annual | 58.14 | 50.36 | 41.63 | 37.53 | 34.93 | 30.47 |
Disclaimer/Publisher’s Note: The statements, opinions and data contained in all publications are solely those of the individual author(s) and contributor(s) and not of MDPI and/or the editor(s). MDPI and/or the editor(s) disclaim responsibility for any injury to people or property resulting from any ideas, methods, instructions or products referred to in the content. |
© 2024 by the authors. Licensee MDPI, Basel, Switzerland. This article is an open access article distributed under the terms and conditions of the Creative Commons Attribution (CC BY) license (https://creativecommons.org/licenses/by/4.0/).
Copyright: This open access article is published under a Creative Commons CC BY 4.0 license, which permit the free download, distribution, and reuse, provided that the author and preprint are cited in any reuse.


