Submitted:
08 May 2025
Posted:
08 May 2025
You are already at the latest version
Abstract
The spatial-temporal distribution and variability of soil moisture (SM) constitutes a critical foundation for coordinating agricultural productivity, ecological preservation, and mountain flood disaster mitigation. Based on observed SM data from 27 automated monitoring stations established by the Aerospace Information Research Institute during 2022-2024 across different climatic zones in China, the temporal change patterns, spatial heterogeneity characteristics, dominant meteorological influencing factors and the respective quantitative contributions, as well as the time-lagged responses to meteorological variables in different climatic zones were analyzed systematically applying integrated methodologies combining the regional spatial-temporal analysis, principal component analysis, random forest algorithm and cross-correlation techniques. Temporally, the monthly SM in all climatic zones exhibited consistent seasonal patterns characterized by higher values in spring-summer and lower levels in autumn-winter. Notably, the tropical monsoon and subtropical monsoon climate zones displayed lower variability in monthly soil moisture fluctuations, whereas the temperate monsoon, temperate continental, and alpine plateau climate zones manifested various seasonal divergence. Spatially, the annual and seasonal SM exhibited a declined characteristic from southeastern to northwestern regions. Conversely, the coefficient of variation of SM presented an inverse pattern with enhanced variability along the same direction. Generally, the relationship between SM and soil depth was optimally modeled closely aligned with quadratic regression, demonstrating both initially increasing and then slightly decreasing trend and monotonically increasing trend with increasing depth. The meteorological variables on SM ranked the descending order of significance were mean temperature, maximum temperature, minimum temperature, precipitation, net solar radiation intensity, and mean wind speed. Simultaneously, the minimum temperature emerged as the highest contribution to SM in different soil layers. The meteorological forcing contributions in different climate zones displayed significant spatial heterogeneity affected by soil texture, vegetation type and topography. Meanwhile, the hydroclimatic response mechanisms were found that the temperature exhibited prolonged time-lagged effects on SM ranging from 21 to 101 days, whereas the precipitation manifested rapid coupling with merely 2 to 6 days.
Keywords:
soil moisture
; climatic zones
; spatiotemporal distribution
; regional heterogeneity
; quantitative attribution
; time-lagged response
1. Introduction
Soil moisture content (SM) serves as a pivotal indicator for characterizing soil water status and constitutes a critical research focus in the fields of agricultural water management, hydrological cycles, and climate change[1]. Its accurate measurement and analysis facilitate precision agricultural water management, enhance the computational accuracy of hydrological models, improve water demand forecasting, and support the formulation of climate change adaptation strategies, thereby promoting the sustainable utilization of water resources.
The SM exhibited significant correlation with precipitation patterns. In China, annual precipitation gradually decreased progressively from the southeastern coastal regions to the northwestern interior[2]. In regions with abundant precipitation, such as Guangxi and Jiangxi, the soil can maintain relatively high and stable soil humidity, with the SM reaching up to 40%[3]. Contrasting with southern humid regions, limited annual precipitation coupled with high evapotranspiration rates resulted in characteristically low SM, typically ranging from 5% to 30% in the Inner Mongolia and Gansu[4]. Furthermore, there was a high risk of waterlogging and soil gleying in the southern area[5],whereas the north area usually focused on desertification control through water-saving irrigation technologies [6]. Therefore, spatiotemporal analysis of SM differences is the scientific foundation for agricultural production, ecological protection, and disaster risk mitigation.
Manual observation techniques mainly contained the traditional oven-drying method and the instrumental approaches of The Time Domain Reflectometry (TDR) and Frequency Domain Reflectometry (FDR). The traditional oven-drying method provided high accuracy, but faced the cumbersome, time-consuming, and destructive problems[7]. Although the TDR and FDR methods were widely used in field experiments, the calibration processes were complicated due to factors of soil salinity and texture. Additionally, the measurement accuracy decreased under extreme water content conditions[8-9]. Remote sensing technology can obtain global-scale spatiotemporal distribution data of SM, providing capabilities of large-area monitoring and efficient collection of SM. However, collecting high spatial resolution SM required substantial financial and labor investments for system maintenance, which resulted in limited data accuracy and spatial resolution[10]. As a continuous SM monitoring method, the limited number and regional coverage of automatic SM measurement stations can provide representative, accurate, and comparable continuous SM observation data. These systems significantly reduced the manual observation labor, enhancing the continuity of observation data, as well as remedied the labor-intensive field surveys and cost-prohibitive remote sensing. The automatic SM measurement method can provide high-quality datasets for drought monitoring and agrometeorological forecasting.
Numerous studies have demonstrated that SM exhibits distinct seasonal variability on annual trends, while presents pronounced spatial heterogeneity influenced by topographic features, soil textural properties, and vegetation coverage. Lu et al. (2020) conducted a comprehensive analysis of SM in the depth of 0-10 cm during the 2015-2018, which revealed significant positive correlations between SM and precipitation across the majority of Chinese regions, as well as a seasonal change pattern with peak values occurring in summer, intermediate levels in autumn, and minimum measurements recorded in both winter and spring[11]. Wang et al. (2022) identified that human activities, such as intensive agricultural expansion, unsustainable grazing practices, irrational land management, and elevated greenhouse gas emissions in recent decades have obviously disrupted the soil-water balance, which led to a declined trend of SM in both annual and seasonal in China[12]. Liu et al. (2020) revealed that the interception of the vegetation canopy induced a lagged response of SM to precipitation events, while the topographic variations altered the precipitation distribution with more precipitation on the windward slopes and less on the leeward slopes[13]. Li et al. (2023) indicated that sandy soil exhibited strong saturated hydraulic conductivity but poor water retention, while clay soil showed low permeability with high field capacity[14]. Asgarimehr et al. (2024) showed that areas with dense vegetation cover in Amazonian remained the relatively stable SM through transpiration and precipitation interception[15]. Both natural factors and human activities have significantly led to the loss of soil organic matter and water, resulting in a gradual SM decline.
Previous research on SM predominantly focused on meteorological and topographical factors. Mao et al. (2024) found that precipitation is the primary factor affecting SM at the nationwide scale, and the influence of meteorological drivers on SM gradually decreased from temperate to tropical zones[16]. In northern China, Zhang et al. (2022) identified that the SM variability across the Qinghai - Tibet Plateau region is greatly affected by factors of rainfall patterns, topographic features, and soil properties[17]. Yan et al. (2021) examined the current status and spatial variation of the surface SM in a typical red-layer ecological degradation area within the Nanxiong Basin, which revealed that SM was influenced by both structural factors, such as climate, parent material, and topography, and random factors related to human activities[18]. Regarding the mechanism analysis of the interaction factors on SM, Li et al. (2021) focused primarily on key factors including precipitation, temperature, evaporation, and land-use types, without considering secondary factors of wind speed and solar radiation[19]. Hui et al. (2025) have conducted extensive research on the hysteresis characteristics of SM in dry-wet seasons and different regions of China[20]. Nevertheless, there are relatively few comprehensive studies on the lag on an annual and national scale. Besides, the analysis of the mechanism of the complex interaplay among multiple factors and their time-lagged effects on SM is not enough. Consequently, it is an imperative research priority to systematically exploring the influencing factors and associated time-lagged effects on SM at both national and annual scales.
In order to revealing the spatio-temporal distribution characteristics of SM and its systematic influence, the regional spatio-temporal analysis, principal component analysis(PCA), and the random forest method were conducted using the data from 27 automatic SM measurement stations installed by the Aerospace Information Research Institute (AIR) across various climate zones in China during 2022 to 2024. The spatio-temporal characteristics of SM across different climatic zones and its distribution patterns at varying soil depths were elaborated, the effect of meteorological factors and land cover on SM dynamics were also analyzed. Furthermore, the lagged responses of soil moisture to the main influencing factors were explored. The study result is expected to provide scientific guidance for optimizing water allocation in irrigation district, improving regional hydrological modeling, and formulating climate change adaptation strategies to achieve the rational allocation of water resources.
2. Materials and Methods
2.1. Study area
China's territory extends from 73°E to 135°E and 3°N to 53°N (Figure 1) . The terrain exhibits a west-to-east descending gradient with complex geomorphology and distinct climatic zones. Vegetation diversity spans from forests to shrublands, savannas, farmlands, grasslands, and barren lands, showing a decreasing coverage gradient from southeastern coastal regions to northwestern inland areas[21]. The annual precipitation is 631.5 mm and presents a significant spatial heterogeneity ranging from 2000 mm in southern regions to 100 mm in northern areas. Extreme temperatures vary from -30°C in Mohe in Heilongjiang to 49°C in Turufan in Xinjiang. Evaporation shows substantial regional variation, from 500 mm in northeastern China to 2600 mm in northwestern Inner Mongolia[22]. Wind velocities range from calm conditions to typhoon-level intensities of 240 km/h[23]. Relative humidity exhibits marked contrasts between arid desert regions and southern coastal areas, reaching up to 90%.
2.2. Data resources
The SM data were derived from 27 automatic soil moisture monitoring stations deployed by AIR across various climatic regions of China during 2022-2024. These stations automatically collect SM data at an average interval of half an hour each day for soil layers at depths of 0-5 cm, 5-10 cm, 10-20 cm, and 20-40 cm. The Table 1 displayed individual automatic SM monitoring station information, including geographical locations, soil texture, and plant type. Meanwhile, the daily meteorological data such as mean temperature, maximum temperature, minimum temperature, mean wind speed, precipitation, and net solar radiation intensity were also gathered from the Wheat A Agricultural Meteorological Big Data System, which can analyze the impact of meteorological factors on SM.
2.3. Regional Division
The study area was divided into five distinct climatic zones, which included tropical monsoon, subtropical monsoon, temperate monsoon, temperate continental, and alpine plateau climates. Among the 27 study sites, Guangdong station is located in the tropical monsoon zone. Stations containing Dong ting Lake, Hefei, Nanjing, Qi yang, Qianyanzhou, Deqing, and Xiamen are situated in the subtropical monsoon zone. The temperate monsoon zone comprises stations at Guyuan, Jingyuetan, Qingdao, Yucheng, Luancheng, Shangqiu, and Shouyang. The temperate continental zone involves in the stations of Hulunbuir, Jiangshanjiao, Xilinhote, Bayannur, Da'an, and Heihe. The alpine plateau zone encompasses Haibei, Minqin, Nagqu, Western Tianshan, Kanas, and Turpan stations.
2.4. Methods
2.4.1. Temporal change
Based on the climatic zoning classification of 27 SM monitoring stations, the intra-annual variation patterns of daily mean SM across different soil layers were analyzed for each climatic zone using Origin 10.0 software.
2.4.2. Spatial distribution characteristics
According to the SM at the depth of 0 - 5 cm, 5 - 10 cm, 10 - 20 cm, and 20 - 40 cm soil layers from 27 soil moisture monitoring stations, the maximum, minimum, average values, and variation coefficients (CV) (Equation 1 to Equation 3) of the SM at each soil depths of individual station were further calculated. The Kriging interpolation method inset in ArcGIS 10.7 software was used for spatial interpolation to obtain the distribution characteristics of the annual and seasonal maximum, minimum, average values, and Cv of the SM[24].
where is the average value of the variable, x is the monitored variable in certain time, n is the total number of variable. The is the standard deviation of a series of variables, which implies the amount of variation or dispersion of the variable around the average value.
2.4.3. Analysis Methodology of Influencing Factors
(a) PCA
PCA is a dimensionality reduction technique that transforms multiple original variables into mutually independent principal components[25]. Components with feature value greater than 1 and cumulative contribution rates exceeding 80% are typically selected. PCA is considered as appropriate when the Kaiser-Meyer-Olkin (KMO) measure exceeds 0.5 and Bartlett's test of sphericity yields a significance level below 0.05[26]. The weight values of PCA indicate their relative importance in influencing SM, where higher weights denoting greater influence. Jaswal R et al.(2024) investigate the effects of different tillage and irrigation practices on SM, shoot-root growth parameters, and yield in maize-wheat cropping systems through PCA[27]. In this study, PCA analysis on daily SM and meteorological data from 27 regions (2022-2024) was conducted using SPSS 25.5, where the KMO was 0.771. Besides, Bartlett's test showed a significance level of 0.0001, indicating significant correlations among variables and effective PCA.
(2)Random Forest Analysis
Feature importance scores are recognized as a critical tools for understanding the internal mechanisms of complex models, which is helpful to identify key features contributing greatly to predictive performance during the in-depth analysis[28]. The Random Forest algorithm creates multiple subsets through the sampling method with re-putting, then randomly selects some features for training the decision tree. It can give each decision tree uniqueness and significantly improve the generalization ability of the model. During the training process, Random Forest method quantifies the importance score of each feature, where higher scores indicate greater influence of the feature on SM. Zheng et al.(2024) [29] achieved high-precision inversion of SM utilizing the Random Forest algorithm and multiple decision trees. In this study, meteorological variables including mean temperature, maximum temperature, minimum temperature, precipitation, average wind speed, and solar radiation were selected as input features. It was revealed that the contribution of different meteorological factors in SM dynamics applying the Random Forest algorithm.
(c) Cross-correlation function(CCF)
The CCF quantitatively describes the intrinsic relationship between input and output variables. The peak value of the cross-correlation coefficient curve indicates the response intensity between two sequential variables, where higher peaks signify stronger influence of input factors on output variables[30]. The temporal position of the peak reveals the lag time, where the first peak corresponds to the time lag between output and input variables. Zhang et al. (2024) [31] revealed temperature lag effects on SM in the research of crop water stress index for winter wheat monitoring. In this paper, CCF was used to analyze the lagged effects of daily precipitation and temperature on daily SM.
3. Results and Discussion
3.1. Temporal Dynamics of SM
Monthly SM variations differed significantly across climatic zones. The tropical monsoon regions, subtropical monsoon regions and temperate monsoon regions exhibited minimal differences of SM across soil depths, whereas the temperate continental and alpine zones displayed apparent seasonal fluctuations of SM(Figure 2). In tropical monsoon zones, monthly SM at different depths varied moderately between 28.38% and 42.27%, which attributed to abundant and evenly distributed precipitation. In the subtropical monsoon regions, rapid runoff formation and short water retention time led to relatively lower SM ranging from 26.67% to 40.10%, especially during August-November. Temperate monsoon regions ranged from 16.90% to 29.87%. Precipitation was predominantly concentrated in summer, which resulted in higher SM levels during spring and summer compared to autumn and winter. Less soil evaporation with dense vegetation canopy in this climatic area, combined well-developed root systems led to relatively stable SM across depths[32]. In the temperate continental and alpine zones, the range fluctuations of annual SM were 10.01%-32.84% and 8.26%-25.39%, respectively. Similar to the trend of precipitation, these regions expressed obvious seasonal SM variations with higher levels in spring/summer and lower levels in autumn/winter. Seasonal precipitation patterns, temperature-driven evaporation and freeze-thaw processes, as well as vegetation-mediated water retention capacity, collectively determining spatiotemporal SM variations across distinct climatic zones.
3.2. Spatial distribution characteristics of soil moisture content
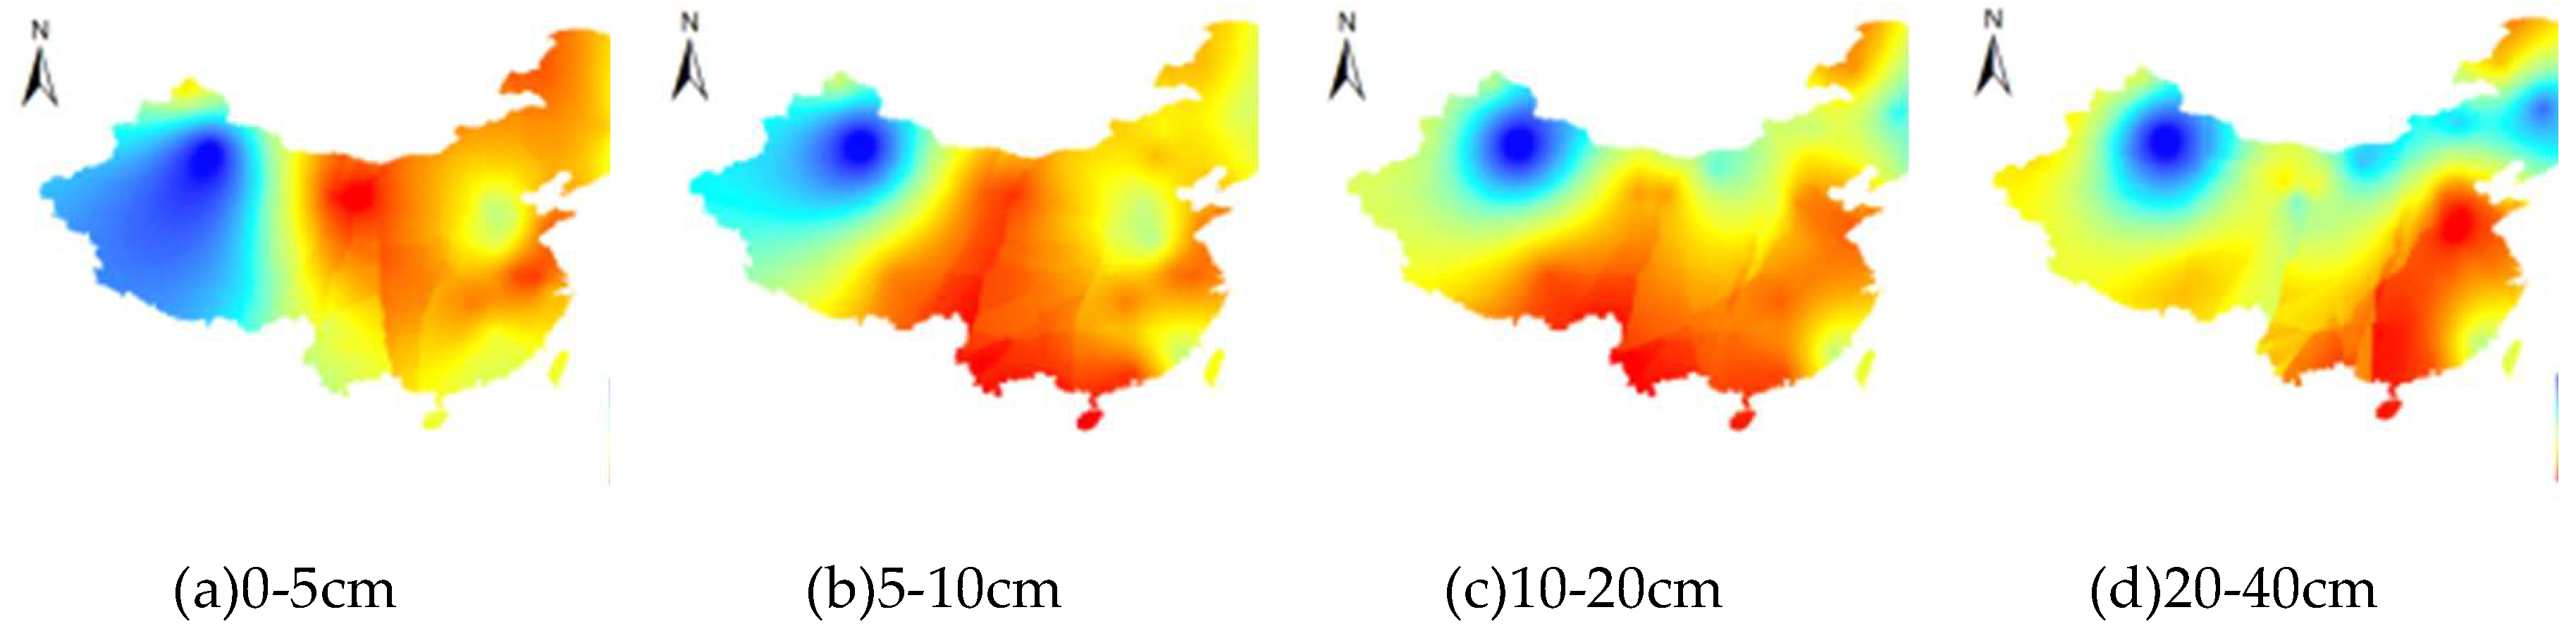
Generally, the annual daily average SM in China showed a gradual declining trend from the southeast to the northwest, while the dispersion gradually increased from the south to the north and from the east to the west. Spatial distribution characteristics and differences of annual daily average SM and its Cv in China were shown in Figure 3-12. Due to concentrated and intense rainfall, the stations of Guangzhou, Deqing, and Xiamen in the southeastern region located in the tropical and subtropical monsoon climate zone expressed a relatively high SM with an average of 32.7% and a Cv less than 0.2. Specially, the maximum surface SM in Nanjing and Hefei reached 72.9% and 65.7%, respectively, which was influenced by agricultural irrigation and urban greening water usage. With the reduced precipitation, the seasonal SM at stations of Guyuan, Qingdao, and Shangqiu in the central region characterized by a temperate monsoon climate were pronounced and the average SM was below 25%. The vegetation classification varied from forests to grasslands, which caused the soil's water retention capabilities with a Cv over 0.27. The alpine frigid climate zone and the temperate continental climate zone in Northwest and Northeast regions, where manifested strong instability affected by seasonal rainfall and freezing-thawing. The mean SM at stations of Kanas and Turpan was approximately 16%, and the Cv of SM was more than 0.4. Overall, the distribution of annual daily average SM marked differences across various regions, which were influenced by the integrated effects of climate type, precipitation patterns, and vegetation coverage.
Figure 3.
Spatial distribution characteristics of annual daily average SM in China.

Figure 4.
Spatial distribution characteristics of annual Cv of SM in China.
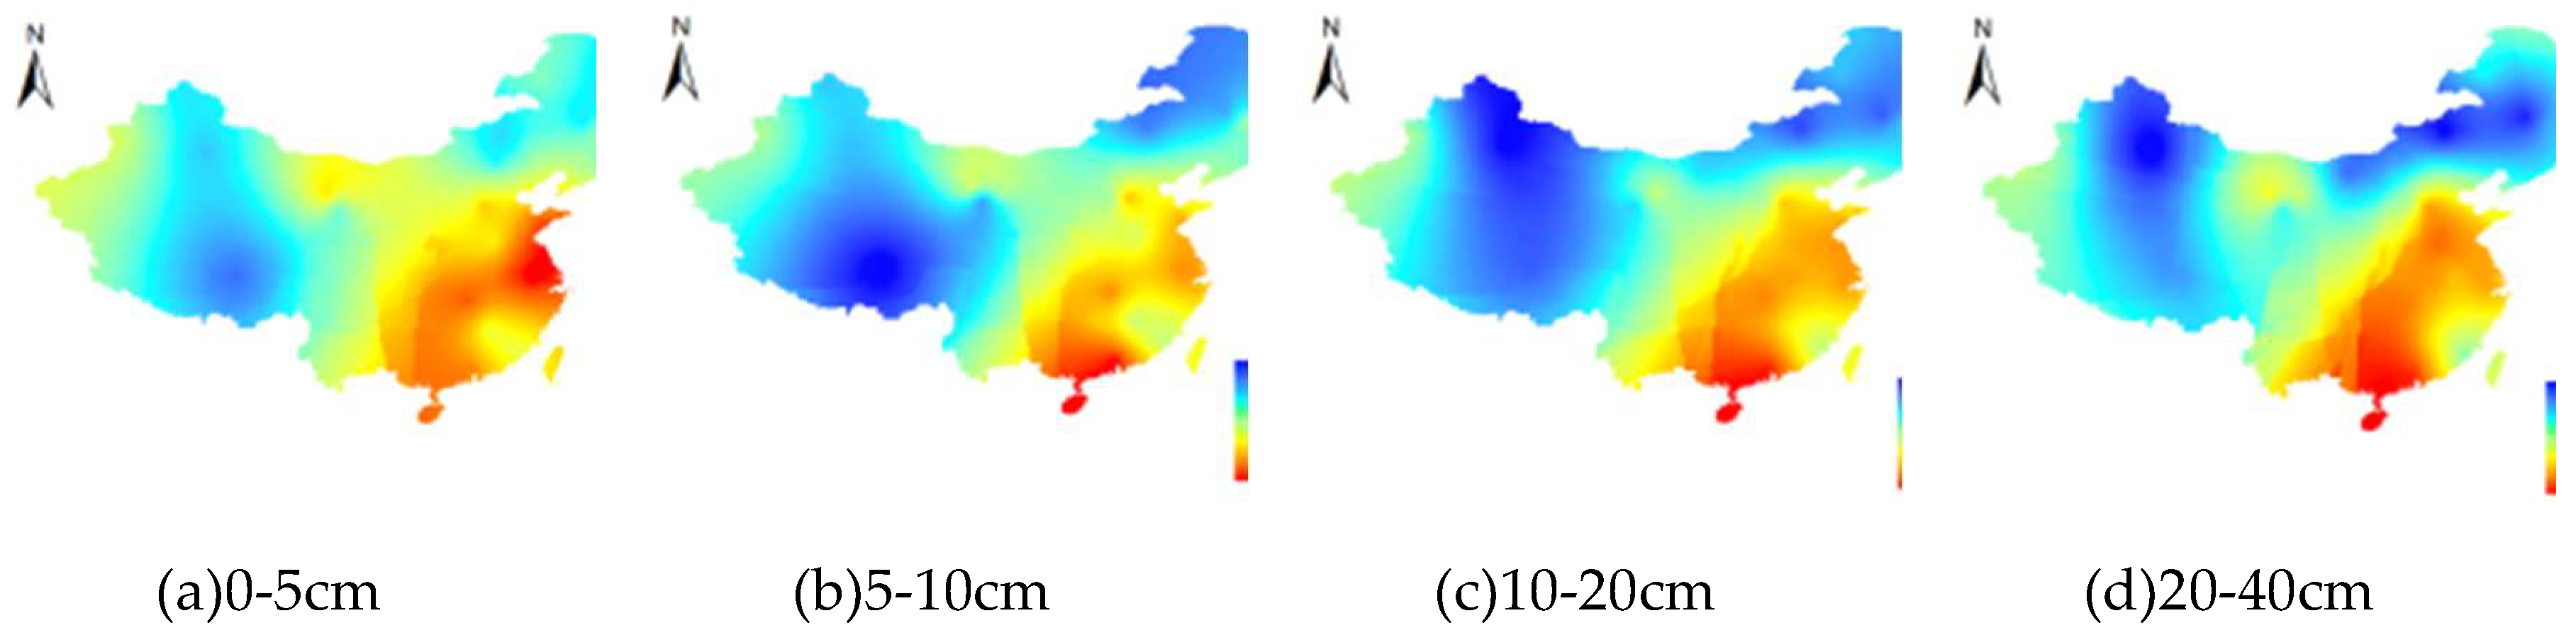
Figure 5.
Spatial distribution characteristics of average SM in Spring in China.
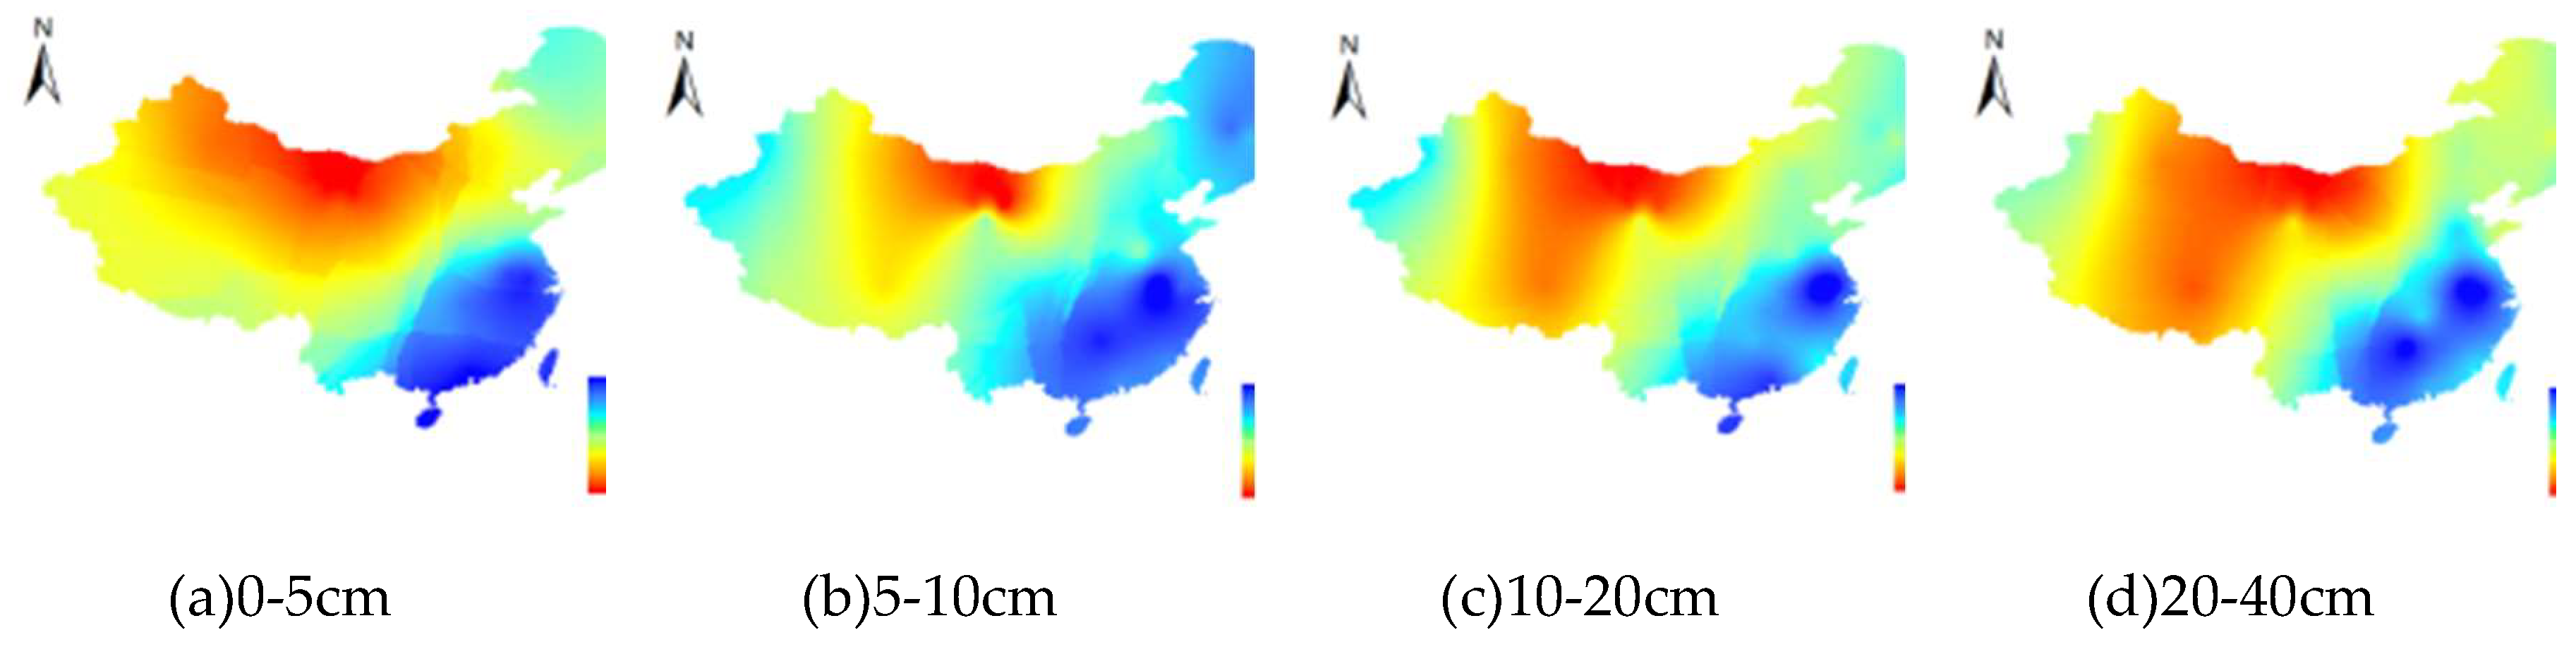
Figure 6.
Spatial distribution characteristics of Cv of SM in Spring in China.
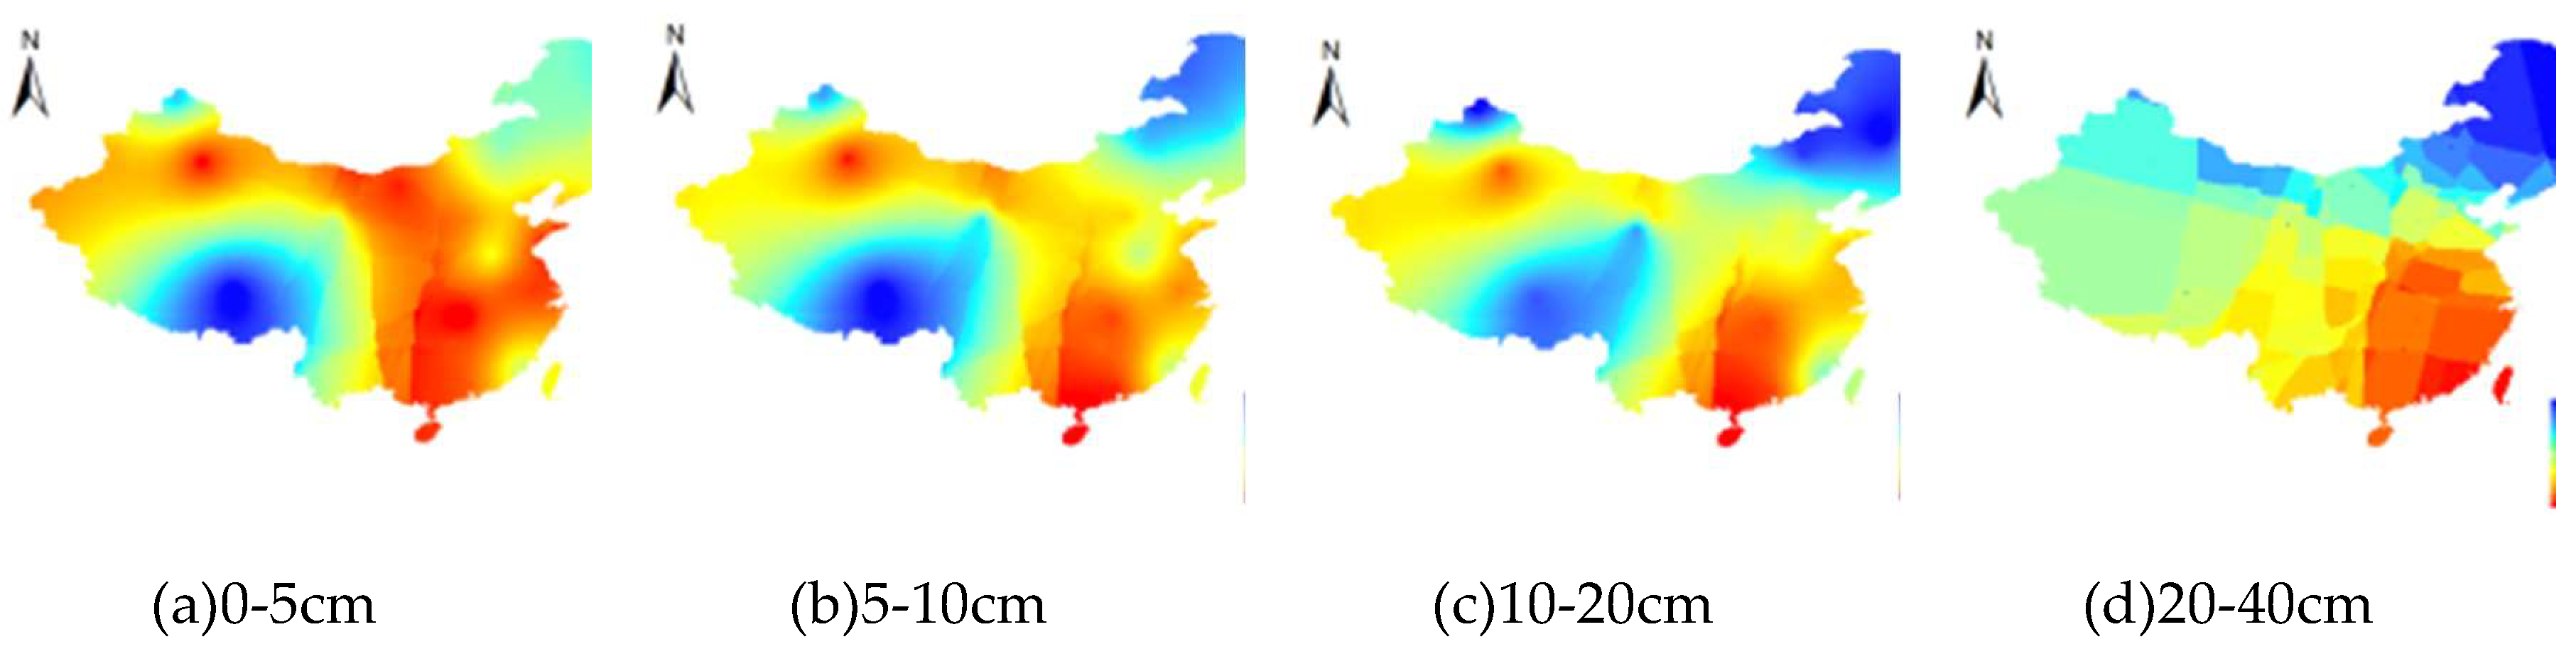
Figure 7.
Spatial distribution characteristics of average SM in Summer in China.
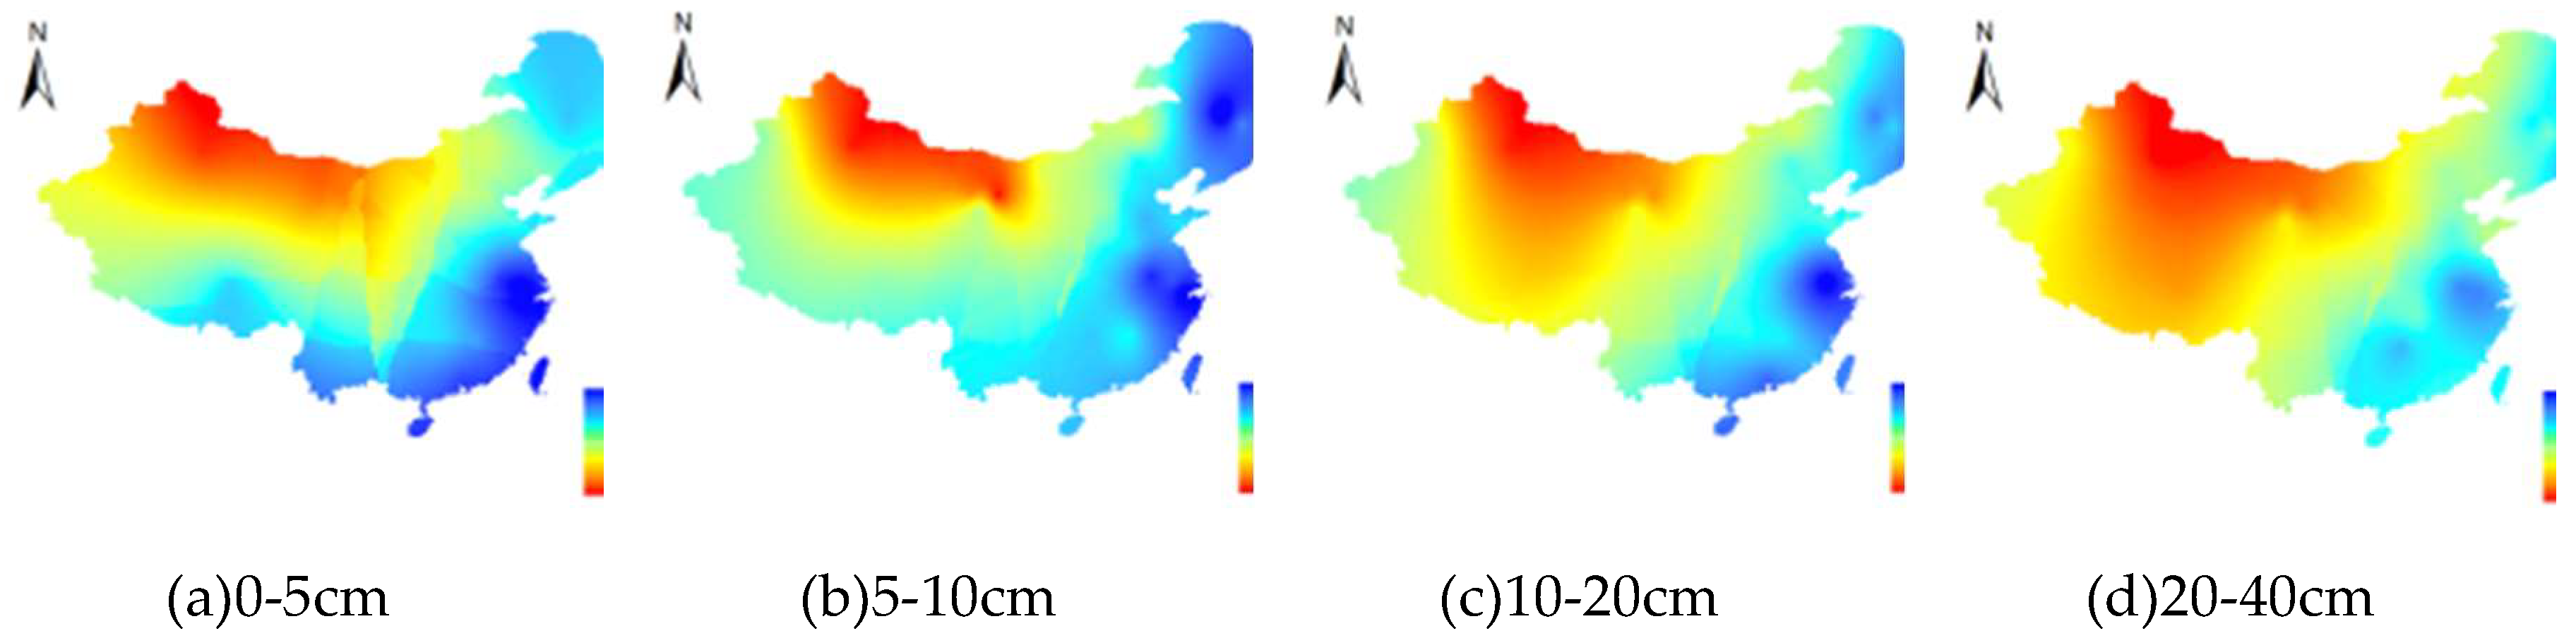
Figure 8.
Spatial distribution characteristics of Cv of SM in Summer in China.
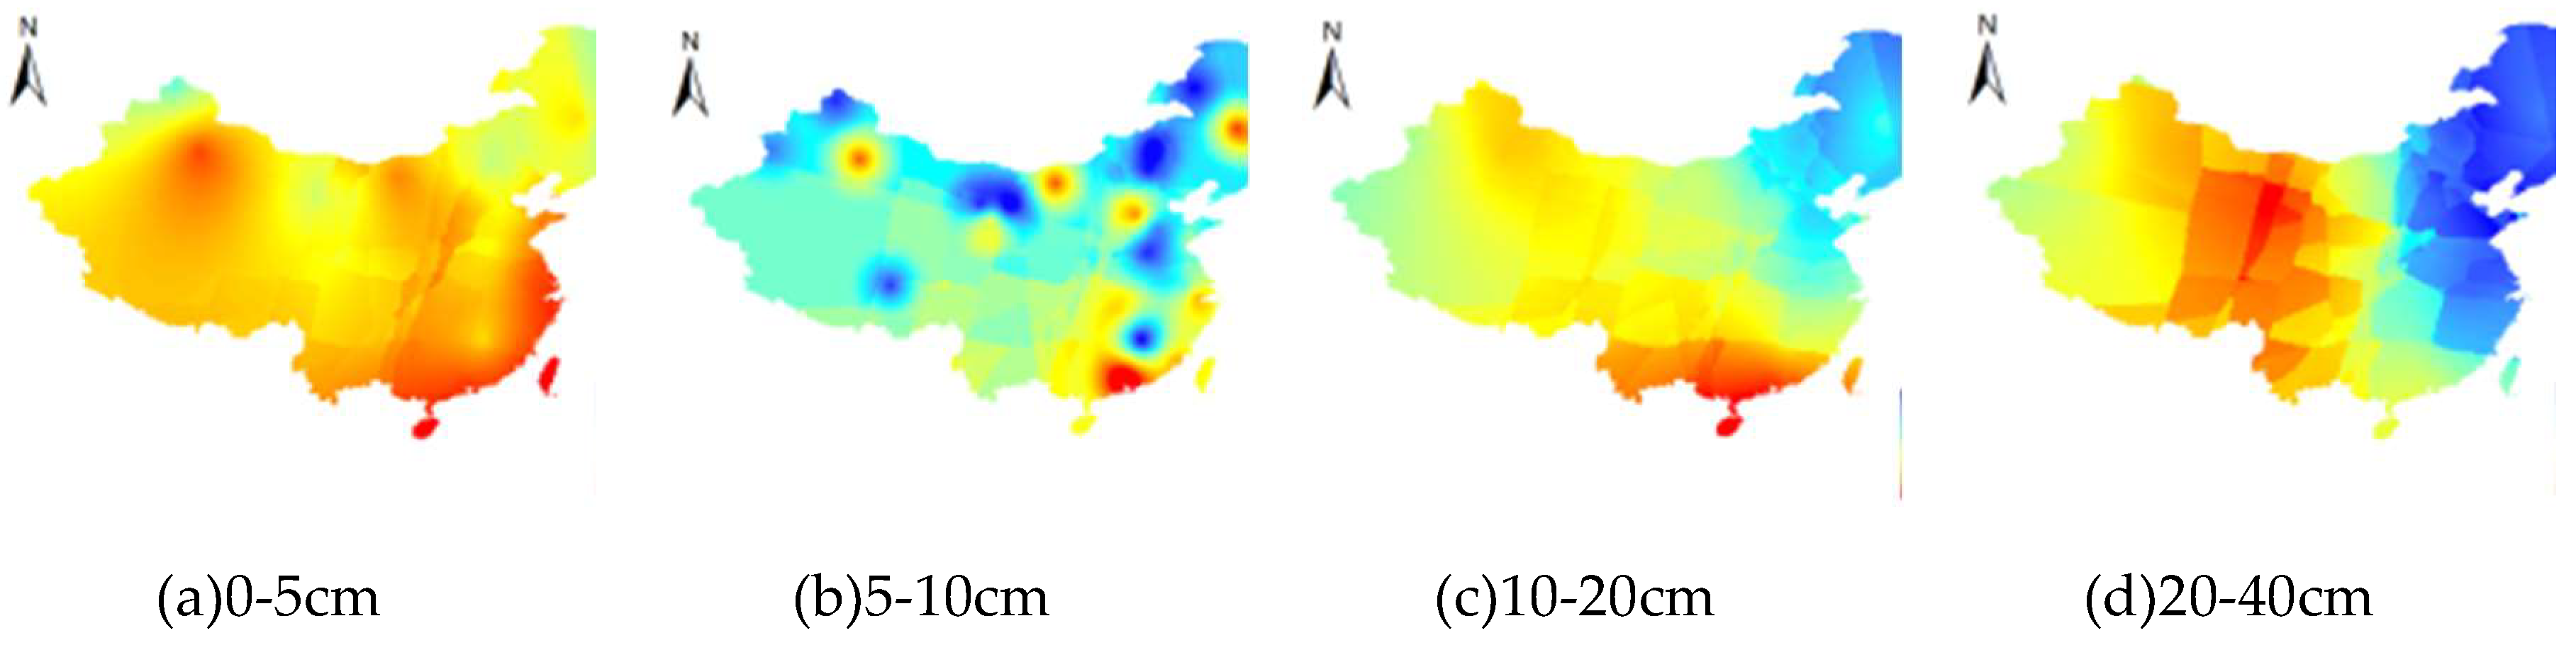
Figure 9.
Spatial distribution characteristics of average SM in Autumn in China.
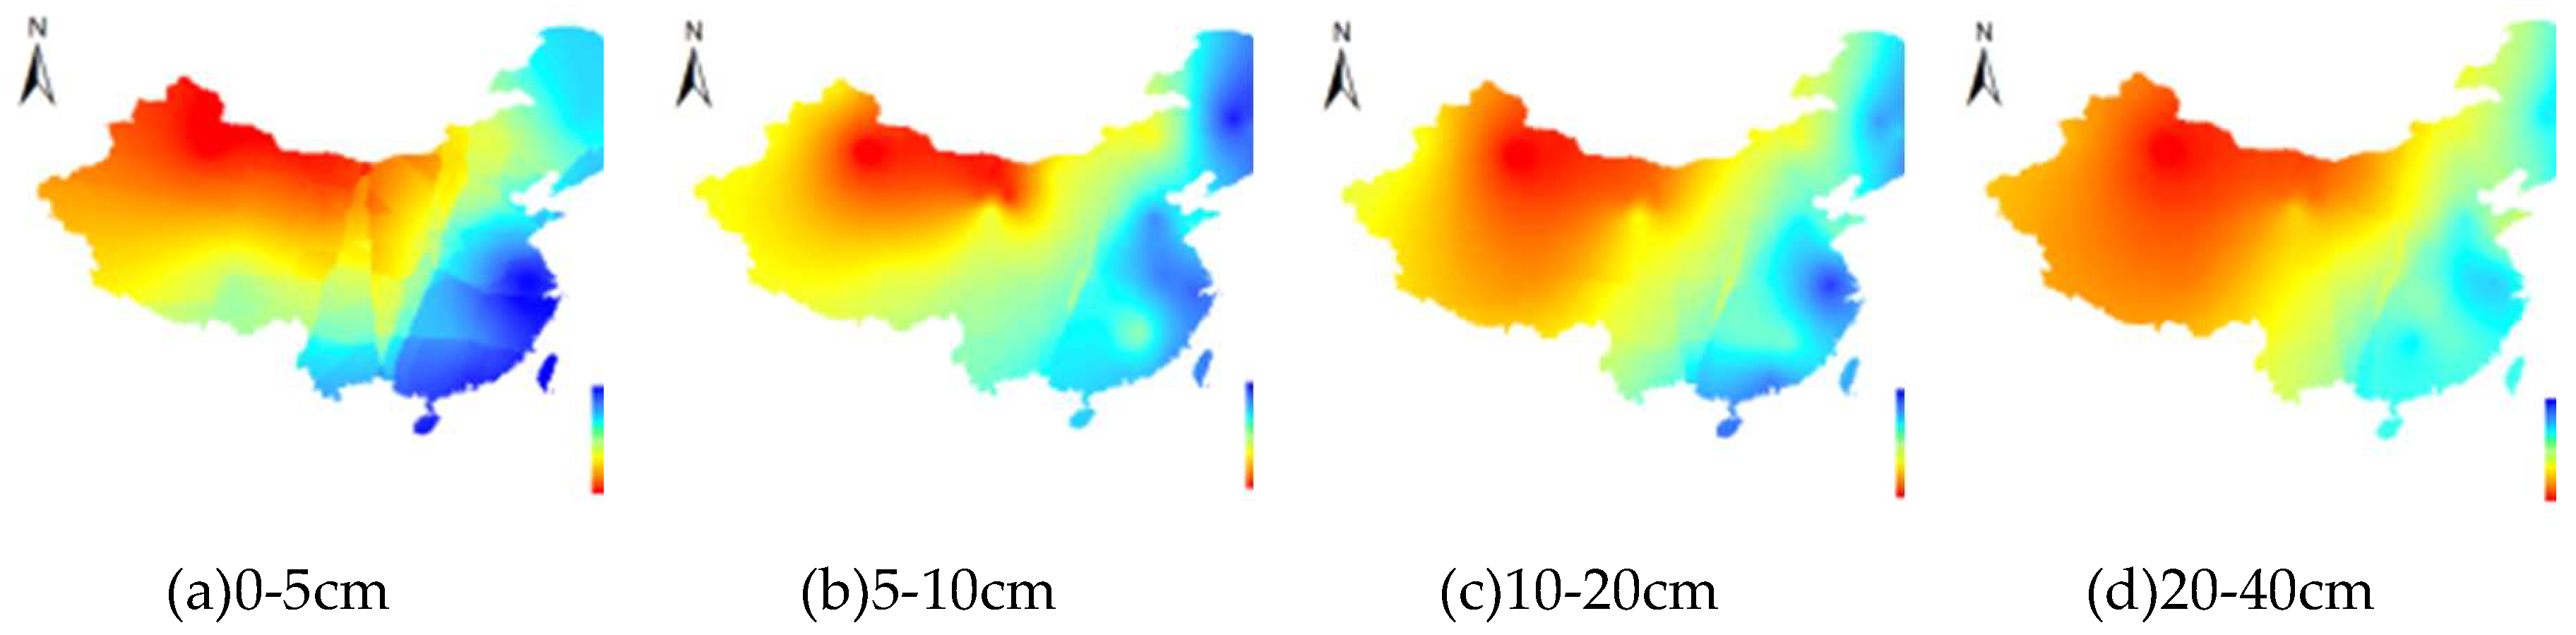
Figure 10.
Spatial distribution characteristics of Cv of SM in Autumn in China.
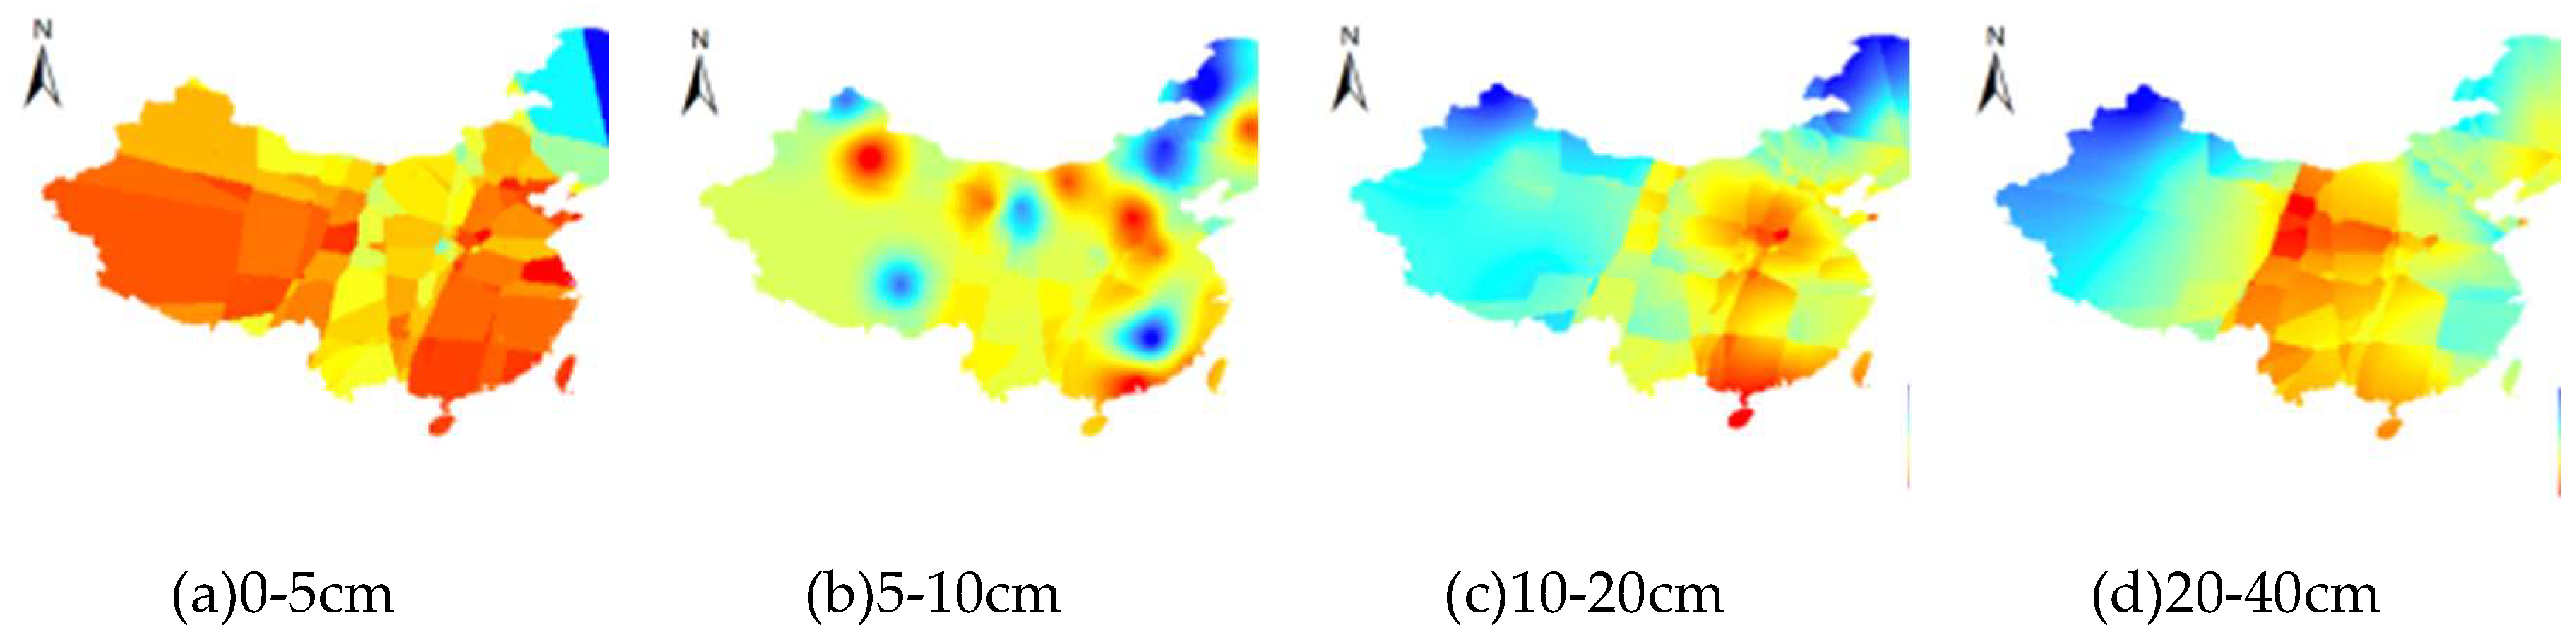
Figure 11.
Spatial distribution characteristics of average SM in Winter in China.
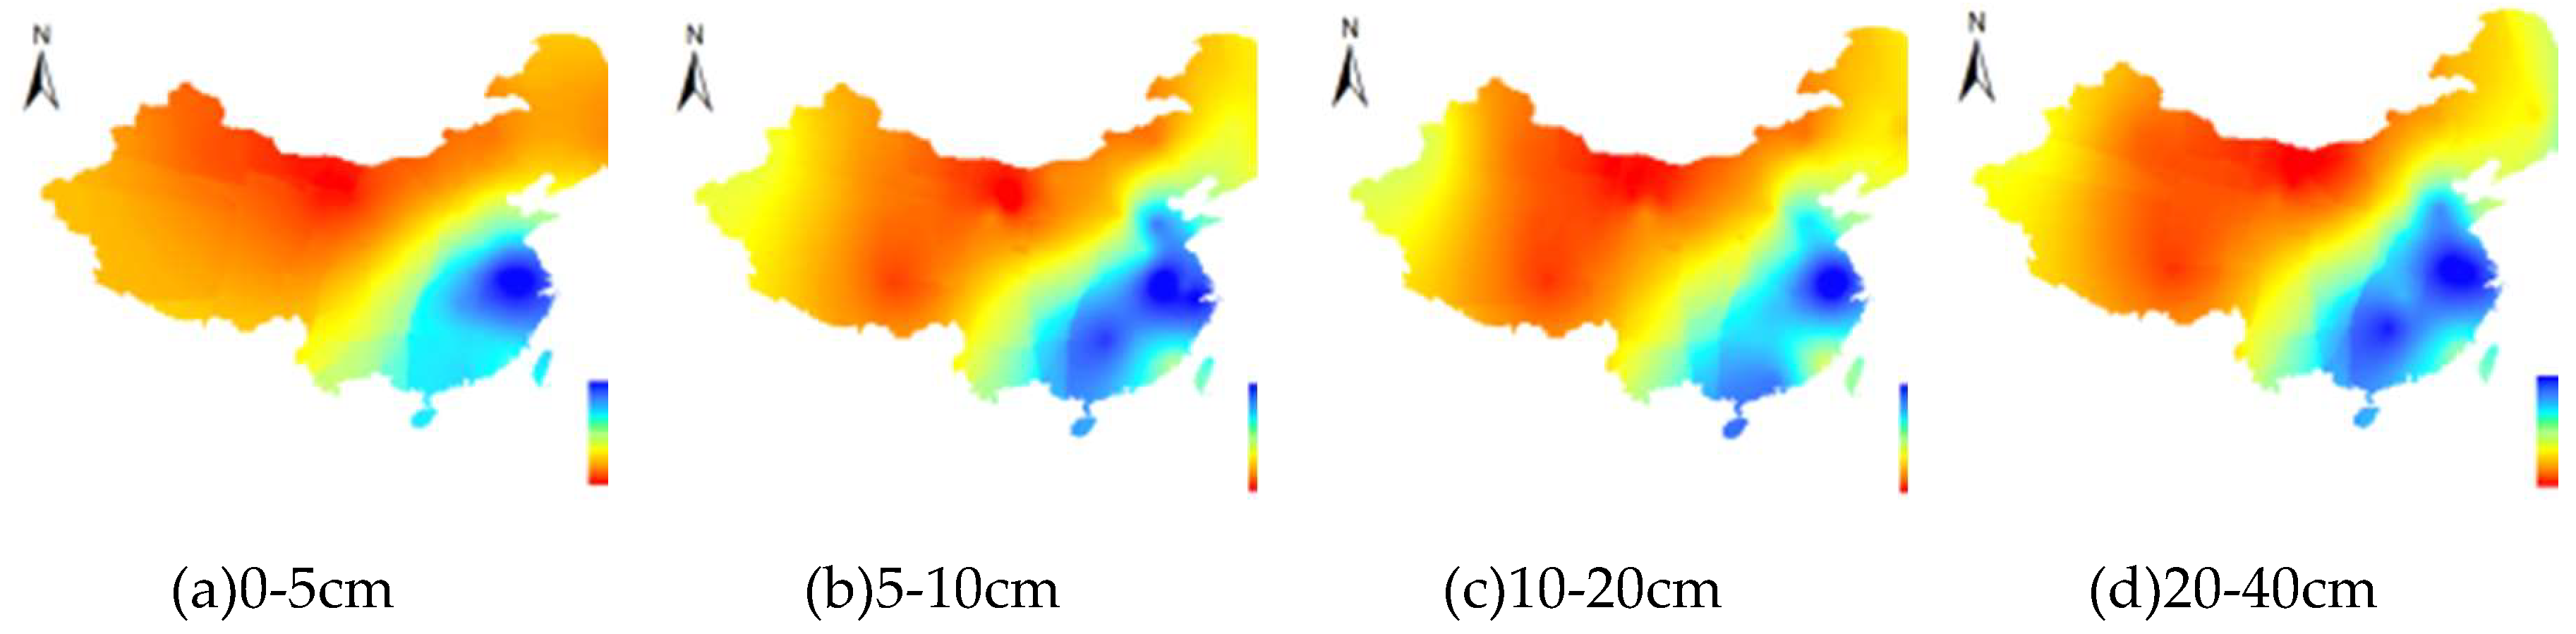
Figure 12.
Spatial distribution characteristics of Cv of SM in Winter in China.
3.3. The SM change pattern with increasing soil depth
It can be seen from Figure 13 that the vertical distribution patterns of multi-day average SM at the majority of stations approximately exhibited a quadratic relationship with soil depth. It characterized by an initial increase followed by subsequent decrease or a continuous ascending trend with increasing depth, reaching peak moisture content at depths of 20–40 cm. The loose soil structure and rapid evaporation resulted in the low SM in surface soil layers. With increasing depth, SM increased driving by a huge decline of evaporation. When the soil layer reached a certain depth, the soil in deep soil showed two trends. The SM in deep soil displayed a gradually decreased trend affected by compact soil structure and weak infiltration ability, as well as increased trend because of groundwater recharge. Li et al. (2022) [33] found that the relatively high and stable SM in the Nam Co, Mount Qomolangma, and Southeast Tibet stations occurred in 40 cm, 20 cm, and 60 cm depths , respectively, which was consistent with the result of this study.
Nevertheless, there also displayed special change trend in certain SM monitoring sites. The SM of Hefei, Nanjing, and Xiamen in subtropical monsoon climate regions located in rivers or coastal areas , which decreased initially and then increased with soil depth. The surface soil moisture was significantly reduced due to evaporation and plant transpiration [34]. But the groundwater recharge from adjacent rivers or seawater elevated deep SM in deep soil. However, the SM in tea garden in mountain at Dongting Lake Station declined progressively with increasing soil depth by the influence of less groundwater recharge[35]. In temperate continental climate regions, such as Hulunbuir and Bayannur, the SM decreased with increasing soil depth, where had dense vegetation and strong interception ability, as well as poor soil water holding capacity[36]. Overall, soil moisture dynamics were influenced by a combination of soil texture, climatic conditions, and underlying surface characteristics.
3.4. Effects of Meteorological Factors on SM
The meteorological factors affecting SM were ranked in mean temperature> maximum temperature>minimum temperature>precipitation>net solar radiation intensity>mean wind speed. As shown in Table 2, Principal Component 1 showed the strong positive correlations with mean, maximum, and minimum temperatures, and net solar radiation intensity. Principal Component 2 demonstrated a significantly positive correlation with precipitation. Whereas Principal Component 3 exhibited a strong positive correlation with mean wind speed.
Table 3 indicated that temperature emerged as the predominant factor, followed by precipitation, with other factors exerting relatively minor influences. This finding were similar to the result of Li et al. (2025) [37], who identified temperature and precipitation as primary determinants, with temperature elevation being the principal driver of SM reduction.
3.5. Contribution Analysis of meteorological factors to SM in different soil layers
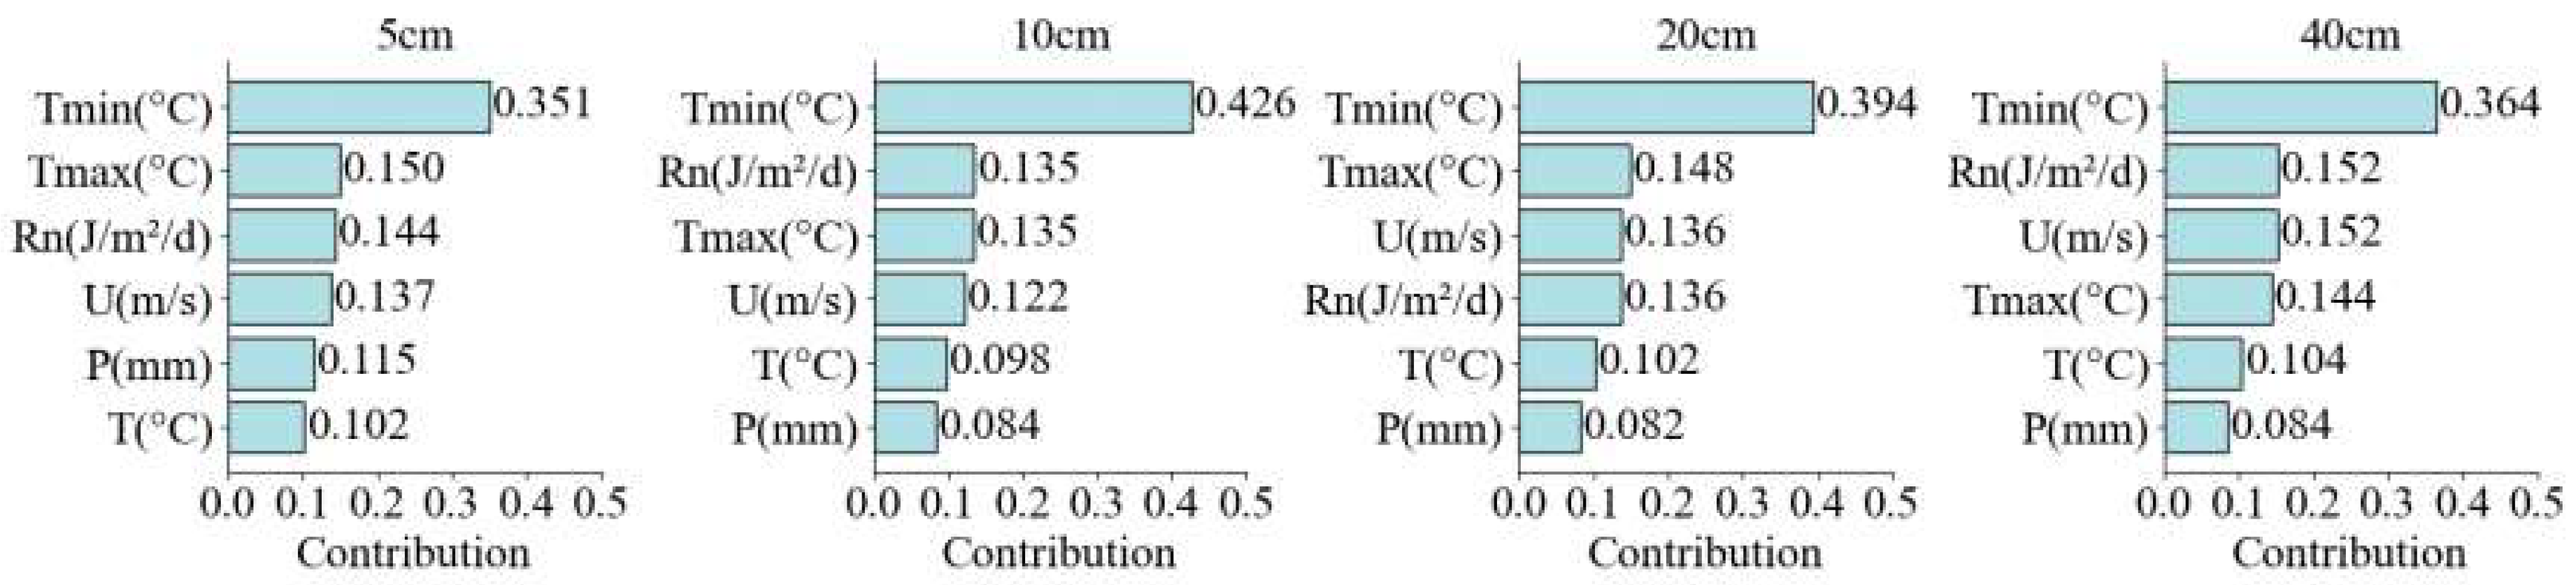
The contribution of meteorological factors to SM across different soil layers in various climate zones is shown from Figure 14 to Figure 19. Generally, the minimum temperature exhibited the highest contribution to soil moisture in each layer, but the dominant factors varied among climate zones and soil depths. In the tropical monsoon climate zone, precipitation was demonstrated as the largest contributing factor to SM in the soil of 0–10 cm, while the minimum temperature was the major contribute factor to SM at 10–40 cm. The balance of precipitation and evaporation formed a dynamic surface SM equilibrium. The minimum temperatures reduced soil evaporation and plant transpiration, which can minimized SM loss and preserved water in deeper layers[38]. In the subtropical monsoon climate zone, maximum temperature and net solar radiation intensity enhanced surface energy input, driving rapid soil evaporation and vegetation transpiration, which dominated SM depletion in all layers[39]. Both in temperate monsoon and temperate continental climate zones, the minimum temperature and precipitation were recognized as the remarkable and tiny contribution factors to SM across all layers. In alpine plateau climate zone, precipitation and wind speed were the largest contribution factors to SM at the soil of 0–10 cm and 20–40 cm, respectively.
The study result is significant for understanding and predicting SM dynamics, which can provide implications for agricultural irrigation and water resource management. In tropical monsoon zones, irrigation scheduling needs to be optimized utilizing deep soil water in drought season. Subtropical regions require heat-tolerant crops against intense solar radiation. Temperate zones should focus on winter moisture conservation and utilization of snow melt resources. It is necessary to improve crop species and optimizing landform in Alpine regions.
Figure 14.
Contribution values of various meteorological factors to SM in each soil layers in tropical monsoon climate zone.
Figure 14.
Contribution values of various meteorological factors to SM in each soil layers in tropical monsoon climate zone.
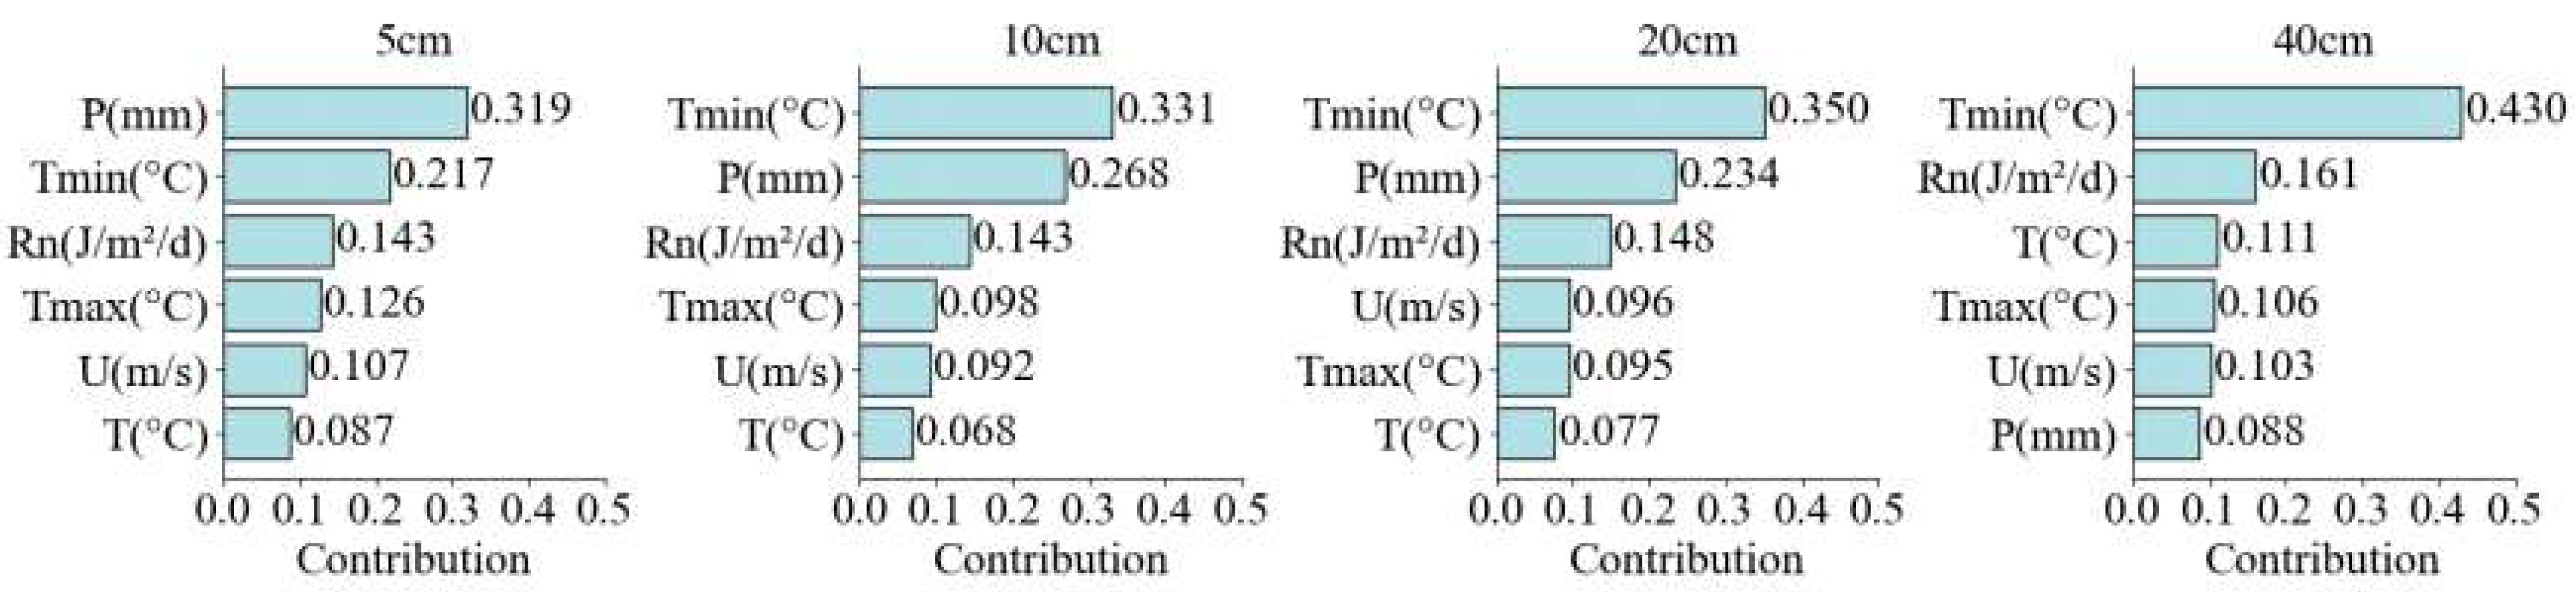
Figure 15.
Contribution values of various meteorological factors to SM in each soil layers in subtropical monsoon climate zone.
Figure 15.
Contribution values of various meteorological factors to SM in each soil layers in subtropical monsoon climate zone.
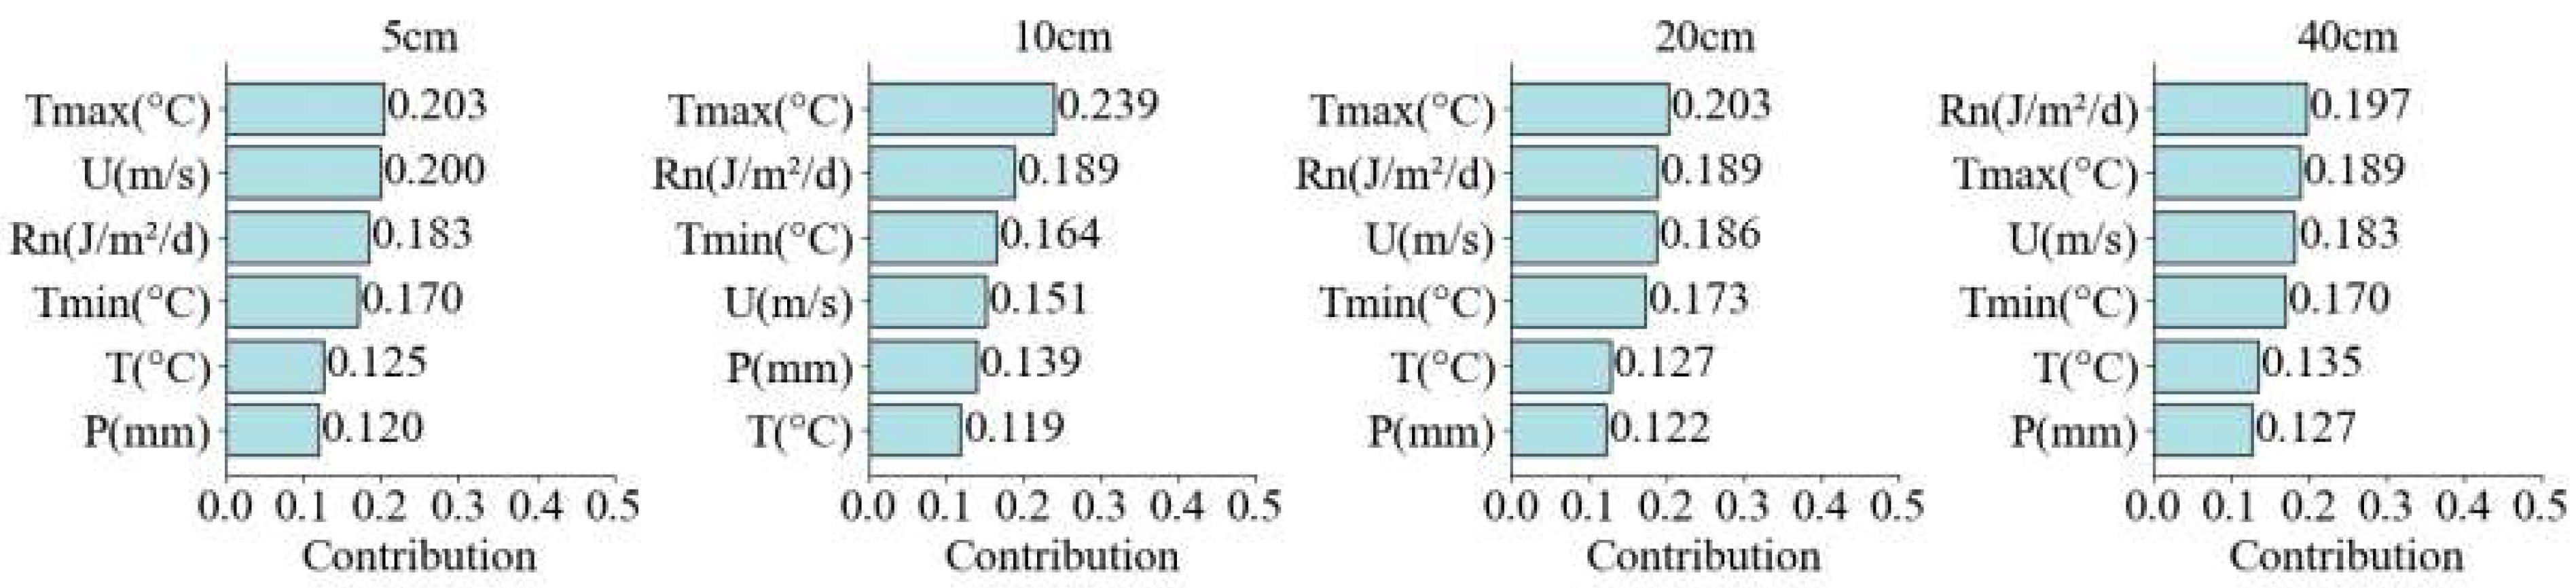
Figure 16.
Contribution values of various meteorological factors to SM in each soil layers in temperate monsoon climate zone.
Figure 16.
Contribution values of various meteorological factors to SM in each soil layers in temperate monsoon climate zone.
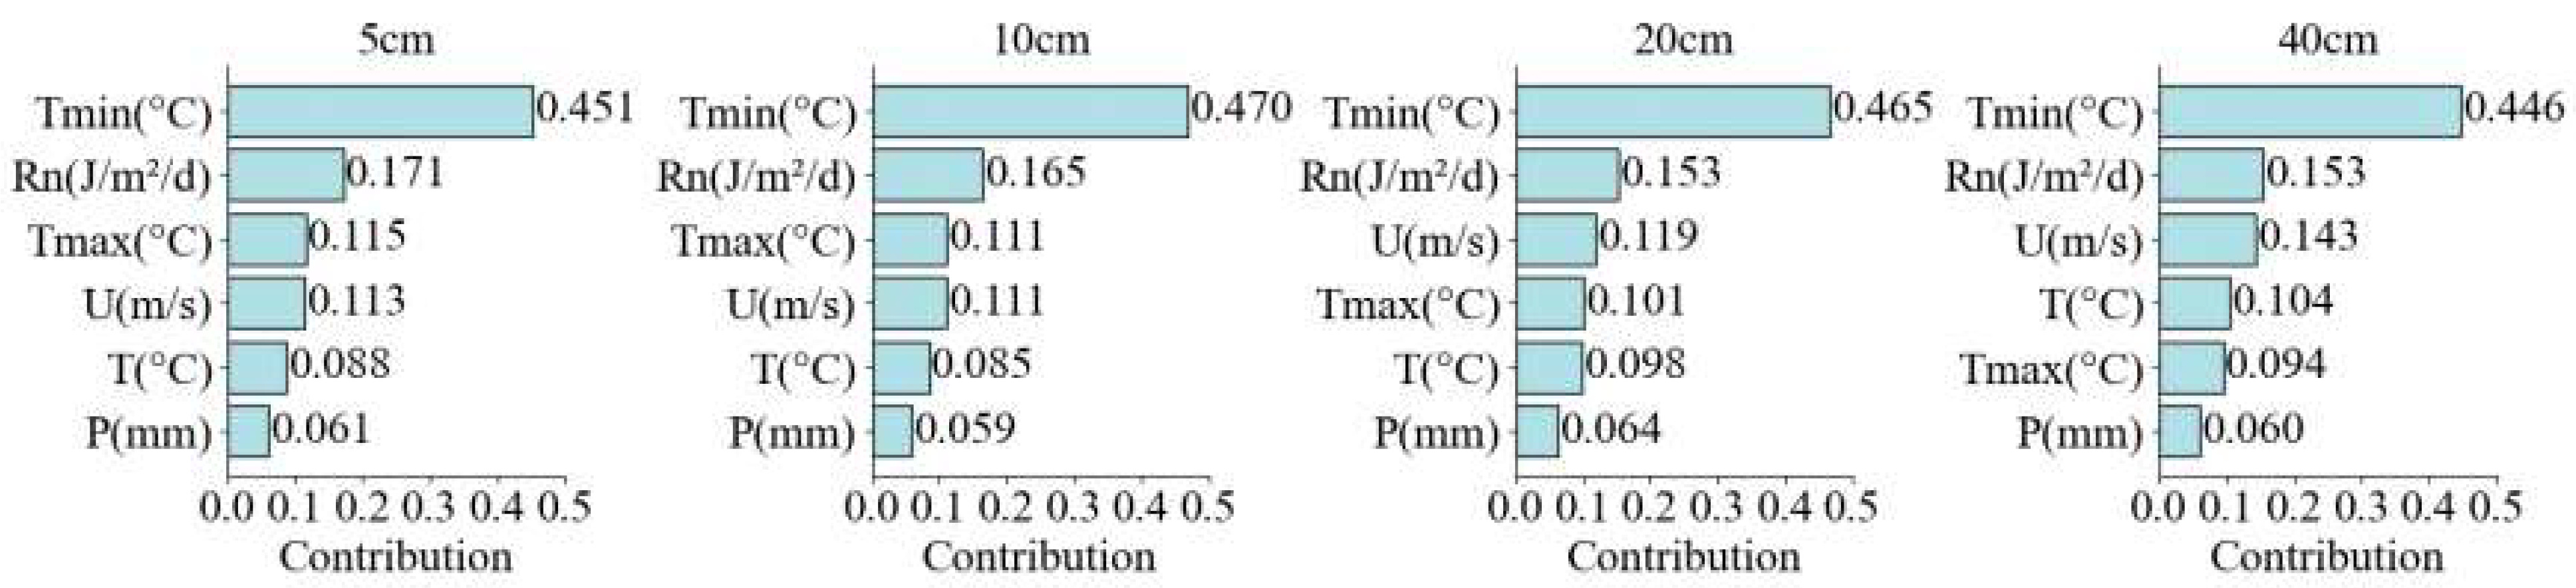
Figure 17.
Contribution values of various meteorological factors to SM in each soil layers in temperate continental climate zone.
Figure 17.
Contribution values of various meteorological factors to SM in each soil layers in temperate continental climate zone.
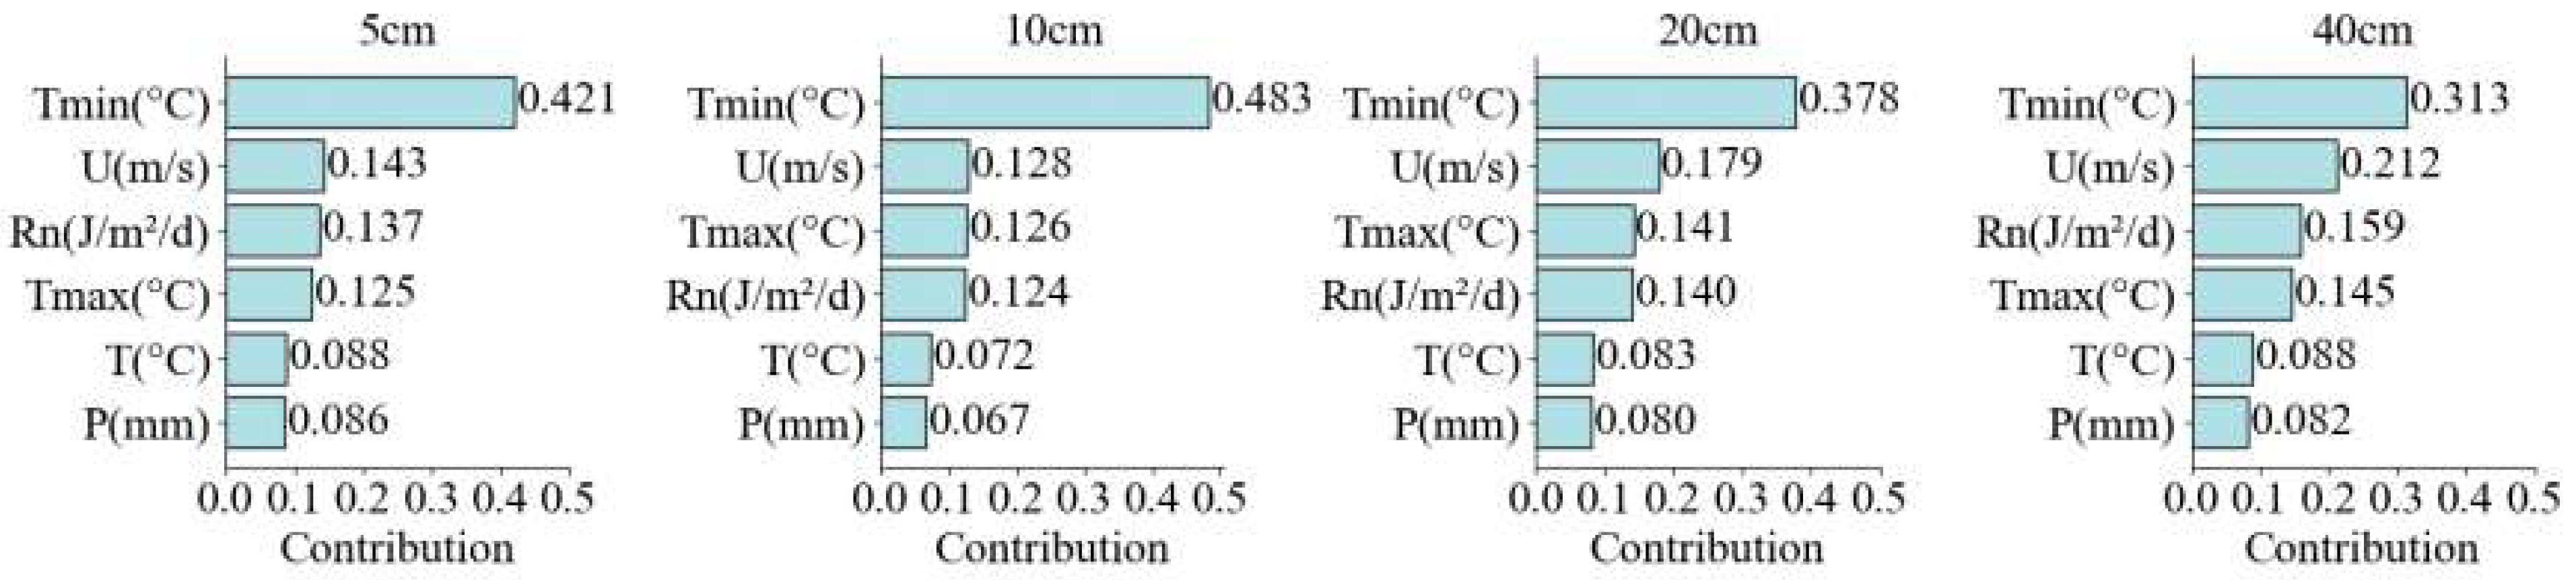
Figure 18.
Contribution values of various meteorological factors to SM in each soil layers in alpine plateau climate zone.
Figure 18.
Contribution values of various meteorological factors to SM in each soil layers in alpine plateau climate zone.
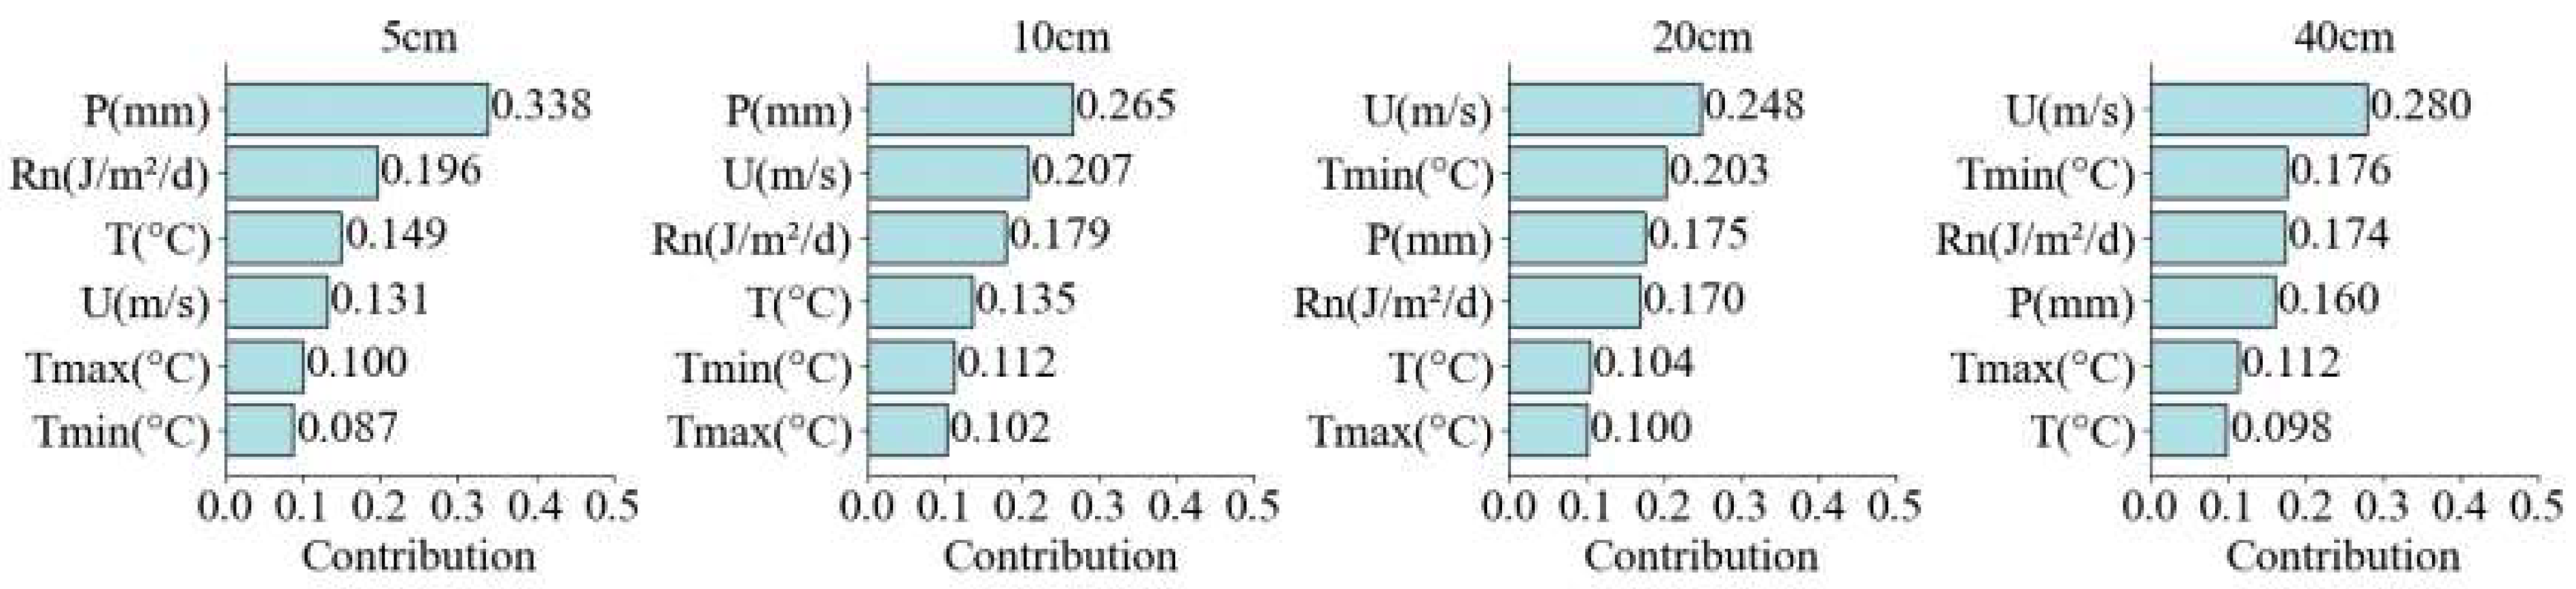
Figure 19.
Contribution values of various meteorological factors to SM in each soil layers indifferent zones.
Figure 19.
Contribution values of various meteorological factors to SM in each soil layers indifferent zones.
4. Discussion
4.1. Spatial differences analysis of Cv for SM
The seasonal Cv is influenced by region, topography, and vegetation. The Cv distribution across different seasons and regions is complex, which affects the SM dynamic balance in further. Li et al. (2022) [40] also found the similar result that the unstable temperature and precipitation were unstable in spring and autumn led to large Cv of SM in Northeastern and high-altitude areas in China. Yu et al. (2019) showed the larger fluctuations of SM in the Loess Plateau, especially in summer and winter[41]. Eunhyung L et al. (2022) reflected that the deep-layer SM in mountainous areas was significantly affected by topography and geological structures [42]. Both Wei S (2022) and Xiaodong L (2022) found the SM in tropical rainforests and subtropical forests was steady result of high vegetation with root fixation, canopy interception, and transpiration [43]. Ding et al. (2023) analyzed that poor holding capacity, rapid surface runoff and strong evaporation resulted in intensified fluctuations in SM in low-coverage grassland vegetation area[44]. Research showed that the distribution of SM was mainly controlled by precipitation, temperature, and soil layer depth, and its dynamic change was the result of the combined function of multiple factors such as climate, topography, and vegetation.
4.2. The impact of underlying surfaces and human activities on soil moisture content
Except for meteorological variables, vegetation cover and soil texture are also the important influence factors in SM distribution. The different effects of absorbing and utilizing with different crops during the whole growth processes influenced SM, which were attributed to the different physiological characteristics, root distribution, and growth period[45]. Lower SM appeared in the site of Heihe and Turufan in sandy grasslands with loose soil particles and sparse plant roots[46]. In corn-planting areas such as Bayannur, Shangqiu, Shouyang, and Luancheng, corn had high water requirement during its growth period, which led to relatively low SM, approximately 15 - 25% [47]. The dense shallow roots in Qianyanzhou and Xilinhot in grass-covered areas can effectively reduce surface soil evaporation, which maintained SM level with 8-18%[48]. In contrast, the woodland/orchard areas, such as Jiangshanjiao and Western Tianshan, presented the soil water - holding capacity with 20 - 35% result of less soil evaporation[49]. Additionally, the SM in Deqing and Hefei were 70-100%, which showed relatively higher relying on rice - planting with necessary irrigation water depth[50]. Generally, the SM of different crops followed the order: paddy rice > woodland/orchard areas > corn/wheat land> grassland > sandy grassland.
Moreover, human activities also have a significant impact on SM. The negative impacts of human activities on SM were mainly reflected in substantial irrigation, reclamation, over-grazing, and unreasonable land use. Although irrigation can supplement soil water in the short term, long-term and excessive irrigation and reclamation led to the loss of soil structure and nutrients[51], which accelerated SM decline. Over-grazing exceeded the carrying capacity of the grassland ecosystem, meanwhile, it hastened the degradation of soil water - holding capacity. The research by Han et al. (2024) illustrated that long-term unreasonable land use destroyed the soil aggregate structure[52], thus was more likely to infiltrate and evaporate. In this study, human activities damage the natural structure and soil water-holding capacity.
To improve soil water-holding capacity, optimization considering ecological and technologies should be carried out from the aspects of vegetation selection, planting methods, and land management. The deep-rooted plants such as alfalfa and sea - buckthorn can be selected for promoting vertical water infiltration and reducing evaporation. Drought-tolerant tree species of pine and juniper can also enhance water - holding capacity and reduce water evaporation[53]. Adopting conservation tillage methods, such as no-till or minimum tillage, contour planting, and terrace construction can help reduce evaporation and water loss[54]. Precision irrigation and organic fertilizers application can significantly improve water use efficiency andsoil water holding capacity[55].
4.3. Lagged Effect of Meteorological Factors to Soil Moisture
Due to surface infiltration capacity and underlying surface characteristics, the SM change had a certain lag effects compared with individual influencing factors[56]. Among these factors, precipitation and temperature had more closely influence on SM. Therefore, this study focused on the temporal lag effects relative to precipitation and temperature.
Figure 20 presented the cross-correlation coefficients between daily precipitation and SM. It was revealed that lag times relative to precipitation in tropical monsoon, subtropical monsoon, temperate monsoon, temperate continental, and alpine climates were 3day, 2day, 2day, 3day, and 6 days, respectively. Figure 21 illustrated the temperature-SM relationship, showing longer lag times of 21, 47, 54, 101, and 83 days, respectively. Higher temperatures accelerate SM variations under soil moisture evaporation, reducing lag times. Soil water infiltration rates primarily determine precipitation lag effects, thereby intense rainfall promoting faster SM response[57]. This study indicated stronger temperature-induced lag effects to SM compared to precipitation, which was consistent with researches in humid zones and Yangtze River Basin. Wang et al. (2024) [58] reported 30-day temperature lags and 3-day precipitation lags in humid zones. Tian et al. (2022) [59] observed 1-2 month temperature lags and 2-3 day precipitation lags in the Yangtze River Basin.
Although precipitation exerted greater immediate influence on SM, temperature showed more prolonged lag effects on SM. These suggested that short-term SM prediction models should emphasize precipitation inputs, whereas long-term forecasts required temperature lag effect. Furthermore, These insights are crucial for developing adaptive irrigation strategy, optimizing plant structure, and implementing effective water resource management in the aspect of mitigating agricultural drought risks.
5. Conclusions
Based on the SM data at 27 measuring stations from AIR across China, the spatiotemporal distribution patterns of SM in China and its driving factors were analyzed. The main conclusions were as follows: 1) The annual monthly SM ranges different in each climate zones. The inter-annual fluctuation and vertical difference of SM in the tropical and subtropical monsoon region were small. The temperate monsoon, continental, and alpine plateau climate regions showed higher SM in spring and summer and lower SM in autumn and winter. 2) As a whole, the SM increased from northwest to southeast. The north area displayed relatively lower SM and large variation coefficients exceeding 0.3, whereas the south area presented higher SM and the stable variation coefficients less than 0.2. 3) The great majority of SM expressed approximately a quadratic function with the soil depth, reaching a peak at a depth of 20-40 cm. 4) Temperature and precipitation were the main influencing factors of SM. Overall, the principal contributing factor of SM at each soil layers were minimum temperature. 5) In addition, the study revealed that the short-term SM was mainly affected by rainfall, while the SM of medium and long term showed obvious hysteresis influenced by temperature. The research results can provide a guiding basis for the rational construction of soil-hydrological models, the adjustment of the plant-water resource structure, as well as the strategy against agricultural drought issues in the context of climate warming.
Author Contributions
Conceptualization, X.G.; methodology, X.G., B.C., X.Y. and H.W.; software, B.C., X.Y. and H.W.; validation, X.G.; formal analysis, X.G.; investigation, X.G.; resources, C.W.; data curation, C.W. and H.G.; writing—original draft preparation, X.G., B.C. and X.Y.; writing—review and editing, X.G., B.C., X.Y. and H.W.; visualization, X.G.; supervision, X.G. and D.L.; project administration, X.G. and C.W; funding acquisition, X.G and C.W. All authors have read and agreed to the published version of the manuscript.
Funding
This research was funded by the Common Application Support Platform for National Civil Space Infrastructure Land Observation Satellites, grant numberE0A203010F, and the Basic Research Program of Shanxi Province, grant number 202403021221043 and 20210302124370.
Data Availability Statement
The data that support the findings of this study are available upon request from the corresponding author.
Conflicts of Interest
The authors declare no conflicts of interest.
References
- Bláhová, M.; Fischer, M.; Poděbradská, M.; Štěpánek, P.; Balek, J.; Zahradníček, P.; Kudláčková, L.; Žalud, Z.; Trnka, M. Testing the reliability of soil moisture forecast for its use in agriculture. Agric. Water Manage. 2024, 304, 109073. [Google Scholar] [CrossRef]
- Chi, X.X.; Yin, Z.E.; Wang, X.; Sun, Y.K. Spatiotemporal variations of precipitation extremes of China during the past 50 years (1960–2009). Theor. Appl. Climatol. 2016, 124, 555–564. [Google Scholar] [CrossRef]
- Han, G.L.; Wang, J.L.; Pan, Y.Y.; Huang, N.; Zang, Z.Y.; Peng, R.Q; Wang, Z.Z.; Sun, G.F.; Liu, C.; Ma, S.Q.; Song, Y.; Pan, Z.H. Temporal and Spatial Variation of Soil Moisture and Its Possible Impact on Regional Air Temperature in China. Water 2020, 12, 1807. [Google Scholar] [CrossRef]
- Cai, J.J.; Zhou, B.T.; Chen, S.Y.; Wang, X.L.; Yang, S.Y.; Cheng, Z.Q.; Wang, F.W.; Mei, X.Y.; Wu, D. Spatial and Temporal Variability of Soil Moisture and Its Driving Factors in the Northern Agricultural Regions of China. Water 2024, 16, 556. [Google Scholar] [CrossRef]
- Chen, X.; Dong, J.W.; Huang, L.; Chen, L.J.; Li, Z.C.; You, N.S.; Singha, M.; Tao, F.L. Characterizing the 2020 summer floods in South China and effects on croplands. Iscience 2023, 26, 107096. [Google Scholar] [CrossRef]
- Wang, J.F.; Wang, Y.Q.; Xu, D.Y. Desertification in northern China from 2000 to 2020: The spatial–temporal processes and driving mechanisms. Ecol. Inf. 2024, 82, 102769. [Google Scholar] [CrossRef]
- Wan, H.Y.; Qi, H.W.; Shang, S.H. Estimating soil water and salt contents from field measurements with time domain reflectometry using machine learning algorithms. Agric. Water Manage. 2023, 285, 108364. [Google Scholar] [CrossRef]
- Rasheed, M.W.; Tang, J.L.; Sarwar, A.; Shah, S.; Saddique, N.; Khan, M.U.; Khan, M.I.; Nawaz, S.; Shamshiri, R.R.; Aziz, M.; Sultan, M. Soil Moisture Measuring Techniques and Factors Affecting the Moisture Dynamics: A Comprehensive Review. Sustainability 2022, 14, 11538. [Google Scholar] [CrossRef]
- Mouazen, A.M.; Al-Asadi, R.A. Influence of soil moisture content on assessment of bulk density with combined frequency domain reflectometry and visible and near infrared spectroscopy under semi field conditions. Soil Till Res. 2018, 176, 95–103. [Google Scholar] [CrossRef]
- Maamar, M.; Mohamed, R. Assessment of the impact of climate change on soil moisture using remote sensing and Geographic Information Systems (GIS). Int. J. Ecol Dev. 2024, 39(2), 1–14. [Google Scholar]
- Lu, X.J.; Huang, Y.H.; Yan, H.B.; Wu, C.L.; Luo, L.; Zhou, B. Temporal and spatial variation of soil moisture in china based on smap data. Isprs Archives 2020, XLII-3/W10, 775–781. [Google Scholar] [CrossRef]
- Wang, Y.P.; Mao, J.F.; Hoffman, F.M.; Bonfils, C.J.W.; Douville, H.; Jin, M.Z.; Thornton, P.E.; Ricciuto, D.M.; Shi, X.Y.; Chen, H.S.; Wullschleger, S.D.; Piao, S.L.; Dai, Y.J. Quantification of human contribution to soil moisture-based terrestrial aridity. Nat. Commun. 2022, 13(1), 6848. [Google Scholar] [CrossRef]
- Liu, M.X.; Wang, Q.Y.; Guo, L.; Yi, J.; Lin, H.; Zhu, Q.; Fan, B.H.; Zhang, H.L. Influence of canopy and topographic position on soil moisture response to rainfall in a hilly catchment of Three Gorges Reservoir Area, China. J. Geog. Sci. 2020, 30(3), 949–968. [Google Scholar] [CrossRef]
- Li, Y.Q.; Wang, S.J.; Peng, T.; Zhao, G.Z.; Dai, B. Hydrological characteristics and available water storage of typical karst soil in SW China under different soil–rock structures. Geoderma 2023, 43, 116633. [Google Scholar] [CrossRef]
- Asgarimehr, M.; Entekhabi, D.; Camps, A. Diurnal Vegetation Moisture Cycle in the Amazon and Response to Water Stress. Geophys. Res. Lett. 2024, 51, e2024GL111462. [Google Scholar] [CrossRef]
- Mao, X.R.; Zheng, J.H; Guan, J.Y.; Zhong, T.; Liu, L. Exploring the dominant drivers affecting soil water content and vegetation growth by decoupling meteorological indicators. J. Hydrol. 2024, 631, 130722. [Google Scholar] [CrossRef]
- Zang, Z.W.; Yin, H.Y.; Chang, J.J.; Xue, J. Spatial variability of surface soil water content and its influencing factors on shady and sunny slopes of an alpine meadow on the Qinghai–Tibetan Plateau. Glob. Ecol. Conserv. 2022, 34, e02035. [Google Scholar]
- Yan, P.; Lin, K.R.; Wang, Y.R.; Zheng, Y.; Gao, X.; Tu, X.J.; Bai, C.M. Spatial interpolation of red bed soil moisture in Nanxiong basin, South China. J. Contam. Hydrol. 2021, 242, 103860. [Google Scholar] [CrossRef]
- Li, B.B; Yang, Y.; Li, Z. ; Combined effects of multiple factors on spatiotemporally varied soil moisture in China’s Loess Plateau. Agric. Water Manage. 2021, 258, 107180. [Google Scholar] [CrossRef]
- Hui, S.Q.; Guo, L.; Liu, H.C.; Wu, X.M.; Lan, P.; Boyer, E.W.; Mello, C.R.; Li, H.X. Spatiotemporal dynamics of soil moisture and the occurrence of hysteresis during seasonal transitions in a headwater catchment. Geoderma 2025, 454, 117169. [Google Scholar] [CrossRef]
- Liu, Y.X.Y.; Yang, Y.P. ; Spatial-temporal variability pattern of multi-depth soil moisture jointly driven by climatic and human factors in China. J. Hydrol. 2023, 619, 129313. [Google Scholar] [CrossRef]
- Wang, F.; Lai, H.X.; Li, Y.B.; Feng, K.; Zhang, Z.Z.; Tian, Q.Q.; Zhu, X.M.; Yang, H.B. Dynamic variation of meteorological drought and its relationships with agricultural drought across China. Agric. Water Manage. 2022, 261, 107301. [Google Scholar] [CrossRef]
- Wu, J.; Shi, Y. Changes in surface wind speed and its different grades over China during 1961–2020 based on a high-resolution dataset. Int. J. Climatol. 2021, 42, 3954–3967. [Google Scholar] [CrossRef]
- Wang, W.H.; Jing, H.F.; Guo, X.X.; Dou, B.Y.; Zhang, W.S. Analysis of Water and Salt Spatio-Temporal Distribution along Irrigation Canals in Ningxia Yellow River Irrigation Area, China. Sustainability 2023, 15(16), 12114. [Google Scholar] [CrossRef]
- Marukatat, S. Tutorial on PCA and approximate PCA and approximate kernel PCA. Artif Intell Rev. 2022, 56, 5445–5477. [Google Scholar] [CrossRef]
- Rajput, P.S.; Patley, S.; Choudhary, B.; Gupta, S. Assessment and Comparison of Soil Quality Using Principal Components Analysis (PCA) & Expert Opinion (EO) Methods in different Rice-based Cropping Systems in Alfisol. Int. J. Environ. Clim. Chang. 2023, 13(12), 869–887. [Google Scholar]
- Jaswal, R.; Sandal, K.S. Effect of Conservation Tillage and Irrigation on Soil Water Content, Shoot-Root Growth Parameters and Yield in Maize (Zea mays)-Wheat (Triticum aestivum) Cropping Sequence. J. Soil Sci. Plant Nutr. 2024, 24(4), 1–15. [Google Scholar] [CrossRef]
- Sinha, R.K. Book review: Christoph Molnar. 2020. Interpretable Machine Learning: A Guide for Making Black Box Models Explainable. Metamorphosis 2024, 23, 92–93. [Google Scholar] [CrossRef]
- Zheng, N.Q.; Chai, H.Z.; Wang, Z.H.; Pu, D.D.; Zhang, Q.K. Research on GNSS-IR soil moisture retrieval based on random forest algorithm. Meas. Sci. Technol. 2024, 35, 105108. [Google Scholar] [CrossRef]
- Wang, X.Y.; Jiang, H.W.; Han, G.S. Multiscale adaptive multifractal cross-correlation analysis of multivariate time series. Chaos Solitons Fract. 2023, 174, 113872. [Google Scholar] [CrossRef]
- Zhang, Q.Y.; Yang, X.Z.; Liu, C.; Yang, N.; Yu, G.D.; Zhang, Z.T.; Chen, Y.W.; Yao, Y.F. ; Hu. X.T. Monitoring soil moisture in winter wheat with crop water stress index based on canopy-air temperature time lag effect. Int. J. Biometeorol. 2024, 68, 647–659. [Google Scholar] [CrossRef]
- Zhu, P.Z.; Zhang, G.H.; Wang, H.X.; Zhang, B.J.; Liu, Y.N. Soil moisture variations in response to precipitation properties and plant communities on steep gully slope on the Loess Plateau. Agric. Water Manage. 2021, 256, 107086. [Google Scholar] [CrossRef]
- Li, H.Y.; Xiao, Z.N.; Wei, J.H.; Wang, G. The Seasonal and Diurnal Variation Characteristics of Soil Moisture at Different Depths from Observational Sites over the Tibetan Plateau. Remote Sens. 2022, 14(19), 5010. [Google Scholar] [CrossRef]
- Song, J.R.; Gao, J.H.; Zhang, Y.B.; Li, F.P.; Man, W.D.; Liu, M.Y.; Wang, J.H.; Li, M.Q.; Zheng, H.; Yang, X.W.; Li, C.J. Estimation of Soil Organic Carbon Content in Coastal Wetlands with Measured VIS-NIR Spectroscopy Using Optimized Support Vector Machines and Random Forests. Remote Sens. 2022, 14, 4372. [Google Scholar] [CrossRef]
- Chen, X.S.; Li, X.; Xie, Y.H.; Li, F.; Hou, Z.Y.; Zheng, L. Combined influence of hydrological gradient and edaphic factors on the distribution of macrophyte communities in Dongting Lake wetlands, China. Wetlands Ecol. Manage. 2015, 23, 481–490. [Google Scholar] [CrossRef]
- Bao, Z.X.; Yuan, L.M.; Meng, Z.J.; Zhang, E.Z.; Zhu, L.; Liu, J.W. Soil moisture partitioning strategies in blowouts in the Hulunbeier grassland and response to rainfall. Front. Environ. Sci. Eng. 2025, 12, 1519807. [Google Scholar] [CrossRef]
- Li, D.S.; Ouyang, W.; Wang, L.; Chen, J.; Zhang, H. Sharhuu, A.; Tseren-Ochir, S.E.; Yang, Y. Revisiting snowmelt dynamics and its impact on soil moisture and vegetation in mid-high latitude watershed over four decades. Agric. Forest. Meteorol. 2025, 362, 110353. [Google Scholar] [CrossRef]
- Wei, L.Z.; Qiu, Z.J.; Zhou, G.Y.; Zuecco, G.L.; Liu, Y.; Wen, Y. Soil water hydraulic redistribution in a subtropical monsoon evergreen forest. Sci. Total Environ. 2022, 835, 155437. [Google Scholar] [CrossRef]
- Sugathan, N.; Biju, V.; Renuka, G. Influence of soil moisture content on surface albedo and soil thermal parameters at a tropical station. J. Earth Syst. Sci. 2014, 123, 1115–1128. [Google Scholar] [CrossRef]
- Li, Y.X.; Liu, D.P.; Li, T.X.; Fu, Q.; Liu, D.; Hou, R.J.; Meng, F.X.; Li, M.; Li, Q.L. Responses of spring soil moisture of different land use types to snow cover in Northeast China under climate change background. J. Hydrol. 2022, 608, 127610. [Google Scholar] [CrossRef]
- Yu, B.W.; Liu, G.H.; Liu, Q.S.; Huang, C.; Li, H.; Zhao, Z.H. Seasonal variation of deep soil moisture under different land uses on the semi-arid Loess Plateau of China. J. Soils Sediments. 2019, 19, 1179–1189. [Google Scholar] [CrossRef]
- Lee, E.H.; Kim, S.H. Spatiotemporal soil moisture response and controlling factors along a hillslope. J. Hydrol. 2022, 605, 127382. [Google Scholar] [CrossRef]
- Shao, W.; Li, M.J.; Wu, Y.; Ma, X.Y.; Song, Q.H.; Zhang, Y.P.; Su, Y.; Ni, J.J.; Dong, J.Z. Identification of varied soil hydraulic properties in a seasonal tropical rainforest. Catena 2022, 212, 106104. [Google Scholar] [CrossRef]
- Ding, H.; Yuan, Z.; Shi, X.L.; Yin, J.; Chen, F.; Shi, M.Q.; Zhang, F.L. Soil moisture content-based analysis of terrestrial ecosystems in China: Water use efficiency of vegetation systems. Ecol. Indic. 2023, 150, 110271. [Google Scholar] [CrossRef]
- Wang, Y.; Li, R.N.; Liang, M.; Ma, J.F.; Yang, Y.Z.; Zheng, H. Impact of crop types and irrigation on soil moisture downscaling in water-stressed cropland regions. Environ. Impact Assess. Rev. 2023, 100, 107073. [Google Scholar] [CrossRef]
- Chen, Y.B; Zhan, H.B.; Yang, W.B.; Bao, F. Deep soil water recharge response to precipitation in Mu Us Sandy Land of China. Water Sci. Eng. 2018, 11, 139–146. [Google Scholar] [CrossRef]
- Bai, L.Z.; Kong, X.Y.; Li, H.; Zhu, H.B.; Wang, C.W.; Ma, S.A. Effects of Conservation Tillage on Soil Properties and Maize Yield in Karst Regions, Southwest China. Agriculture 2022, 12(9), 1449. [Google Scholar] [CrossRef]
- Yao, S.X.; Zhao, C.C. Impact of Different Yearly Rainfall Patterns on Dynamic Changes of Soil Moisture of Fixed Sand Dune in the Horqin Sandy Land. IOP Conf. Ser: Earth Environ. Sci. 2019, 234, 012020. [Google Scholar] [CrossRef]
- Li, G.J.; Wan, L.; Cui, M.; Wu, B.; Zhou, J.X. Influence of Canopy Interception and Rainfall Kinetic Energy on Soil Erosion under Forests. Forests 2019, 10(6), 509. [Google Scholar] [CrossRef]
- Zhang, Q.F.; Lv, X.Z.; Yu, X.X.; Ni, Y.G.; Ma, L.; Liu, Z.Q. Species and spatial differences in vegetation rainfall interception capacity: A synthesis and meta-analysis in China. Catena 2022, 213, 106223. [Google Scholar] [CrossRef]
- Liu, Z.; Cao, S.L.; Sun, Z.H.; Wang, H.Y.; Qu, S.D.; Lei, N.; He, J.; Dong, Q.G. Tillage effects on soil properties and crop yield after land reclamation. Sci. Rep. 2021, 11, 4611. [Google Scholar] [CrossRef] [PubMed]
- Han, J.W.; Pan, C.Z.; Sun, Y.H.; Chen, Z.J.; Xiong, Y.W.; Huang, G.H. Impact of Land Use Conversion on Soil Structure and Hydropedological Functions in an Arid Region. Land Degrad Dev. 2024, 36(2), 643–654. [Google Scholar] [CrossRef]
- Zhang, Z.Q.; Li, M.; Si, B.C.; Feng, H. Deep rooted apple trees decrease groundwater recharge in the highland region of the Loess Plateau, China. Sci. Total Environ. 2018, 622-623, 584–593. [Google Scholar] [CrossRef]
- Chen, D.; Wei, W.; Chen, L.D. Effects of terracing practices on water erosion control in China: A meta-analysis. Earth Sci. Rev. 2017, 173, 109–121. [Google Scholar] [CrossRef]
- Meng, W.; Sun, X.H.; Ma, J.J.; Guo, X.H.; Lei, T.; Li, R.F. Measurement and simulation of the water storage pit irrigation trees evapotranspiration in the Loess Plateau. Agric. Water Manage. 2019, 226, 105804. [Google Scholar] [CrossRef]
- Guo, Y.; Wang, F.; Qin, D.J.; Zhao, Z.F.; Gan, F.P.; Yan, B.K.; Bai, J.; Muhammed, H. Hydrodynamic characteristics of a typical karst spring system based on time series analysis in northern China. China Geology 2021, 4(3), 433–445. [Google Scholar] [CrossRef]
- Heisler-White, J.L.; Knapp, A.K.; Kelly, E.F. Increasing precipitation event size increases aboveground net primary productivity in a semi-arid grassland. Oecologia 2008, 158, 129–140. [Google Scholar] [CrossRef]
- Wang, J.; Bao, Z.X.; Wang, G.Q.; Liu, C.S.; Xie, M.M.; Wang, B.; Zhang, J.Y. The Time Lag Effects and Interaction among Climate, Soil Moisture, and Vegetation from In Situ Monitoring Measurements across China. Remote Sens. 2024, 16(12), 2063. [Google Scholar] [CrossRef]
- Tian, Q.; Lu, J.Z.; Chen, X.L. A novel comprehensive agricultural drought index reflecting time lag of soil moisture to meteorology: A case study in the Yangtze River basin, China. Catena 2022, 209, 105804. [Google Scholar] [CrossRef]
Figure 1.
Geographical distribution and Location of individual soil moisture observation station in China.
Figure 1.
Geographical distribution and Location of individual soil moisture observation station in China.
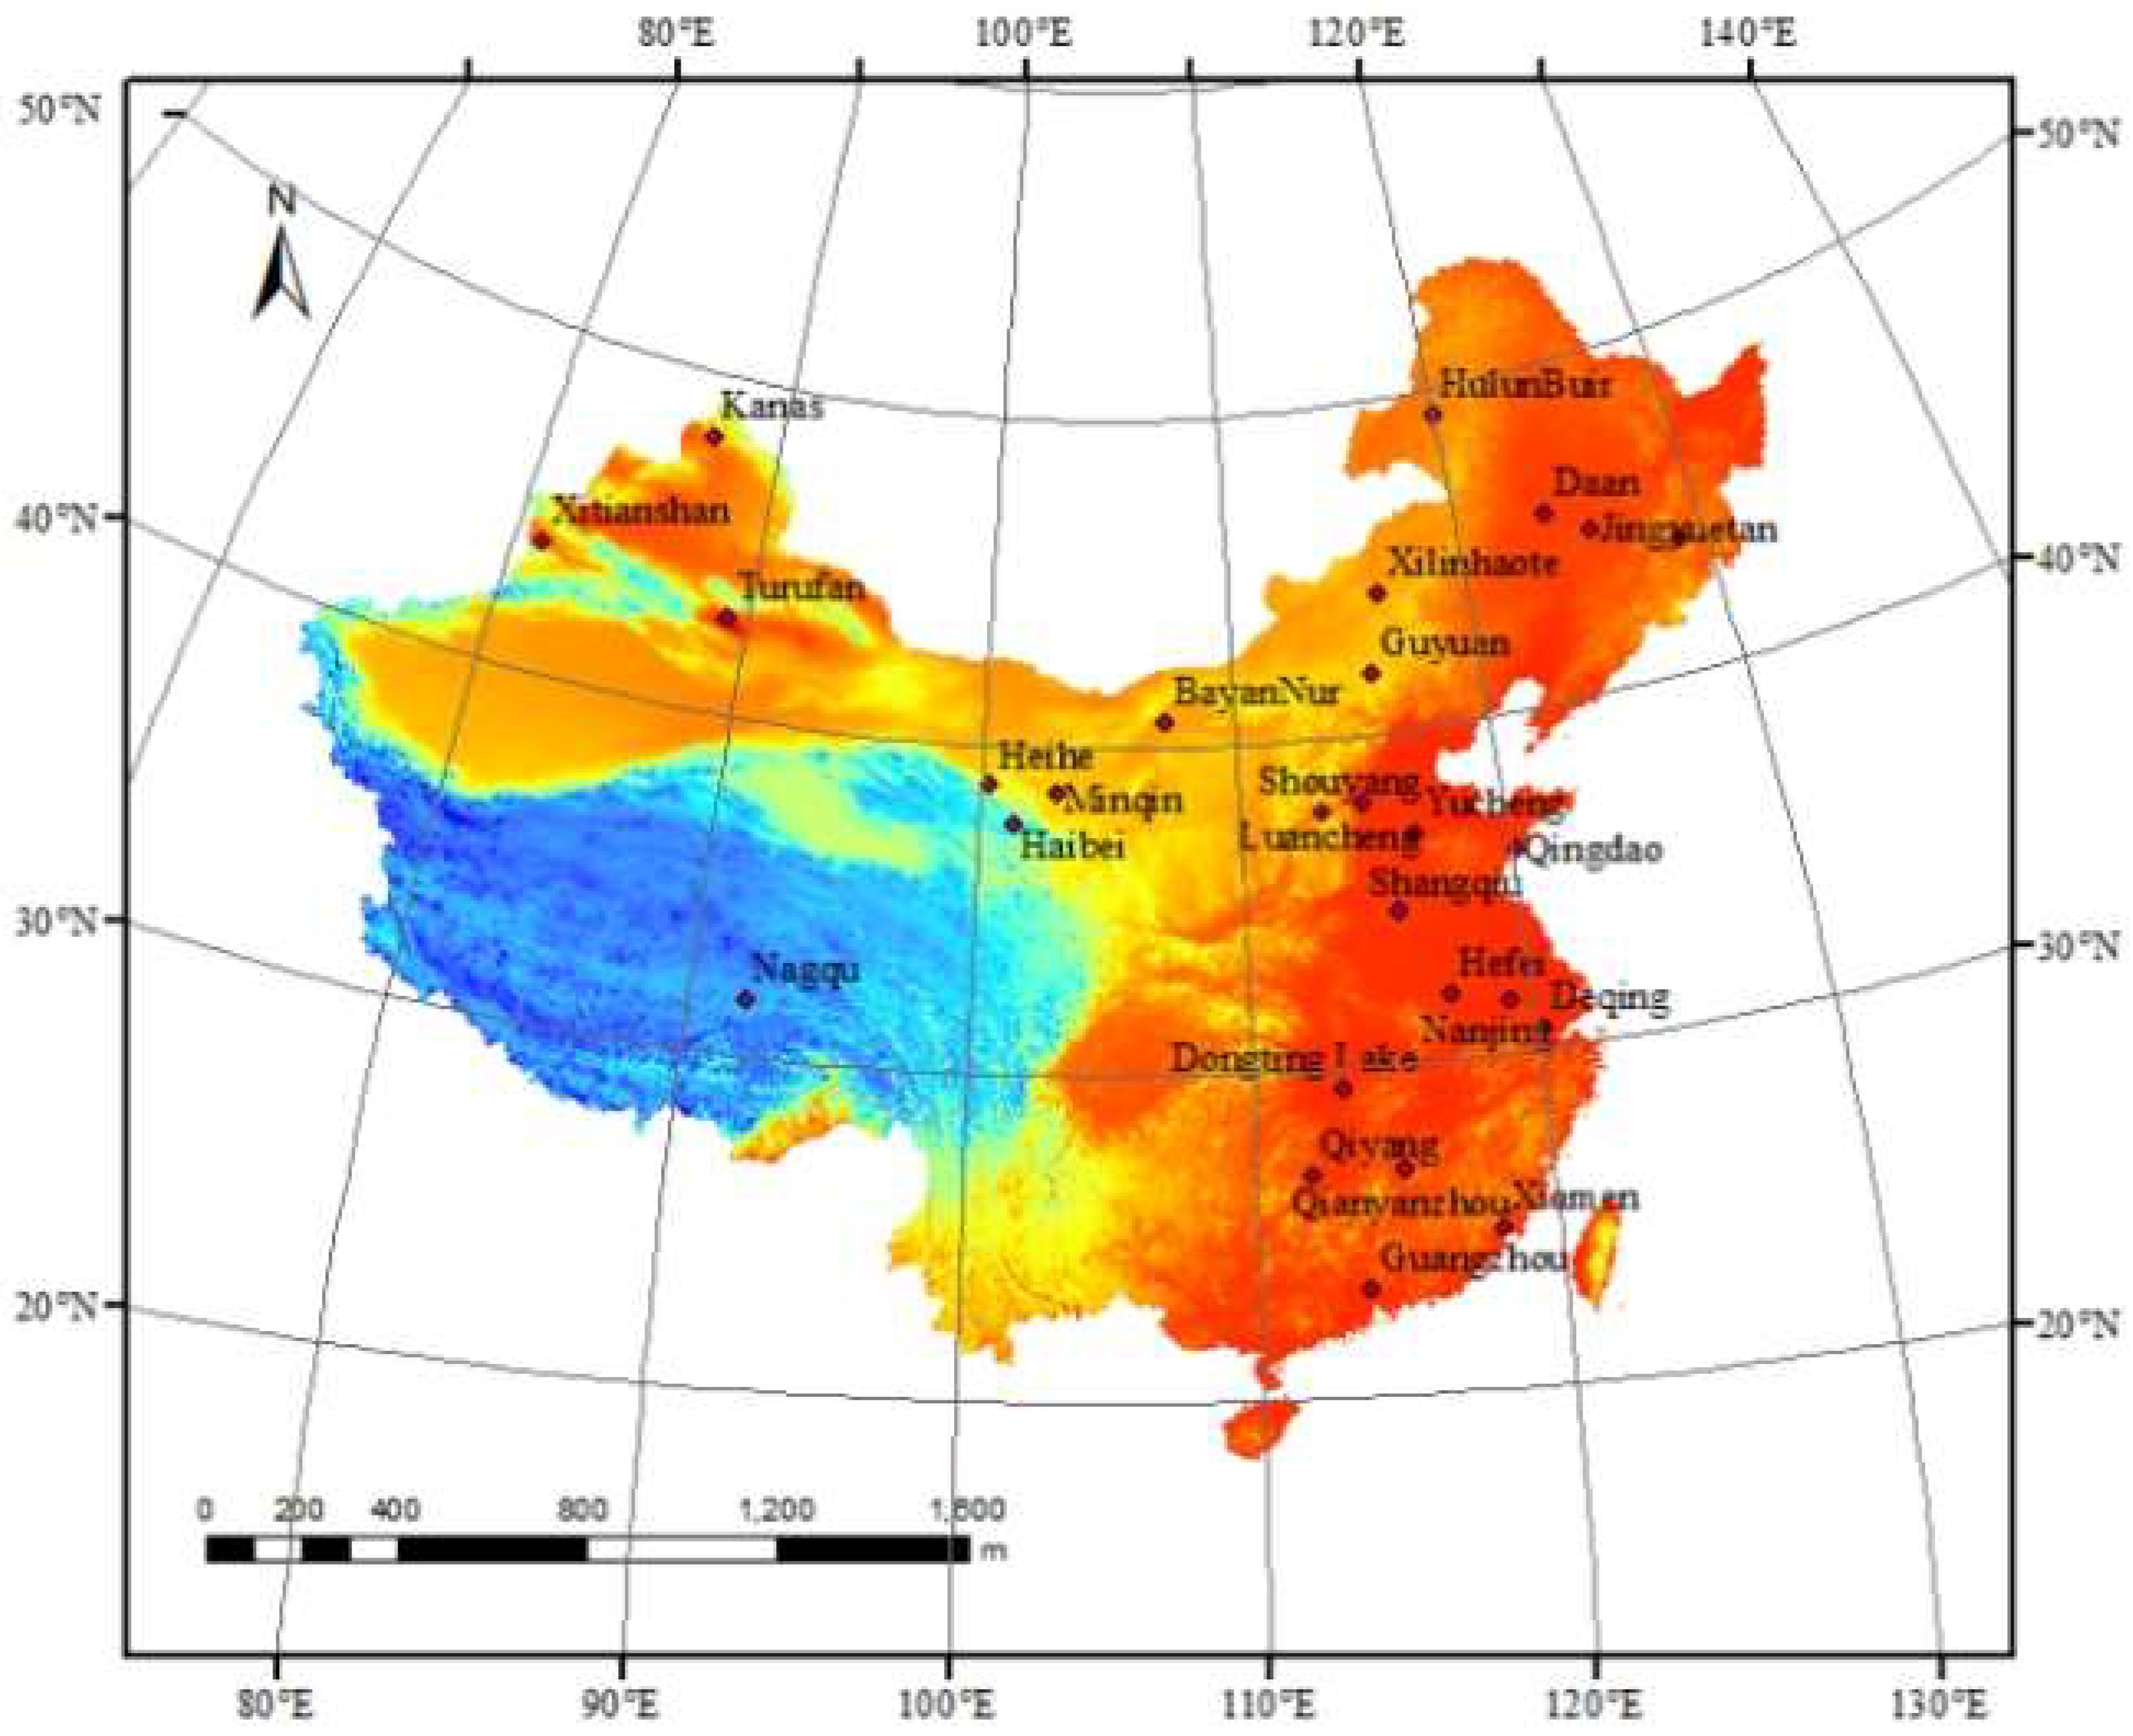
Figure 2.
Annual monthly variation patterns of SM across different climatic zones.
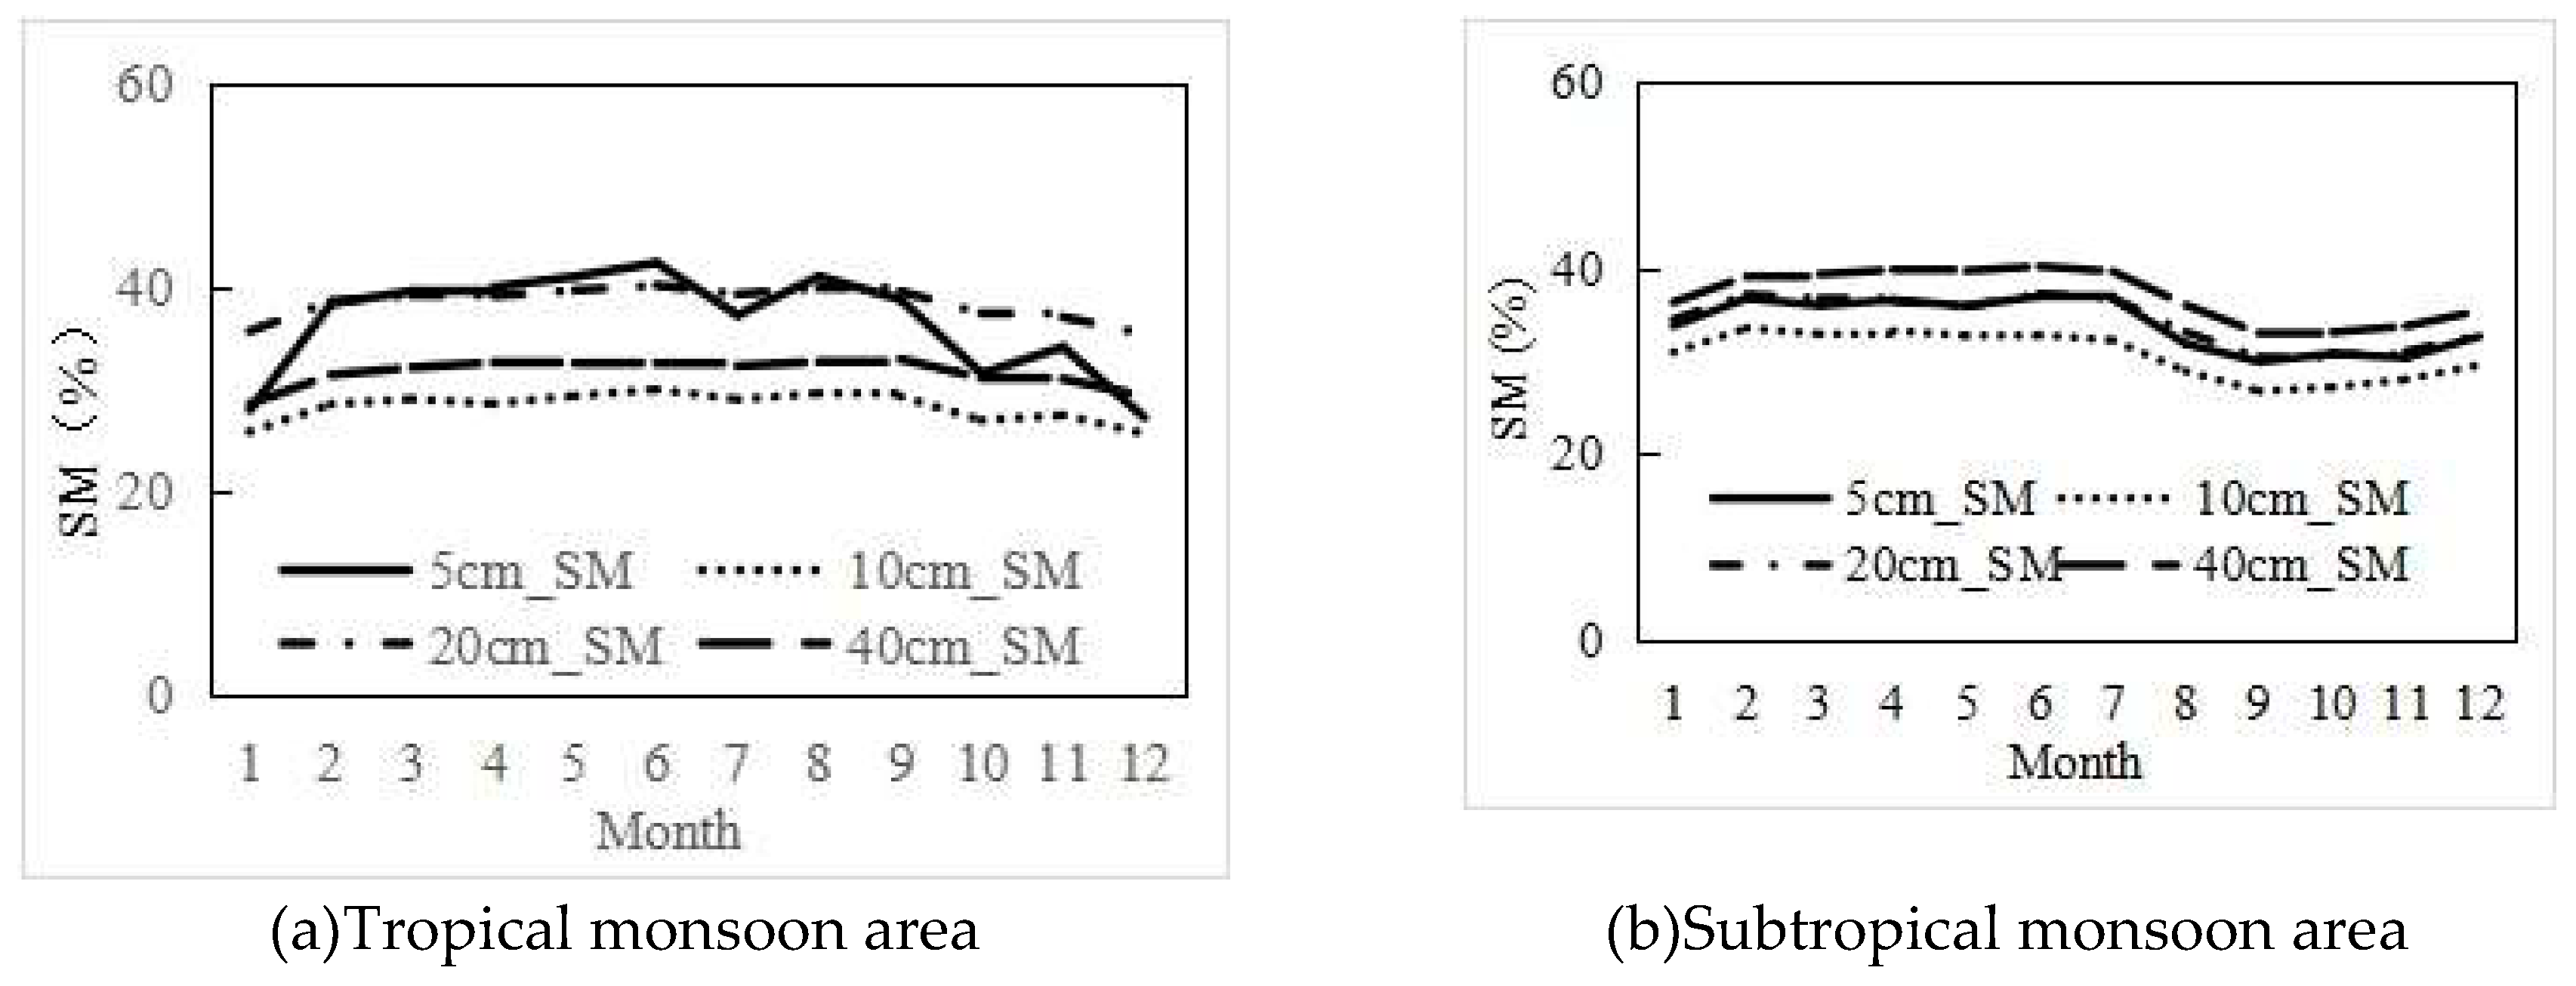
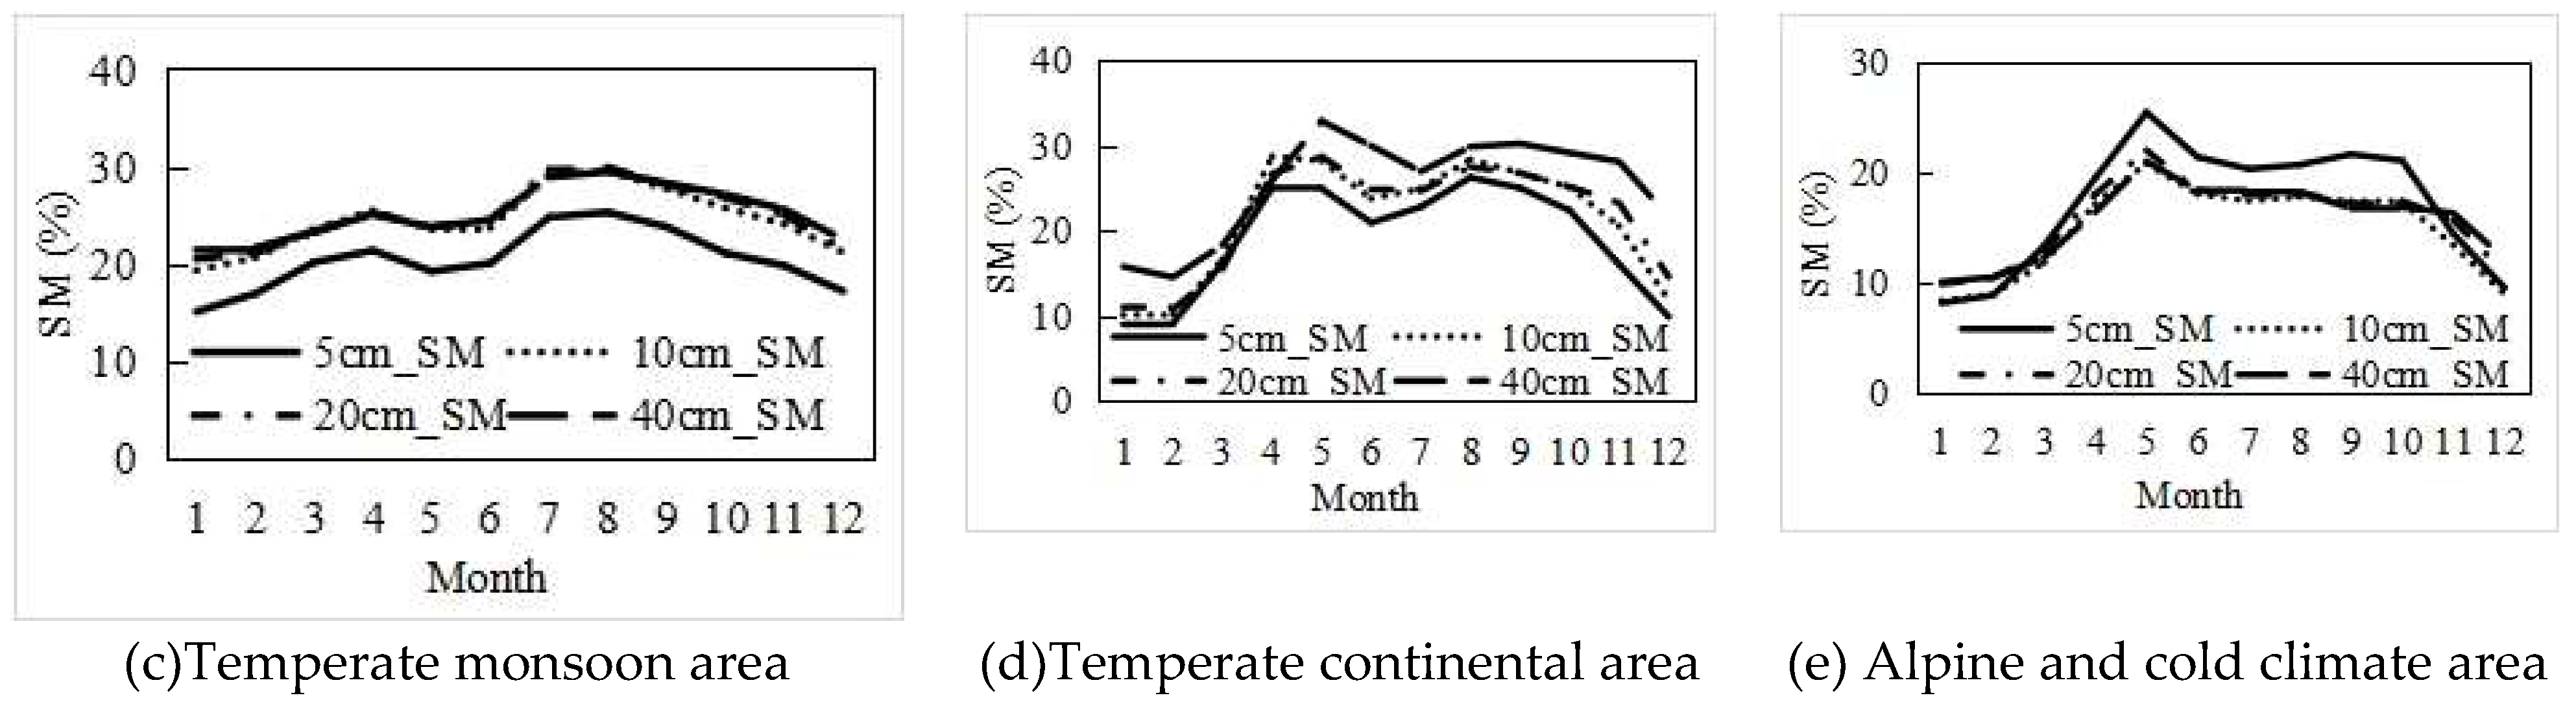
Figure 13.
The relationship of SM and corresponding soil depth.
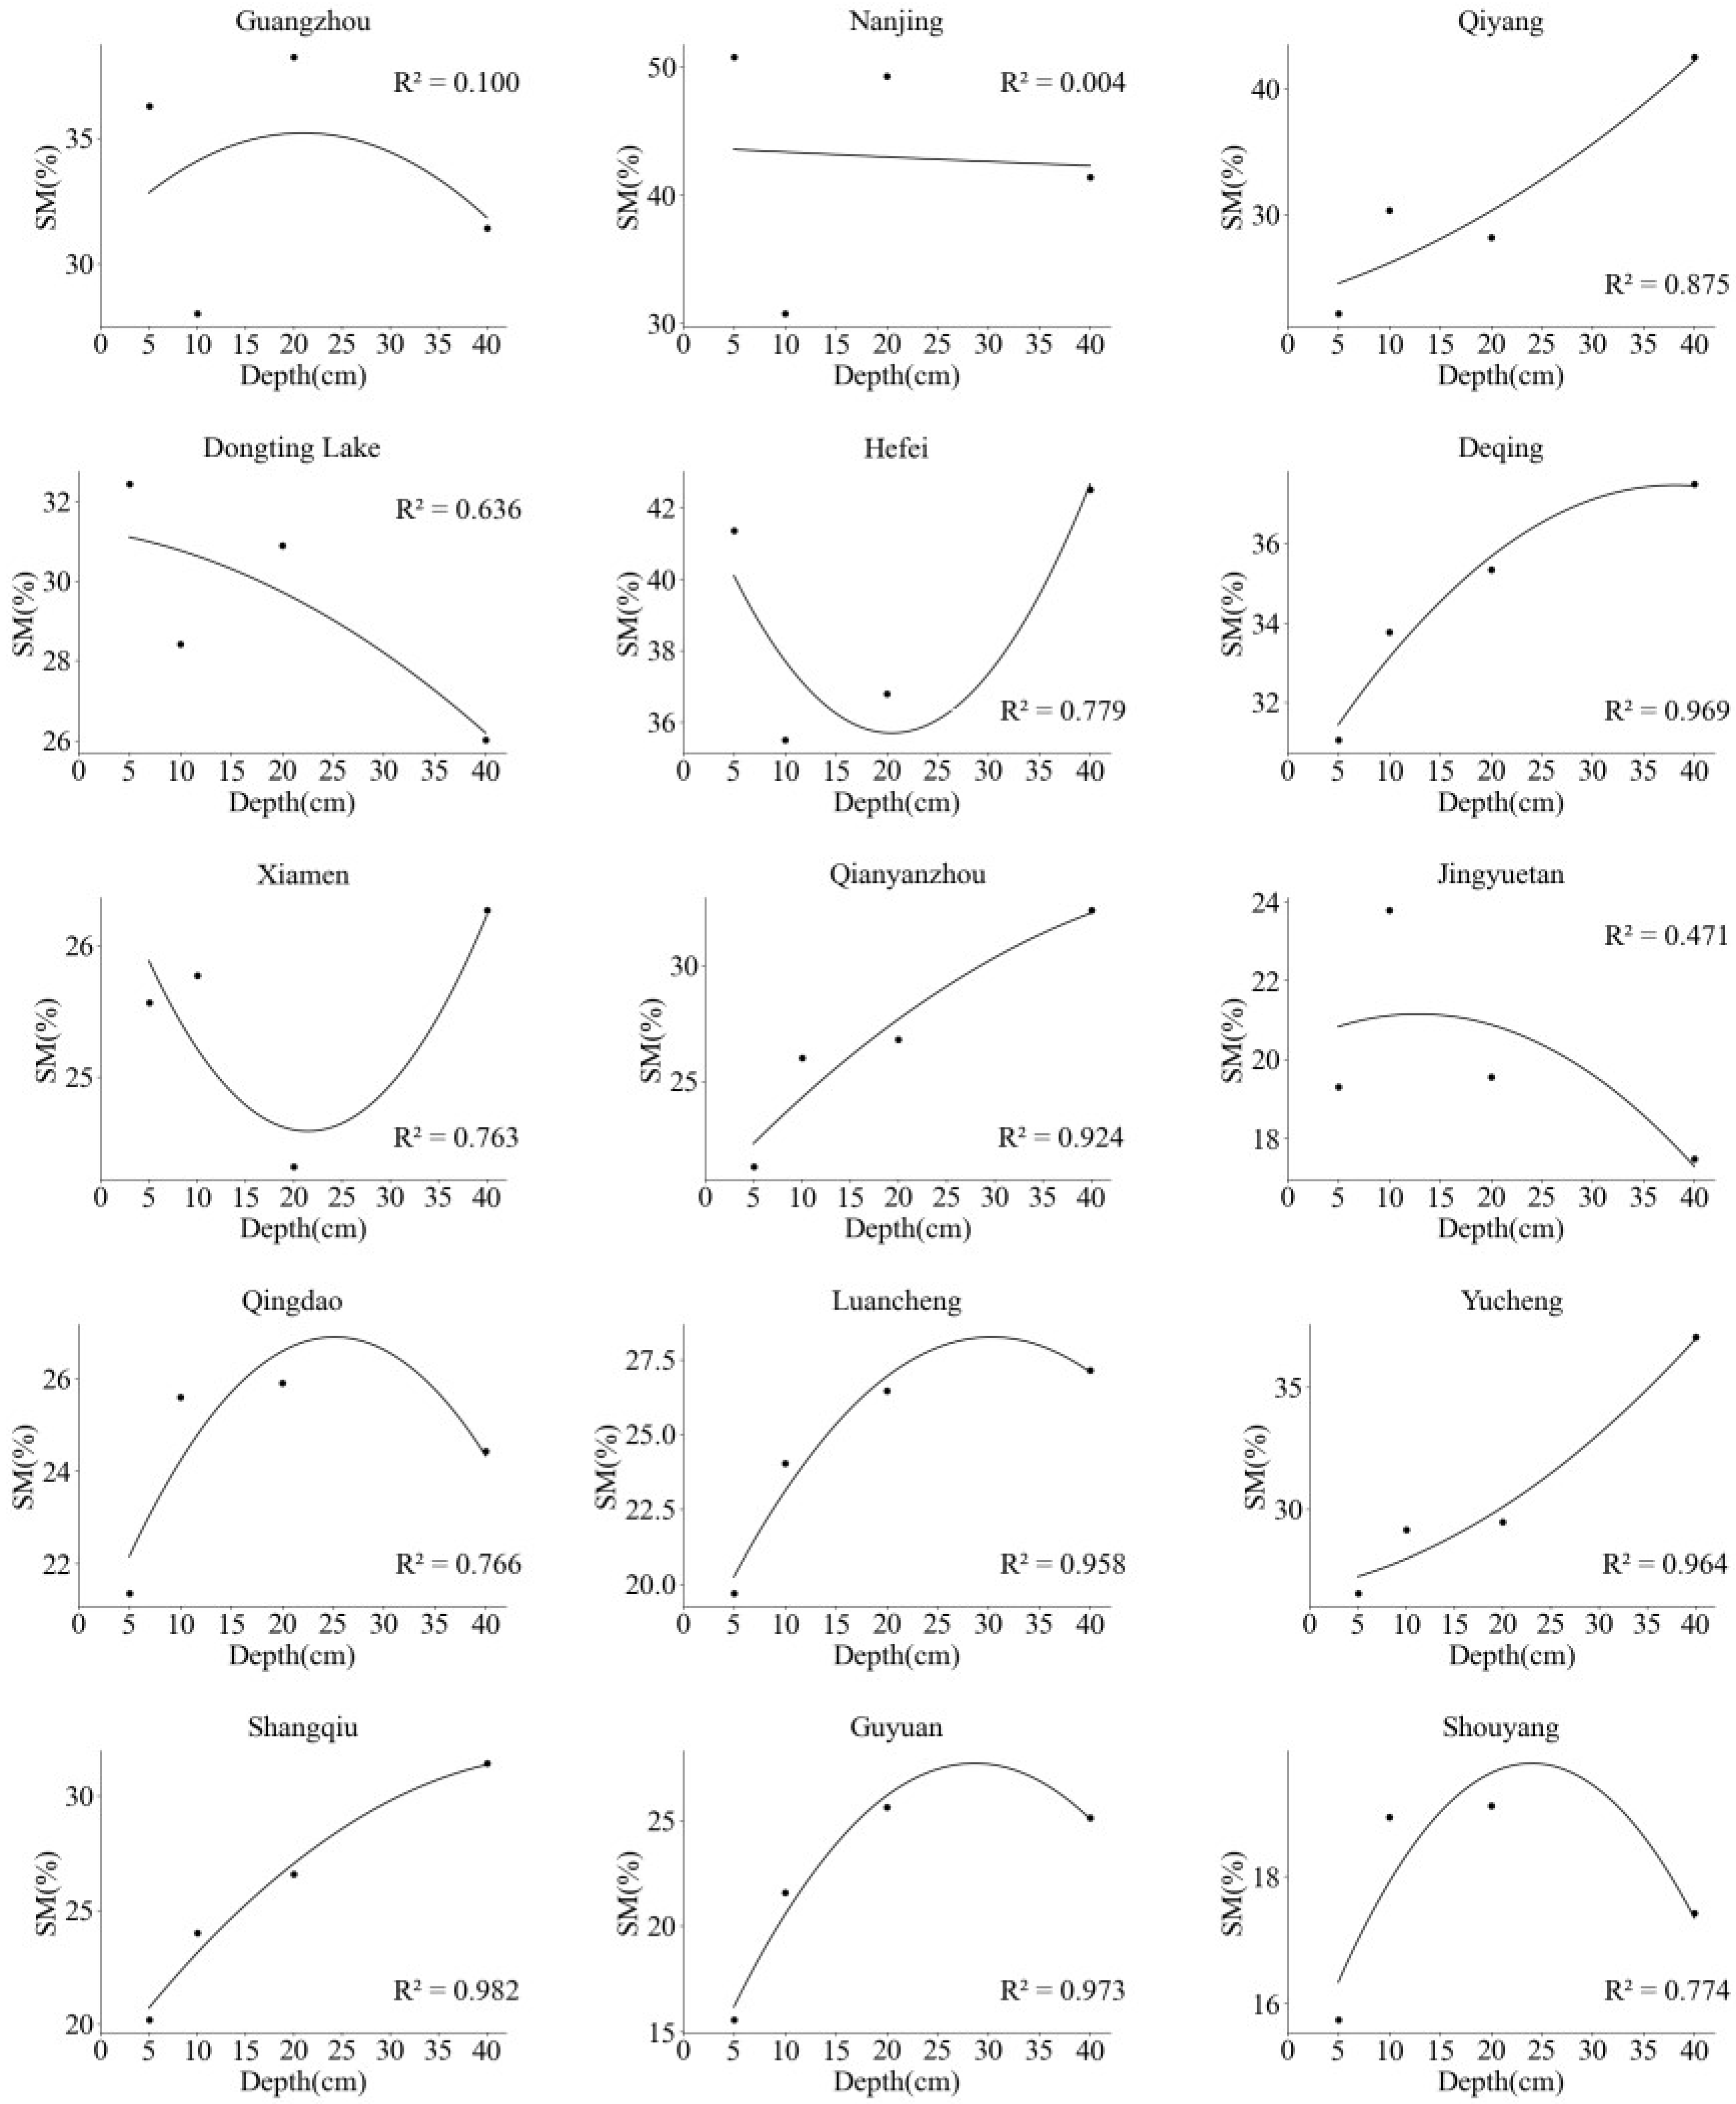
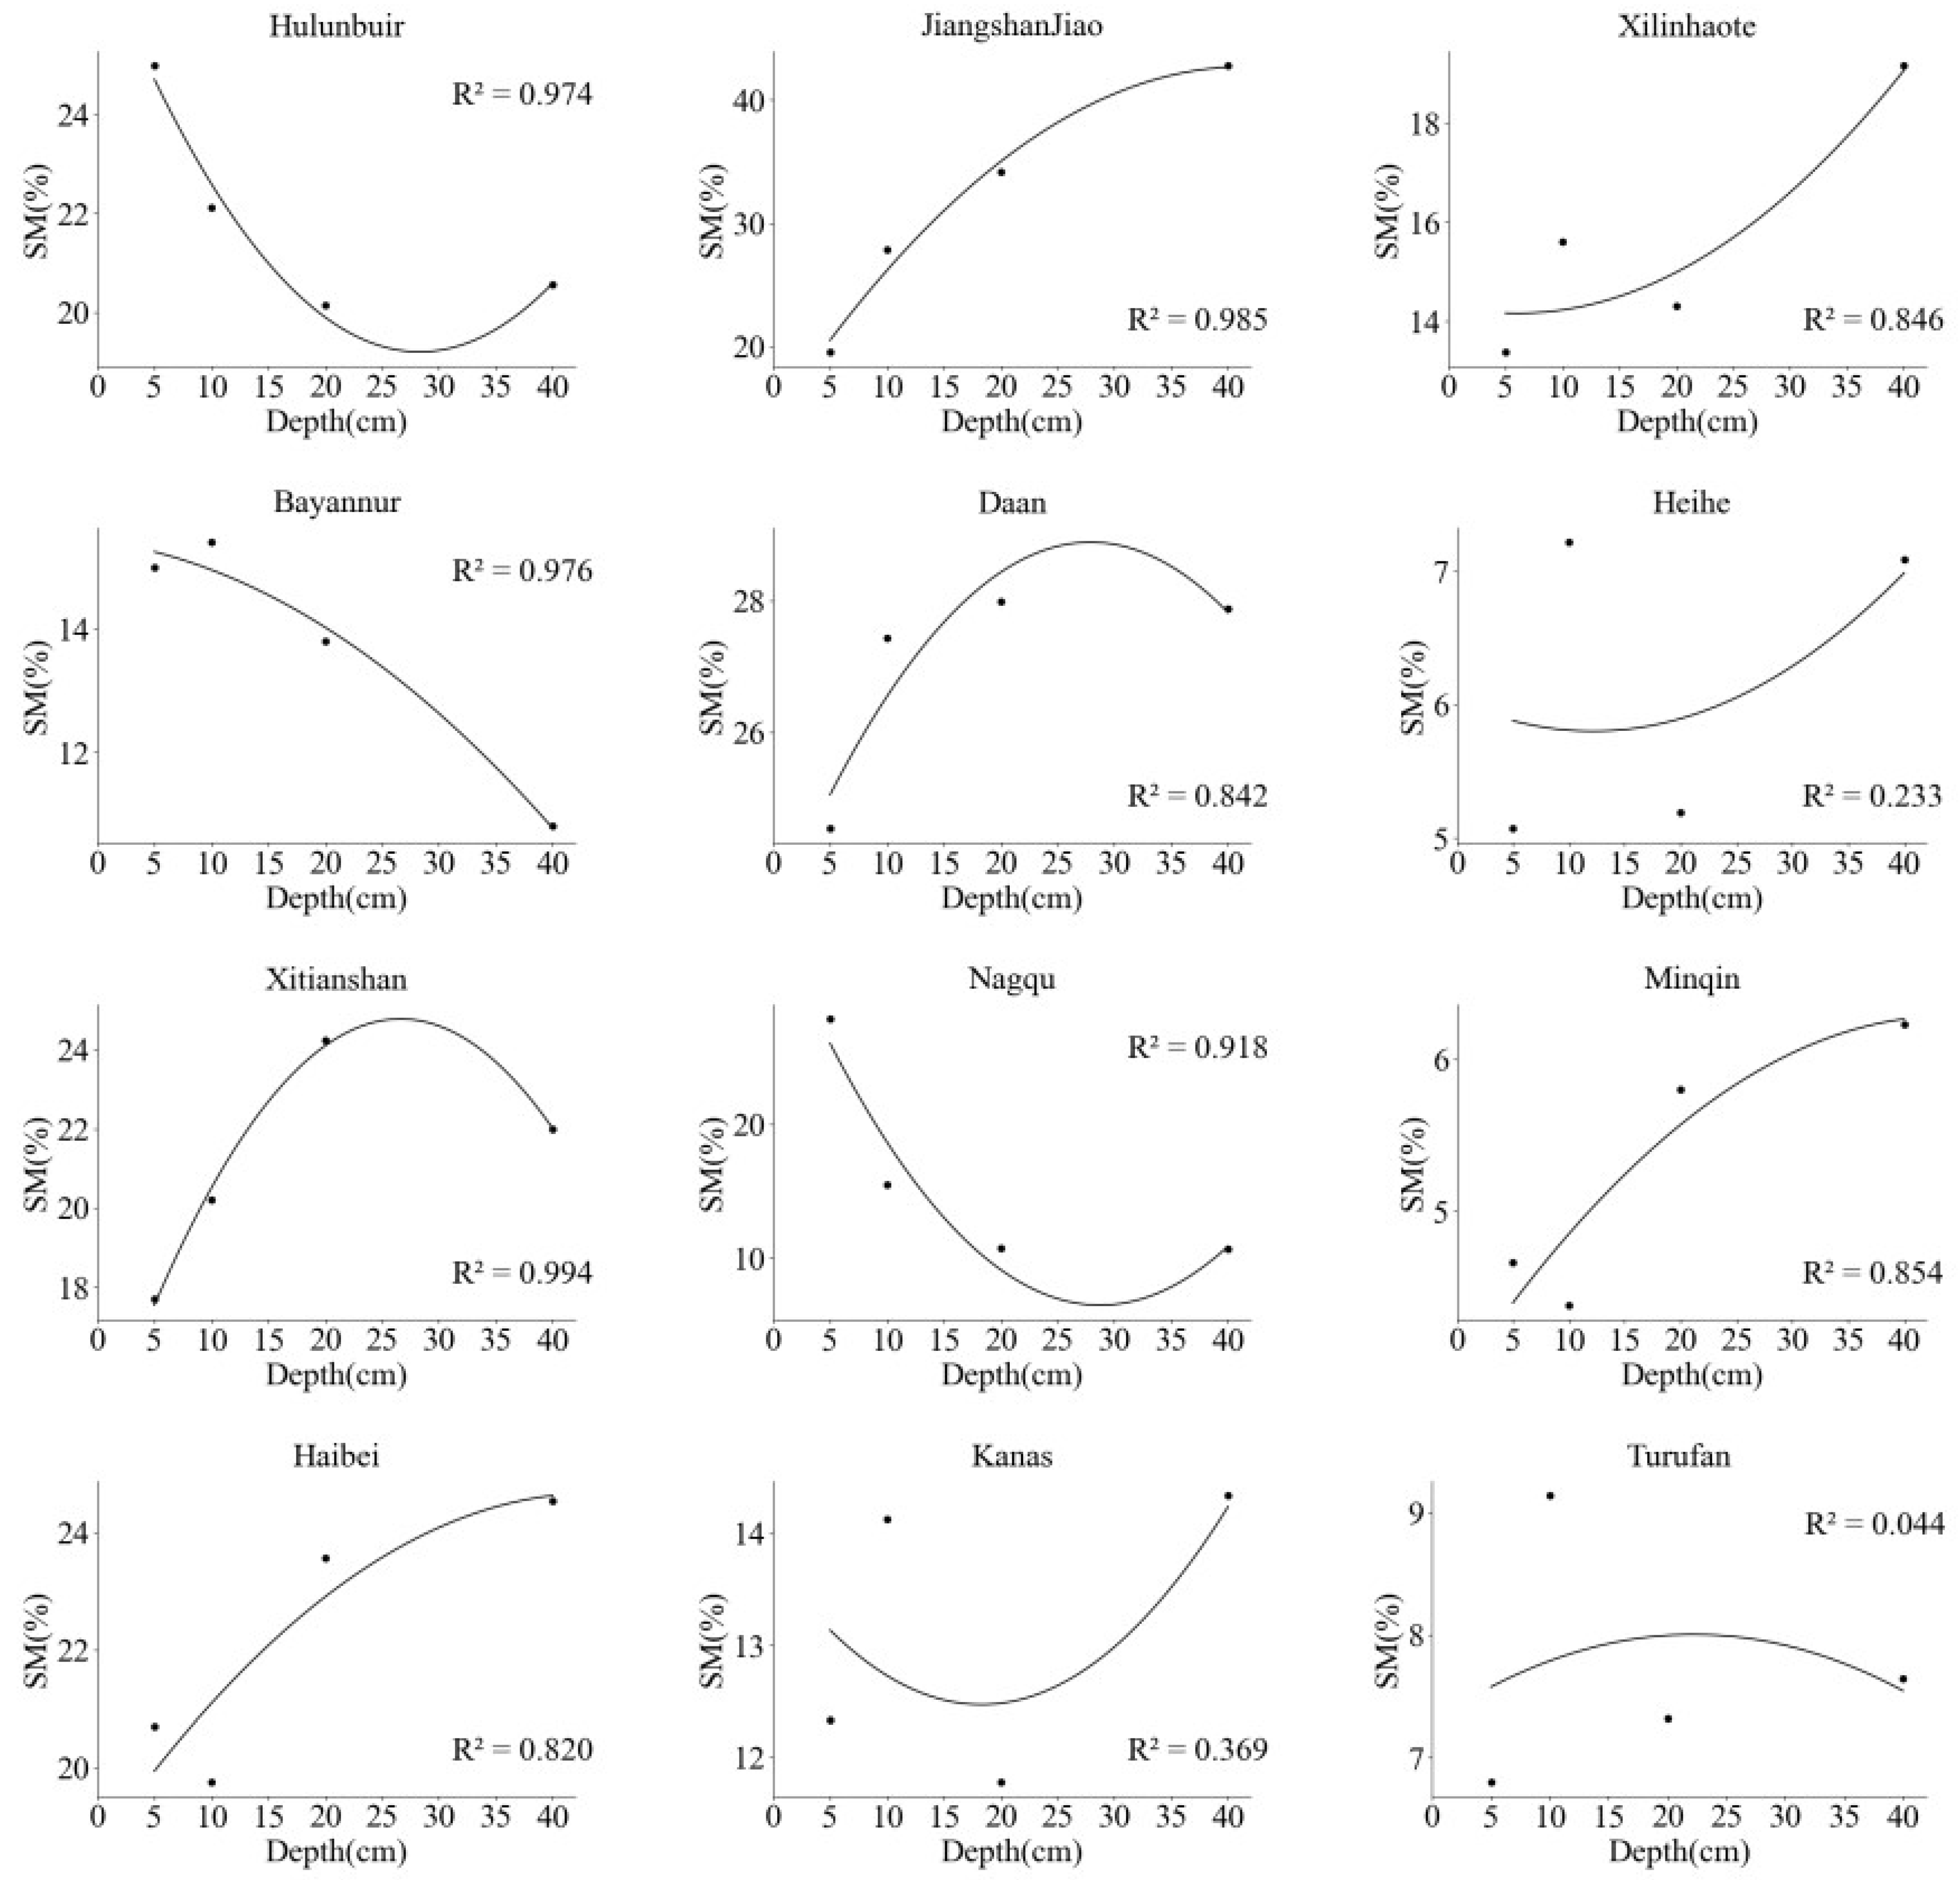
Figure 20.
The daily cross-correlation coefficients between daily precipitation and SM in different zones.
Figure 20.
The daily cross-correlation coefficients between daily precipitation and SM in different zones.
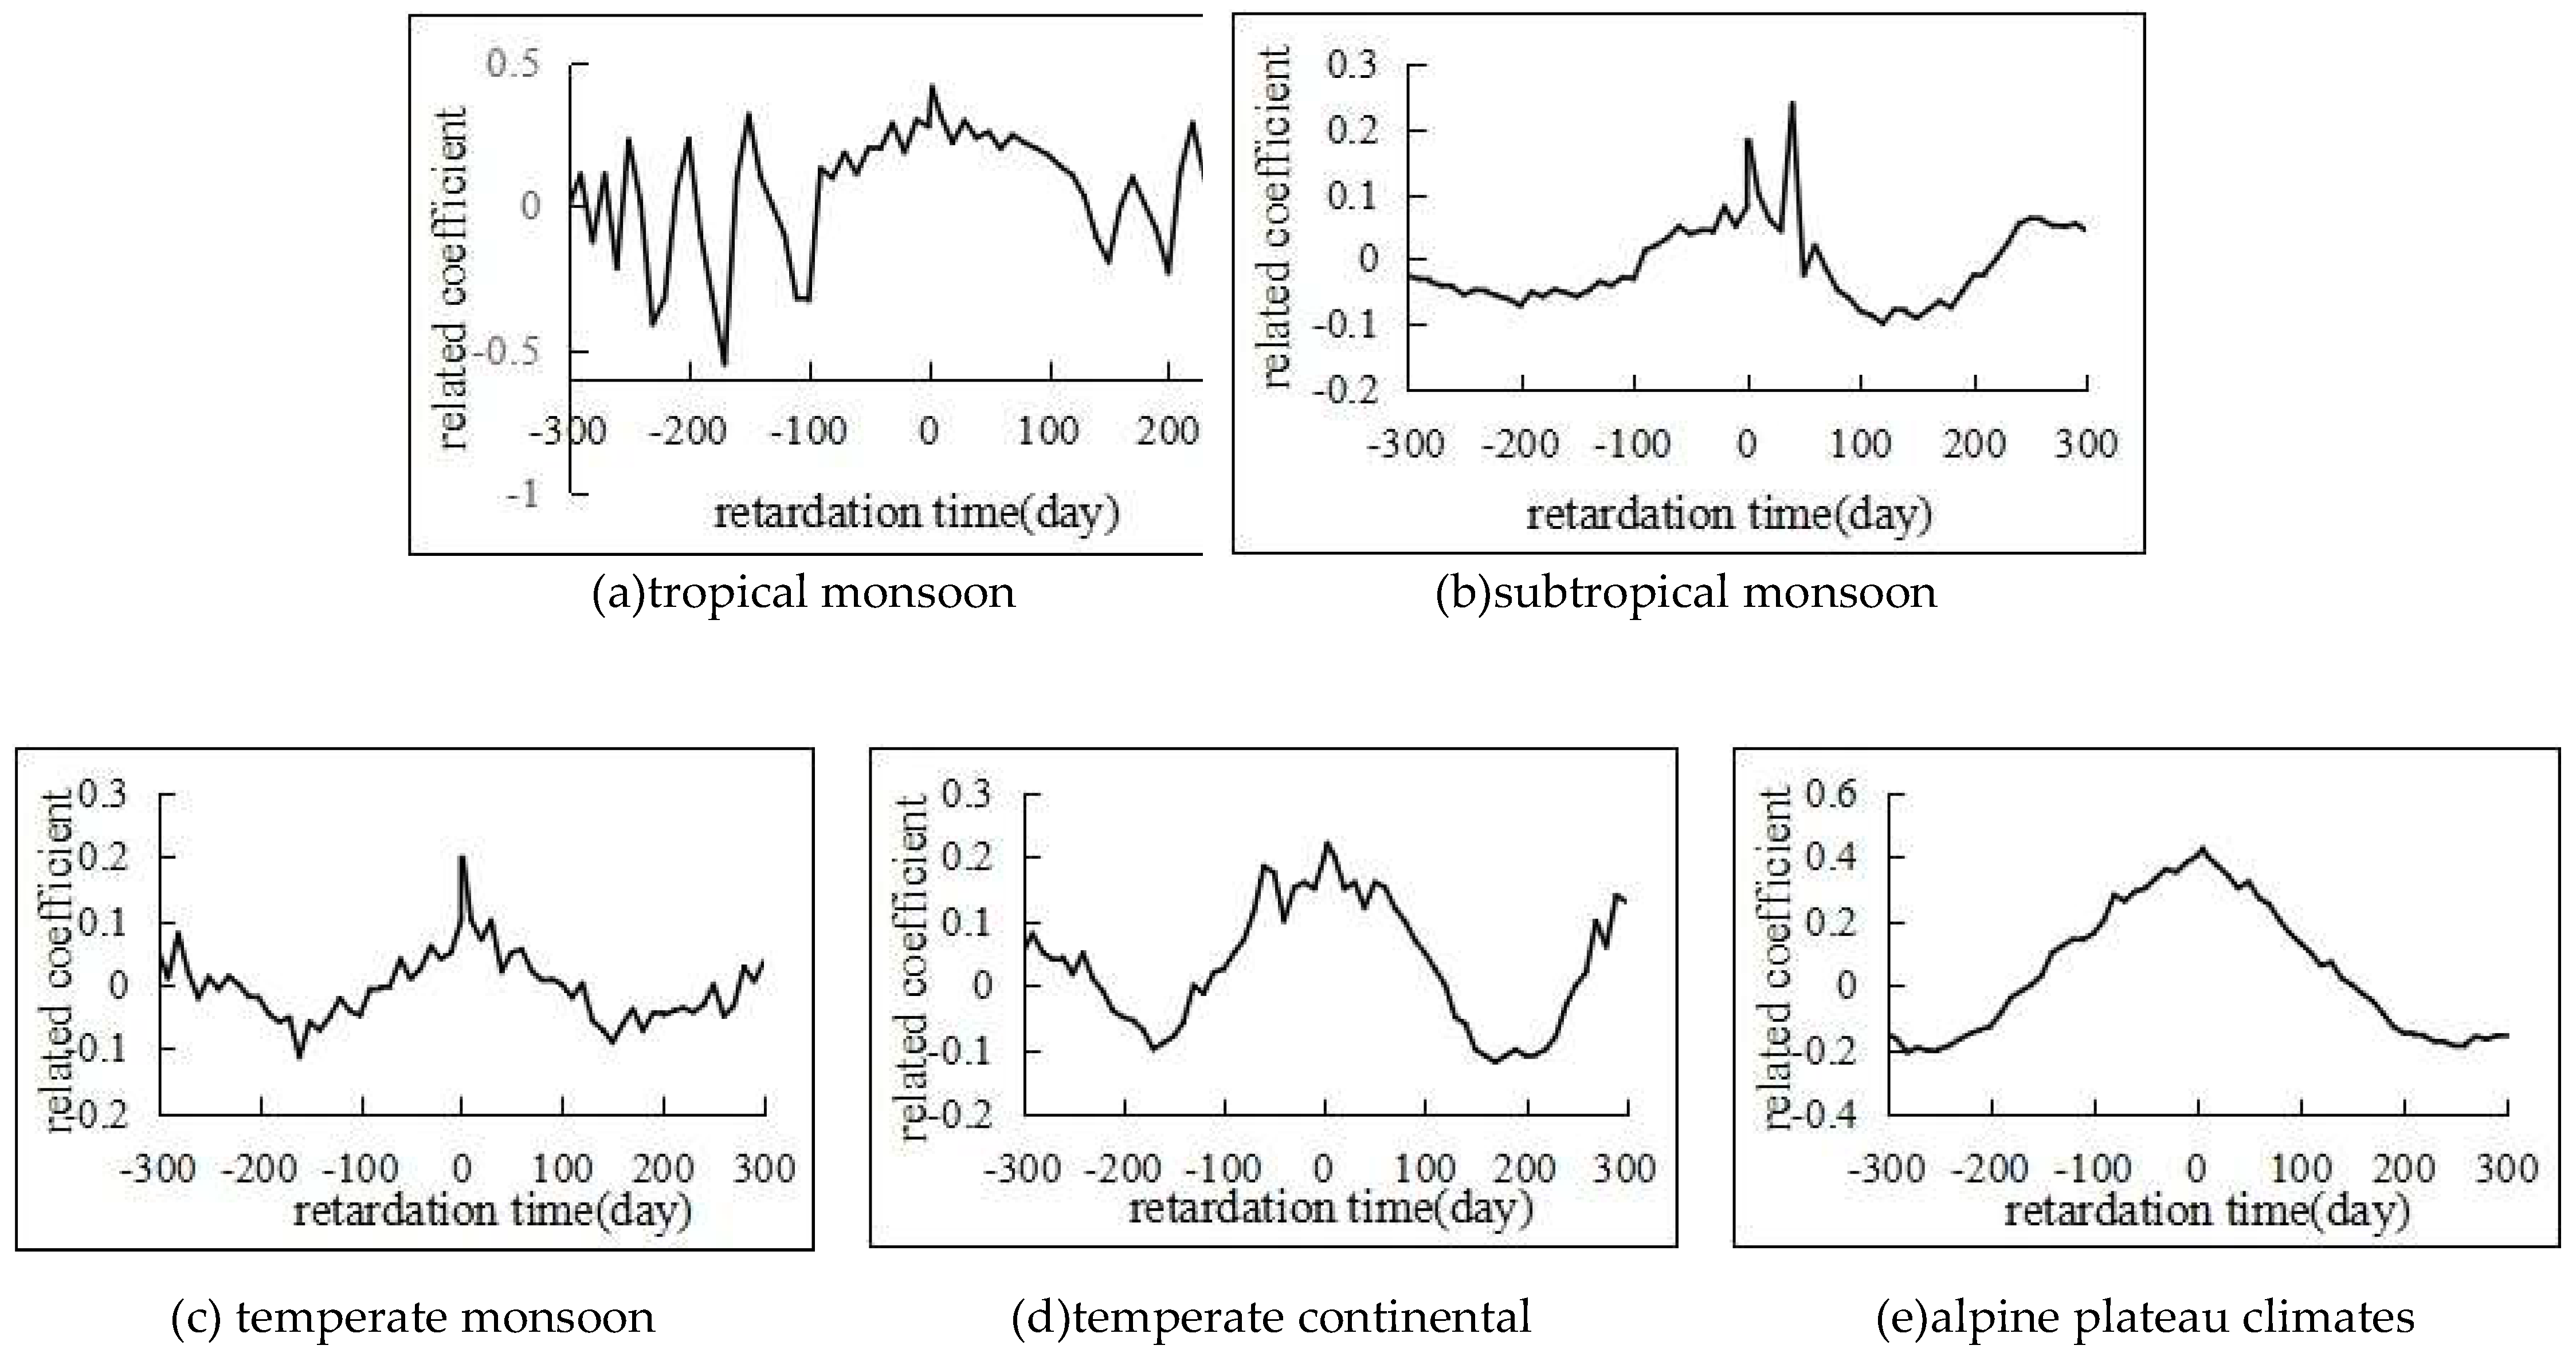
Figure 21.
The daily cross-correlation coefficients between daily temperature and SM in different zones.
Figure 21.
The daily cross-correlation coefficients between daily temperature and SM in different zones.
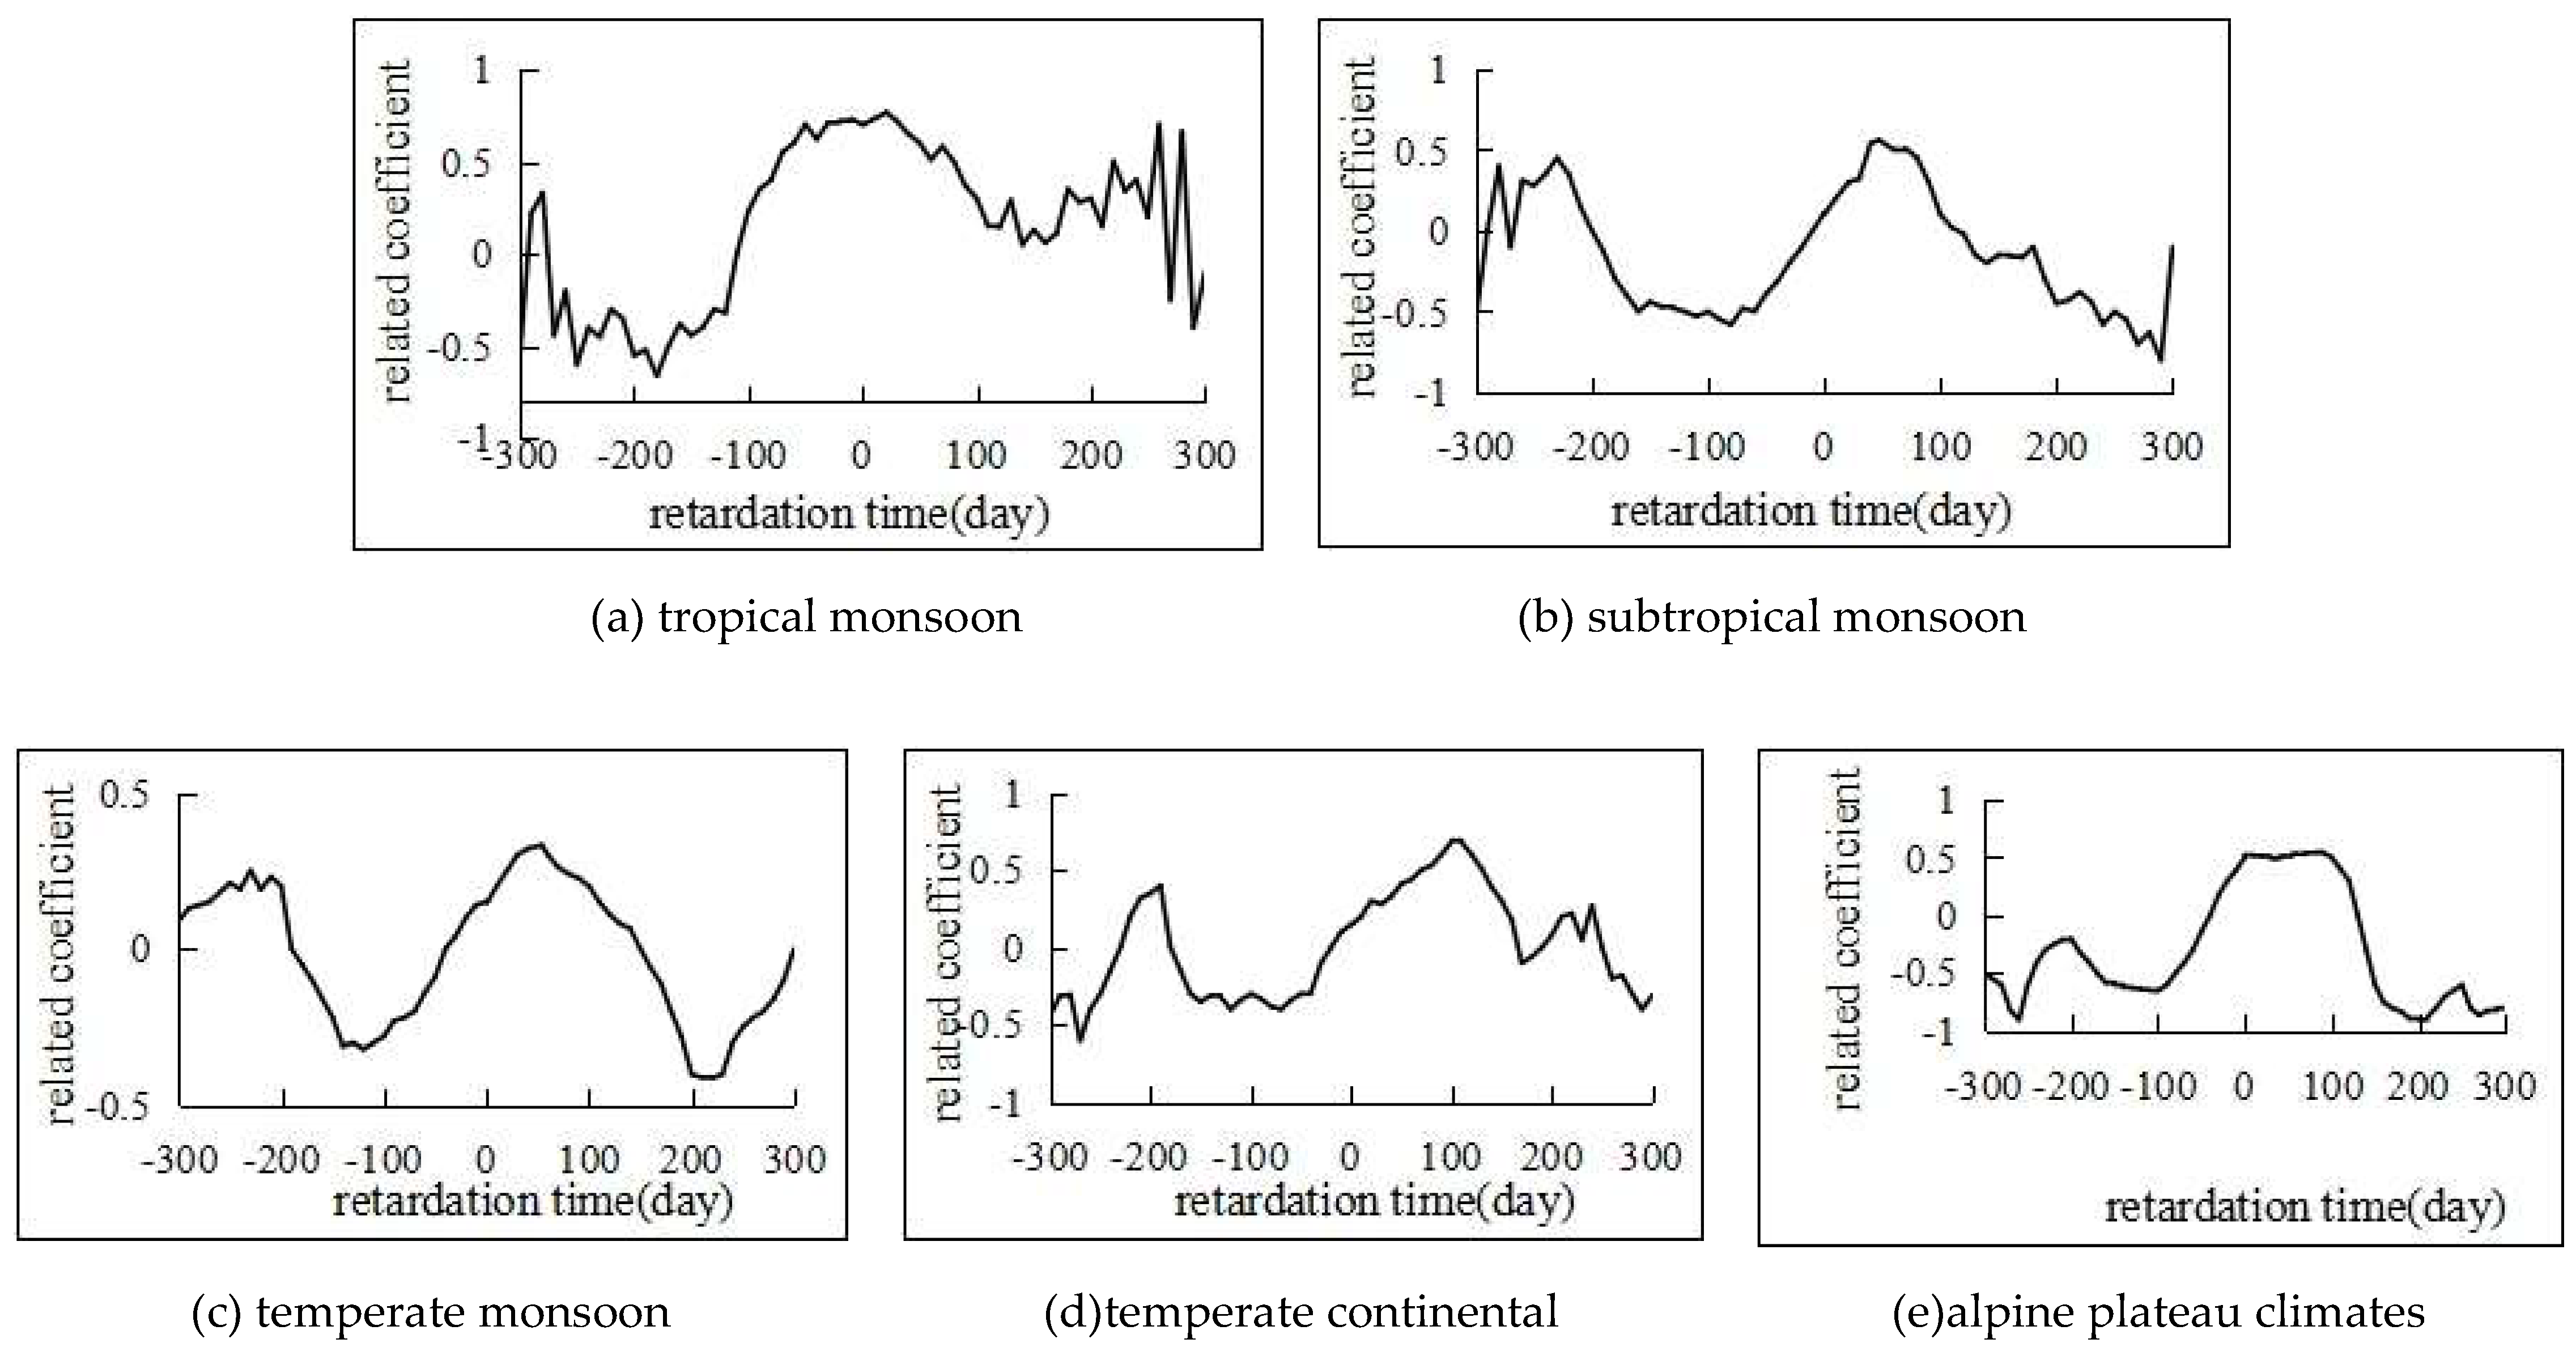

Table 1.
National Automatic Soil Moisture Monitoring Station Information.
| ID | Name | Longitude (°E) | Latitude (°N) | Soil Texture | Plant Type |
| 1 | Dongting Lake | 113.17 | 29.32 | 13%、82%、5% | Camellia oleifera |
| 2 | Guyuan | 115.68 | 41.76 | 7%、37%、56% | Grassland |
| 3 | Guangzhou | 113.64 | 23.25 | 5%、56%、39% | Grassland |
| 4 | Haibei | 101.31 | 37.61 | 7%、83%、10% | Grassland |
| 5 | Hefei | 117.17 | 31.9 | 11%、81%、8% | Rice |
| 6 | HulunBuir | 119.99 | 49.22 | 11%、57%、32% | Grassland |
| 7 | Jiangshanjiao | 128.95 | 43.86 | 32%、41%、27% | Forest Land |
| 8 | Jingyuetan | 125.62 | 44.79 | 10%、53%、37% | Corn |
| 9 | Minqin | 102.92 | 38.63 | 1%、11%、88% | Desert control |
| 10 | Nagqu | 92.01 | 31.64 | 11%、84%、5% | Grassland |
| 11 | Nanjing | 119.21 | 31.5 | 7%、61%、32% | Tea Plantation |
| 12 | Qiyang | 111.87 | 26.76 | 17%、74%、9% | Tea Plantation |
| 13 | Qianyanzhou | 115.07 | 26.75 | 25%、39%、36% | Grassland vegetation |
| 14 | Qingdao | 120.18 | 35.95 | 7%、55%、38% | Pine trees and fruit trees |
| 15 | Western Tianshan | 81.17 | 43.74 | 7%、59%、34% | apple |
| 16 | Xilinhaote | 116.33 | 44.14 | 8%、37%、54% | Grassland vegetation |
| 17 | Yucheng | 116.57 | 36.83 | 32%、56%、12% | Corn-Wheat Rotation |
| 18 | BayanNur | 107.22 | 40.73 | 32%、50%、18% | Corn |
| 19 | Daan | 123.85 | 45.6 | 28%、45%、27% | Grassland,saline-alkali soil |
| 20 | Deqing | 120.19 | 30.57 | 38%、33%、29% | Rice |
| 21 | Heihe | 100.32 | 38.77 | 36%、53%、11% | Sandy Grassland |
| 22 | Kanas | 87.02 | 48.1 | 31%、51%、18% | Grassland |
| 23 | Luancheng | 114.69 | 37.89 | 29%、50%、21% | Winter wheat –Corn rotation |
| 24 | Xiamen | 118.07 | 24.78 | 38%、33%、29% | Corn |
| 25 | Shangqiu | 115.59 | 34.52 | 31%、47%、22% | Corn |
| 26 | Shouyang | 113.2 | 37.75 | 32%、54%、14% | Corn |
| 27 | Turufan | 89.2 | 42.85 | 17%、78%、5% | Sandy Grassland |
1Note: The percentages in the soil texture are silt, sand, and clay respectively.
Table 2.
The correlation with meteorological factors on principal components.
|
Meteorological Factors |
Factor Loading | Communality | ||
| Principal Component 1 | Principal Component 2 | Principal Component 3 | ||
| T (℃) | 0.967 | 0.179 | 0.163 | 0.983 |
| Tmax (℃) | 0.981 | 0.098 | 0.117 | 0.977 |
| Tmin (℃) | 0.925 | 0.269 | 0.207 | 0.957 |
| P (mm) | -0.336 | 0.855 | 0.249 | 0.729 |
| U(m/s) | -0.490 | -0.408 | 0.768 | 0.548 |
| Rn (J/m2/d) | 0.641 | -0.672 | -0.006 | 0.677 |
Note:T、Tmax 、Tmin、P 、U and Rn represent mean temperature、maximum temperature 、minimum temperature、 precipitation、mean wind speed and net solar radiation intensity, respectively.
Table 3.
The influence weight of meteorological factors on SM in different climatic zones.
| climatic zones | T (℃) | Tmax(℃) | Tmin (℃) | P (mm) | U (m/s) | Rn(J/m2/d) |
| Tropical Monsoon | 0.196 | 0.192 | 0.186 | 0.191 | 0.047 | 0.184 |
| subtropical monsoon | 0.199 | 0.198 | 0.183 | 0.170 | 0.100 | 0.146 |
| temperate monsoon | 0.191 | 0.189 | 0.184 | 0.184 | 0.080 | 0.168 |
| temperate continental | 0.198 | 0.196 | 0.193 | 0.191 | 0.030 | 0.187 |
| alpine plateau climates | 0.221 | 0.215 | 0.215 | 0.170 | 0.015 | 0.162 |
| Mean | 0.201 | 0.198 | 0.192 | 0.181 | 0.055 | 0.169 |
Disclaimer/Publisher’s Note: The statements, opinions and data contained in all publications are solely those of the individual author(s) and contributor(s) and not of MDPI and/or the editor(s). MDPI and/or the editor(s) disclaim responsibility for any injury to people or property resulting from any ideas, methods, instructions or products referred to in the content. |
© 2025 by the authors. Licensee MDPI, Basel, Switzerland. This article is an open access article distributed under the terms and conditions of the Creative Commons Attribution (CC BY) license (http://creativecommons.org/licenses/by/4.0/).
Copyright: This open access article is published under a Creative Commons CC BY 4.0 license, which permit the free download, distribution, and reuse, provided that the author and preprint are cited in any reuse.


