Submitted:
08 May 2025
Posted:
08 May 2025
You are already at the latest version
Abstract
Nanoparticles are mixed into discotic liquid crystals (DLCs) to enhance their physical, optical, and electrochemical properties for advanced applications. The incorporation of nanoparticles can improve the thermal and mechanical stability of DLCs, as well as modulate their phase behavior and self-assembly characteristics. Nanoparticles can also serve as alignment aids, promoting uniform orientation of the discotic mesophase. Additionally, they introduce functionalities such as enhanced conductivity, magnetism, or photoluminescence, making the resulting composite materials suitable for diverse applications, including optoelectronic devices, sensors, and smart materials. This synergy between nanoparticles and DLCs enables the development of hybrid systems with novel and improved performance characteristics.In this chapter we explain the mixing of discotic liquid crystals and nanoparticles. Mainly what size and quantity of nanoparticle should be added to enhance the property of host DLCs is discussed.
Keywords:
liquid crystals
; discotic liquid crystals
; nanoparticles
; liquid crystal nano composites
; dielectric
; thermodynamic and optical studies
Introduction
Liquid crystals are unique materials that exhibit properties intermediate between conventional liquids and solid crystals[1]. They possess the fluidity of liquids while maintaining some degree of ordered molecular arrangement, characteristic of solids. This dual nature enables liquid crystals to respond sensitively to external stimuli such as temperature, electric fields, and magnetic fields, making them highly versatile. They are classified into various types, including thermotropic and lyotropic liquid crystals, based on their phase transitions and molecular arrangements. Widely used in display technologies, sensors, and advanced materials, liquid crystals play a pivotal role in modern science and technology due to their dynamic optical and electro-optical properties[2,3].
When compared to their bulk counterparts, nanoparticles—tiny particles with dimensions in the nanometer range, usually between 1 and 100 nanometers—display distinct physical, chemical, and biological characteristics. These characteristics, which include a high surface area-to-volume ratio, enhanced reactivity, and quantum effects, make nanoparticles extremely adaptable and valuable in a variety of fields. They have uses in environmental science, electronics, energy, and medicine and can be produced from metals, oxides, polymers, or biomaterials. Drug delivery, catalysis, imaging, and the creation of advanced materials all depend on nanoparticles, which provide creative answers to problems in both science and business. Because of their nanoscale size, which permits exact control over material performance, revolutionary advances in research and technology are made possible. [4,5]
Discotic liquid crystals [6,7], or DLCs, are significant functional materials that are used in photovoltaic solar cells, light-emitting diodes, one-dimensional conductors, and photoconductors. Typically, they consist of aromatic core in the middle, surrounded by aliphatic chains. A variety of supramolecular interactions, including π-π ntacts, charge-transfer interactions, dipolar or quadrapolar interactions, metal coordination, hydrogen bonding, and others, cause appropriately substituted disc-shaped molecules to organize themselves in orderly columns. The molecules can stack on top of one another to create columns because of the strong π-π contact between the aromatic cores and the weak connection between the flexible aliphatic chains. Along the columns, there is quasi-one-dimensional electrical conductivity due to strong intracolumnar contact and weak intercolumnar interaction. Numerous applications in the following domains have been suggested for these discotic systems' quasi-one-dimensional electrical conductivity [8,9,10]
Liquid crystal-nano particle (LC-NP) composites have become a popular topic of study for scientists studying soft matter, drawing from a variety of disciplines[11,12]. Liquid crystals/discotic liquid crystals characteristics can be effectively tuned with nanomaterials. There are several papers describing the distribution of NPs in DLCs, nematic LCs, and FLCs. [13,14,15] In this chapter we are focusing only on discotic naoparticle composite materials.
Methodologies
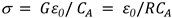
The present study uses 2, 3, 6, 7, 10, and 11-hexabutyloxytryphenylene (HAT4) as the DLC. The molecular configuration of the triphenylene-based DLC hexabutyloxytryphenelene (HAT4) with a plastic columnar phase (colhp) is depicted in Figure 1.
Gold nanoparticles (non functionalized GNPs, reactant free, displaying a light reddish colour) with the size of 5 nm and 2 nm diameter in the present study have been procured from Sigma-Aldrich, USA. Nanocomposites were prepared by dispersion of GNPs in pure DLC (HAT4). HAT4 and GNPs have been dissolved in chloroform (CHCl3) and nanocomposites are ultrasonicated for about 300 minutes to obtain uniform distribution. The desired dispersion formed as a result of the solvent (CHCl3) slowly evaporating. The Differetial Scanning Calorimeter of the NETZSCH model DSC-200-F3-Maia has been used to perform the thermodynamic analysis of the pure and nano system. During the heating and cooling cycles, machine has been operated at various scanning rates. The UV-1800 Shimadzu UV Spectrophotometer was used to record UV-Vis absorbance spectra in the wavelength range of 190-900 nm. A standard quartz cell with a path length of 10 mm was used to test CHCl3. The homeotropic and planner geometry, in which the plane of discotic molecules is parallel and perpendicular to the electrode surfaces, was used for the samples' dielectric analyses.
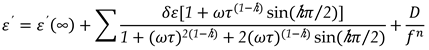
Figure 2.
11: Schematic representation of (a) planar and (b homeotropic alignment configurations of discotic columnar phase.
Figure 2.
11: Schematic representation of (a) planar and (b homeotropic alignment configurations of discotic columnar phase.
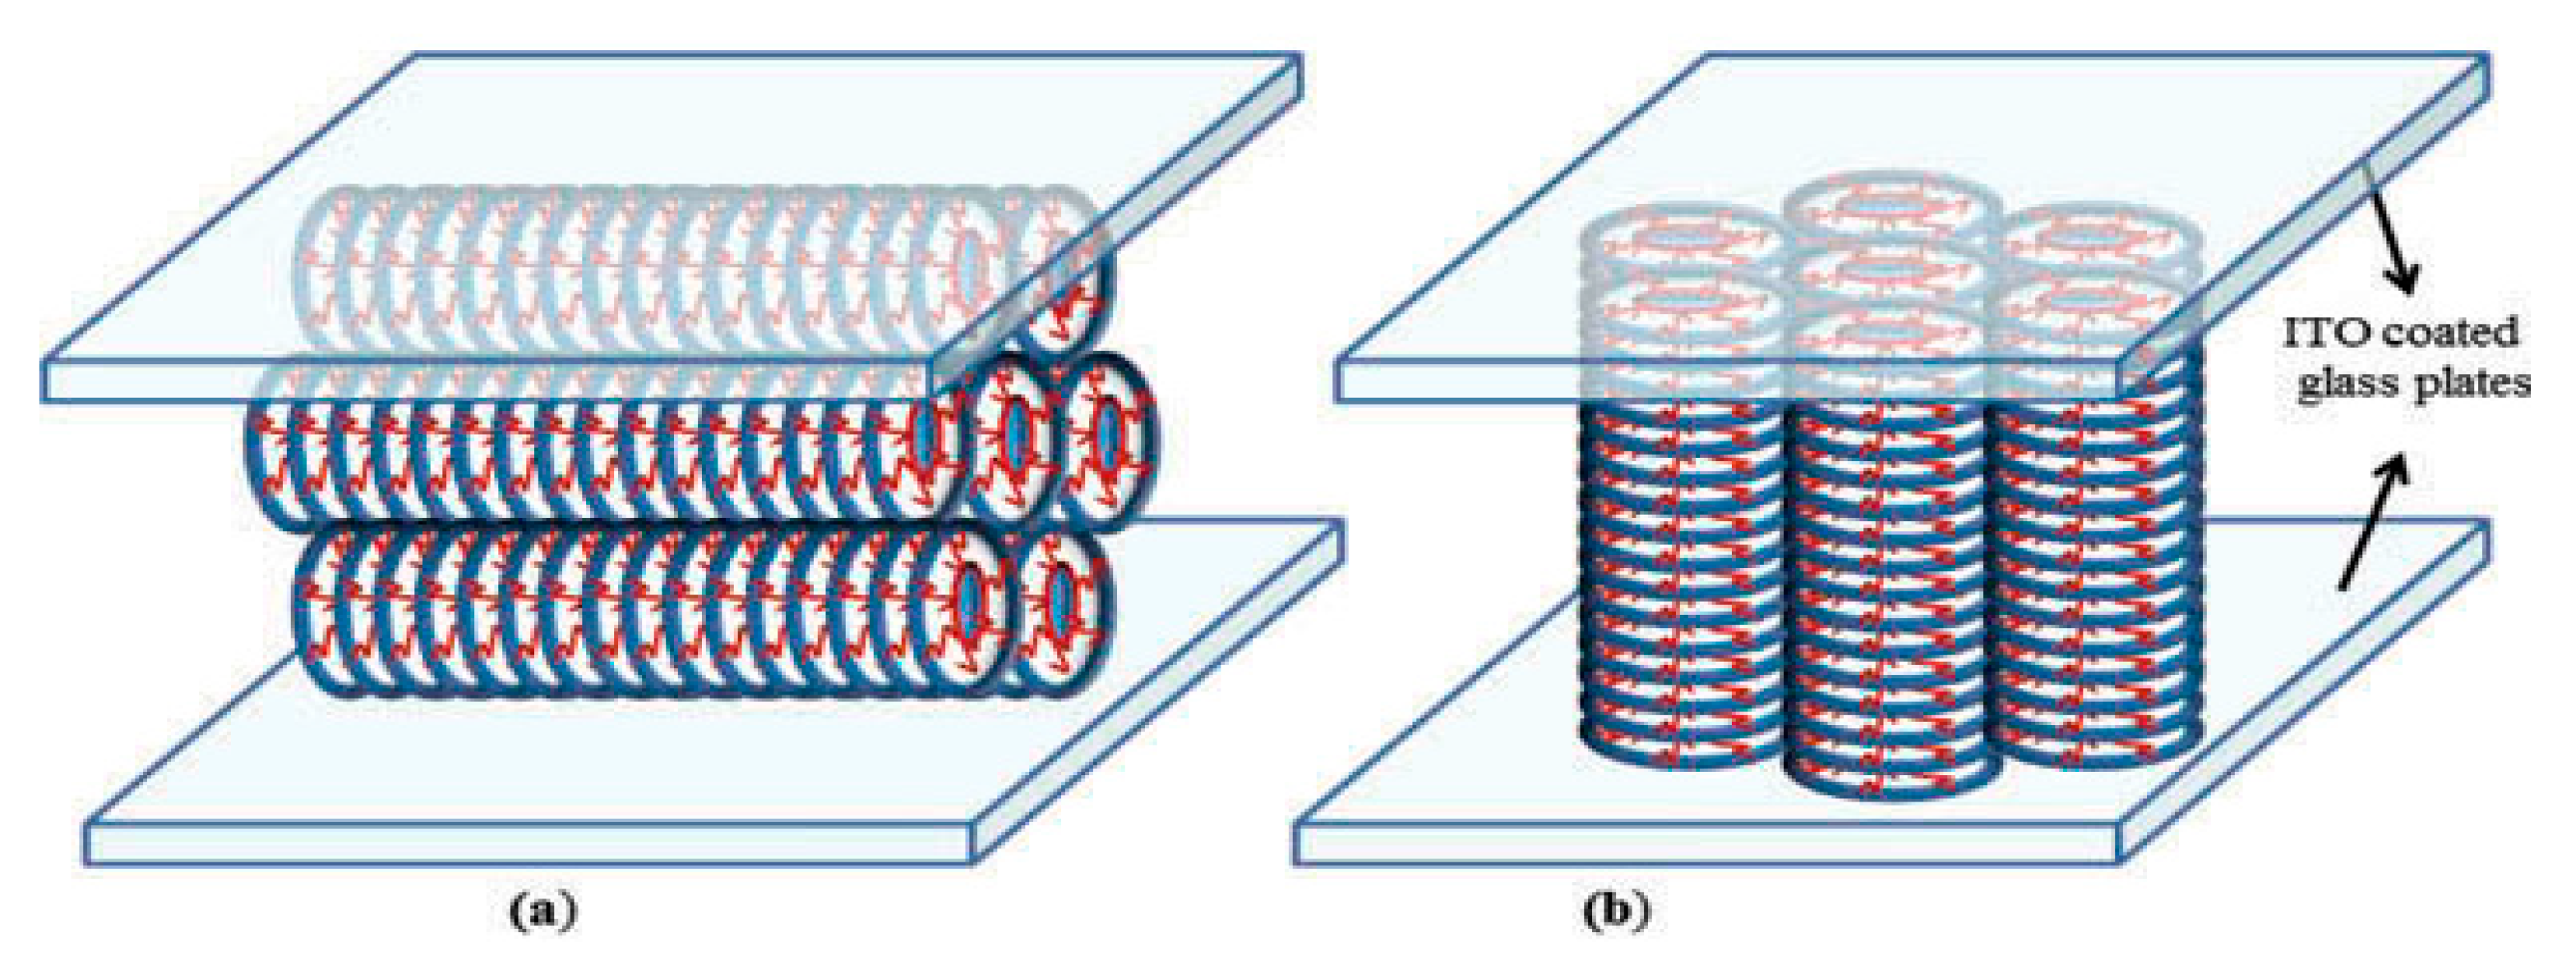
Two optically flat glass substrates covered in layers of indium tin oxide (ITO) were used to build the sandwiched type cells. Two mylar spacers, each 10 µm thick, were placed between the glass plates to fix the cell thickness. After that, the system was clamped using a sample holder to hold the plates in place without the need for any adhesive. By heating to the isotropic liquid phase, the samples were introduced by capillary action. Since it is the least energy configuration, spontaneous homeotropic alignment (column axis normal to the glass plates) of DLCs in thin cells is typically obtained by slowly cooling the sample from the isotropic phase. Unless otherwise indicated, dielectric data were captured during the cooling cycle, when better molecular alignment is anticipated than during the heating cycle. When cooling the dielectric data were obtained by using a Newton’s Phase Sensitive Multimeter (model PSM 1735 coupled with Impedance Analysis Interface (IAI model-1257) in the frequency range of 1-35 MHz during cooling of the sample from its isotropic liquid (IL) phase. The temperature of the samples for aforesaid measurements have been controlled with the help of a hot stage from Instec (model HCS-302) having an accuracy of ±0.1°C. Detailed methodology and necessary mathematical equations to obtain the dielectric permittivity (ε'), loss (ε'') and conductivity (σ) of the materials can be seen from our earlier publications Gold nanoparticles (GNPs) of two sizes 5 nm and 2 nm have been mixed in HAT4 with various low and high concentrations and discuss findings based on differential scanning calorimetry, polarized light microscopy, UV-Vis spectroscopy, X-ray diffraction (XRD) and dielectric spectroscopies. We have dispersed GNPs in four various amount 0.2, 0.6, 1.2 and 3 wt% in HAT4 i.e. both sizes of 0.2, 0.6, 1.2 and 3 wt%. of GNPs. Detail information regarding instruments experiments are discussed in my previous reports [16].
Calcualtion of the Dielectric Variables and Data Analysis
For the cell without etching of the sides have two components of capacitance . The capacitance of the empty cells
C (a) = CA + CD
In this case, CA and CD represent the cell's active and non-active capacitances. By filling the cell with a common non-polar liquid (in this case, cyclohexane), active capacitance (CA) is computed. The capacitance of the cyclohexane-filled cell:
where ε'(ch) is the relative permittivity of cyclohexane.
C (ch) = ε′ (ch) CA + CD
Finally, the above two equations gives,
CA= [C (ch)-C (a)]/ [ε' (ch)-1]
Comparing the cell's capacity before and after the cyclohexane was filled ensured that the molecule would be completely removed from the cell (after calibration). Permittivity (ε′) and loss (ε′′) of the material have been calculated with the help of the equations, for our lab made cells
For cell with etching of sides (Instec cells), there is no involvement of dead capacitance and hence:
 and
and
 where R is the resistance of the material sandwiched between parallel glass plates, f is the frequency, is the conductivity, and C (m) is the capacitance of the cell filled with material. While obtaining Equation 6, The following method has been used to determine the conductivity As shown below, R is inversely proportional to the sample's cross-sectional area and proportional to the material's resistivity (ρ) and electrode separation (s).


Using  in the above equation,
in the above equation,
To analyze the measured dielectric data, complex dielectric permittivity (ε∗) has been fitted with the generalized Cole-Cole equation, [30]

Both permittivity and loss from Equation 9, can be written as:
 where
where 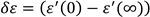 , The relaxation mode's symmetric distribution parameter (0< h<1), relaxation time, and dielectric strength are denoted by τ and h, respectively. The dielectric permittivity's low and high frequency limiting values are ε'(0) and ε'(∞).The presence of ionic conductance and electrode polarization capacitance at low frequencies causes the addition of the third and fourth terms in Equation (9) where D and n are the fitting parameters. Equation (9) adds the fifth imaginary term to partially account for the high frequency effect, where B and r are constants as long as the correction terms are small. Using a program created with Origin 6.1 software, the measured dielectric permittivity and dielectric loss data are fitted independently with Equations 10 and 11. Estimating the parameter values that best describe the data and minimizing deviations are the goals of nonlinear fitting. The correlation coefficient (R2) and chi-square (χ2) values in this case indicate the best fit. The value of R2 should tend to 1 and the value of χ2 should tend to 0 for the best fitted curve. The best fit values for the different parameters of Equations 10 and 11 are found through the fitting process. Using the determined fitting parameters, low and high frequency correction terms are computed. The correct dielectric spectrum of ε' and ε'', free from low and high frequency parasitic effects, is then obtained by subtracting these terms from the experimental data.
, The relaxation mode's symmetric distribution parameter (0< h<1), relaxation time, and dielectric strength are denoted by τ and h, respectively. The dielectric permittivity's low and high frequency limiting values are ε'(0) and ε'(∞).The presence of ionic conductance and electrode polarization capacitance at low frequencies causes the addition of the third and fourth terms in Equation (9) where D and n are the fitting parameters. Equation (9) adds the fifth imaginary term to partially account for the high frequency effect, where B and r are constants as long as the correction terms are small. Using a program created with Origin 6.1 software, the measured dielectric permittivity and dielectric loss data are fitted independently with Equations 10 and 11. Estimating the parameter values that best describe the data and minimizing deviations are the goals of nonlinear fitting. The correlation coefficient (R2) and chi-square (χ2) values in this case indicate the best fit. The value of R2 should tend to 1 and the value of χ2 should tend to 0 for the best fitted curve. The best fit values for the different parameters of Equations 10 and 11 are found through the fitting process. Using the determined fitting parameters, low and high frequency correction terms are computed. The correct dielectric spectrum of ε' and ε'', free from low and high frequency parasitic effects, is then obtained by subtracting these terms from the experimental data.Results and Analysis
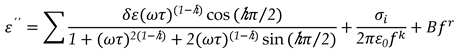
At intervals of 2.5 °C min-1, DSC was run at different scanning rates ranging from 2.5 °C min-1 to 15 °C min-1. Before recording the fair data, the samples underwent five thermal cycles to stabilize the system. The heating scans of pure DLC (HAT4) and its nanocomposites at a scan rate of 5 °C min-1 are displayed in Figure 2(a) for 2nm and 2(b) for 5nm, respectively.
At the Cr-Colhp and Colhp-I transitions, endothermic peaks were detected on heating scans and exothermic peaks on cooling scans. Heat absorption is represented by the transitions on the heating scan, while heat release is represented by the transitions on the cooling scan. conservation law. Columnar hexagonal to isotropic (Colhp-Iso) transition temperature is listed in Table 1 for various concentrations with accuracy ±0.5°C.
Figure 2.
(a): DSC thermograms for the pure and dispersed samples of size 2 nm GNPs during heating cycles at the scan rate of 5ºC/min.Curve (1) for HAT4, (2) for HAT4 + 0.2 wt% GNPs, (3) for HAT4 + 0.6 wt% GNPs and (4) for HAT4 +1.2 wt% GNPs.
Figure 2.
(a): DSC thermograms for the pure and dispersed samples of size 2 nm GNPs during heating cycles at the scan rate of 5ºC/min.Curve (1) for HAT4, (2) for HAT4 + 0.2 wt% GNPs, (3) for HAT4 + 0.6 wt% GNPs and (4) for HAT4 +1.2 wt% GNPs.
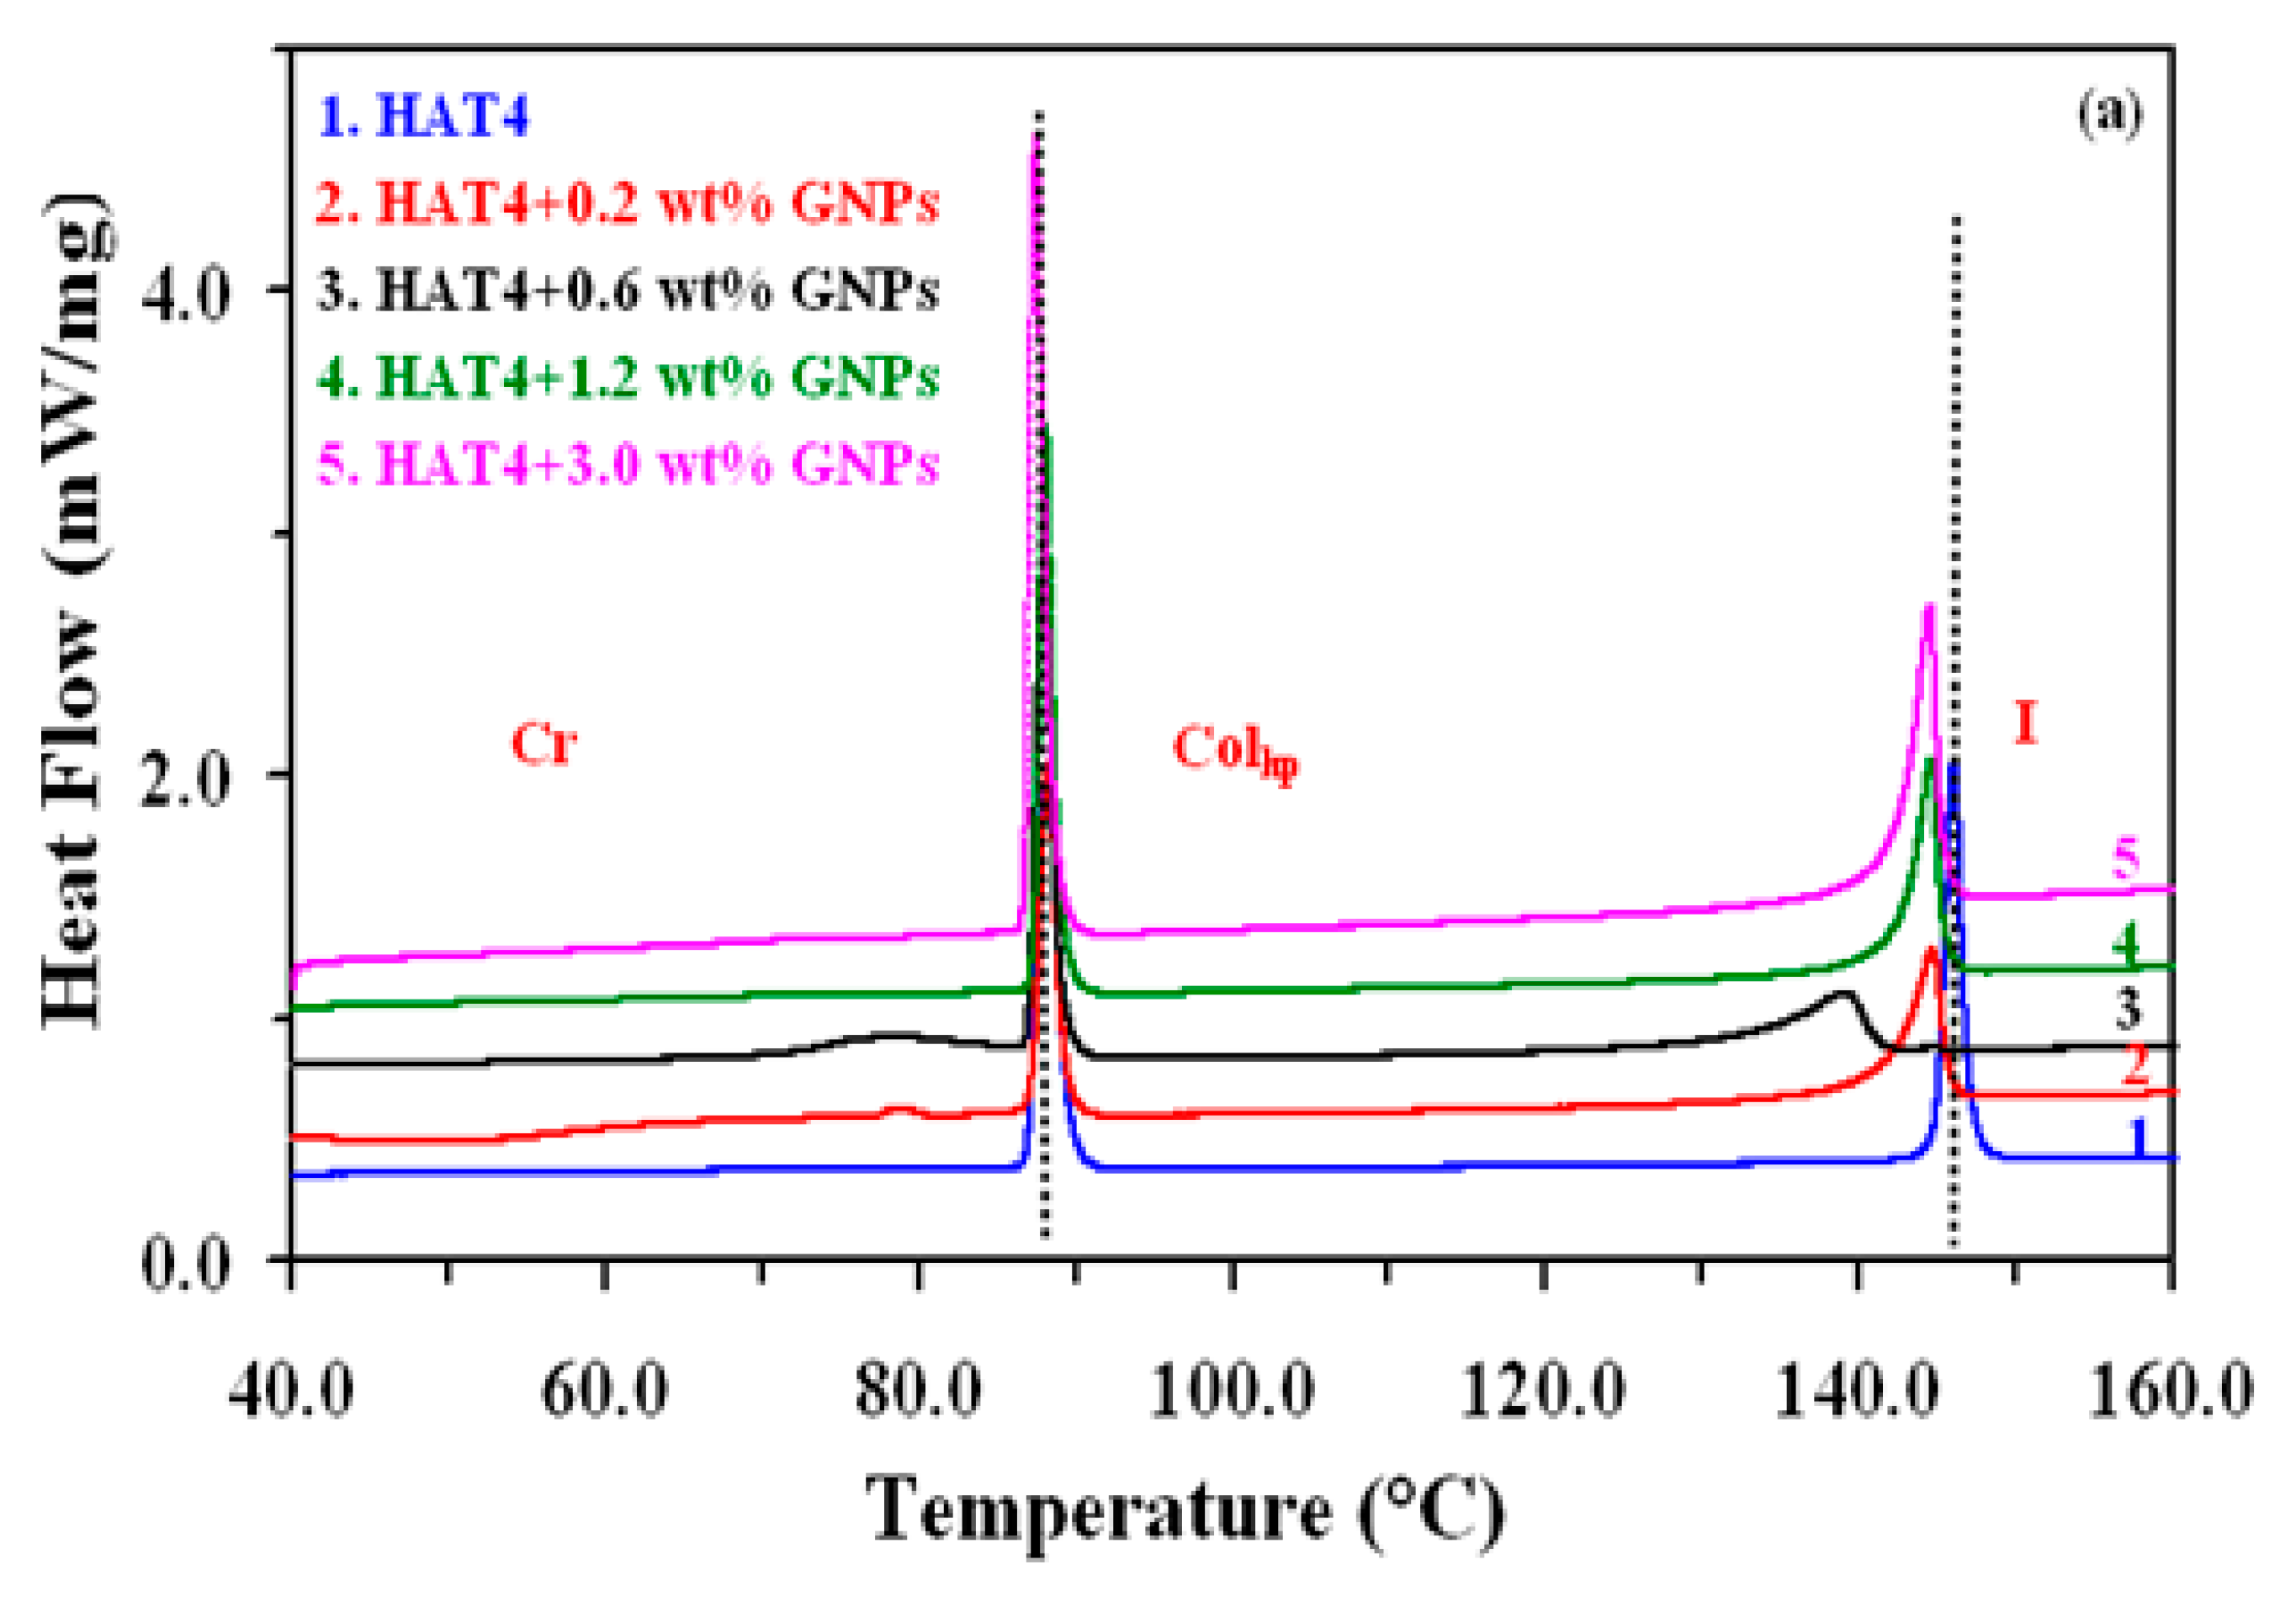
Figure 2.
(b): DSC thermograms for the pure and dispersed samples of size 5 nm GNPs during heating cycles at the scan rate of 5ºC/min.Curve (1) for HAT4, (2) for HAT4 + 0.2 wt% GNPs, (3) for HAT4 + 0.6 wt% GNPs and (4) for HAT4 +1.2 wt% GNPs.
Figure 2.
(b): DSC thermograms for the pure and dispersed samples of size 5 nm GNPs during heating cycles at the scan rate of 5ºC/min.Curve (1) for HAT4, (2) for HAT4 + 0.2 wt% GNPs, (3) for HAT4 + 0.6 wt% GNPs and (4) for HAT4 +1.2 wt% GNPs.
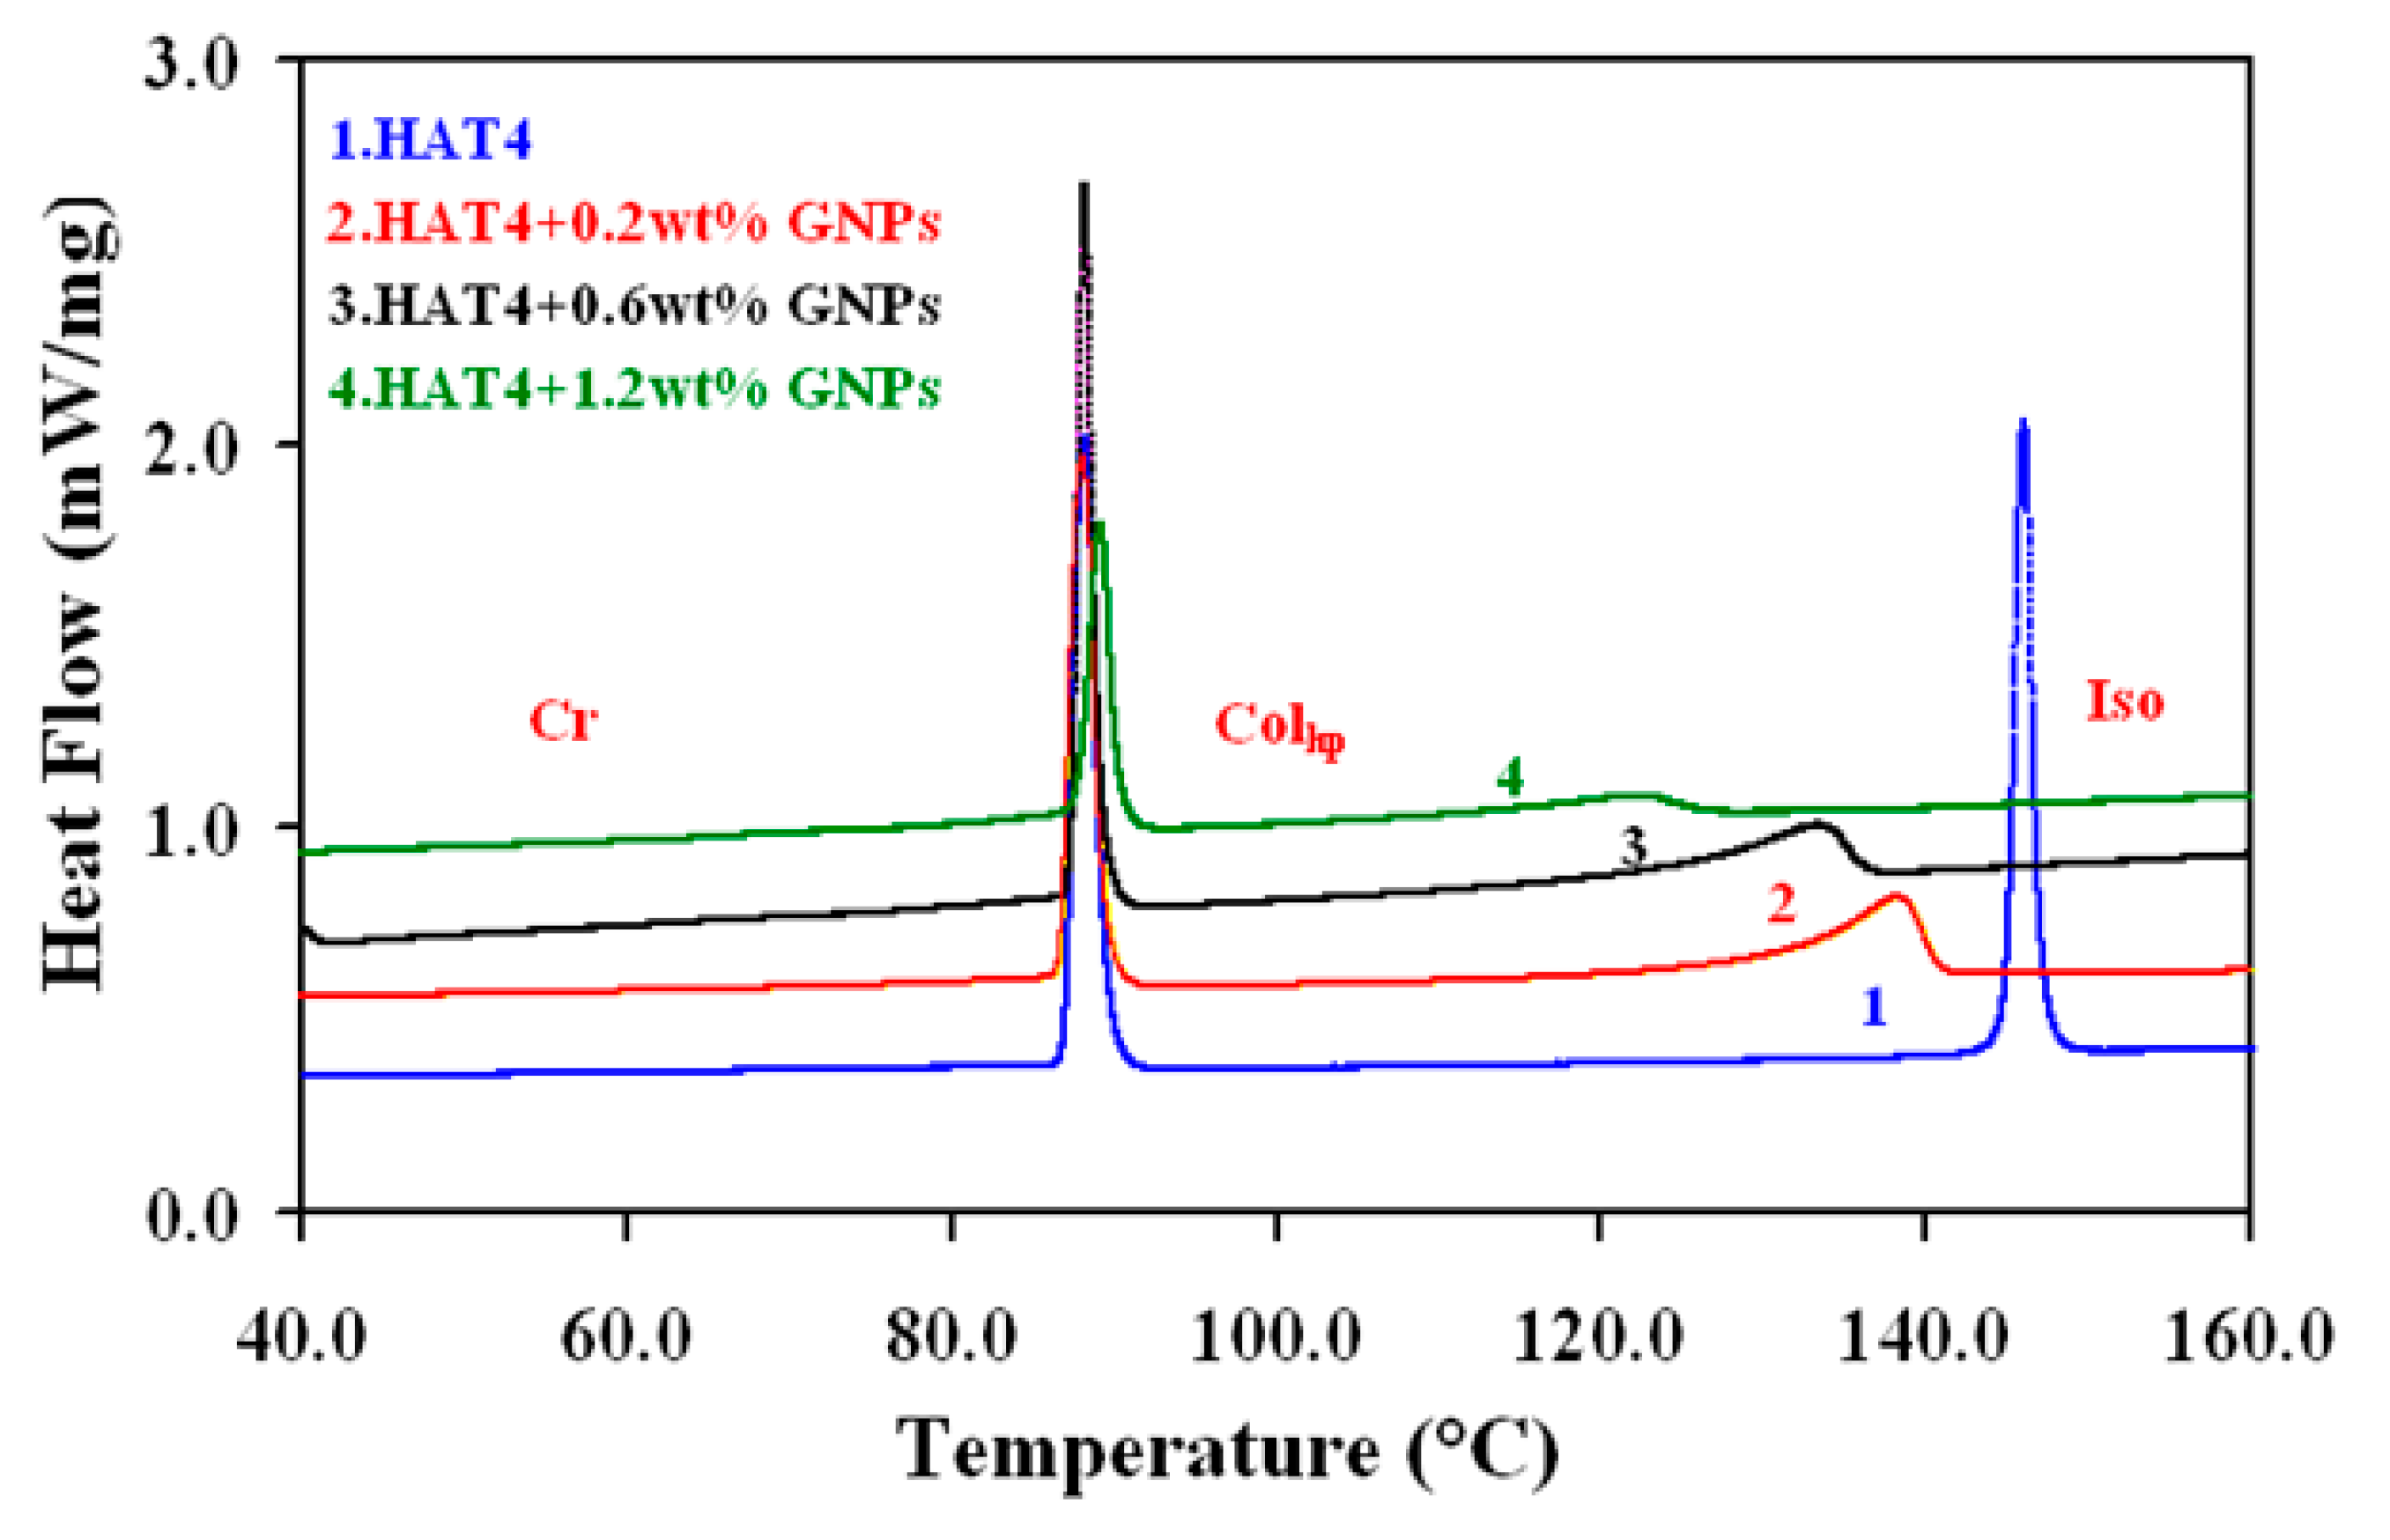
According to the results, increasing the amount of GNPs of 5 nm in HAT4 decreases the Colhp-Iso transition temperature up to 1.2 wt%. In contrast, the transition temperature begins to rise at 3 weight percent instead of decreasing.In a similar vein, the data for 2% weight shows that as GNP concentrations rise (below 1% weight), the Colhp-I transition temps drop sharply. This is conceivable since it is anticipated that GNPs will be placed in domain boundaries and columns, upsetting the cores—the Colhp–I transition being most negatively impacted. Based on the findings, I can deduce that the temperature of the Colhp-I transition, in particular, is either essentially constant or declines very slowly in the higher concentration zone for 2 nm. We can thus conclude that the transition temperature decreases very quickly with increasing GNP concentration in the first region, or low concentrations (<1 wt%), while it remains roughly constant or decreases very slowly with increasing GNP concentrations in HAT4 in the second region, or higher concentrations (>1 wt%). Several researchers have discovered that only a tiny quantity of NPs is needed to enhance the characteristics of liquid crystal hosts.
Doping with nanoparticles (NPs) generally results in increased conductivity in the isotropic and mesophases of discotic materials. Doping the GNPs in HAT4 produced similar results in our case as well, though there were some notable differences from earlier studies.Pure HAT4 has a conductivity of about 10-10 S-m-1, which is consistent with values found in published articles. In the case of the highest concentration (1.2 wt %) of GNPs, the conductivity in the colhp has increased by approximately five orders of magnitude.
For both 0.6 and 0.2 weight percent of GNPs (5nm), the increase in ionic conductivity in colhp is nearly identical. It is significant to note that, for composites containing 0.6 and 0.2 weight percent of GNPs, conductivity enhancement is nearly constant throughout the isotropic liquid and colhp phases, with the exception of a slight decrease at the iso-colhp transition, which is caused by an increase in viscosity at that point. On the other hand, when the composite with 1.2 weight percent of GNPs transitioned from the isotropic liquid phases to the colhp phase, conductivity increased significantly (see Figure 3). This demonstrates unequivocally that the molecules in the columns are highly aligned.
For 2nm GNPs, It is also evident from Figure 4 that the enhancement of the dc conductivity is nearly uniform throughout the isotropic and Colhp phase at lower concentrations (0.2 & 0.6 weight percent). On the other hand, conductivity has increased in the Colhp phase from the isotropic phase in the case of higher concentrations (1.2 & 3.0 wt%). From an application perspective, this is significant evidence of good homeotropic alignment in the Colhp phase during cooling from the isotropic phase.
Conclusion
Based on the aforementioned findings and discussions, it is determined that as GNP concentrations increase in DLC (HAT4), Colhp–I phase transition temperatures decrease more slowly at higher concentrations. Even higher concentrations of GNPs (2nm) (1.2 wt %) dispersed in HAT4 have been shown to significantly increase (by roughly seven orders of magnitude) the value of dc conductivity when compared to lower concentrations. Conductivity is initially high at higher concentrations (3.0 wt%), but as temperature drops owing to GNP aggregation, alignment deteriorates and conductivity drops. At lower concentrations (0.2 & 0.6 wt%), these values decrease rapidly. The findings clearly demonstrate that the columnar mesophase of HAT4 is plastic, exhibiting improved fluidity (mesophase behavior) at low concentrations (<2%) of GNPs without losing its columnar structure (as verified by XRD). However, because of the increased disorder, it is anticipated that a high concentration will destroy its mesomorphic nature.
References
- P. J. Collings, M. Hird. Introduction to Liquid Crystals. Taylor Francis, Bristol, PA 1997.
- P. G. de Gennes, J. Prost. The physics of Liquid Crystals, Clarendon Press, Oxford, 1993.
- G. Ozin, A. Arsenault. Nanochemistry: A Chemical Approach to Nanomaterials RSC, Cambridge, 2005.
- Kumar S, Chemistry of discotic liquid crystals: From monomers to polymers, CRC Press, Boca Raton, USA, 2011.
- Chandrasekhar S, Sadashiva BK, Suresh K, Liquid crystals of disc- like molecules. Pramana. 1977;9:471-480. [CrossRef]
- Bushby RJ, Kawata K. Liquid crystals that affected the world: discotic liquid crystals. Liquid Crystal. 2011;38:1415-1426. [CrossRef]
- Chandrasekhar S, Balagurusamy VSK, Discotic liquid crystals as quasi-one-dimensional electrical conductors. Royal. Society. Lond. A. 2002;458: 1783-1794. [CrossRef]
- Kumar, S. Recent developments in the chemistry of triphenylene-based discotic liquid crystals; Liquid. Crystal. 2004;31: 1037–1059. [CrossRef]
- Kumar, S. Triphenylene-based discotic liquid crystal dimmers, oligomers and polymer; Liquid. Crystal. 2005; 32:1089–1113. [CrossRef]
- Mishra M, Dhar R, Kumar S, Effect of the dispersed colloidal gold nano particles on the electrical properties of a columnar discotic liquid crystal;RSC Advances;2014 ;4: 62404-62410. [CrossRef]
- Mishra M, R. Dhar R, Kumar S Gold nanoparticles in plastic columnar discotic liquid crystalline material.Thermochimica Acta 2016; 631: 59-65. [CrossRef]
- Supreet R, Pratibha, Raina KK, effect of dispersion of gold nanoparticles on the optical and electrical pSroperties of discotic liquid crystal, Liq. Cryst. 2014; 41: 933–939. [CrossRef]
- Lopatina LM, Selinger JV, Theory of ferroelectric nanoparticles in nematic liquid crystals, Phys. Rev. Lett. 2009;102: 1–-4. [CrossRef]
- Reznikov Y, Buchnev O, Tereshchenkov O, Reshetnyak V, Glushchenko A, Ferroelectric nematic suspension, Appl. Phys. Lett. 2003; 82: 1917–1919. [CrossRef]
- Kumar V, Kumar A, Biradar AM, Reddy GB, D. Pasricha R, Enhancement of electro-optical response of ferroelectric liquid crystal: the role of grapheme quantum dots, Liq. Cryst. 2014; 41:1719–1725. [CrossRef]
- Mishra M, Dabrowski RS, Dhar R, Thermodynamical optical, electrical and electro-optical studies of a room temperature nematic liquid crystal 4-pentyl-4_cyanobiphenyl dispersed with barium titanate nanoparticles, J. Mol. Liq. 2016; 213 247–254. [CrossRef]
Figure 1.
Molecular structure of 2, 3, 6, 7, 10, 11- Hexabutoxytryphenylene (HAT4).
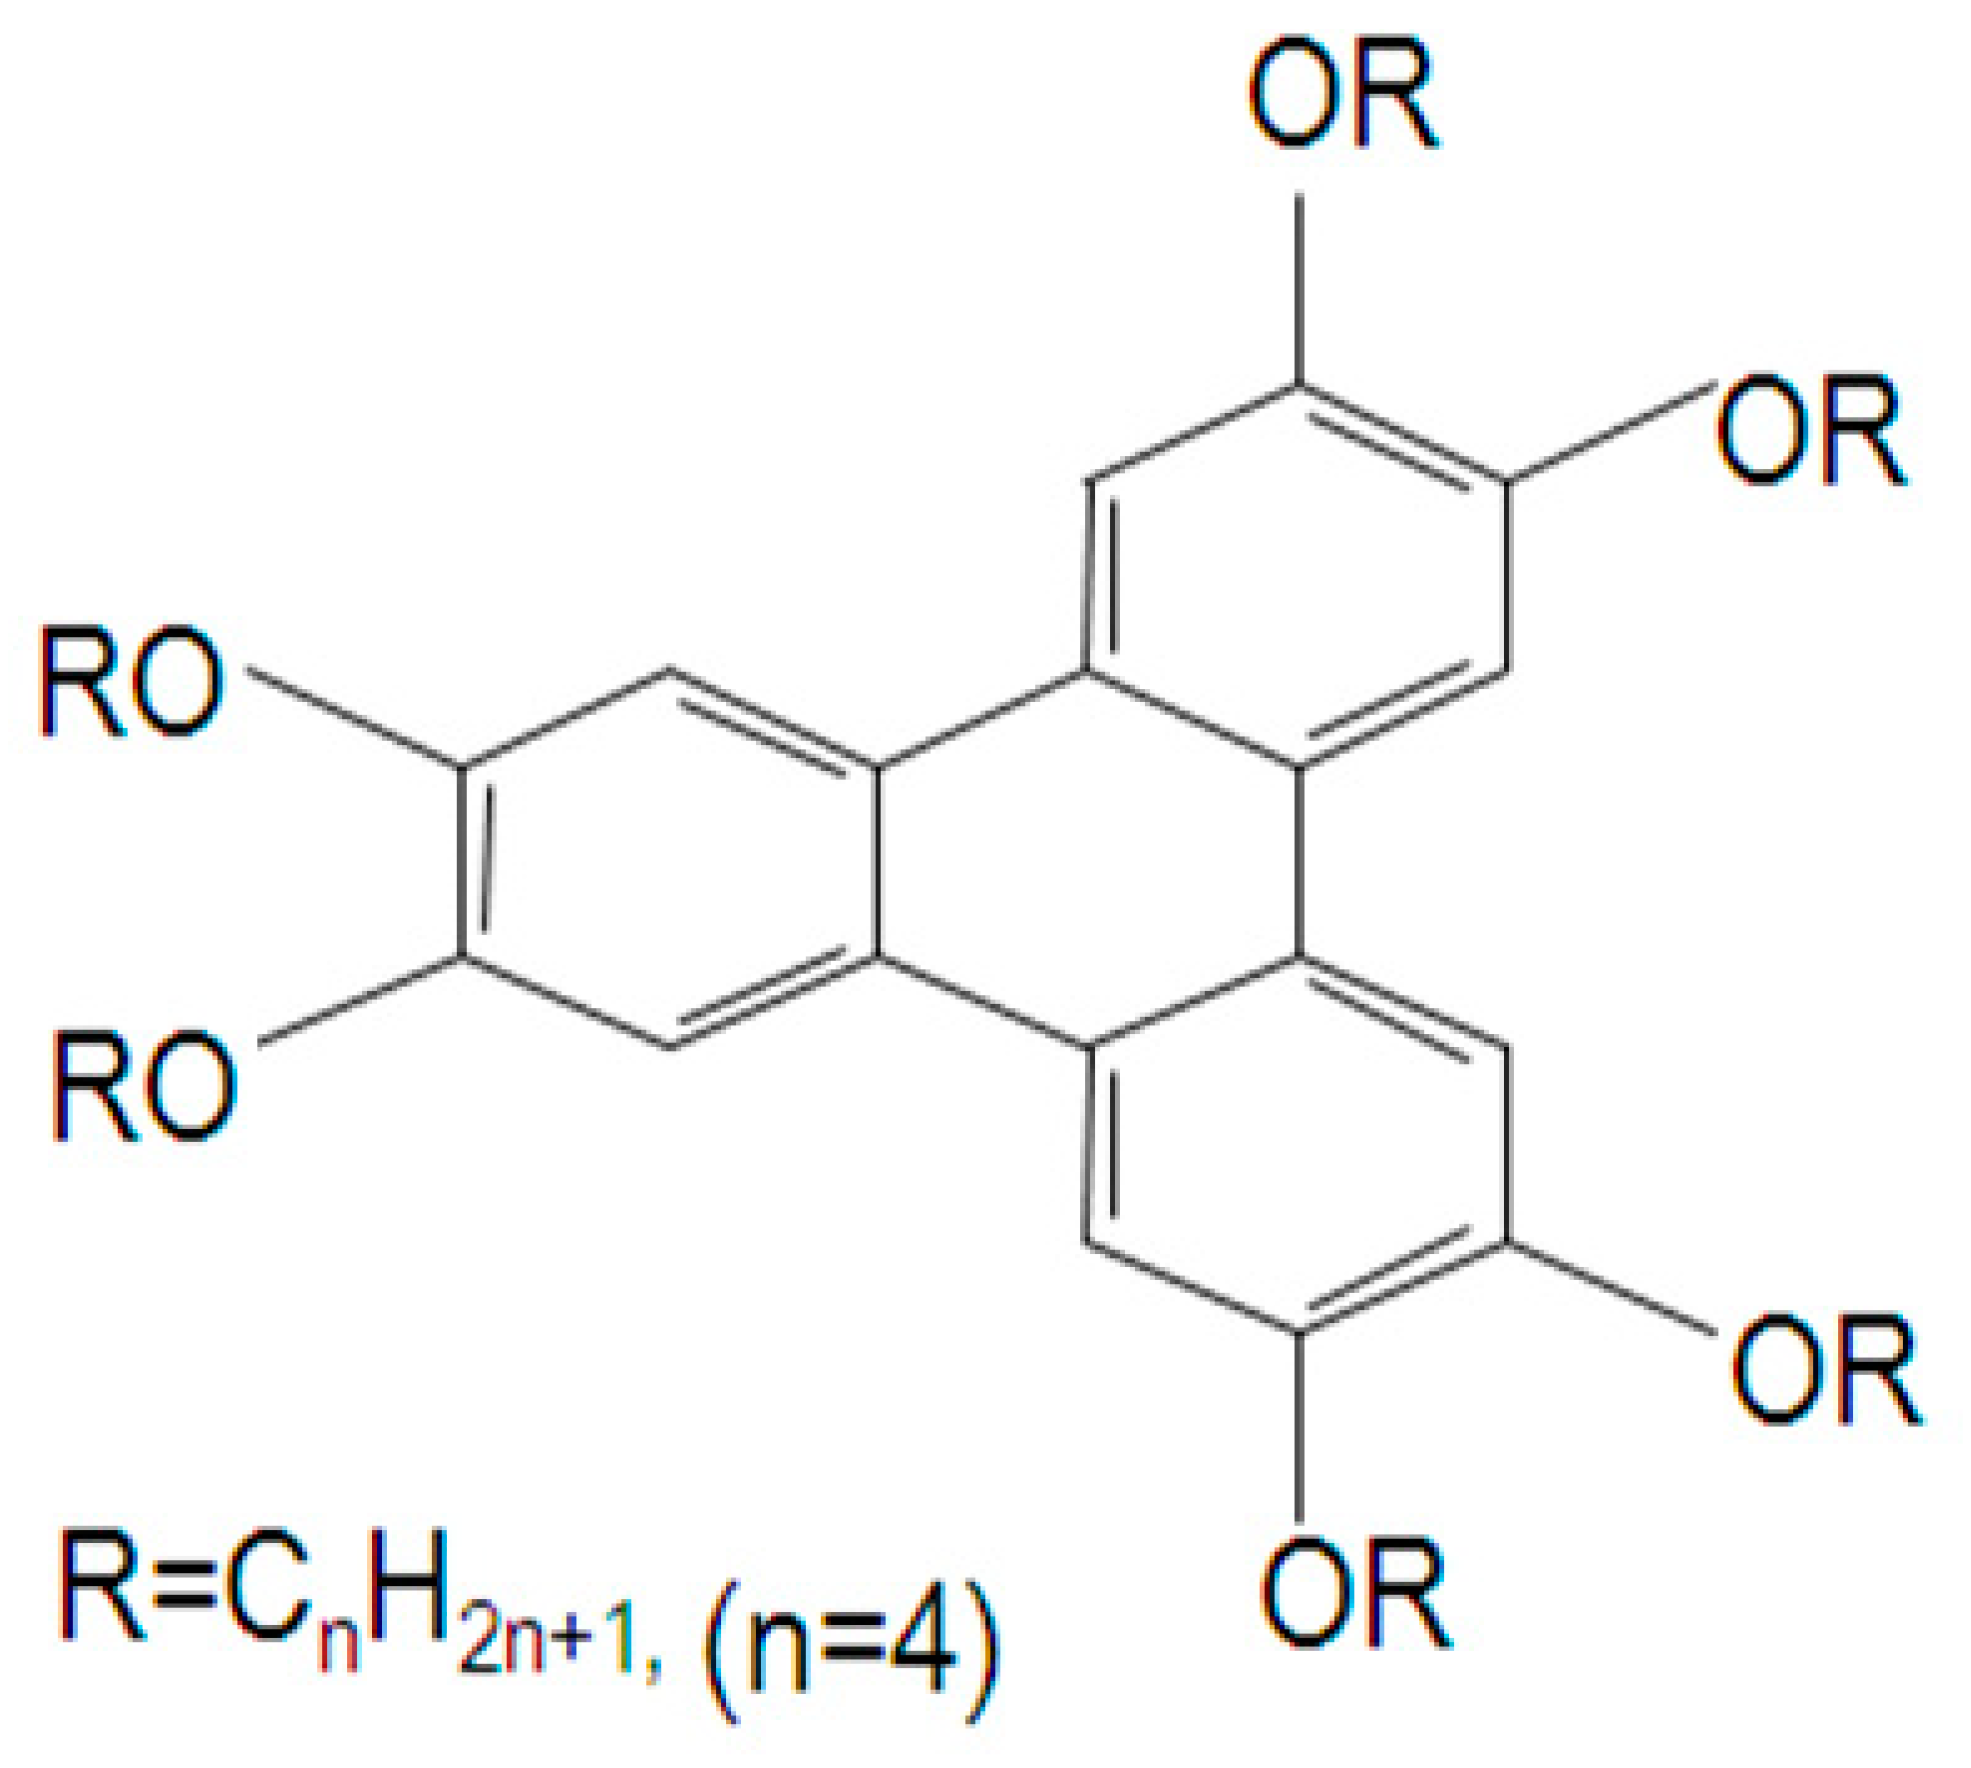
Figure 3.
Plot of Ionic conductivity vs tempertaure for pure and its nanocomposites (5 nm).
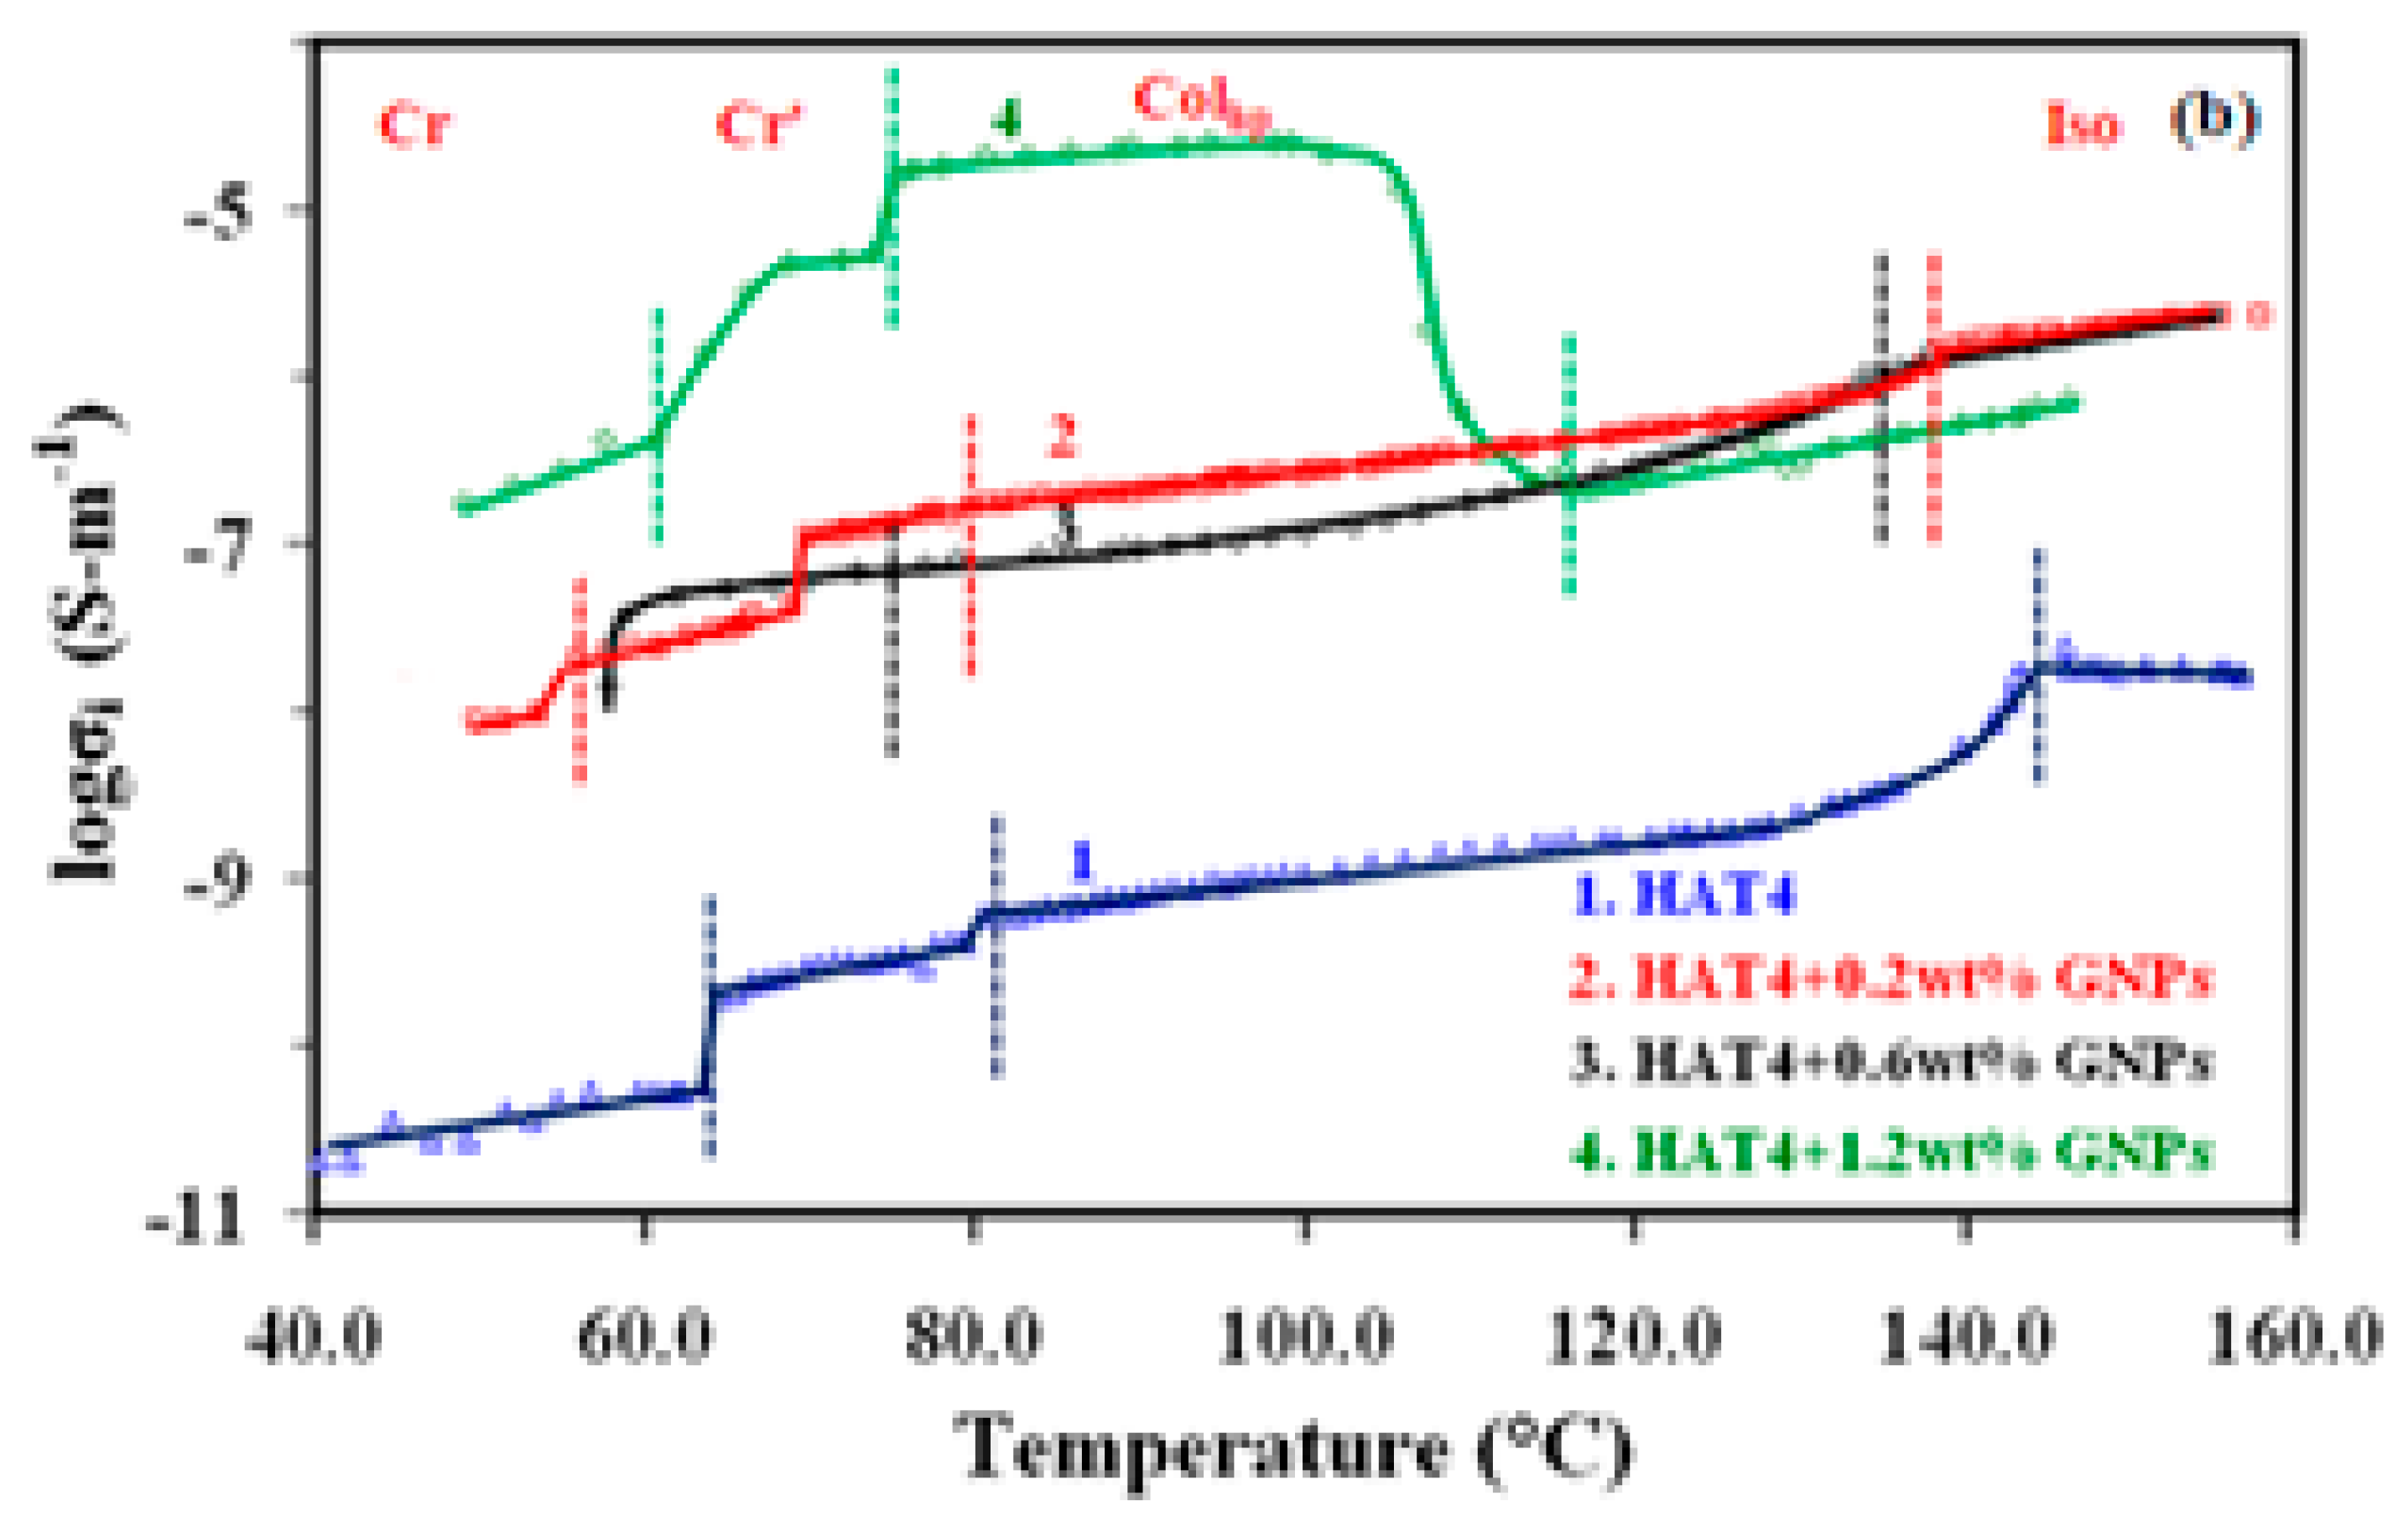
Figure 4.
Plot of Ionic conductivity vs tempertaure for pure and its nanocomposites (2nm).

Table 1.
Transition temperatures of pure and its nanocomposites.
| Sr. No. | Transition Temperatures | ||||
|---|---|---|---|---|---|
| Pure HAT4 | 0.2 wt% | 0.6 wt% | 1.2 wt% | 3.0 wt% | |
| Phase | Colhp-Iso | Colhp-Iso | Colhp-Iso | Colhp-Iso | Colhp-Iso |
| 5 nm | 144.8 | 137.9 | 132.8 | 122.7 | 139.5 |
| 2 nm | 144.8 | 143.9 | 137.9 | 143.9 | 142.8 |
Disclaimer/Publisher’s Note: The statements, opinions and data contained in all publications are solely those of the individual author(s) and contributor(s) and not of MDPI and/or the editor(s). MDPI and/or the editor(s) disclaim responsibility for any injury to people or property resulting from any ideas, methods, instructions or products referred to in the content. |
© 2025 by the authors. Licensee MDPI, Basel, Switzerland. This article is an open access article distributed under the terms and conditions of the Creative Commons Attribution (CC BY) license (http://creativecommons.org/licenses/by/4.0/).
Copyright: This open access article is published under a Creative Commons CC BY 4.0 license, which permit the free download, distribution, and reuse, provided that the author and preprint are cited in any reuse.


