Submitted:
08 May 2025
Posted:
08 May 2025
You are already at the latest version
Abstract
Plant defense responses are mediated by hormones such as jasmonic acid (JA) and salicylic acid (SA). JA and SA have been shown to trigger a range of different defense responses in model plants but little is described in crops like quinoa. Here, we present the first molecular description of JA and SA signaling at transcriptomic level in quinoa. Methods: The transcriptomes of quinoa cv. Kurmi seedlings treated with 100 µM JA or 1 mM SA for 4 h were analyzed. Results: Quinoa plants treated with JA showed 1246 differentially expressed (DE) genes and plants treated with SA showed 590 DE genes. The response to JA include genes for biosynthesis of JA, saponins, and lignin subunits, indicating that lignin biosynthesis may be induced by JA in quinoa plants. The SA treatment triggered the upregulation of genes for the biosynthesis of monoterpenoids and glucosinolates, which have defense responses properties. Conclusion: The results here suggest that JA and SA promotes the biosynthesis of lignin polymers and chemical defense compounds, respectively. Overall, the DE genes identified can be used as molecular markers in quinoa for tracking plant hormone pathway involvements in defense responses.
Keywords:
jasmonic acid
; next generation sequencing
; plant hormones
; quinoa
; RNA-seq
; salicylic acid
; transcriptomics
1. Introduction
Quinoa (Chenopodium quinoa Willd.) is an allotetraploid crop that has gained wide international interest due to its great nutritional properties and high tolerance to drought and salinity [1,2], and is now cultivated in more than 120 countries around the world [3]. Quinoa has been much investigated regarding its capability to tolerate abiotic stress [4]. In contrast, its response to biotic stress has been far less studied, despite the fact that plant diseases (e.g. downy mildew) [5] and insect plagues (e.g. quinoa moth) are main factors affecting crop yields at Andean highlands, the native homeland of quinoa [6]. For example, the downy mildew disease caused by the oomycete Peronospora variabilis can lead to crop losses up to a 99% in susceptible cultivars (e.g. cv. Utusaya) unless controlled [7].
Plant defense responses, mainly based on observations in Arabidopsis thaliana, are regulated by phytohormones such as salicylic acid (SA) and jasmonic acid (JA). Plant defense against biotrophic pathogens usually involves the activation of SA-mediated defense response pathways. On the other hand, defense response against necrotrophic pathogens and insects involves JA to a greater extent [8]. The crosstalk between the signaling pathways of these two hormones creates a highly regulated network to prevent pathogen damage and optimize the defense response. SA usually takes transcriptional control over JA [9], but SA-mediated defense responses can also be regulated and even suppressed by JA [10]. Recent discoveries have shed more light on the impact of JA on the defense response against biotrophic pathogens; in grapevine, it has been shown that resistance to the biotrophic pathogen Plasmopara viticola is mediated by JA [11]. The application of JA to plants related to quinoa, such as sugarbeet, have shown to reduce the progression of disease symptoms by multiple post-harvest pathogens [12].
Quinoa exposure to JA and SA has been used to overcome drought stress symptoms [13]. The effect of JA application in quinoa has also been studied to evaluate JA impact on saponin biosynthesis through gene expression changes [14]. However, little is known about the effect of JA and SA for quinoa to overcome biotic stress. Previous investigations of quinoa-microbial interactions have indicated associations to quinoa orthologs of genes that are responsive to biotic stress hormones such as JA [15], but a direct association of quinoa genes to hormones has not been done.
In order to provide a stable foundation for transcriptomics analyses of quinoa biotic interactions, and avoiding analyses by proxy, we here present the quinoa transcriptomic response to treatments with JA and SA. Our results suggest that quinoa seedling exposure to JA in vitro triggers genes for synthesis of JA and production of lignin monomers. Meanwhile, the application of exogenous SA suggested the upregulation genes for monoterpenoid biosynthesis and SA degradation.
2. Results
2.1. Transcriptomic Analysis of Quinoa Seedlings Treated with JA or SA
Five RNA samples from 2 days-old quinoa seedlings treated with SA or JA for 4 hours were collected. The four RNA samples that showed best quantity and quality parameters were selected for RNA-seq. Sequencing was carried out with an output between 3.87 and 4.53 million paired-end reads of 300 bp length per sample (Table 1). Reads were mapped to the chromosome-level assembly of the quinoa genome cultivar QQ74 (Table 1). The proportion of mapped reads to the QQ74 quinoa genome was on average 95.4 %.
Reads aligned to a single gene accounted for 13.8%, reads aligned to two genes (ambiguous) were only 0,017%. Reads that were aligned to multiple genes with no clear assignment (alignment_not_unique) were 34%. The majority of reads were defined as “no feature” (48,5%) during counting with HTseq, therefore we suggest those reads belong to noncoding RNA because we used a CDS reference annotation file. For these reasons, our downstream analysis was done only with reads assigned to a single gene, especially for the differential gene expression analysis (Table S1).
DGE analysis was performed comparing the transcriptome of each treatment (JA and SA) against the control. Genes that have at least one read count were considered (36,049 genes). Quinoa plants treated with JA showed 1246 DE genes (Table S2), while quinoa plants treated with SA showed 590 DE genes (Table S3).
2.2. KOBAS-i Gene Set Enrichment Analysis of Quinoa Treated with JA and SA
We analyzed JA and SA set of DE genes and we found an overlap of 119 genes that were significantly differentially expressed by both treatments (Figure 1A, Table S4). There was a higher number of DE genes after JA treatment (1125) as compared to SA treatment (471). JA induced 918 genes, while repressed 328 genes. SA induced 389 genes, while repressed 201 genes (Figure 1A).
The bubble plot gene set enrichment analysis has shown that JA and SA response has the same two pathways with the highest p values of enrichment: Biosynthesis of secondary metabolites and metabolic pathways. Both JA and SA samples also displayed significant enrichment for alpha-linolenic acid metabolism, yet whereas JA induced effects on aromatic amino acid biosynthesis, SA was significantly associated with metabolism of glutathione, ABC transporters and porphyrins (Figure 1B-C).
Bar plots on the other hand, as they show the enrich ratio, which measures the relevance for a gene set to an experimental condition, indicate that quinoa treated with JA is activating synthesis and degradation of ketone bodies, alpha-linolenic acid and linoleic acid metabolism as the top categories (Figure 1D). Quinoa treated with SA revealed that the most enriched genes are involved in biosynthesis of glucosinolates, monoterpenoid biosynthesis and ABC transporters (Figure 1E).
2.3. KOALA Annotation and KEGG Mapping Reveals That JA Application Induces Genes for Biosynthesis of Jasmonates
The sets of differentially expressed genes were further analyzed for annotation of genes for metabolic pathways in the KEGG database with BlastKOALA. Thus, KEGG enrichment analysis for JA showed that alpha-linolenic metabolism genes were highly enriched (Figure 1D). Linolenic acid is a precursor of JA and is involved in its biosynthesis. Looking at the KEGG enrichment with more detail we could observe that JA induced the gene expression of eight quinoa genes (AUR62019248, AUR62019249, AUR62012258, AUR62002817, AUR62000076, AUR62000077, AUR62009902 and AUR62001467) that were annotated as orthologs of lipoxygenase-2 (LOX2, K00454). LOX2 produces 13(S)-hydroxiperoxyoctadeca-9,11-dienoic acid (13S-HPODE), a precursor of JA. In fact, the whole JA biosynthesis KEGG module (M00113) was significantly induced (Figure 2, Table 2 and Supplementary Table S7). The automatic annotation by KEGG pathway map viewer can be seen at Supplementary Figure S2. Thus, the results suggest that JA was synthesized from alpha-linolenic acid in quinoa when the plants were spray-treated with JA, in what may be a positive feedback loop regulation. LOX1 was also significantly induced in quinoa, a gene that was previously thought to be involved in JA biosynthesis through the linoleic acid metabolism (K15718, AUR62005156).
2.4. Quinoa Treatment with JA Induces Genes Involved in Lignin Biosynthesis
BlastKOALA annotated to functional categories almost half (618 genes; 49,6%) of the whole set of DE genes responsive to JA treatment. The highest proportion of genes was annotated to the large gene groups associated with carbohydrate metabolism (15%), amino acid metabolism (11,5%) and signaling and cellular processes (10,5%) (Figure 1). The annotation by KOALA has better correlation with the enriched bubble plot generated by Kobas-i than the Barplot enrichment (Figure 1).
In order to pinpoint whole signaling pathways induced by JA treatment in quinoa, a gene enrichment was performed with the KEGG Mapper. KEGG reconstruction showed that 5 pathway modules were DE and were the following (Supplementary Table S2): JA biosynthesis and beta-oxidation in the acyl-CoA synthesis as part of the lipid metabolism module (M00087). The serine and cysteine biosynthesis in the aminoacid metabolism module (M00021). The mevalonate pathway (C5 isoprenoid biosynthesis) in the module of biosynthesis of terpenoids and polyketides (M00095). And the module of flavanone biosynthesis (M00137) that converts phenylalanine into naringenin inside the biosynthesis of other secondary metabolites module.
The modules signature inside the KEGG mapper reconstruction analyzes whole biological pathways where the software can annotate all or some DE genes that belong to a certain pathway. The module signature allows to explore biological pathways with 1 or more components (blocks) that are not annotated (i.e., a gene missing on a DGE list of a pathway during a certain experiment). During our JA treatment of quinoa plants, we found that several genes in the monolignol biosynthesis pathway were differentially expressed (Figure 3, Table 3). Putative quinoa genes for 10 out of 11 enzymes involved in the production of the lignin monomers sinapyl, p-coumaryl and coniferyl alcohols were significantly induced (Table 3, Supplementary Tables S5 and S7). The automatic annotation by KEGG pathway map viewer can be seen at Supplementary Figure S3. Among them, genes for enzymes that produces non-conventional lignin monomers such as guaiacyl, syringyl, 5-OH—guaiacyl and p-hydroxyphenyl units were also induced. This suggests that lignin synthesis may be generally elevated during treatment with external JA.
2.5. JA May Induce the Biosynthesis of Saponins
Saponins are synthesized from oleanolic acid which is the product of B-amyrin monooxygenases (CqbAMO1 and 2) and B-amyrin synthases (CqbAS1 and 2). We found two B-amyrin synthases differentially induced, one of them was the gene CqbAS1 (AUR62025693) that was previously reported to be induced by JA treatment in quinoa plants [14] and here we also report the DE of its ortholog (CqbAS2, AUR62001311), which has a 89.3% identity at genomic level and 96.6% at protein level. Our DGE analysis also showed that that B-amyrin monooxygenases CqbAMO1 (AUR62025699) and CqbAMO2 (AUR62001317), previously described as P450 enzymes (CqCYP716A78 and CqCYP716A79), were also differentially induced indicating that saponins might be synthesized upon JA treatment.
2.6. Other Pathways Differentially Expressed by JA Treatment in Quinoa
JA induced the expression of several additional gene groups. Related to redox metabolism and oxidative stress, 9 genes of glutathione-S transferase GST (K00799) were DE, where two genes were repressed and seven were induced. We also observed significant induction of seven ascorbate peroxidases (K00434). While analyzing chalcone synthases (K00660) we observed that two were induced and one was repressed. The analysis of chitinases (K01183) showed two repressed and one induced. Finally, we observed 7 acetyl methyl transferases (K22588) that were all induced (Supplementary Table S7).
2.7. Quinoa Differential Gene Expression in Response to SA Treatment
Treatment of quinoa plants with SA lead to 590 genes differentially expressed. Among them, we observed four genes significantly induced which are annotated in the monoterpenoid biosynthesis pathway by KEGG. Quinoa gene AUR62004316 was annotated as neomenthol dehydrogenase (K15095) and three genes (AUR62003693, AUR62024168 and AUR62003695) were annotated for 8-hydroxygeraniol dehydrogenase (K23232). In addition, other genes were annotated in the metabolism of terpenoids, specifically carotenoids, where we observed one gene induced (AUR62019188; K02291) and another repressed (AUR62031420; K15746), suggesting that carotenoids are synthesized during SA treatment.
Among defense response genes that were DE by SA we observed seven peroxidases significantly induced (K00430), thirteen glutathione S-transferases DE (K00799) where twelve were induced and one was repressed, and five DE chitinases (K01183) with four being induced and one repressed. Regarding metabolic pathways related to defense response we observed four DE lipoxygenases (K00454), two induced and two repressed. Interestingly, we observed that all five DE chalcone synthases (K00660) were repressed, contrarily to what we observed with JA where two were induced and one repressed (Supplementary Tables S7 and S8). We could observe the significant induction of two putative salicylic acid 5-hydroxylases (AtSA5H) genes: AUR62028083 (CqSA5HA) and AUR62005987 (CqSA5HB) (Supplementary Tables S3 and S8).
Finally, in order to analyze the correlation of genes expressed by hormone (JA and SA) treatment and the biocontrol agent Trichoderma spp., we compared the DGE list of quinoa plants treated with JA and SA to the treatment of the same quinoa cultivar (cv. Kurmi) with two Trichoderma species: Trichoderma harzianum BOL-12 (T.BOL12) and Trichoderma afroharzianum T22 (T22) [15]. The response of quinoa to JA shared a statistically significant association with the expression of 28 DE genes with T.BOL12 and 234 DE genes with T22 (Figure 4). The response of quinoa to SA shared a statistically significant association only with Trichoderma strain BOL12 (13 DE genes). Nevertheless, the response of quinoa to SA shared the expression of 83 DE genes with T22 (Figure 4 and Supplementary Table S9). Overall, data thus indicate a clear association between the quinoa response to JA and the response to Trichoderma spp.
3. Discussion
Transcriptomic analyses of quinoa seedlings collected 4 h after JA treatment resulted in the identification of 1246 DE genes and after SA treatment we identified 590 DE genes. However, we have to consider that these results involve whole RNA, where there might be a bias towards noncoding RNA. The majority of reads during counting with HTseq were defined as “no feature” (48,5%), therefore we suggest “no feature” reads belong to noncoding RNA because we constructed the sequencing library with a Truseq stranded total RNA kit and we used a CDS reference file (GTF file) for mapping and counting. We also identified that a proportion of reads (34%) were tagged as non-unique due to the inability of the software to identify properly the right gene for the counting. This could be attributed to the nature of the quinoa genome, which is tetraploid a many genes are duplicated or have a similar pseudogene, which makes the read assignation to a single gene difficult [16]. Despite the above, we had enough reads (average = 565.577 reads) to show whole metabolic pathways DE (Table 1).
Among the 1246 DE genes we identified the upregulation of several quinoa gene orthologs of genes known to be responsive to JA (Supplementary Table S2). These include two quinoa orthologs (AUR62018713 and AUR62007294) of the Arabidopsis thaliana AtMYC2 gene, a well know JA-responsive transcription factor in Arabidopsis [17], which can confirm that response of quinoa to JA is somewhat similar to what is reported in A. thaliana [17]( Supplementary Figure S3) and tomato [18]. The response of our quinoa plants to JA also includes several genes previously reported to be upregulated by JA in quinoa [14]. For example, we observed upregulation of B-amyrin synthase (CqbAS; AUR62025693) and two cytochrome P450 monooxygenases (CYP450; AUR62025699 and AUR62001317) that were previously shown DE by drenching mature quinoa leaf tissue in JA [14].
During JA treatment of quinoa plants, we identified several DE genes related to jasmonate biosynthesis (Figure 2). This is consistent with previous observations in A. thaliana, where JA creates a positive feedback regulation of JA biosynthesis and it is described as a primary response of JA signaling [19,20]. The generally accepted view is that a positive feedback keeps JA levels high enough to keep the plant’s response activated against long-term stress [19,21].
One of the main defense responses in plants is lignification [22]. However, how the lignin biosynthesis pathway is activated is not completely clear. We observed that many genes in the lignin biosynthesis pathway have been differentially expressed by JA treatment in our analysis, which might indicate its activation. Induction of lignification by methyl jasmonate has been reported in Arabidopsis cell cultures [23], conifers [24], A. thaliana and poplar plants by mutant analysis and gene expression [25].
The quinoa lignin biosynthesis seems to share the core molecular components for biosynthesis of conventional lignin monomers [26,27]. Given that 15 peroxidases (K00430) that synthesize lignin alcohol monomers such as guaiacyl, syringyl and p-hydroxyphenyl were expressed (Figure 3), we could assume that these set of enzymes catalyse oxidation of the basic lignin alcohol monomers to produce the lignin subunits which ultimately form the lignin polymer.
JA may induce the synthesis of saponins in quinoa plants because the spray treatment of quinoa with JA induced several genes present in the biosynthetic pathway of triterpene saponins from 2,3-oxidosqualene as previously reported [14]. Among them we can observe B-amyrin monooxygenases (CqbAMO1 and 2, Table S2) which convert B-amyrin into oleanolic acid that will ultimately be converted to triterpene saponins. Besides the aforementioned enzymes, other putative B-amyrin monooxygenases (AUR62023556 and its ortholog AUR62004592) were also DE and these enzymes might be involved in the conversion of B-amyrin into oleanolic acid.
Finally, JA upregulated the expression of quinoa genes involved in the antioxidant response such as L-ascorbate peroxidase, annexins and catalase. Annexins have been described to be involved to the abiotic and biotic stress response in plants [28]. Annexins can reduce the oxidative damage in the plant and allow tissue recovery [29].
Quinoa differential gene expression to SA treatment showed that genes known to be responsive to SA treatment in other species, such as the WRKY70 transcription factor family [30,31] were DE in quinoa (Supplementary Table S3). However, known SA-induced genes such as the Pathogenesis-related protein (AtPR1; AT2G14610) and Non-expressor of Pathogen Resistance gene (AtNPR1; AT1G64280) were not only not expressed but clear orthologs could not be identified in quinoa.
SA is known to stimulate plant defenses through biosynthesis of chemical compounds such as monoterpenoids, both by internal biosynthesis [32] and through exogenous application [33,34]. Therefore, the expression of genes annotated for biosynthesis of monoterpenoids in quinoa upon SA treatment was expected (Figure 1E). The gene set enrichment analysis showed that SA application caused the upregulation of the glucosinolate biosynthesis pathway (Figure 1E). Although only 2 quinoa genes encoding for UDP glycosyltransferases (AUR62039410 and AUR62026575) were annotated for glucosinolate biosynthesis, it is expected that the whole pathway be upregulated upon exogenous SA application as described by Halkier and Du [35]. This indicates that application of exogenous SA might contribute to improve quinoa defenses through enhanced expression of monoterpenoid and glucosinolate biosynthesis.
The upregulation of two genes AUR62028083 (CqS5HA) and AUR62005987 (CqS5HB) that putative encode salicylic acid 5-hydroxylases (AtS5H) suggests that salicylic acid is actively degraded in quinoa upon exogenous application. AtS5H is an enzyme that degrades SA into 2,5-dihydroxybenzoic acid (2,5-DHBA or gentisic acid) [36]. This enzyme fine-tunes SA homeostasis and the downregulation by knockdown or knockout of these gene could enhance the defense response of quinoa as reported previously with Arabidopsis [36]. SA levels can fluctuate very much between plants and even between cultivars, as described in rice [37]. Overexpression of SA-degrading enzymes such as the salicylic acid 5-hydroxylases increases the susceptibility of rice plants to pathogens [38]. Therefore, we suggest that the high overexpression of CqSA5HA-B of quinoa could reduce the effect of exogenous SA. Further, an over overexpression of CqSA5HA-B of quinoa might explain the lack of hypersensitive response in this cultivar and its susceptibility to downy mildew disease [39].
The response of quinoa to JA overlaps statistically significant with the response to Trichoderma spp. (Figure 4), indicating that Trichoderma spp. induces a JA response in quinoa. Previous transcriptomic studies on the response of quinoa to Trichoderma spp. were not able to associate the response to JA with Gene Ontology analysis [15]. This might have been because not enough genes were automatically annotated as responsive to JA in non-model species such as quinoa. The association of plant responses to Trichoderma to JA was first proposed during experiments with cucumber (Cucumis sativus) and JA biosynthesis inhibitors [40]. There, it was also shown that some genes in the JA pathway such as CsLOX1 and CsPAL1 were induced by Trichoderma. Later, the induction of some JA-related genes by Trichoderma was demonstrated in A. thaliana [41] and was finally confirmed with transcriptomic studies [42].
The response of quinoa to SA was associated with one Trichoderma species but not with the other (Figure 4). The response of plants to Trichoderma strains might or might not be associated with SA as it has been reported before, showing the response of Trichoderma atroviride associated with both hormone pathways, JA and SA in Arabidopsis [41].
In conclusion, the research presented here has identified whole pathways DE in quinoa by JA treatment which opens a new way to identify biological significance out of transcriptomic data. In addition, we can observe that the quinoa transcriptomic data generated in this study, can contribute to the association of quinoa defense responses to SA and JA hormone mediated pathways.
4. Materials and Methods
4.1. Biological Materials
Seeds of quinoa (Chenopodium quinoa Willd.) cultivar Kurmi were kindly supplied by PROINPA (Quipaquipani, Bolivia). The study was performed under pertinent institutional, national and international guidelines and legislation.
4.2. Hormone Treatments
Disinfection, germination and in vitro cultivation of C. quinoa seeds were performed as previously described [43]. Five days-old quinoa seedlings (shoot and root) were sprayed to dripping point with a water solution. We applied 100 µM methyl-jasmonate (Here on termed JA) (Sigma-Aldrich, USA) (stock solution dissolved in absolute ethanol) and 1 mM of SA (Sigma-Aldrich, USA) (pH = 7.0) dissolved in sterile MiliQ water. Mock treatments used absolute ethanol for JA treatment and MiliQ water for SA.
4.3. Sample Collection and RNA Extraction
For RNA extraction, quinoa seedlings were sampled 4 h after hormone treatment. Each treatment enclosed four plate replicates containing five seedlings. To reduce inter-plate variability, five seedlings were pooled from each of the four plates into pre-weighed aluminum foil envelopes. Aluminum envelopes were weighed and immediately shock-frozen in liquid nitrogen. Frozen samples were either processed immediately or stored at -80°C until RNA extraction. Total RNA was extracted using the RNeasy plant mini kit (Qiagen, Valencia, CA, USA), with the following modification: Frozen tissue samples were thoroughly ground in a precooled mortar with liquid nitrogen. Then, 450 µL of buffer RLT (Qiagen, Valencia, CA, USA) supplemented with B-mercaptoethanol (1%) was added. Grinding continued until samples thawed and were transferred to a 1.5 ml microcentrifuge tube. The rest of the procedure was followed according to Qiagen instructions. Total RNA quantity was determined with a NanoDrop spectrophotometer. DNase treatment was performed with the DNA-free kit (Ambion, Carlsbad, CA, USA), following the instructions of the manufacturer. The integrity and quality of the RNA was determined by agarose gel as previously described [44].
4.4. RNA-seq Library Construction and Sequencing
Total RNA treated with DNase was sent to the LU DNA sequencing facility (Biology Department, Lund University, Sweden) for RNA quality verification, strand-specific cDNA synthesis, library construction (Truseq Stranded Total RNA) and sequencing using a MiSeq sequencer (Illumina Inc., San Diego, CA, USA) in paired-end mode with a read length of 300 bp. Raw sequences have been deposited at the National Center of Biotechnology Information (NCBI) under project accession number: PRJNA SUB11194058.
4.5. Transcriptomic Analysis
RNA-seq reads were checked for quality by FastQC (v.0.9.0) and mapped on the quinoa genome “QQ74” [2] by Tophat2 (v.2.2.9). Transcript abundances were assessed with HTSeq (v.0.9.1) with “intersection-nonempty” mode. Gene expression levels were measured as counts per million (CPM) [45]. Library size normalization was performed using the trimmed mean of M-values (TMM) within the R package edgeR (v.3.14.0) [46,47]. CPM were TMM-normalized in order to compensate for library size differences. Differential gene expression analysis comparing mock-treated samples with samples treated with JA or SA was performed using edgeR with TMM normalized libraries [45] with a false discovery rate (FDR) of 5% (q < 0.05) [48].
4.6. Functional Annotation of Differentially Expressed Genes
Gene set enrichment for differentially expressed genes was performed with KEGG Orthology Based Annotation System (KOBAS-i) [49]. KOBAS-I presents two types of results visualization: Bubble plots and bar plots. Bubble plots show the p-value of enriched pathways compared to pathways in a genome as a background. Each node size corresponds to six levels of enriched p-values from small to large: 0.05, 0.01, 0.001, 0.0001, 1e-10 and 0,1e-10. Bar plots show enriched pathways in each row, and the length of the bar represents the enrich ratio, which is given by the ratio of the number of input genes to the background gene number. Here, the genes present in the whole quinoa genome are considered the background genes. Later, the whole set of DE aminoacid fasta sequences was annotated with BlastKOALA (KEGG Orthology and Links Annotation) against the KEGG (Kyoto Encyclopedia of Genes and Genomes) database to assign KO (K number) and identify pathways and modules differentially expressed [50]. Pathway visualization was constructed with MIRO web app. Venn diagrams were constructed with Venny [51]. Quinoa DGE correlation of hormone treatment and Trichoderma treatment was done from data previously published [15].
5. Conclusions
Quinoa cv. Kurmi overall transcriptomic response to JA and SA share some response genes to model plants such as Arabidopsis, yet this investigation identifies the particular homologues in C. quinoa that functionally correspond to the previously described Arabidopsis ditto. Quinoa response to JA suggests that lignin is biosynthesized perhaps as a defense response. JA seems to be also biosynthesized in response to exogenous JA application in a feedback loop to keep defenses active. The exogenous application of SA in quinoa plants suggests that glucosinolate and monoterpenoid compounds are being synthesized. The transcriptomic analysis also suggest that SA might be degraded by SA 5-hydroxylases to regulate SA homeostasis because these enzymes have the highest gene expression induction.
Supplementary Materials
The following supporting information can be downloaded at: Preprints.org, Figure S1. Quinoa jasmonic acid biosynthesis genes activated by JA; Figure S2. Quinoa lignin biosynthesis genes activated by JA; Table S1: Quinoa transcriptomic gene expression during treatment with SA and JA. Table S2: Quinoa genes (1246) significantly up- and downregulated during treatment with JA. Table S3: Quinoa genes (590) significantly up- and downregulated during treatment with SA. Table S4: Quinoa genes (119) upregulated during treatment with both, SA and JA. Table S5. Fold change of quinoa gene expression upon treatment with JA and statistical data. Table S6. Fold change of quinoa gene expression upon treatment with SA and statistical data. Table S7. Induction or repression of quinoa genes upon JA treatment. Table S8. Induction or repression of quinoa genes upon SA treatment. Only selected pathways are shown. Table S9, List of quinoa DE genes by JA and SA treatment and Trichoderma spp. treatment.
Author Contributions
Conceptualization, A.R. and O.R.; methodology, O.R.; validation, O.R. and S.N.; investigation, O.R. and S.N.; writing—original draft preparation, O.R.; writing—review and editing, A.R. and O.R.; supervision, A.R., J.A.B., S.W. and P.M; project administration, A.R. and P.M.; funding acquisition, A.R., O.R., S.W. and P.M. All authors have read and agreed to the published version of the manuscript.
Funding
This research was funded by the Swedish International Development Agency (SIDA) in a strategic collaboration between Universidad Mayor de San Andrés (UMSA, Bolivia) and Lund University (LU, Sweden) and by the Royal Physiographic Society in Lund (www. fysiografen.se).
Data Availability Statement
Data are contained within the article.
Acknowledgments
The authors would like to thank Valeria Palma-Encinas for their initial help with QC analysis and Samantha Siles-Krsul for helps in creation of pathway figures. The authors have reviewed and edited the output and take full responsibility for the content of this publication.
Conflicts of Interest
The authors declare no conflicts of interest. The funders had no role in the design of the study; in the collection, analyses, or interpretation of data; in the writing of the manuscript; or in the decision to publish the results.
Abbreviations
The following abbreviations are used in this manuscript:
| JA | Jasmonic acid |
| SA | Salicylic acid |
| DE | Differentially expressed |
| DGE | Differential gene expression |
References
- Bazile, D.; Jacobsen, S.E.; Verniau, A. The Global Expansion of Quinoa: Trends and Limits. Front Plant Sci 2016, 7, 622. [Google Scholar] [CrossRef] [PubMed]
- Jarvis, D.E.; Ho, Y.S.; Lightfoot, D.J.; Schmöckel, S.M.; Li, B.; Borm, T.J.A.; Ohyanagi, H.; Mineta, K.; Michell, C.T.; Saber, N.; et al. The genome of Chenopodium quinoa. Nature 2017, 542, 307–312. [Google Scholar] [CrossRef] [PubMed]
- Alandia, G.; Rodriguez, J.P.; Jacobsen, S.E.; Bazile, D.; Condori, B. Global expansion of quinoa and challenges for the Andean region. Global Food Security 2020, 26, 100429. [Google Scholar] [CrossRef]
- Ruiz, K.B.; Biondi, S.; Oses, R.; Acuña-Rodríguez, I.S.; Antognoni, F.; Martinez-Mosqueira, E.A.; Coulibaly, A.; Canahua-Murillo, A.; Pinto, M.; Zurita-Silva, A.; et al. Quinoa biodiversity and sustainability for food security under climate change. A review. Agronomy for Sustainable Development 2014, 34, 349–359. [Google Scholar] [CrossRef]
- Testen, A.L. Diseases of Quinoa. In Handbook of Vegetable and Herb Diseases, Springer: 2025; pp. 1–27.
- Gandarillas, A.; Saravia, R.; Plata, G.; Quispe, R.; Ortiz-Romero, R.; Bazile, D.; Bertero, H.; Nieto, C. Principle quinoa pests and diseases. In State of the art report on quinoa, 2015; p. 192.
- Danielsen, S.; Jacobsen, S.E.; Echegaray, J.; Ames, T. Impact of downy mildew on the yield of quinoa. CIP program report 2000, 2000, 397–401. [Google Scholar]
- Pieterse, C.M.J.; Leon-Reyes, A.; Van der Ent, S.; Van Wees, S.C.M. Networking by small-molecule hormones in plant immunity. Nature Chemical Biology 2009, 5, 308–316. [Google Scholar] [CrossRef]
- Caarls, L.; Pieterse, C.M.; Van Wees, S.C. How salicylic acid takes transcriptional control over jasmonic acid signaling. Frontiers in Plant Science 2015, 6, 170. [Google Scholar] [CrossRef]
- Bari, R.; Jones, J.D.G. Role of plant hormones in plant defence responses. Plant Molecular Biology 2009, 69, 473–488. [Google Scholar] [CrossRef]
- Guerreiro, A.; Figueiredo, J.; Sousa Silva, M.; Figueiredo, A. Linking jasmonic acid to grapevine resistance against the biotrophic oomycete Plasmopara viticola. Frontiers in plant science 2016, 7, 565. [Google Scholar] [CrossRef]
- Fugate, K.K.; Ferrareze, J.P.; Bolton, M.D.; Deckard, E.L.; Campbell, L.G. Postharvest jasmonic acid treatment of sugarbeet roots reduces rot due to Botrytis cinerea, Penicillium claviforme, and Phoma betae. Postharvest Biology and Technology 2012, 65, 1–4. [Google Scholar] [CrossRef]
- Forouzandeh, M.; Parsa, S.; Mahmoodi, S.; Izanloo, A. Physiological, Biochemical, and Molecular Responses of Quinoa (Chenopodium quinoa Willd.) to Elicitors Under Drought Stress. Plant Molecular Biology Reporter 2024, 42, 515–531. [Google Scholar] [CrossRef]
- Fiallos-Jurado, J.; Pollier, J.; Moses, T.; Arendt, P.; Barriga-Medina, N.; Morillo, E.; Arahana, V.; de Lourdes Torres, M.; Goossens, A.; Leon-Reyes, A. Saponin determination, expression analysis and functional characterization of saponin biosynthetic genes in Chenopodium quinoa leaves. Plant Sci 2016, 250, 188–197. [Google Scholar] [CrossRef] [PubMed]
- Rollano-Peñaloza, O.M.; Mollinedo, P.A.; Widell, S.; Rasmusson, A.G. Transcriptomic Analysis of Quinoa Reveals a Group of Germin-Like Proteins Induced by Trichoderma. Frontiers in Fungal Biology 2021, 2. [Google Scholar] [CrossRef]
- Payá-Milans, M.; Olmstead, J.W.; Nunez, G.; Rinehart, T.A.; Staton, M. Comprehensive evaluation of RNA-seq analysis pipelines in diploid and polyploid species. GigaScience 2018, 7. [Google Scholar] [CrossRef] [PubMed]
- Lorenzo, O.; Chico, J.M.; Saénchez-Serrano, J.J.; Solano, R. JASMONATE-INSENSITIVE1 encodes a MYC transcription factor essential to discriminate between different jasmonate-regulated defense responses in Arabidopsis. The Plant Cell 2004, 16, 1938–1950. [Google Scholar] [CrossRef]
- Du, M.; Zhao, J.; Tzeng, D.T.; Liu, Y.; Deng, L.; Yang, T.; Zhai, Q.; Wu, F.; Huang, Z.; Zhou, M. MYC2 orchestrates a hierarchical transcriptional cascade that regulates jasmonate-mediated plant immunity in tomato. The Plant Cell 2017, 29, 1883–1906. [Google Scholar] [CrossRef]
- Chung, H.S.; Koo, A.J.; Gao, X.; Jayanty, S.; Thines, B.; Jones, A.D.; Howe, G.A. Regulation and function of Arabidopsis JASMONATE ZIM-domain genes in response to wounding and herbivory. Plant physiology 2008, 146, 952–964. [Google Scholar] [CrossRef]
- Browse, J. Jasmonate passes muster: A receptor and targets for the defense hormone. Annual Review of Plant Biology 2009, 60, 183–205. [Google Scholar] [CrossRef]
- Wasternack, C.; Song, S. Jasmonates: Biosynthesis, metabolism, and signaling by proteins activating and repressing transcription. Journal of Experimental Botany 2017, 68, 1303–1321. [Google Scholar] [CrossRef]
- Bhuiyan, N.H.; Selvaraj, G.; Wei, Y.; King, J. Role of lignification in plant defense. Plant Signaling & Behavior 2009, 4, 158–159. [Google Scholar] [CrossRef]
- Pauwels, L.; Morreel, K.; De Witte, E.; Lammertyn, F.; Van Montagu, M.; Boerjan, W.; Inzé, D.; Goossens, A. Mapping methyl jasmonate-mediated transcriptional reprogramming of metabolism and cell cycle progression in cultured Arabidopsis cells. Proceedings of the National Academy of Sciences 2008, 105, 1380–1385. [Google Scholar] [CrossRef]
- Hudgins, J.W.; Christiansen, E.; Franceschi, V.R. Induction of anatomically based defense responses in stems of diverse conifers by methyl jasmonate: A phylogenetic perspective. Tree Physiology 2004, 24, 251–264. [Google Scholar] [CrossRef]
- Zhao, X.; Jiang, X.; Li, Z.; Song, Q.; Xu, C.; Luo, K. Jasmonic acid regulates lignin deposition in poplar through JAZ5-MYB/NAC interaction. Frontiers in Plant Science 2023, 14. [Google Scholar] [CrossRef]
- Nguyen, T.-N.; Son, S.; Jordan, M.C.; Levin, D.B.; Ayele, B.T. Lignin biosynthesis in wheat (Triticum aestivum L.): Its response to waterlogging and association with hormonal levels. BMC Plant Biology 2016, 16, 28. [Google Scholar] [CrossRef]
- Bonawitz, N.D.; Chapple, C. The genetics of lignin biosynthesis: Connecting genotype to phenotype. Annu Rev Genet 2010, 44, 337–363. [Google Scholar] [CrossRef]
- Yadav, D.; Boyidi, P.; Ahmed, I.; Kirti, P.B. Plant annexins and their involvement in stress responses. Environmental and Experimental Botany 2018, 155, 293–306. [Google Scholar] [CrossRef]
- Saad, R.B.; Ben Romdhane, W.; Ben Hsouna, A.; Mihoubi, W.; Harbaoui, M.; Brini, F. Insights into plant annexins function in abiotic and biotic stress tolerance. Plant signaling & behavior 2020, 15, 1699264. [Google Scholar]
- Li, J.; Brader, G.; Palva, E.T. The WRKY70 transcription factor: A node of convergence for jasmonate-mediated and salicylate-mediated signals in plant defense. The Plant Cell 2004, 16, 319–331. [Google Scholar] [CrossRef] [PubMed]
- Eulgem, T.; Somssich, I.E. Networks of WRKY transcription factors in defense signaling. Current opinion in plant biology 2007, 10, 366–371. [Google Scholar] [CrossRef]
- Peng, Y.; Yang, J.; Li, X.; Zhang, Y. Salicylic acid: Biosynthesis and signaling. Annual review of plant biology 2021, 72, 761–791. [Google Scholar] [CrossRef]
- Soltani, N.; Staton, M.; Gwinn, K.D. Response of bitter and sweet Chenopodium quinoa varieties to cucumber mosaic virus: Transcriptome and small RNA-Seq perspective. PLoS ONE 2021, 16, e0244364. [Google Scholar] [CrossRef] [PubMed]
- Wenig, M.; Ghirardo, A.; Sales, J.H.; Pabst, E.S.; Breitenbach, H.H.; Antritter, F.; Weber, B.; Lange, B.; Lenk, M.; Cameron, R.K. Systemic acquired resistance networks amplify airborne defense cues. Nature communications 2019, 10, 3813. [Google Scholar] [CrossRef]
- Halkier, B.A.; Du, L. The biosynthesis of glucosinolates. Trends in Plant Science 1997, 2, 425–431. [Google Scholar] [CrossRef]
- Zhang, Y.; Zhao, L.; Zhao, J.; Li, Y.; Wang, J.; Guo, R.; Gan, S.; Liu, C.-J.; Zhang, K. S5H/DMR6 Encodes a Salicylic Acid 5-Hydroxylase That Fine-Tunes Salicylic Acid Homeostasis. Plant Physiology 2017, 175, 1082–1093. [Google Scholar] [CrossRef] [PubMed]
- Silverman, P.; Seskar, M.; Kanter, D.; Schweizer, P.; Metraux, J.P.; Raskin, I. Salicylic Acid in Rice (Biosynthesis, Conjugation, and Possible Role). Plant Physiology 1995, 108, 633–639. [Google Scholar] [CrossRef]
- Zhang, Y.; Yu, Q.; Gao, S.; Yu, N.; Zhao, L.; Wang, J.; Zhao, J.; Huang, P.; Yao, L.; Wang, M.; et al. Disruption of the primary salicylic acid hydroxylases in rice enhances broad-spectrum resistance against pathogens. Plant, Cell & Environment 2022, 45, 2211–2225. [Google Scholar] [CrossRef]
- Rollano-Peñaloza, O.M.; Palma-Encinas, V.; Widell, S.; Mollinedo, P.; Rasmusson, A.G. The Disease Progression and Molecular Defense Response in Chenopodium Quinoa Infected with Peronospora Variabilis, the Causal Agent of Quinoa Downy Mildew. Plants 2022, 11, 2946. [Google Scholar] [CrossRef] [PubMed]
- Shoresh, M.; Yedidia, I.; Chet, I. Involvement of jasmonic acid/ethylene signaling pathway in the systemic resistance induced in cucumber by Trichoderma asperellum T203. Phytopathology 2005, 95, 76–84. [Google Scholar] [CrossRef]
- Salas-Marina, M.A.; Silva-Flores, M.A.; Uresti-Rivera, E.E.; Castro-Longoria, E.; Herrera-Estrella, A.; Casas-Flores, S. Colonization of Arabidopsis roots by Trichoderma atroviride promotes growth and enhances systemic disease resistance through jasmonic acid/ethylene and salicylic acid pathways. European Journal of Plant Pathology 2011, 131, 15–26. [Google Scholar] [CrossRef]
- Mathys, J.; De Cremer, K.; Timmermans, P.; Van Kerkhove, S.; Lievens, B.; Vanhaecke, M.; Cammue, B.; De Coninck, B. Genome-wide characterization of ISR induced in Arabidopsis thaliana by Trichoderma hamatum T382 against Botrytis cinerea infection. Frontiers in Plant Science 2012, 3, 108. [Google Scholar] [CrossRef]
- Rollano-Peñaloza, O.M.; Widell, S.; Mollinedo, P.; Rasmusson, A.G. Trichoderma harzianum T-22 and BOL-12QD inhibit lateral root development of Chenopodium quinoa in axenic co-culture. Cogent Biology 2018, 4, 1–12. [Google Scholar] [CrossRef]
- Rollano-Peñaloza, O.M.; Mollinedo, P.A.; Widell, S.; Rasmusson, A.G. Transcriptomic Analysis of Quinoa Reveals a Group of Germin-Like Proteins Induced by Trichoderma. Frontiers in Fungal Biology 2021, 2. [Google Scholar] [CrossRef] [PubMed]
- Anders, S.; McCarthy, D.J.; Chen, Y.; Okoniewski, M.; Smyth, G.K.; Huber, W.; Robinson, M.D. Count-based differential expression analysis of RNA sequencing data using R and Bioconductor. Nat Protoc 2013, 8, 1765–1786. [Google Scholar] [CrossRef] [PubMed]
- Robinson, M.D.; McCarthy, D.J.; Smyth, G.K. edgeR: A Bioconductor package for differential expression analysis of digital gene expression data. Bioinformatics 2010, 26, 139–140. [Google Scholar] [CrossRef] [PubMed]
- Dillies, M.A.; Rau, A.; Aubert, J.; Hennequet-Antier, C.; Jeanmougin, M.; Servant, N.; Keime, C.; Marot, G.; Castel, D.; Estelle, J.; et al. A comprehensive evaluation of normalization methods for Illumina high-throughput RNA sequencing data analysis. Brief Bioinform 2013, 14, 671–683. [Google Scholar] [CrossRef]
- Benjamini, Y.; Hochberg, Y. Controlling the False Discovery Rate: A Practical and Powerful Approach to Multiple Testing. Journal of the Royal Statistical Society. Series B (Methodological) 1995, 57, 289–300. [Google Scholar] [CrossRef]
- Bu, D.; Luo, H.; Huo, P.; Wang, Z.; Zhang, S.; He, Z.; Wu, Y.; Zhao, L.; Liu, J.; Guo, J. KOBAS-i: Intelligent prioritization and exploratory visualization of biological functions for gene enrichment analysis. Nucleic acids research 2021, 49, W317–W325. [Google Scholar] [CrossRef]
- Kanehisa, M.; Sato, Y.; Morishima, K. BlastKOALA and GhostKOALA: KEGG Tools for Functional Characterization of Genome and Metagenome Sequences. Journal of Molecular Biology 2016, 428, 726–731. [Google Scholar] [CrossRef]
- Oliveros, J. Venny. An interactive tool for comparing lists with Venn’s diagrams. 2007–2015. 2016.
Figure 1.
Transcript categories affected by JA and SA. (A) Venn diagram of quinoa genes DE in response to JA and SA. Gene set enrichment analysis bubble plot of JA (B) and SA (C) signaling. Bubble size is determined by different significance levels. Gene set enrichment analysis bar plot of JA (D) and SA (E) signaling. Colors in bubble and bar plots reflect clusters (C1-C7) of related metabolic pathways.
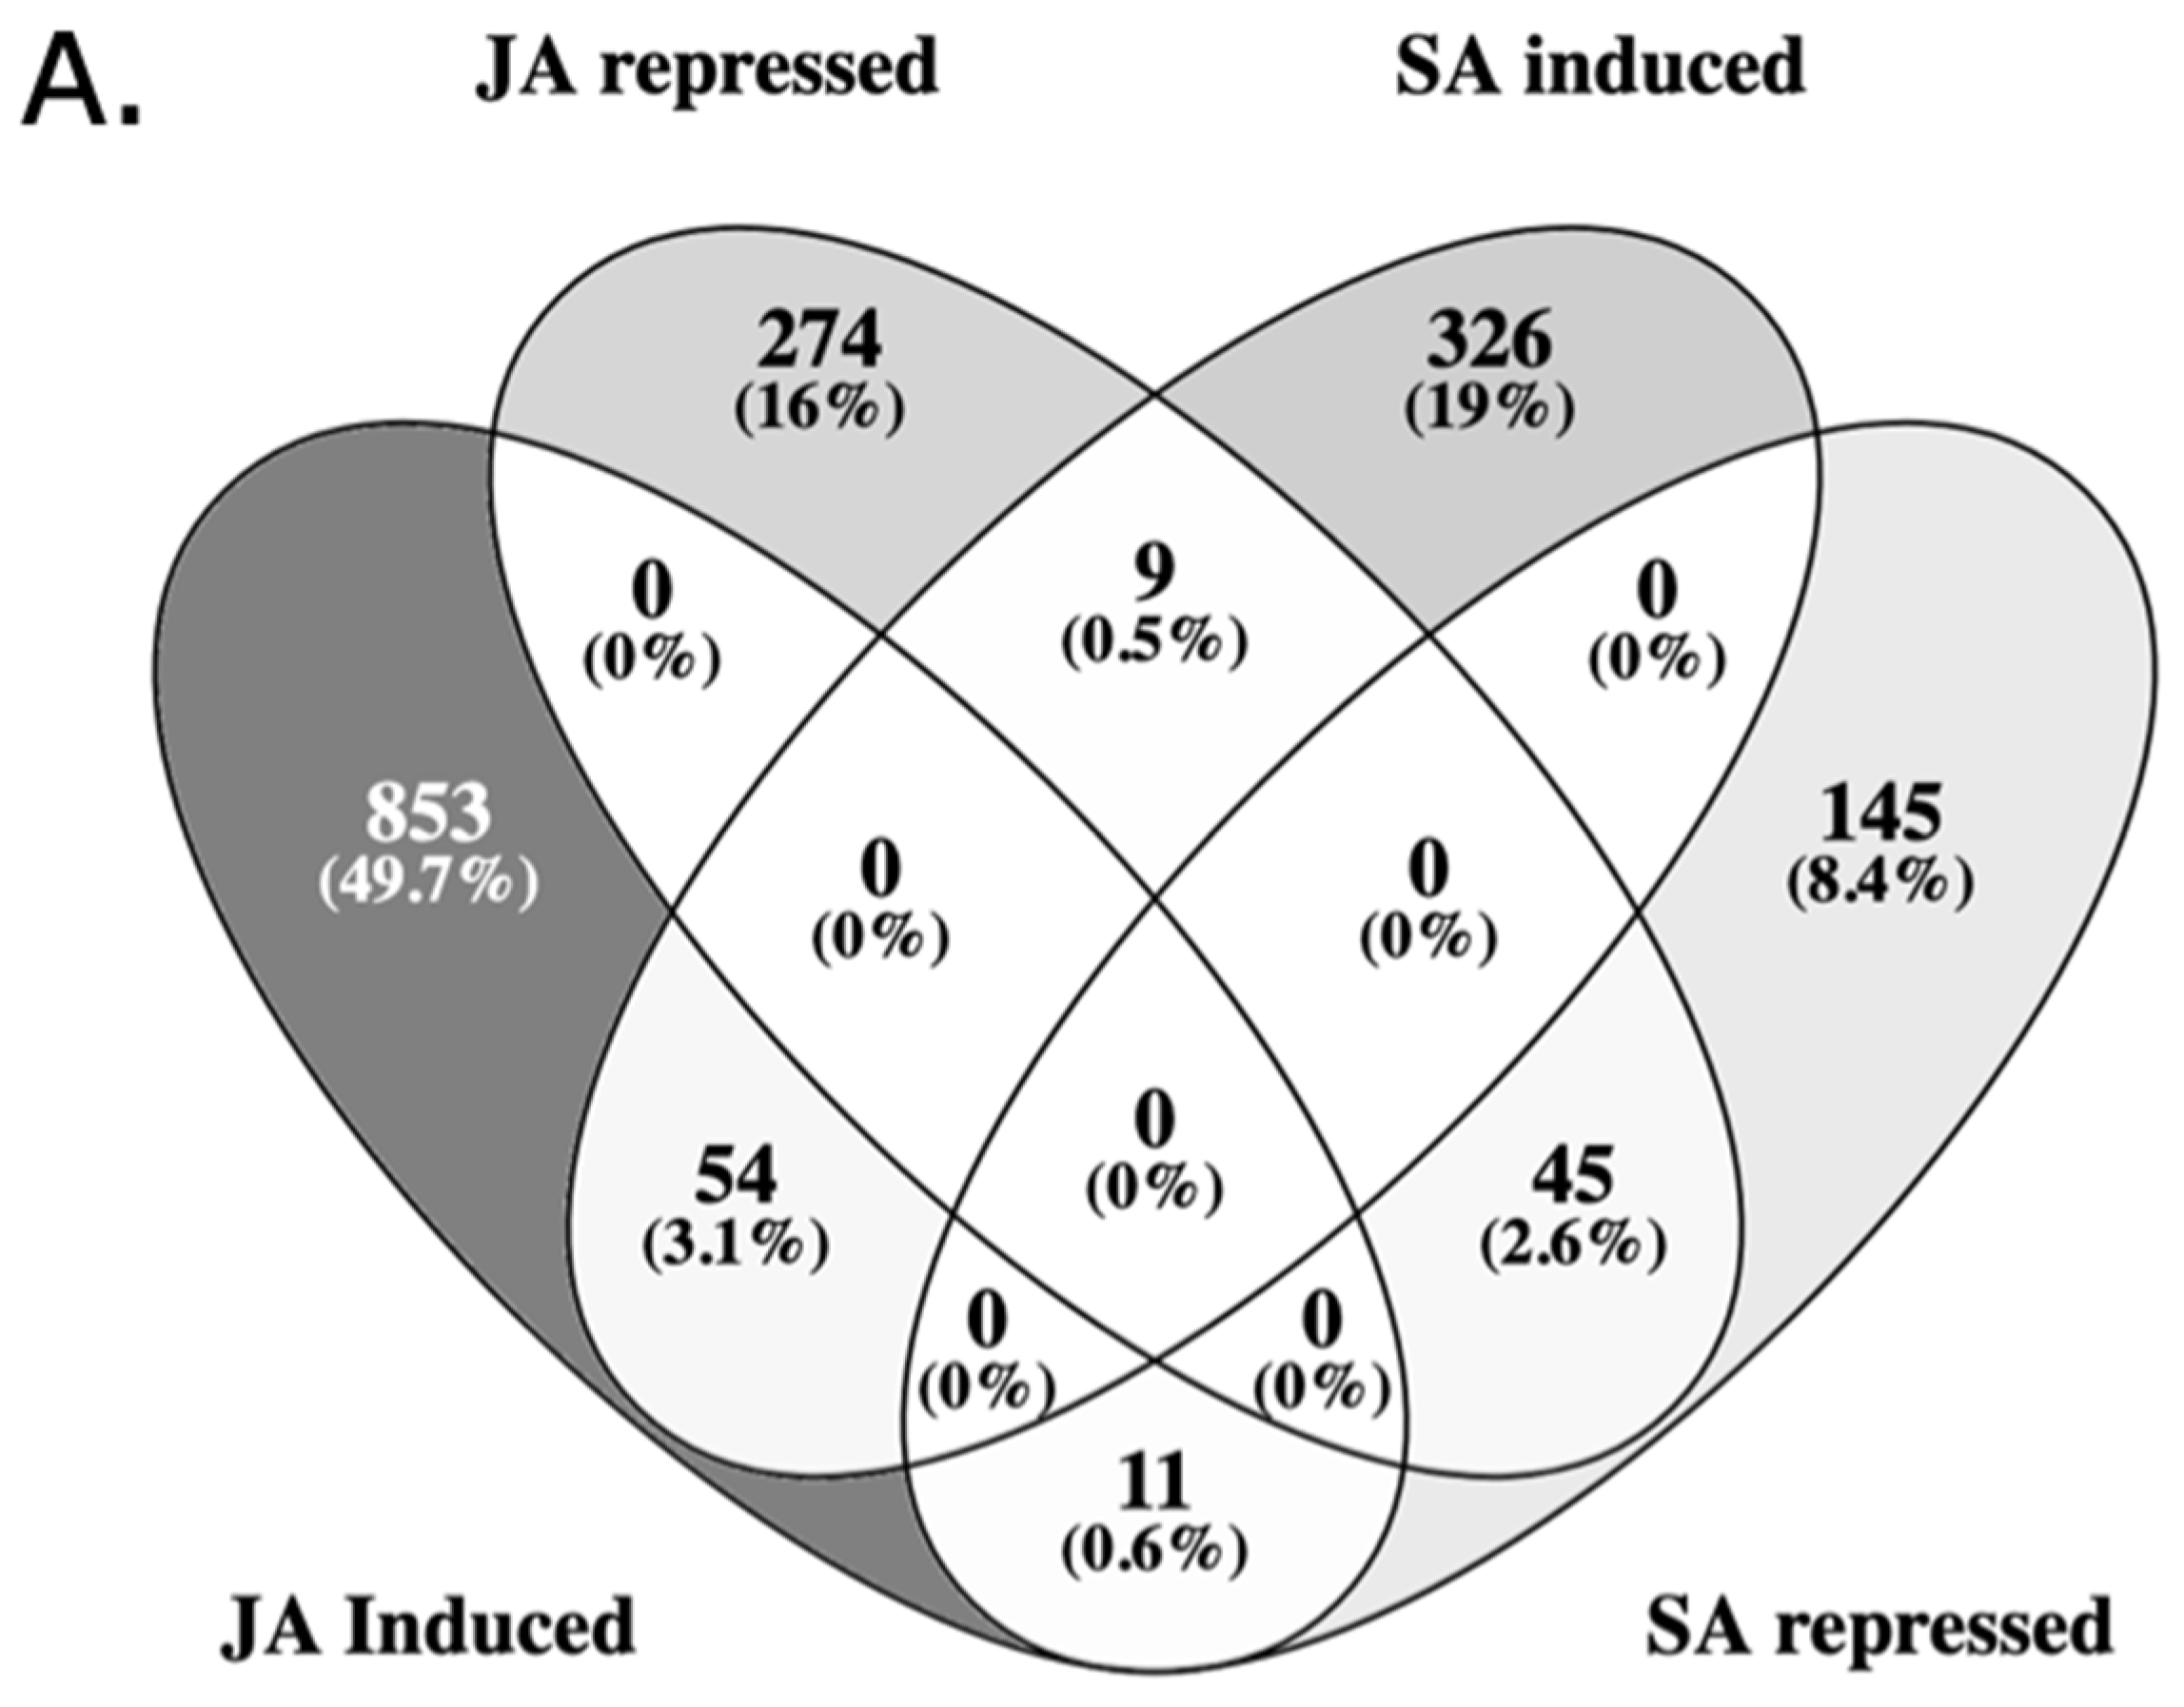
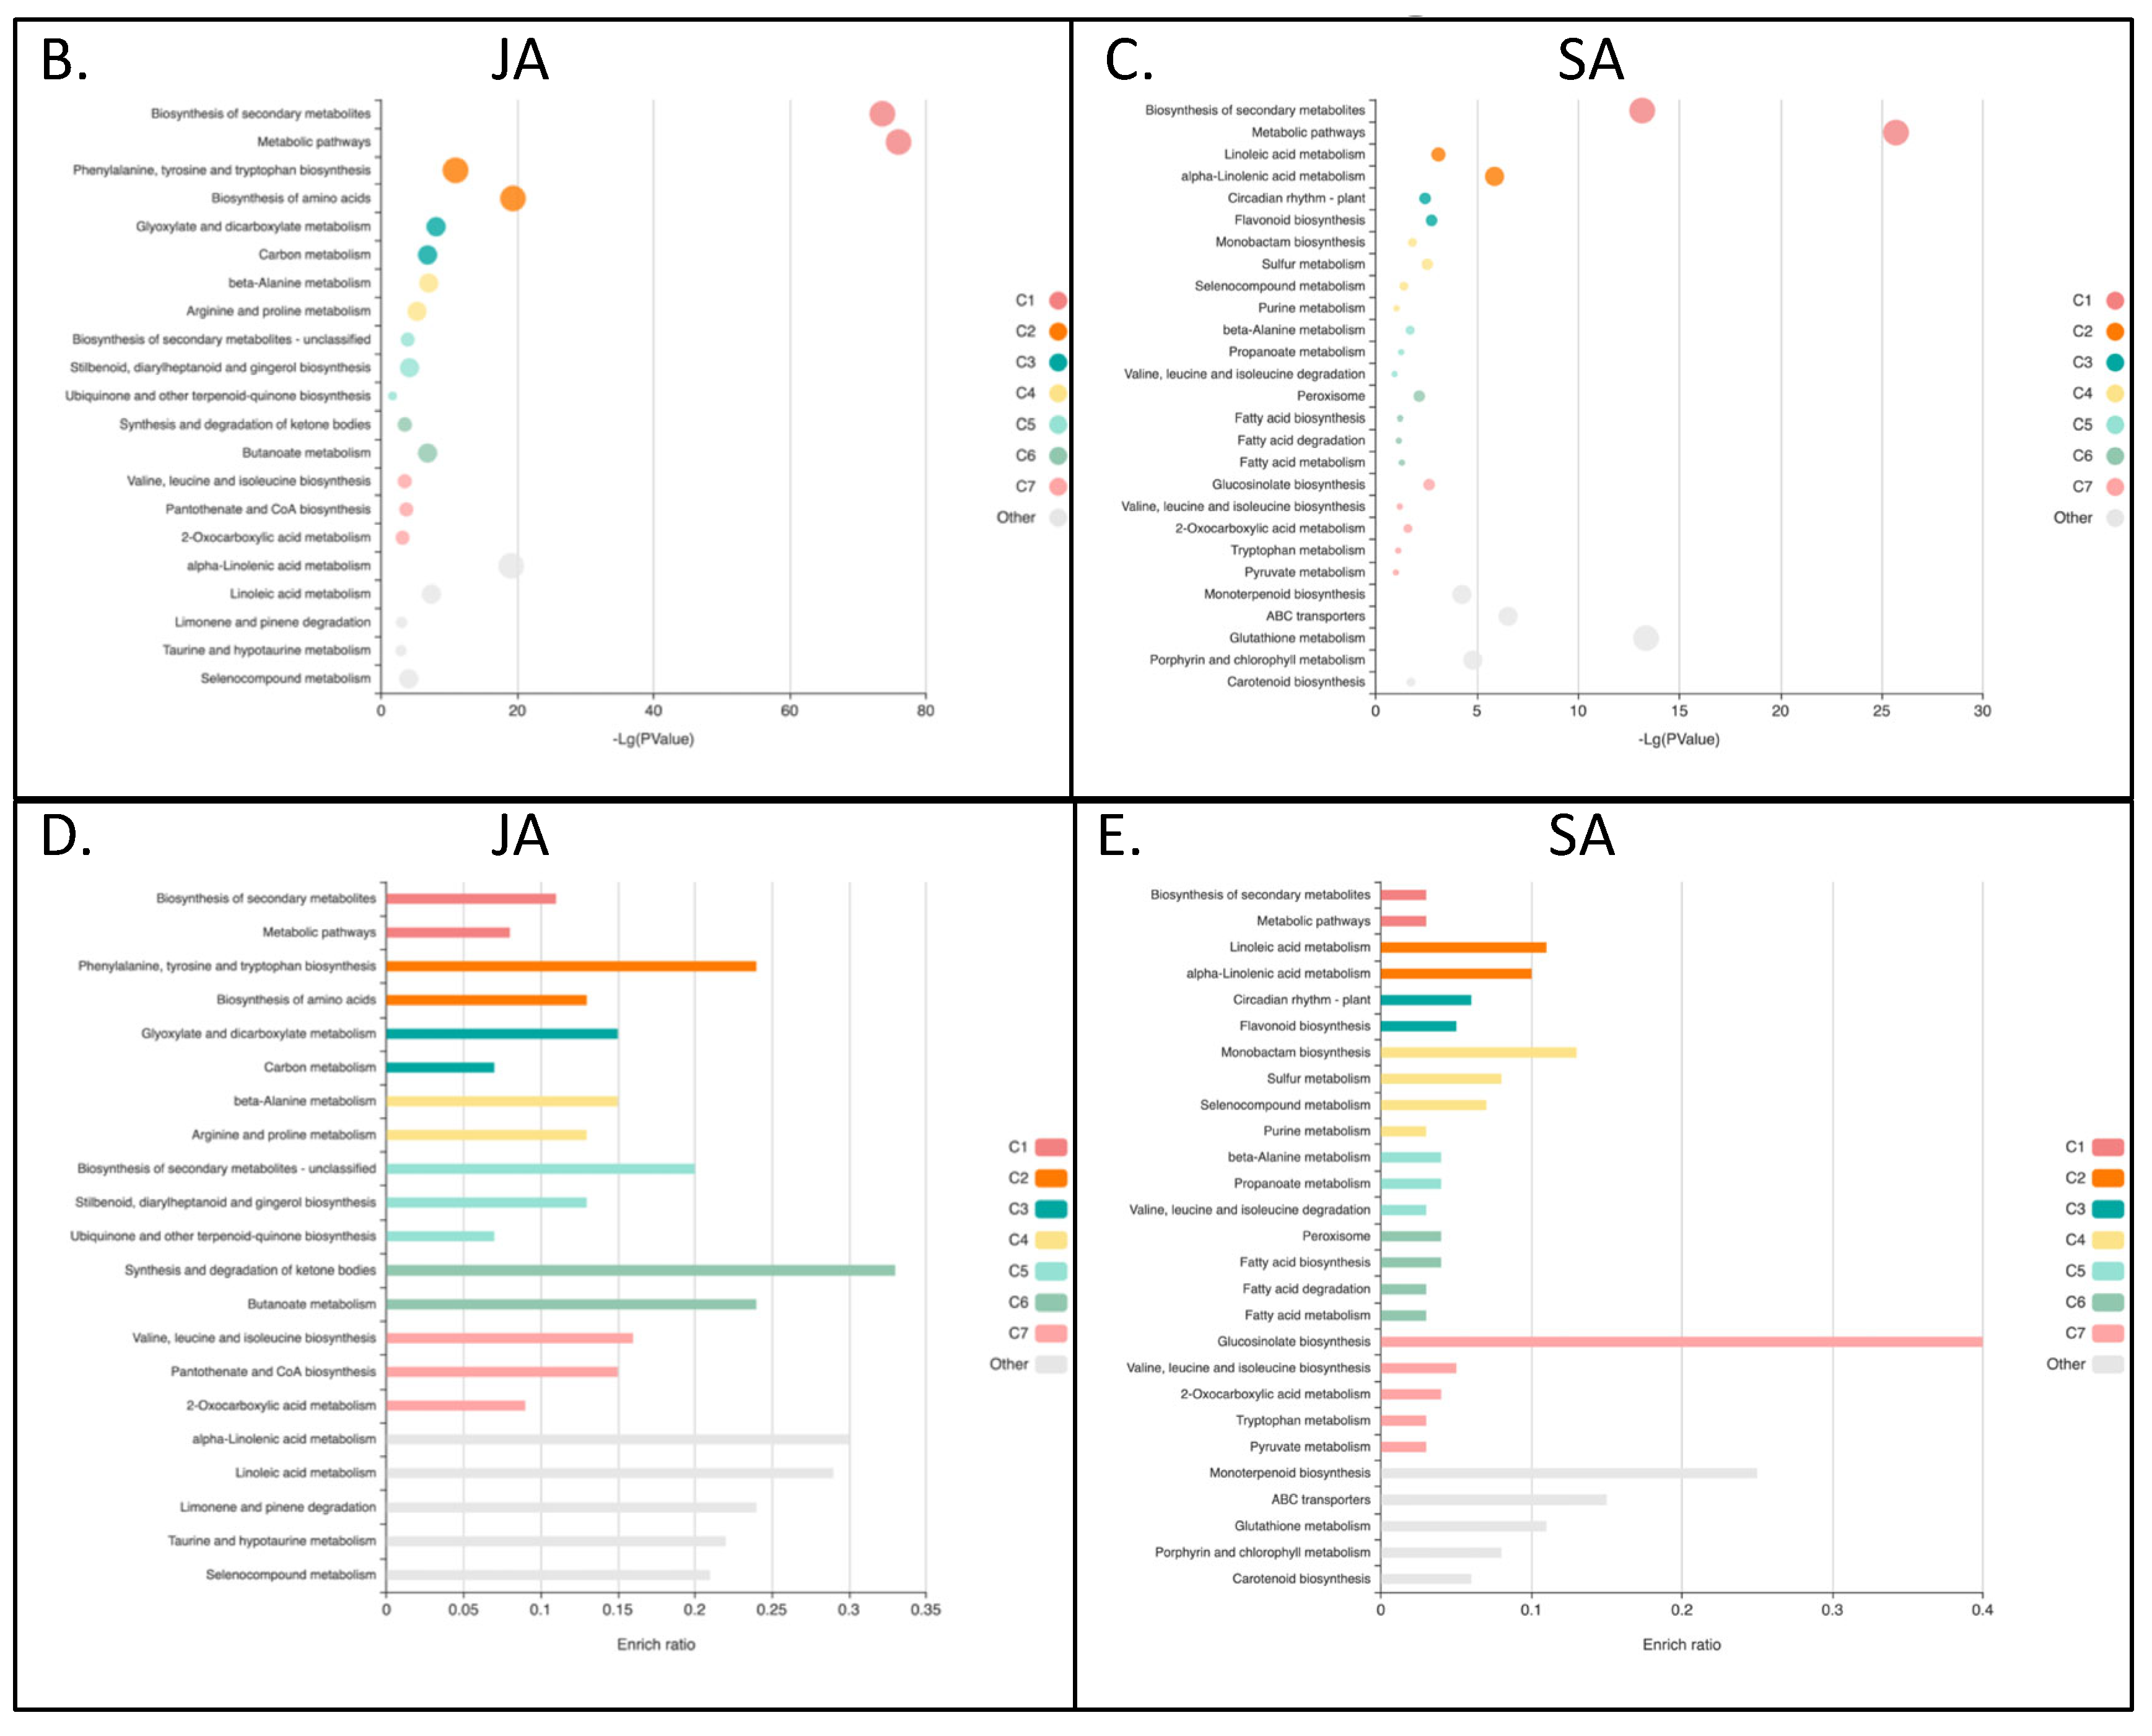
Figure 2.
Pathway of jasmonic acid biosynthesis genes activated by JA in quinoa. LOX2S: Lipoxygenase, AOS: Hydroperoxide dehydratase, AOC: Allene oxide cyclase, OPR: 12-oxophytodienoic acid reductase, OPCL1: OPC-8:0 CoA ligase 1, ACOX1: Acyl-CoA oxidase, ACX: acyl-CoA oxidase, MFP2: Enoyl-CoA hydratase/3-hydroxyacyl-CoA dehydrogenase, ACAA1: Acetyl-CoA acyltransferase 1, HpOTrE: hydroperoxyoctadeca-9,11,15-trienoic acid, EOTrE: epoxyoctadeca-9,11,15-trienoic acid, OPDA: 12-oxo-phytodienoic acid, OPC: (9S,13S,15Z)-12-Oxo-10,11-dihydrophyto-15-enoate, CoA: Co-enzyme A.
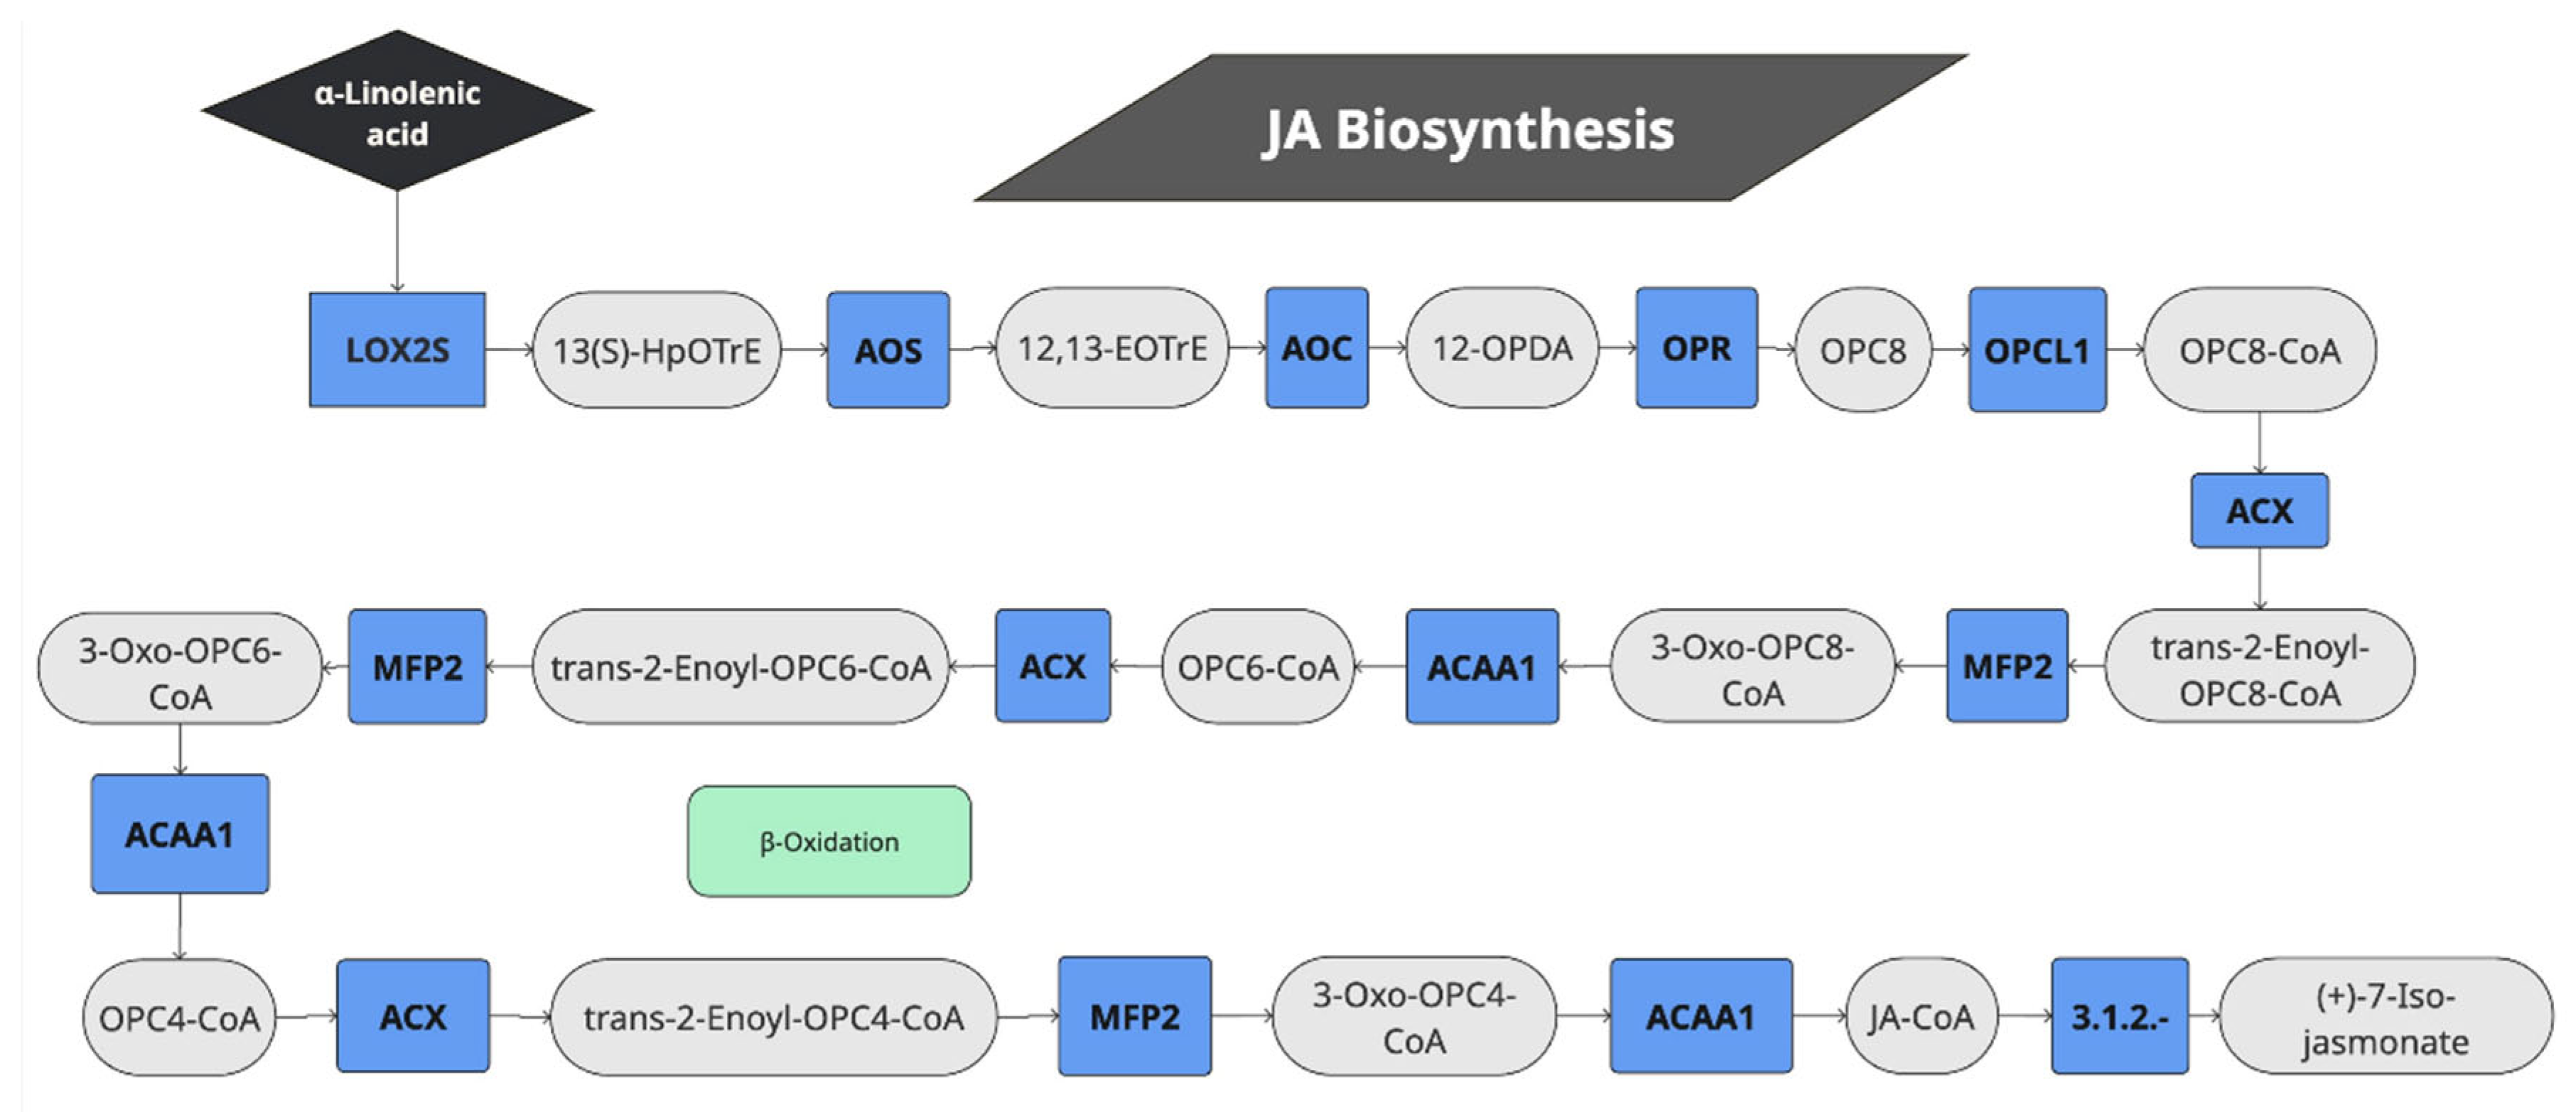
Figure 3.
Pathway of lignin biosynthesis genes activated by JA in quinoa. PAL: Phenylalanine ammonia-lyase, CYP73A: Trans-cinnamate 4-monooxygenase, 4CL: 4-coumarat-CoA ligase, CYP98A: 5-O-(4-coumaroyl)-D-quinate 3'-monooxygenase, HCT: Shikimate O-hydroxycinnamoyltransferase, CCOMT: Caffeoyl-CoA O-methyltransferase, COMT: Caffeic acid 3-O-methyltransferase, F5H: Ferulate-5-hydroxylase, CCR: Cinnamoyl-CoA reductase, CAD: Cinnamyl-alcohol dehydrogenase, Peroxidase: Peroxidases that produce 4 types of lignin subunits.
Figure 4.
Comparison of quinoa genes that were DE when treated with JA and SA and when treated with two Trichoderma species. (A) Quinoa DE genes analyzed with Venn diagrams upon JA and SA treatment compared to Trichoderma spp. treatment. (B) Number of DE genes shared between hormone (JA and SA) and Trichoderma treatment. The total number of genes in each treatment is shown in parentheses. The number of gene overlaps is shown with chi-square p-values in parentheses (when less than 0.05).
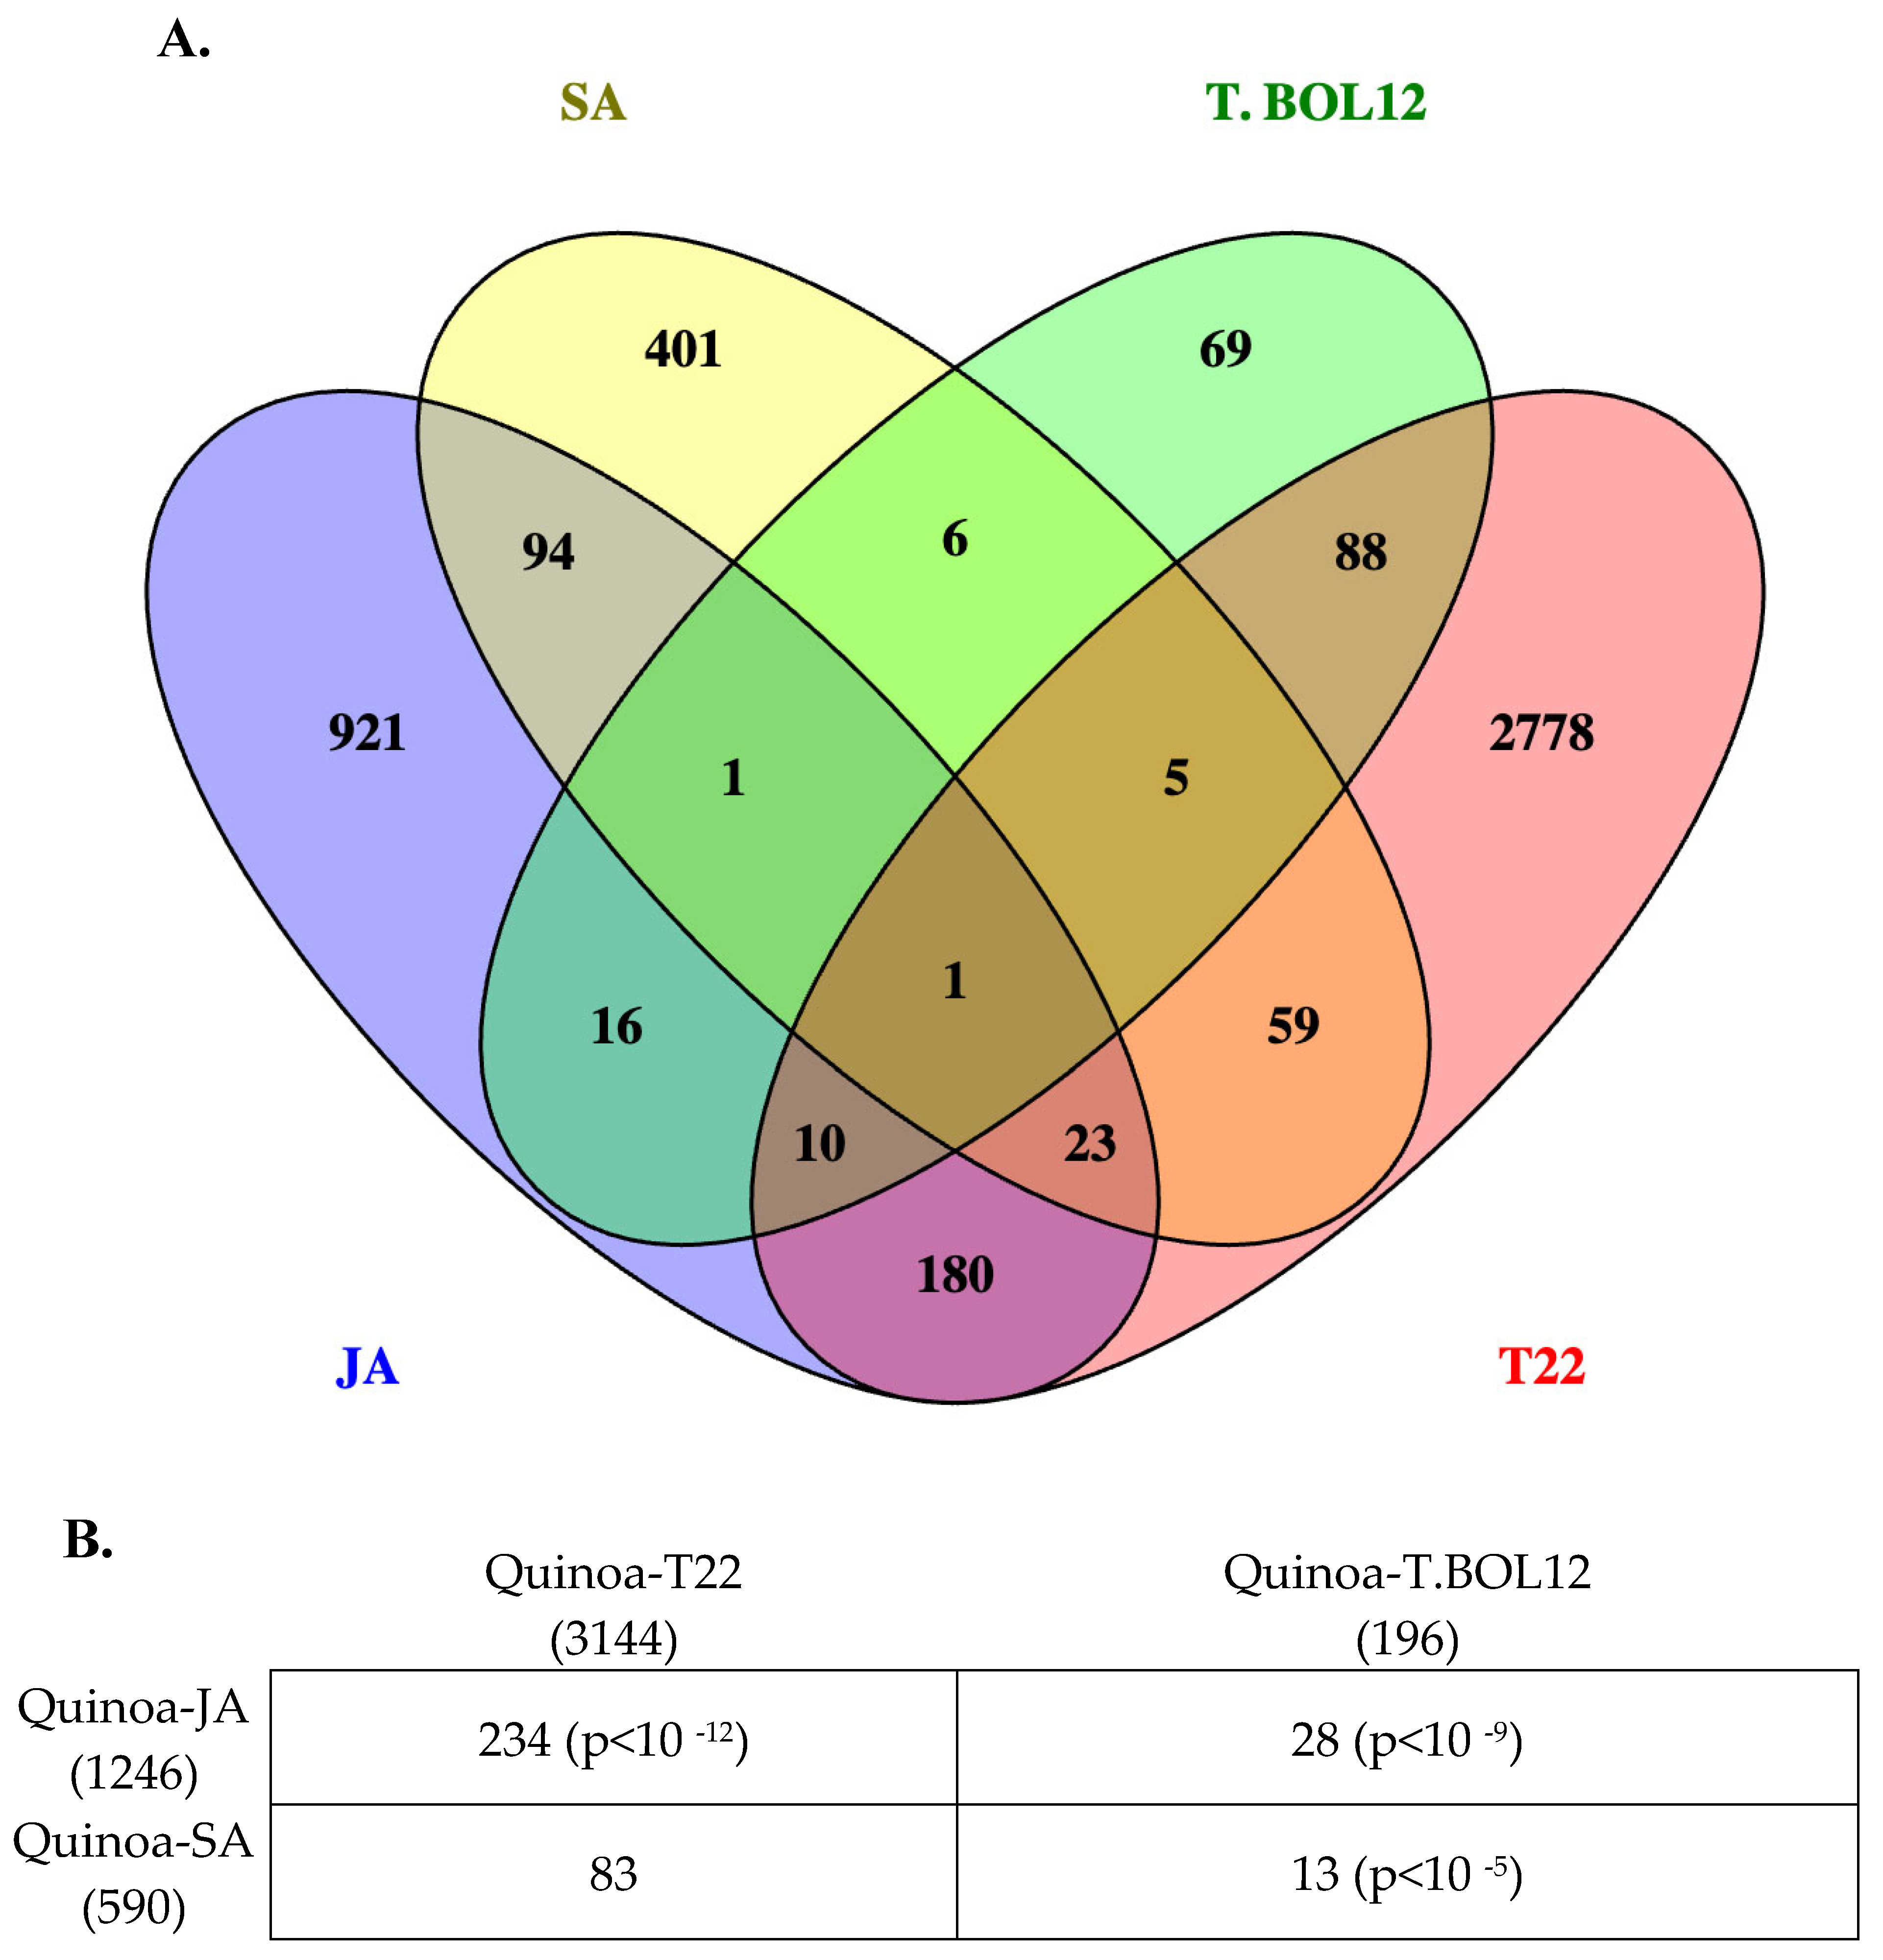

Table 1.
RNA-seq summary of quinoa sequence reads mapped during SA and JA treatment.
| Sample | Treatment | Total reads1 | Mapped reads | % | Unique reads2 | % | Non-unique reads3 | % | Non-Coding RNA reads4 | % | Ambiguous |
|---|---|---|---|---|---|---|---|---|---|---|---|
| 1 | Control 1 | 4.030.580 | 3.983.129 | 96,1 | 497.482 | 12,5 | 1.328.848 | 33,4 | 2.033.141 | 51,0 | 622 |
| 2 | Control 2 | 4.171.906 | 4.171.831 | 94,3 | 478.990 | 11,5 | 1.391.787 | 33,4 | 2.142.277 | 51,4 | 608 |
| 3 | Control 3 | 4.534.183 | 4.486.832 | 96,1 | 561.575 | 12,5 | 1.527.014 | 34,0 | 2.256.616 | 50,3 | 691 |
| 4 | Control 4 | 4.297.813 | 4.240.505 | 95,7 | 595.001 | 14,0 | 1.349.547 | 31,8 | 2.149.134 | 50,7 | 750 |
| 5 | SA 1 | 4.221.902 | 4.176.269 | 96,0 | 468.141 | 11,2 | 1.452.097 | 34,8 | 2.119.621 | 50,8 | 610 |
| 6 | SA 2 | 4.100.965 | 4.059.417 | 96,4 | 477.640 | 11,8 | 1.633.839 | 40,2 | 1.828.580 | 45,0 | 612 |
| 7 | SA 3 | 3.984.027 | 3.935.189 | 95,1 | 564.365 | 14,3 | 1.307.064 | 33,2 | 1.906.205 | 48,4 | 785 |
| 8 | SA 4 | 4.111.569 | 4.070.911 | 95,7 | 614.441 | 15,1 | 1.418.030 | 34,8 | 1.891.153 | 46,5 | 846 |
| 9 | JA 1 | 4.032.015 | 3.975.797 | 95,1 | 656.029 | 16,5 | 1.263.491 | 31,8 | 1.897.901 | 47,7 | 745 |
| 10 | JA 2 | 4.376.388 | 4.327.057 | 94,9 | 596.965 | 13,8 | 1.495.474 | 34,6 | 2.045.298 | 47,3 | 664 |
| 11 | JA 3 | 3.872.463 | 3.826.879 | 95,2 | 590.513 | 15,4 | 1.265.202 | 33,1 | 1.818.469 | 47,5 | 598 |
| 12 | JA 4 | 4.171.328 | 4.128.924 | 94,5 | 685.783 | 16,6 | 1.367.084 | 33,1 | 1.878.286 | 45,5 | 772 |
1 Total reads that passed the quality control. 2 Unique Reads mapped with Tophat2 and counted with HTseq to the QQ74 coastal quinoa genome. 3 Reads mapped to multiple positions with no clear alignment. 4 Reads mapped to the genome with no CDS feature annotated.
Table 2.
List of quinoa genes differentially induced upon JA treatment and involved in the α-linolenic acid and jasmonic acid metabolism.
Table 2.
List of quinoa genes differentially induced upon JA treatment and involved in the α-linolenic acid and jasmonic acid metabolism.
| KEGG code | Number of quinoa genes induced/ genome annotated | Enzyme description | Enzyme code Figure 2 | Enzyme code | |
|---|---|---|---|---|---|
| 1 | K00454 | 8/14 | Lipoxygenase | LOX2S | 1.13.11.12 |
| 2 | K01723 | 2/7 | Hydroperoxide dehydratase | AOS | 4.2.1.92 |
| 3 | K10525 | 3/6 | Allene oxide cyclase | AOC | 5.3.99.6 |
| 4 | K05894 | 4/10 | 12-oxophytodienoic acid reductase | OPR | 1.3.1.42 |
| 5 | K10526 | 2/2 | OPC-8:0 CoA ligase 1 | OPCL1 | 6.2.1. |
| 6 | K00232 | 2/7 | Acyl-CoA oxidase | ACOX1 | 1.3.3.6 |
| 7 | K10527 | 2/6 | Enoyl-CoA hydratase/3-hydroxyacyl-CoA dehydrogenase | MFP2 | 4.2.1.17 |
| 8 | K07513 | 1/4 | Acetyl-CoA acyltransferase 1 | ACAA1 | 2.3.1.16 |
Table 3.
List of quinoa genes differentially induced upon JA treatment involved in lignin biosynthesis.
Table 3.
List of quinoa genes differentially induced upon JA treatment involved in lignin biosynthesis.
| KEGG code | Number of genes responsive/total | Enzyme description | Enzyme code Figure 2 | Enzyme code | |
|---|---|---|---|---|---|
| 1 | K10775 | 2/2 | Phenylalanine ammonia-lyase | PAL | 4.3.1.24 |
| 2 | K00487 | 2/4 | Trans-cinnamate 4-monooxygenase | CYP73A | 1.14.14.91 |
| 3 | K01904 | 2/11 | 4-coumarate-CoA1 ligase | 4CL | 6.2.1.12 |
| 4 | K09754 | 1/62 | 5-O-(4-coumaroyl)-D-quinate 3'-monooxygenase | CYP98A | 1.14.14.96 |
| 5 | K13065 | 1/22 | Shikimate O-hydroxycinnamoyltransferase | HCT | 2.3.1.133 |
| 6 | K00588 | 2/15 | Caffeoyl-CoA O-methyltransferase | CCOMT | 2.1.1.104 |
| 7 | K13066 | 6/18 | Caffeic acid 3-O-methyltransferase | COMT | 2.1.1.68 |
| 8 | K09755 | 1/1 | Ferulate-5-hydroxylase | F5H | 1.14.13.- |
| 9 | K09753 | 1/2 | Cinnamoyl-CoA1 reductase | CCR | 1.2.1.44 |
| 10 | K00083 | 1/15 | Cinnamyl-alcohol dehydrogenase | CAD | 1.1.1.195 |
| 11 | K00430 | 15/199 | Peroxidases that produce 4 types of lignin subunits. | Peroxidase | 1.11.1.7 |
1 CoA: Co-enzyme A. 2 Genes showed an at least 1,7-fold increased transcriptomic signal after JA application but not statistically significant.
Disclaimer/Publisher’s Note: The statements, opinions and data contained in all publications are solely those of the individual author(s) and contributor(s) and not of MDPI and/or the editor(s). MDPI and/or the editor(s) disclaim responsibility for any injury to people or property resulting from any ideas, methods, instructions or products referred to in the content. |
© 2025 by the authors. Licensee MDPI, Basel, Switzerland. This article is an open access article distributed under the terms and conditions of the Creative Commons Attribution (CC BY) license (http://creativecommons.org/licenses/by/4.0/).
Copyright: This open access article is published under a Creative Commons CC BY 4.0 license, which permit the free download, distribution, and reuse, provided that the author and preprint are cited in any reuse.


