
Submitted:
31 May 2025
Posted:
03 June 2025
You are already at the latest version
Abstract
This paper investigates federated learning (FL) for cross-site-scripting (XSS) detection under realistic out-of-distribution (OOD) drift. Real-world XSS traffic mixes fragmented attack payloads, heterogeneous benign inputs and client-side imbalance, which erode conventional detectors. To emulate this variability, we construct two structurally divergent datasets: one containing obfuscated, fragmented attacks and mixed-structure benign samples that blend code, natural-language text and trace fragments, and another comprising syntactically regular examples. This split induces structural OOD in both malicious and benign classes. We train GloVe, GraphCodeBERT and CodeT5 in centralized and federated settings while tracking embedding drift and client-level gaps. FL generally strengthens OOD robustness by averaging stable decision boundaries from cleaner clients into noisier ones. In federated tests, transformer-based embeddings achieve the highest global accuracy, whereas static GloVe vectors remain the least sensitive to negative-class drift. These findings highlight both the limits and value of structure-aware features in FL and suggest FL as a practical, privacy-preserving defence against distributionally mismatched XSS attack.
Keywords:
web security
; machine learning
; cross-site scripting attack
; federated learning
; out of distribution
; Code T5
; GraphcodeBERT
; GloVe
; natural language processing (NLP)
1. Introduction
Cross-site scripting (XSS) attacks remain a persistent security threat due to their widespread occurrence and ease of exploitation [8]. Machine learning-based detection, including reinforcement learning [7,17] and ensemble learning [6,38], has advanced significantly, with earlier studies [4,6,12] and more recent works [1,3,5,10,38] focusing on improving model architectures and feature extraction.
However, many methods still face generalisation issues due to the highly distributed data structure and privacy concerns. Federated Learning (FL) has emerged as a privacy-preserving alternative, allowing collaborative training without exposing raw data. This study explores the use of FL for XSS detection, addressing key challenges such as non-independent and identically distributed (non-IID) data, heterogeneity and out-of-distribution (OOD). While FL has been applied in cybersecurity [11,18], its role in XSS detection remains underexplored. Most prior works focus on network traffic analysis, rather than text-based XSS payloads.
This study presents the first systematic application of federated learning to XSS detection under text-based XSS threat scenarios. Our key contributions are.
- We design a federated learning (FL) framework for XSS detection under structurally non-IID client distributions, incorporating diverse XSS types, obfuscation styles, and attack patterns. This setup reflects real-world asymmetry, where some clients contain partial or ambiguous indicators and others contain clearer attacks. Importantly, structural divergence also affects negatives, whose heterogeneity is a key yet underexplored factor in generalisation failure. Our framework enables the study of bidirectional OOD, where fragmented negatives cause high false positive rates under distribution mismatch.
- Unlike prior work that mixes lexical or contextual features across splits, we maintain strict structural separation between training and testing data. By using an external dataset [57] as an OOD domain, we isolate bidirectional distributional shifts across both classes under FL. Our analysis shows that generalisation failure is can also be driven by structurally complicated benign samples not only by rare or obfuscated attacks, emphasizing the importance of structure-aware dataset design.
- We compare three embedding models (GloVe [24], CodeT5 [26], GraphCodeBERT [25]) in centralised and federated settings, showing that generalisation depends more on embedding compatibility with class heterogeneity than on model capacity. Using divergence metrics and ablation studies, we demonstrate that structurally complex and underrepresented negatives lead to severe false positives. Static embeddings like GloVe show more robust generalisation under structural OOD, indicating that stability relies more on representational resilience than expressiveness.
2. Related Work
Existing research on federated learning (FL) for XSS detection remains scarce. The most relevant work by Jazi & Ben-Gal [2] investigated FL’s privacy-preserving properties using simplified setups and traditional models (e.g., MLP, KNN). Their non-IID configuration assumes an unrealistic “all-malicious vs. all-benign” client split, and evaluation is conducted separately on a handcrafted text-based XSS dataset [57] and the CICIDS2017 intrusion dataset [28]. However, they do not consider data heterogeneity or OOD generalisation. Still, the dataset [57] they selected is structurally rich and thus serves as a suitable OOD test dataset in our experiments (see Section 3.2).
Heterogeneity in datasets remains a significant challenge for XSS detection [14,15,39,61]. The absence of standardized datasets, particularly in terms of class variety and sample volume, can have a substantial impact on the decision boundaries learned by detection models [60,64]. Most existing studies, including [3,4,5,10], attempt to address this issue through labor-intensive manual processing, aiming to ensure strict control over data quality, feature representation, label consistency, and class definitions.
However, we argue that complete reliance on manual curation often fails to reflect real-world conditions. In practical cybersecurity scenarios, data imbalance is both common and inevitable, especially regarding the ratio and diversity of attack versus non-attack samples [60,61,62]. This often results in pronounced structural and categorical divergence between positive and negative classes. For example, commonly used XSS filters frequently over-filter benign inputs [63], indicating a mismatch between curated datasets and actual deployment environments.
In light of these challenges, federated learning demonstrates strong potential. It enables models to share decision boundaries through privacy-preserving aggregation [33,56], offering an effective alternative to centralized data collection and manual intervention.
Meanwhile, we argue that findings from FL research on malicious URL detection [9,37] are partially transferable to XSS detection. Although some malicious URLs may embed XSS payloads, the two tasks differ in semantic granularity, execution contexts, and structural variability. Given their shared challenges like class imbalance, distribution shift, and non-IID data, we think FL techniques proven effective for URL detection offer a reasonable foundation for XSS adaptation.
The high sensitivity of XSS-related information such as emails or session tokens, makes sharing difficult without anonymisation. Yet studies [53,54] show that anonymisation often introduces significant distributional shifts due to strategy-specific biases. Disparities in logging, encoding, and user behaviour further distort data distributions, compromising generalisation [53,54].
For example, strings embedded in polyglot-style payloads are hard to anonymise, as minor changes may affect execution. Consider the following sample:
<javascript:/*-><img/src='x'onerror=eval(unescape(/%61%6c%65%72%74%28%27%45%78%66%69%6c%3A%20%2b%20%27%2b%60test@example.com:1849%60%29/))>
Naively replacing "test@example.com" with an unquoted *** breaks JavaScript syntax, rendering the sample invalid and misleading detectors. While AST-based desensitisation can preserve structure, it is complex, labour-intensive, and lacks scalability [52].
To address these challenges, this study introduces a federated learning (FL) framework to enhance XSS detection while preserving data privacy, especially under an OOD scenario. FL enables collaborative training without exposing raw data [11,56], mitigating distributional divergence and improving robustness [56,59]. More importantly, our approach leverages structurally well-aligned, semantically coherent clients to anchor global decision boundaries, allowing their generalisation capabilities to be implicitly shared across clients with fragmented, noisy, or ambiguous data distributions. In doing so, we avoid the need for centralised, large-scale anonymisation or sanitisation, and instead provide low-quality clients with clearer classification margins without direct data sharing or manual intervention. This decentralised knowledge transfer mechanism forms the basis of our FL framework, detailed in Section 5, and evaluated under dual OOD settings across three embedding models. Section 4 will explain the Centralized OOD testing,
3. Methodology and Experimental Design
3.1. Settings and Rationale
3.1.1. Experiment Environment
Our experiments are based on the FLOWER framework [19], an open-source system for simulating federated learning that supports various federated learning (FL) schemes and aggregation algorithms, including FedAvg [21], FedProx [22], and robust methods such as Krum [23]. The experiments were conducted on the JADE2 high-performance computing (HPC) cluster, using a single NVIDIA V100 GPU (32GB) per run (used average ram 16GB for FL training). As JADE2 is a multi-user shared system, Centralized Training time varied between 0.1-0.5 hours and Federated training time varied between 0.5 - 2 hours, depending on system load and job scheduling conditions. (Typical time cost 2882.32s for GloVe with FedAvg, 4614.06s for GraphCodeBERT with FedAvg)
3.1.2. Embedding Selection Rationale
To evaluate the effectiveness of different natural language processing techniques in OOD XSS detection, we selected three representative word embedding paradigms:
- GloVe-6B-300d (static embedding): A word embedding model that maps words to fixed-dimensional vectors based on co-occurrence statistics.
- GraphcodeBERT-base (BERT-derived, pre-trained with data flow graphs A transformer trained on code using masked language modeling, edge prediction, and token-graph alignment. It models syntax and variable dependencies, making it suited for well-structured XSS payloads.
- CodeT5-base (sequence-to-sequence, code-aware): A unified encoder-decoder model pre-trained on large-scale code corpora. In our setting, we utilize the encoder component to extract contextual embeddings. CodeT5 captures both local and global structural patterns through its masked span prediction and identifier-aware objectives, making it suitable for modeling fragmented or obfuscated payloads that lack explicit syntax trees.
Unlike GraphCodeBERT, which relies heavily on syntax-level alignment, CodeT5 learns a broader structural abstraction that generalizes better to heterogeneous inputs. This makes it particularly effective in detecting distributional shifts in structurally diverse or OOD payloads commonly seen in federated XSS detection scenarios.
For practical considerations, we adopted mid-sized variants of each model to ensure computational feasibility and compatibility with federated learning environments. Larger-scale state of art (SOTA) models such as GPT-3/3.5/4 [43] and DeepSeek-coder-1B/6.7B [44], while potentially more expressive, are prohibitively expensive in terms of inference cost and memory footprint, even when used solely for frozen embedding. Such overhead renders them unsuitable for decentralised training settings, especially when synchronous inference across heterogeneous clients is required.
In addition, to ensure a fair and interpretable comparison, we intentionally avoided mixing model scale and design improvements. The selected models strike a practical balance between representation power and computational efficiency, enabling a focused evaluation of embedding characteristics without introducing confounding factors or excessive system complexity.
3.1.3. Freeze Emebedding
Despite the potential for improved downstream performance, we intentionally avoid fine-tuning the embedding models (e.g., CodeT5, GraphCodeBERT) in our pipeline. This design choice reflects both practical and privacy-driven considerations.
In typical and classical FL settings, model training must occur on decentralised clients where raw data cannot be aggregated. Fine-tuning pre-trained models typically requires centralised access to data and intensive resources, which contradicts FL’s privacy-preserving assumptions.
Furthermore, recent studies [40,41,45] have demonstrated that fine-tuning can amplify privacy leakage risks by recovering previously “forgotten” personal information from language models (LMs). They will also increase the FL computation cost and complexity [45]. Therefore, we use frozen embedding models to better align with real-world FL deployments, where privacy and generalisation must coexist without heavy centralised retraining, and to reduce the risk of inference attacks [46] that exploit model updates to extract senssitive client information.
3.1.4. Downstream Classifier
The downstream classifier is a unified light transformer model with d_model = 256, nhead = 8, num_encoder_layers = 3, dim_feedforward = 512, dropout = 0.1, learning rate = 0.001. Batch_size = 64. The input dimensions of the three word-embedding models used are 768 for both CodeT5 and GraphcodeBERT, and 300 for GloVe, respectively. We used Cross Entropy Loss for both Centralised and FL tests.
3.1.5. Optimization and Aggregation
We applied FedAvg and FedProx with Focal Loss [34] to address client drift and imbalance in the Non-IID federated learning setting for aggregation. The Focal Loss modification helps mitigate the impact of class imbalance, particularly for rare XSS attack variants. For details, please see section 5.1.
In the overall framework, we avoided overly complex designs like federated domain adaptation [47] to minimise the influence of different factors on the advantages of federated learning. Our experiment design aims to verify the potential role of the federated learning framework in OOD XSS attack detection rather than to validate single models or approaches that have already been extensively studied and repeatedly tested, as mentioned earlier. Many of these models strongly depend on specific datasets and centralised training conditions, making them less applicable to real-world FL scenarios with non-IID, privacy-constrained data distributions. The following sections will explain the dataset preparation, the central aggregation algorithms used for federated learning, and the experimental evaluation results.
3.2. Dataset Design and Explanation
3.2.1. Dataset Construction
Following recent studies [1,2,3,4,15,20,39,57], we categorize XSS datasets into two types: text-oriented and traffic-oriented. Our focus is on text-oriented datasets, which include raw payloads, JavaScript fragments, and event handlers, and more directly capture XSS surface forms. Unlike general intrusion datasets (e.g., CICIDS2017, NF-ToN-IoT [27]), XSS detection lacks large-scale, standardized text corpora. Existing datasets are often small, domain-specific, and poorly documented [5,20,29,30].
We use two complementary datasets to support federated learning experiments:
- Dataset 1: A manually curated training set (73,277 samples; 39,134 positives) sourced from OWASP, GitHub, and PortSwigger. It includes diverse XSS types (Reflected, Stored, DOM-based) and obfuscation styles. Positive samples are often partial or fragmented payloads, while negative samples are heterogeneous, including mixed-format code snippets, incomplete traces, and unrelated injections.
- Dataset 2: A structurally consistent test set (42,514 samples; 15,137 positives) from [57], dominated by fully-formed Reflected XSS payloads (~95.7%) with high lexical and syntactic regularity. Its negative samples are more cleanly separated (e.g., full URLs, plain text), resulting in lower structural ambiguity.
To simulate FL-specific non-IID conditions:
- We partition Dataset 1 across five clients with attack-type and source-specific imbalance;
- We use Dataset 2 as an out-of-distribution (OOD) test set to evaluate generalisation under structural shift.
No data augmentation or resampling was applied, in order to preserve natural fragmentation, partial injections, and scanning artifacts. The dataset continues to be refined to ensure that observed OOD effects stem from real-world variability, not artificial perturbations.
We released both raw datasets in:
Our dataset design was also inspired by the research of Sun's team [31], along with their formula for evaluating model generalisation errors:
3.2.3. Semantic-Preserving Substitution and Lexical Regularisation
In Dataset 1, we replaced high-frequency canonical payloads such as “alert” with syntactically valid but functionally diverse JavaScript APIs like prompt. See Table 1. These variants, although not strictly equivalent in runtime effect, remain plausible within XSS contexts and preserve executable structure. The substitutions were selected to expand structural diversity and better reflect real-world attack surface variability. Unlike traditional lexical regularisation that aims to preserve semantic identity, our transformation introduces controlled structural perturbations without altering the label or removing executable intent. While Dataset 2 retains conventional alert-style payloads, Dataset 1 exposes the model to more varied expressions. This design enables us to evaluate robustness under structurally diverse but semantically plausible inputs, particularly relevant for fragmented or ambiguous samples in practical deployment scenarios.
3.2.4. Quantitative lexical-level analysis reveals distributional divergence.
To quantify lexical-level divergence between Dataset 1 and Dataset 2, we extracted top-100 TF-IDF features from 3,000 sampled samples. In positive samples, 63 features overlapped (Jaccard = 45.98%, Cosine = 0.4988), showing moderate consistency. In contrast, negative samples had only 20 overlaps (Jaccard = 10.5%, Cosine = 0.2230), reflecting greater lexical diversity. While this suggests notable variation in negative samples, We hypothesise that generalisation gaps cannot be solely attributed to this, as structural inconsistencies in positive samples also play a key role. See Table 2. For the formulation, refers to the Top-k TF-IDF features from Dataset 1, same to , the overlap count is defined as where , denote the sets of top-k TF-IDF features in each dataset. cosine similarity between aggregated TF-IDF vectors is given by, where represent the mean TF-IDF vectors of each dataset. However, since TF-IDF cannot effectively capture structural differences in positive samples (similar to GloVe, which also lacks structural awareness), we further employed other measurements to visualise such differences in the following paragraphs of section 4.2.
3.2.5. Visualisation of Different Datasets’ Positive Samples
While we initially considered multiple projection methods, such as T-SNE [32], we ultimately chose UMAP [58] for this analysis, we used GraphCodeBERT embeddings, as it offers better sensitivity to structural and token-level variation in code-like or script-based inputs, which are common in XSS payloads. We focused on positive samples for visualisation since our dataset mainly contains potential payloads and a relatively minor portion of actual attacks. As shown in Figure 3, Dataset 1 appears fragmented, reflecting obfuscated or diverse payloads, while Dataset 2 forms a more compact and uniform cluster. This structural contrast supports the presence of feature-level drift across datasets.
3.3. Experimental Procedure Overview
We conducted four groups of experiments to evaluate model generalisation, feature sensitivity, and federated learning performance:
- Centralized Embedding Evaluation: We tested three embedding models, GloVe, GraphcodeBERT, and CodeT5 under centralised settings using Dataset 1 for training and Dataset 2 for testing. This setup evaluates each model’s generalisation ability to unseen attack structures in an OOD context.
- Dataset Swap OOD Test: To further explore the impact of feature distribution divergence, we reversed the datasets: training on Dataset 2 and testing on Dataset 1. This demonstrates how models trained on one domain generalise (or fail to generalise) to structurally distinct inputs.
- Federated Learning with Non-IID Clients: We simulated a more realistic extreme horizontal FL setup with five clients. Dataset 1 and Dataset 2 were partitioned across clients to introduce heterogeneous distributions. Each client was trained locally and evaluated on unseen data from the other dataset. We used FedAvg and FedProx for aggregation, evaluating accuracy, false positive rate, recall, and precision.
- Centralised In-Distribution Control Test: As a baseline, we trained and evaluated the classifier based on three embedding models on a single, fully centralised test set that merge both datasets. This set-up lets us contrast truly centralised learning with our federated-learning regime, isolate any performance gains attributable to data decentralisation, and expose the limits of federated learning when distributional heterogeneity is removed.
4. Independent Client Testing with OOD Distributed Data
In the first part of our evaluation, we trained on Dataset 1 and tested on Dataset 2, then reversed the setup. While both datasets target reflected XSS, they differ in structural and lexical characteristics, as detailed in Section 3.1. This asymmetry, present in both positive and negative samples, led to significant generalisation gaps. In particular, models trained on one dataset exhibited lower precision and increased false positive rates when tested on the other, reflecting the impact of data divergence under OOD settings.
We evaluated all three embedding models under both configurations. Confusion matrices (Figure 4 and Figure 5) illustrate the classification differences when trained on low- versus high-generalisation data, respectively. Before this, we established performance baselines via 20% splits on the original training set to rule out overfitting (Table 3). Figure 6 summarises cross-distribution performance under each model, and Figure 7 highlights the extent of performance shifts under structural OOD. These results confirm that both positive and negative class structures play a critical role in the generalisation performance of XSS detectors
To isolate the impact of positive sample structure, we conducted cross-set training where the training positives originated from the high-generalisation Dataset2 while retaining fragmented negatives from Dataset1 on the most structure sensitive model GraphcodeBERT. Compared to the baseline trained entirely on Dataset1, this setup substantially improved Accuracy (from 56.80% to 71.57%) and precision (from 44.82% to 68.39%), with Recall slightly increased to 99.70%. These findings highlight that structural integrity in positive samples enhances model confidence and generalisability even under noisy negative supervision. Conversely, negatives primarily increase false positives (FPR 68.19%). See Table 4.
4.1. Generalisation Performance Analysis
When We evaluate the generalisation ability of GloVe, GraphCodeBERT, and CodeT5 embeddings by testing on the high-generalisation dataset (Dataset 2) and training on the structurally diverse and fragmented Dataset 1. All models experience a significant drop in performance, particularly in precision and false positive rate (FPR), indicating high sensitivity to structural shifts across datasets.
GraphCodeBERT shows the most severe performance degradation, with precision dropping from 84.38% to 45.03% (−39.35%), and FPR increasing from 19.16% to 65.62% (+46.46%). Despite maintaining nearly perfect recall (99.63%), it heavily overpredicts positives when faced with unfamiliar structures, suggesting poor robustness to syntactic variance due to its code-centric pretraining.
CodeT5 suffers slightly less, but still significant degradation: precision drops from 84.50% to 46.36% (-38.14%), and FPR rises from 18.47% to 61.95% (+43.48%). This suggests that while its span-masked pretraining aids structural abstraction, it still fails under negative class distribution shift.
GloVe demonstrates the most stable cross-dataset performance, with a precision decline from 90.13% to 51.58% (−38.55%), and FPR increasing from 11.90% to 47.90 (+36.00%). Although static and context-agnostic, GloVe is less vulnerable to structural OOD, likely due to its reliance on global co-occurrence statistics rather than positional or syntactic features.
These results support that structural generalisation failure arises from both positive class fragmentation and negative class dissimilarity. Models relying on local syntax (e.g., GraphCodeBERT) are more prone to false positives, while those leveraging global distributional features (e.g., GloVe) exhibit relatively better robustness under extreme OOD scenarios.
Sensitivity of Embeddings to Regularization Under OOD
Under structural OOD conditions, CodeT5 achieved high recall (≥99%) but suffered from low precision and high FPR, indicating overfitting to local patterns. Stronger regularization (dropout = 0.3, lr = 0.0005) led to improved precision (+4.73%) and reduced FPR (−10.89%), showing modest gains in robustness. GloVe benefited the most from regularization, with FPR dropping to 29.49% and precision rising to 63.41%. In contrast, GraphCodeBERT remained not very sensitive to regularization, with relatively smaller change across settings. These results suggest that structure-sensitive embeddings require tuning to remain effective under structural shift, while static embeddings like GloVe offer more stable performance.
Notably, we also observed that stronger regularization on dropout tends to widen the performance gap between best and worst OOD scenarios, especially for GloVe (4%~9%). These results suggest that structure-sensitive embeddings require tuning to remain effective under distributional shift. See Table 5.
4.2. Embedding Level Analysis
To assess whether embedding similarity correlates with generalisation, we computed pairwise Jensen-Shannon Divergence (JSD) [49] and Wasserstein distances (WD) [50] across models on both datasets. and : Probability distributions of two embedding sets, : Mean distribution. : Kullback–Leibler divergence from one distribution to another. :Cumulative distribution functions. reflects a symmetric, smoothed divergence metric capturing the balanced difference between and .
As shown in Table 6, the three embedding models respond differently to structural variation. GraphCodeBERT has the lowest JSD (0.2444) but the highest WD (0.0758), suggesting its embeddings shift more sharply in space despite low average token divergence. This sensitivity leads to poor generalisation, with false positive rates exceeding 65% under OOD tests. GloVe shows the highest JSD (0.3402) and moderate WD (0.0562), indicating broader but smoother distribution changes. It performs most stably in OOD scenarios, likely due to better tolerance of structural drift. CodeT5 has the lowest WD (0.0237), meaning its embeddings change little across structure shifts. However, this low sensitivity results in degraded precision, especially for negative-class drift.
Kernel-Based Statistical Validation of OOD Divergence
While metrics like JSD and Wasserstein quantify distributional shifts, they do not assess statistical significance. To address this, we compute the Maximum Mean Discrepancy (MMD) between Dataset 1 and Dataset 2 using Random Fourier Features (RFF) for efficiency, with 40,000 samples per set, for details.
- 4.
- score scope for different models embedding in all samples: 0.001633 (GraphcodeBERT) - 0.082517 (GloVe) - 0.118169 (CodeT5).
- 5.
- In positive samples: 0.000176 (GloVe) - 0.000853(GraphcodeBERT) - 0.106470 (CodeT5).
- 6.
- In negative samples: 0.004105(GraphcodeBERT) - 0.007960 (CodeT5) - Glove (0.517704)
- 7.
- All Embeddings’ < 0.001(refers to a distinct OOD)
These data confirmed a statistically significant distributional shift and semantic OOD in negative samples. For formulation, please see below. , refers to the set of different embeddings. means the kernel feature mapping approximated via Random Fourier Features (RFF). For , is the observed MMD score, represents the number of permutations, is the MMD value obtained for the i permutation.
The unusually high negative-class MMD of GloVe largely arises from lexical-surface drift along dimensions that have negligible classifier weights. Suggesting the decision boundary learned during hard-negative mining is far from benign regions in these dimensions, the model maintains a low false-positive rate under OOD settings despite the apparent distribution gap. Conversely, contextual models display smaller overall MMD yet place their boundary closer to benign clusters, yielding higher FPR. This suggests that absolute MMD magnitude is not a sufficient indicator of OOD robustness; alignment between drift directions and decision-relevant subspaces is critical.
These results, supported by lexical analysis (Section 3.2) indicate that the observed generalisation gap is attributable to systematic data divergence, particularly in negative sample distributions, rather than random fluctuations.
5. Federated Learning Tests Under Non-IID Scenarios
This paragraph will investigate whether such generalisation holds under decentralised settings, to validate our original idea that Federated learning can enhance the model’s generalisation even under an OOD situation.
5.1. Federated Learning Settings
5.1.1. Dataset Distribution
The rest of the training and test splits were partitioned according to the label and sample categories described in Section 3.2, using fixed random seeds (= 42) to ensure reproducibility. We set three representative non-IID configurations: (1) clients with severe class imbalance (e.g., skewed positive/negative ratios), (2) clients with varied total data quantities and randomly sampled label distributions, and (3) clients with composite distribution skew involving both label imbalance and quantity mismatch, potentially including noisy samples. An example of the composite configuration (3) is illustrated in Figure 8. For the remaining parts of the two datasets, approximately 50% of the labels and sample sizes are evenly distributed among five clients as the test set. However, the test sets for clients 1 to 4 are derived from dataset 2, while the test set for client 5 is from dataset 1. This forms the OOD distribution. This setup reflects a realistic federated setting where label and distributional skews co-occur [48,56].
5.1.2. Federated Learning Setup
We simulate a horizontal FL setup with five clients, each holding structurally distinct training data. Clients 1–4 use imbalanced and diverse samples from Dataset 1, while Client 5 holds syntactically regular data from Dataset 2, forming a heterogeneous training landscape with inter-client label and structure skew.
All clients participate in 30 global rounds with learning rate = 0.005, dropout = 0.1, using FedAvg and FedProx (proximal term = 0.2) for aggregation. Clients train locally for 10 epochs with SGD and Focal Loss (α = 1.4, γ = 2.0), and StepLR scheduler (step = 5, γ = 0.5). After each round, the global model is redistributed and evaluated on each client’s mismatched test set and Clients 1–4 are tested on Dataset 2, Client 5 on Dataset 1, to enable systematic evaluation under structural OOD.
Client training and evaluation run in parallel, and metrics (accuracy, recall, precision, F1, FPR) are computed locally and aggregated at the server.
5.1.3. Aggregation Algorithms
We adopt two standard aggregation methods to evaluate FL under non-IID settings: FedAvg and FedProx. FedAvg computes the global model as a weighted average of client updates, proportionally based on each client’s local data size. This method ensures that clients with more data significantly influence the global model, which enhances the model’s performance and generalisation ability.
FedAvg Formulas:
- : The weight of the global model after round t+1.
- : The number of participating clients.
- : The data size of client k
- : The total data size across all clients
- : The local model weight of client k after round t
FedProx is particularly suitable for non-IID settings, as it stabilises training by reducing local model drift. We include it to evaluate how regularised aggregation affects generalisation under heterogeneous XSS data.
FedProx Formulas:
- : The optimised weight of the local model on client k after round t+1.
- : The loss function for client k.
- : The regularisation parameter (proximal term).
- : The weight of the global model after round t.
- The argument of the minimum indicates that minimises the expression within the parentheses.
5.2. Federated Learning Performance
Firstly, we examined the global classifier’s performance under two algorithms, using GLOVE-6B-300D as an example (the other two models showed different convergence behaviours, with GraphCodeBERT improving most under FedProx), as shown in Figure 9. At a learning rate of 0.005, the global model exhibits severe oscillation during training, particularly under FedProx. This instability stems from the concentration of generalizable data in a single client, whose contribution is suppressed by Proximal regularization. Lowering the rate to 0.001 improves stability with GloVe, but slows training, requiring more rounds to match performance. After 30 rounds, it reaches 94.89% accuracy and 6.7% FPR, compared to 97.14% and 3.2% under 0.005. In contrast, GraphCodeBERT and CodeT5 exhibit distinct convergence patterns, despite their poorer out-of-distribution (OOD) performance. Aggregated accuracy and FPR curves for all embeddings under both FedProx and FedAvg are shown in Figure10.
FedAvg improves training stability across all embeddings but slightly hinders final performance for GloVe and CodeT5. In contrast, GraphCodeBERT benefits from FedProx, showing improved final accuracy; however, CodeT5 still achieves better performance on the worst client. Table 7 reports peak and worst client-side results under FedProx.
Centralised No Data Isolation Testing Baseline
We also tested the classifier performance of three different embedding models, without data isolation, to demonstrate a comparison with federated learning. In this scenario, the train dataset contains data from both Dataset 1 and Dataset 2 (25% from the high generalisation dataset, the test dataset also includes 25% from the original train dataset, dataset1), with balanced negative, positive samples. See Figure 11 and Table 8.
5.3. Federated Learning Result Analysis
GloVe reaches a competitively aggregated endpoint (Acc = 96.2%, FPR = 5.5%) but exhibits the most significant round-to-round variance, reflecting its struggle to reconcile client-specific structural drift under FedProx. GraphCodeBERT starts lower (77.3%) but climbs steadily to 96.8%, with a relatively smooth trajectory and a low final FPR (4.7%). Its graph-guided attention appears to benefit from inter-client variability, suggesting an implicit alignment effect during parameter averaging. CodeT5 surpasses 90% within five rounds and peaks at 97.6% / 3.5% FPR (aggregated), but later shows mild instability. As we use only the frozen encoder, this is likely due to local structural sensitivities encoded during pre-training, rather than decoder-side overfitting. These contrasting convergence profiles highlight the importance of aligning aggregation dynamics with embedding characteristics in non-IID FL settings. FedAvg generally offers better convergence stability, while FedProx accelerates early learning but suffers from instability due to the suppression of the only high-generalisation client. GraphCodeBERT benefits most from ensemble smoothing, while GloVe’s sparse lexical weights are pulled in conflicting directions. CodeT5 learns fastest initially but is vulnerable to jitter in later rounds. Overall, FL averages out lexical and structural distributional shifts that would otherwise harm model boundaries when trained in isolation. Client-level improvements from round 1 to 30 are summarised in Figure 12.
6. Conclusions
This work demonstrates that federated learning can effectively mitigate structural distribution shifts in OOD XSS detection while preserving data privacy. By contrasting two structurally divergent datasets and systematically evaluating three representative embeddings, we show that generalization under non-IID and OOD settings is highly contingent on the alignment between embedding geometry and aggregation dynamics. Our analyses reveal a class-specific drift pattern, where benign inputs exhibit surface-level variability, while attack samples shift along deeper syntactic axes. Under such drift, federated training helps smooth client heterogeneity, particularly when embeddings are structure-aware yet stable. These findings highlight the potential of FL not only as a privacy-preserving alternative to centralized curation, but also as a robustness-enhancing strategy for deployment in fragmented, real-world web environments. Future directions include dynamic aggregation schemes sensitive to client-specific drift profiles, and broader evaluations across asynchronous or transient FL setups.
7. Limitations and Future Work
- Incorporating Partial Participation with Invariant Learning. Our current setup assumes synchronous client participation per round, whereas real-world FL often involves dropout or intermittent availability. While we do not explicitly simulate asynchronous updates, recent methods such as FEDIIR [55] have shown robustness under partial participation by implicitly aligning inter-client gradients to learn invariant relationships. Extending such approaches to our structure-variant OOD setting may improve robustness in realistic, non-synchronous FL environments.
- Data Quality as a Structural Bottleneck. A key challenge in federated XSS detection lies not in algorithmic optimisation, but in the difficulty of acquiring high-quality, generalisable data across all clients. Our results suggest that if no clients possess substantial structural diversity or sufficient sample representation, the global model’s generalisation ability will be severely impaired, even with robust aggregation. Federated learning in XSS detection contexts fundamentally depends on partial data sufficiency among clients. As part of future work, we plan to expand the dataset to include more structurally complex XSS payloads, especially context-dependent polyglot attacks that combine HTML, CSS, and JavaScript in highly obfuscated forms. Such samples are essential to better simulate real-world, evasive behaviours and stress-test federated models under extreme structural variability.
- Deployment Feasibility and Optimisation Needs.While the current framework employs a lightweight Transformer classifier, future work may explore further simplification of the downstream classifier through distilled models (e.g., TinyBERT), linear-attention architectures (e.g., Performer), or hybrid convolution-attention designs to reduce computational overhead and improve real-world deplorability.
Abbreviations
The following abbreviations are used in this manuscript:
| OOD | out-of-distribution |
| XSS | Cross-Site Scripting |
| FL | federated learning |
| IID | Independent and Identically Distributed |
| Non-IID | Non-Independent and Identically Distributed |
| FPR | False Positive Rate |
| MMD | Maximum Mean Discrepancy |
| NLP | Natural Language Processing |
| JSD | Jensen-Shannon Divergence |
| WD | Wasserstein Distance |
| TF-IDF | Term Frequency–Inverse Document Frequency |
References
- Alqura’n, R., et al.: Advancing XSS Detection in IoT over 5G: A Cutting-Edge Artificial Neural Network Approach. IoT 5(3), 478–508 (2024). [CrossRef]
- Jazi, M., Ben-Gal, I.: Federated Learning for XSS Detection: A Privacy-Preserving Approach. In: Proceedings of the 16th International Joint Conference on Knowledge Discovery, Knowledge Engineering and Knowledge Management, pp. 283–293. SCITEPRESS, Porto, Portugal (2024). [CrossRef]
- Tan, X., Xu, Y., Wu, T., Li, B.: Detection of Reflected XSS Vulnerabilities Based on Paths-Attention Method. Appl. Sci. 13(13), 7895 (2023). [CrossRef]
- Fang, Y., Li, Y., Liu, L., Huang, C.: DeepXSS: Cross Site Scripting Detection Based on Deep Learning. In: Proceedings of the 2018 International Conference on Computing and Artificial Intelligence, pp. 47–51. ACM, Chengdu (2018). [CrossRef]
- Abu Al-Haija, Q.: Cost-effective detection system of cross-site scripting attacks using hybrid learning approach. Results Eng. 19, 101266 (2023). [CrossRef]
- Nagarjun, P., Shakeel, S.: Ensemble Methods to Detect XSS Attacks. Int. J. Adv. Comput. Sci. Appl. 11(5) (2020). [CrossRef]
- Tariq, I., et al.: Resolving cross-site scripting attacks through genetic algorithm and reinforcement learning. Expert Syst. Appl. 168, 114386 (2021). [CrossRef]
- MITRE: CWE Top 25 Most Dangerous Software Weaknesses. https://cwe.mitre.org/top25/archive/2023/2023_top25_list.html (2023). Accessed 18 Aug 2024.
- Sakazi, I., Grolman, E., Elovici, Y., Shabtai, A.: STFL: Utilizing a Semi-Supervised, Transfer-Learning, Federated-Learning Approach to Detect Phishing URL Attacks. In: 2024 International Joint Conference on Neural Networks (IJCNN). pp. 1–10. IEEE, Yokohama, Japan (2024). [CrossRef]
- Bakır, R., Bakır, H.: Swift Detection of XSS Attacks: Enhancing XSS Attack Detection by Leveraging Hybrid Semantic Embeddings and AI Techniques. Arab. J. Sci. Eng. (2024). [CrossRef]
- Li, L., et al.: A review of applications in federated learning. Comput. Ind. Eng. 149, 106854 (2020). [CrossRef]
- Rathore, S., Sharma, P.K., Park, J.H.: XSSClassifier: An Efficient XSS Attack Detection Approach Based on Machine Learning Classifier on SNSs. J. Inf. Process. Syst. 13(4), 1014–1028 (2017). [CrossRef]
- Byun, J.-E., Song, J.: A general framework of Bayesian network for system reliability analysis using junction tree. Reliab. Eng. Syst. Saf. 216, 107952 (2021). [CrossRef]
- Côté, P.-O., et al.: Data cleaning and machine learning: a systematic literature review. Autom. Softw. Eng. 31(2), 54 (2024). [CrossRef]
- Kaur, J., Garg, U., Bathla, G.: Detection of cross-site scripting (XSS) attacks using machine learning techniques: a review. Artif. Intell. Rev. 56(11), 12725–12769 (2023). [CrossRef]
- Rodríguez-Galán, G., Torres, J.: Personal data filtering: a systematic literature review comparing the effectiveness of XSS attacks in web applications vs cookie stealing. Annals of Telecommunications. (2024).
- Fang, Y., et al.: RLXSS: Optimizing XSS Detection Model to Defend Against Adversarial Attacks Based on Reinforcement Learning. Future Internet 11(8), 177 (2019). [CrossRef]
- Zhao, Y., et al.: Federated Learning with Non-IID Data. arXiv preprint arXiv:1806.00582 (2018). [CrossRef]
- Flower Framework Documentation. https://flower.ai/docs/framework/_modules/flwr/server/strategy/fedprox.html#FedProx (2024). Accessed 20 Sep 2024.
- Thajeel, I.K., et al.: Machine and Deep Learning-based XSS Detection Approaches: A Systematic Literature Review. J. King Saud Univ. Comput. Inf. Sci. 35(7), 101628 (2023). [CrossRef]
- McMahan, H.B., et al.: Communication-Efficient Learning of Deep Networks from Decentralised Data. In: Proceedings of the 20th International Conference on Artificial Intelligence and Statistics, pp. 1273–1282. PMLR (2017).
- Li, T., et al.: Federated Optimization in Heterogeneous Networks. arXiv preprint arXiv:1812.06127 (2020). https://arxiv.org/abs/1812.06127.
- Blanchard, P., et al.: Byzantine-Tolerant Machine Learning. arXiv preprint arXiv:1703.02757 (2017). https://arxiv.org/abs/1703.02757.
- Pennington, J., et al.: GloVe: Global Vectors for Word Representation. https://nlp.stanford.edu/projects/GloVe/ (2014). Accessed 20 Oct 2024.
- Guo, D., et al.: GraphCodeBERT: Pre-training Code Representations with Data Flow. arXiv preprint arXiv:2009.08366 (2021). https://arxiv.org/abs/2009.08366.
- Y. Wang, W. Wang, S. Joty, and S.C.H. Hoi, “CodeT5: Identifier-aware Unified Pre-trained Encoder-Decoder Models for Code Understanding and Generation,” in *Proceedings of the 2021 Conference on Empirical Methods in Natural Language Processing (EMNLP)*, pp. 8696–8708, 2021.
- NF-ToN-IoT Dataset. https://staff.itee.uq.edu.au/marius/NIDS_datasets/ (2024). Accessed 20 Aug 2024.
- CICIDS2017 Dataset. https://www.unb.ca/cic/datasets/ids-2017.html (2024). Accessed 18 Aug 2024.
- Sarhan, M., Layeghy, S., Portmann, M.: Towards a Standard Feature Set for Network Intrusion Detection System Datasets. Mobile Netw. Appl. 27(1), 357–370 (2022). [CrossRef]
- Qin, Q., et al.: Detecting XSS with Random Forest and Multi-Channel Feature Extraction. Comput. Mater. Contin. 80(1), 843–874 (2024). [CrossRef]
- Sun, Z., Niu, X., Wei, E.: Understanding Generalisation of Federated Learning via Stability: Heterogeneity Matters. In: Proceedings of the 39th International Conference on Machine Learning, pp. 1–15. PMLR (2022).
- Chan, D.M., et al.: T-SNE-CUDA: GPU-Accelerated T-SNE and its Applications to Modern Data. In: 2018 30th International Symposium on Computer Architecture and High Performance Computing, pp. 330–338. IEEE, Lyon (2018). [CrossRef]
- Vahidian, S., et al.: Rethinking Data Heterogeneity in Federated Learning: Introducing a New Notion and Standard Benchmarks. IEEE Trans. Artif. Intell. 5(3), 1386–1397 (2024). [CrossRef]
- Lin, T.-Y., et al.: Focal Loss for Dense Object Detection. In: Proceedings of the IEEE International Conference on Computer Vision, pp. 2980–2988. IEEE, Venice (2017).
- Rieke, N., et al.: The future of digital health with federated learning. npj Digit. Med. 3(1), 119 (2020). [CrossRef]
- Li, Q., et al.: Federated Learning on Non-IID Data Silos: An Experimental Study. arXiv preprint arXiv:2102.02079 (2021). https://arxiv.org/abs/2102.02079.
- Khramtsova, E., et al.: Federated Learning For Cyber Security: SOC Collaboration For Malicious URL Detection. In: 2020 IEEE 40th International Conference on Distributed Computing Systems, pp. 1316–1321. IEEE, Singapore (2020). [CrossRef]
- Zhou, Y., Wang, P.: An ensemble learning approach for XSS attack detection with domain knowledge and threat intelligence. Comput. Secur. 82, 261–269 (2019). [CrossRef]
- Hannousse, A., Yahiouche, S., Nait-Hamoud, M.C.: Twenty-two years since revealing cross-site scripting attacks: A systematic mapping and a comprehensive survey. Comput. Sci. Rev. 52, 100634 (2024). [CrossRef]
- Wang, T., Zhai, L., Yang, T., Luo, Z., Liu, S.: Selective privacy-preserving framework for large language models fine-tuning. Information Sciences. 678, 121000 (2024). [CrossRef]
- Du, H., Liu, S., Zheng, L., Cao, Y., Nakamura, A., Chen, L.: Privacy in Fine-tuning Large Language Models: Attacks, Defenses, and Future Directions (2025). [CrossRef]
- Kirchner, R., Möller, J., Musch, M., Klein, D., Rieck, K., Johns, M. Dancer in the Dark: Synthesizing and Evaluating Polyglots for Blind Cross-Site Scripting. Proceedings of the 33rd USENIX Security Symposium, August 14–16, 2024, Philadelphia, PA, USA. https://www.usenix.org/conference/usenixsecurity24/presentation/kirchner.
- OpenAI. "GPT-4 Technical Report." OpenAI (2023). https://openai.com/research/gpt-4.
- DeepSeek AI. DeepSeek-Coder-6.7B-Instruct. 2024. Available at: https://huggingface.co/deepseek-ai/deepseek-coder-6.7b-instruct. (Accessed Sep 2024).
- Chen, H., Zhao, H., Gao, Y., Liu, Y., Zhang, Z.: Parameter-Efficient Federal-Tuning Enhances Privacy Preserving for Speech Emotion Recognition. In: ICASSP 2025 - 2025 IEEE International Conference on Acoustics, Speech and Signal Processing (ICASSP). pp. 1–5. IEEE, Hyderabad, India (2025). [CrossRef]
- Rao, B., Zhang, J., Wu, D., Zhu, C., Sun, X., Chen, B.: Privacy Inference Attack and Defense in Centralized and Federated Learning: A Comprehensive Survey. IEEE Trans. Artif. Intell. 6, 333–353 (2025). [CrossRef]
- Peterson, D., Kanani, P., Marathe, V.J.: Private Federated Learning with Domain Adaptation, http://arxiv.org/abs/1912.06733, (2019). [CrossRef]
- Zhang, J., Li, C., Qi, J., He, J.: A Survey on Class Imbalance in Federated Learning, http://arxiv.org/abs/2303.11673, (2023).
- J.S. Lin. Divergence Measures Based on the Shannon Entropy. IEEE Transactions on Information Theory, 37(1), 145–151 (1991).
- M. Arjovsky, S. Chintala, L. Bottou. Wasserstein GAN. arXiv preprint arXiv:1701.07875 (2017).
- A. Gretton, K.M. Borgwardt, M.J. Rasch, B. Schölkopf, A. Smola. A Kernel Two-Sample Test. Journal of Machine Learning Research, 13, 723–773 (2012).
- Sun, W., Fang, C., Miao, Y., You, Y., Yuan, M., Chen, Y., Zhang, Q., Guo, A., Chen, X., Liu, Y., Chen, Z.: Abstract Syntax Tree for Programming Language Understanding and Representation: How Far Are We?, http://arxiv.org/abs/2312.00413, (2023). [CrossRef]
- Pimenta, I., Silva, D., Moura, E., Silveira, M., & Gomes, R.L. (2024). Impact of Data Anonymization in Machine Learning Models. In: Proceedings of the 13th Latin-American Symposium on Dependable and Secure Computing (LADC 2024), ACM, pp. 188–191. [CrossRef]
- Rahman, A., Iqbal, A., Ahmed, E., Tanvirahmedshuvo, & Ontor, M.R.H. (2024). Privacy-Preserving Machine Learning: Techniques, Challenges, and Future Directions in Safeguarding Personal Data Management. Frontline Marketing Management and Economics Journal, 4(12), 84–106. [CrossRef]
- Guo, Y., Li, J., Wang, X., Liu, Y., Wu, Y., & Wang, Y. (2023). Out-of-Distribution Generalization of Federated Learning via Implicit Invariant Relationships. Proceedings of the 40th International Conference on Machine Learning (ICML 2023), PMLR 202:11560–11584.
- Pei, J., Liu, W., Li, J., Wang, L., Liu, C.: A Review of Federated Learning Methods in Heterogeneous Scenarios. IEEE Trans. Consumer Electron. 70, 5983–5999 (2024). [CrossRef]
- Mereani, F.A., Howe, J.M.: Detecting Cross-Site Scripting Attacks Using Machine Learning. In: Hassanien, A.E., Tolba, M.F., Kim, T.-h. (eds.) Advanced Machine Learning Technologies and Applications. AISC, vol. 723, pp. 200–210. Springer, Cham (2018). [CrossRef]
- McInnes, L., Healy, J., Melville, J.: UMAP: Uniform Manifold Approximation and Projection for Dimension Reduction. arXiv preprint arXiv:1802.03426 (2018).
- Liao, X., Liu, W., Zhou, P., Yu, F., Xu, J., Wang, J., Wang, W., Chen, C., Zheng, X.: FOOGD: Federated Collaboration for Both Out-of-distribution Generalization and Detection.
- Gao, C., Zhang, X., Han, M., Liu, H.: A review on cyber security named entity recognition. Front Inform Technol Electron Eng. 22, 1153–1168 (2021). [CrossRef]
- Wang, H., Singhal, A., Liu, P.: Tackling imbalanced data in cybersecurity with transfer learning: a case with ROP payload detection. Cybersecurity. 6, 2 (2023). [CrossRef]
- Al-Shehari, T., Kadrie, M., Al-Mhiqani, M.N., Alfakih, T., Alsalman, H., Uddin, M., Ullah, S.S., Dandoush, A.: Comparative evaluation of data imbalance addressing techniques for CNN-based insider threat detection. Sci Rep. 14, 24715 (2024). [CrossRef]
- Assessment of Dynamic Open-source Cross-site Scripting Filters for Web Application. KSII TIIS. 15, (2021). [CrossRef]
- Pramanick, N., Srivastava, S., Mathew, J., Agarwal, M.: Enhanced IDS Using BBA and SMOTE-ENN for Imbalanced Data for Cybersecurity. SN COMPUT. SCI. 5, 875 (2024). [CrossRef]
Figure 1.
Project Pipeline.
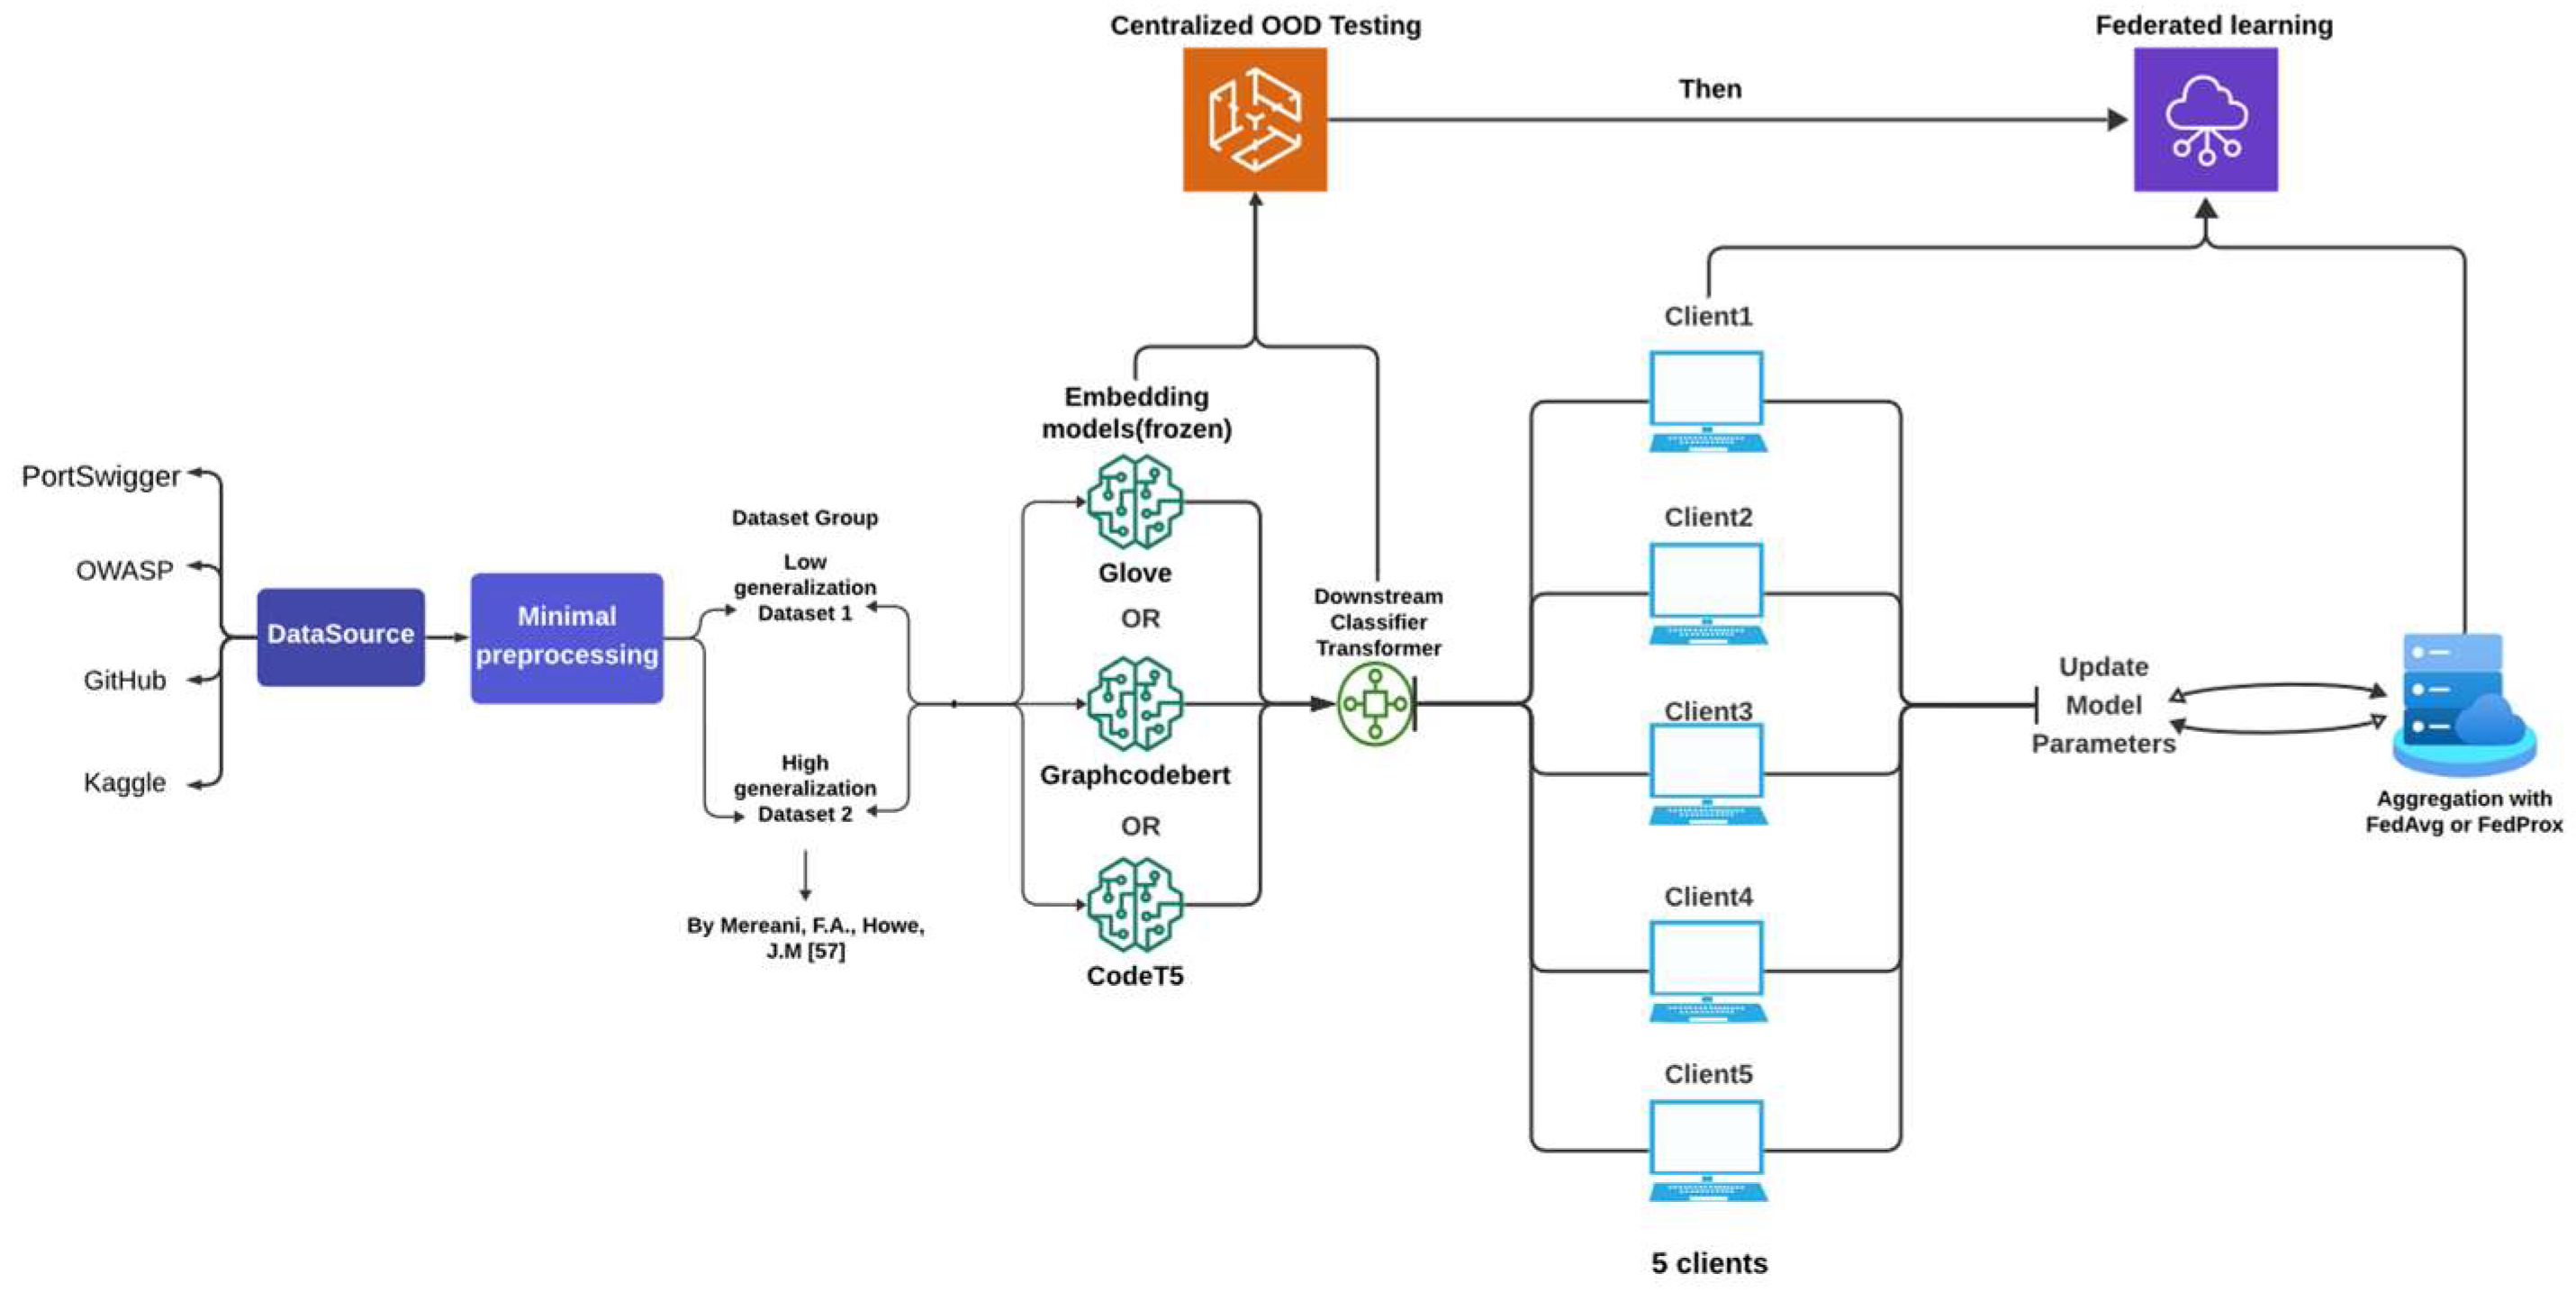
Figure 2.
Paper Logic flow.
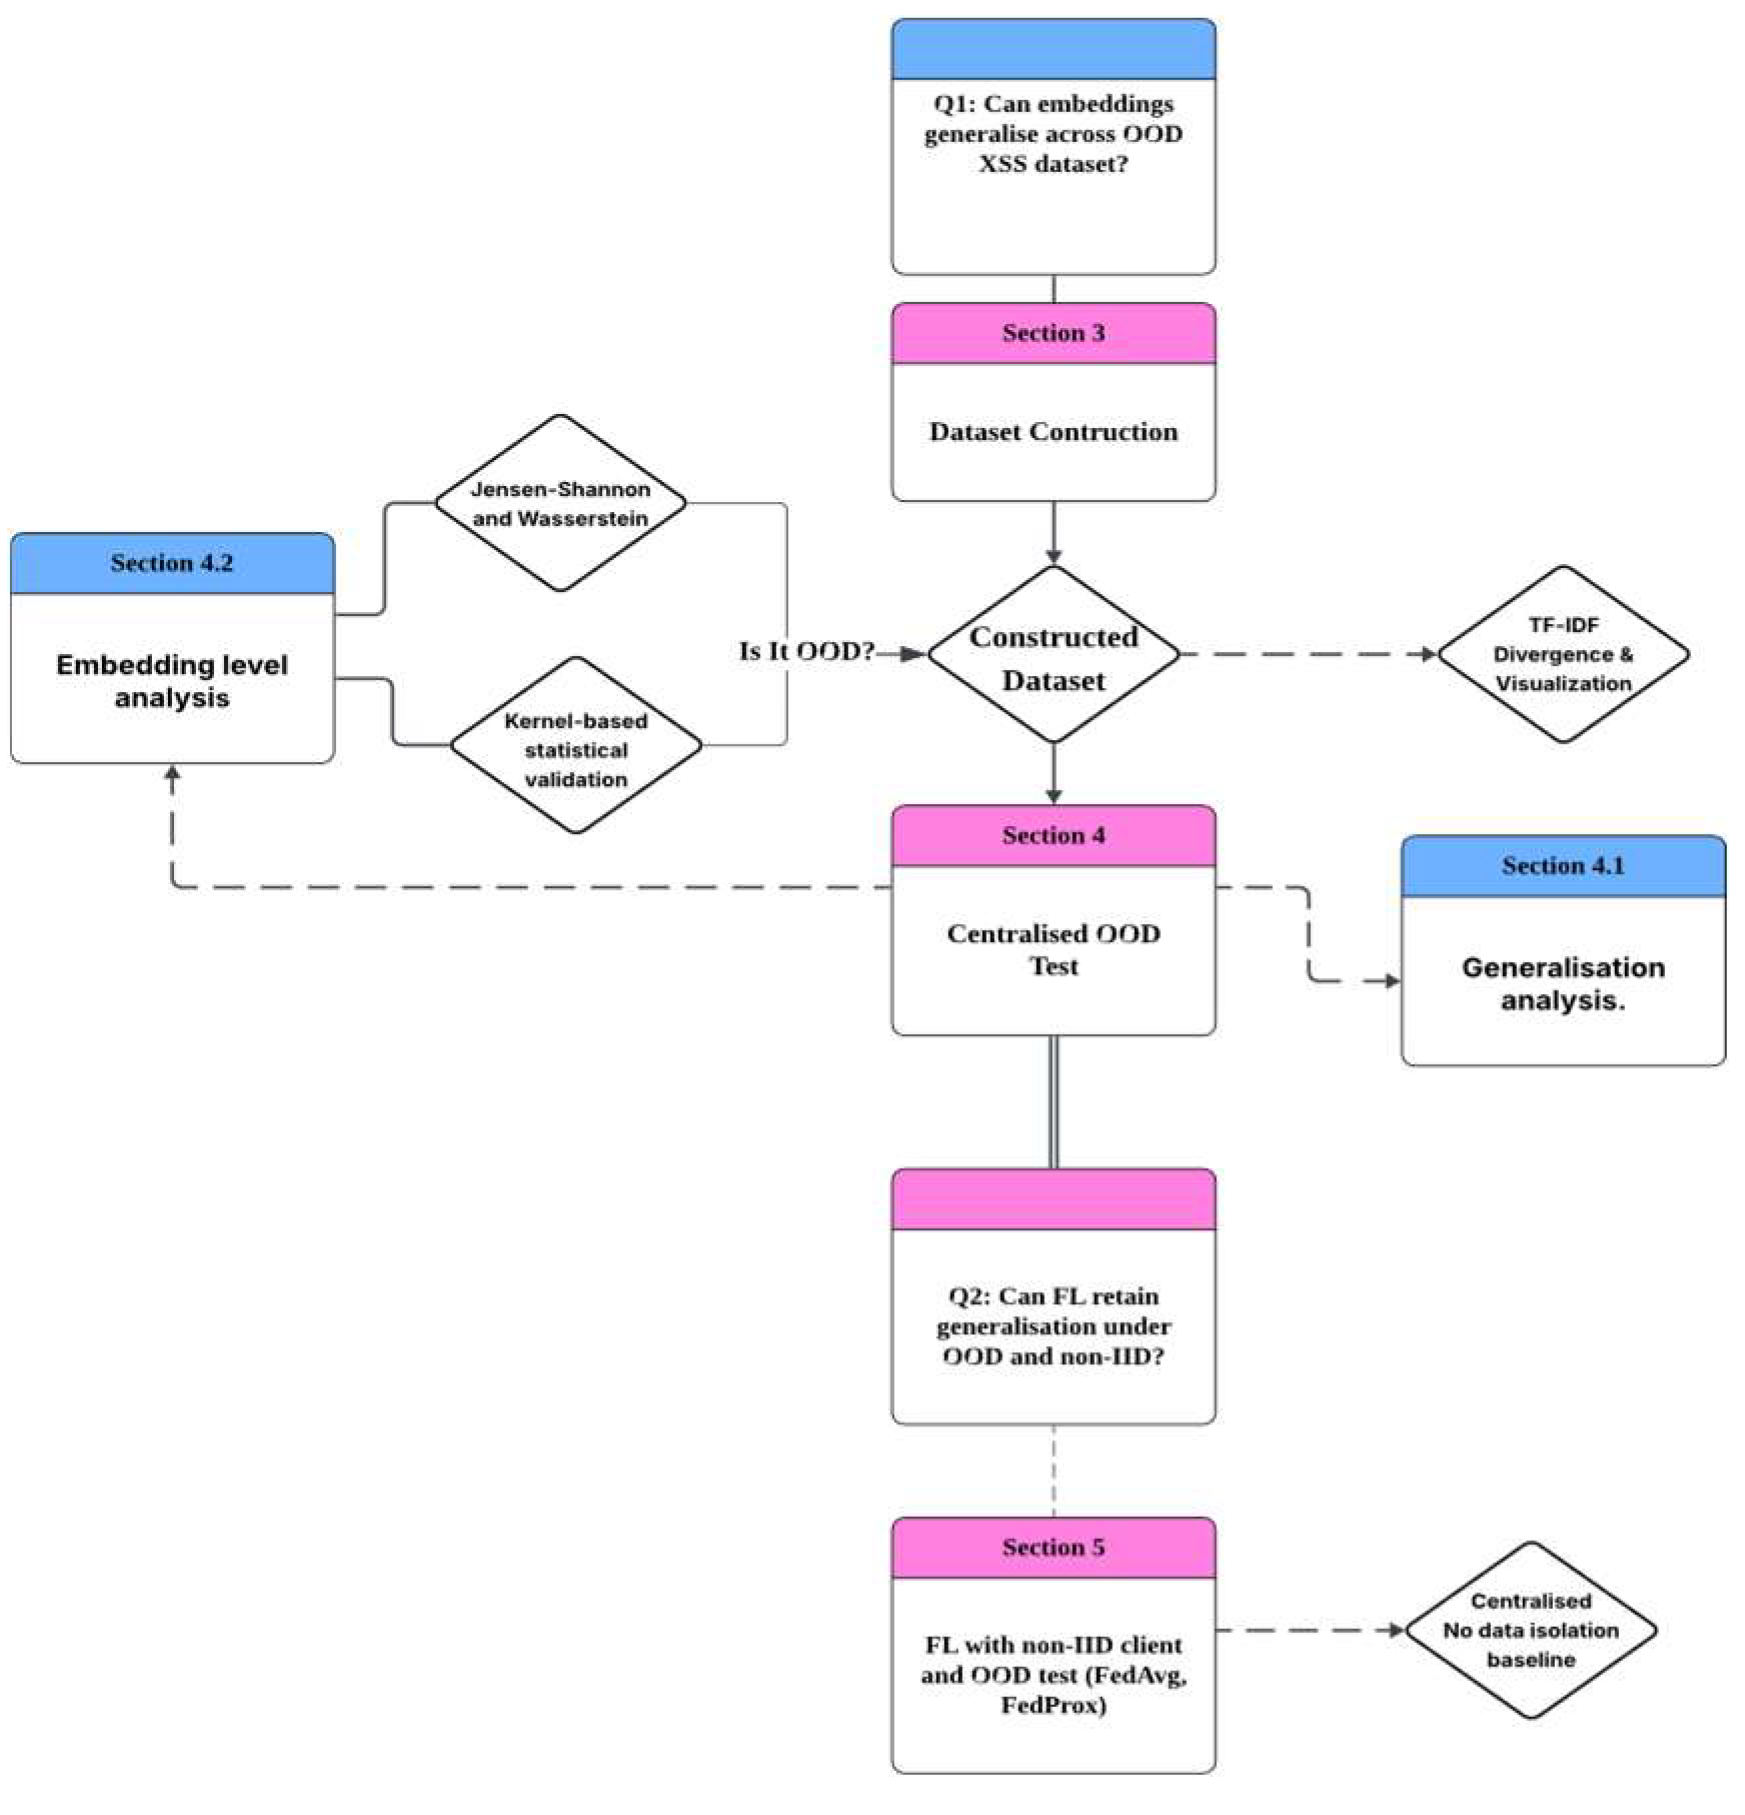
Figure 3.
UMAP of GraphcodeBERT’s embedding positive samples distributions between two datasets.
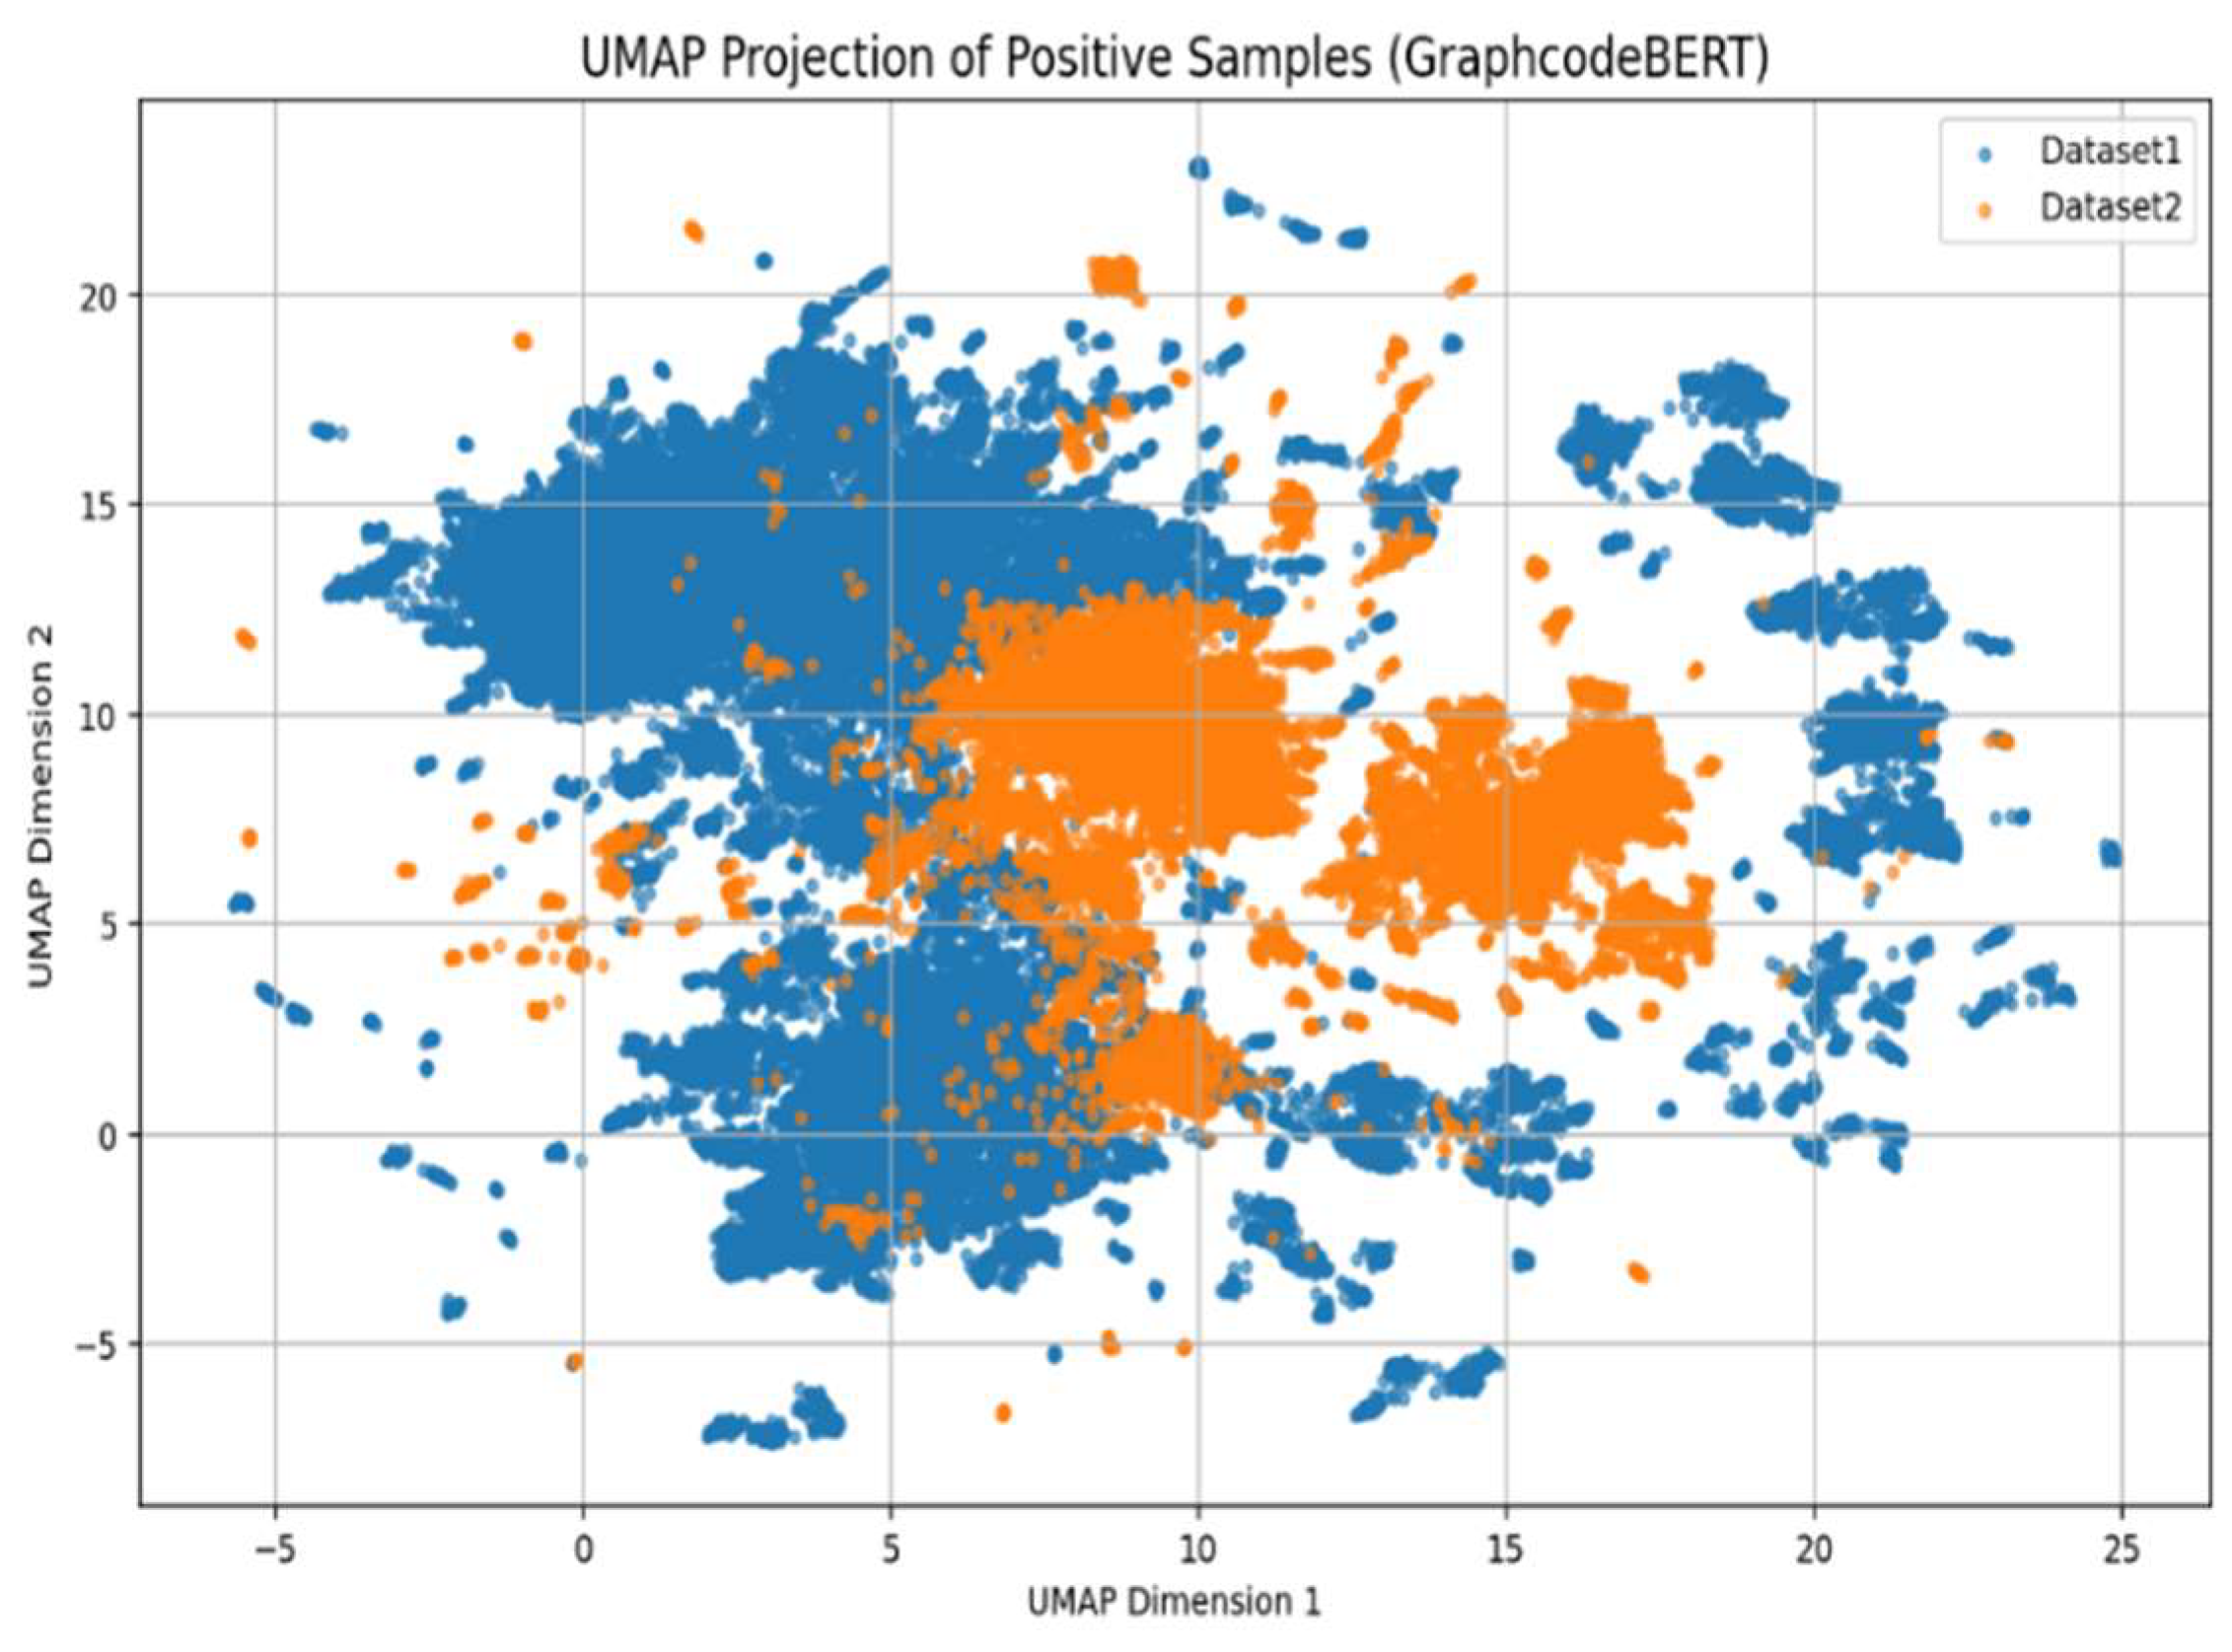
Figure 4.
Confusion matrices (per-class normalised, percentage) of the classifier trained on dataset 1.
Figure 4.
Confusion matrices (per-class normalised, percentage) of the classifier trained on dataset 1.
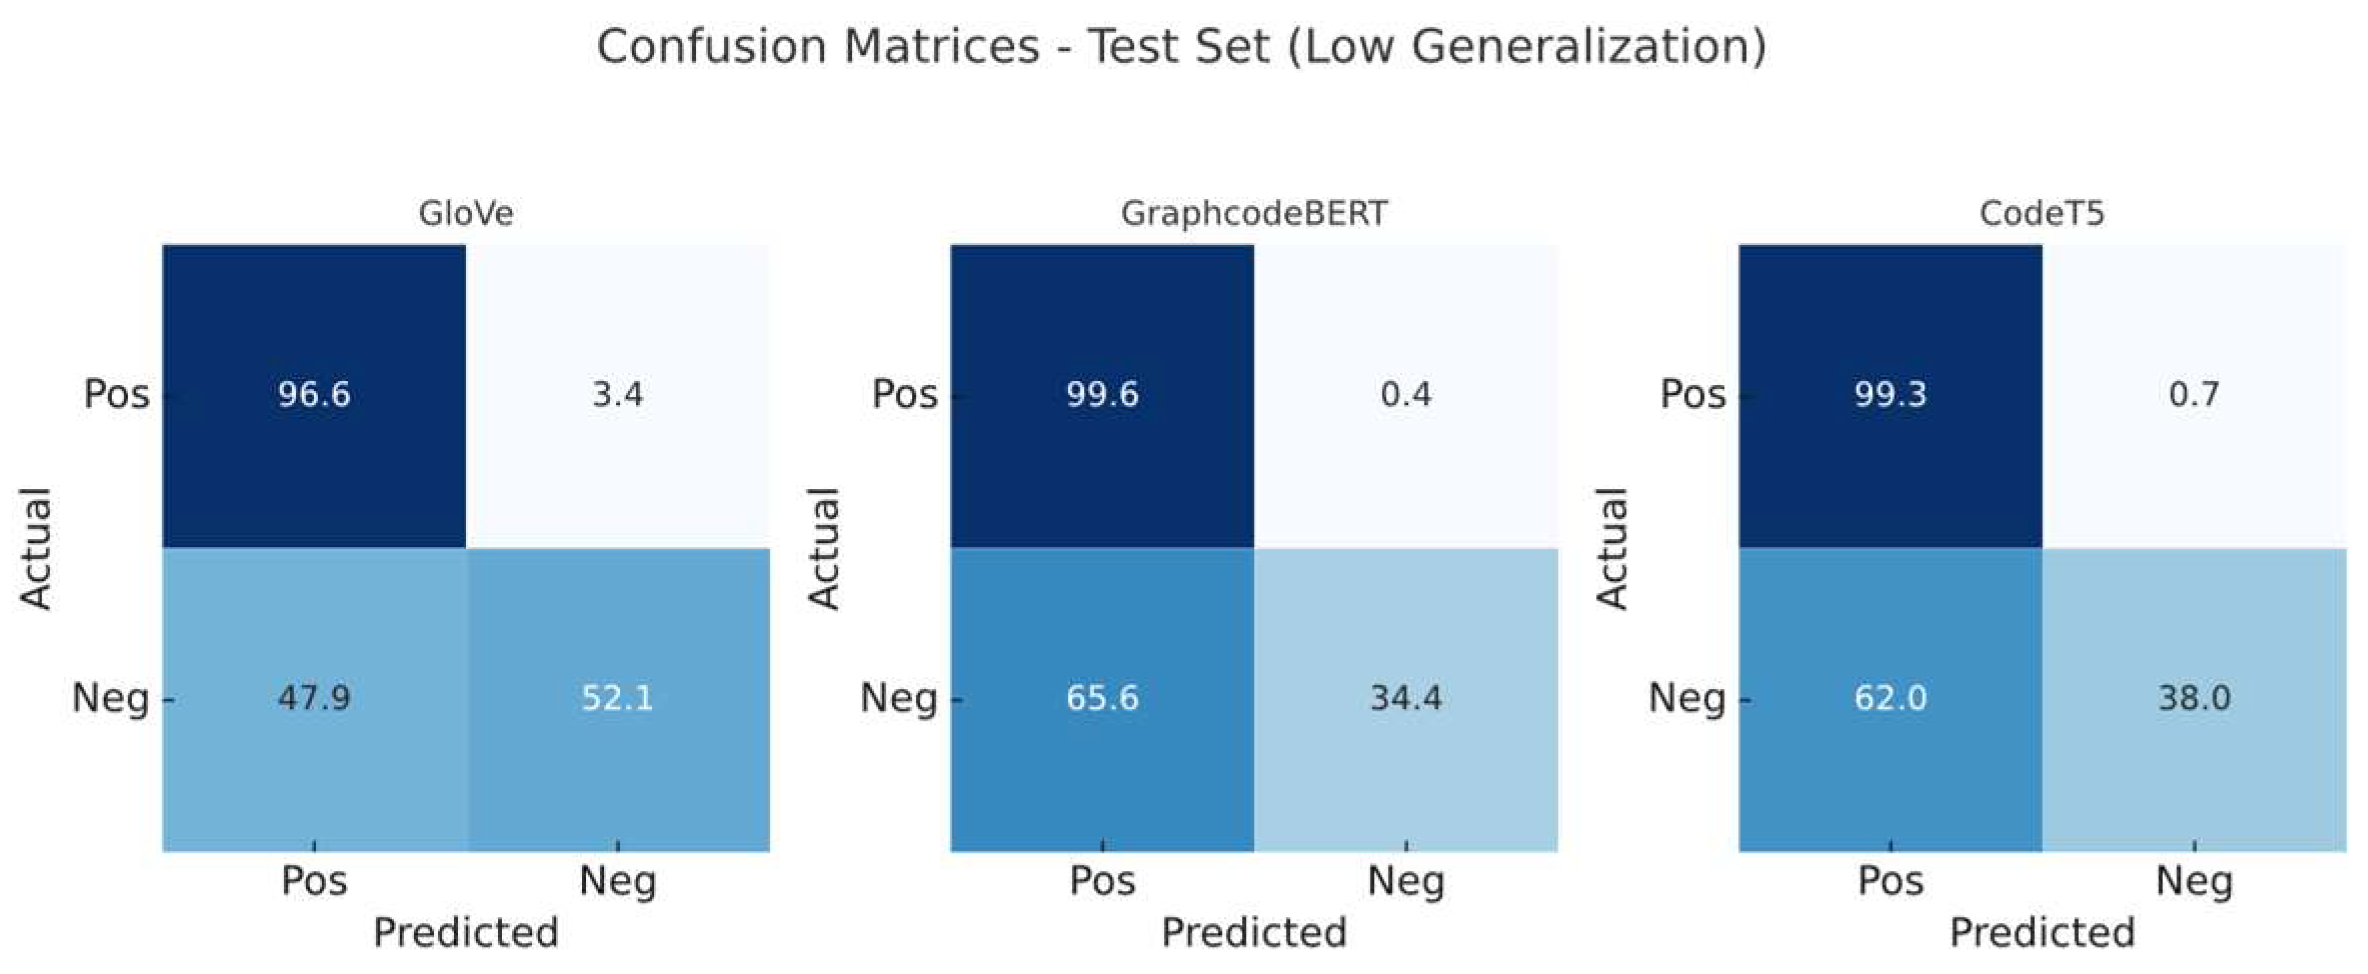
Figure 5.
Confusion matrices (per-class normalised, percentage) of the classifier trained on dataset 2.
Figure 5.
Confusion matrices (per-class normalised, percentage) of the classifier trained on dataset 2.
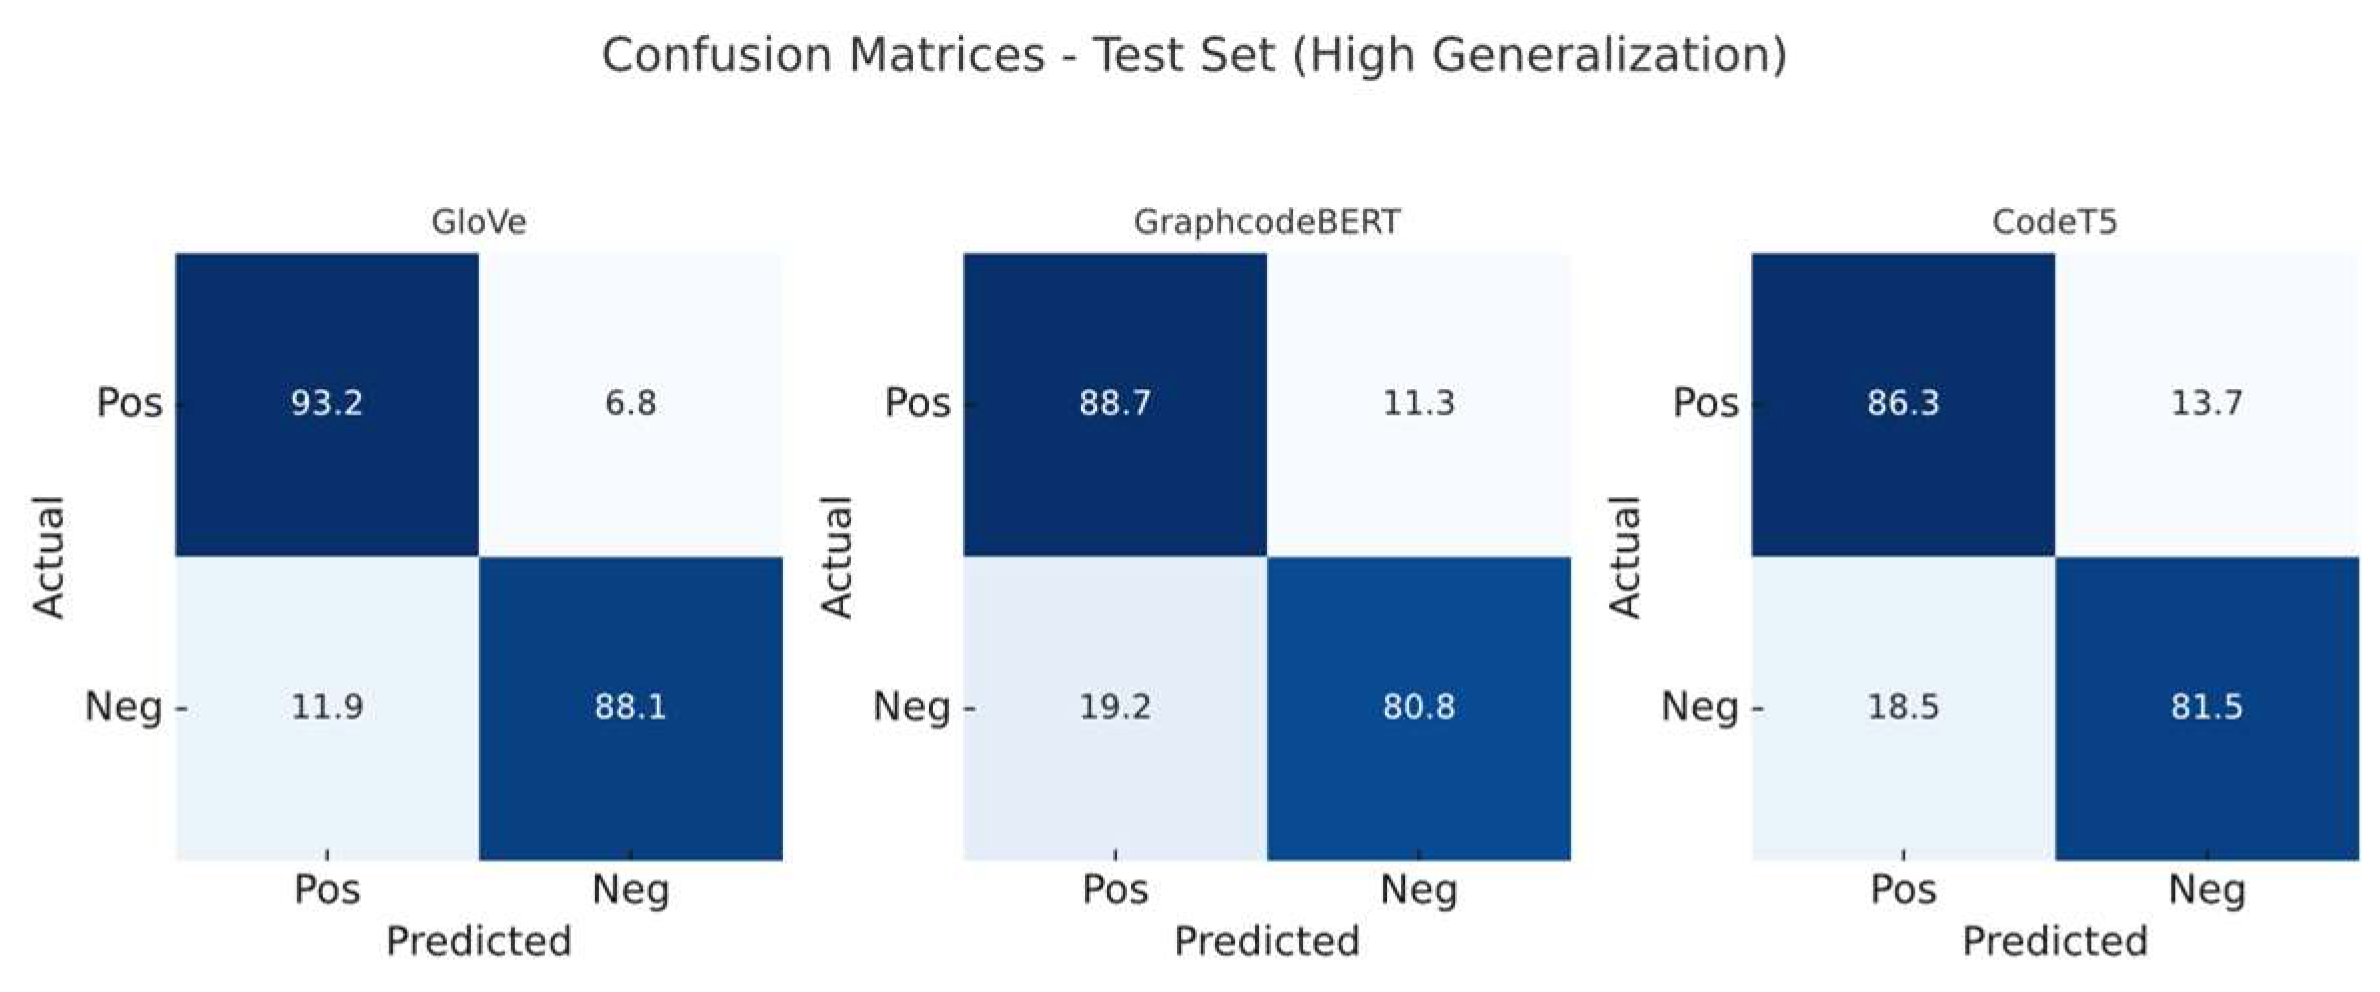
Figure 6.
Cross-Dataset Classification Performance across Embedding Models. (CT5 refers to CodeT5).
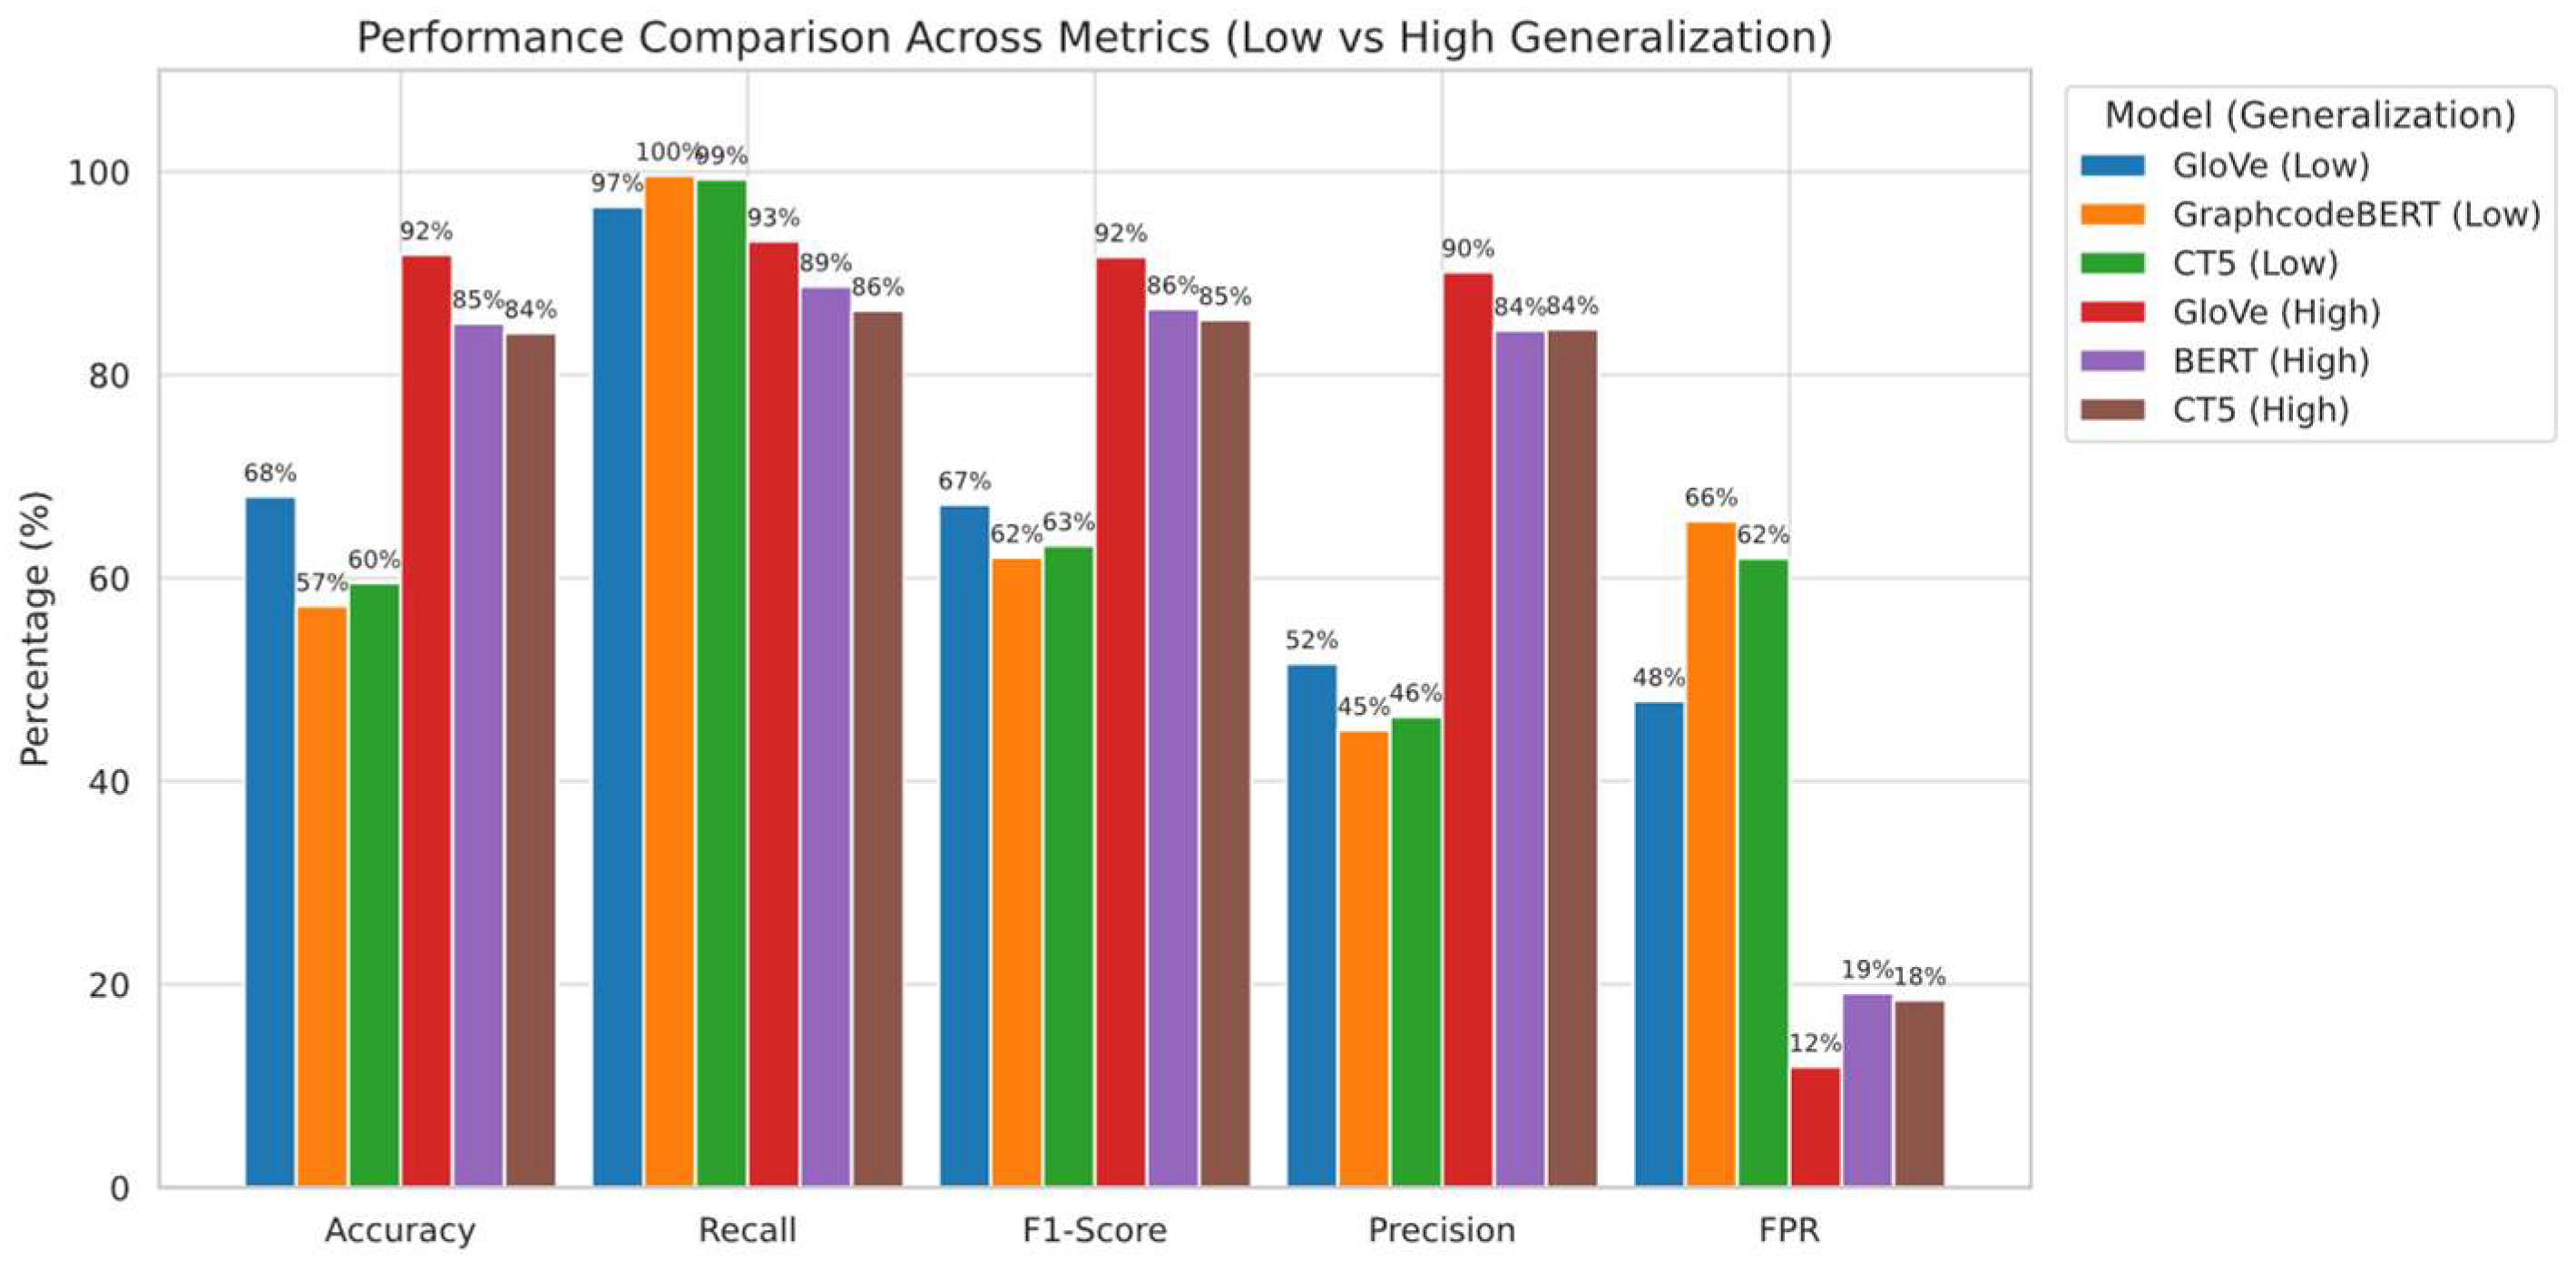
Figure 7.
Classifier’s performance change under OOD scenarios.
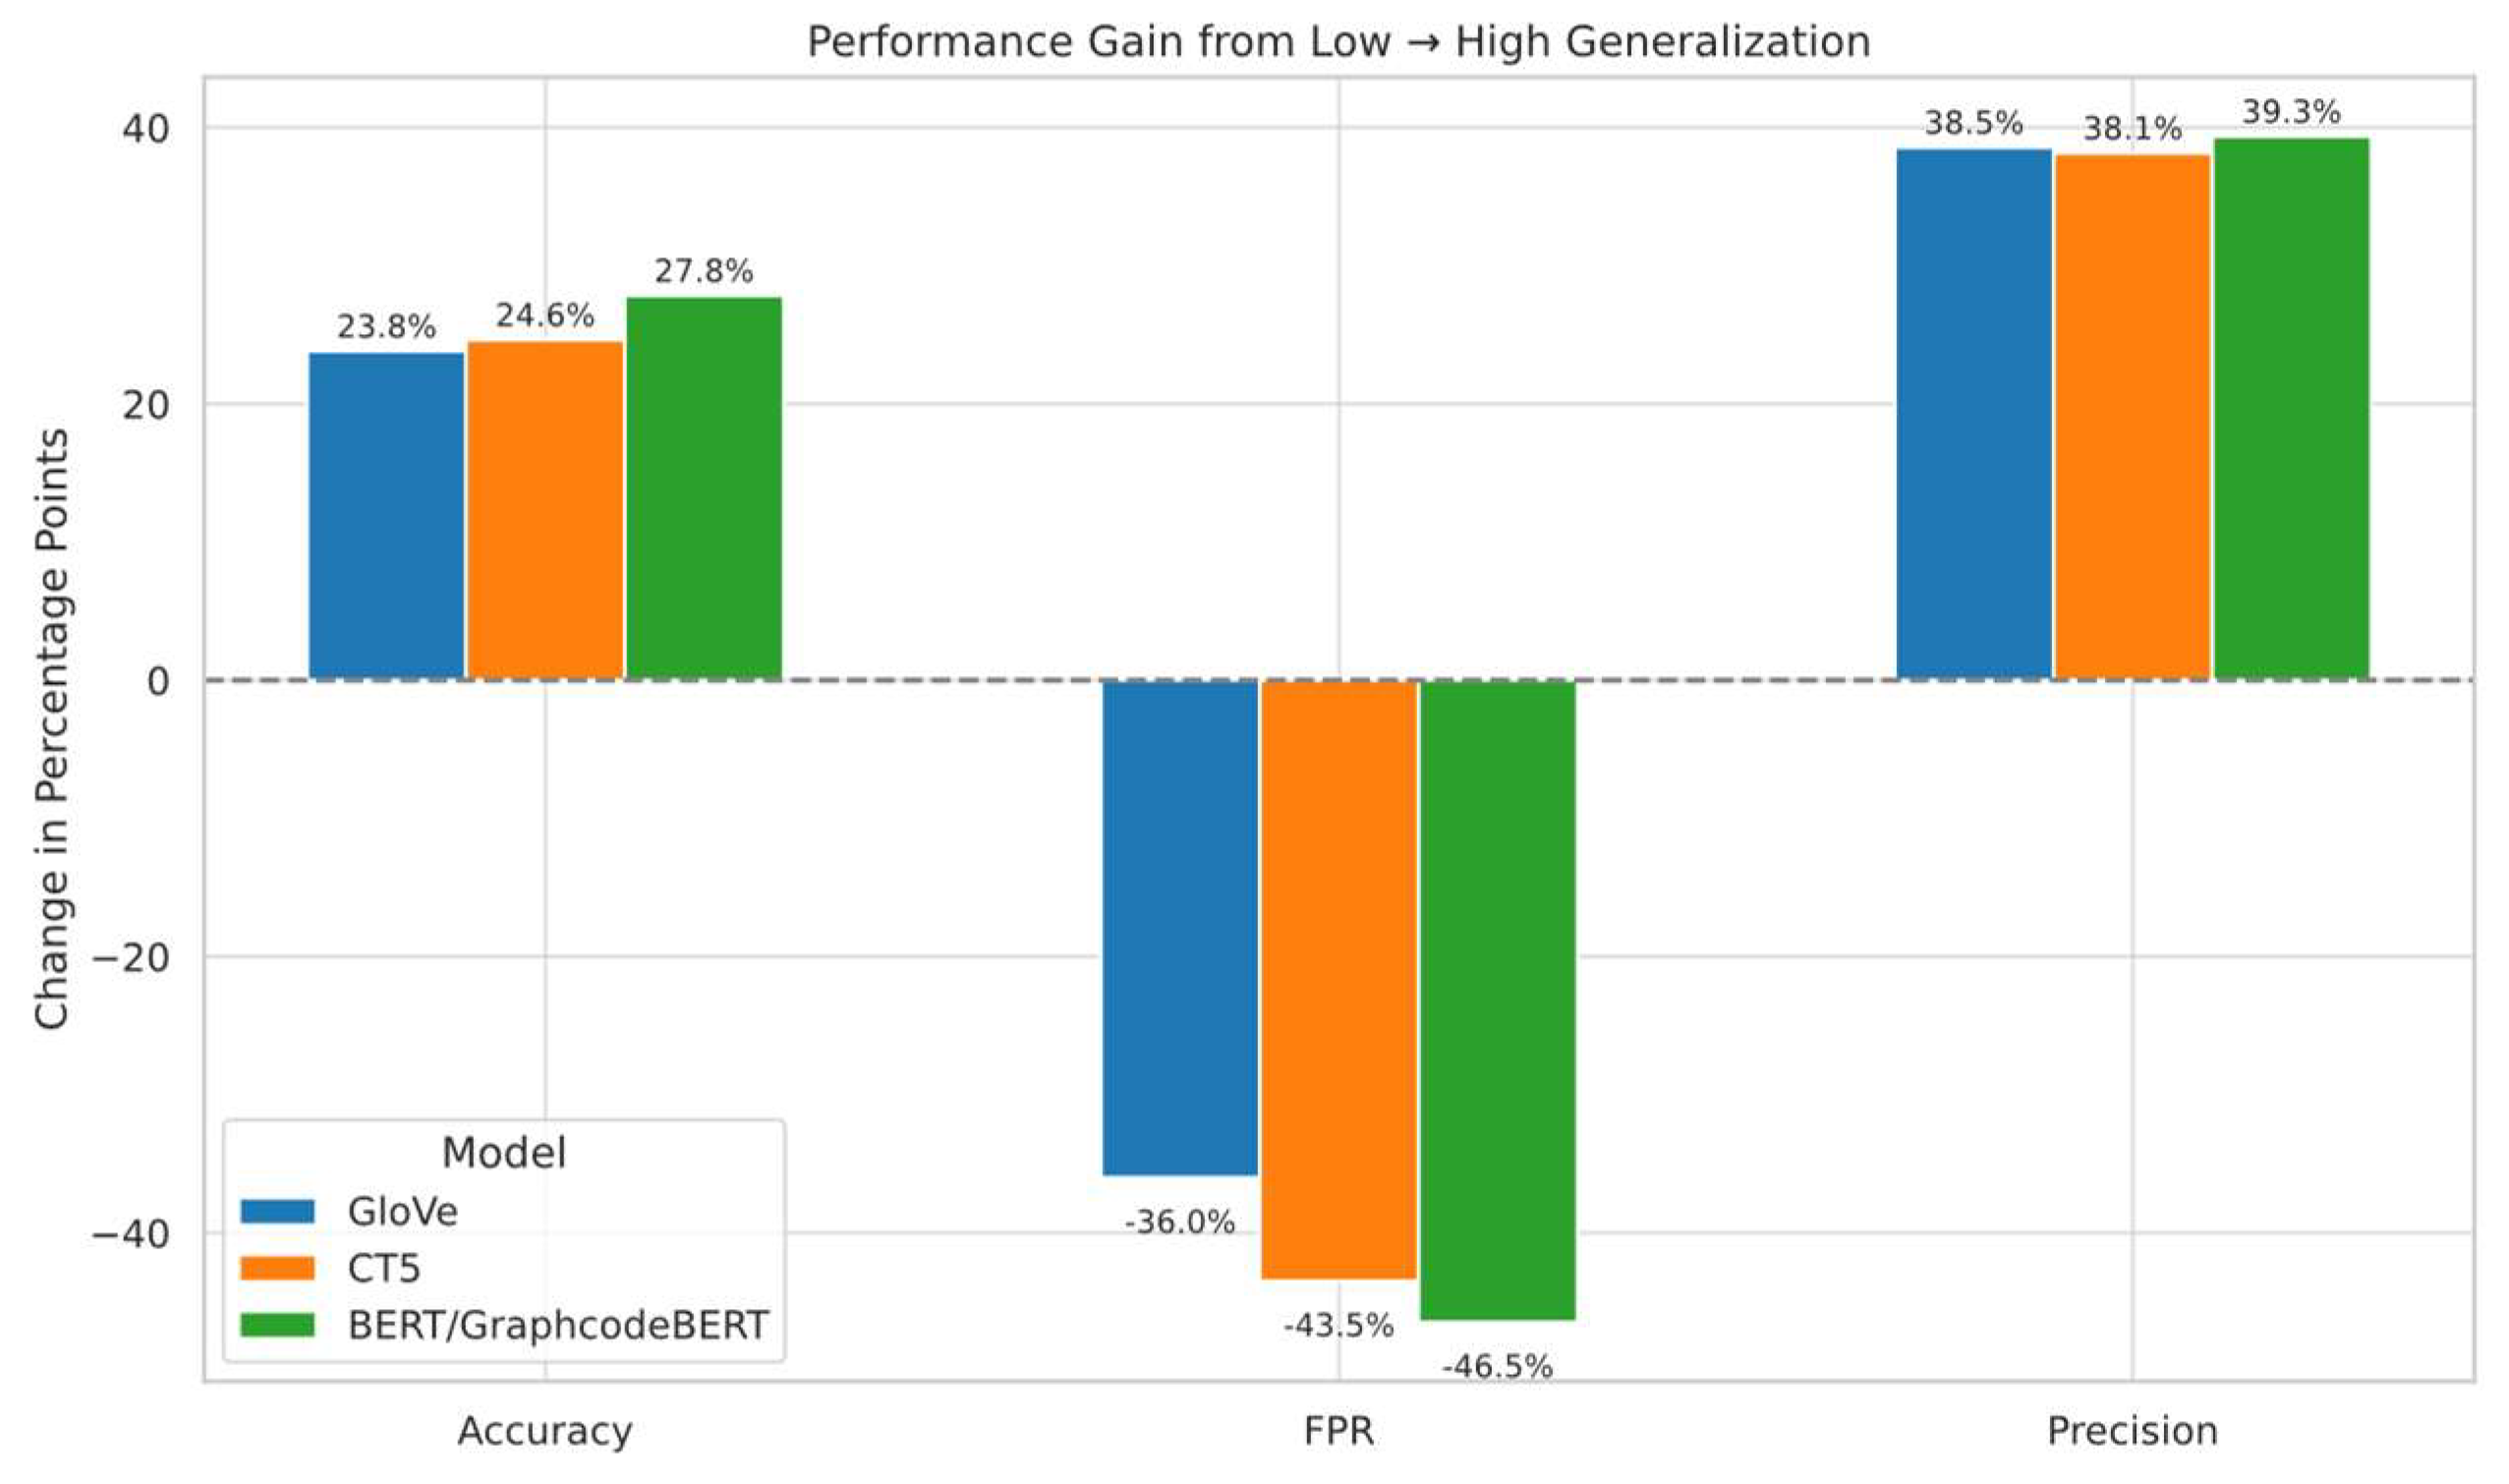
Figure 8.
Train data distribution strategy and sample numbers.

Figure 9.
Classifier convergence curve with GloVe-6b-300d embeddings under FedAvg and FedProx with learning rate, 0.001 or 0.005, aggregation rounds = 50 or 30.
Figure 9.
Classifier convergence curve with GloVe-6b-300d embeddings under FedAvg and FedProx with learning rate, 0.001 or 0.005, aggregation rounds = 50 or 30.

Figure 10.
Classifier convergence comparison under FedAvg and FedProx aggregation with different embedding models, aggregation rounds = 30, learning rate 0.005.
Figure 10.
Classifier convergence comparison under FedAvg and FedProx aggregation with different embedding models, aggregation rounds = 30, learning rate 0.005.
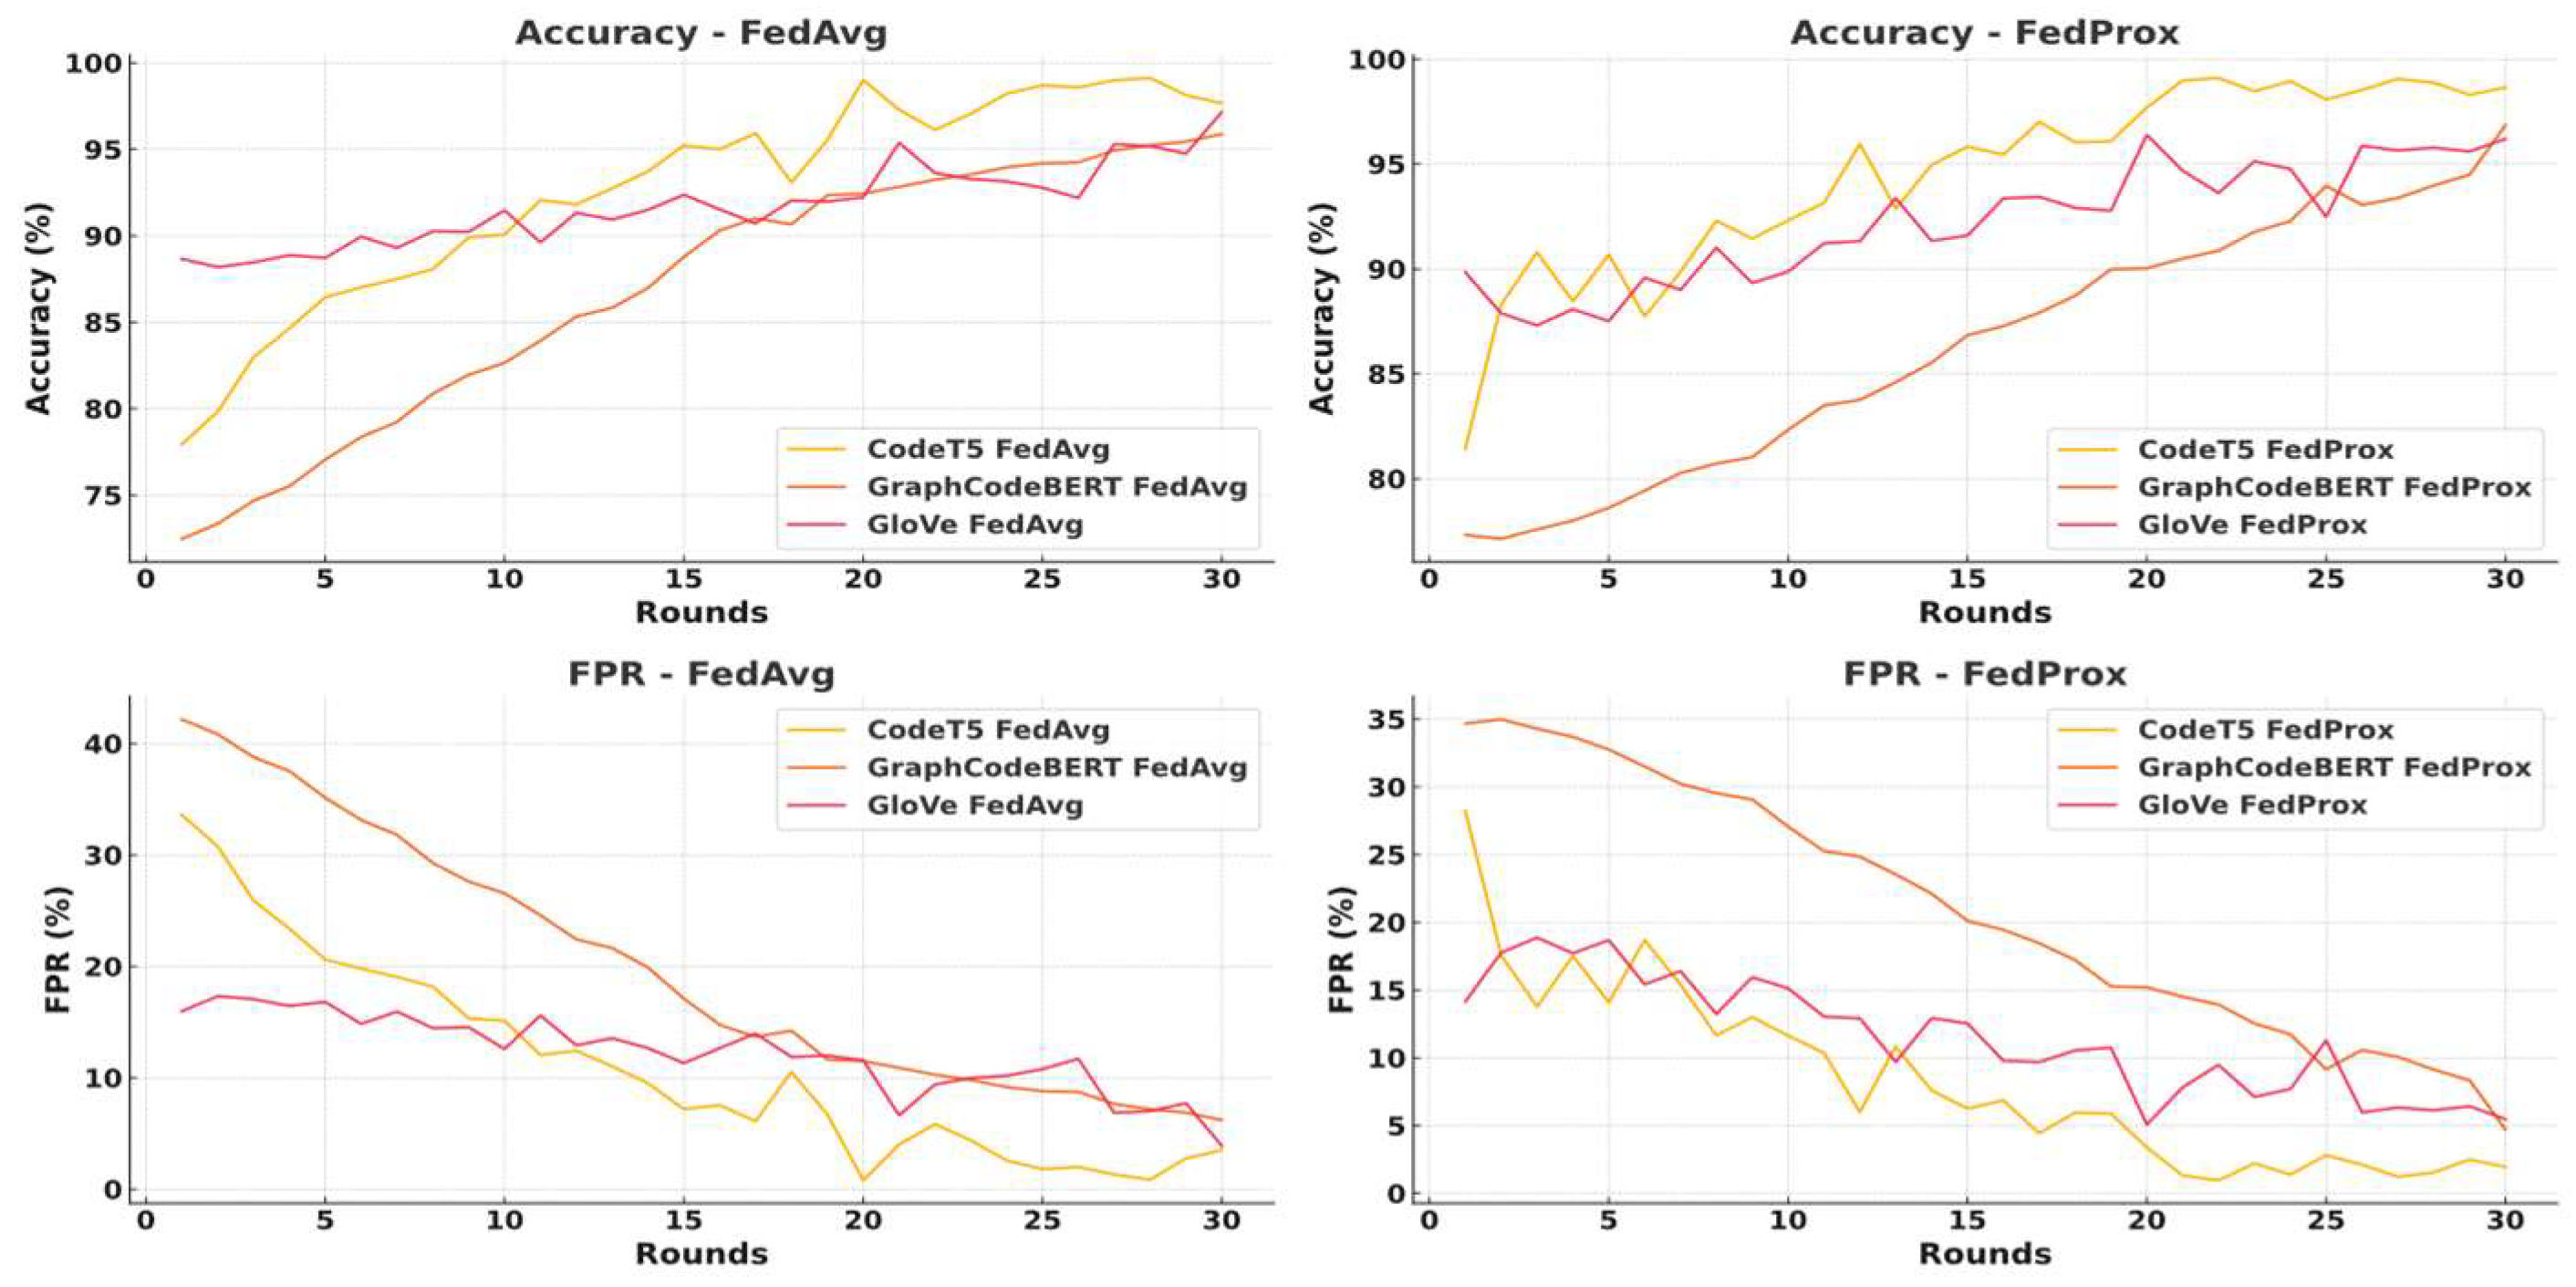
Figure 11.
Confusion matrices (per-class normalised, percentage) under centralised training without data isolation.
Figure 11.
Confusion matrices (per-class normalised, percentage) under centralised training without data isolation.
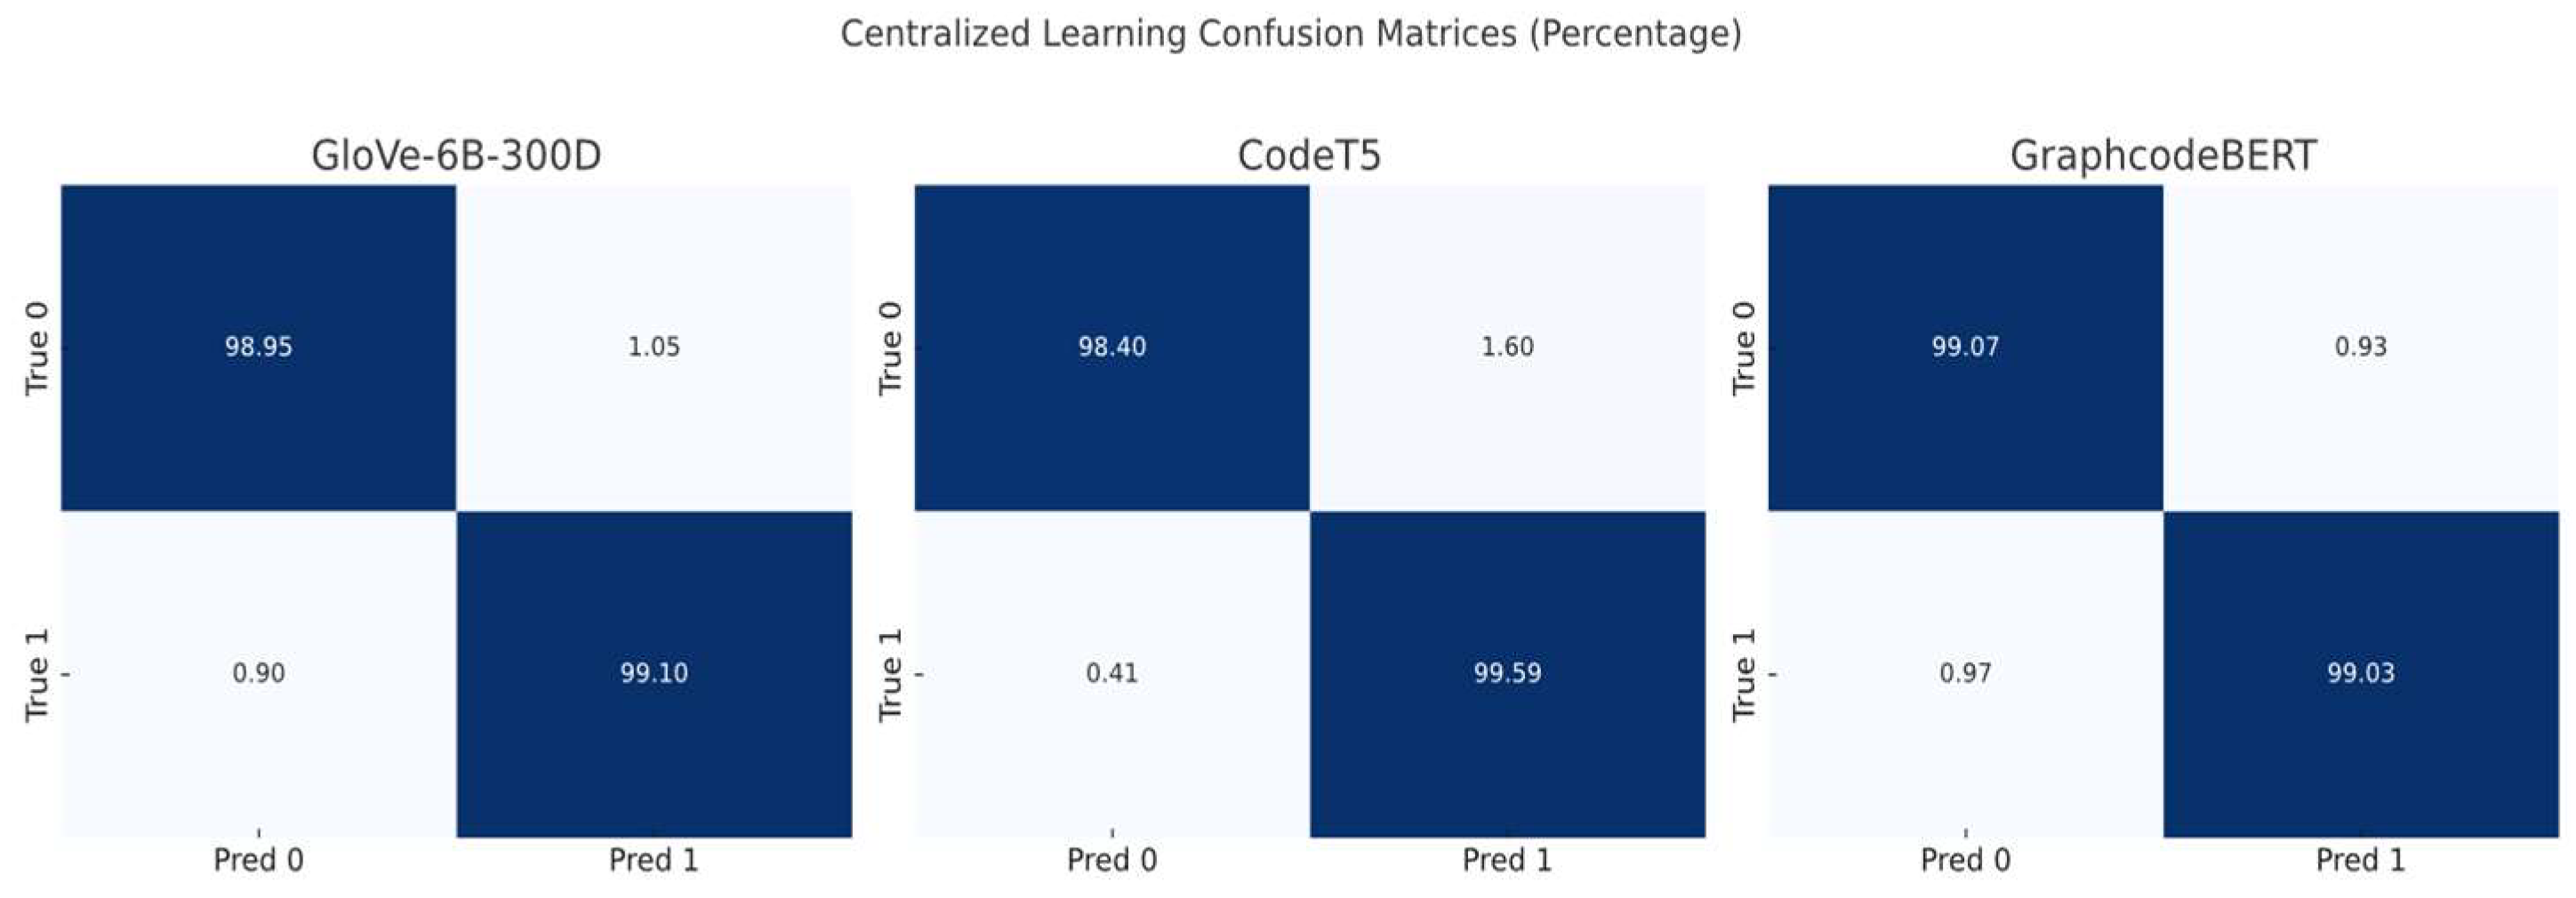
Figure 12.
A single client's best performance improvement comparison with different embedding models. The initial testing is the first round, and the final results are tested in 30 rounds.
Figure 12.
A single client's best performance improvement comparison with different embedding models. The initial testing is the first round, and the final results are tested in 30 rounds.
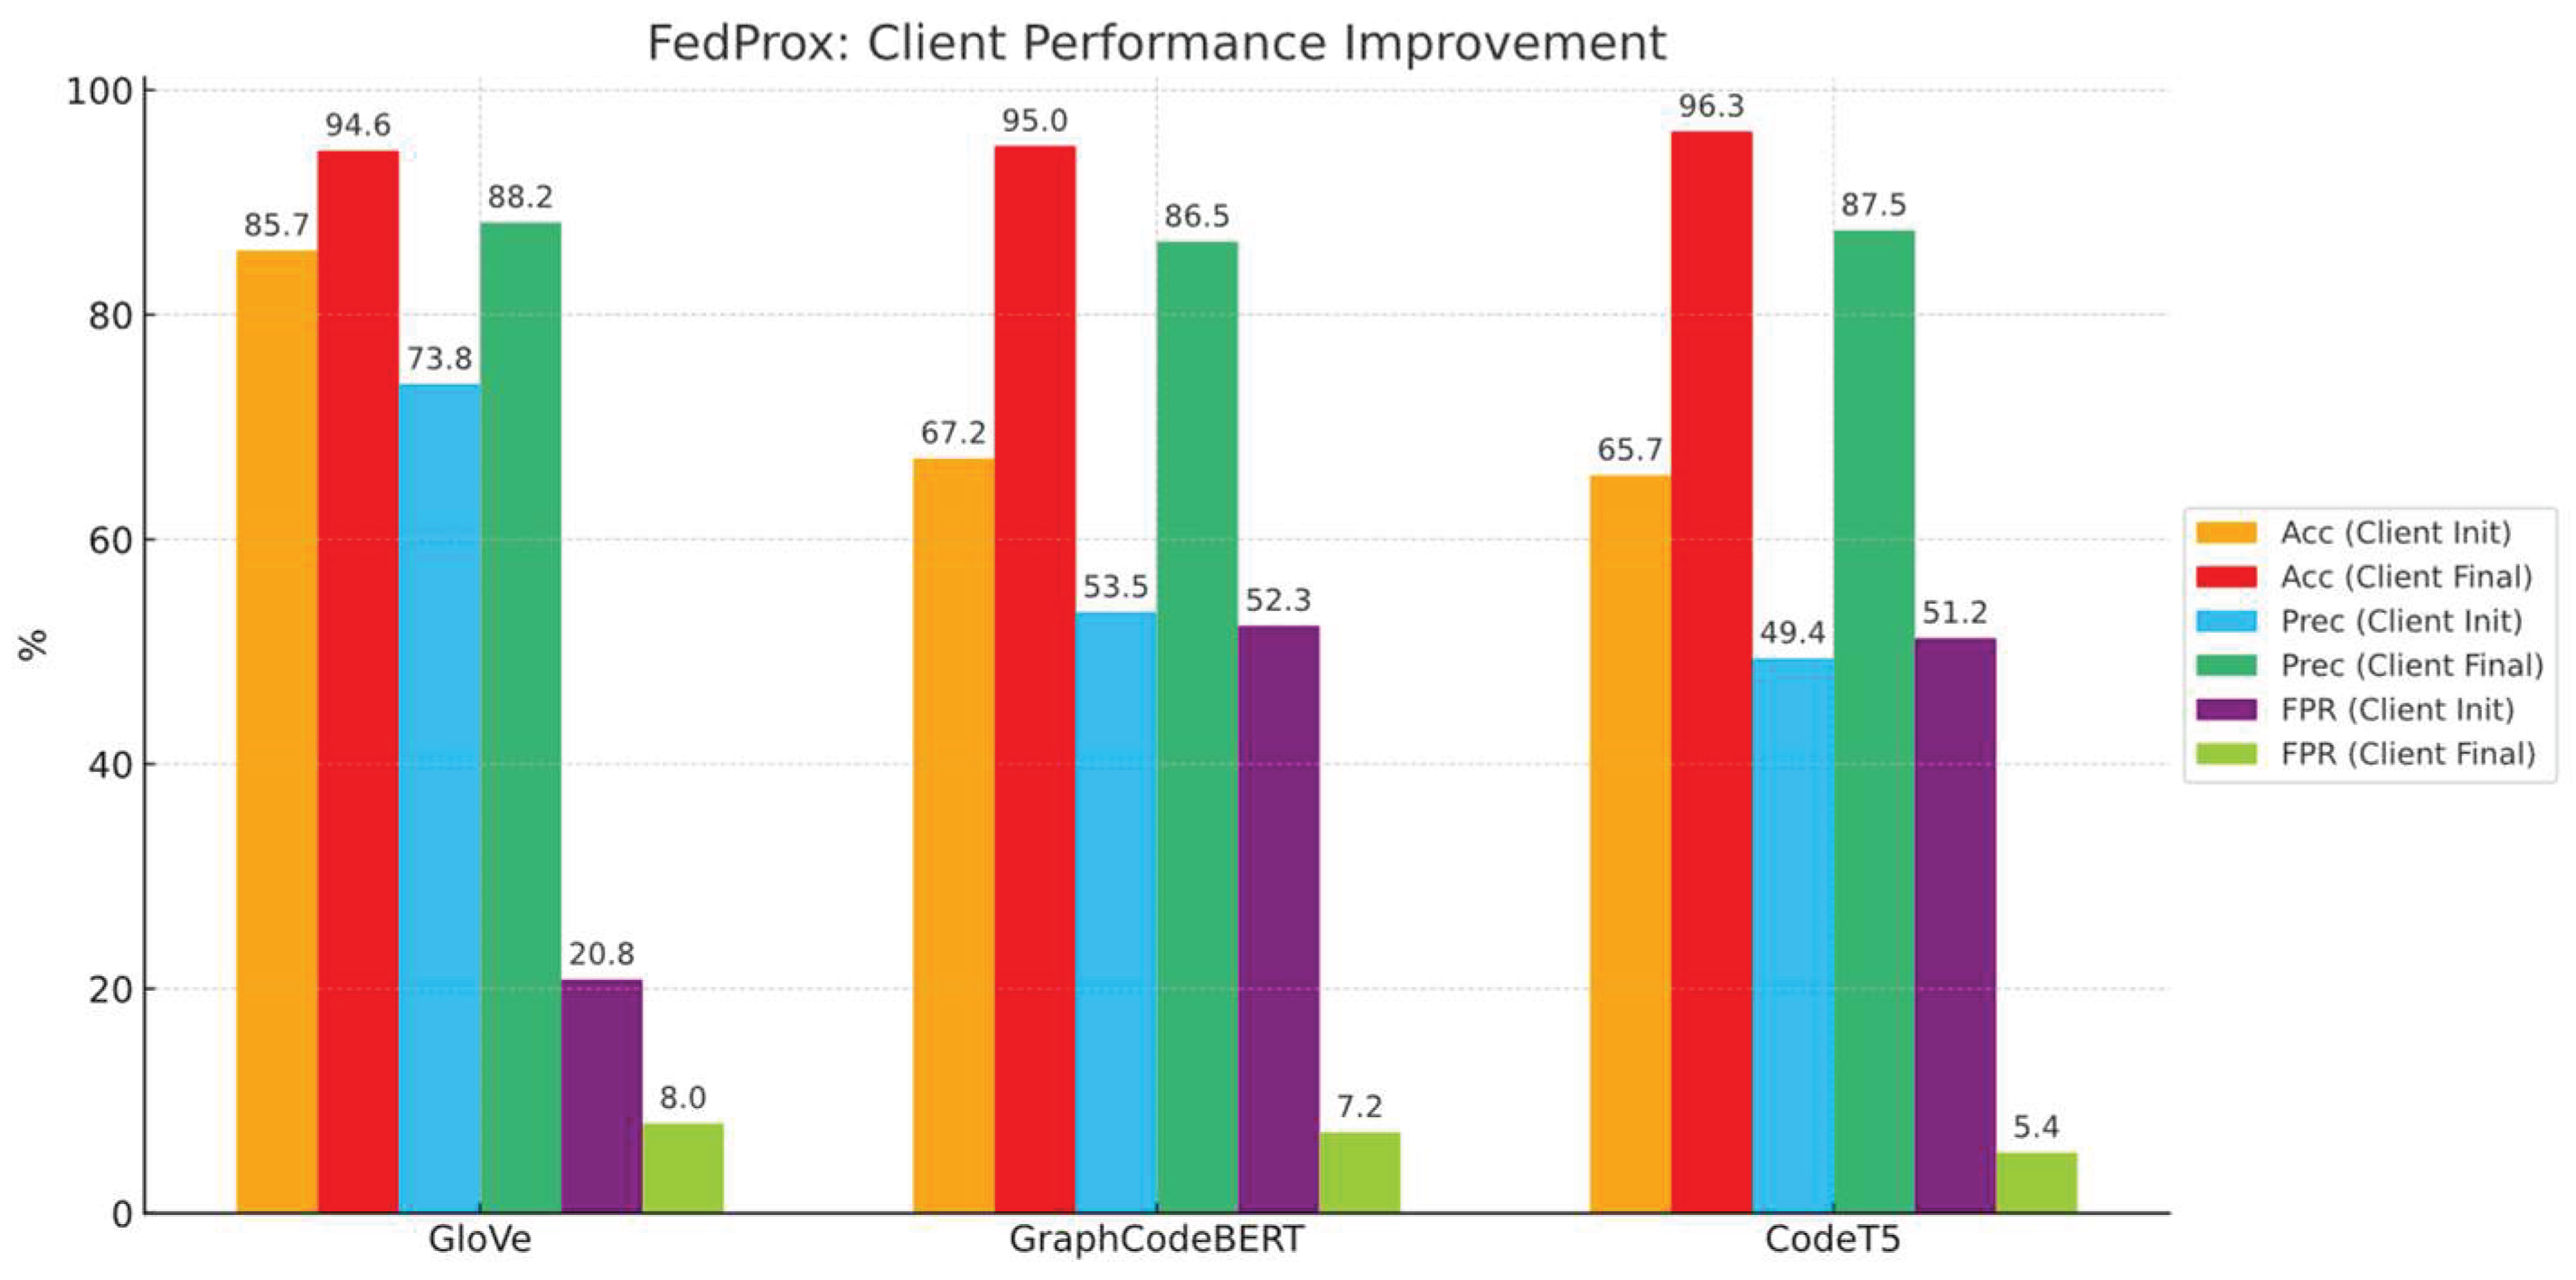

Table 1.
High-frequency pattern replacements.
| Function Name Examples | Rationale |
|---|---|
| Console.error | Outputs an error message to the console. |
| confirm | Displays a confirmation dialog asking the user to confirm an action. |
| prompt | Displays a prompt to input information. |
Table 2.
Quantitative feature-level analysis.
| Metrics | Baseline (IID) | Negative samples | Positive Samples |
|---|---|---|---|
| Top-100 TF-IDF | 70-90 | 20 ± 1 | 63 ± 1 |
| Jaccard similarity | 70-90% | 10.50% ± 1 | 45.98% ± 1 |
| cosine similarity | 0.85-0.95 | 0.2230 ± 0.01 | 0.4988 ± 0.01 |
Table 3.
Overfitting validation on same dataset.
| Embedding Model | Accuracy | FPR | Recall | Precision | Test Dataset Type |
|---|---|---|---|---|---|
| GloVe-6B-300d | 98.12±1% | 1.31±1% | 98.45±1% | 98.29±1% | 20% of Same dataset |
| CodeT5 | 98.30±1% | 2.21±2% | 98.31±1% | 98.16±1% | 20% of Same dataset |
| GraphcodeBERT | 99.24±0.5% | 0.87±2% | 99.40±0.5% | 99.02±0.5% | 20% of Same dataset |
Table 4.
Exchanged positive samples in dataset 2 (As a test dataset) performance comparison.
| Embedding Model | Accuracy | FPR | Precision | Recall | Positive Sample |
|---|---|---|---|---|---|
| GraphcodeBERT | 56.80% | 66.22% | 44.82% | 99.69% | Dataset 1 |
| 71.57% | 68.19% | 68.39% | 99.70% | Dataset 2 |
Table 5.
Regurgitation of two embedding model, downstream Average (5times) performance comparison.
| Embedding Model | Accuracy | Recall | Precision | FPR | Classifier Hyperparameters |
| GloVe-6B-300d | 65.84% | 98.53% | 50.65% | 51.79% | Lr = 0.005, drop out = 0.1 |
| 69.31% | 98.08% | 53.38% | 46.21% | Lr = 0.001, drop out = 0.1 | |
| 79.00% | 94.74% | 63.41% | 29.49% | Lr = 0.001, drop out = 0.5 | |
| GraphcodeBERT | 56.80% | 99.69% | 44.82% | 66.22% | Lr = 0.001, drop out = 0.1 |
| 57.25% | 99.63% | 45.03% | 65.24% | Lr = 0.0005, drop out = 0.3 | |
| CodeT5 | 59.50% | 99.26% | 46.36% | 61.95% | Lr = 0.001, drop out = 0.1 |
| 66.42% | 97.86% | 51.09% | 51.06% | Lr = 0.0005, drop out = 0.3 |
Table 6.
Jensen-Shannon and Wasserstein divergence between Dataset 1 and Dataset 2 across different embedding models.
Table 6.
Jensen-Shannon and Wasserstein divergence between Dataset 1 and Dataset 2 across different embedding models.
| Comparison | JSD | WD |
|---|---|---|
| GraphCodeBERT | 0.2444 | 0.0758 |
| GloVe | 0.3402 | 0.0562 |
| CodeT5 | 0.3008 | 0.0237 |
Table 7.
Global Classifier’s performance records under FedProx with different embedding models after 30 rounds of aggregation.
Table 7.
Global Classifier’s performance records under FedProx with different embedding models after 30 rounds of aggregation.
| Embedding Model | Accuracy | FPR | Precision | Recall | F-1 |
| GraphcodeBERT | 99.92 / 95.02% | 0.69 / 6.76% | 99.94 / 86.48% | 99.94 / 99.49% | 99.94 / 92.86% |
| GloVe-6b-300d | 98.63 / 94.06% | 1.35 / 9.69% | 99.69 / 86.84% | 99.61 / 98.87% | 99.65 / 93.25% |
| Code T5 | 99.64 / 96.13% | 0.31 / 3.19% | 99.70 / 94.48% | 99.74 / 99.04% | 99.04 / 96.77% |
Table 8.
No data isolation scenario: Classifier performance results.
| Embedding model | Accuracy | FPR | Precision | Recall | F1-Score |
|---|---|---|---|---|---|
| GloVe-6B-300d | 99.01%±1.2 | 1.05%±1.4 | 98.56%±1.5 | 99.10%±1.5 | 98.83%±1.1 |
| CodeT5 | 98.90%±0.5 | 1.60%±1.1 | 97.83%±0.5 | 99.59%±0.3 | 98.70%±1.4 |
| GraphcodeBERT | 99.05%±0.7 | 0.93%±1.2 | 98.72%±1.5 | 99.03%±0.5 | 98.87%±1.2 |
Disclaimer/Publisher’s Note: The statements, opinions and data contained in all publications are solely those of the individual author(s) and contributor(s) and not of MDPI and/or the editor(s). MDPI and/or the editor(s) disclaim responsibility for any injury to people or property resulting from any ideas, methods, instructions or products referred to in the content. |
© 2025 by the authors. Licensee MDPI, Basel, Switzerland. This article is an open access article distributed under the terms and conditions of the Creative Commons Attribution (CC BY) license (http://creativecommons.org/licenses/by/4.0/).
Copyright: This open access article is published under a Creative Commons CC BY 4.0 license, which permit the free download, distribution, and reuse, provided that the author and preprint are cited in any reuse.


