Submitted:
06 May 2025
Posted:
07 May 2025
You are already at the latest version
Abstract
Under the "Dual Carbon Goals" (Carbon Peaking and Carbon Neutrality), the acceler-ated global transition towards green and low-carbon development has become an ir-reversible trend. As a key carbon-emitting sector in China, the transportation industry accounts for approximately 10% of the nation's total carbon emissions. Transportation decarbonization is therefore critical not only for addressing global climate change challenges and fulfilling international emission reduction commitments, but also for driving the industry's green transformation, optimizing energy structures, enhancing public livelihood and ecological environment quality, and ultimately achieving sus-tainable development. Taking Chengdu as a case study, this paper systematically: (1) objectively summarizes the current status and achievements of green development in Chengdu's transportation sector; (2) identifies bottlenecks hindering its green transi-tion; (3) calculates carbon emissions across various transport modes in recent years to identify key influencing factors; and (4) proposes targeted strategies to establish Chengdu as a national pioneer in developing innovative "dual carbon" pathways for transportation. The findings aim to provide decision-making support for building a low-carbon transportation system that aligns with Chengdu's megacity development goals.
Keywords:
carbon emission
; low-carbon transport
; urban transport
; transport structure
1. Introduction
Facing the severe challenges posed by global climate change, reducing greenhouse gas (GHG) emissions and achieving green, low-carbon development have become a global consensus [1]. As the world's largest developing country and carbon emitter, China recognizes its critical responsibility in addressing climate change [2]. To promote global low-carbon transition, protect the ecological environment, and realize sustainable development, China has proactively committed to the "Dual Carbon Goals" of carbon peaking and carbon neutrality [3-4]. The establishment of these goals not only demonstrates China's firm resolve to tackle climate change but also reflects its willingness to collaborate with the international community in building a future of harmonious coexistence between humanity and nature. Through the implementation of the Dual Carbon Strategy, China will lead domestic energy structure optimization, drive industrial green upgrading, and contribute Chinese wisdom and solutions to global climate governance [5-6].In December 2024, the Climate Change Response Report (2024) (hereinafter referred to as the Report), jointly compiled by the Chinese Academy of Social Sciences and the China Meteorological Administration, was released in Beijing. The Report indicates that, under the carbon neutrality target, the global trend toward accelerated green and low-carbon transition is irreversible. The transportation sector, as one of the foundational pillars for economic and social prosperity, stability, and sustainable development, plays a crucial role in national long-term strategies under the Dual Carbon Goals by reducing air pollutants and CO₂ emissions while advancing green and low-carbon development [7-9]. Therefore, it is imperative to conduct carbon emission accounting and analysis for the transportation sector and systematically explore optimization pathways for emission reduction, thereby facilitating the industry's transition toward sustainable and low-carbon development.
Chengdu is currently spearheading its development under the guiding principle of building a demonstration zone for park cities that fully embodies the new development philosophy. With a focus on synergistic pollution reduction and carbon mitigation in the transportation sector, the city is actively advancing the green and low-carbon transformation of its transport structure [10-12]. Both the "Decision of the CPC Chengdu Municipal Committee on Optimizing Spatial, Industrial, Transportation and Energy Structures to Promote Urban Green and Low-carbon Development with the Goal of Achieving Carbon Peak and Carbon Neutrality" adopted at the 10th Plenary Session of the 13th Chengdu Municipal Party Committee [13], and the 14th Chengdu Municipal Party Congress explicitly proposed to coordinate and promote the optimization and adjustment of "four major structures" (space, industry, transportation, and energy) guided by the carbon peak and carbon neutrality goals, thereby facilitating urban green and low-carbon development.To actively implement these directives and promote transportation structure optimization as part of the "four major structures" adjustment, the municipal government has issued the "Chengdu Action Plan for Optimizing Transportation Structure to Promote Urban Green and Low-carbon Development" and the "Chengdu Policy Measures for Optimizing Transportation Structure to Promote Urban Green and Low-carbon Development" [14]. These documents clearly outline four key tasks: "promoting green travel, optimizing freight structure, promoting new energy vehicles, and advancing green smart transportation infrastructure construction." Since the implementation of these policies, Chengdu has achieved certain results in green transportation development. However, the current challenges remain daunting, with significant gaps compared to national requirements, leading cities, and the city's own targets. Persistent pain points and difficulties remain prominent and wide-ranging [15-16].Therefore, it is imperative to further focus on the key tasks and challenges of Chengdu's green transportation development. By employing scientific methods to account for the city's transportation carbon emission pathways, systematically analyze influencing factors, and propose targeted countermeasures and suggestions for the next steps in green transportation development under the Dual Carbon Goals, we can effectively promote the green and low-carbon transformation of the transportation sector.
2. Materials and Methods
2.1. Model Selection
The term "transportation carbon emissions" [17-18] specifically refers to emissions generated by mobile sources (i.e., vehicles), while stationary sources within the transportation sector—such as airport terminals and port facilities—are excluded from this research scope [19]. "Carbon emissions" [20-23] in this context encompass both direct CO2 emissions from fossil fuel combustion and indirect emissions from electricity consumption. Given their negligible contribution (less than 0.1% combined), methane (CH4) and nitrous oxide (N2O) emissions are simplified and excluded from calculations in this study.Current mainstream carbon emission models include the MARKet ALlocation (MARKAL) model, the Asia-Pacific Integrated Assessment Model (AIM), and the Long-range Energy Alternatives Planning (LEAP) model. Developed by Lawrence Berkeley National Laboratory, the LEAP model represents a scenario-based energy-environment simulation platform specifically designed for energy planning, particularly long-term strategic planning. Compared with alternative models, LEAP demonstrates three distinctive advantages: (1) Enhanced structural robustness enabling seamless integration with general economic models, end-use consumption patterns, and energy supply systems; (2) Capability to evaluate the impacts of energy conservation technologies and specific mitigation strategies through comprehensive policy simulations; (3) A dedicated Technology and Environmental Database (TED) that compiles emission indicators for various technologies across different countries into a comprehensive database. This system allows researchers to expand the database based on regional-specific conditions, thereby significantly facilitating environmental impact assessments. Considering these technical merits and adaptability requirements, the LEAP model is selected as the primary computational tool for carbon emission analysis in this research.
2.2. Model Framework
The LEAP model, an integrated energy-environment scenario analysis platform incorporating energy systems, environmental impacts, and socioeconomic development, is widely employed in energy policy evaluation and climate change mitigation studies. Its modular architecture comprises five core components: Energy Demand, Environmental Emissions, Energy Conversion, Biomass Resources, and Cost Analysis. Users can establish customized scenarios by inputting quantitative parameters reflecting current conditions and projected socioeconomic/energy development trajectories, enabling systematic comparisons of alternative policy outcomes.
In this study, only the Energy Demand Module and Environmental Impact Assessment Module were utilized to quantify transportation-related CO2 emissions in Chengdu. Based on transportation mode characteristics, the city’s transport sector was classified into eight categories: private cars, taxis, buses, motorcycles, metro, road transport, railway transport, and civil aviation. Three of these categories—road transport, railway transport, and civil aviation—were further subdivided into passenger and freight sub-sectors, resulting in six specialized operational units. Sector-specific emission inventories were systematically aggregated to derive the total carbon emissions for Chengdu’s transportation system. Figure 1 illustrates the LEAP-based analytical framework for transportation carbon emissions in Chengdu.
2.3. System Boundaries
This study adopts a comprehensive "macro-transportation" scope [24], encompassing road transport, railway, civil aviation, waterway transport, urban rail transit (e.g., metro), public buses (including electric buses), taxis, and non-operational transport. Non-operational transport comprises privately owned vehicles (e.g., passenger cars, motorcycles), logistics vehicles, sanitation vehicles, and other social service vehicles [25-27]. Due to data availability constraints, pipeline transport and non-road transport (e.g., agricultural machinery) are excluded, while civil aviation coverage is limited to commercial aviation, excluding general aviation [28].
A critical challenge in transportation emission accounting lies in defining spatial and operational boundaries for mobile emission sources [29]. To align with statistical reporting conventions, the energy consumption and emission boundaries in this study are structured as follows:
Road transport, civil aviation, waterway transport, public buses, taxis, and non-operational transport adhere to the territorial principle, accounting exclusively for vehicles, vessels, and aircraft registered within Chengdu’s administrative jurisdiction [30-31].
Railway emissions are calculated based on the operational scope of the Chengdu Railway Bureau rather than municipal administrative boundaries, as railway energy consumption data are aggregated by rail networks rather than geographic divisions [32]. While this approach may overestimate Chengdu’s emissions, it aligns with the city’s energy efficiency evaluation protocols for the Chengdu Railway Bureau and addresses practical challenges in disaggregating railway energy data at the municipal level.
Urban rail transit emissions are confined to traction energy consumption of Chengdu’s metro system [33]. Empirical data indicate that metro traction accounts for approximately 50% of total energy consumption in urban rail transit operations.
The system boundaries further incorporate Scope 1, Scope 2, and Scope 3 emissions [34-35], defined as:
Scope 1: Direct emissions occurring within Chengdu’s administrative boundaries (e.g., gasoline combustion from vehicles operating within the city).
Scope 2: Indirect emissions from electricity consumption within Chengdu’s boundaries (e.g., electricity-powered metro operations).
Scope 3: Transboundary emissions induced by activities originating within Chengdu, including aviation emissions from flights departing/arriving in Chengdu and freight transport emissions from trucks servicing the city.
2.4. Computational Methodology
This study integrates two distinct calculation approaches: the ton-kilometer-based method [36] and the vehicle stock-based method [37]. The methodological selection follows a hierarchical principle: ton-kilometer statistics (e.g., passenger-kilometers, freight-ton-kilometers) are preferentially applied where available, while vehicle stock data (e.g., registered vehicles, annual mileage) serve as supplementary inputs for sectors lacking systematic turnover metrics. A detailed classification of the computational methodologies adopted for each transport category is provided in Table 1.
2.4.1. Ton-Kilometer/Passenger-Kilometer-Based Method
The ton-kilometer/passenger-kilometer-based method calculates total carbon emissions by multiplying actual transportation workload (e.g., freight "ton-kilometers" or passenger "passenger-kilometers") by carbon emission factors per unit turnover. This approach emphasizes the operational efficiency of transport activities, requiring high-precision data inputs. In this study, road transport, railway, civil aviation, and metro systems were analyzed using this method. Following the 2006 IPCC Guidelines for National Greenhouse Gas Inventories, transportation emissions are classified as mobile source emissions. The calculation formula, based on turnover metrics and associated parameters, is expressed as:
Where Cp is the total carbon emissions; Tp is the turnover volume (ton-kilometers or passenger-kilometers); Hij is the the share of fuel type j in transport category i; Fij is the energy consumption coefficient per unit turnover for fuel j in category i; eij is the carbon emission factor for fuel j in category i.
2.4.2. Vehicle Stock-Based Method
The vehicle stock-based method estimates total carbon emissions by multiplying the registered vehicle/equipment population (e.g., total private cars in a region) by the average annual carbon emissions per vehicle. This approach reflects the aggregate impact of fleet size on emissions and is suitable for macro-level policy analysis, necessitating vehicle stock statistics and average utilization intensity data. In this study, buses, taxis, private cars, and motorcycles were evaluated using this method. The computational formula is defined as:
E is the total carbon emissions; Vi is the vehicle stock; Si is the annual mileage per vehicle; Cij is the fuel consumption per 100 kilometers for fuel j in transport category i; eij is the emission factor for fuel j in category i.
2.5. Parameter Settings
2.5.1. Emission Factors
Emission factors for various transport modes should ideally be determined through empirical testing to accurately reflect the technological proficiency of combustion equipment and region-specific emission profiles in Chengdu. However, due to practical constraints in obtaining localized experimental data, this study primarily adopts recommended coefficients from the National Guide for Atmospheric Pollution Source Emission Inventories [38]. These coefficients ensure methodological consistency and compliance with national regulatory standards. Detailed emission factors and their corresponding transport categories are systematically tabulated in Table 2.
2.5.2. Energy Consumption Coefficient per Unit Turnover
For setting the energy consumption coefficients of intercity transportation modes in the base year, this study references research findings from Research on Medium- and Long-Term Energy Conservation in China's Transportation Sector, China Transportation Yearbook, corporate reports, and related literature. Specific parameter settings are detailed in Table 3.
2.5.3. Energy Consumption per 100 Kilometers
The energy consumption per 100 kilometers in this study references The Chengdu 14th Five-Year Plan for Integrated Transportation and Logistics Development and national transportation policy documents, such as the Ministry of Science and Technology's 2017 Annual Project Application Guide for New Energy Vehicle Pilot Programs and the State Council's Energy-Saving and New Energy Vehicle Industry Pl an (2012-2020) [39], among others (as detailed in the table). Specific parameter settings are provided in Table 4.
3. Results
3.1. Total Transportation Carbon Emissions in Chengdu
Based on current data on vehicle populations, transportation activity levels, energy efficiency, and emission factors, this study quantifies the carbon emission inventory of Chengdu’s major transport sectors over the past five years. As shown in Figure 2 , total transportation emissions remained relatively stable from 2017 to 2022. However, significant fluctuations emerged in 2023, driven primarily by a surge in travel demand following the post-pandemic recovery. In 2024, Chengdu’s transportation carbon emissions reached 31.17 million metric tons (MtCO₂), marking a 0.7% increase compared to 2023. Private car travel, road freight transport, and civil aviation accounted for the largest shares at 40.1%, 16.6%, and 26.0%, respectively, as illustrated in Figure 3.
3.2. Carbon Emissions from Private Car Travel
Private car travel represents the largest contributor to Chengdu’s transportation carbon emissions. As detailed in Table 5, emissions from this sector grew at an average annual rate of 5.8% between 2017 and 2024. In 2024 alone, private car travel generated 12.496 MtCO₂, underscoring its dominant role in the city’s emission profile.
3.3. Carbon Emissions from Public Transportation
This study defines public transportation emissions as those arising from metro and public bus usage. Table 6 summarizes the annual emissions for this category. The analysis reveals a substantial increase in metro-related emissions, rising from 0.951 MtCO₂ in 2022 to 2.839 MtCO₂ in 2024. This surge is attributed to Chengdu’s post-pandemic status as a major tourist destination, coupled with the continuous expansion of its metro network, which enhanced accessibility and affordability. In 2024, total emissions from public transportation amounted to 3.861 MtCO₂, significantly lower than those from private car travel.
3.4. Carbon Emissions from Freight Transport
As Chengdu lacks waterway freight infrastructure, this study focuses on emissions from road, rail, and air freight. Table 7 provides a detailed breakdown. Road freight consistently dominated this category, contributing over 92% of total freight emissions in recent years. In 2024, freight transport emissions totaled 5.587 MtCO₂, comprising 5.168 MtCO₂ from road transport, 0.254 MtCO₂ from rail freight, and 0.165 MtCO₂ from air freight.
4. Discussion
4.1. Analysis of Vehicle Energy Structure
The calculated results reveal that Chengdu’s transportation sector exhibits elevated carbon emissions, attributed to two primary factors: (1) a large and growing motor vehicle population, and (2) suboptimal energy structure dominated by fossil fuels. By the end of 2024, Chengdu’s motor vehicle population reached 7.66 million units (including approximately 6.30 million passenger cars), ranking first nationally. Projections indicate this figure will exceed 8.5 million units by 2030, as illustrated in Figure 4.
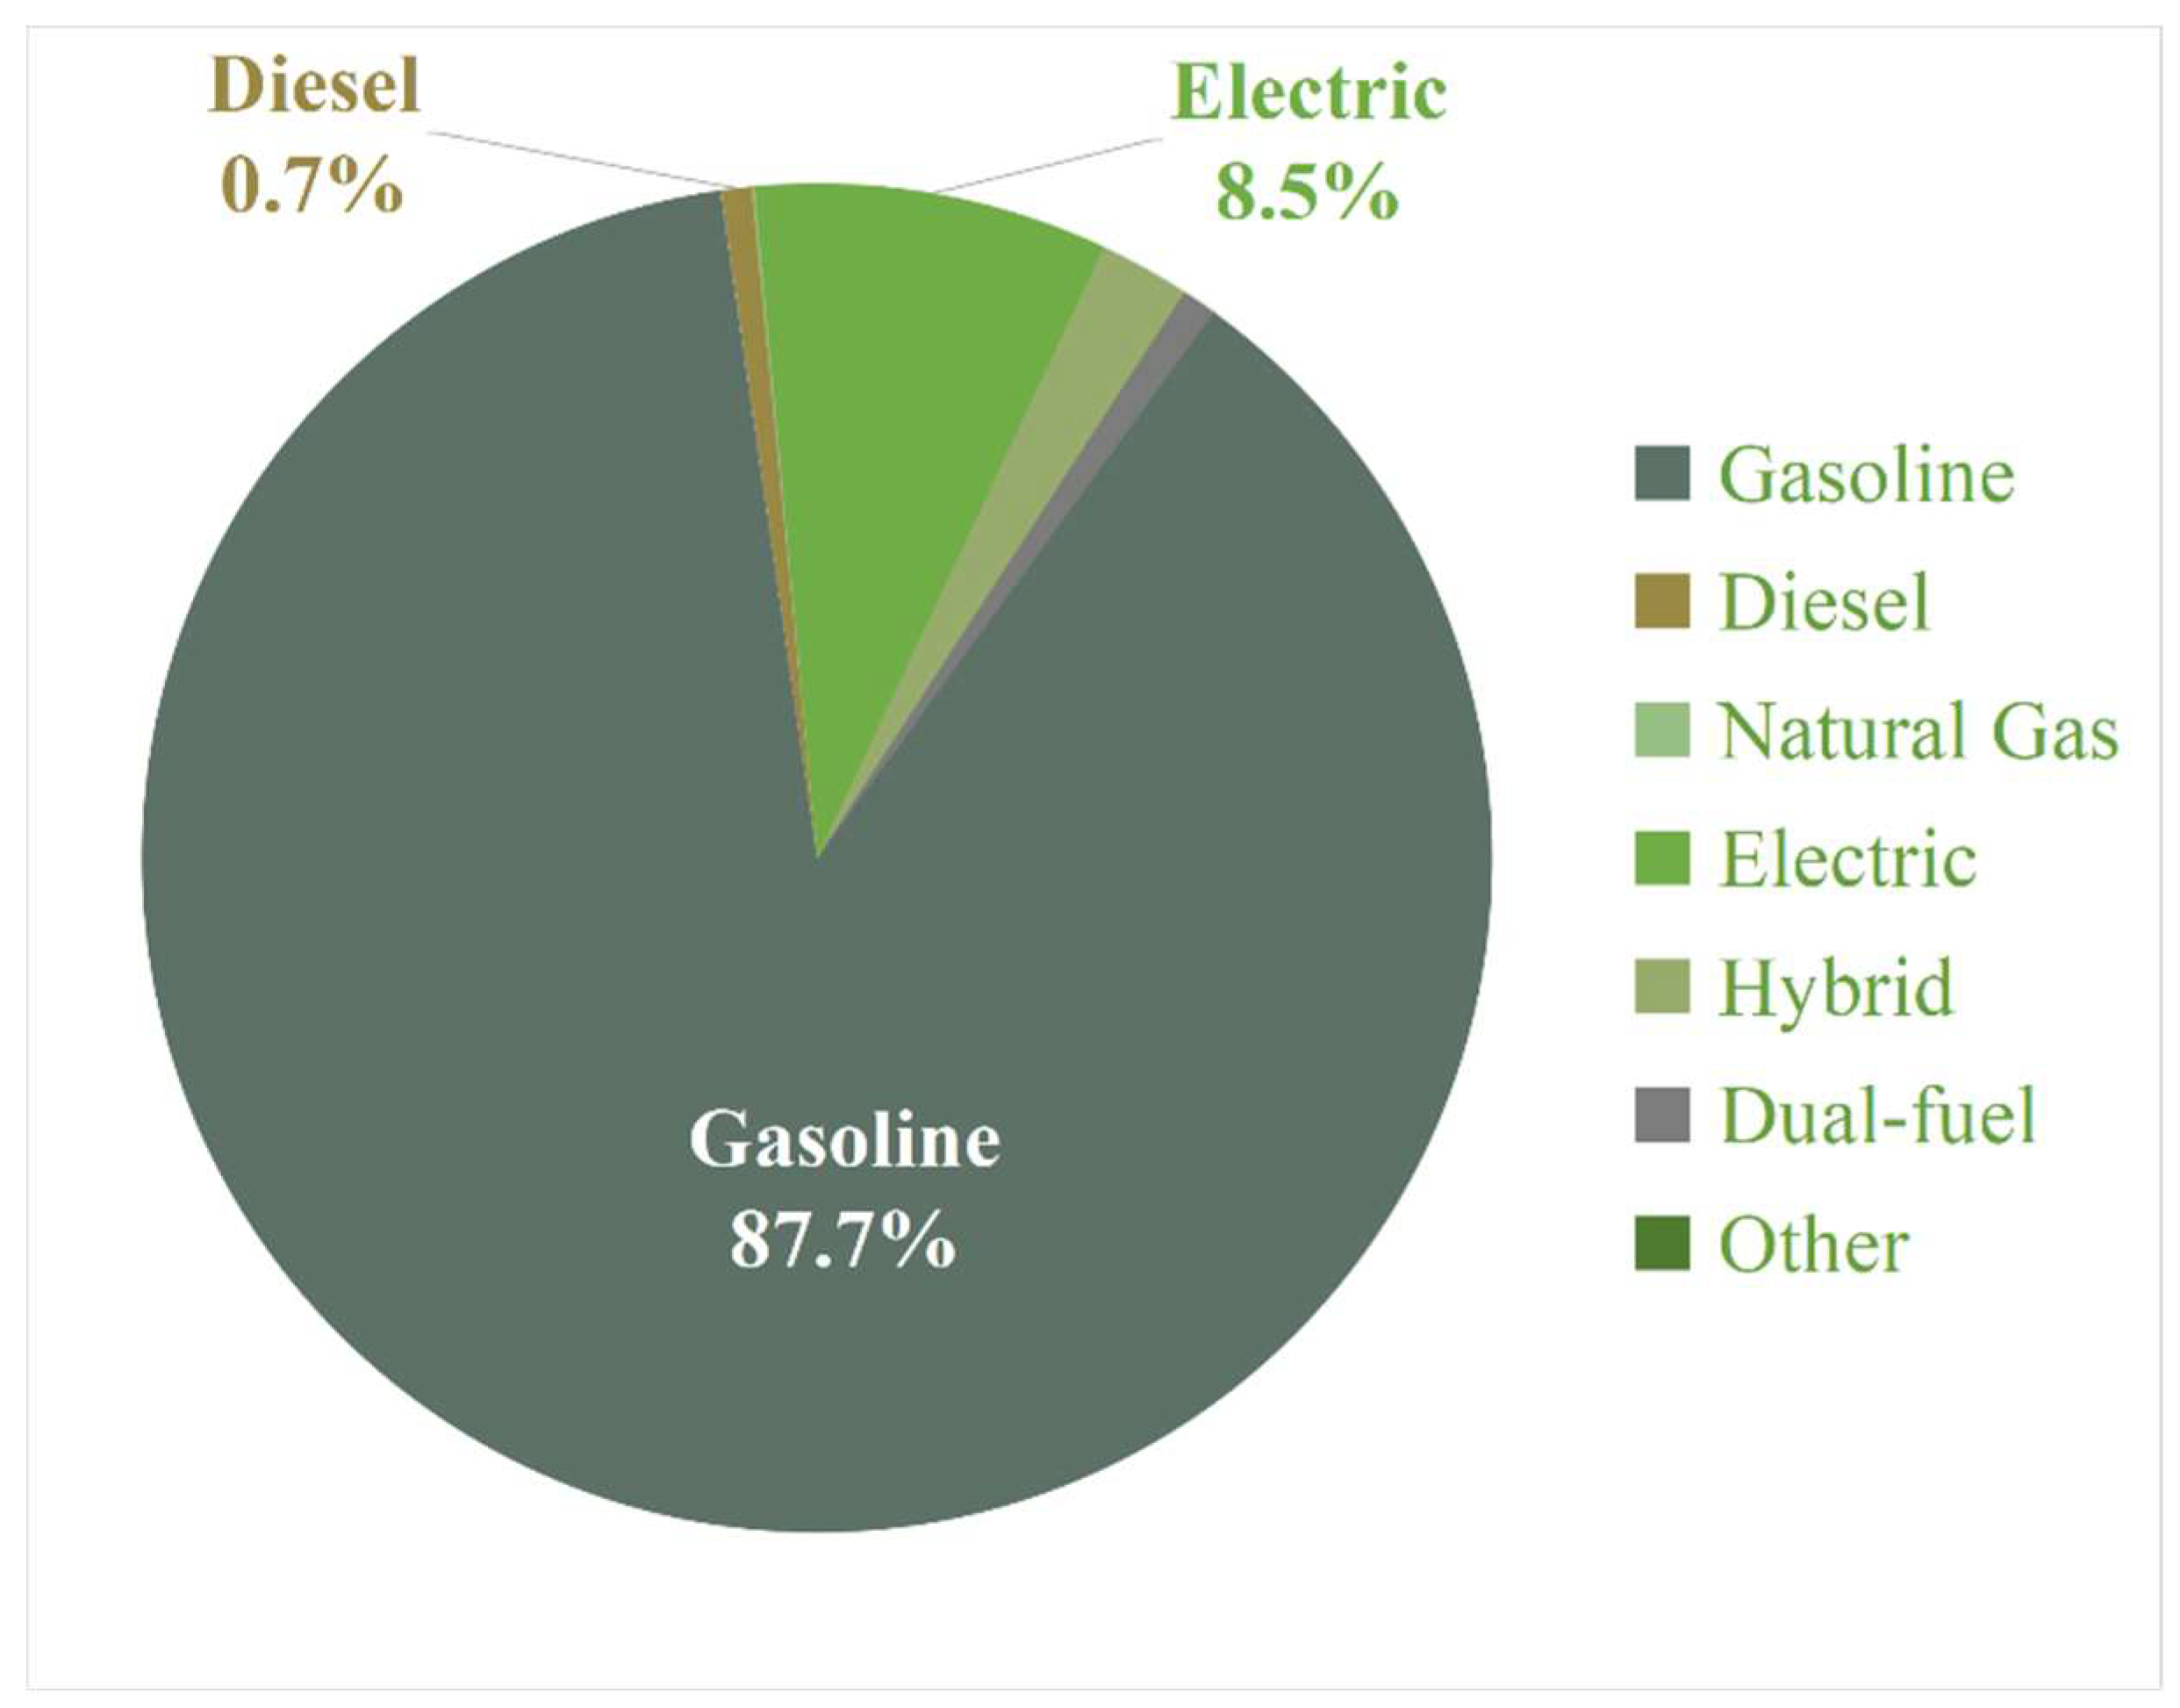
Notably, the energy mix of Chengdu’s vehicle fleet remains heavily reliant on conventional fuels. Gasoline-powered vehicles dominate, accounting for 91.2% of the total fleet, while new energy vehicles (NEVs) represent only 4.8%. In 2024, NEVs numbered approximately 850,000 units, constituting less than 12% of the total fleet—a significant gap compared to leading cities in NEV adoption. Within this category, passenger cars predominantly rely on gasoline, with NEVs constituting a mere 10%. Despite policy efforts in public transport electrification, over 90% of newly registered passenger vehicles continue to utilize fossil fuels, reflecting limited regulatory constraints on private vehicle energy transitions.
Figure 6.
Fuel Type Composition of Chengdu’s Passenger Car Population.
4.2. Analysis of Travel Mode Structure
In Chengdu’s central urban area, private car usage dominates resident travel patterns, accounting for 45.4% of total trips, followed by public bus transit (16.0%), metro systems (30.9%), and taxi/ride-hailing services (7.2%), as illustrated in Figure 7. This skewed modal split stems from two systemic drivers: (1) persistent reliance on private cars due to low ownership/operational costs and insufficient high-quality alternatives, rendering metro network expansions ineffective in curbing car dependency; and (2) underdeveloped low-carbon mobility culture, characterized by preferences for high-displacement vehicles, prolonged engine idling, and inadequate vehicle maintenance, compounded by weak policy advocacy. Survey data reveal that 20% of private car trips cover short distances (≤5 km), with modeling indicating that substituting these trips with green mobility options (e.g., cycling, walking) could yield annual CO₂ reductions of at least 500,000 metric tons.
4.3. Analysis of Freight Transport Structure
Chengdu’s freight transport structure faces dual challenges: (1) excessive reliance on road transport, which accounts for over 84.6% of total freight volume (significantly higher than the <15% share of rail transport, as shown in Figure 8), resulting in disproportionately high carbon emissions and hindering sustainable urban development and transport optimization; and (2) low adoption rates of new energy vehicles (NEVs) in truck fleets, with over 40% of trucks meeting only China IV or lower emission standards (compared to <15% in Beijing), alongside a high prevalence of high-pollution vehicles, including 14% China III or older trucks (exceeding Beijing’s 5%) and 45% diesel-powered trucks (surpassing Beijing’s 27%). NEVs constitute merely 14% of Chengdu’s truck fleet (vs. >20% in Shenzhen), with critically low electrification rates in public service vehicles (e.g., dump trucks, concrete mixers) and medium/heavy-duty trucks (<1%), exacerbating the sector’s environmental impact.
5. Green and Low-Carbon Development Pathways
Drawing on advanced urban practices and Chengdu's contextual realities, this strategy focuses on key areas of pollution and carbon reduction in transportation, balancing critical factors such as primary pollution sources, cost-benefit investments, and socio-economic impacts. Through a dual approach of enhancement and reduction, it aims to achieve tangible progress in emission and carbon mitigation within Chengdu's transport sector.
5.1. Holistic Integration of "Rail + Bus + Non-Motorized Transport" Networks
5.1.1. Establish a "Four Synchronizations" Coordination Mechanism
Implement a synchronized planning, land acquisition, construction, and completion process for rail transit station-supporting facilities, including bus stops, taxi stands, and non-motorized vehicle parking. Develop binding standards for intermodal infrastructure allocation (e.g., bus terminals, bike-sharing hubs). Integrate station and transfer facility designs during feasibility and preliminary design phases. Ensure concurrent construction of rail stations and transfer hubs, and incorporate multimodal connectivity assessments as a prerequisite for rail project acceptance and operational commissioning.
5.1.2. Optimize Rail-Bus Network Synergy
Adopt a regionally differentiated strategy: Reduce bus-rail route redundancy in core urban zones ("5+1" districts) and radial corridors, while strengthening rail-bus connectivity in peripheral areas ("7+2" districts). Refine the multi-tiered bus network by prioritizing express lines for medium-long distances (complementing rail coverage) and feeder lines for short-haul trips (seamlessly connecting to rail nodes), fostering functional complementarity and coordinated development.
5.1.3. Enhance Integrated Operational Efficiency and Service Quality
Achieve full-coverage, interconnected service guidance across all networks. Standardize signage parameters (layout, placement, content) for seamless rail-bus transfers, creating age-inclusive, user-friendly environments. Strengthen wayfinding systems for high-traffic public service hubs and tourist attractions within walkable catchment areas, ensuring intuitive navigation for pedestrian flows.
5.2. Optimize Freight Structure to Advance Green Logistics
5.2.1. Enhance Freight Corridor Infrastructure
Accelerate the development of expressway networks to strengthen road freight corridors. Prioritize key projects including the Fifth Ring Road construction, elevated upgrades of Chengdu-Luojiang Avenue and Chengdu-Longquan Avenue, freight corridor enhancements on Huoyun Avenue, and rapid transit node improvements on Dajian Road, while initiating feasibility studies for relocating Dajian Road. These efforts will establish an external freight network anchored by a "3 circumferential and 17 radial" expressway system and a municipal freight system centered on a "3 loops, 15 radials, and 6 connectors" rapid road network. This framework supports the "intra-ring passenger priority, extra-ring freight focus" traffic strategy, minimizing freight interference with urban commuting flows.
5.2.2. Systematically Refine Citywide Freight Management
Adopt an integrated citywide approach to regulate non-essential truck traffic. Enforce strict controls on transiting and non-local trucks under the principle of "divert through traffic, restrict non-local vehicles, ban high-emission trucks", while advancing policies to phase out Yellow-label and China III standard vehicles. Implement categorized management for essential urban freight:
Industrial logistics: Ensure raw material input and finished product output through spatiotemporal passenger-freight separation or new energy vehicle (NEV) replacements to maintain production continuity.
Civilian supply chains (wholesale markets, supermarkets): Transition to NEVs and nighttime deliveries to meet daily supply demands.
Logistics hubs (postal, express, warehousing): Optimize freight corridors via upgraded road standards and route adjustments to enhance efficiency.
5.2.3. Promote Rail-Oriented Modal Shift for Suitable Cargo
Expand rail-compatible industries such as automotive, aerospace, rail equipment, advanced materials, and green food processing, clustering manufacturing parks and industrial zones near rail terminals to boost rail-suitable export volumes. Incentivize diversified rail services, including bulk cargo direct trains, container block trains, and point-to-point freight lines, to shift commodities like retail goods, fuels, and commercial vehicles from road to rail. Support dedicated rail spur construction for large enterprises and logistics parks, and establish "virtual rail stations" in industrial zones and highway logistics hubs, transforming rail transport from traditional "station-to-station" to "door-to-door" services.
5.3. Accelerate New Energy Vehicle Adoption to Reduce Source Emissions
5.3.1. Expedite Phasing Out of Aging Vehicles
Capitalizing on the 2023 Implementation Plan for Incentivizing Early Retirement of Aging Commercial Vehicles, launch a targeted campaign to accelerate retirement of outdated trucks. Establish a comprehensive registry of aging vehicles and owners, coupled with proactive outreach, on-site notifications, and intensified road inspections. Expand Yellow-label vehicle restricted zones and tighten management policies to phase out high-emission, energy-intensive vehicles. Explore a fuel vehicle exit roadmap to gradually restrict and eventually terminate fossil-fuel vehicle sales and usage.
5.3.2. Pioneer Key Sector Electrification
As a national pilot demonstration zone for full electrification of public sector vehicles, prioritize pure electric adoption in urban buses and taxis to achieve complete public transit electrification. Systematically transition ride-hailing, sanitation, postal, and light logistics fleets to new energy or clean energy vehicles. Strengthen incentives for NEV purchases and usage through stable, long-term policy frameworks, fostering industry growth. Target 1 million NEVs in operation by 2025, positioning Chengdu as a national leader in green mobility.
5.3.3. Rapid Deployment of Charging Infrastructure
Enforce mandatory charging facility integration standards for all new/renovated buildings:
• Residential complexes: 20% equipped with chargers, 80% pre-wired
• Office buildings: 25% charging-ready
• Commercial/public buildings: 20% charging-ready
Ensure DC fast-charging stations constitute ≥15% of total installations. Align with the 2025 target of 200,000 cumulative charging points through strict compliance with zoning regulations and dedicated infrastructure planning.
5.4. Strengthen Policy and Regulatory Frameworks
5.4.1. Optimize Traffic Demand Management Policies
Align with China’s dual-carbon goals and analyze spatiotemporal traffic patterns to objectively evaluate current vehicle restriction policies (time slots, zones, and targets). Refine the license plate-based traffic rationing system (particularly for trucks) to align with Chengdu’s green mobility transition. Revamp on-street parking fee policies by adjusting differentiated pricing in the “5+1” districts and coordinating unified optimization across the “12+2” central urban areas and peripheral regions. Establish a citywide, multi-tiered parking fee system incorporating spatial differentiation, time-of-day pricing, vehicle-type distinctions, precision timing, and progressive rate increments. Advance feasibility studies for vehicle quota controls, congestion charging, and low-emission zones to curb non-NEV ownership growth and usage, thereby boosting green travel modal share and reducing transport-sector emissions.
5.4.2. Enforce Rigorous Governance to Foster Green Mobility Culture
Firstly, strictly regulate illegal parking within 150 meters of rail stations. Implement yellow curb markings and bus lane demarcations, supported by frequent patrols and strict penalties to eliminate unauthorized parking, ensuring unimpeded traffic flow. Secondly, standardize shared bike parking at transit hubs through geo-fenced designated zones and enhanced digital management, preventing chaotic bike and maintaining orderly station access.
5.4.3. Strengthen Multi-Stakeholder Collaboration Mechanisms
Firstly, enhance institutional coordination by establishing cross-regional linkages (e.g., Chengdu-Chongqing Economic Circle, metropolitan clusters), interdepartmental partnerships, and public-private collaborations, leveraging the Chengdu Logistics Association to foster co-governance. Secondly, drive innovation by developing green logistics pilot zones (one per district/county) with tailored action plans, and integrate truck operations into the “Carbon Incentive Mobility” platform to refine management and cultivate industry-leading freight enterprises. Finally, amplify public engagement through integrated campaigns, proactive monitoring, and responsive communication to solidify societal support for green mobility.
6. Conclusions
This study quantifies the carbon emissions of Chengdu’s transportation sector in recent years and analyzes emission patterns across transport modes. Based on the results, a detailed assessment of vehicle energy structures and transportation system configurations is conducted:
(1) By the end of 2024, Chengdu’s motor vehicle population reached 7.66 million units (ranking first nationally), with total transportation emissions amounting to 31.17 million metric tons (MtCO₂)—a 0.7% increase from 2023. This growth poses significant challenges to sustainable urban development and transportation structure optimization.
(2) Private car travel contributes 40.1% of the sector’s total emissions, driven by two structural inefficiencies: (i) a suboptimal vehicle energy mix, with only 10% of passenger cars being new energy vehicles (NEVs); and (ii) an imbalanced travel mode structure, where private cars account for 45.4% of trips in central urban areas, compounded by low public transit ridership and insufficient public awareness of green mobility.
(3) In 2024, freight transport generated 5.587 MtCO₂, with road freight contributing 5.168 MtCO₂ (92% of the total). Structural deficiencies include overdependence on high-pollution trucks, with >40% complying with China IV or lower emission standards, underscoring the urgent need to shift freight from road to rail .
Building on the systemic analysis, this study proposes green and low-carbon development pathways for Chengdu’s transportation sector. As cities serve as pivotal arenas for achieving carbon peaking and neutrality, transportation represents a strategic lever for urban decarbonization. Confronting rapid demand growth, spatial resource constraints, and pronounced environmental externalities, Chengdu urgently requires an integrated strategy featuring unified citywide coordination, root-cause mitigation, and precision governance to optimize its transportation structure. Core pathways include vehicle electrification (prioritizing NEV adoption), emission standard escalation (phasing out high-pollution fleets), green modal shift (enhancing rail and public transit), and carbon sink institutionalization (establishing offset mechanisms). Critical priorities involve increasing NEV penetration rates, optimizing private car and freight transport structures, and implementing robust safeguards across policy, legislation, funding, technology, and institutional frameworks. These multi-pronged measures, grounded in a "whole-system" approach, will position Chengdu as a trailblazer in urban transportation decarbonization, balancing developmental needs with climate imperatives.
7. Patents
Author Contributions
Conceptualization, Q.Liu. and C.Ma.; methodology, Q.Liu.; software, Q.Liu.; validation, Q.Liu.; formal analysis, Q.Liu.; investigation, Q.Liu.; writing—original draft preparation, Q.Liu.; writing—review and editing, Q.Liu. and C.Ma.; supervision, Q.Liu.; project administration, Q.Liu. and C.Ma; funding acquisition, C.Ma. All authors have read and agreed to the published version of the manuscript.
Funding
This research was funded by the JOINT PROJECT OF THE NATURAL SCIENCE FOUNDATION OF HEILONGJIANG PROVINCE, grant number LH2023G002.
Acknowledgments
The authors would like to acknowledge the Natural Science Foundation of Heilongjiang Province for providing support to this study. In addition, the authors thank the anonymous reviewers who provided useful insights and suggestions.
Conflicts of Interest
The authors declare no conflicts of interest. The funder had no role in the design, execution, interpretation, or writing of the study.
References
- Research and Markets Adds Report: Global Dual Carbon Battery Market Outlook to 2020[J].Wireless News,2016,n/a.
- Gao, Y.; Chong, C.H.; Liu, G.; Casazza, M.; Xiong, X.; Liu, B.; Zhou, X.; Zhou, X.; Li, Z.; Ni, W.; et al. Identification of carbon responsibility factors based on energy consumption from 2005 to 2020 in China. Energy 2024, 296. [Google Scholar] [CrossRef]
- Jian, H.; Lin, C.; Na, Z. A Statistical Review of Considerations on the Implementation Path of China’s “Double Carbon” Goal[J].Sustainability,2022,14(18):11274-11274.
- Wu, Y. Dilemmas and Strategies for Global Climate Governance in Industry 4.0[J].Academic Journal of Environment & Earth Science,2022,4.0(6.
- Yuan, Z.; Yuan, X.; Yang, Y.; Chen, J.; Nie, Y.; Cao, M.; Chen, L. Greenhouse gas emission analysis and measurement for urban rail transit: A review of research progress and prospects. Digit. Transp. Saf. 2023, 2, 36–51. [Google Scholar] [CrossRef]
- Research Group of the Major Innovation Project of the Chinese Academy of Social Sciences "Core Theoretical Foundations of the Autonomous Knowledge System for Ecological Civilization and Policy Research (2024YZD001)", Zhang Yongsheng. Urgent Need for Paradigm Shift to Address Global Climate Crisis: Executive Summary of the 2024 Expert Report on Climate Change [J/OL]. Ecological Civilization Research, 1-4 [2024-03-28]. http://kns.cnki.net/kcms/detail/10.1979.C.20250103.1618.006.html.
- Li, L.; Wang, X.Y. Research on Optimization of Urban Transportation Structure in Beijing under Dual-Carbon Goals [J]. Transport Energy Conservation & Environmental Protection, 2022, 18(02): 52-56.
- Wu, X.J.; Zhou, Y.L.; Bi, Q.H. Forecasting Carbon Emissions in Changsha’s Transportation Sector [J]. Transportation Construction & Management, 2023, (05): 150-152.
- Pascal, P. The effect of transportation policies on energy consumption and greenhouse gas emission from urban passenger transportation[J].Transportation Research Part A:Policy and Practice,2008,(06):901-909.
- Cevero, R.; Kockelman, K. Travel demand and the 3Ds: density, diversity, and design [ J ]. Transportation Re- search Part D : Transport and Environment, 1997,2 ( 3 ) : 199 -219.
- Su, T.Y.; Zhang, J.H.; Li, J.L. Empirical Study on Influencing Factors of Urban Transportation Carbon Emissions: Evidence from Panel Data of Beijing, Tianjin, Shanghai, and Chongqing [J]. Industrial Engineering and Management, 2011, 16(05): 134-138. [CrossRef]
- Miao, M.Y.; Wang, L.L.; Li, F.F. Optimizing the "Four Major Structures" to Explore a Unique Low-Carbon Development Path for Megacities [N]. Chengdu Daily, 2021-12-29(004). [CrossRef]
- Decision of the Chengdu Municipal Committee of the Communist Party of China on Optimizing Spatial, Industrial, Transportation, and Energy Structures to Promote Green and Low-Carbon Urban Development with Carbon Peaking and Neutrality Goals (Adopted at the 10th Plenary Session of the 13th Chengdu Municipal Committee on December 28, 2021) [J]. Xianfeng, 2022, (01): 23-30.
- Notice of the Chengdu Municipal People’s Government General Office on Issuing the Action Plan and Policy Measures for Optimizing Transportation Structure to Promote Green and Low-Carbon Urban Development [J]. Chengdu Municipal Government Gazette, 2022, (08): 12-17.
- Mao, J. Optimizing the "Four Major Structures" to Drive Comprehensive Green and Low-Carbon Transformation in Chengdu [J]. Xianfeng, 2024, (07): 50.
- Yang, J.; Tang, L.; Mi, Z.; Liu, S.; Li, L.; Zheng, J. Carbon emissions performance in logistics at the city level. J. Clean. Prod. 2019, 231, 1258–1266. [Google Scholar] [CrossRef]
- Liu, Y.; Yu, Y.; Baldacci, R.; Tang, J.; Sun, W. Optimizing carbon emissions in green logistics for time-dependent routing. Transp. Res. Part B: Methodol. 2025, 192, 103155. [Google Scholar] [CrossRef]
- Ding, J.; Jin, F.; Li, Y.; Wang, J. Analysis of transportation carbon emissions and its potential for reduction in China. Chin. J. Popul. Resour. Environ. 2013, 11, 17–25. [Google Scholar] [CrossRef]
- Li, X.; Tang, J.; Li, W.; Si, Q.; Guo, X.; Niu, L. A Bibliometric Analysis and Visualization of Aviation Carbon Emissions Studies. Sustainability 2023, 15, 4644. [Google Scholar] [CrossRef]
- Jan, S.; Yang, L.; Stefan, S. Carbon emissions from European land transportation: A comprehensive analysis[J].Transportation Research Part D,2023,121.
- Intergovernmental Panel on Climate Change. 2006 IPCC Guidelines for National Greenhouse Gas Inventories [ M ]. Japan : Institute for Global Environmental Strategies (IGES), 2006.
- European Commission,The white paper:Road map to a Single European Transport Area.Towards a competitive and resource efficient transport system,COM 2011(144) final,Brussels,28.03.2011,p.9.
- Cheng, G.; Liu, X.; Pei, Y. A review of research on public transport priority based on CiteSpace. J. Traffic Transp. Eng. (English Ed. 2023, 10, 1118–1147. [Google Scholar] [CrossRef]
- Leisch, J. P. New Concepts in Rail-Bus Interchange[J].Transportation Engineering Journal of ASCE,1974,100(1):.
- Moussa; Rushdy, R.Reducing carbon emissions in Egyptian roads through improving the streets quality[J].Environment, Development and Sustainability,2022,25(5):1-22.
- Guo, C.; Xu, J. Carbon Emission Calculation Methods for Highway Tunnel Construction; Springer Nature: Dordrecht, GX, Netherlands, 2022; ISBN:.
- Dobers, K.; Ehrler, C.V.; Davydenko, Y .Challenges to Standardizing Emissions Calculation of Logistics Hubs as Basis for Decarbonizing Transport Chains on a Global Scale[J].Transportation Research Record,2019,2673(9):502-513.
- Cui, Q.; Lei, Y.; Li, Y. Protocol to calculate aircraft emissions for international air routes in South America. STAR Protoc. 2022, 4, 101952. [Google Scholar] [CrossRef] [PubMed]
- Deng, S.; Mi, Z. A review on carbon emissions of global shipping. Mar. Dev. 2023, 1, 1–10. [Google Scholar] [CrossRef]
- Stefano, M.; Lu, Z.M. Carbon emission and cost analysis of vehicle technologies for urban taxis[J].Transportation Research Part D,2021,99.
- Ang, B.W. The LMDI approach to decomposition analysis: a practical guide. Energy Policy 2005, 33, 867–871. [Google Scholar] [CrossRef]
- Wang, M.; Zhu, C.; Cheng, Y.; Du, W.; Dong, S. The influencing factors of carbon emissions in the railway transportation industry based on extended LMDI decomposition method: evidence from the BRIC countries. Environ. Sci. Pollut. Res. 2022, 30, 15490–15504. [Google Scholar] [CrossRef] [PubMed]
- Pu, J.; Cai, C.; Guo, R.; Su, J.; Lin, R.; Liu, J.; Peng, K.; Huang, C.; Huang, X. Carbon emissions of urban rail transit in Chinese cities: A comprehensive analysis. Sci. Total. Environ. 2024, 921, 171092. [Google Scholar] [CrossRef] [PubMed]
- Jie, P.; Zhong, L.S.; Feng, W. Study on Evaluation System of Aircraft Carbon Emissions for China Civil Aviation[J].Advanced Materials Research,2011,356-360(356-360):825-829.
- Zhang, M.J.; Yang, S.W.; Wu, M.J.X.; Chen, F.Z. Research on the drivers of carbon emissions from highway trucks based on pathway analysis[C]//Southwest Forestry University (China),2024:.
- Jiang, X.-T.; Su, M.; Li, R. Investigating the Factors Influencing the Decoupling of Transport-Related Carbon Emissions from Turnover Volume in China. Sustainability 2018, 10, 3034. [Google Scholar] [CrossRef]
- Hou, L.; Wang, Y.; Zheng, Y.; Zhang, A. The Impact of Vehicle Ownership on Carbon Emissions in the Transportation Sector. Sustainability 2022, 14, 12657. [Google Scholar] [CrossRef]
- National Emission Standards for Hazardous Air Pollutants: Chemical Manufacturing Area Sources Technology Review[J].The Federal Register / FIND ,2025,90(013):7942-7942.
- Energy-saving and New Energy Vehicle Industry Development Plan (2012-2020) [J]. Earth, 2015, (09): 13.
Figure 1.
The LEAP-based analytical framework for transportation carbon emissions in Chengdu.
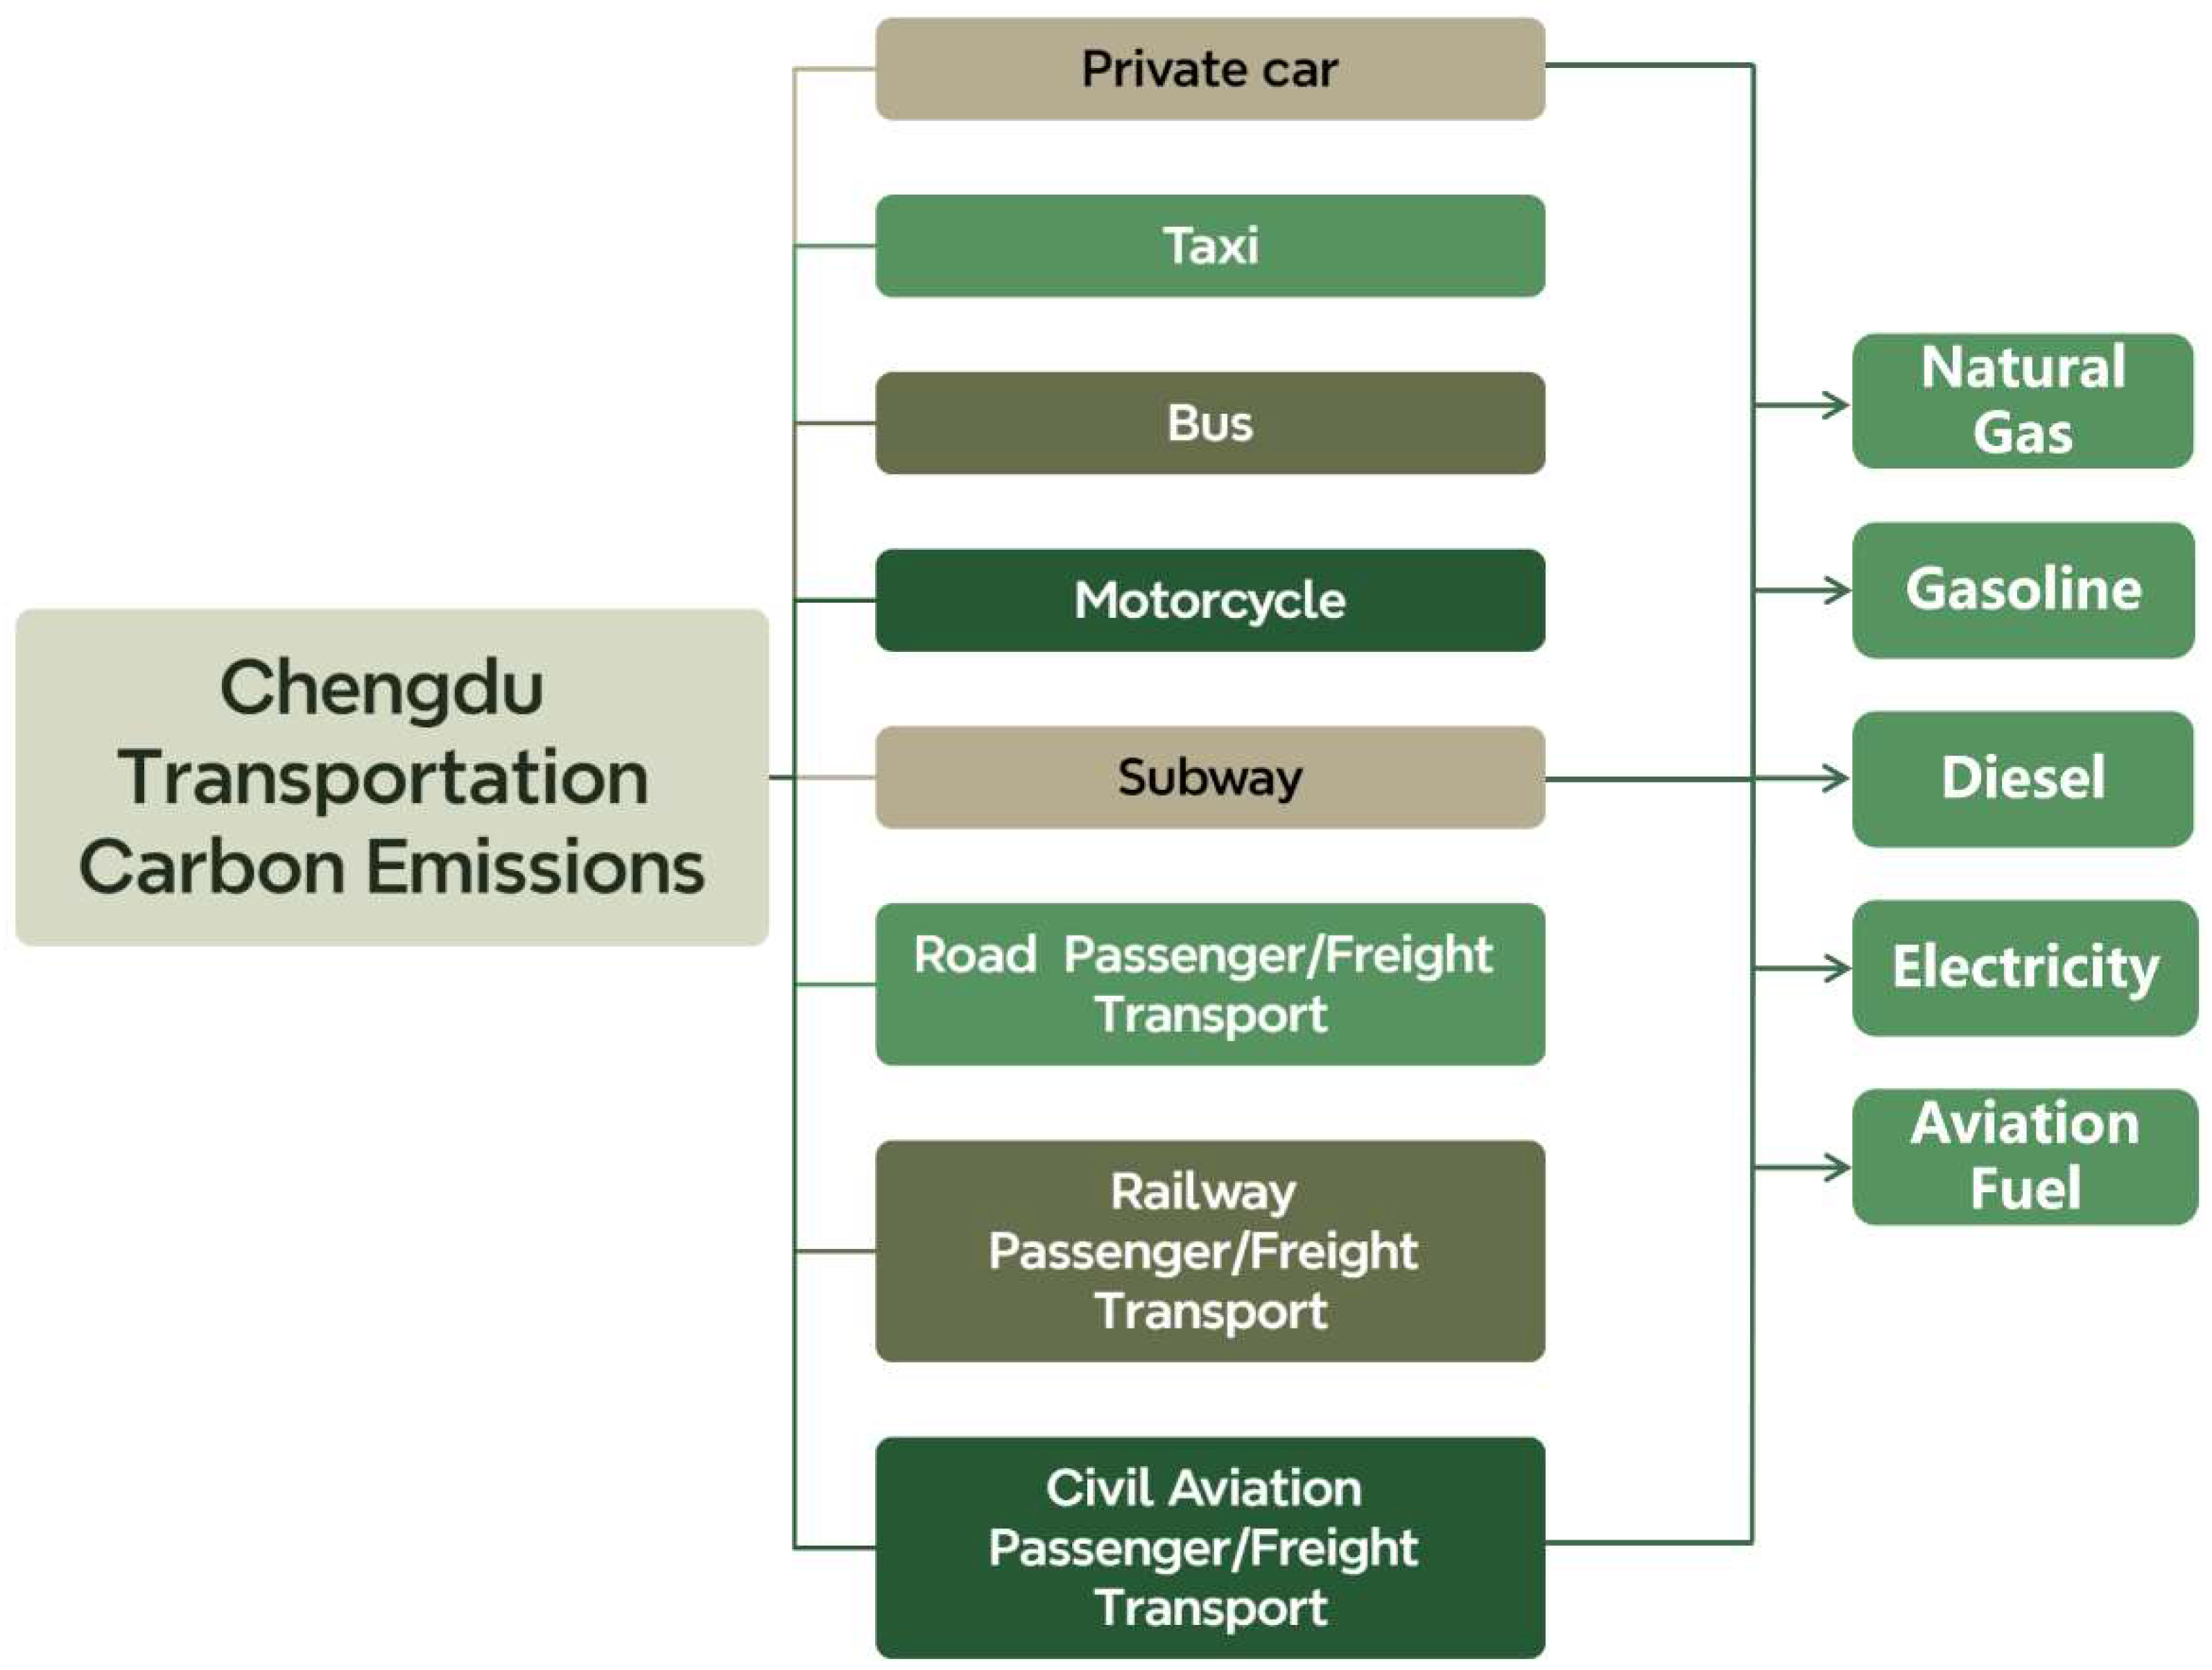
Figure 2.
Trends in Chengdu’s Transportation Carbon Emissions: 2017–2024.
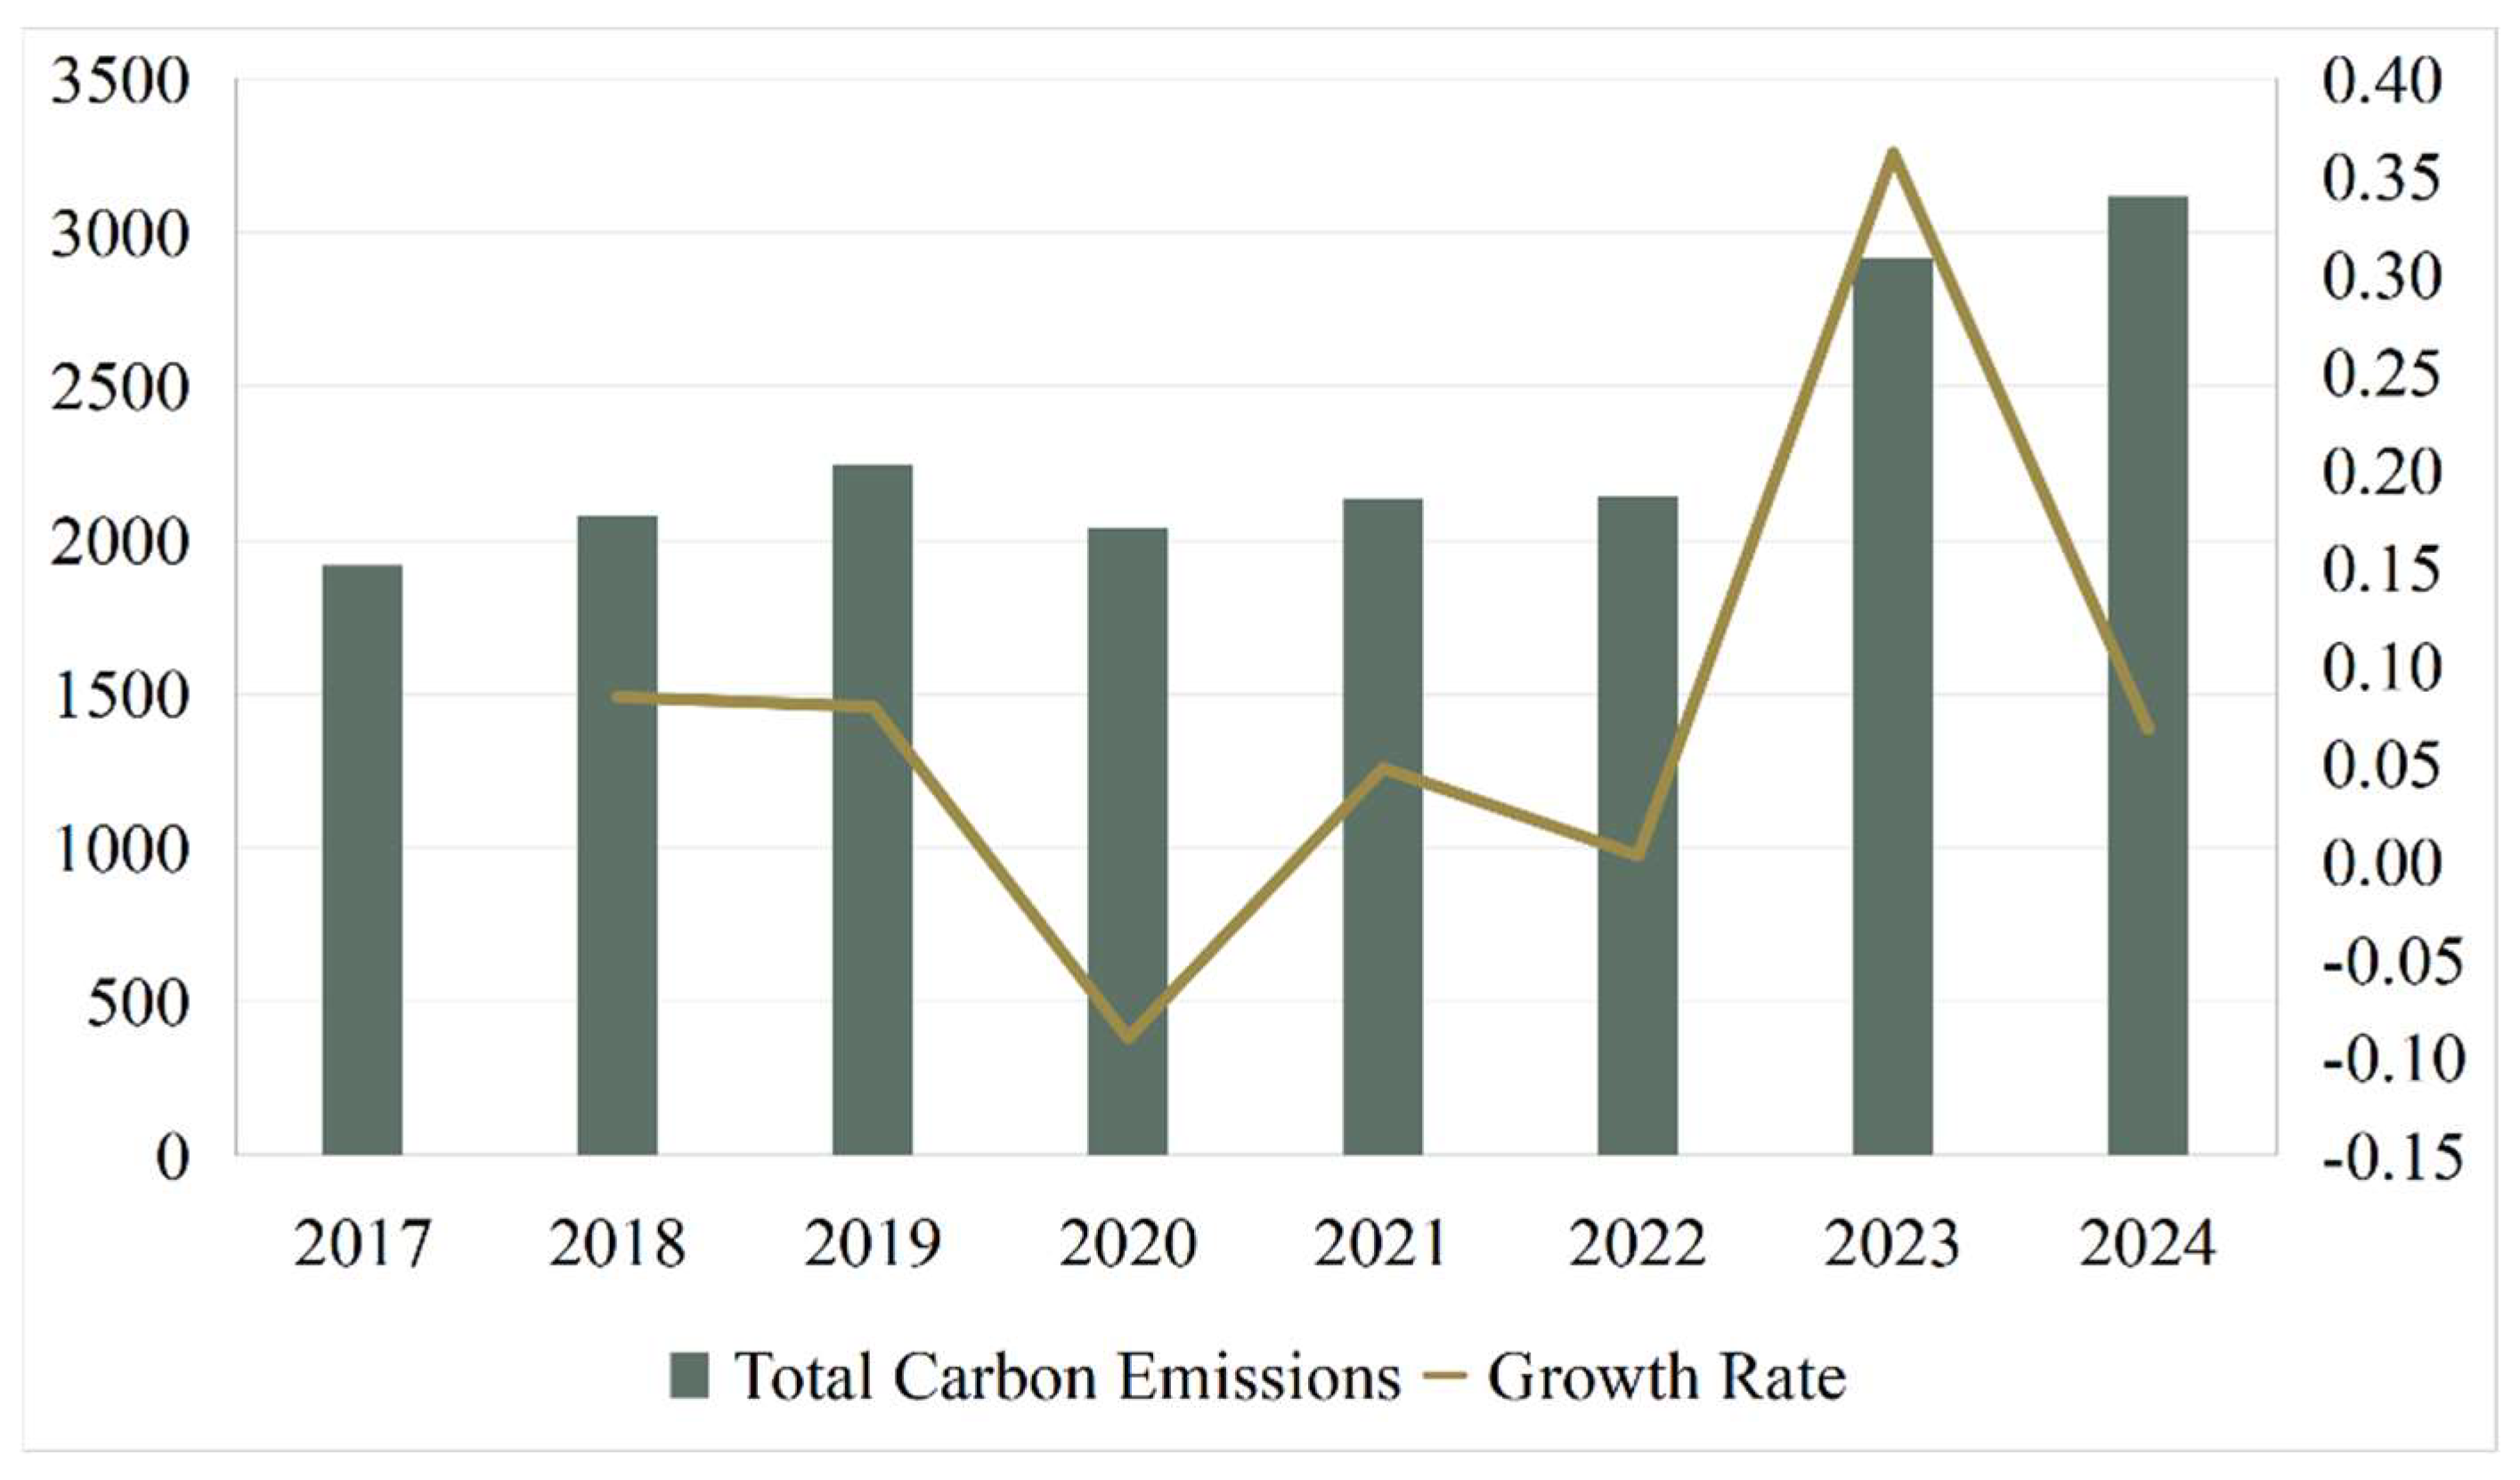
Figure 3.
Composition of Chengdu’s Transportation Carbon Emissions in 2024.
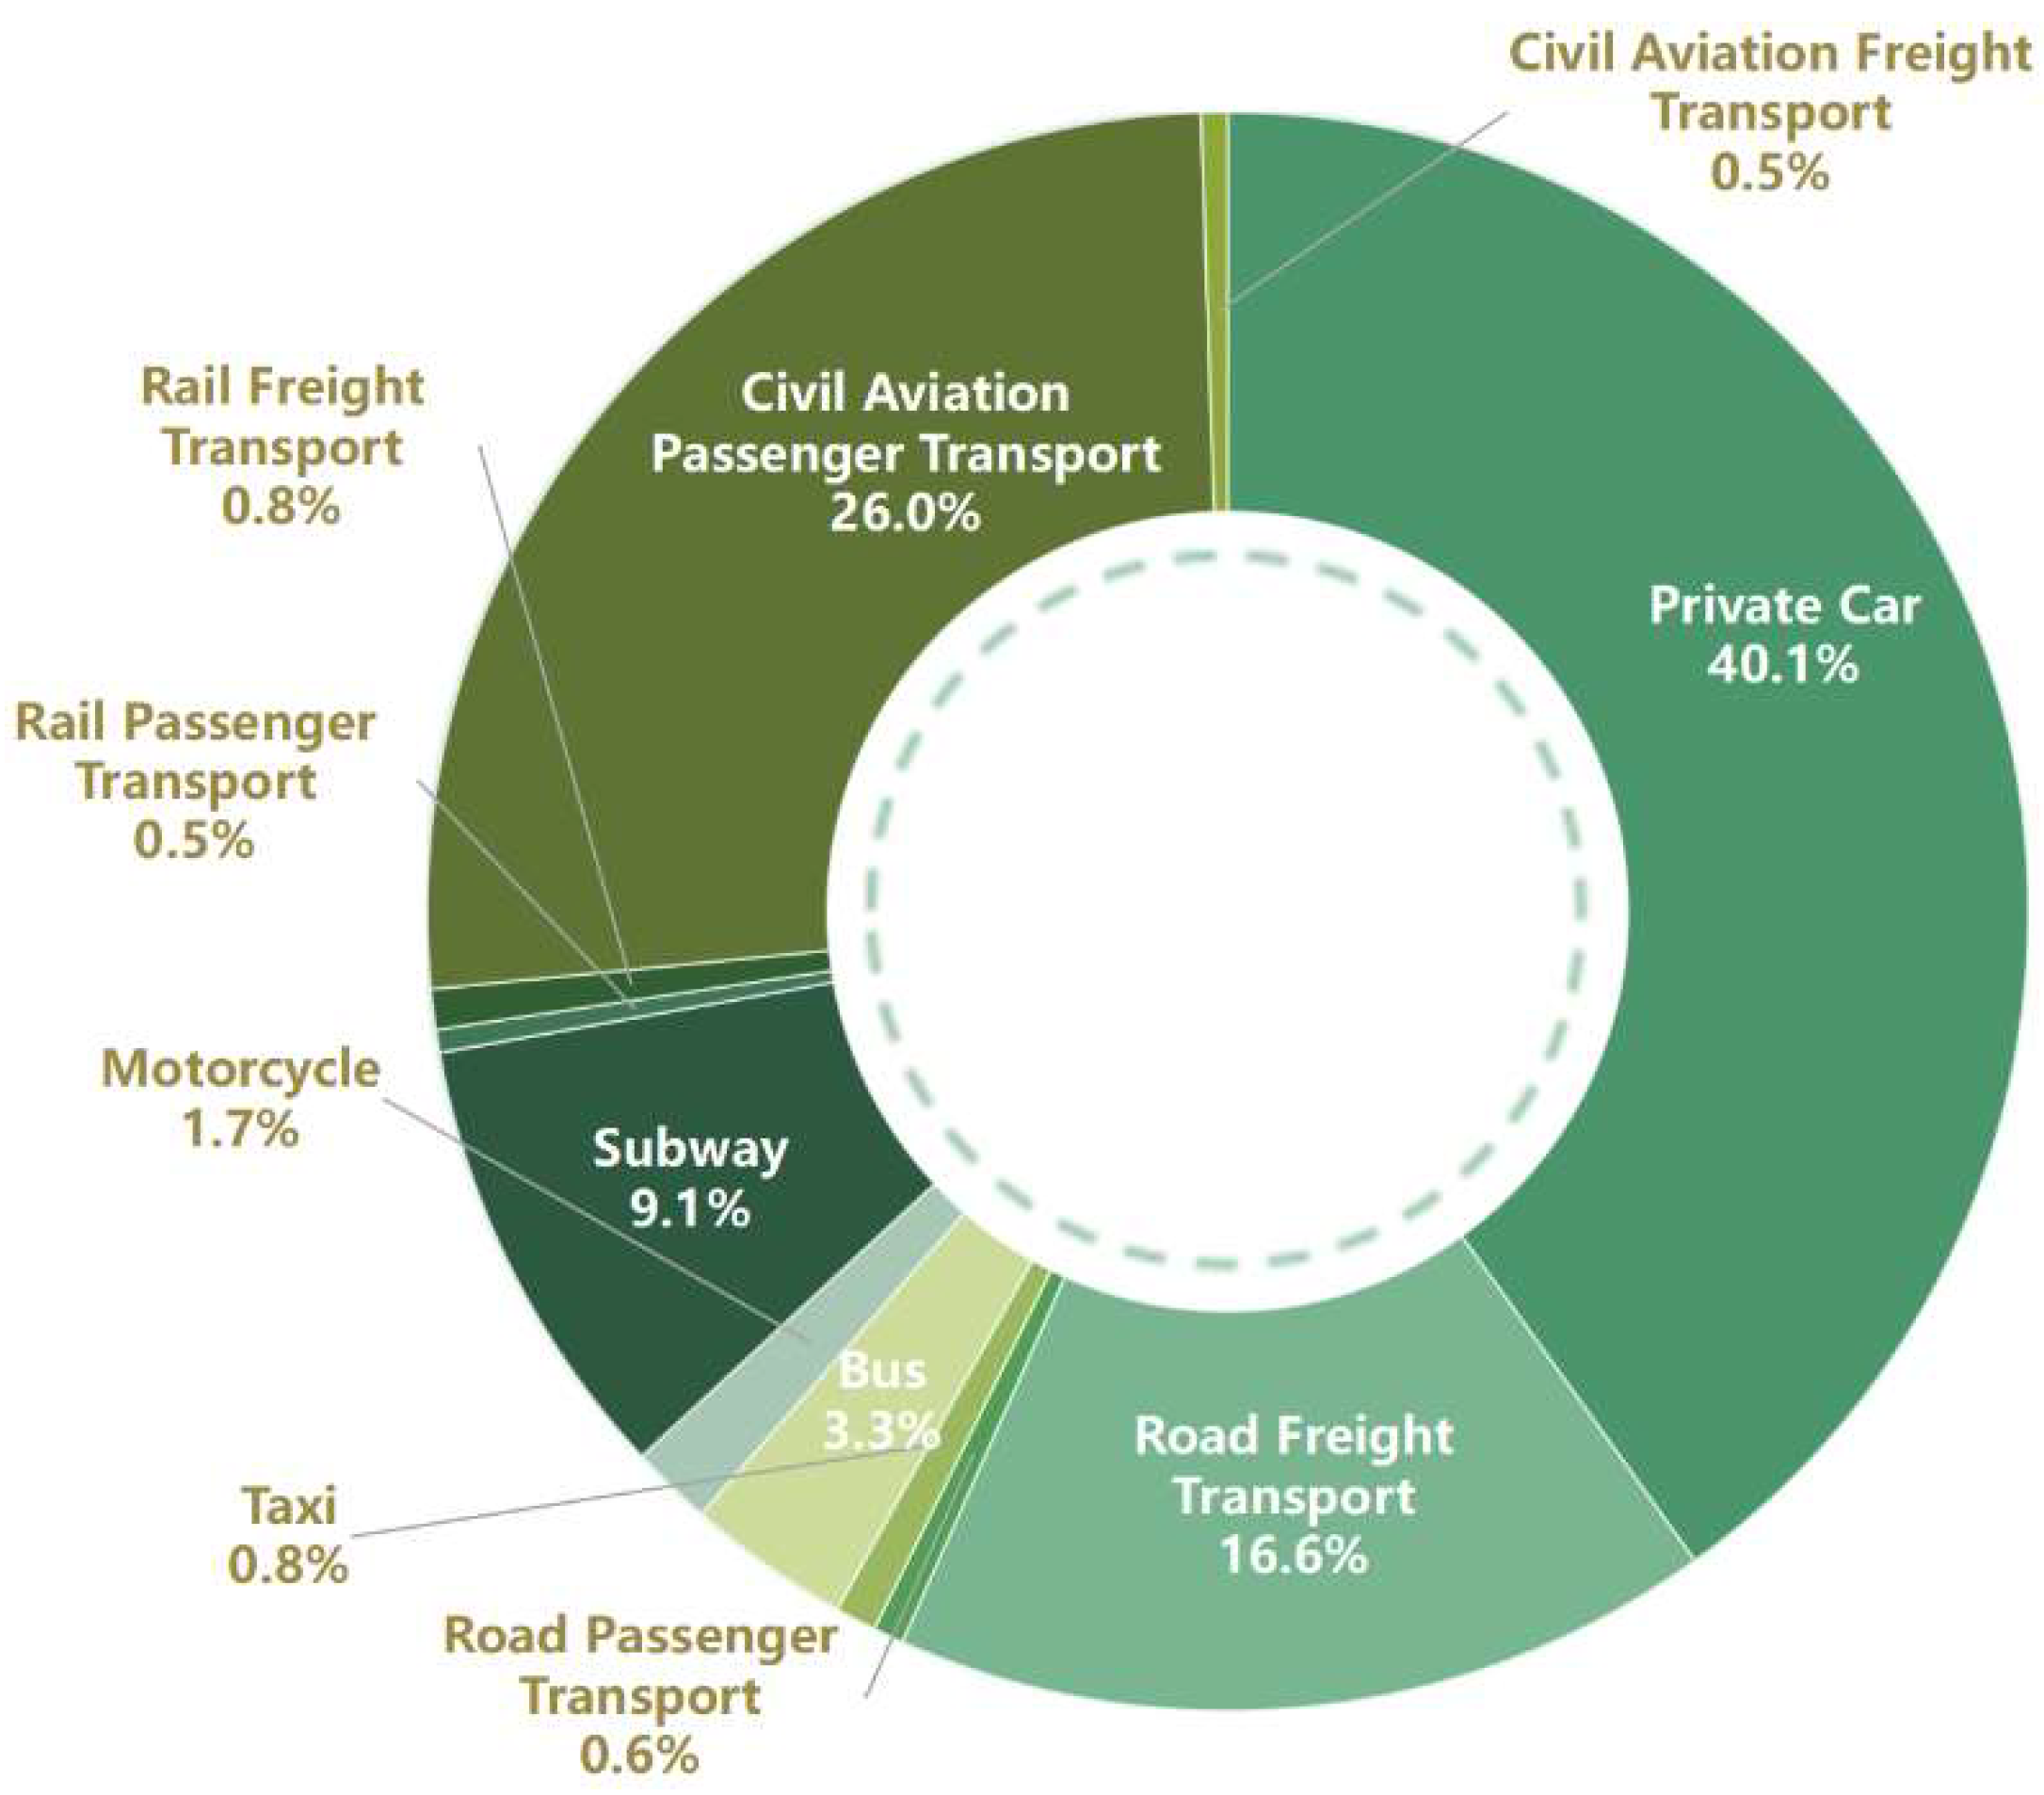
Figure 4.
Trends in Chengdu’s Motor Vehicle Population.
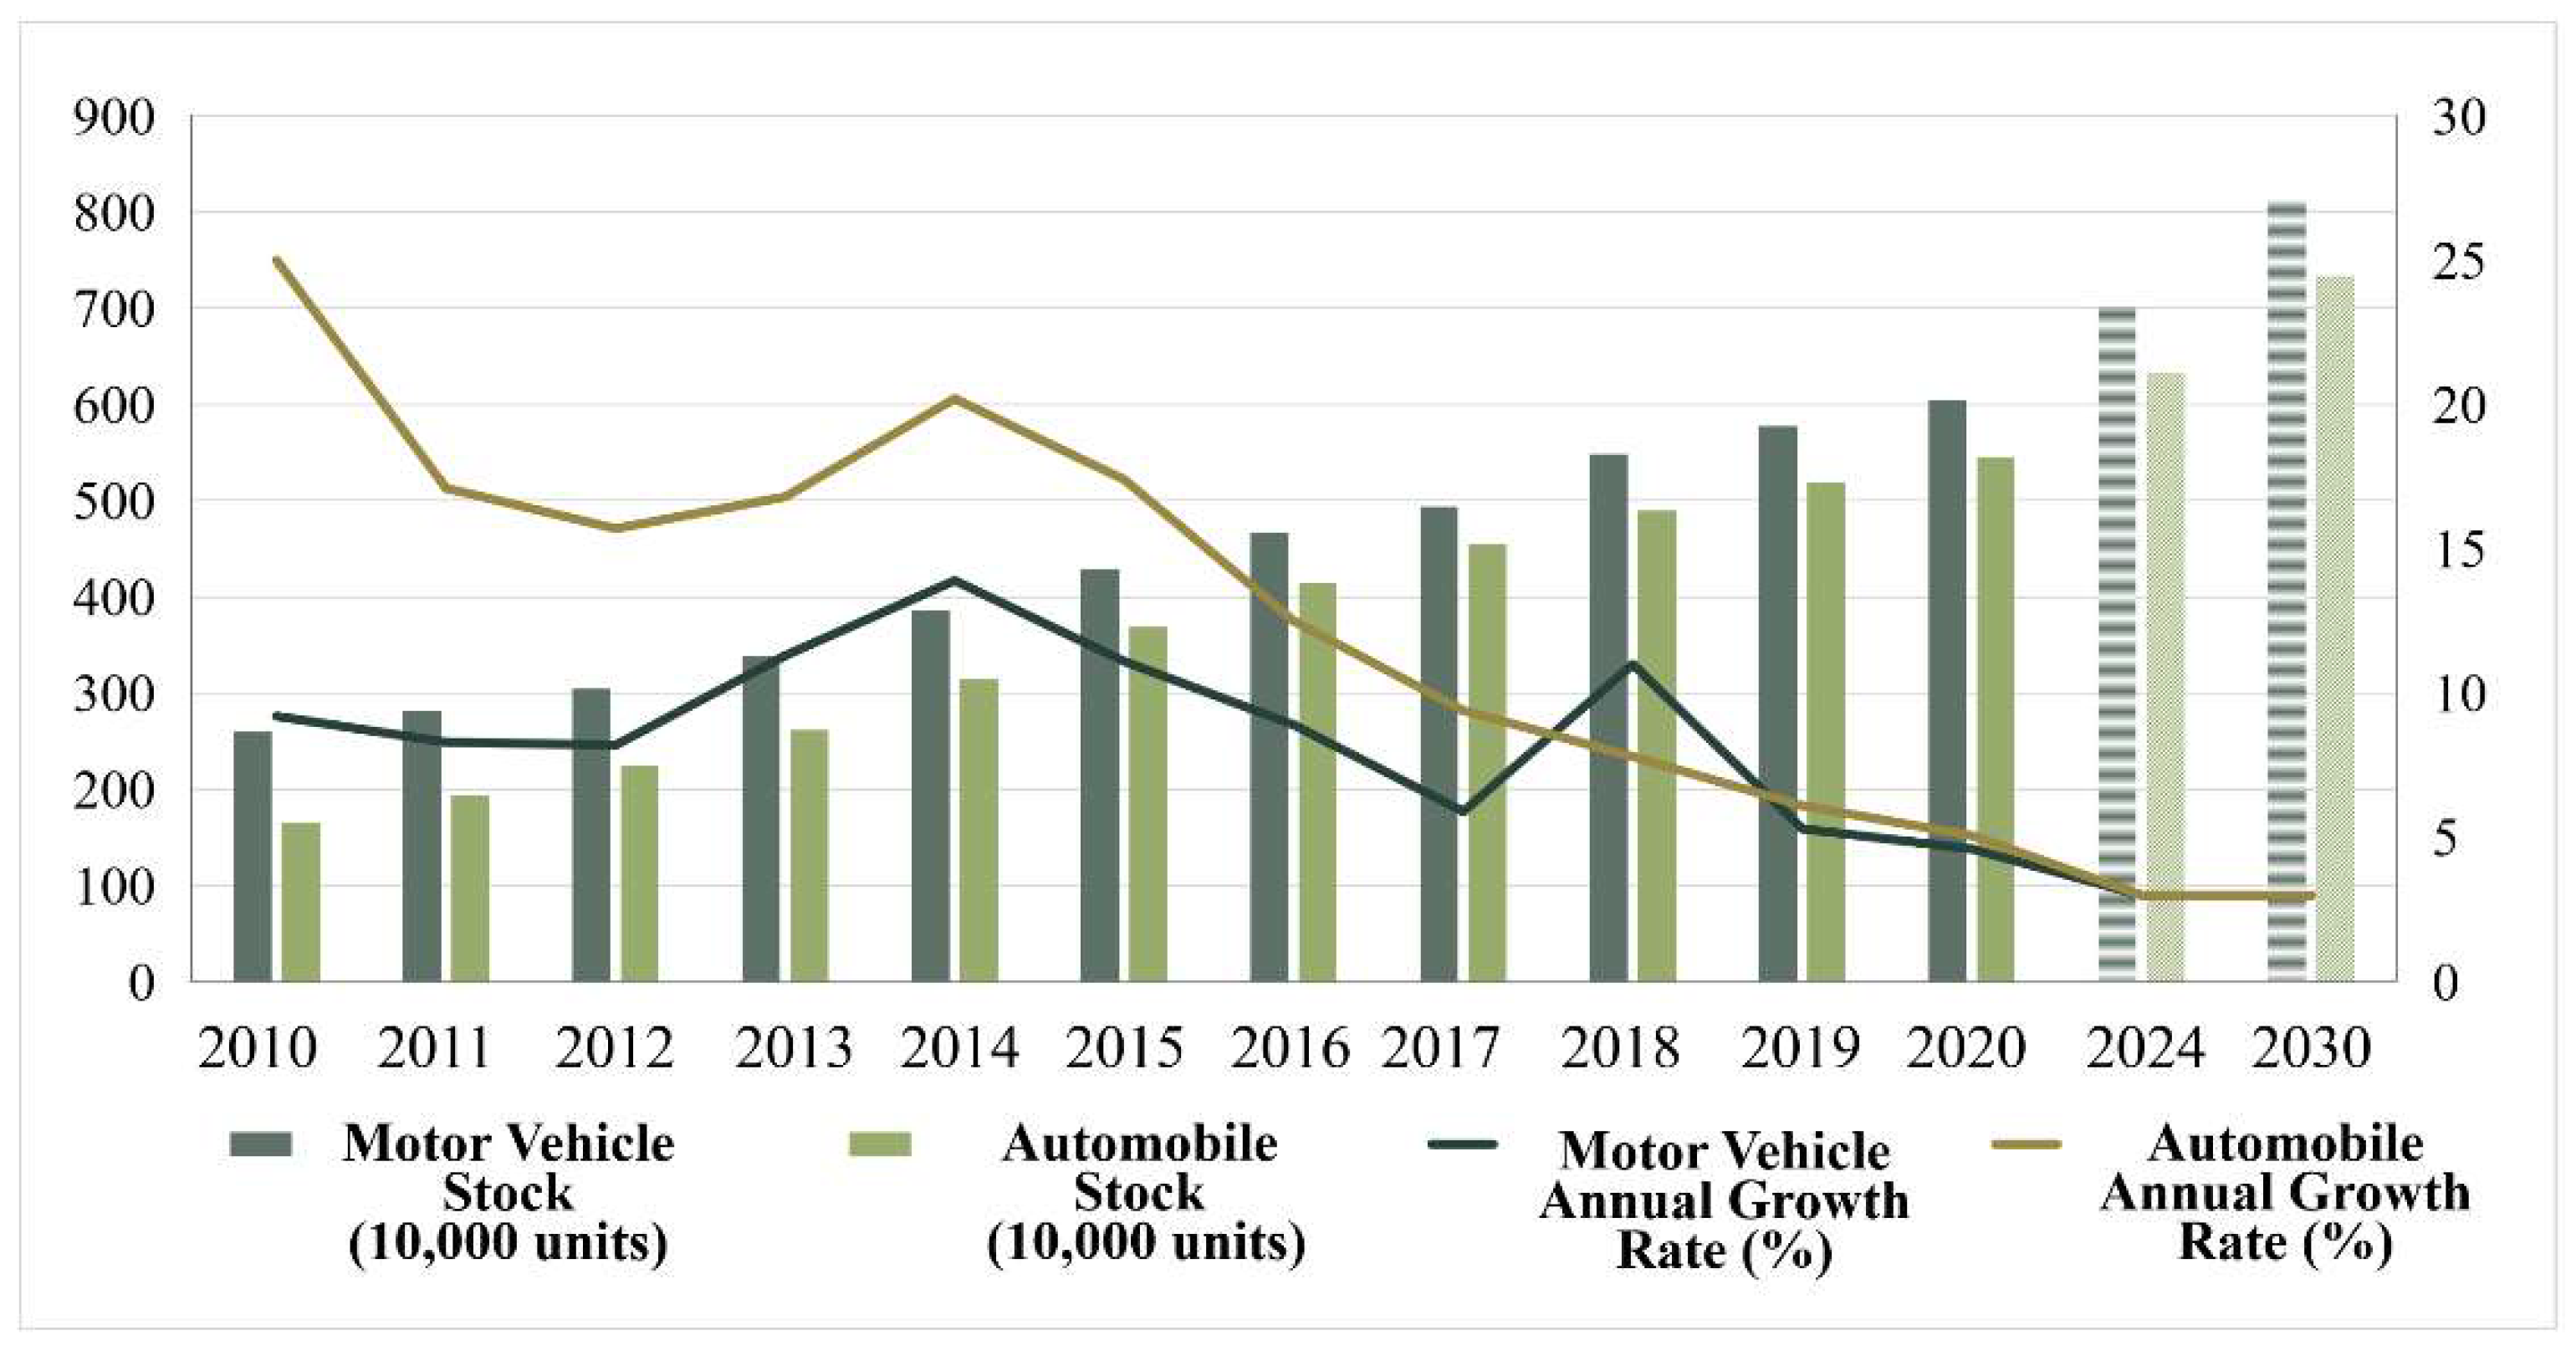
Figure 5.
Trends in Chengdu’s New Energy Vehicle (NEV) Population.
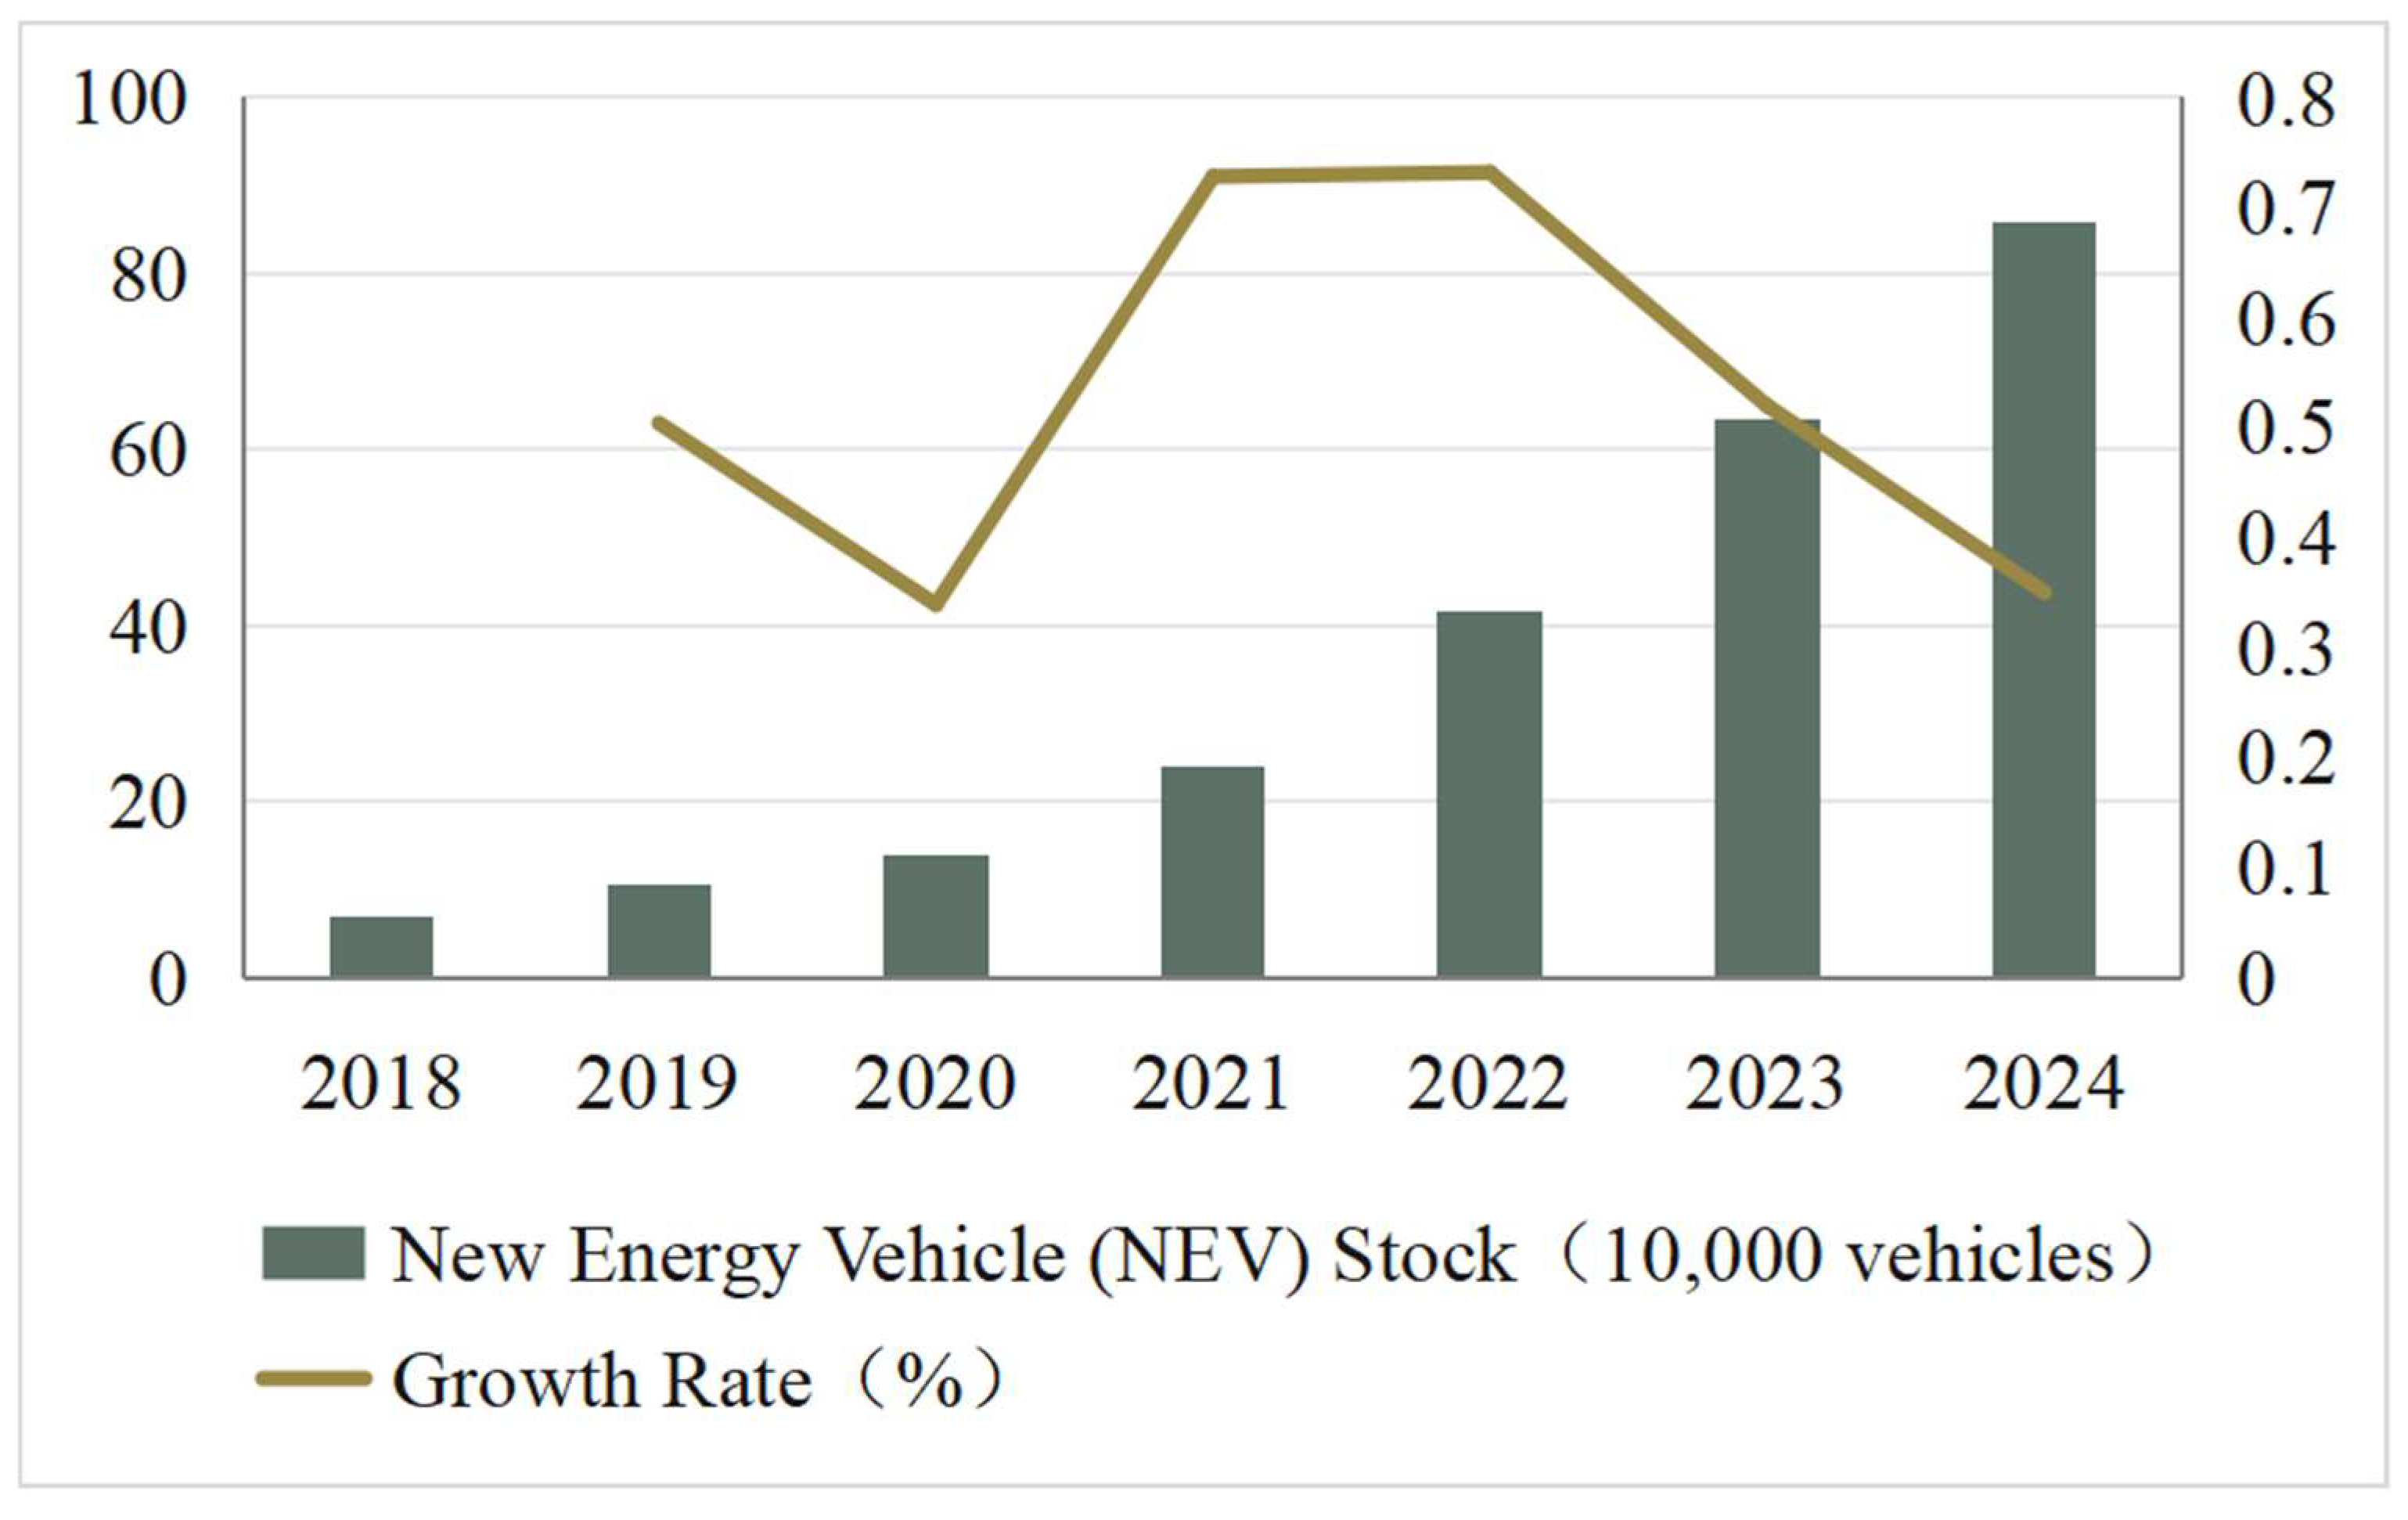
Figure 7.
Composition of Travel Modes in Chengdu’s Central Urban Area.
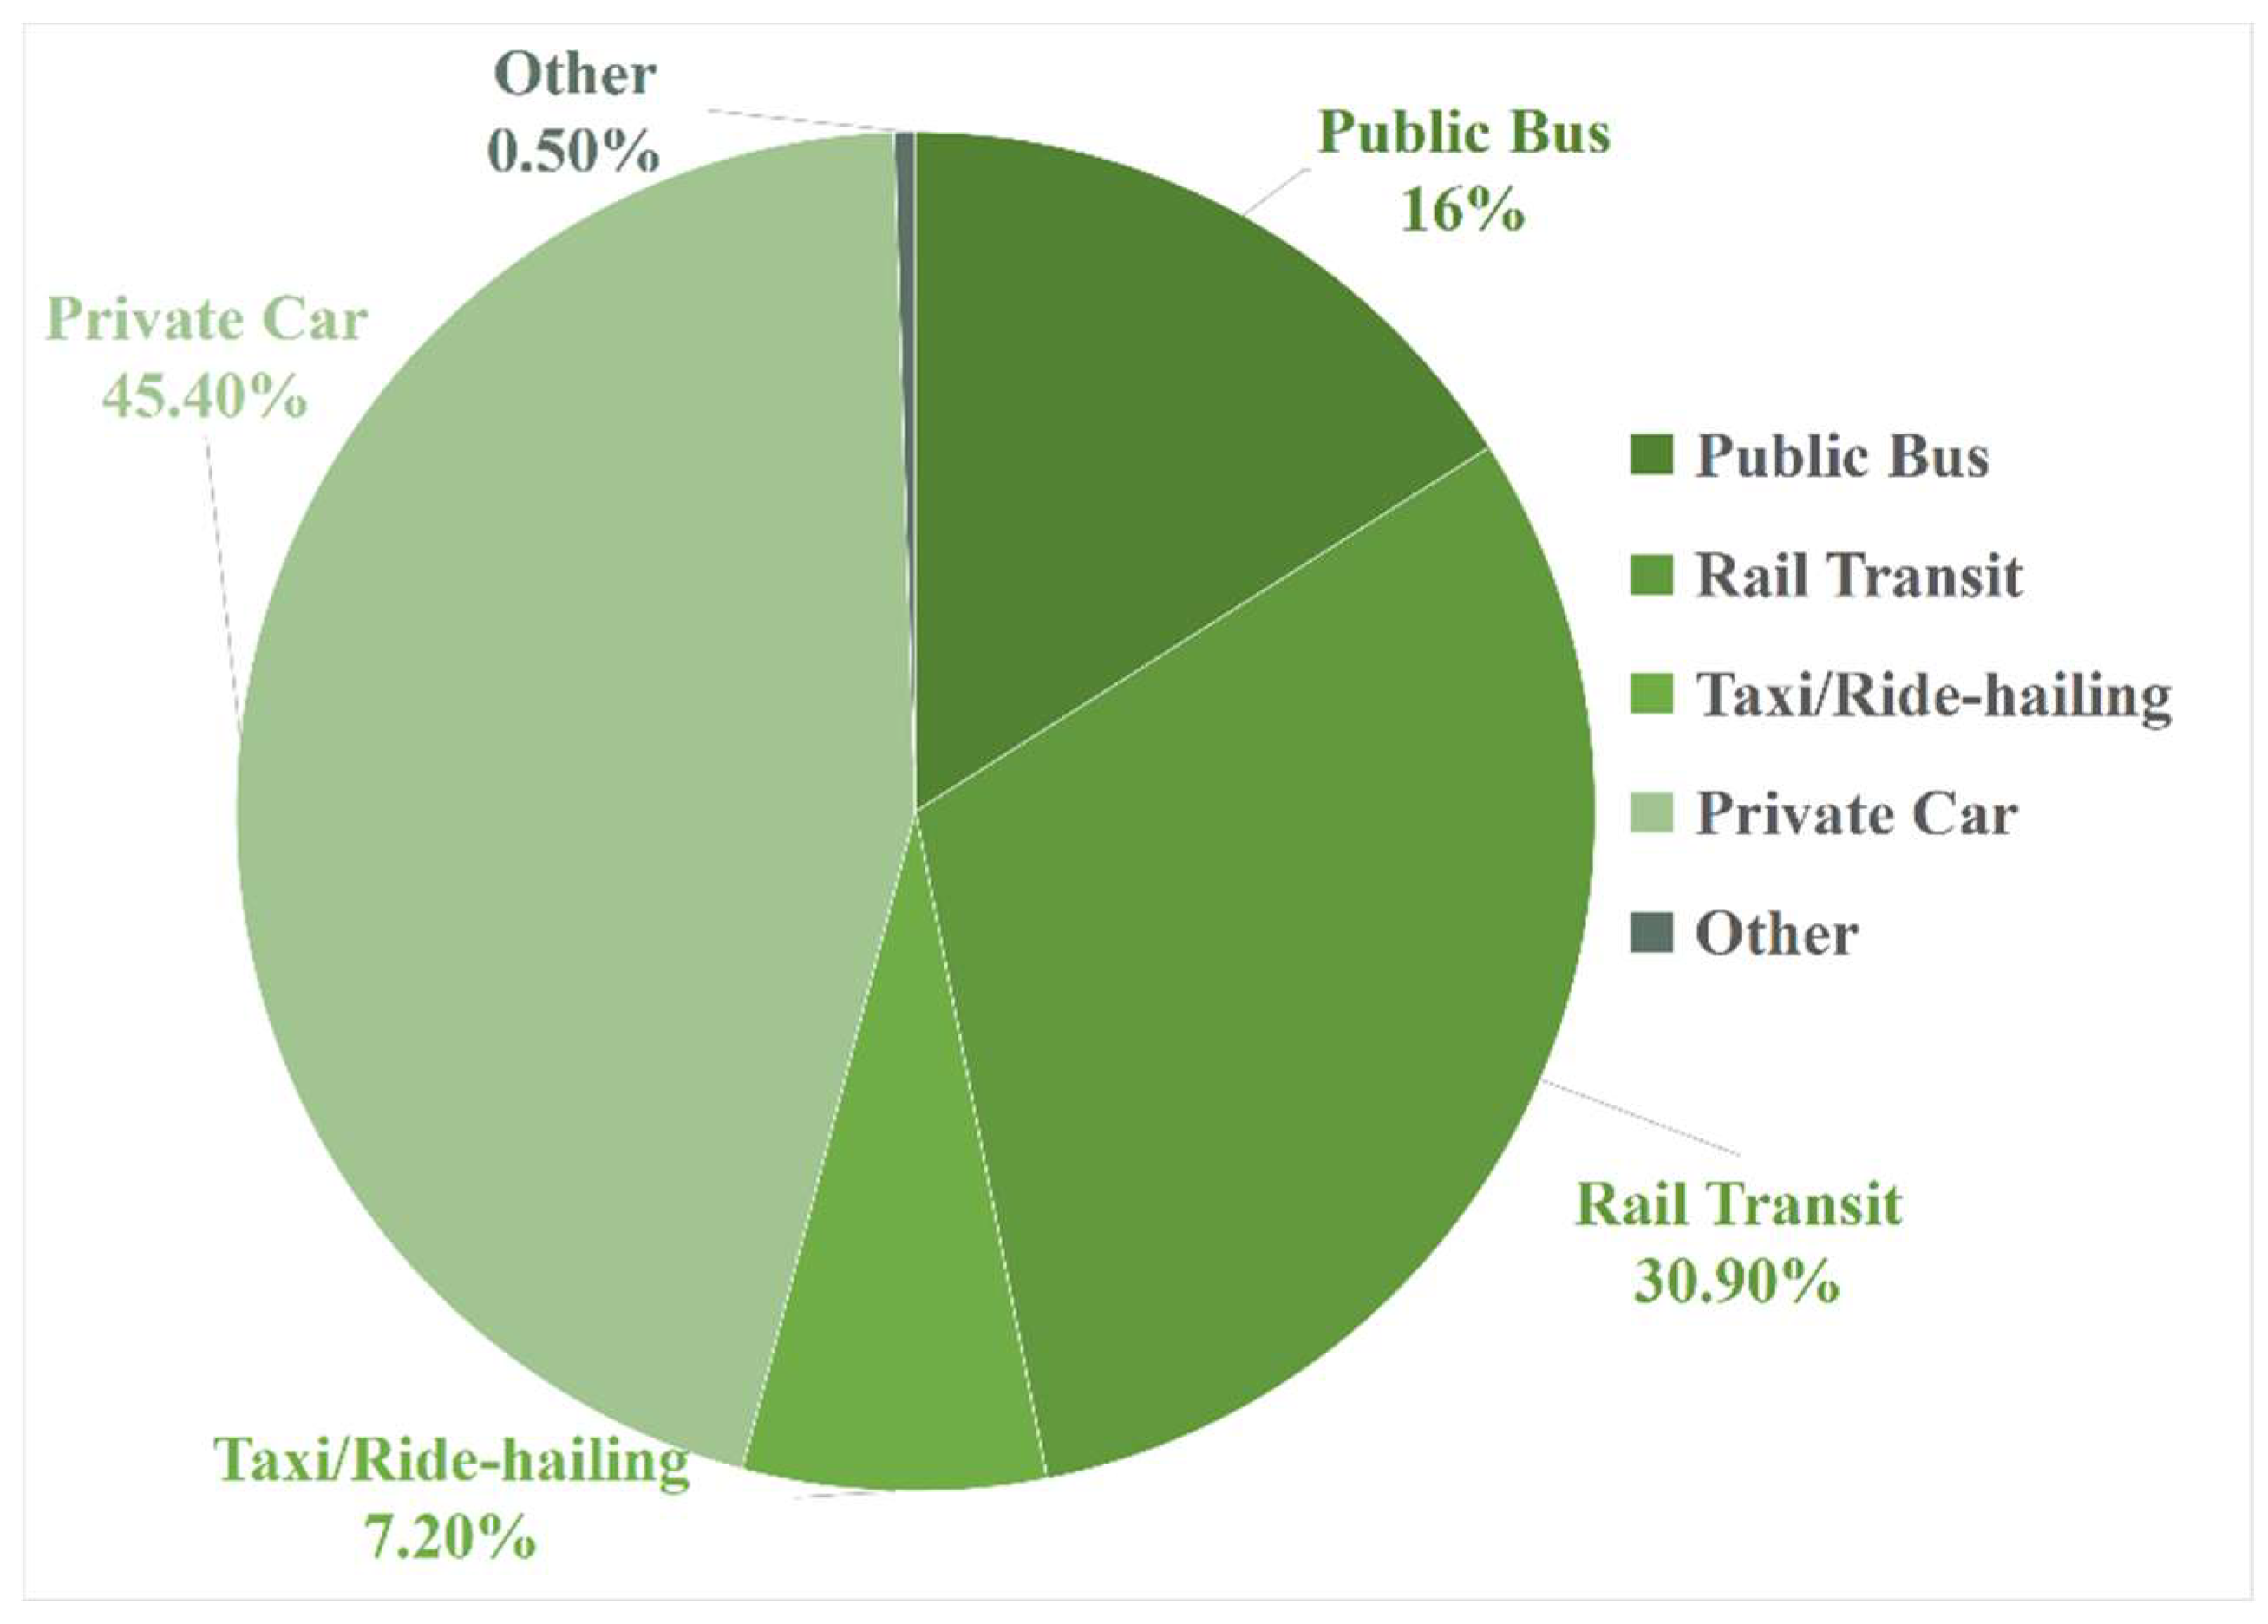
Figure 8.
Comparison of Freight Structure Across Cities.
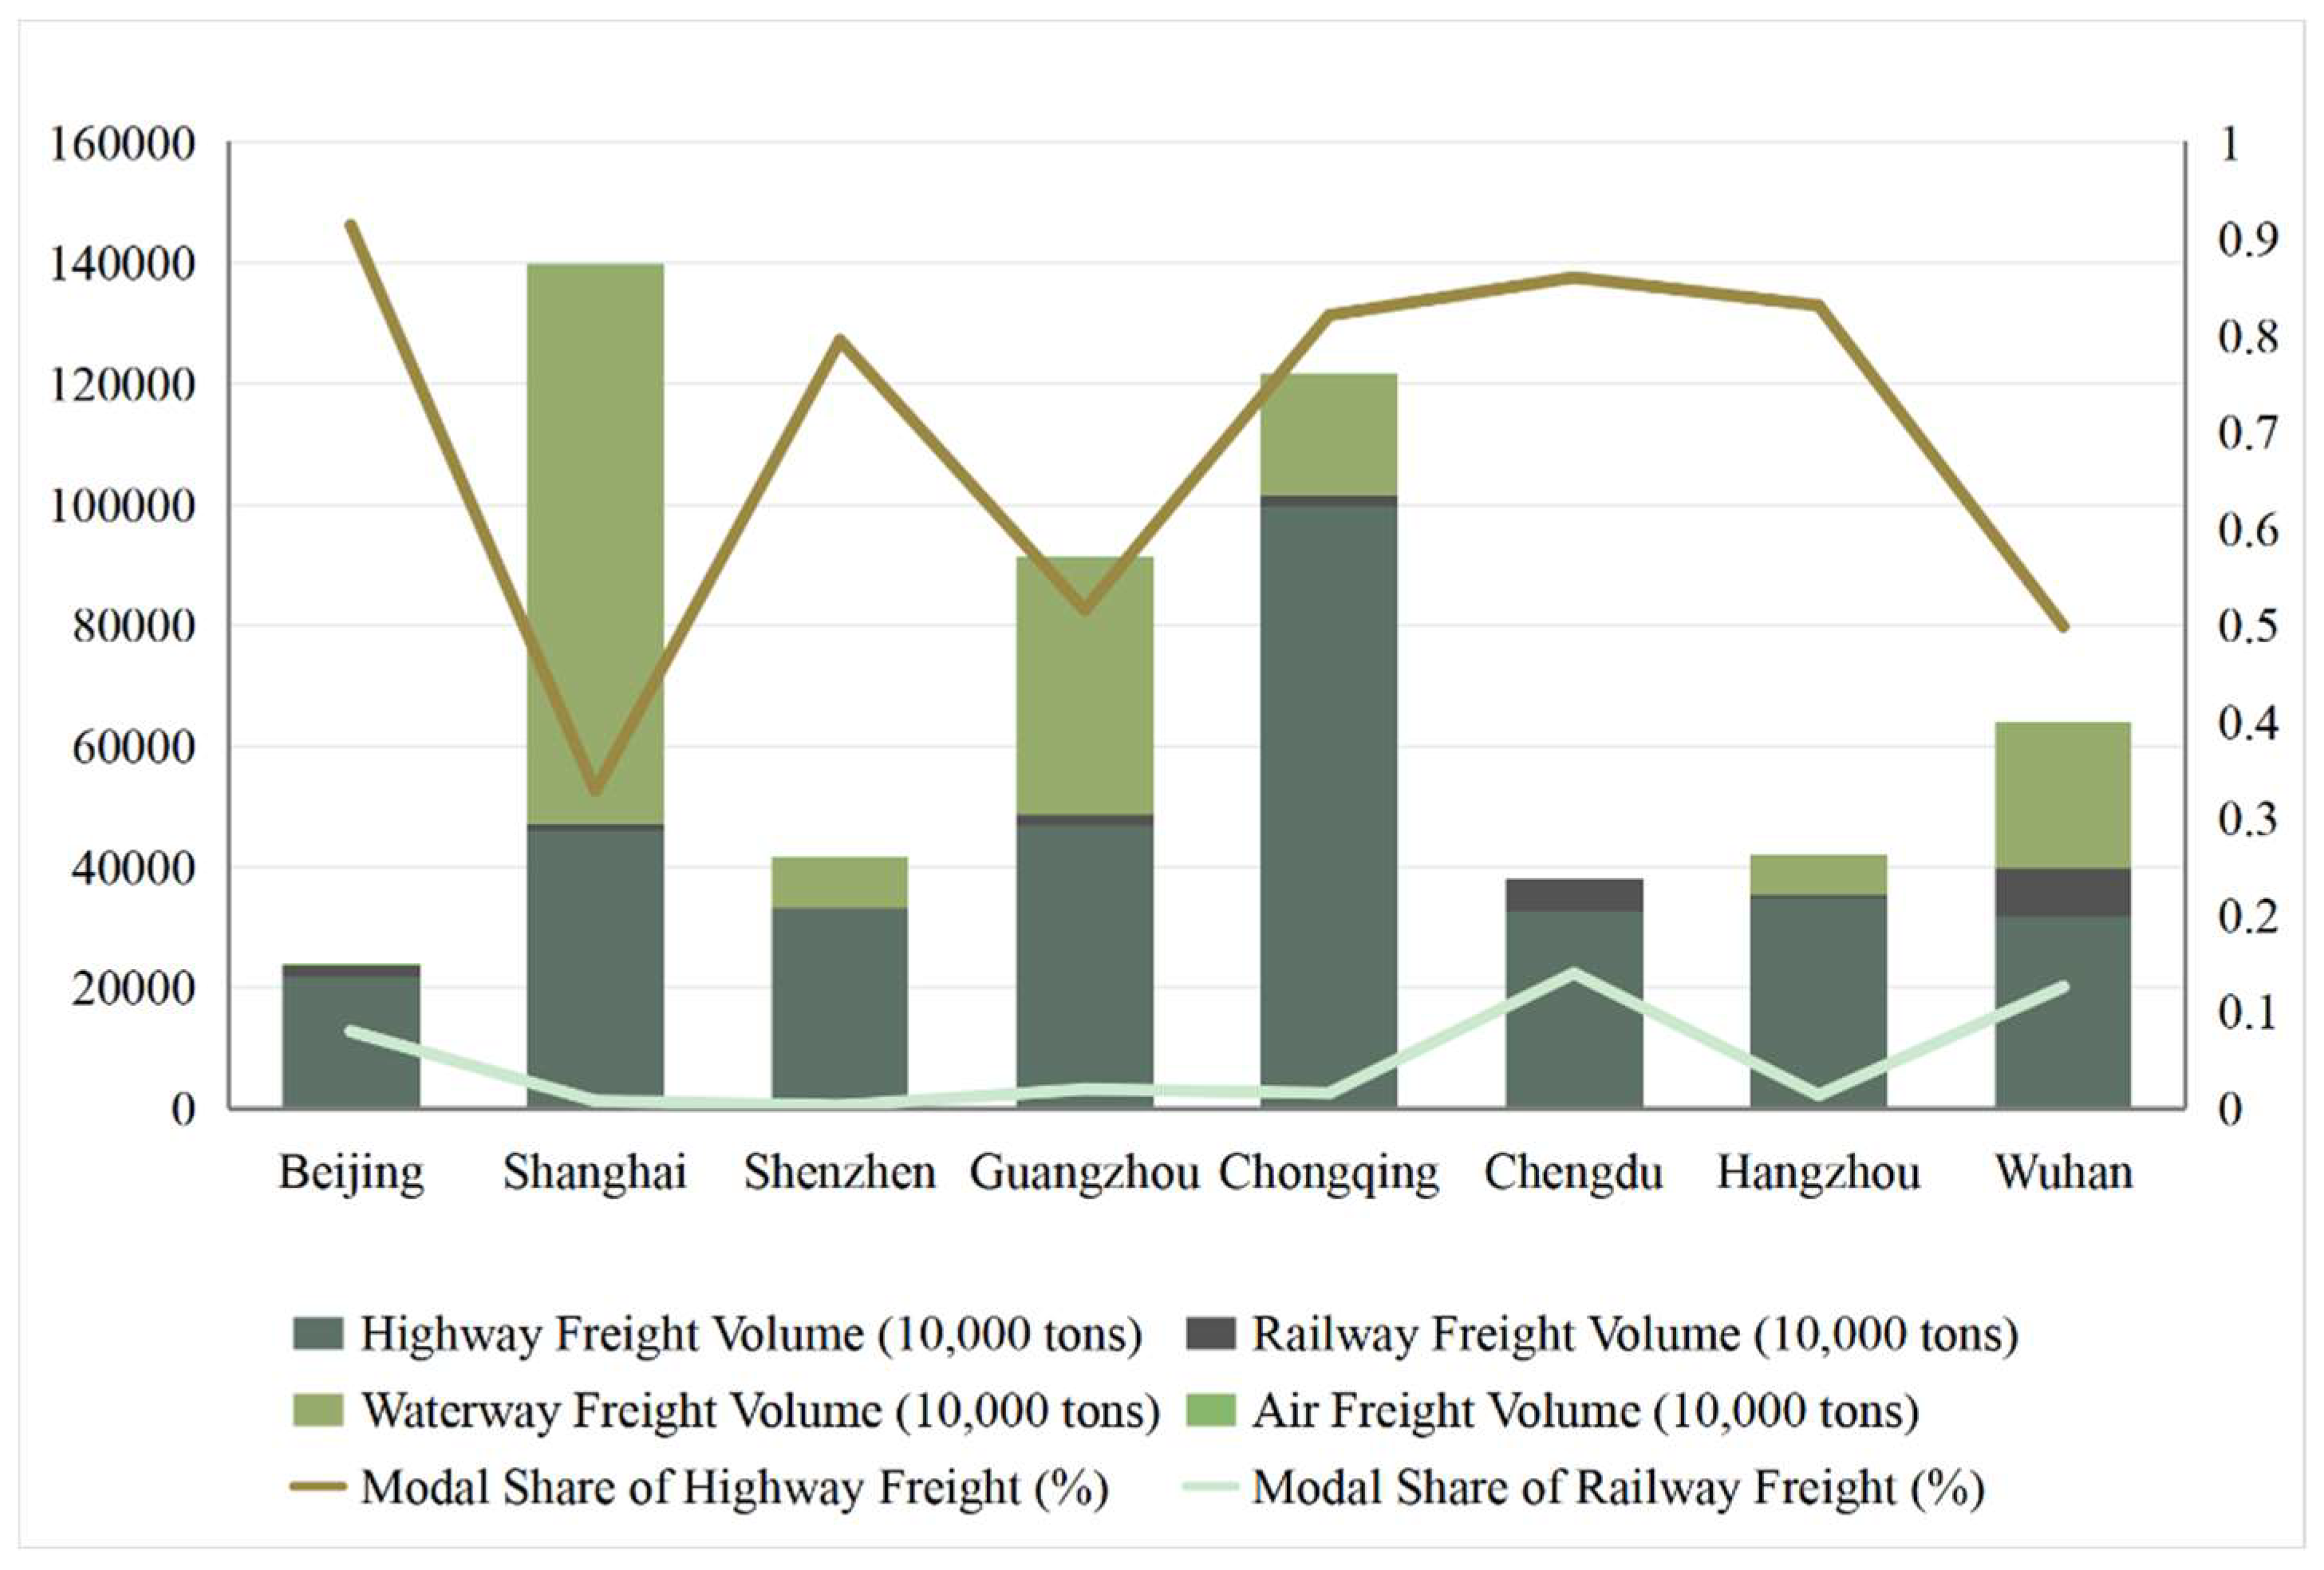

Table 1.
Calculation Methods by Transport Type.
| Transportation Modes | Utilization Based on Turnover Volume Calculation | Utilization Based on Fleet Ownership Calculation |
|---|---|---|
| Road Passenger/Freight Transport | √ | |
| Railway Passenger/Freight Transport | √ | |
| Civil Aviation Passenger/Freight Transport | √ | |
| Motorcycle | √ | |
| Subway | √ | |
| Bus | √ | |
| Taxi | √ | |
| Private Car | √ |
Table 2.
Emission Factors and Energy Consumption Coefficients.
| Vehicle Type | Energy Source | Energy Efficiency | Unit | Emission Factor | Unit |
|---|---|---|---|---|---|
| Public Bus | Diesel Fuel | 36.31 | l/100km | 0.002663 | l |
| Dual Fuel | 39.3 | kgce/100km | 0.002773 | kgce | |
| Electricity | 100 | kwh/100km | 0.000815 | kwh | |
| Gasoline | 34.3 | l/100km | 0.002121 | l | |
| Hybrid | 33.61 | l/100km | 0.001272 | l | |
| Liquefied Petroleum Gas | 65 | l/100km | n/a | l | |
| Natural Gas | 38 | m³/100km | 0.002162 | m³ | |
| Intercity Coach | Diesel Fuel | 25 | l/100km | 0.002663 | l |
| Dual Fuel | 1.17 | kgce/100km | 0.002773 | kgce | |
| Electricity | 100 | kwh/100km | 0.000815 | kwh | |
| Gasoline | 29.37 | l/100km | 0.002121 | l | |
| Hybrid | 33.61 | l/100km | 0.001272 | l | |
| Liquefied Petroleum Gas | 65 | l/100km | n/a | l | |
| Natural Gas | 24 | m³/100km | 0.002162 | m³ | |
| Private Passenger Vehicle | Diesel Fuel | 8 | l/100km | 0.002663 | l |
| Dual Fuel | 7 | kgce/100km | 0.002773 | kgce | |
| Electricity | 20 | kwh/100km | 0.000815 | kwh | |
| Gasoline | 10 | l/100km | 0.002121 | l | |
| Hybrid | 6 | l/100km | 0.001272 | l | |
| Liquefied Petroleum Gas | 10 | l/100km | n/a | l | |
| Natural Gas | 8 | m³/100km | 0.002162 | m³ | |
| Long-haul Freight Truck | Diesel Fuel | 4.5 | l/100km | 0.002663 | l |
| Dual Fuel | 4 | kgce/100km | 0.002773 | kgce | |
| Gasoline | 6.5 | l/100km | 0.002121 | l | |
| Natural Gas | 5.71 | m³/100km | 0.002162 | m³ | |
| MotorcycleAircraft | Gasoline | 3 | l/100km | 0.002121 | l |
| Fuel Oil | 800 | kg/LTO | 0.00302 | kgce |
Table 3.
Future Energy Consumption per Unit Levels for Freight and Passenger Transport under Different Scenarios.
Table 3.
Future Energy Consumption per Unit Levels for Freight and Passenger Transport under Different Scenarios.
| Vehicle Type | Railway | Highway | Civil Aviation |
|---|---|---|---|
| Freight Transport Energy Consumption(100t*km) | 4.00kwh | 8.3L(Gasoline) 6.3L(Diesel) |
29.5kg |
| Passenger Transport Energy Consumption(100m*km) | 3.12kwh | 1.13L(Gasoline)0.79L(Diesel) | 2.85kg |
1 The base-year energy consumption data for railway and civil aviation were referenced from the carbon emission intensity parameter settings under the baseline scenario in the Study on Carbon Emission Reduction Potential in China's Transport Sector. 2 The energy consumption data for road freight transport were sourced from the Research on Energy Conservation and Emissions Reduction Potential in Guangdong's Transport Sector Using Scenario Analysis Methodology. 3 Estimates were derived based on the fuel consumption per 100 kilometers for vehicles provided in the 2020 Chengdu Road Transport Primary Combustion Equipment Data Report.
Table 4.
Energy Consumption per 100 Kilometers for Different Vehicles.
| Vehicle Type | Fuel Type | Energy Consumption per 100 Kilometers |
|---|---|---|
| Bus | Natural Gas | 30(m³/100km) |
| Diesel | 42(L/100km) | |
| Electric | 64(kwh/100km) | |
| Hybrid | 31(L/100km) | |
| Taxi | Gasoline | 7.5(L/100km) |
| Electric | 17(kwh/100km) | |
| Hybrid | 6(L/100km) | |
| Natural Gas | 8.8(m³/100km) | |
| Subway | Electric | 104(kwh/m*km) |
| Private Car | Gasoline | 7(L/100km) |
| Electric | 16(kwh/100km) | |
| Hybrid | 6(L/100km) |
Table 5.
Estimated Carbon Emissions from Private Car Travel in Chengdu: 2017–2024.
| Year | Private car ownership (10,000 vehicles) |
Total Carbon Emissions (Mt) |
Growth Rate (%) |
|---|---|---|---|
| 2017 | 398.2 | 858.6 | 7.73 |
| 2018 | 420.3 | 906.1 | 5.53 |
| 2019 | 438.8 | 946.1 | 4.41 |
| 2020 | 441.4 | 951.6 | 0.58 |
| 2021 | 460.5 | 992.8 | 4.33 |
| 2022 | 503.3 | 1085.1 | 9.30 |
| 2023 | 542.8 | 1170.2 | 7.84 |
| 2024 | 579.6 | 1249.6 | 6.79 |
Table 6.
Estimated Carbon Emissions from Public Transportation in Chengdu: 2017–2024).
| Year | Carbon emissions from subway travel (Mt) | Carbon emissions from bus travel (Mt) | Total (Mt) |
|---|---|---|---|
| 2017 | 28.5 | 104.9 | 133.4 |
| 2018 | 39.7 | 111.2 | 150.9 |
| 2019 | 58.8 | 110.6 | 169.4 |
| 2020 | 71.0 | 102.5 | 173.5 |
| 2021 | 61.8 | 86.9 | 148.7 |
| 2022 | 95.1 | 102.9 | 198 |
| 2023 | 240.7 | 102.2 | 342.9 |
| 2024 | 283.9 | 102.3 | 386.1 |
Table 7.
Estimated Carbon Emissions from Freight Transport in Chengdu: 2017–2024.
| Year | Carbon emissions from road freight (Mt) |
Carbon emissions from rail freight (Mt) |
Carbon emissions from air freight (Mt) |
Total (Mt) | Share of carbon emissions from road freight (%) |
Share of carbon emissions from rail freight (%) |
Share of carbon emissions from air freight (%) |
|---|---|---|---|---|---|---|---|
| 2017 | 323.1 | 15.1 | 7.7 | 345.9 | 93.4 | 4.4 | 2.2 |
| 2018 | 343.6 | 16.7 | 8.3 | 368.6 | 93.2 | 4.5 | 2.3 |
| 2019 | 364.9 | 18.1 | 8.5 | 391.5 | 93.2 | 4.6 | 2.2 |
| 2020 | 411.8 | 19.4 | 9.0 | 440.2 | 93.6 | 4.4 | 2.0 |
| 2021 | 456.5 | 20.5 | 9.9 | 486.9 | 93.8 | 4.2 | 2.0 |
| 2022 | 475.9 | 21.2 | 8.8 | 505.9 | 94.1 | 4.2 | 1.7 |
| 2023 | 505.3 | 22.4 | 14.6 | 542.3 | 93.2 | 4.1 | 2.7 |
| 2024 | 516.8 | 25.4 | 16.5 | 558.7 | 92.5 | 4.6 | 3.0 |
Disclaimer/Publisher’s Note: The statements, opinions and data contained in all publications are solely those of the individual author(s) and contributor(s) and not of MDPI and/or the editor(s). MDPI and/or the editor(s) disclaim responsibility for any injury to people or property resulting from any ideas, methods, instructions or products referred to in the content. |
© 2025 by the authors. Licensee MDPI, Basel, Switzerland. This article is an open access article distributed under the terms and conditions of the Creative Commons Attribution (CC BY) license (http://creativecommons.org/licenses/by/4.0/).
Copyright: This open access article is published under a Creative Commons CC BY 4.0 license, which permit the free download, distribution, and reuse, provided that the author and preprint are cited in any reuse.


