
Submitted:
06 May 2025
Posted:
07 May 2025
You are already at the latest version
Preprints on COVID-19 and SARS-CoV-2
Abstract
Objectives. To confirm a conjecture from year 2020 of the SARS-CoV-2 (COVID-19) pandemic suggesting policy alternatives to substantially reduce mortality burden. Methods. Data from a global COVID-19 database comparing different countries on cumulative mortality and vaccination were analyzed in conjunction with surveys of seropositivity. Predictions of final mortality burden under an alternate policy scenario for Japan were calculated and the COVID-19 outcomes for China were assessed. Results. By 2025 Western countries (U.S, UK, Brazil and Italy) had cumulative mortality rates in the range 3,339-3,548 deaths per million, about 6-fold higher than East Asian and New Zealand ‘zero-COVID’ countries. Moderate virus suppression in Japan produced the lowest cumulative mortality of the countries analyzed; if earlier policies had been maintained, the predicted Japanese cumulative mortality rate by 2025 would be one-tenth that of the U.S, UK, Brazil and Italy and one-half to one-third that of other zero-COVID countries. For China transitioning from a zero-COVID policy in 2022-23, estimated 2025 cumulative mortality was 1607/M, about half of that of Western countries. Conclusion. To minimize COVID-19 mortality would require: 1) Innovation on systematic sampling of ambient airborne virus exposure to sustain low but non-zero virus levels across entire populations, and 2) seropositivity assessment (instead of mass PCR testing for new cases) for calibrating exposure management, and tracking and protecting high-risk populations.
Keywords:
exposure-response
; infection fatality ratio
; natural immunity
; seropositivity
; vaccination
; virus exposure
; zero-COVID
1. Introduction
Across the world national policies and practices determined the course of the catastrophic SARS-CoV-2 (COVID-19) pandemic, reflecting diverse societal cultural norms, views on basic medical issues, public health practices, resource limitations and political constraints. In the U.S two popular schools of thought on pandemic management emerged: 1) positions opposed to government intervention, promoted by the then current Trump 2016 Administration (denial of pandemic, individual rights, anti-vaccination, disregard of the vulnerable), and 2) the evolving CDC/National Institutes of Health policies for which Dr. Anthony Fauci was the public presence. The primary pandemic strategy that quickly emerged in the U.S. and Europe was rapid, large-scale vaccine development. Haphazard and inadequate primary-prevention efforts (reducing virus exposure) during early 2020, the critical pre-vaccine period, resulted in overwhelming challenges to hospital medicine and severe economic disruption. Meanwhile a notable global pivot in basic, medical and public health research occurred (reflected in many journal offerings) producing real-time insight for pandemic policy.
A comparison of high COVID-19 mortality countries (e.g., U.S., U.K, Brazil, Italy) with low mortality “zero-COVID” countries (e.g., Taiwan, New Zealand, South Korea, Japan) during 2020 – 2024 provides an opportunity to examine the role of natural immunization in relation to the general levels of virus exposure over the course of pandemic mortality. It will be argued here that neither high nor very-low mortality-rate countries achieved close to optimum pandemic management. This would require adopting fundamental concepts in a) environmental exposure assessment (surveys of airborne COVID-19 air concentrations) and b) epidemiological risk characterization (infection, case identification and fatality incidence rates) in relation to airborne virus exposure concentrations. The objective here is to define a strategy to manage COVID-19 exposures before and after vaccine availability in order to minimize the ultimate mortality burden and pandemic-associated social and economic disruption.
The Early Evidence on Developing Immunity
In Queens NY, U.S.A surveys revealed that many more people had acquired immunity than were known COVID-19 cases. [1] This important anecdotal observation was confirmed by formal investigations. Three months into the pandemic a population-based survey of COVID-19 immunity (positive seroconversion) in Santa Clara County, CA, U.S.A. estimated that 53,000 people (2.8% of the population) had COVID-19 immunity with only 1,200 confirmed COVID-19 cases. [2] There were 90 attributable deaths (0.17% of estimated total infections, 7.5% of cases). By Jan 1 2021, before vaccines, 25% of the U.S. (about 84 million) was estimated to have natural immunity from COVID-19 infection, and immunity was increasing at about 5% per month (unpublished estimates based on analyses performed by investigators at City University of New York (CUNY) [3,4] in collaboration with The New York Times [5] ). The simulation modeling studies of Pei et al. [6] estimated 105 million (about 31% of the U.S. population) had attained significant immunity as of Jan 26 2021, almost entirely from COVID-19 infection. By Feb 15 2021 the CUNY/NY Times research group estimated 38% of the U.S. population had acquired natural COVID-19 immunity and 4% had immunity by vaccination. [3–5] The 105 million estimated infections (producing immunity) corresponded to 25.3 million known cases of infection reported by CDC [7] and 400,000 deaths corresponding to a case fatality ratio (CFR) of 1.6% (400,000/25,300,000) and an infection fatality ratio (IFR) of about a 0.4% (400,000/105,000,000). Only 1 in 4 infections conferring immunity were being identified, suggesting that about three fourths of all infections were asymptomatic or low severity. Some severe COVID-19 infection cases may have been missed because of poor access to healthcare, unavailable testing, or flawed reporting. By April 2022, based on surveys from all 50 states, U.S. CDC estimated that 60% had been infected (about 195 million) and less than one in three infections were being detected. [8]
Observation that most infections resulting in immunity were not reliably identified suggests that low virus exposures can sufficiently stimulate the immune system to stay ahead of the developing infection (in healthy people) and that the immunity exposure-response is stronger (requires less virus exposure) than that for developing serious clinical or fatal disease; the number of new infections (conferring immunity) per fatality may be higher in populations with lower COVID-19 exposure levels. The implications of this conjecture posed urgent research questions. For example, 1) what should be the target exposure range and the sampling regime for ambient COVID-19 air concentrations when only fleeting contact with a “heavy spreader” was likely, and 2) what target levels were appropriate for venues where sustained contact with infected individuals was likely with exposures to larger-diameter particulate aerosols.[9,10] (A 50 µm droplet size would contain 1000 = 103 times the virus copies of a 5 m droplet.) However, research on primary prevention for COVID-19 was not a priority. The focus was on secondary prevention (early detection through extensive high-throughput testing, rapid development of COVID-19 vaccines), and tertiary prevention (improving critical care practices and capacity for COVID-19 cases).
There are no studies that characterized COVID-19 inhalation exposure over time in large populations, and the appropriate exposure metrics predicting immunity or serious disease based on the time-profile of exposure are not known. However, viral load in an index case is a useful surrogate. One study bearing on the infection exposure response investigated the 231,498 out of 2,474,066 contacts (9%) (traced from 1,064,004 presenting cases) who tested PCR-positive in England during 1 Sept 2020 to 28 Feb 2021.[11] COVID-19 seropositivity prevalence in contacts increased almost 4-fold across 5 levels of viral load (PCR assay) in the presenting case (p<0.001). COVID-19 case-mortality was also associated with viral load at diagnosis.[12]
The present work explores COVID-19 seropositivity prevalence in relation to case fatality, and reviews global summary data over the course of the pandemic comparing selected countries. Predictions of final pandemic mortality burdens taking into account vaccination are calculated. The results are discussed with respect to outstanding issues, a proposed strategy and research needs.
2. Methods
Based on the global COVID-19 database developed and curated at Johns Hopkins University[13] (and using a display interface[14]) COVID-19 cases, deaths and vaccination status during 2020 – 2024 were examined in selected countries. This database does not include demographic risk factors. A literature search was conducted on a) pre-vaccination COVID-19 seropositivity surveys, b) COVID-19 exposure response and c) exposure characterization issues such as airborne particle size. Cumulative pandemic mortality, IFR, and CFR were examined across countries and regions. Of special interest was the fatality infection ratio (FIR = 1/IFR): the number of infections conferring immunity per confirmed COVID-19 attributable death. Pandemic performance was assessed by examining the cumulative mortality rates (per million) over the years 2020 through 2024.
2.1. Trends in Fatality Infection Ratio
To examine whether the FIR is higher at lower virus exposures, data on seropositivity (positive COVID-19 seroconversion) were compared in relation to a measure of cumulative virus exposure. A surrogate for relative average COVID-19 exposure intensity was defined as the average COVID-19 mortality rate: calculated as the cumulative COVID-19 mortality in the region (up to the date of the survey) divided by a) the time since April 1 2020 and b) the population of the region surveyed. While this surrogate does not account for progress in medical mortality outcomes and is assumed linear (at the group or ecological level of analysis), it was believed to be the best available measure.
2.2. Extrapolation to Ultimate Pandemic Mortality Burden
In what appeared to be a special case involving Japan, the ultimate mortality burden associated with alternate hypothetical policy choices (reflected in COVID-19 annual mortality rates) was examined. This was accomplished by estimating the cumulative mortality resulting by start of 2025 based on the country’s mortality and vaccination history up until Jan. 1, 2023 (Supplementary File). Similarly, the cumulative mortality resulting by 2025 for Taiwan was estimated (due to Taiwan data no longer being reported in the global database[14] in 2024).
3. Results
3.1. Seropositivity and Exposure Response
Seropositivity surveys were reported from many countries during 2020 (Table 1). Some surveys were intended to be nationally representative (typically based on routine medical-laboratory blood samples); others assessed high-risk areas.[1,2,3,4,5,15,16,17,18,19,20,21,22,23,24,25,26,27,28,29,30,31,32,33,34] During 2020 before vaccine availability, seropositivity ranged from 0.0005 (Taiwan[15]) to 0.68 (South Africa[33] and Queens NY[1]) reflecting the non-uniform chronological spread of virus exposure, sampling strategies, and diverse prevention policies and practices. Variation in COVID-19 time-course and exposure levels across the surveys make interpretations with respect to FIR somewhat opaque but countries with zero-COVID policies (Taiwan, New Zealand, S Korea) appear to have the lowest CFRs compared to UK, Germany, Sweden, Spain and Italy (Table 1). Early in the pandemic CFRs would generally increase with improved COVID-19 death certification but decrease to a greater extent from increased testing availability over time and improved medical outcomes. The general decline in the CFR with calendar time within countries,[13] by an order of magnitude in some cases (Table 2), suggests that increasing natural and vaccination immunity and lower COVID-19 exposures have played an important role in reducing the CFR in addition to the effects of more thorough case ascertainment and improvements in medical management. Interestingly, the zero-COVID countries had average rates of new COVID deaths during 2022 that were comparable to those of the Western countries studied.
3.2. Retrospective Empirical Evidence from the COVID-19 Pandemic Across Countries
In the countries and regions with concurrent seropositivity survey and cumulative fatality data, the evidence supports the conjecture that the FIR decreases with increasing average COVID-19 mortality rate (surrogate for COVID-19 exposure), by an order of magnitude or more (Supplementary file, Figs. S1, S2, Tables S5, S6), but the data are limited. However, a comparison of the actual time course of COVID-19 cumulative mortality rates across countries provides further support with implications for optimum pandemic management. Most large or developed Western countries performed poorly on COVID-19 mortality, e.g., U.S., U.K., Brazil, Italy, and Russia (Figure 1); by the end of 2024, the U.S, UK, Italy and Brazil had sustained remarkably similar cumulative COVID mortality ranging 3,339-3,548 deaths per million (Table 3). In contrast New Zealand, Vietnam, Japan, Taiwan, and South Korea had quickly implemented stringent (zero- COVID) exposure controls that highly suppressed COVID-19 mortality (Figs. 1, 2); their cumulative death rates ranged 433-694 per million by the end of 2024, 6-fold lower than in the highest-risk Western countries (Table 3). China executed an extreme lockdown policy extending through 2022, which was abandoned or heavily revised in Dec 2022. Data availability and reporting criteria may have changed in China over time and COVID-19 mortality prior to 2023 are not analyzed in detail here.
Comparing the time course of COVID-19 deaths in the East Asian and New Zealand examples suggests important insights. Taiwan experienced the lowest mortality rate of any country until about July 2021. After seeing repeated minor spikes where 99.7% of new cases are asymptomatic or mild, Taiwan (apparently briefly) relaxed controls to achieve higher COVID-19 natural immunity (Figure 2).[35] As a result, cumulative COVID-19 mortality advanced to a new plateau still far below almost all other countries. Then, in May 2022 it appears that a further relaxation and/or advent of new variants preceded a sustained large increase in the COVID-19 annual mortality rate (slope of cumulative deaths curve, Figure 1) which, at the end of 2022, exceeded the COVID annual mortality rates in the U.S and UK (but less than rates in Italy and Germany) (Table 4). At the end of 2022 Taiwan’s COVID-19 cumulative mortality (deaths per million) was the highest of the zero-COVID countries analyzed here (Table 4, Figure 2). This history reveals how effective zero-COVID policies were in preventing deaths but also in avoiding natural immunity, and leaving citizens without immunity at high risk from endemic COVID-19 exposures. By the end of 2024 (when current mortality data for Taiwan was unavailable), based on the annual COVID mortality rate at the end of 2022, the total COVID-19 deaths in Taiwan were estimated to be 27,895 (1182×23.6, Table 4), which (at the same cumulative mortality rate) would be equivalent to 388,878 deaths in U.S. (vs. 1,167,292 reported).
New Zealand, with a zero-COVID policy and lockdown like Vietnam and China, exhibits a similar history with a single upward escalation in mortality rate occurring abruptly in Mar 2022 (Figure 2). South
Korea experienced modestly higher mortality beginning earlier (Jan 2021) but much higher starting in Feb 2022 and by the end of 2022 a cumulative mortality rate very close to that of Taiwan, and a mortality rate (slope of cumulative rates) comparable to Taiwan and New Zealand (Figure 2). The elevated mortality rates toward the end of 2022 in all the zero-COVID countries (Table 4) appear to reflect the low prevalence of immunity (natural or vaccine) and account for the high overall annual COVID mortality rate observed for those countries for the year 2022 (Table 2).
Of the better-performing countries analyzed Japan experienced higher mortality rates sooner, beginning in Nov 2020, but by Nov 2022 had the lowest cumulative COVID-19 mortality of any of the countries analyzed here. By the end of 2021 Japan and Vietnam had permitted the highest cumulative mortality rate (150 and 300/M respectively) but had the lowest cumulative mortality by the end of 2022 (Figure 2). At that time New Zealand also had the same cumulative rate but the annual rate was increasing rapidly as for S. Korea and Taiwan. These observations imply that higher early COVID-19 exposures (and mortality) in Japan were promoting higher immunization rates than in other zero-COVID countries but achieving lower cumulative mortality rates by the end of 2022, much lower than in the West. However, Japan experienced two abrupt increases in mortality (in January and July 2022); without them the cumulative mortality would have been substantially lower by end of 2022 (Figure 2). Vietnam appears to have relaxed precautions in about July 2021 with a corresponding leap in the mortality rate until April 2022 when either strong restrictions were re-imposed, or reporting of COVID-19 mortality was curtailed, although, Vietnam had the highest vaccination rate of all these countries (92% in Dec. 2022: 87% full initial protocol, 5% partial) and reported the lowest cumulative mortality (Figure 2). By Dec 1 2022, the East Asian/New Zealand countries with the highest cumulative deaths per million were those that appeared to maintain zero-COVID policies the longest, relaxing controls later in time (Taiwan, South Korea, New Zealand) compared to Japan (Figure 2). A reasonable inference from the zero-COVID country comparisons is that there is a range of COVID (airborne) exposure and associated low but significant mortality that ultimately results in the lowest cumulative mortality burden.
At the end of 2022 among all the countries analyzed Japan had the highest COVID-19 annual mortality rate, 986/M (Table 4). However, subsequent policy adjustments lowering COVID-19 mortality rates appear to have been implemented (Supplementary File, Fig. S5). Predictions of final burdens for all the countries analyzed were greater than observed (Supplementary File, Table S4) probably because the annual rate applied in the estimation algorithm for the period 2023-2024 was too high (based on the rate observed at the end of 2022). For the two counterfactual scenarios in Japan maintaining lower mortality rates (beginning in Jan. and July 2022) and avoiding the consequences of a major relaxation of controls, the prediction algorithm used here yielded cumulative mortality estimates of 348/M and 276/M for Jan. 1, 2025, respectively, much lower than the observed final rate, 598/M. The predicted counterfactual Japanese cumulative mortality outcomes were exceptionally superior to that of the Western countries (by a factor of 10) and were one-half to one-third of the mortality burdens of other zero-COVID countries (Table 4). These observations support the conclusion that the optimum COVID-19 control strategy would maintain a low but nonzero exposure level both before and after the advent of vaccination, and that the levels achieved by Japan (and possibly Vietnam) over the period 2020-2021 were close to ideal.
3.3. The Chinese COVID-19 Pandemic Experience
Analyses on the China policy changes implemented in late 2022 are revealing. Based on reported provincial cremation data, estimates of COVID-19 related mortality over time were calculated making supported assumptions that infections rose relatively uniformly across many provinces. [36] Multiple investigators (Ben Cowling, Univ. Hong Kong; Lauren Ancil Meyers, Univ. of Texas, Austin, and Zhanwei Du, Univ. Hong Kong; Yong Cai, Univ. North Carolina, Chapel Hill) estimated that the surge in mortality beginning in late 2022 comprised about 1.5 million deaths and by the end of the surge, about 80-90% of the Chinese population had been infected[36]. Investigators Du and Wang et al., using Chinese infection and vaccination data, estimated 1.2-1.7 million COVID-19 deaths during the surge. [37] An interpretation of the Chinese experience based on the present work suggests that large numbers of the Chinese population lacked COVID-19 immunity until late 2022 and were thus highly vulnerable following the policy change, especially those in high-risk populations. It is unclear to what extent, if any, protective behaviors and policies continued during the surge.
Applying to China the cumulative mortality rates of the other zero-COVID countries analyzed here (about 540/M by the end of 2022 and a population of 1.4 B) (Table 4), implies that about 750,000 total Chinese COVID-19 deaths (540/M × 1,400 M) occurred prior to the ‘surge’ and indicate that cumulative COVID-19 mortality by the end of the surge was probably about 2.25 million (1.5M + 750K), implying a final burden (cumulative mortality per million) of 1607 (2,250,000/1,400 M) and corresponding to 0.16% of the population (compared to 0.34% in the U.S.). Applying the U.S. COVID-19 cumulative mortality rate to China implies 4.8 M COVID-19 deaths would have occurred (2.25*0.34/0.16), suggesting the harsh Chinese zero-COVID policies may have avoided about 2.5 M deaths. The Chinese experience supports in a large population with rigorous virus suppression the inferences drawn here from the Western and East Asian/New Zealand countries analyzed. A more nuanced transition at the end of 2022 and a public health strategy from the outset optimizing natural and vaccination immunity perhaps could have avoided another million deaths in China with much less economic trauma.
3.4. Drivers of Pandemic Control Decisions
The COVID-19 annual mortality rates at the start of 2023 were higher in Italy, Germany and Taiwan, but highest (perhaps briefly) in Japan: 986/M (Figs. 1,2 (slope); Table 4) which was more than double those of New Zealand, South Korea and Taiwan. The observations suggest that relaxation of controls likely resulted in dramatic increases in mortality rates among the unprotected (Table 4: Annual mortality rate/M... population-at-risk). The basis for policy relaxations in the better-performing countries may have included considerations of real-time overall COVID-19 mortality rates. These rates were calculated on full populations, not those at risk (unvaccinated with no prior infection). If immunity from infection and vaccination was not accounted for, relaxing controls would have placed sharply escalating risk on those unprotected. The final (unprotected) rate at the end of 2022 in Japan (5245/M, Table 4) approaches that of the UK during its early crisis period (6751/M) (Table 5).
In China an estimated 80-90 percent immunity was achieved after the surge,[36] and if there was 20% immunity before the surge, then during the surge about 65% (85-20) of the population acquired immunity during 3 months. There were 1.5 M COVID-19 deaths during the surge,[36,37] implying about 600 infections per death (FIR =1.4B×0.65/1.5M =607), and indicating that most immunizations probably occurred at low virus exposures in a country coming out of extreme COVID-19 suppression. The high surge mortality rate among the unprotected in China (>5000/M per year, Table 5) may reflect a very non-uniform distribution of COVID-19 exposure, e.g., urban vs. rural areas, with urban areas having higher mortality and an FIR much lower than 607.
4. Discussion
4.1. Conclusions
Although Japan appears to have achieved a high level of success, this result may have been fortuitous. No programmatic incorporation of ambient exposure information was evident in any country for identifying target exposure levels. Exposure assessments have been done only in limited locations such as hospitals.[38] The superior performance of the East Asian countries studied and New Zealand may reflect important public health policy choices but also other critical factors such as the widespread acceptance and routine use of mask PPE and public trust in mandated preventative practices.
Specific key summary observations:
- Taiwan and possibly some other countries achieved very low COVID-19 mortality rates without resorting to comprehensive lockdowns.
- The countries maintaining very low COVID-19 mortality rates also largely suppressed natural COVID-19 immunity.
- Widespread acceptance of face masks in the zero-COVID countries suggests this is a critical component of exposure control along with distancing and isolation procedures. Downsizing routine respiratory protection from full cannister to N95 facemasks and primitive cloth masks would be appropriate based on exposure surveys.
- The policies followed in Japan during 2020-2021 appear to have been close to optimal for minimizing COVID-19 cumulative mortality.
- Decisions to relax strong COVID-1 suppression based on diminishing case or fatality rates resulted in high mortality among residual unprotected populations.
The findings here argue for:
- A primary prevention emphasis where ambient COVID-19 air concentrations would be systematically monitored to achieve levels in an optimal range. Supplemental sampling protocols would target: educational, retail, transportation, medical, recreational, and workplaces. Sampling the built environment would inform distancing, filtration and air-change goals. Efficient, low-cost sampling and high-throughput virus determination technology would be promoted.
- Assessment of seropositivity prevalence in place of routine, repetitive mass (costly) PCR testing for new cases. Seropositivity information would be needed to a) specify the operational parameters of the exposure control strategy, b) inform secondary prevention (e.g., allocation of masks), c) identify the remaining unprotected population, and d) facilitate decision-making in the workplace.[39,40,41,42,43,44,45,46] Seropositivity surveys would be conducted on small representative samples of local populations, but for some subpopulations would attempt to survey everyone: nursing homes, anyone having routine contact with the public or other workers; travelers by air or rail who could be required to show seropositivity documentation (or a current negative PCR test). Low-cost, high throughput seropositivity testing would drive innovations as happened with PCR testing for COVID-19 cases.
Issues of environmental justice should be examined in the larger context as communities at high risk due to housing, air pollution, transportation and other demographic factors are sources of general contagion and also where many workers reside including those deemed “essential” but afforded minimal protection.[47,48,49,50]
The early manifestations of avian virus (H5N1) human contagion in 2024 present an opportunity for epidemic management based on environmental science. [51,52] Rather than widespread testing of entire dairy herds by way of combined milk-sample determinations, efficient air sampling strategies for airborne virus would permit early identification of herds with an infection, leading to prompt interventions (to protect farm workers, identify and isolate infected cows, and promote natural immunization of herds while avoiding high exposures). Similarly there are implications for H5N1 management in other animal populations (e.g., chickens) with the intention of promoting natural immunity and avoiding mass culling of farm populations. Initial animal seropositivity studies associated with H5N1 air concentrations would be needed.
4.2. Strengths, Limitations and Needs
The countries with zero-COVID policies focused on here (in East Asia and New Zealand) all have modern public health infrastructure comparable or superior to that of the high-risk countries (e.g., UK, U.S, Italy, Brazil). The pandemic database curated at Johns Hopkins University was an exceptional resource. This review has multiple unavoidable limitations: a) paucity of published seroprevalence information with corresponding cumulative fatality data, b) incomplete or unrepresentative COVID-19 case and fatality identification over time, c) total absence of virus exposure information, and d) assumption of a quasi-linear exposure-response relationship at low exposures for seropositivity and fatality (required for analyses based on aggregated, summary data). Statistical variability generally was not an issue because for the measures of seropositivity, cases and fatalities the observed numbers were large except in the early days of the pandemic in zero-COVID countries. The choice of countries to study was restricting but included important examples contrasting mortality outcomes; no alternate country choices were investigated and discarded. For countries with limited public health resources, the available data would not have been adequate for this analysis. The conclusions presented need validation and elaboration within the public health and broader research community, including pandemic modelling research.
Acknowledgments
This research did not receive any funding from agencies in the public, commercial, or not-for-profit sectors. The work was performed by the author following retirement (2022) from of the National Institute for Occupational Safety and Health (NIOSH), U.S. Centers for Disease Control and Prevention (CDC). This work has not been reviewed and cleared for submission as a NIOSH publication and the findings and conclusions in this report are those of the author and do not represent the official position of NIOSH or CDC. Encouragement and very helpful suggestions were provided by David Michaels, Darius Sivin and anonymous journal reviewers.
References
- Goldstein J. 68% Have Antibodies in This Clinic. Can a Neighborhood Beat a Next Wave? New York Times July 9, 2020; https://www.nytimes.com/2020/07/09/nyregion/nyc-coronavirus-antibodies.html ; published July 9, 2020 Updated July 10, 2020.
- Bendavid E, Mulaney B, Sood N, et al. COVID-19 antibody seroprevalence in Santa Clara County, California. Intl J Epidemiol 2021; 50: 410-419. [CrossRef]
- Bartsch SM, Ferguson MC, McKinnell JA, et al. The potential health care costs and resource use associated with COVID-19 in the United States. Health Affairs 2020; 39: 927-935. [CrossRef]
- Bartsch SM, O’Shea KJ, Wedlock PT, et al. The benefits of vaccinating with the first available COVID-19 coronavirus vaccine. Am J Prev Med 2021; 60: 605−613.
- Conlen M, Smart C. When could the U.S. reach herd immunity? It’s complicated. New York Times Feb 24, 2021.
- Pei S, Yamana TK, Kandula S, et al. Burden and characteristics of COVID-19 in the United States during 2020. Nature 2021; 598: 338-341. [CrossRef]
- Barron J. Coronovirus update. New York Times Jan 26, 2021.
- Clarke KEN, Jones JM, Deng Y, et al. Seroprevalence of Infection-Induced SARS-CoV-2 Antibodies — United States, September 2021–February 2022. MMWR 2022 (April 29); 71: 606-608.
- Morawska L, Cao J. Airborne transmission of SARS-CoV-2: The world should face the reality. Environ Intl 2020; 139: 105730.
- Anderson EL, Turnham P, Griffin JR, et al. Consideration of the aerosol transmission for COVID-19 and public health. Risk Analysis 2020; 40: 902-907. [CrossRef]
- Lee LYW, Rozmanowski S, Pang M, et al. Severe acute respiratory syndrome coronavirus 2 (SARSCoV-2) infectivity by viral load, s gene variants and demographic factors, and the utility of lateral flow devices to prevent transmission. Clin Infectious Dis 2022; 74: 407-415. https://doi.10.1093/cid/ciab421.
- Pujadas E, Chaudhry F, McBride R, et al. SARS-Co V-2 viral load predicts COVID-19 mortality. Lancet / respiratory (letter) 2020; 8: e70. [CrossRef]
- Coronavirus Resource Center, Center for Systems Science and Engineering (CSSE), Johns Hopkins University, Baltimore MD; https://coronavirus.jhu.edu/about , https://systems.jhu.edu/research/public-health/ncov/.
- Mathieu E, Ritchie H, Rodés-Guirao L et al. (2020). Coronavirus Pandemic (COVID-19). Global Change Data Lab: Published online at OurWorldInData.org: https://ourworldindata.org/coronavirus.
- Ho H-L, Wang F-Y, Lee H-R, et al. Seroprevalence of COVID-19 in Taiwan revealed by testing anti-SARS-CoV-2 serological antibodies on 14,765 hospital patients. Lancet Regional Health – Western Pacific 3 (2020) 100041. [CrossRef]
- Carlton LH, Chen T, Whitcombe AL, et al. Charting elimination in the pandemic: a SARS-CoV-2 serosurvey of blood donors in New Zealand. Epidemiol Infection 2021; 149: e173, 1-4. [CrossRef]
- Nah E-H, Cho S, Park H, et al. Nationwide seroprevalence of antibodies to SARS-CoV-2 in asymptomatic population in South Korea: a cross-sectional study. BMJ Open 2021; 11: e049837. [CrossRef]
- Hasan T, Pham TN, Nguyen TA, et al. Sero-prevalence of SARS-CoV-2 antibodies in high-risk populations in Vietnam. Int J Environ Res Public Health 2021; 18 6353. [CrossRef]
- Gornyk D, Harries M, Glöckner S, et al. SARS-CoV-2 seroprevalence in Germany—a population-based sequential study in seven regions. Dtsch Arztebl Int 2021; 118: 824-831. [CrossRef]
- Doi A, Iwata K, Kuroda H, et al. Estimation of seroprevalence of novel coronavirus disease (COVID-19) using preserved serum at an outpatient setting in Kobe, Japan: A cross-sectional study. Clin Epidemiol Global Health 2021; 11: 100747. [CrossRef]
- Reuters. Only 5% of Spain’s population has coronavirus antibodies, despite severe outbreak: study. https://globalnews.ca/news/7144280/spain-immunity-study-coronavirus/ Updated July 6, 2020, accessed Nov 17, 2022.
- Ahlander J, Pollard N. Swedish antibody study shows long road to immunity as COVID-19 toll mounts. Reuters. https://www.reuters.com/article/us-health-coronavirus-sweden-strategy/swedish-antibody-study-shows-long-road-to-immunity-as-COVID-19-toll-mounts-idUSKBN22W2YC , May 20, 2020; accessed Nov 17, 2022.
- Huergo LF, Paula NM, Gonçalves ACA, et al. sars-cov-2 seroconversion in response to infection and vaccination: a time series local study in Brazil. Microbiol Spectrum 2022; 10: 10.1128/ spectrum.01026-2022.
- Wells PM, Doores KJ, Couvreur S, et al. Estimates of the rate of infection and asymptomatic COVID-19 disease in a population sample from SE England. J Infection 2020; 81: 931-936. [CrossRef]
- Shakiba M, Nazemipour M, Heidarzadeh A, et al. Prevalence of asymptomatic COVID-19 infection using a seroepidemiological survey. Epidemiol Infection 2020; 148: e300, 1-3. [CrossRef]
- Talaei M, Faustini S, Holt H, et al. Determinants of pre-vaccination antibody responses to SARS-CoV-2: a population-based longitudinal study (COVIDENCE UK). BMC Medicine 2022; 20: 87. [CrossRef]
- Prakash O, Solanki B, Sheth JK, et al. Assessing seropositivity for IgG antibodies against SARS-CoV-2 in Ahmedabad city of India: a cross-sectional study. BMJ Open 2021; 11: e044101. https://doi.10.1136/bmjopen-2020-044101.
- Stefanelli P, Bella A, Fedele G, et al. Prevalence of SARS-CoV-2 IgG antibodies in an area of northeastern Italy with a high incidence of COVID-19 cases: a population-based Study. Clin Microbiol Infection 2021; 27: 633.e1e633.e7. [CrossRef]
- Alhazmi A, Alamer E, Abdelwahab S, et al. Community-based seroprevalence of SARS-CoV-2 antibodies following the First Wave of the COVID-19 pandemic in Jazan Province, Saudi Arabia. Int J Environ Res Public Health 2021; 18: 12451. [CrossRef]
- Bin-Ghouth AS, Al-Shoteri S, Mahmoud N, et al. SARS-CoV-2 seroprevalence in Aden, Yemen: a population-based study. Intl J Infectious Dis 2022; 115: 239-244. [CrossRef]
- Mattar S, Alvis-Guzman N, Garay E, et al. Severe acute respiratory syndrome Coronavirus 2 seroprevalence among adults in a tropical city of the Caribbean area, Colombia: Are we much closer to herd immunity than developed countries? Open Forum Inf Dis 2020; 7: ofaa550. [CrossRef]
- Adhikari A, Yin J. Short-term effects of ambient ozone, pm2.5, and meteorological factors on COVID-19 confirmed cases and deaths in Queens, New York. Int J Environ Res Public Health 2020; 17: 4047. https://doi.10.3390/ijerph17114047.
- Madhi SA, Kwatra G, Myers JE, et al. Population immunity and COVID-19 severity with omicron variant in South Africa. N Engl J Med 2022; 386: 1314-1326. https://doi.10.1056/NEJMoa2119658.
- Einhauser S, Peterhoff D, Beileke S, et al. Time trend in SARS-CoV-2 seropositivity, surveillance detection- and infection fatality ratio until Spring 2021 in the Tirschenreuth County—results from a population-based longitudinal study in Germany. Viruses 2022; 14: 1168. [CrossRef]
- Qin A, Chang A, Qian I. Eyes on its economy, Taiwan shifts to coexisting with COVID. New York Times May 10, 2022.
- Xiao M, Hvistendahl M, Glanz J. Data briefly hinted at China’s hidden COVID toll. New York Times July 20, 2023.
- Du Z, Wang Y, Yuan Bai Y, et al. Estimate of COVID-19 deaths, China, December 2022–February 2023. Emerg Inf Disease 2023 29:2121-2124.
- Stern RA, Koutrakis P, Martins MAG, et al. Characterization of hospital airborne SARS-CoV-2. Respir Res 2021; 22: 73. [CrossRef]
- USDA. https://www.ers.usda.gov/COVID-19/rural-america/meatpacking-industry/ May 13, 2021.
- Hassan A. Coronavirus cases and deaths were vastly underestimated in U.S. meatpacking plants, a House report says. New York Times, Oct. 28, 2021 https://www.nytimes.com/2021/10/28/world/meatpacking-workers-COVID-cases-deaths.html.
- House report. Memorandum: Coronavirus infections and deaths among meatpacking workers at top five companies were nearly three times higher than previous estimates. U.S. House of Representatives, Select Subcommittee on the Coronavirus Crisis, October 27, 2021. https://coronavirus-democrats-oversight.house.gov/sites/democrats.coronavirus.house.gov/files/2021.10.27%20Meatpacking%20Report.Final.pdf.
- Grabell M. The plot to keep meatpacking plants open during COVID-19. Propublica, May 13, 2022; https://www.propublica.org/article/documents-COVID-meatpacking-tyson-smithfield-trump.
- Mutambudzi M, Niedzwiedz C, Macdonald EB, et al. Occupation and risk of severe COVID-19: prospective cohort study of 120 075 UK Biobank participants. Occup Environ Med 2021; 78: 307-314.
- Billock RM, Steege AL, Miniño A. COVID-19 mortality by usual occupation and industry: 46 States and New York City, United States, 2020. National Vital Statistics Reports 2022; 71(6): 1-33, October 28, 2022.
- Carlsten C, Gulati M, Hines S, et al. COVID-19 as an occupational disease. Amer J Ind Med 2021; 64: 227-237.
- Michaels D, Wagner GR. Occupational Safety and Health Administration (OSHA) and worker safety during the COVID-19 pandemic. JAMA 2020; 324: 1389-1390.
- Cole HVS, Anguelovski I, Baró F, et al. The COVID-19 pandemic: power and privilege, gentrification, and urban environmental justice in the global north. Cities & Health 2021; 5(No. S1): S71-S75; [CrossRef]
- Benmarhnia T. Linkages between air pollution and the health burden from COVID-19: methodological challenges and opportunities. Am J Epidemiol 2020; 189(11): 1238-1243.
- Terrell KA, James W. Racial disparities in air pollution burden and COVID-19 deaths in Louisiana, USA, in the context of long-term changes in fine particulate pollution. Environ Justice 2022; 15(5), published online:14 Oct 2022; [CrossRef]
- Ellis A. Examining an intersection of environmental justice and COVID-19 risk assessment: a review. University of Tennessee at Chattanooga, Honors Theses, 2021; https://scholar.utc.edu/honors-theses/347.
- Mandavilli A, Qui L, Athes E. Dairy workers at risk in outbreak of bird flu. New York Times May 10, 2024.
- Bright R. Testing can stop the spread of bird flu. New York Times June 4, 2024.
Figure 1.
Cumulative confirmed Covid-19 deaths per million for selected countries (data from Johns Hopkins University CSSE[13], displayed by software at OurWorldInData.org[14] and provided under Creative Commons BY open access license).
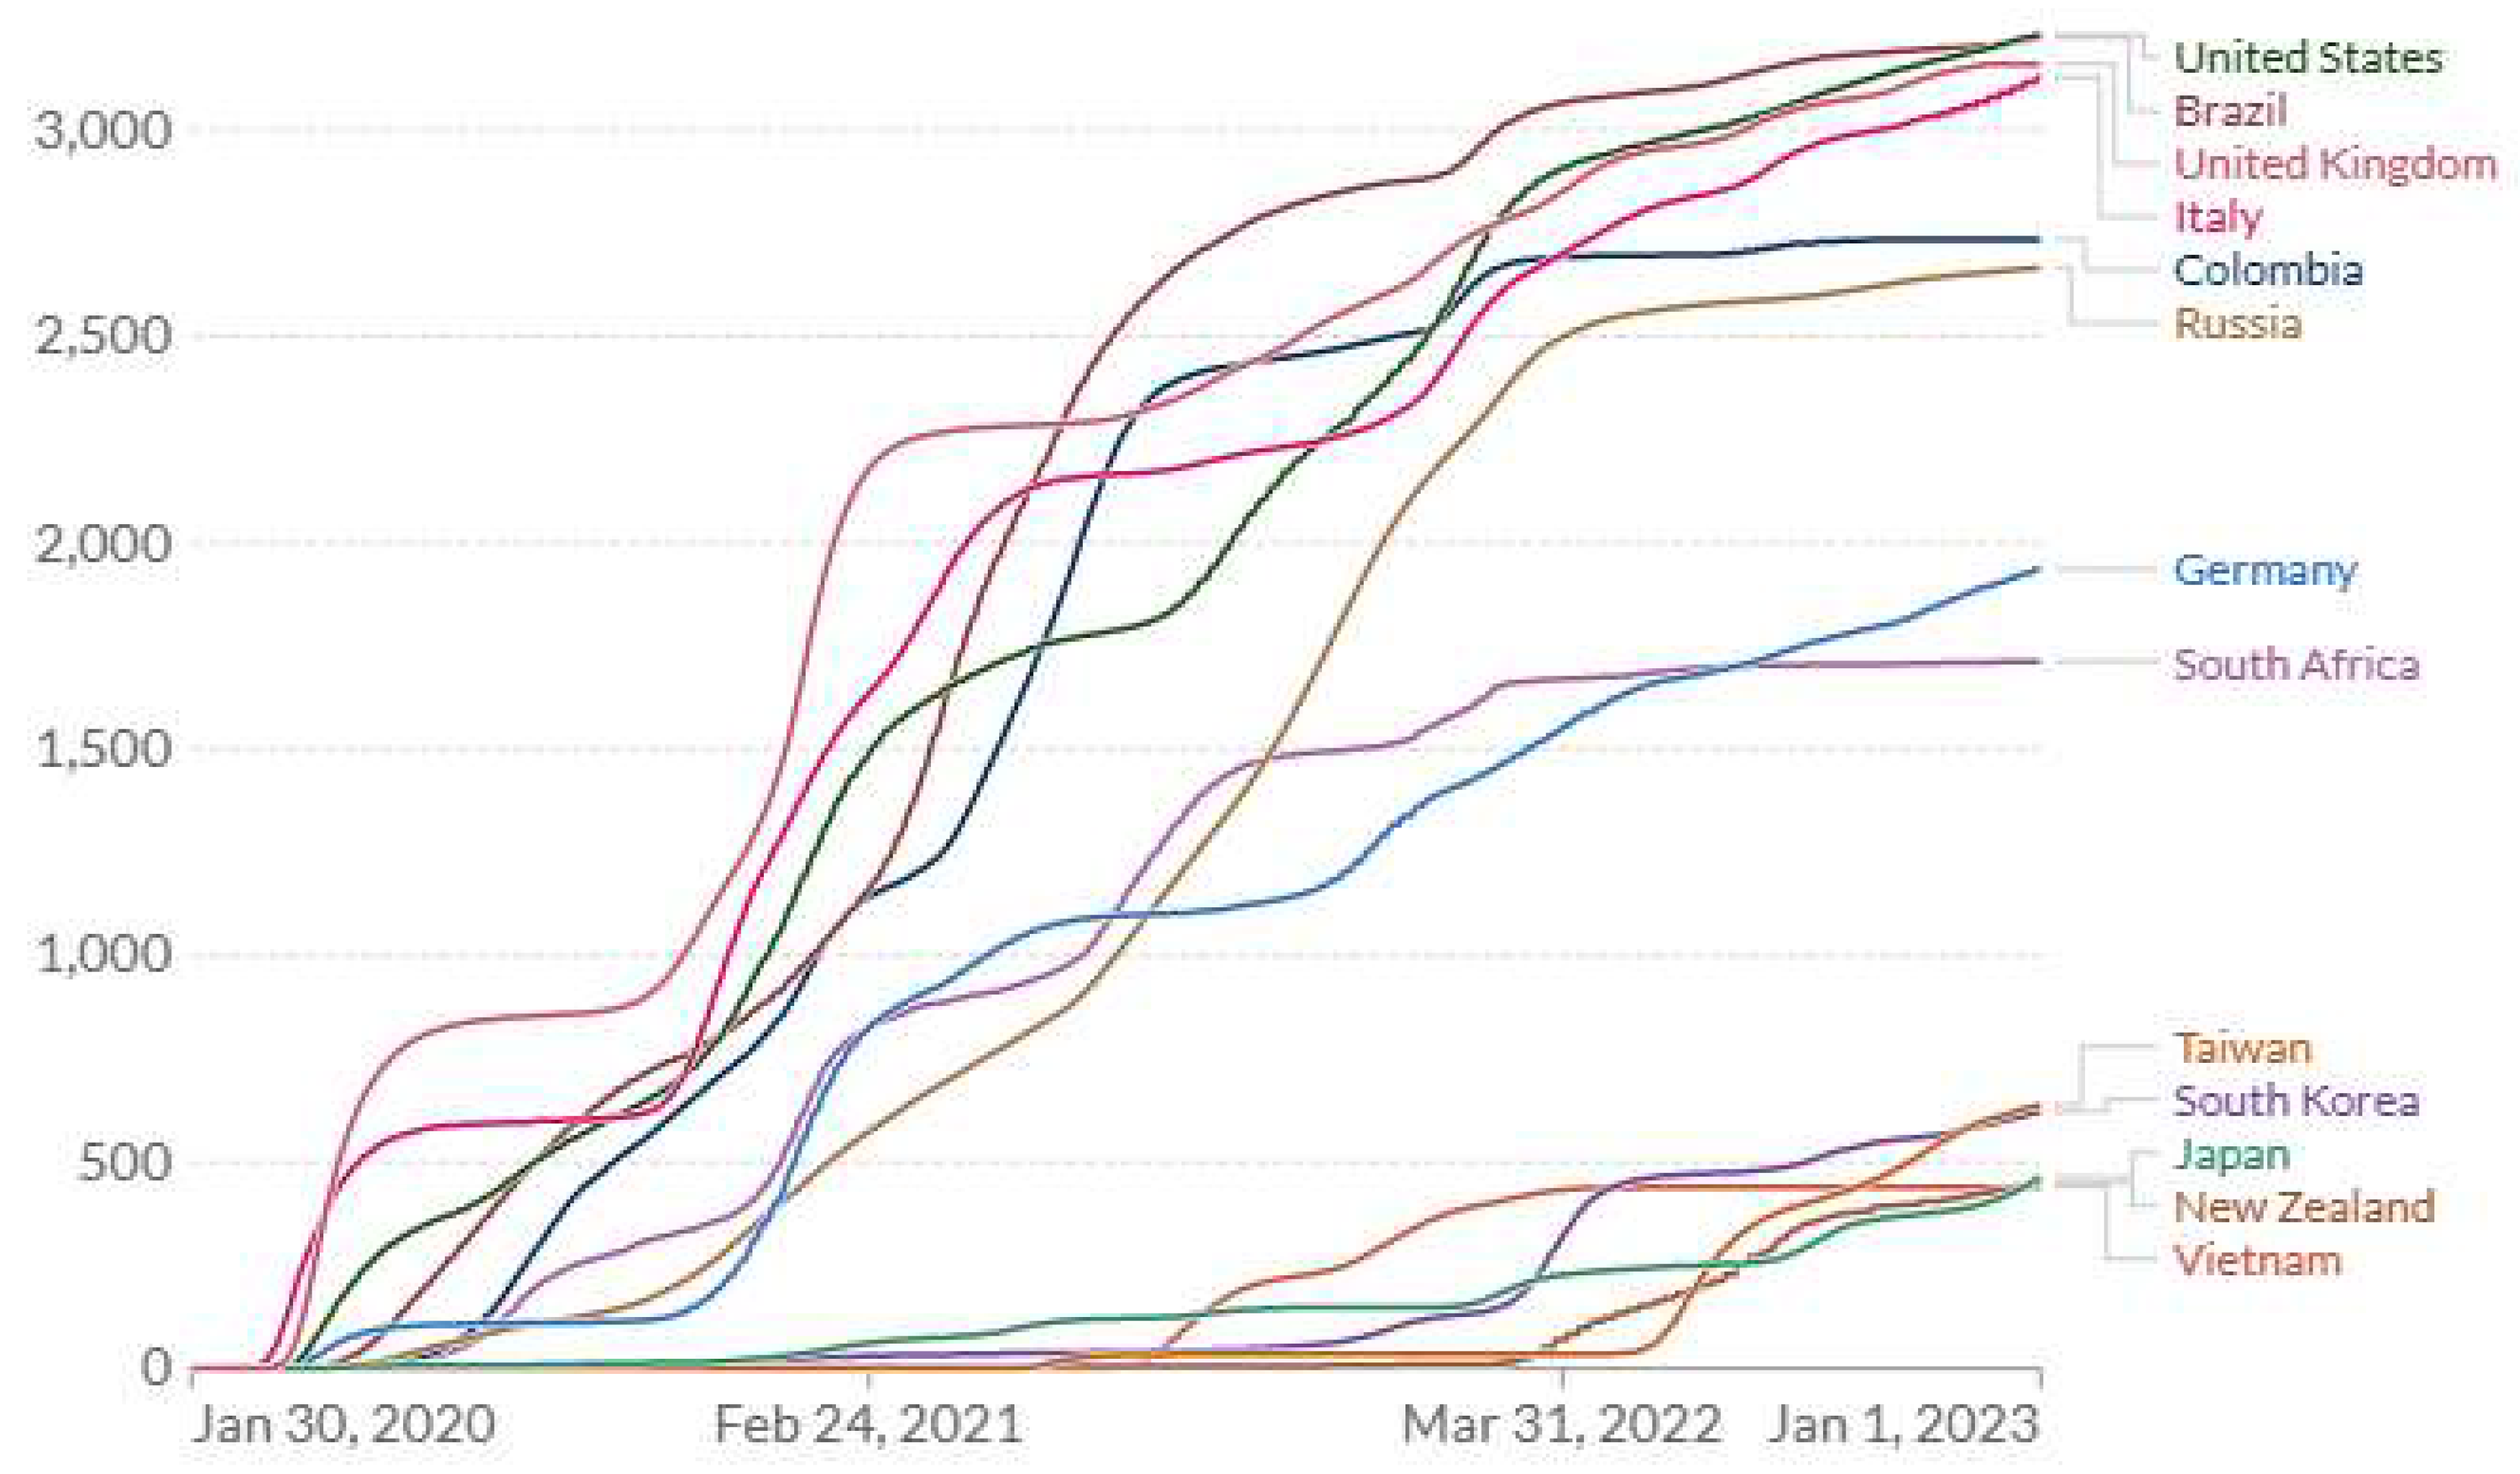
Figure 2.
Cumulative confirmed Covid-19 deaths per million for countries exhibiting low death rates (data from Johns Hopkins University CSSE[13], displayed by software at OurWorldInData.org[14] and provided under Creative Commons BY open access license).
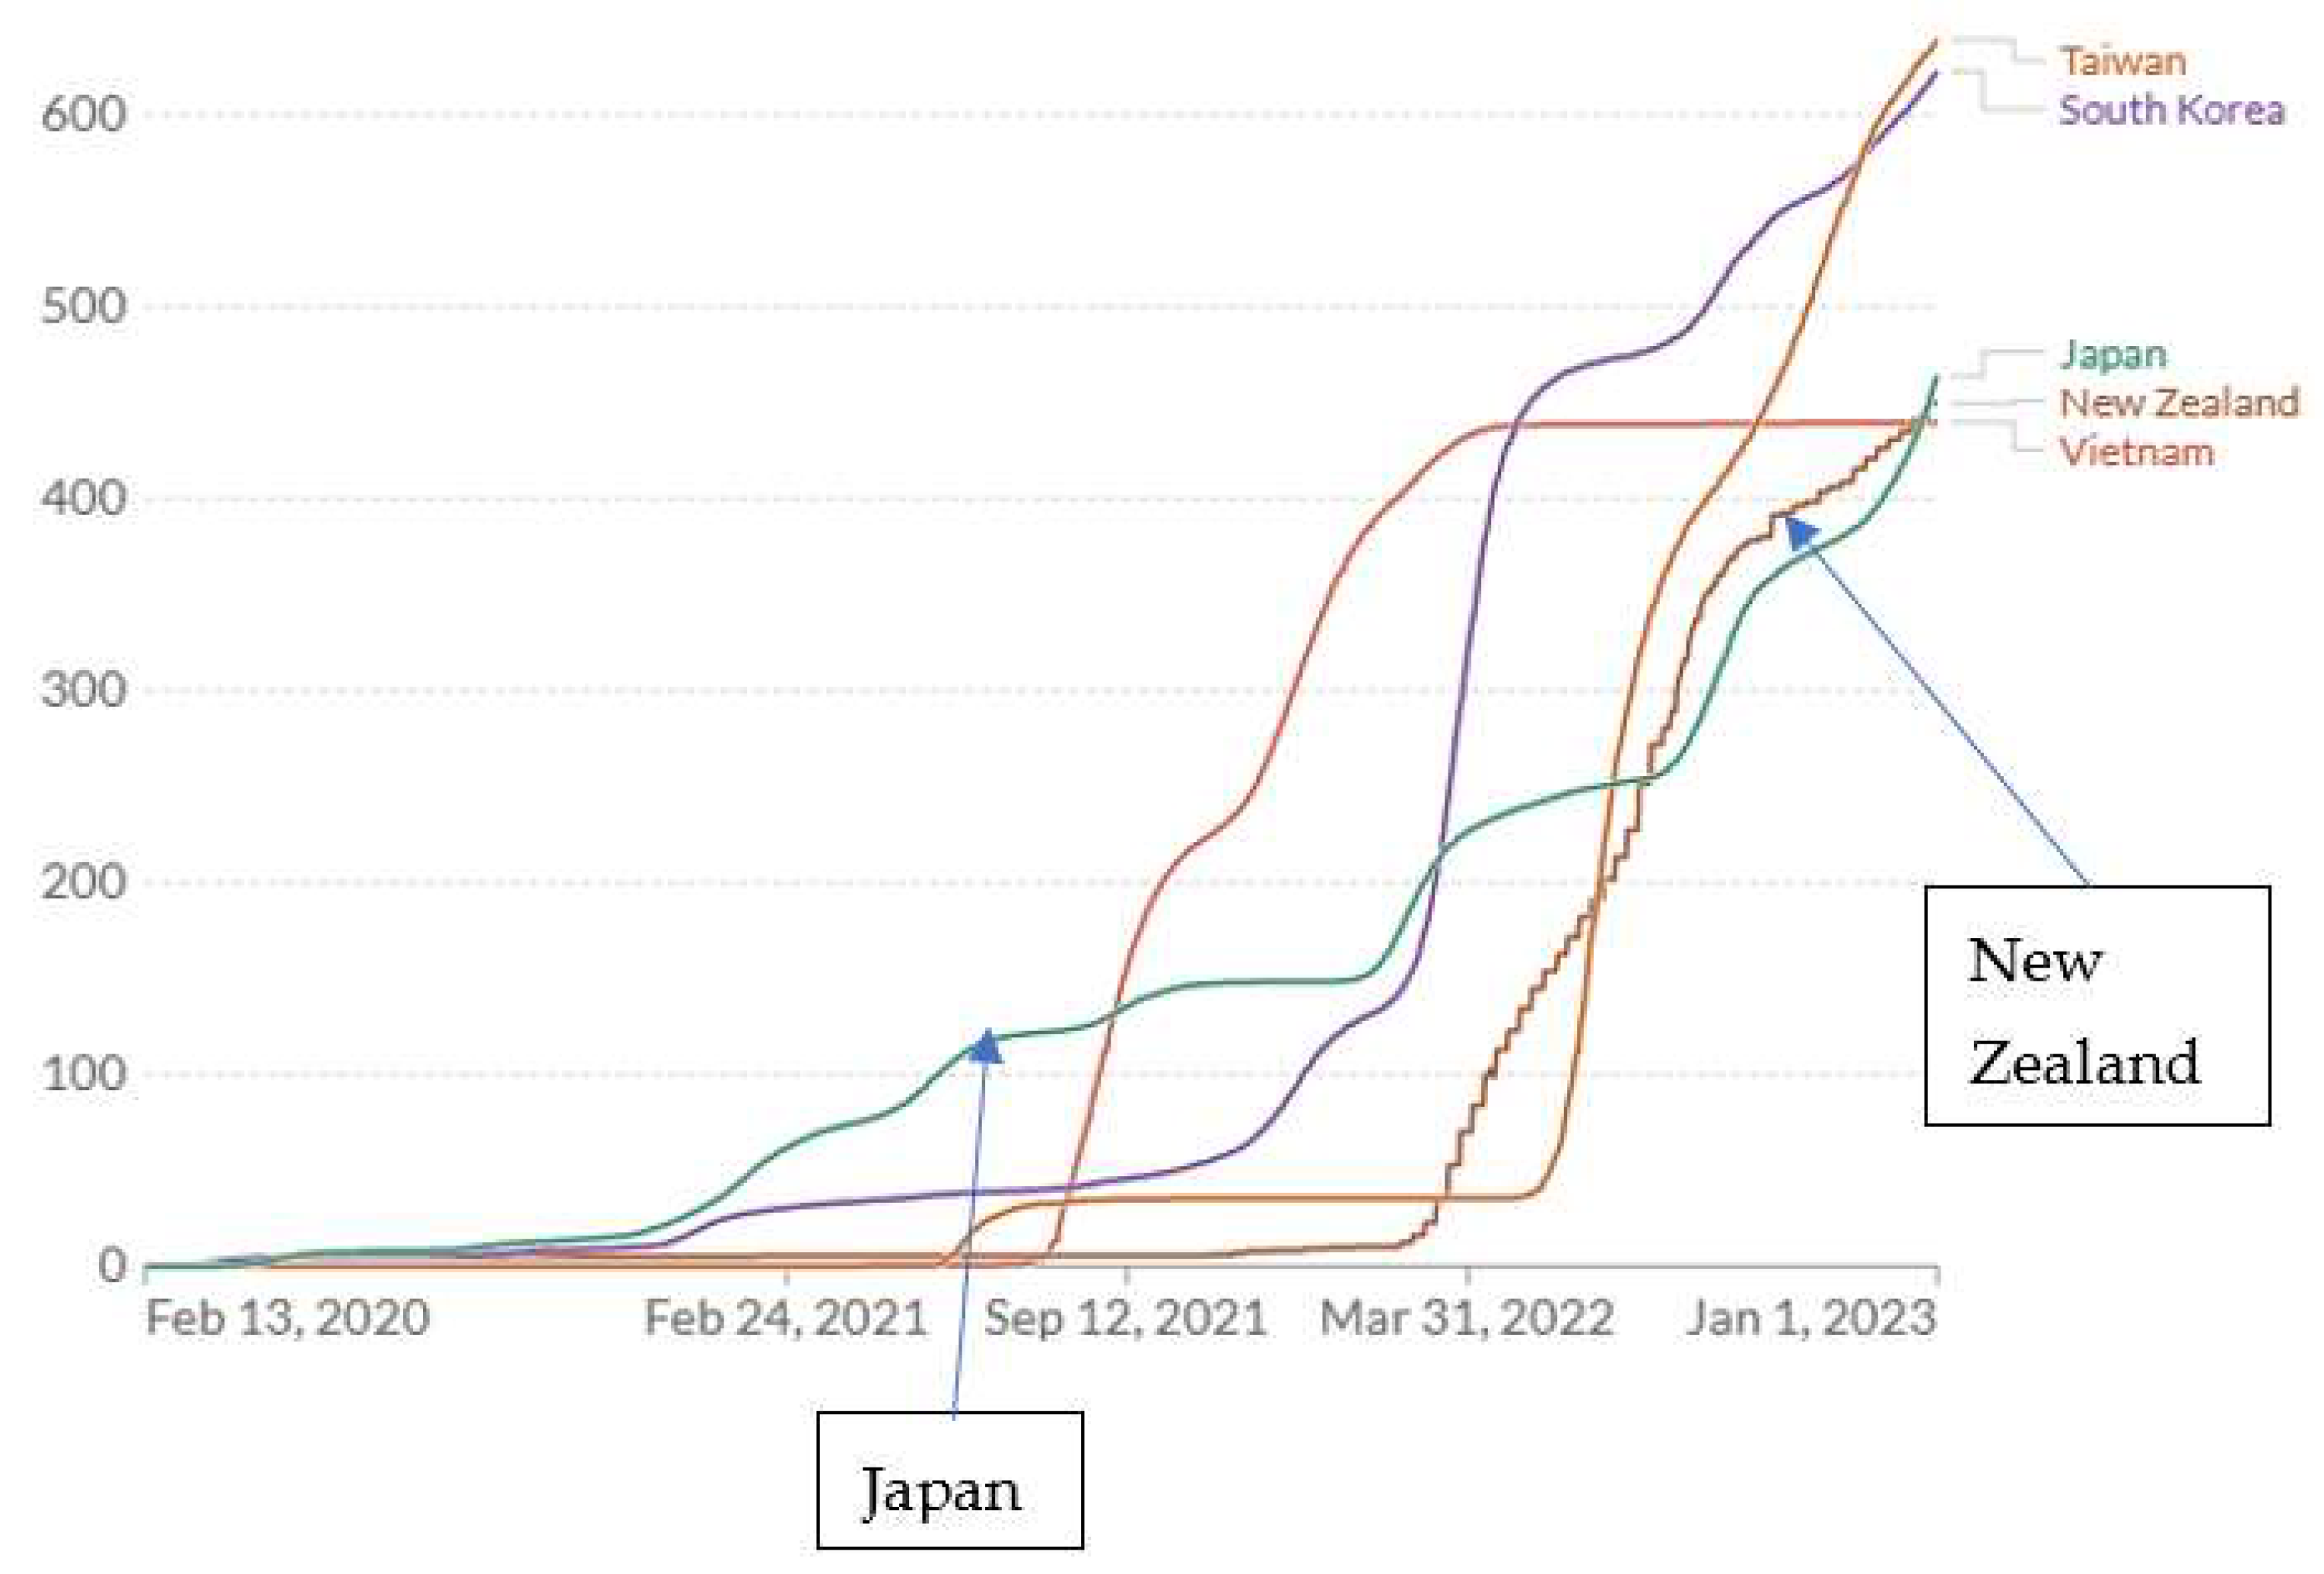

Table 1.
COVID-19 seropositivity surveys prior to vaccination availability in order of increasing seropositivity.
Table 1.
COVID-19 seropositivity surveys prior to vaccination availability in order of increasing seropositivity.
| Country/region (ref:1-5,15-34) | Survey date mm/dd/yyyy |
Seropositivity | IFR1 | FIR1 | CFR1 |
|---|---|---|---|---|---|
| Taiwan | 07-15-2020 | 0.0005 | 0.00058 | 17242 | 0.0153 |
| New Zealand | 12-16-2020 | 0.0010 | 0.0050 | 200 | 0.0124 |
| S Korea | 11-01-2020 | 0.0024 | 0.0037 | 268 | 0.0175 |
| Vietnam/high risk region | 10-15-2020 | 0.004 | 0.000092 | 111112 | - |
| Germany/7 regions | 08-15-2020 | 0.020 | 0.015 | 67 | 0.040 |
| US/California (Santa Clara) | 03-20-2020 | 0.028 | 0.0017 | 5882 | 0.075 |
| Japan/Kobe | 04-07-2020 | 0.033 | 0.000022 | 428572 | 0.021 |
| Spain | 07-06-2020 | 0.052 | 0.0115 | 87 | 0.113 |
| Sweden | 07-23-2020 | 0.073 | 0.00736 | 136 | 0.075 |
| Germany/Tirschenreuth | 11-22-2020 | 0.092 | 0.023 | 43 | 0.084 |
| Brazil/Matinhos | 07-01-2021 | 0.11 | - | - | - |
| UK/Southeast | 05-12-2020 | 0.12 | - | - | - |
| Iran/Guilan | 04-15-2020 | 0.12 | - | - | - |
| UK | 01-15-2021 | 0.15 | 0.0108 | 93 | 0.034 |
| India/Ahmedabad | 12-31-2020 | 0.18 | - | - | - |
| US/New York State | 06-15-2020 | 0.22 | - | - | - |
| Italy | 05-10-2020 | 0.23 | 0.0022 | 455 | 0.140 |
| US/New York City | 06-26-2020 | 0.26 | - | - | - |
| Saudi Arabia/Jazan | 11-01-2020 | 0.26 | - | - | - |
| Yemen/Aden | 12-01-2020 | 0.27 | - | - | - |
| US | 12-31-2020 | 0.31 | 0.0033 | 303 | 0.0173 |
| Colombia/Monteria | 10-14-2020 | 0.55 | 0.0058 | 172 | 0.063 |
| US/NYC(Queens) | 06-15-2020 | 0.68 | 0.00212 | 4762 | - |
| SA/Gauteng | 12-15-2020 | 0.68 | 0.000612 | 16392 | 0.028 |
IFR – infection fatality ratio FIR – fatality infection ratio (1/IFR) CFR – case fatality ratio 1 When prior COVID-19 cases and fatalities are known on date of seropositivity survey; when day of month not reported, 15 assigned. 2 Likely under-ascertainment of COVID-19 deaths.
Table 2.
Annual average COVID-19 case fatality ratio (CFR) by country and year,[13].in order of 2020 deaths per million.
Table 2.
Annual average COVID-19 case fatality ratio (CFR) by country and year,[13].in order of 2020 deaths per million.
| country | year | Cases per million | Deaths per million | CFR |
|---|---|---|---|---|
| UK | 2020 | 36865 | 1407 | 0.0382 |
| 2021 | 154782 | 1223 | 0.0079 | |
| 2022 | 165862 | 529 | 0.0032 | |
| US | 2020 | 59763 | 1036 | 0.0173 |
| 2021 | 102538 | 1406 | 0.0137 | |
| 2022 | 135553 | 789 | 0.0058 | |
| Brazil | 2020 | 35673 | 906 | 0.0254 |
| 2021 | 67859 | 1971 | 0.0290 | |
| 2022 | 65205 | 346 | 0.0053 | |
| Japan | 2020 | 1902 | 28.2 | 0.0148 |
| 2021 | 12082 | 119 | 0.0099 | |
| 2022 | 221871 | 316 | 0.0014 | |
| S Korea | 2020 | 1192 | 17.7 | 0.0148 |
| 2021 | 11068 | 92.3 | 0.0083 | |
| 2022 | 549669 | 513 | 0.0009 | |
| New Zealand | 2020 | 417 | 5.0 | 0.0120 |
| 2021 | 2306 | 4.3 | 0.0019 | |
| 2022 | 401277 | 440 | 0.0011 | |
| Taiwan | 2020 | 33.4 | 0.29 | 0.0087 |
| 2021 | 679.6 | 35.3 | 0.0520 | |
| 2022 | 369572 | 603 | 0.0016 | |
| Vietnam | 2020 | 14.9 | 0.36 | 0.0242 |
| 2021 | 17617 | 331 | 0.0188 | |
| 2022 | 99749 | 108 | 0.0011 |
Table 3.
Cumulative confirmed COVID-19 cases per thousand and deaths per million[13].at July 1, 2020 and Dec 31, 2024, in order of decreasing cumulative COVID-19 deaths per million on July 1, 2020.
Table 3.
Cumulative confirmed COVID-19 cases per thousand and deaths per million[13].at July 1, 2020 and Dec 31, 2024, in order of decreasing cumulative COVID-19 deaths per million on July 1, 2020.
| Country | Cum. cases/K | Cum. deaths/M | CFR1 | Cum. cases/K | Cum. deaths/M | CFR |
|---|---|---|---|---|---|---|
| as of July 1, 2020 | as of Dec 31, 2024 | |||||
| UK | 4.20 | 834 | 0.199 | 367 | 3404 | 0.009 |
| Italy | 4.08 | 589 | 0.144 | 452 | 3345 | 0.007 |
| US | 8.14 | 381 | 0.047 | 303 | 3548 | 0.012 |
| Brazil | 6.98 | 289 | 0.041 | 178 | 3339 | 0.019 |
| Germany | 2.34 | 108 | 0.046 | 457 | 2081 | 0.005 |
| S Africa | 2.81 | 47.5 | 0.017 | 65.2 | 1645 | 0.025 |
| Japan | 0.153 | 7.88 | 0.052 | 270 | 598 | 0.002 |
| S Korea | 0.250 | 5.44 | 0.022 | 668 | 694 | 0.001 |
| New Zealand | 0.295 | 4.44 | 0.015 | 519 | 876 | 0.002 |
| Taiwan2 | 0.018 | 0.29 | 0.016 | - | - | - |
| Vietnam3 | 0.003 | - | - | 117 | 433 | 0.004 |
1 Case fatality ratio (CFR) based not on individual case outcomes but reporting of total numbers; deaths in general would have occurred at some time after certification of cases. 2 Taiwan excluded from OurWorldInData.org[14] at some time after 2022. 3 Very small numbers of deaths reported for Vietnam in 2020.
Table 4.
COVID-19 mortality rates at end of 2022 and final pandemic mortality burden by end of 2024 as well as predicted burden in a) Japan under two alternate scenarios and b) for Taiwan (missing data).
Table 4.
COVID-19 mortality rates at end of 2022 and final pandemic mortality burden by end of 2024 as well as predicted burden in a) Japan under two alternate scenarios and b) for Taiwan (missing data).
| Country | Pop (M) |
Cum. mort. rate/M @ end 2022 | Annual mort. rate /M @ end 20221 |
% Vacc. @ end 2022 |
Avg. FIR | Proportion at risk @ end2022 (prevalence) | Annual mort. rate/M @ end 2022 in population at-risk2 |
Cum. mort. rate/M @ end 2024 |
Pandemic deaths @ end 2024 |
|---|---|---|---|---|---|---|---|---|---|
| US | 329 | 3230 | 367 | 68.6 | 2273 | 0.126 | 2913 | 3548 | 1,167,292 |
| UK | 67.1 | 3159 | 367 | 76.54 | 94 | 0.204 | 1799 | 3404 | 228,408 |
| Italy | 59.5 | 3128 | 573 | 81.3 | 945 | 0.171 | 3351 | 3345 | 199,028 |
| Germany | 83.2 | 1937 | 520 | 76.5 | 75 | 0.239 | 2176 | 2081 | 173,139 |
| Taiwan7 | 23.6 | 639 | 460 | 86.3 | 2666 | 0.155 | 2968 | 11827 | 27,893 |
| S Korea | 51.7 | 623 | 393 | 86.3 | 266 | 0.155 | 2535 | 694 | 35,880 |
| New Zealand | 5.1 | 450 | 267 | 79.8 | 200 | 0.223 | 1197 | 876 | 4,468 |
| Japan | 126.3 | 464 | 986 | 83.2 | 2666 | 0.188 | 5245 | 598 | 75,527 |
| Japan8 | 126.3 | 235 | 80 | 82.0 | 266 | 0.209 | 383 | 3488 | 43,952 |
| Japan9 | 126.3 | 145 | 80 | 81.0 | 266 | 0.223 | 359 | 2769 | 34,859 |
1 Annual rate based on 9-month period (Mar 31, 2022 to Dec 31 2022) from graphical presentation (Figs. 1, 2); during 2022-2024 mortality rate at end of 2022 applied to at-risk subpopulation (unvaccinated or zero seropositivity) assuming that group declines to almost zero by end of 2024, with protection factors: PF(seropos.) = 0.80, PF(vacc) = 0.90 and PF = 0.98 for both natural and vaccine immune protection; final annual mortality rate not readily derivable from OurWorldInData.org[14] at end of 2024. 2 For US: 2913 = 367/0.126. 3 US FIR based on IFR=0.00441 derived from Clarke et al.[8] 4 Vaccination status for England. 5 FIR for Italy (444, 05/10/2020) replaced by value from UK: 94. 6 FIR for Japan (42,857, very early in pandemic, 04/07/20) and for Taiwan (1724, 07/15/2020) replaced by value from S Korea: 266 (11/01/2020). 7 Data absent from OurWorldInData.org[14] in 2024; predicted based on annual mortality rate and vaccination prevalence observed at end of 2022. 8 Prediction based on cumulative deaths and mortality rate as of July 24, 2022. 9 Prediction based on cumulative deaths and mortality rate as of Jan 27, 2022.
Table 5.
Initial and 2022 COVID-19 mortality rates per million population.
| Country |
Pop (M) |
Initial annual mortality rate/M1 | Annual mortality rate/M2 @ end 2022 |
Proportion at risk @ end 20223,4 (prevalence) |
Annual mortality rate/M in population at risk @ end 20224 |
| US | 329 | 2591 | 367 | 0.126 | 2913 |
| UK | 67.1 | 6751 | 367 | 0.204 | 1799 |
| Taiwan | 23.6 | 0.29 | 460 | 0.155 | 2968 |
| S Korea | 51.7 | 14.3 | 393 | 0.155 | 2535 |
| Japan | 126 | <10 | 986 | 0.188 | 5245 |
| estimate from July 2022 | <10 | 804 | 0.209 | 383 | |
| estimate from Feb 2022 | <10 | 804 | 0.223 | 359 | |
| China, 0% immunity3 | 1400 | <1815 | <1815 | 1.0 | 54776 |
| China, 10% immunity3 | <1815 | <1815 | 0.9 | 58936 | |
| China, 20% immunity3 | <1815 | <1815 | 0.8 | 63686 |
1 During first 4 months of 2020. 2 As of end of 2022. 3 As of end of 2022: final annual mortality rate divided by population at risk, e.g., for U.S.: 367/0.126=2913. For China, hypothetical population at risk (prevalence) prior to surge at Jan 1, 2023, which is assumed to decline exponentially during surge of 2023 to 0.1 (90% protected) by Apr 1 2023. 4 As of end of 2022, but for Japan without two relaxation implementations, as of July 24, 2022 and Jan 27, 2022; for China during surge of early 2023. 5 China cumulative COVID-19 mortality per million in 3-year period 2020-2022 estimated based on cumulative rates from the zero-COVID countries analyzed as of end of 2022 (Table 5, using mean of 639,623,450,464=544); an over-estimate because those countries experienced surges beginning in 2022. Estimated initial and final (average) Chinese annual rates: 3-yr cum. rate/3 = 544/3 = 181. 6 In China, average annual COVID-19 mortality rate during 3-month surge, Jan-Mar 2023: 1,500,000×4/1400 = 4286/M; final fixed rate during surge.
Disclaimer/Publisher’s Note: The statements, opinions and data contained in all publications are solely those of the individual author(s) and contributor(s) and not of MDPI and/or the editor(s). MDPI and/or the editor(s) disclaim responsibility for any injury to people or property resulting from any ideas, methods, instructions or products referred to in the content. |
© 2025 by the author. Licensee MDPI, Basel, Switzerland. This article is an open access article distributed under the terms and conditions of the Creative Commons Attribution (CC BY) license (https://creativecommons.org/licenses/by/4.0/).
Copyright: This open access article is published under a Creative Commons CC BY 4.0 license, which permit the free download, distribution, and reuse, provided that the author and preprint are cited in any reuse.


