
Submitted:
27 July 2025
Posted:
28 July 2025
You are already at the latest version
Abstract
Spinocerebellar ataxia type 2 (SCA2) is a neurodegenerative disorder marked by progressive brainstem and cerebellar atrophy, leading to gait ataxia. Quantifying this atrophy in magnetic resonance imaging (MRI) is critical for tracking disease progression in both symptomatic patients and preclinical subjects. However, manual segmentation of brainstem subregions (mesencephalon, pons, and medulla) is time-consuming and prone to human error. This work presents an automated deep learning framework to assess brainstem atrophy in SCA2. Using T1-weighted MRI scans from patients, preclinical carriers, and healthy controls, an U-shape convolutional neural network (CNN) was trained to segment brainstem subregions and quantify volume loss. The model achieved strong agreement with manual segmentations (min DSC: 0.93), and significantly reduced processing time from hours to minutes. Results revealed severe atrophy in preclinical and symptomatic cohorts, with pons volumes reduced by nearly 50% compared to controls (p< 0.001). The mesencephalon and medulla showed milder degeneration, underscoring regional vulnerability differences. This automated approach enables rapid, precise assessment of brainstem atrophy, advancing early diagnosis and monitoring in SCA2. By streamlining analysis, deep learning bridges translational gaps in neurodegenerative disease research.
Keywords:
Deep Learning
; Brainstem Segmentation
; Medical Imaging Processing
; Brain MRI segmentation
; Convolutional Neural Networks
; U-Net
1. Introduction
Spinocerebellar Ataxia type 2 (SCA2) is a rare neurodegenerative disorder characterized by progressive degeneration of the brainstem and cerebellum. As one of the most prevalent spinocerebellar ataxias globally [1,2,3,4], it exhibits a notably high incidence in Holguin, Cuba [1,5]. Clinical manifestations include a cerebellar syndrome, slowing of the saccadic ocular movements, cognitive disorders, sensory neuropathy, etc [6].
Three patterns of macroscopic atrophy reflecting damage of different neuronal system are recognized in spinocerebellar ataxias, named spinal atrophy (SA), olivopontocerebellar atrophy (OPCA) and cortico-cerebellar atrophy (CCA) [7]. Neuroimaging has played a pivotal role in diagnosing these atrophy patterns since 1995, and magnetic resonance imaging (MRI) remains the gold standard for structural segmentation and volumetric analysis due to its superior resolution [8], outperforming other modalities such as single-photon emission computed tomography (SPECT) and positron emission tomography (PET) in visualizing SA, OPCA, and CCA [9]. According to recent literature [10,11], MRI is one of the most common biomarker candidate for spinocerebellar ataxias.
Brainstem atrophy has been documented across both symptomatic and prodromal stages of SCA2 [1,2,3,12,13,14,15,16,17,18]. However, most studies rely on manual segmentation, a method constrained by time-intensive workflows, inter-rater variability, and scalability limitations in large cohorts. To address these challenges, this work introduces an automated deep learning framework for quantifying volumetric changes in SCA2 patients, preclinical carriers, and healthy controls.
Convolutional Neural Networks (CNNs) have achieved state-of-the-art performance across diverse domains, including handwritten digit classification [19], face and contour detection [20], automatic video processing [21,22] and neurological behavior analysis and prediction[23,24,25]. In neuroimaging, CNNs have become indispensable for brain lesion segmentation and structural parcellation [26], with architectures like U-Net [27,28,29,30], ResNet [31], and VGG-Net [32], leveraging adversarial training [33] and hierarchical feature extraction to enhancing learning robustness. Among the most interesting advances in brain structure segmentation, we can find cerebellum parcellation via cascaded CNNs used by Han et al. [34], highlighting their potential for fine-grained neuroanatomical analysis and the 2D approach proposed by Faber et al. [29]. Although 2D convolutional models exhibit greater computational efficiency and lower resource demands by processing individual image slices independently, 3D convolutional models ultimately achieve superior segmentation performance by leveraging volumetric spatial context, which is critical for accurately analyzing anatomical continuity and pathological structures across adjacent slices in neuroimaging data.
Recent architectural innovations have significantly advanced CNN-based segmentation performance in neuroimaging through sophisticated feature refinement and multi-scale processing. Convolutional Block Attention Modules (CBAM) [35,36,37] enhance segmentation precision by sequentially applying channel and spatial attention mechanisms, enabling the model to focus on diagnostically relevant features while suppressing noise - particularly valuable for heterogeneous tumor regions and subtle subcortical boundaries. Parallel developments in inception modules [38,39,40,41] address scale variance through parallel convolutional pathways with differing receptive fields, capturing both local texture details and global anatomical context essential for brain structures.
Building on prior work [40], this study applies CNNs to brainstem segmentation in MRI, with a focus on mesencephalon, pons, and medulla volumetric changes. The main advancement over the previous architecture is the incorporation of CBAM modules, which greatly improves the model’s accuracy, allowing to accurately segment brainstem structures while maintaining a small number of parameters. To date, no studies have employed deep learning to compare brainstem atrophy between symptomatic SCA2 patients, preclinical carriers, and controls in Cuba. This approach aims to establish a scalable, objective tool for identifying early biomarkers of SCA2 progression.
2. Materials and Methods
The proposed model architecture builds upon the method described in [40], utilizing a 3D U-Net-like framework to perform volumetric segmentations. This design processes the input images in their native 3D spatial context, which allows to preserve anatomical relationships. The main architecture contains four downsampling and upsampling operations. To enhance feature extraction, each convolutional layer was replaced with an inception module [42], which optimizes computational efficiency by processing multi-scale features in parallel. Additionally, skip connections were refined using three consecutive Convolutional Block Attention Modules (CBAM) [43], enabling the model to focus on spatially and channel-wise relevant features in these branches.
The inclusion of inception modules and CBAM in the proposed U-Net variant was motivated by the need to address two key challenges in brainstem segmentation: (1) the multi-scale nature of anatomical features (e.g., the compact mesencephalon vs. the pons and medulla), and (2) the subtle intensity changes between adjacent substructures. Inception modules enable efficient multi-scale feature extraction, while CBAM refines skip connections to prioritize anatomically relevant regions. The overall model and inception architectures are illustrated in Figure 1, with detailed schematics of the CBAM blocks provided in Figure 2.
The study employed a cohort of 42 MRI scans obtained from the Cuban Neurosciences Center. These scans correspond to 25 individuals, comprising five healthy controls, seven preclinical subjects, and 13 SCA2 patients. The participants belong to different age, SARA scores, and years of SCA2 evolution (more information can be found in Table 1). This study was conducted in accordance with the Declaration of Helsinki and approved by the Research Ethics Committee of the Cuban Center for Neuroscience on November, 2020. Written informed consent was obtained from all subjects involved in the study.
Given hardware limitations, the model was designed to balance computational efficiency with performance, ensuring feasibility on available infrastructure while maintaining robust segmentation accuracy.
2.1. Image Preparation
The full preparation process for one single image can be depicted in Figure 3. All MRI scans underwent preprocessing to ensure consistency and improve segmentation accuracy. First, N4 bias field correction [44] was applied to address intensity inhomogeneities, enhancing image quality for subsequent analysis. Following this, each scan was registered to the ICBM 2009c nonlinear symmetric template [45] using Advanced Normalization Tools (ANTS) [46]. The registration process employed a three-stage approach: rigid, affine, and symmetric normalization (SyN), ensuring optimal alignment of individual scans to the standardized template space. The ICBM 2009c template was selected for its validated ability to represent adult brain anatomy and compatibility with neuroimaging studies [47,48,49]. The hierarchical registration pipeline minimizes anatomical mismatch by progressively aligning scans to the template’s symmetric space, ensuring consistent preprocessing critical for mod generalizability. The Figure 3a shows the original image, and 3b displays the result of N4+MNIregistration.
To optimize computational efficiency, MRI scans were automatically cropped to focus exclusively on the brainstem region. Using training set segmentations as reference, a standardized region of interest (ROI) measuring 80×80×96 voxels was extracted for each scan. This approach reduced the computational load by 93%, decreasing processed volumes from approximately 8.5 million voxels per full scan to ~614,000 voxels. The cropped ROIs enabled efficient model training and inference while preserving all relevant anatomical data for brainstem analysis. The Figure 3d shows the result of the cropping operation. Following the crop, intensity normalization was applied for every image (Figure 3e). The reduced volumes were used as inputs to the 3D U-Net. The Figure 3f shows one fully preprocessed image overlapped with its manual segmentations.
2.2. Analysis Description
The study was implemented in Python 3.9, utilizing TensorFlow [50] and Keras [51] for model development and training. The model was trained over 250 epochs using the Adam optimizer [52] with default parameters, and a constant learning rate of 10-4. To mitigate overfitting, a dropout rate of 0.2 was applied before the final convolutional layer.
For training, the label maps are converted into C binary channels, and each channel represents a label. At the same time, each voxel can only belong to one label. The loss function used was one minus the average Dice score (DSC) across all channels, and the DSC is computed as mentioned by Han et al. [34].
The experiment was conducted on a computer provided with an Intel Core i5-10500H microprocessor, 16GB RAM, and a NVIDIA RTX 3060 6GB GPU. The dataset was partitioned into 17 images for training, 3 for validation, and 22 for testing. To enhance model generalization, and given the relatively small size of the available cohort, data augmentation techniques were applied during training, including random rotations (-15° to 15°), translations (±15 pixels on each direction), and flipping (probabilistic). No augmentation was applied to the images of the test set.
The proposed method was evaluated against four UNet-based approaches: (1) an upscaled version of the model architecture from [40], (2) the cerebellar parcellation network by Han et al. [34], (3) the brainstem parcellation model by Magnusson et al. [53], and the whole-brain parcellation model used by Nishimaki et al. [54]. The model by Han et al. [34] was constructed using the exact computer code provided by the authors in their paper, while the models proposed by Magnusson et al. [53] and Nishimaki et al. [54] were implemented by the authors of the current research.
To ensure a fair comparison, all models were trained under identical conditions, maintaining consistent training protocols (loss functions, optimizer parameters, regularization strategies, number of epochs, learning rate). Due to computational constraints, the model proposed by Nishimaki et al. [54] was impossible to train with the original filter sizes for each UNet stage. For this approach, the number of filters were changed from [64, 128, 256, 512, 1024] to [32, 64, 128, 256, 512], ensuring a proper fit in our graphics card.
The segmentations generated by the top-performing model were subsequently utilized for volumetric analyses, with regional volumes normalized as a percentage of total intracranial volume (%TICV) to account for interindividual variability in head size. Additionally, we investigated potential clinical and developmental correlations by examining the relationship between brainstem subregion volumes and both age and Scale for the Assessment and Rating of Ataxia (SARA) scores. These analyses aimed to elucidate whether volumetric variations in the medulla, pons, and mesencephalon were associated with neurological function or age-related morphological changes.
3. Results
The evaluation results demonstrate high segmentation accuracy across all regions of interest. Mean Dice similarity coefficients (DSC) exceeded 0.95 for all structures, with the highest score (0.97) achieved for the whole brainstem. The mesencephalon exhibited the lowest mean DSC (0.93), indicating consistent yet slightly reduced performance in this region. These results highlight the model’s robustness and reliability in segmenting brainstem subregions.
Table 2 shows the number of parameters for each model used in the comparison.
Table 3 shows the mean Dice Score for each model evaluated in the test set. The evaluations are present for each brainstem region (medulla, pons and mesencephalon) and full brainstem. The Table 4 shows the results of the Intersection over Union (IoU), Haussdorf Distance (HD95), Specificity, Sensitivity and Precision, calculated for the full brainstem.
Figure 4 presents a qualitative comparison of segmentation results, showing a representative test image alongside its predicted segmentation. The visual assessment of the segmentations generated by the five models reveals a consistent pattern in the spatial distribution of errors. While all models achieve high performance metrics—including Dice Similarity Coefficient (DSC), 95th percentile Hausdorff Distance (HD95), sensitivity, and specificity—qualitative inspection of the multiplanar error maps (Figure 5) indicates that discrepancies predominantly occur along the outer boundaries of the brainstem rather than at the internal interfaces between substructures (i.e., the medulla-pons and pons-mesencephalon borders). This observation suggests that the models excel in delineating the internal architecture of the brainstem, accurately capturing the transitions between adjacent subregions, but exhibit minor inaccuracies in defining the precise outer margins of the brainstem itself.
The concentration of errors along the periphery may reflect inherent challenges in boundary definition due to partial volume effects at the brainstem’s interface with surrounding cerebrospinal fluid or adjacent soft tissues. Additionally, slight variations in image contrast or resolution near the edges could contribute to this phenomenon. Importantly, the robustness of internal parcellation underscores the models’ ability to learn and reproduce the complex anatomical relationships between substructures, which is critical for clinical and research applications. Future work could explore postprocessing refinements or targeted training strategies to further improve boundary precision without compromising the already high accuracy of internal segmentation.
Based on the information provided in Tables 2 to 4, and Figure 4 and Figure 5, the proposed method achieves superior performance while maintaining the lowest computational footprint. This model consistently outperforms or matches competing methods across all evaluated metrics, including DSC, HD95, and IoU. Specifically, it attains the highest DSC for all brainstem substructures (0.96 for the mesencephalon and pons, 0.95 for the medulla, and 0.96 for the full brainstem), demonstrating robust segmentation accuracy. Additionally, its HD95 of 2.71mm indicates precise boundary delineation, comparable to Nishimaki et al.’s marginally better 2.65mm [54], but using a substantially smaller model.
Beyond accuracy, the proposed model stands out for its efficiency. With only 5.25 million parameters, it is significantly leaner than competing models, which range from 8.79 million to 22.6 million parameters. This efficiency does not come at the cost of performance, as the model matches or exceeds the scores in secondary metrics such as sensitivity (0.95) and precision (0.96). In contrast, larger models like Han et al. [34] (21.64M parameters) and Nishimaki et al. [54] (22.6M parameters) offer negligible improvements while demanding far greater computational resources. This makes the proposed approach particularly suitable for real-world clinical settings, where hardware limitations and inference speed are practical concerns.
The implications of these findings are substantial for both researchers and practitioners. For clinicians, the model’s high accuracy ensures reliable segmentation for diagnostic purposes. For researchers, its parameter efficiency translates to faster inference times and lower hardware costs, facilitating the deployment in resource-constrained environments. From a research perspective, this work establishes a new benchmark for balancing performance and efficiency in medical imaging segmentation. The improvements can be attributed to the two key architectural changes made to the U-Net: (1) the integration of attention mechanisms within skip connections to refine feature aggregation, and (2) the replacement of conventional convolutional layers with inception modules to capture multi-scale contextual information more effectively. By addressing limitations related to structural heterogeneity and boundary ambiguity—common challenges in brain MRI segmentation—the method offers improved accuracy and consistency, allowing to produce high-quality segmentation with smaller models. While future studies could explore further optimizations, the current model demonstrates that state-of-the-art accuracy does not come at the expense of larger models.
Quantitative evaluation of computational efficiency revealed segmentation times of <1 second per image when utilizing GPU acceleration (NVIDIA RTX 3060 MOBILE, 6GB GDDR6), while CPU-based processing (Intel Core i5-10500H, 16GB DDR4 RAM) required 210±15 seconds per case. This represents a 60-120× speed improvement compared to manual segmentation protocols while maintaining diagnostic-grade accuracy.
Using the segmentation results for all the images of the initial cohort, volumetric changes were calculated for SCA2 patients, preclinical subjects, and healthy controls. Volumes were normalized as a percentage of the total intracranial volume (% TICV), with TICV computed using ROBEX [55]. Consistent with prior findings by Reetz et al. [56] , our results (Table 5) revealed a progressive volumetric reduction: SCA2 patients exhibited significantly smaller brainstem subregion volumes compared to preclinical subjects, which in turn were reduced relative to healthy controls. These findings validate the model’s ability to detect subtle neuroanatomical changes, reinforcing its utility in both clinical assessment and longitudinal studies of neurodegenerative disorders.
The most pronounced differences were observed in the pons, with mean volumes of 0.47% TICV for patients, 0.76% TICV for preclinical subjects, and 0.82% TICV for controls. Notably, the median volume for controls was nearly double that of patients. Differences between preclinical subjects and controls were less pronounced. In the mesencephalon, mean volumes were 0.40% TICV for patients, 0.44% TICV for preclinical subjects, and 0.48% TICV for controls. The medulla exhibited the smallest volumetric differences, with values of 0.26%, 0.29%, and 0.31% TICV for patients, preclinical subjects, and controls, respectively. At the whole brainstem level, mean volumes were 1.12%, 1.49%, and 1.62% TICV for patients, preclinical subjects, and controls, respectively, further highlighting the progressive nature of brainstem atrophy in SCA2.
Leveraging the automated segmentations generated by our proposed model, we assessed the relationship between brainstem subregion volumes and clinical measures, including the Scale for the Assessment and Rating of Ataxia (SARA) scores and disease duration (Table 6). The analysis included 11 SCA2 patients and 8 preclinical carriers (one patient was excluded due to missing data). For disease duration, correlations were restricted to the patient cohort.
The correlation analysis between brainstem subregion volumes (%TICV) and clinical parameters yielded several key findings. All brainstem subdivisions showed significant negative correlations with SARA scores (pons: r=−0.69, p<0.01; whole brainstem: r=−0.71, p<0.01), indicating that smaller volumes are associated with worse ataxia severity. Notably, the pons demonstrated the strongest association, aligning with its known role in motor coordination. Disease duration correlated most prominently with pons volume (r=−0.55, p<0.05), suggesting this region may serve as biomarker of progression. In contrast, medulla and mesencephalon volumes were not significantly associated with disease duration (p>0.05), highlighting regional selectivity in neurodegeneration. CAG repeat length exhibited consistent negative correlations across all structures (pons: r=−0.56; whole brainstem: r=−0.55; mesencephalon: r=-0.49; both p<0.05), supporting the genetic contribution to volumetric decline. The medulla showed a marginally nonsignificant trend (p=0.06), possibly reflecting smaller effect sizes or sample size limitations.
4. Discussion
This study presented a deep learning-based framework for analyzing MRI scans to quantify volumetric changes in the brainstem of SCA2 patients and preclinical subjects compared to healthy controls. To the best of our knowledge, this represents the first such study conducted in Cuba, addressing a critical need for accessible and efficient tools to study neurodegenerative diseases in resource-constrained settings.
The success of our approach stems from the inherent advantages of the 3D U-Net for medical image segmentation. Unlike classical techniques (e.g., atlas-based or graph-cut methods) that rely on handcrafted features—which often fail to capture complex anatomical variability [57]—CNNs automatically learn discriminative hierarchical features, enabling precise parcellation of challenging structures like the brainstem substructures [58]. Our modified 3D U-Net architecture incorporates two key changes - attention mechanisms in skip connections and inception modules replacing standard convolutions. This advanced and complex architecture achieves expert-level segmentation accuracy (Dice >0.95 for all brainstem substructures). The attention modules enable precise localization of anatomical boundaries by selectively emphasizing relevant spatial features, while the inception modules capture multi-scale contextual information critical for distinguishing between adjacent brainstem subregions.
The results demonstrate that deep learning techniques can effectively characterize brainstem atrophy, enabling rapid differentiation between patients, preclinical subjects, and controls. Our findings demonstrate a robust inverse relationship between pons volume and SARA scores (r=−0.69, p<0.01), underscoring the pons’ pivotal role in SCA2-related motor dysfunction. This correlation suggests that automated brainstem volumetry serve as a biomarker for clinical trials, enabling early intervention in preclinical carriers. Future longitudinal studies will validate these associations and explore multimodal imaging to refine prognostic models. These findings suggest that the proposed framework can be integrated into larger neuroimaging pipelines to assess volumetric changes in SCA2 patients and preclinical subjects. The development of user-friendly software based on this approach could provide clinicians with a powerful tool for rapid diagnosis and monitoring of disease progression. By highlighting key atrophic changes and enabling longitudinal evaluation, such tools could improve patient care and support early intervention strategies.
The computational efficiency of the proposed method offers significant advantages for clinical implementation. While GPU-based segmentation completes in under one second per image - representing an important time reduction compared to manual segmentation – we observed important trade-offs in CPU-based processing (3.5 minutes per case) that warrant discussion. These processing times reflect the brainstem-specific segmentation only, with the full pipeline (including registration) requiring additional computation. The choice between GPU and CPU implementation presents practical considerations: CPU acceleration enables real-time processing for clinical workflows, while CPU processing remains viable for resource-constrained environments at the cost of increased processing time. Importantly, both approaches maintain equivalent segmentation accuracy, with the computational differences arising solely from hardware parallelization capabilities. For large-scale deployments, GPU implementations are recommended when available, as they provide a most balanced combination of speed and precision. The method’s memory requirements make it deployable on most modern medical imaging workstations without specialized hardware.
4.1. Limitations and Future Work
The main limitations of the current work can be resumed in:
- a)
- Registration dependency: While the hierarchical registration pipeline ensures robust alignment to the ICBM 2009c template, this preprocessing step might introduce critical limitations, such as failure cases (a failure in registration step inevitably conduces to a wrong segmentation) and template bias (the ICBM 2009c may not generalize to other populations, potentially biasing volumetric estimates).
- b)
- Regional bias due to dataset homogeneity: All the collected data belongs to Cuban individuals, which may limit the generalizability to global SCA2 populations with differing genetic/environmental profiles.
- c)
- Small cohort size: While the proposed model demonstrates strong performance in the used cohort, deep learning models typically benefit from larger and more diverse datasets to ensure robustness across populations and imaging protocols.
- d)
- Cross-sectional design: Volumetric differences are reported in a single timepoint, precluding causal inferences about atrophy progression.
To assess these limitations, future research will be mainly oriented to the development of registration-free pipelines, allowing to enhance robustness and generalizability. The use of vision transformers could be a possible path for exploration, but their innate need for computational resources might negatively impact the processing time. Another way to avoid registration could be using a cascaded approach, similar to proposed by Han et al. [34], which uses two consecutive U-Nets for cerebellar localization and latter segmentation. Incrementing the size of the dataset will positively influence the model’s generalizability too. For this purpose, new SCA2 patients and preclinical carriers should be added to the cohort, but also other neurodegenerative diseases can be added (i.e. other types of SCA, Parkinson’s Disease). The use of multimodal imaging should be explored too, incorporating information of multiple modalities (e.g., DTI/fMRI to map microstructural degeneration). Finally, the use of longitudinal MRI data will be explored too, aiming to a more intrinsic correlate between volumetric trajectories and clinical decline.
5. Conclusions
This study introduced a deep learning-based framework to quantify brainstem atrophy in SCA2 patients, preclinical subjects, and healthy controls, representing a pioneering effort in Cuba. By achieving mean Dice scores above 0.96 for the whole brainstem and 0.95 for its subregions, the approach demonstrates high accuracy in detecting significant volumetric differences, particularly in the pons. Also, the experiment showed highly negative correlations between all brainstem structures and SARA scores. These findings highlight the potential of deep learning to address critical gaps in neuroimaging analysis. The method enables rapid, scalable assessments, reducing reliance on time-intensive manual segmentation and supporting earlier diagnosis and monitoring of SCA2. While the framework demonstrates high accuracy, its reliance on registration and homogeneous data limits immediate clinical translation. Future work will prioritize registration-free architectures, multi-center validation, and longitudinal designs to establish causal links between atrophy and symptom progression. By addressing these limitations, we aim to deploy this tool as a scalable solution for neurodegenerative disease monitoring.
Author Contributions
Conceptualization, Robin Cabeza-Ruiz, Luis Velázquez-Pérez, Evelio González-Dalmau, Alejandro Linares-Barranco and Roberto Pérez-Rodríguez; Data curation, Robin Cabeza-Ruiz; Formal analysis, Robin Cabeza-Ruiz, Luis Velázquez-Pérez and Roberto Pérez-Rodríguez; Investigation, Robin Cabeza-Ruiz, Luis Velázquez-Pérez and Evelio González-Dalmau; Methodology, Robin Cabeza-Ruiz, Luis Velázquez-Pérez and Roberto Pérez-Rodríguez; Project administration, Luis Velázquez-Pérez and Roberto Pérez-Rodríguez; Resources, Luis Velázquez-Pérez and Evelio González-Dalmau; Software, Robin Cabeza-Ruiz; Supervision, Luis Velázquez-Pérez, Alejandro Linares-Barranco and Roberto Pérez-Rodríguez; Validation, Robin Cabeza-Ruiz, Luis Velázquez-Pérez, Evelio González-Dalmau, Alejandro Linares-Barranco and Roberto Pérez-Rodríguez; Visualization, Robin Cabeza-Ruiz; Writing – original draft, Robin Cabeza-Ruiz; Writing – review & editing, Luis Velázquez-Pérez, Evelio González-Dalmau, Alejandro Linares-Barranco and Roberto Pérez-Rodríguez.
Funding
This research received no external funding.
Institutional Review Board Statement
This study was conducted in accordance with the Declaration of Helsinki and approved by the Research Ethics Committee of the Cuban Center for Neuroscience on November, 2020.
Informed Consent Statement
Written informed consent was obtained from all subjects involved in the study.
Data Availability Statement
The preprocessed (totally anonymized) MRIs used in this study can be shared with authors upon a reasonable request. The source code for this study is publicly available at the GitHub repository https://github.com/robbinc91/mipaim_unet.
Conflicts of Interest
The authors declare no conflict of interest.
References
- Seidel, K.; Siswanto, S.; Brunt, E.R.P.; Den Dunnen, W.; Korf, H.W.; Rüb, U. Brain pathology of spinocerebellar ataxias. Acta Neuropathol 2012, 124, 1–21. [Google Scholar] [CrossRef]
- Mascalchi, M.; Diciotti, S.; Giannelli, M.; Ginestroni, A.; Soricelli, A.; Nicolai, E.; Aiello, M.; Tessa, C.; Galli, L.; Dotti, M.T.; et al. Progression of Brain Atrophy in Spinocerebellar Ataxia Type 2 : A Longitudinal Tensor-Based Morphometry Study. PLoS One 2014, 9. [Google Scholar] [CrossRef]
- Marzi, C.; Ciulli, S.; Giannelli, M.; Ginestroni, A.; Tessa, C.; Mascalchi, M.; Diciotti, S. Structural Complexity of the Cerebellum and Cerebral Cortex is Reduced in Spinocerebellar Ataxia Type 2. J. Neuroimaging 2018, 28, 1–6. [Google Scholar] [CrossRef] [PubMed]
- Antenora, A.; Rinaldi, C.; Roca, A.; Pane, C.; Lieto, M.; Saccà, F.; Peluso, S.; De Michele, G.; Filla, A. The Multiple Faces of Spinocerebellar Ataxia type 2. Ann. Clin. Transl. Neurol. 2017, 4, 687–695. [Google Scholar] [CrossRef]
- Velázquez-Pérez, L.; Medrano-Montero, J.; Rodríguez-Labrada, R.; Canales-Ochoa, N.; Alí, J.C.; Rodes, F.J.C.; Graña, T.R.; Oliver, M.O.H.; Rodríguez, R.A.; Barrios, Y.D.; et al. Hereditary Ataxias in Cuba : A Nationwide Epidemiological and Clinical Study in 1001 Patients. 2020.
- Sena, L.S.; Furtado, G.V.; Pedroso, J.L.; Barsottini, O.; Cornejo-Olivas, M.; Nóbrega, P.R.; Neto, P.B.; Bezerra, D.M.; Vargas, F.R.; Godeiro, C.; et al. Spinocerebellar ataxia type 2 has multiple ancestral origins. Parkinsonism Relat. Disord. 2024, 120, 105985. [Google Scholar] [CrossRef]
- Mascalchi, M. Spinocerebellar ataxias. Neurol Sci 2008, 29, 311–313. [Google Scholar] [CrossRef] [PubMed]
- Meira, A.T.; Arruda, W.O.; Ono, S.E.; Neto, A.D.C.; Raskin, S.; Camargo, C.H.; Teive, H.A.G. Neuroradiological Findings in the Spinocerebellar Ataxias. Tremor and Other Hyperkinetic Movements 2019, 1–8. [Google Scholar] [CrossRef]
- Mascalchi, M.; Vella, A. Neuroimaging Applications in Chronic Ataxias. Int. Rev. Neurobiol. 2018, 143, 109–162. [Google Scholar] [CrossRef]
- Öz, G.; Cocozza, S.; Henry, P.; Lenglet, C.; Deistung, A.; Faber, J.; Schwarz, A.J.; Timmann, D.; Dijk, K.R.A. Van; Harding, I.H. MR Imaging in Ataxias: Consensus Recommendations by the Ataxia Global Initiative Working Group on MRI Biomarkers. The Cerebellum 2024, 23, 931–945. [Google Scholar] [CrossRef]
- Klockgether, T.; Grobe-Einsler, M.; Faber, J. Biomarkers in Spinocerebellar Ataxias. The Cerebellum 2025, 24, 1–11. [Google Scholar] [CrossRef]
- Tamuli, D.; Kaur, M.; Sethi, T.; Singh, A.; Faruq, M.; Jaryal, A.K.; Srivastava, A.K.; Senthil, S. Cortical and Subcortical Brain Area Atrophy in SCA1 and SCA2 Patients in India : The Structural MRI Underpinnings and Correlative Insight Among the Atrophy and Disease Attributes. Neurol. India 2021, 69, 1318–1325. [Google Scholar] [CrossRef]
- Peipei, L.; Yang, L.; Weihong, G.; Xiaonan, S. Clinical Manifestation, Imaging, and Genotype Analysis of Two Pedigrees with Spinocerebellar Ataxia. Cell Biochem. Biophys. 2011, 61, 691–698. [Google Scholar] [CrossRef]
- Jacobi, H.; Hauser, T.; Giunti, P.; Globas, C.; Bauer, P. Spinocerebellar Ataxia Types 1, 2, 3 and 6 : the Clinical Spectrum of Ataxia and Morphometric Brainstem and Cerebellar Findings. Cerebellum 2012, 11, 155–166. [Google Scholar] [CrossRef]
- Dijk, T. Van; Barth, P.; Reneman, L.; Appelhof, B.; Baas, F.; Poll-the, B.T. A De Novo Missense Mutation in the Inositol 1, 4, 5-Triphosphate Receptor Type 1 Gene Causing Severe Pontine and Cerebellar Hypoplasia : Expanding the Phenotype of ITPR1 -Related Spinocerebellar Ataxia ’ s. Am. J. Med. Genet. 2016. [Google Scholar] [CrossRef]
- Politi, L.S.; Bianchi Marzoli, S.; Godi, C.; Panzeri, M.; Ciasca, P.; Brugnara, G.; Castaldo, A.; Di Bella, D.; Taroni, F.; Nanetti, L.; et al. MRI evidence of cerebellar and extraocular muscle atrophy differently contributing to eye movement abnormalities in SCA2 and SCA28 diseases. Investig. Ophthalmol. Vis. Sci. 2016, 57, 2714–2720. [Google Scholar] [CrossRef]
- Mascalchi, M.; Vella, A. Neuroimaging biomarkers in SCA2 gene carriers. Int. J. Mol. Sci. 2020, 21, 1–14. [Google Scholar] [CrossRef]
- Hernandez-Castillo, C.R.; Galvez, V.; Mercadillo, R.; Diaz, R.; Campos-Romo, A.; Fernandez-Ruiz, J. Extensive white matter alterations and its correlations with ataxia severity in SCA 2 patients. PLoS One 2015, 10, 1–10. [Google Scholar] [CrossRef] [PubMed]
- Tu, Y.; Li, Z.; Xiong, F.; Gao, F. Progressive white matter degeneration in patients with spinocerebellar ataxia type 2. Neuroradiology 2023, 66, 101–108. [Google Scholar] [CrossRef]
- Al-Arab, N.; Hannoun, S. White matter integrity assessment in spinocerebellar ataxia type 2 (SCA2) patients. Clin. Radiol. 2023, 79, 67–72. [Google Scholar] [CrossRef]
- 19. Khorsheed, E.A.; Al-Sulaifanie, A.K. Handwritten Digit Classification Using Deep Learning Convolutional Neural Network. J. Soft Comput. Data Min. 2024, 5, 79–90. [Google Scholar] [CrossRef]
- Zangana, H.M.; Mustafa, F.M. Review of Hybrid Denoising Approaches in Face Recognition: Bridging Wavelet Transform and Deep Learning. Indones. J. Comput. Sci. 2024, 13. [Google Scholar] [CrossRef]
- Kavitha, N.; Soundar, K.R.; Karthick, R.; Kohila, J. Automatic video captioning using tree hierarchical deep convolutional neural network and ASRNN-bi-directional LSTM. Computing 2024, 106, 3691–3709. [Google Scholar] [CrossRef]
- Chen, H.Y.; Lin, C.H.; Lai, J.W.; Chan, Y.K. Convolutional neural network-based automated system for dog tracking and emotion recognition in video surveillance. Appl. Sci. 2023, 13, 4596. [Google Scholar] [CrossRef]
- Rahman, S.; Hasan, M.; Sarkar, A.K. Prediction of brain stroke using machine learning algorithms and deep neural network techniques. Eur. J. Electr. Eng. Comput. Sci. 2023, 7, 23–30. [Google Scholar] [CrossRef]
- Kanna, R.K.; Sahoo, S.K.; Madhavi, B.K.; Mohan, V.; Babu, G.S.; Panigrahi, B.S. Detection of Brain Tumour based on Optimal Convolution Neural Network. EAI Endorsed Trans. Pervasive Heal. Technol. 2024, 10. [Google Scholar] [CrossRef]
- Mushtaq, S.; Singh, O. Convolution neural networks for disease prediction: applications and challenges. Scalable Comput. Pract. Exp. 2024, 25, 615–636. [Google Scholar] [CrossRef]
- Saifullah, S.; Dreżewski, R. Automatic brain tumor segmentation using convolutional neural networks: U-net framework with pso-tuned hyperparameters. In Proceedings of the International Conference on Parallel Problem Solving from Nature; Springer, Cham; 2024; pp. 333–351. [Google Scholar]
- Mansencal, B.; Senneville, B.D. De; Ta, V.; Lepetit, V. AssemblyNet : A large ensemble of CNNs for 3D whole brain MRI segmentation. Neuroimage 2020, 219, 117026. [Google Scholar] [CrossRef]
- Mecheter, I.; Abbod, M.; Amira, A.; Zaidi, H. Deep Learning with Multiresolution Handcrafted Features for Brain MRI Segmentation. Artif. Intell. Med. 2022, 131, 102365. [Google Scholar] [CrossRef] [PubMed]
- Faber, J.; Kügler, D.; Bahrami, E.; Heinz, L.S.; Timmann, D.; Ernst, T.M.; Deike-Hofmann, K.; Klockgether, T.; van de Warrenburg, B.; van Gaalen, J.; et al. CerebNet: A fast and reliable deep-learning pipeline for detailed cerebellum sub-segmentation. Neuroimage 2022, 264, 119703. [Google Scholar] [CrossRef]
- Mallampati, B.; Ishaq, A.; Rustam, F.; Kuthala, V.; Alfarhood, S.; Ashraf, I. Brain tumor detection using 3D-UNet segmentation features and hybrid machine learning model. IEEE Access 2023, 11, 135020–135034. [Google Scholar] [CrossRef]
- Aggarwal, M.; Tiwari, A.K.; Sarathi, M.P.; Bijalwan, A. An early detection and segmentation of Brain Tumor using Deep Neural Network. BMC Med. Inform. Decis. Mak. 2023, 23. [Google Scholar] [CrossRef]
- Jabbar, A.; Naseem, S.; Mahmood, T.; Saba, T.; Alamri, F.S.; Rehman, A. Brain tumor detection and multi-grade segmentation through hybrid caps-VGGNet model. IEEE Access 2023, 11, 72518–72536. [Google Scholar] [CrossRef]
- Sille, R.; Choudhury, T.; Sharma, A.; Chauhan, P.; Tomar, R.; Sharma, D. A novel generative adversarial network-based approach for automated brain tumour segmentation. Medicina (B. Aires). 2023, 59, 119. [Google Scholar] [CrossRef]
- Han, S.; Carass, A.; He, Y.; Prince, J.L. Automatic Cerebellum Anatomical Parcellation using U-Net with Locally Constrained Optimization. Neuroimage 2020, 116819. [Google Scholar] [CrossRef]
- Cao, Y.; Zhang, Q.; Li, J.; Wang, Y.; Liu, D.; Yu, H. An automated segmentation model based on CBAM for MR image glioma tumors. In Proceedings of the Proceedings of the 2022 2nd International Conference on Bioinformatics and Intelligent Computing; Association for Computing Machinery: Harbin, China, 2022; pp. 385–388. [Google Scholar]
- Shyamala, N.; Mahaboobbasha, S. Convolutional Block Attention Module-based Deep Learning Model for MRI Brain Tumor Identification (ResNet-CBAM). In Proceedings of the 2024 5th International Conference on Smart Electronics and Communications (ICOSEC); IEEE: Trichy, India, 2024; pp. 1603–1608. [Google Scholar]
- Cui, Y. EUnet++: Enhanced UNet++ Architecture incorporating 3DCNN and CBAM Modules for Brain Tumor Image Segmentation. In Proceedings of the 2024 International Conference on Information Technology, 2024, Communication Ecosystem and Management (ITCEM); IEEE; pp. 28–34.
- Hoseini, F.; Sepehrzadeh, H.; Talimian, A.H. MRI Segmentation Using Inception-based U-Net Architecture and Up Skip Connections. Karafan J. 2024, 21, 66–90. [Google Scholar] [CrossRef]
- Sharma, V.; Kumar, M.; Yadav, A.K. 3D Air-UNet: attention-inception-residual-based U-Net for brain tumor segmentation from multimodal MRI. Neural Comput. Appl. 2025, 37, 9969–9990. [Google Scholar] [CrossRef]
- Cabeza-Ruiz, R.; Velázquez-Pérez, L.; Linares-Barranco, A.; Pérez-Rodríguez, R. Convolutional Neural Networks for Segmenting Cerebellar Fissures from Magnetic Resonance Imaging. Sensors 2022, 22, 1345. [Google Scholar] [CrossRef]
- Hechri, A.; Boudaka, A.; Harmed, A. Improved brain tumor segmentation using modified U-Net model with inception and attention modules on multimodal MRI images. Aust. J. Electr. Electron. Eng. 2024, 21, 48–58. [Google Scholar] [CrossRef]
- Cahall, D.E.; Rasool, G.; Bouaynaya, N.C.; Fathallah-Shaykh, H.M. Inception Modules Enhance Brain Tumor Segmentation. Front. Comput. Neurosci. 2019, 13, 1–8. [Google Scholar] [CrossRef]
- Woo, S.; Park, J.; Lee, J.; Kweon, I.S. CBAM : Convolutional Block Attention Module. In Proceedings of the Proceedings of the European conference on computer vision (ECCV).
- Tustison, N.J.; Avants, B.B.; Cook, P.A.; Zheng, Y.; Egan, A.; Yushkevich, P.A.; Gee, J.C. N4ITK : Improved N3 Bias Correction. In Proceedings of the IEEE Transactions on Medical Imaging; 2010; Vol. 29; pp. 1310–1320. [Google Scholar]
- Fonov, V.S.; Evans, A.C.; Mckinstry, R.C.; Almli, C.R.; Collins, D.L. Unbiased nonlinear average age-appropriate brain templates from birth to adulthood. Neuroimage 2009, 47. [Google Scholar] [CrossRef]
- Avants, B.B.; Tustison, N.; Johnson, H. Advanced Normalization Tools ( ANTS ). Insight j 2009, 2. [Google Scholar]
- Nishio, M.; Wang, X.; Cornblath, E.J.; Lee, S.-H.; Shih, Y.-Y.I.; Palomero-Gallagher, N.; Arcaro, M.J.; Lydon-Staley, D.M.; Mackey, A.P. Alcohol impacts an fMRI marker of neural inhibition in humans and rodents. bioRxiv 2025. [Google Scholar] [CrossRef]
- Fernandez, L.; Corben, L.A.; Bilal, H.; Delatycki, M.B.; Egan, G.F.; Harding, I.H. Free-Water Imaging in Friedreich Ataxia Using Multi-Compartment Models. Mov. Disord. 2024, 39, 370–379. [Google Scholar] [CrossRef]
- Wang, Y.; Teng, Y.; Liu, T.; Tang, Y.; Liang, W.; Wang, W.; Li, Z.; Xia, Q.; Xu, F.; Liu, S. Morphological changes in the cerebellum during aging: evidence from convolutional neural networks and shape analysis. Front. Aging Neurosci. 2024, 16, 1359320. [Google Scholar] [CrossRef]
- Agarwal, A.; Barham, P.; Brevdo, E.; Chen, Z.; Citro, C.; Corrado, G.S.; Davis, A.; Dean, J.; Devin, M.; Ghemawat, S.; et al. TensorFlow: Large-Scale Machine Learning on Heterogeneous Distributed Systems. arXiv Prepr. arXiv1603.04467 2016. [Google Scholar]
- Chollet, F. Keras: The Python deep learning library. Astrophys. Source Code Libr. 2018, ascl–1806. [Google Scholar]
- Kingma, D.P.; Ba, J.L. Adam: a method for stochastic optimization. In Proceedings of the 3rd International Conference for Learning Representations (ICLR); 2015. [Google Scholar]
- Magnusson, M.; Love, A.; Ellingsen, L.M. Automated brainstem parcellation using multi-atlas segmentation and deep neural network. In Proceedings of the Medical Imaging 2021: Image Processing; 2021; pp. 645–650. [Google Scholar]
- Nishimaki, K.; Onda, K.; Ikuta, K.; Chotiyanonta, J.; Uchida, Y.; Mori, S.; Iyatomi, H.; Oishi, K. OpenMAP-T1: A Rapid Deep-Learning Approach to Parcellate 280 Anatomical Regions to Cover the Whole Brain. Aust. Imaging Biomarkers Lifestyle Flagsihp Study Aeging 2024, 45, 70063. [Google Scholar] [CrossRef] [PubMed]
- Iglesias, J.E.; Liu, C.Y.; Thompson, P.M.; Tu, Z. Robust brain extraction across datasets and comparison with publicly available methods. IEEE Trans. Med. Imaging 2011, 30, 1617–1634. [Google Scholar] [CrossRef]
- Reetz, K.; Rodríguez, R.; Dogan, I.; Mirzazade, S.; Romanzetti, S.; Schulz, J.B.; Cruz-Rivas, E.M.; Alvarez-Cuesta, J.A.; Aguilera Rodríguez, R.; Gonzalez Zaldivar, Y.; et al. Brain atrophy measures in preclinical and manifest spinocerebellar ataxia type 2. Ann. Clin. Transl. Neurol. 2018, 5, 128–137. [Google Scholar] [CrossRef]
- Ronneberger, O.; Fischer, P.; Brox, T. U-net: Convolutional networks for biomedical image segmentation. Lect. Notes Comput. Sci. (including Subser. Lect. Notes Artif. Intell. Lect. Notes Bioinformatics) 2015, 9351, 234–241. [Google Scholar] [CrossRef]
- Çiçek, Ö.; Abdulkadir, A.; Lienkamp, S.S.; Brox, T.; Ronneberger, O. 3D U-net: Learning dense volumetric segmentation from sparse annotation. In Proceedings of the Medical Image Computing and Computer-Assisted Intervention–MICCAI 2016: 19th International Conference; Vol. 9901 LNCS; Springer International Publishing: Athens, Greece, 2016; pp. 424–432. [Google Scholar]
Figure 1.
Basic structure of the 3D U-Net and inception used.
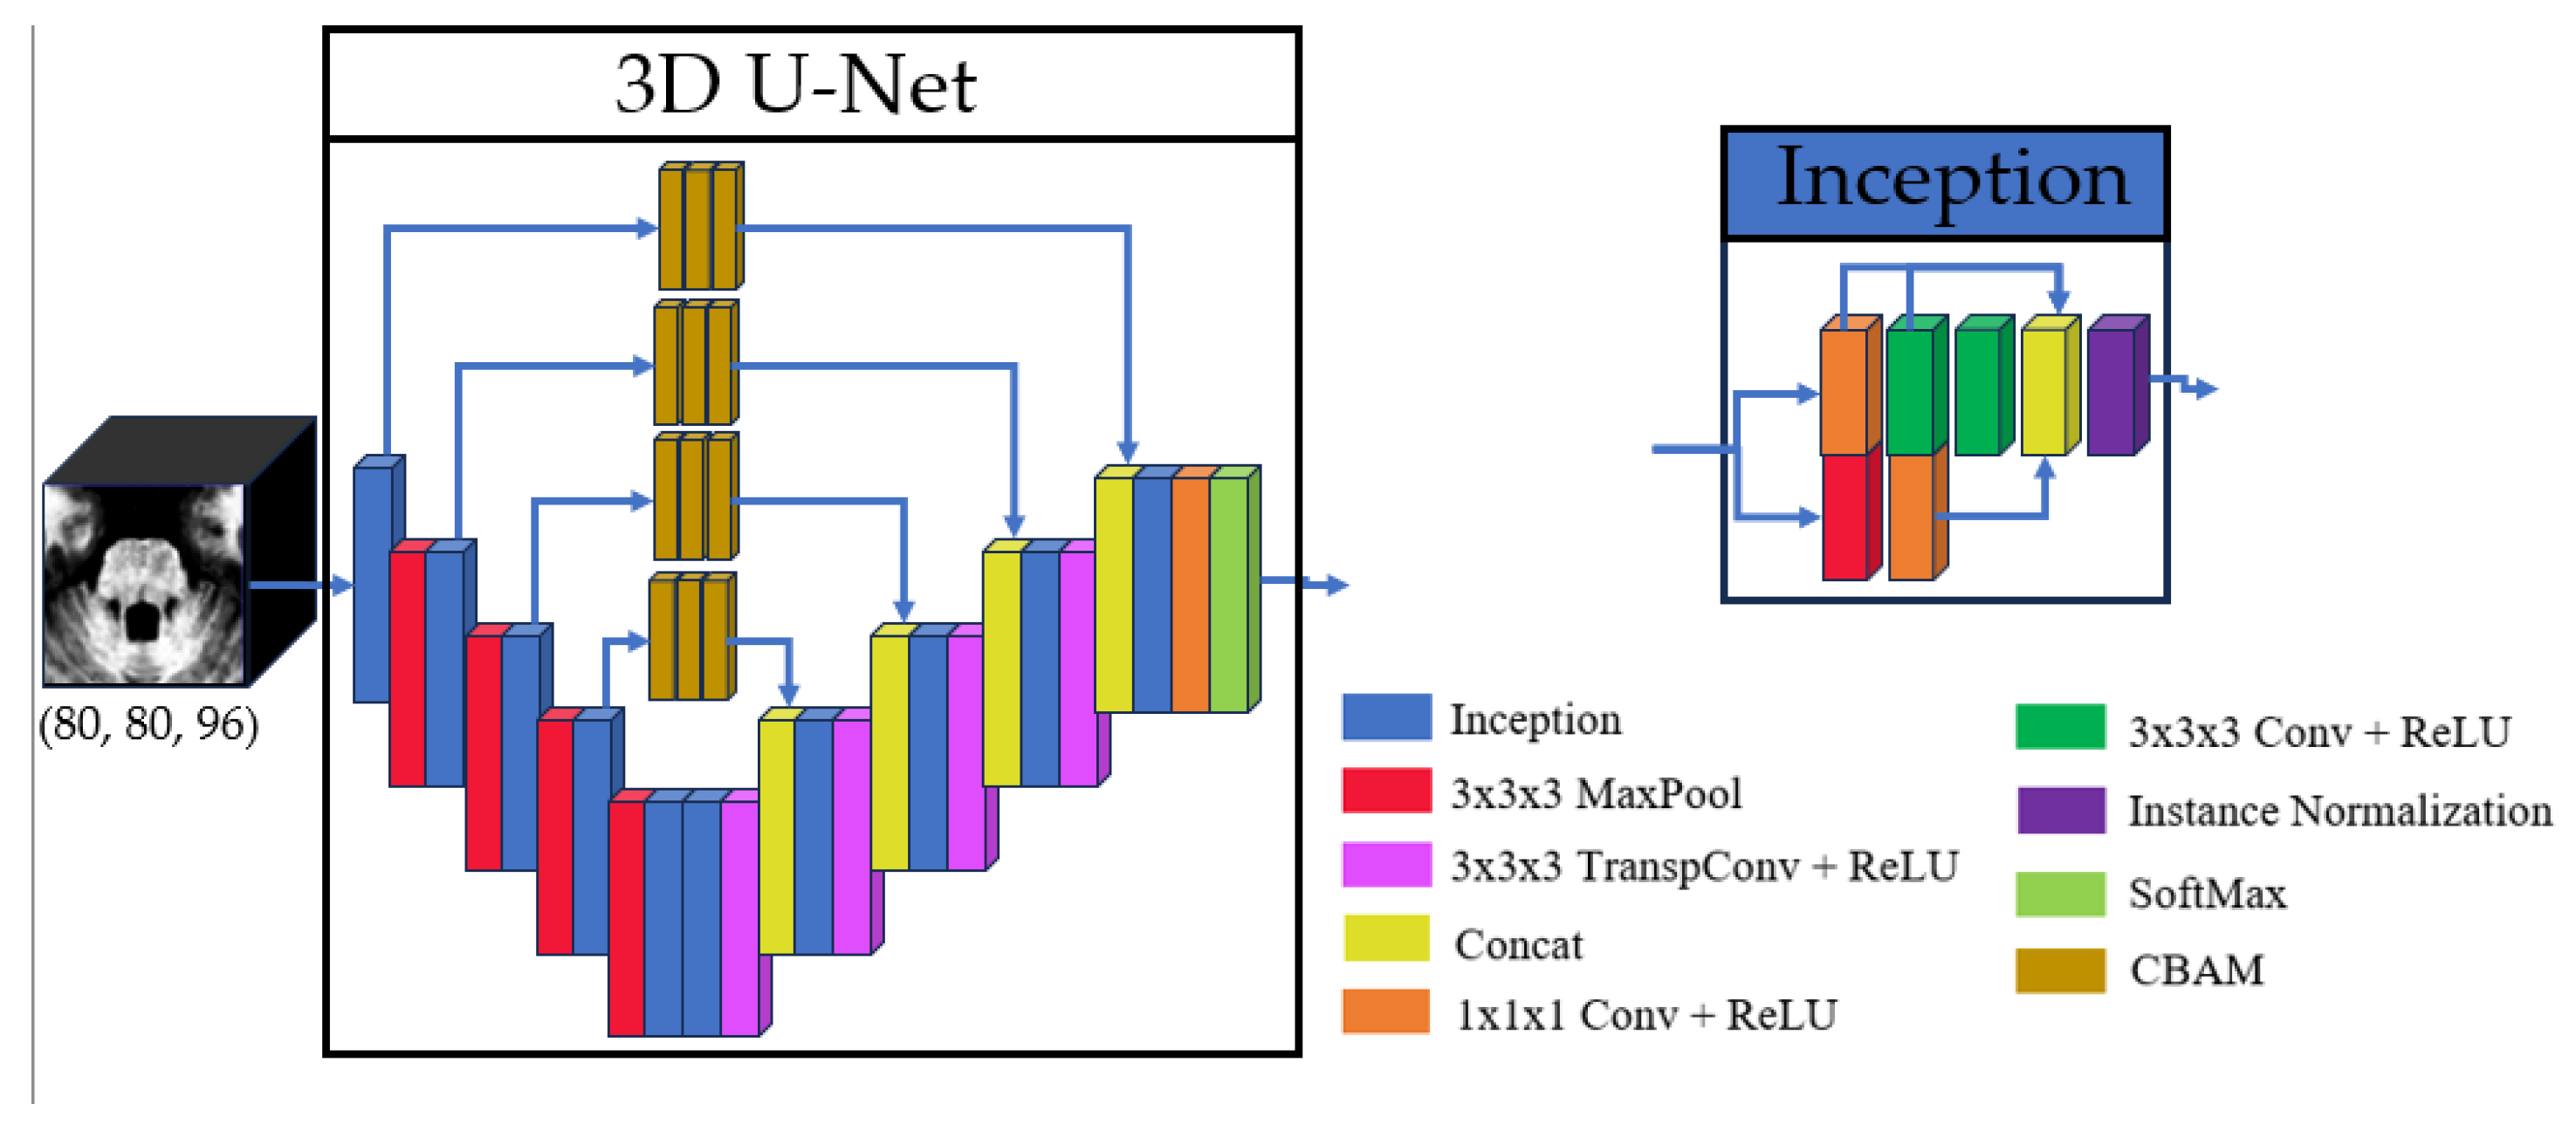
Figure 2.
Structures of Convolutional Block Attention Module (CBAM), Channel Attention Module (CAM) and Spatial Attention Module (SAM).
Figure 2.
Structures of Convolutional Block Attention Module (CBAM), Channel Attention Module (CAM) and Spatial Attention Module (SAM).
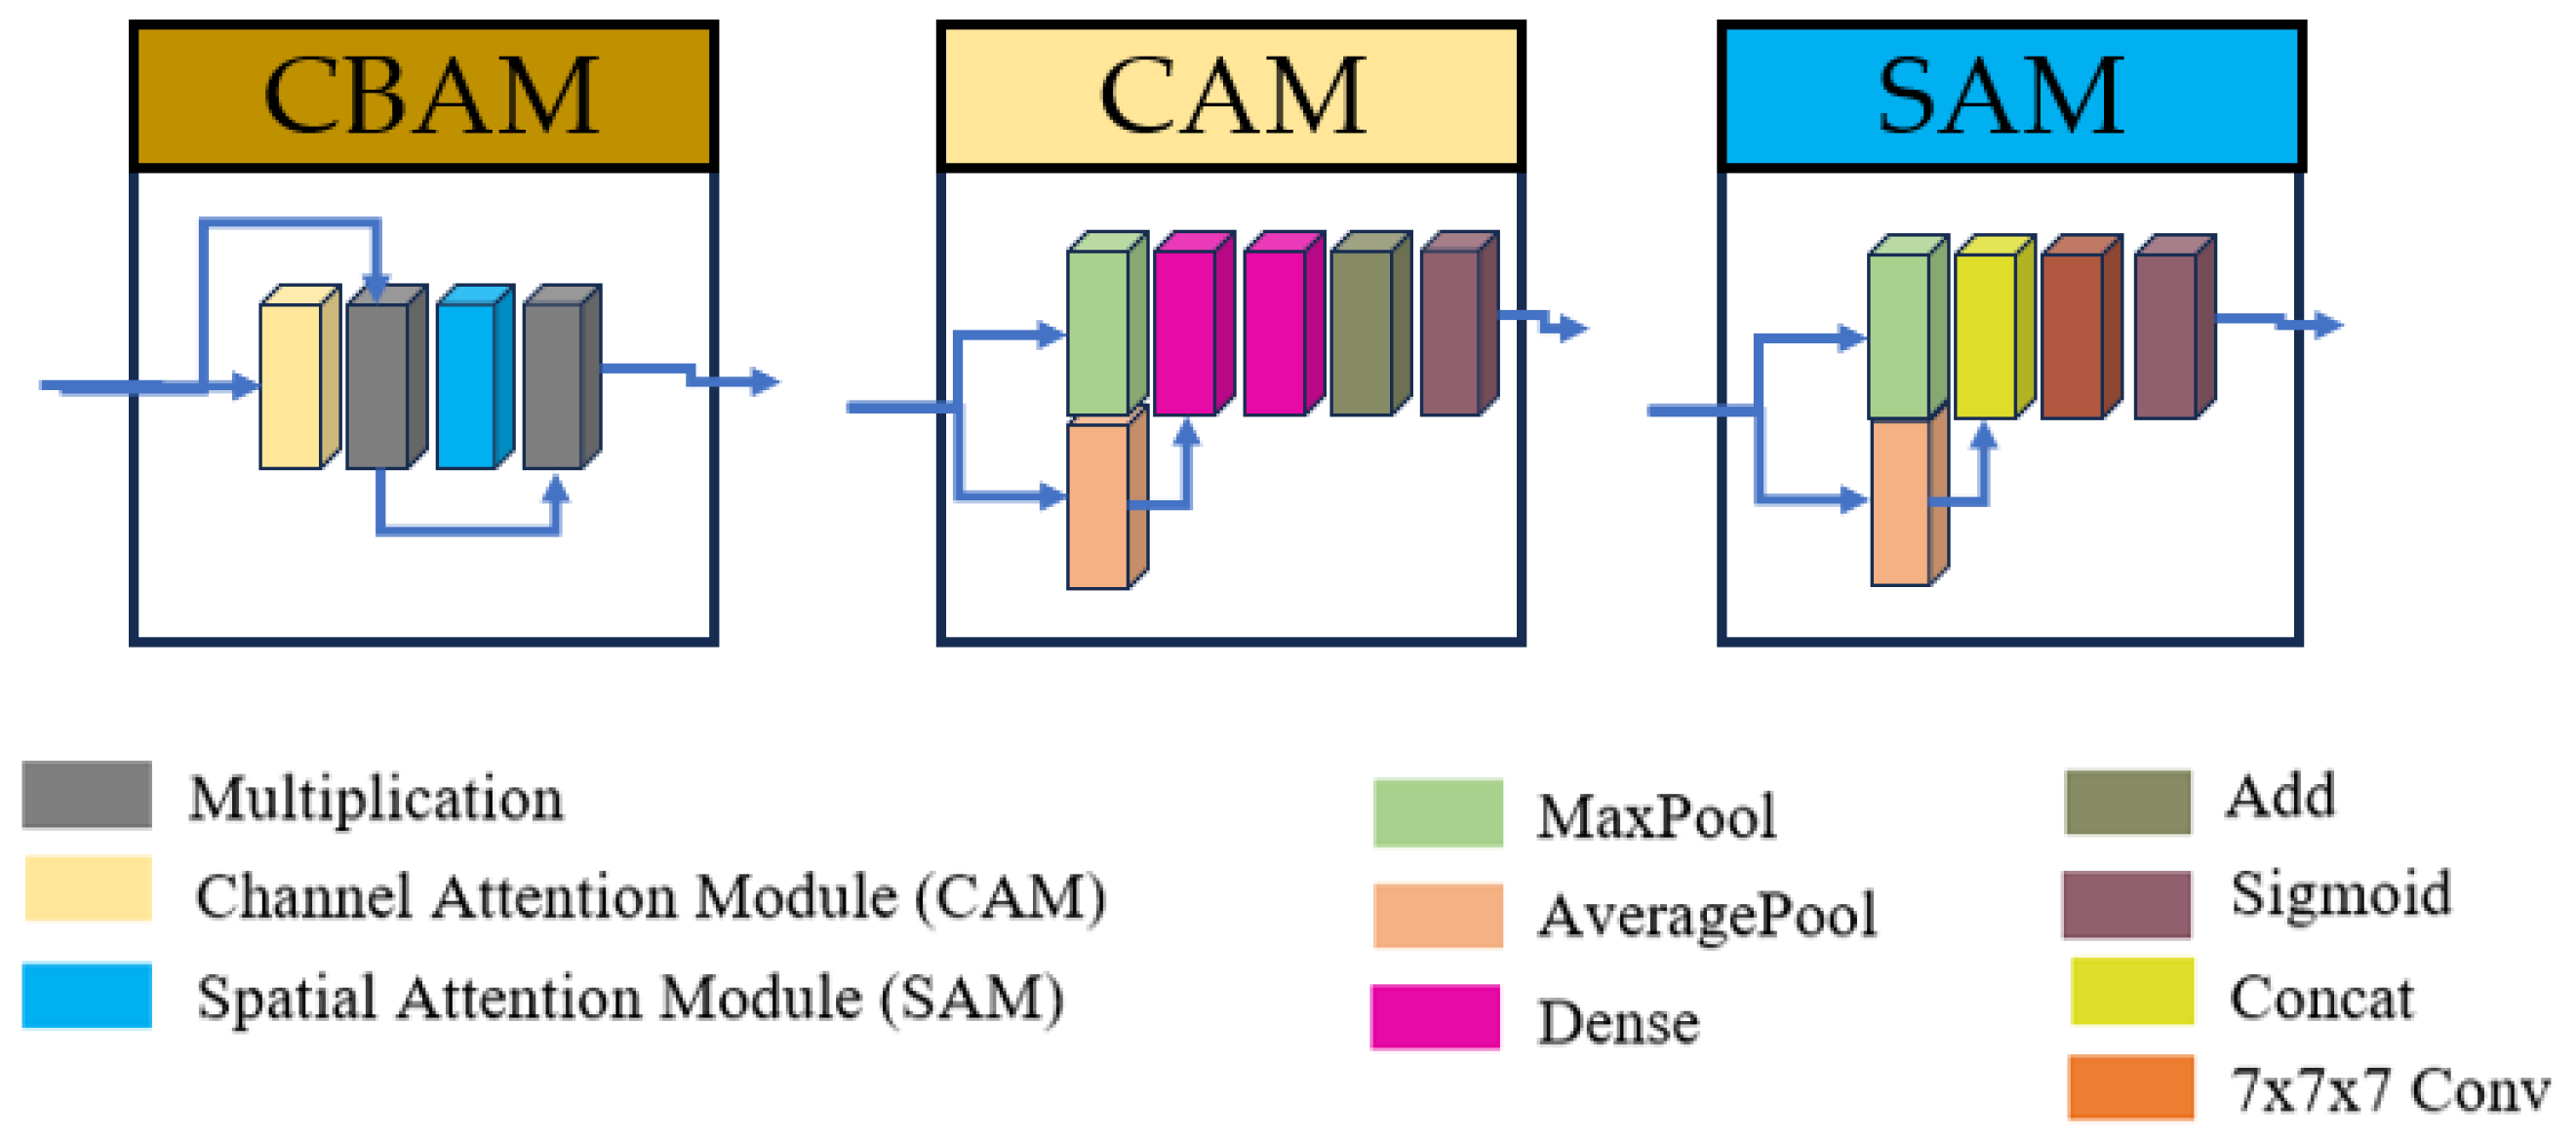
Figure 3.
Full preprocessing routine for a single image. Original image (a), followed by N4 Norm.+MNI Registration (b) and manual labels superposition (c). Follows the result of crop operation (d) and intensity normalization (e). In (f) the manually segmented labels in the cropped region, and (g) shows a 3D view. Label colors: medulla (red), pons (green), and mesencephalon (blue).
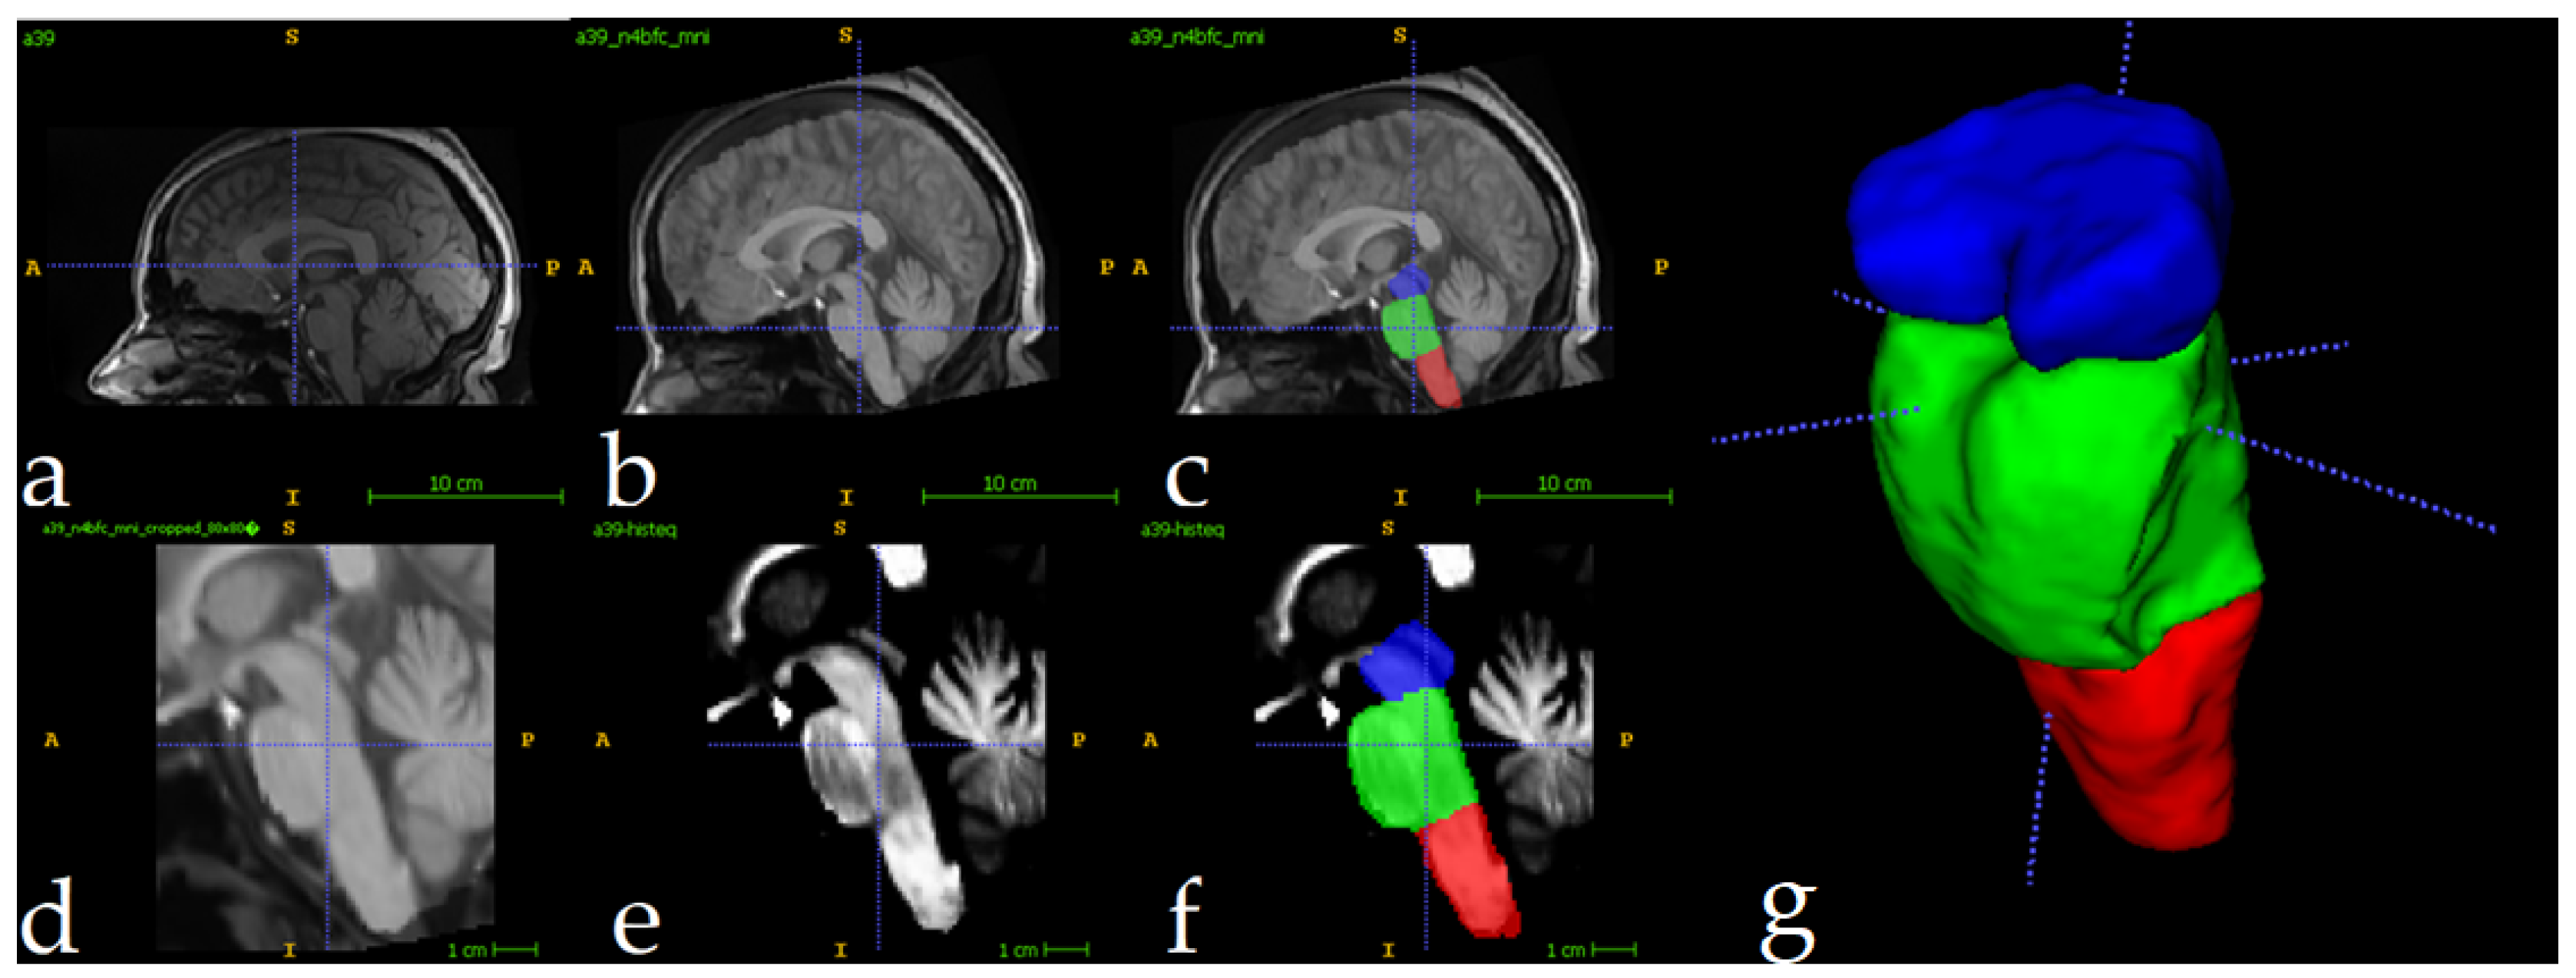
Figure 4.
From top to bottom: original image, and segmentations produced by this research, previous research [40], Han et al. [34], Magnusson et al. [53], and Nishimaki et al. [54]. From left to right: axial, sagittal, coronal and 3D views. Labels shown: medulla (red), pons (green) and mesencephalon (blue).
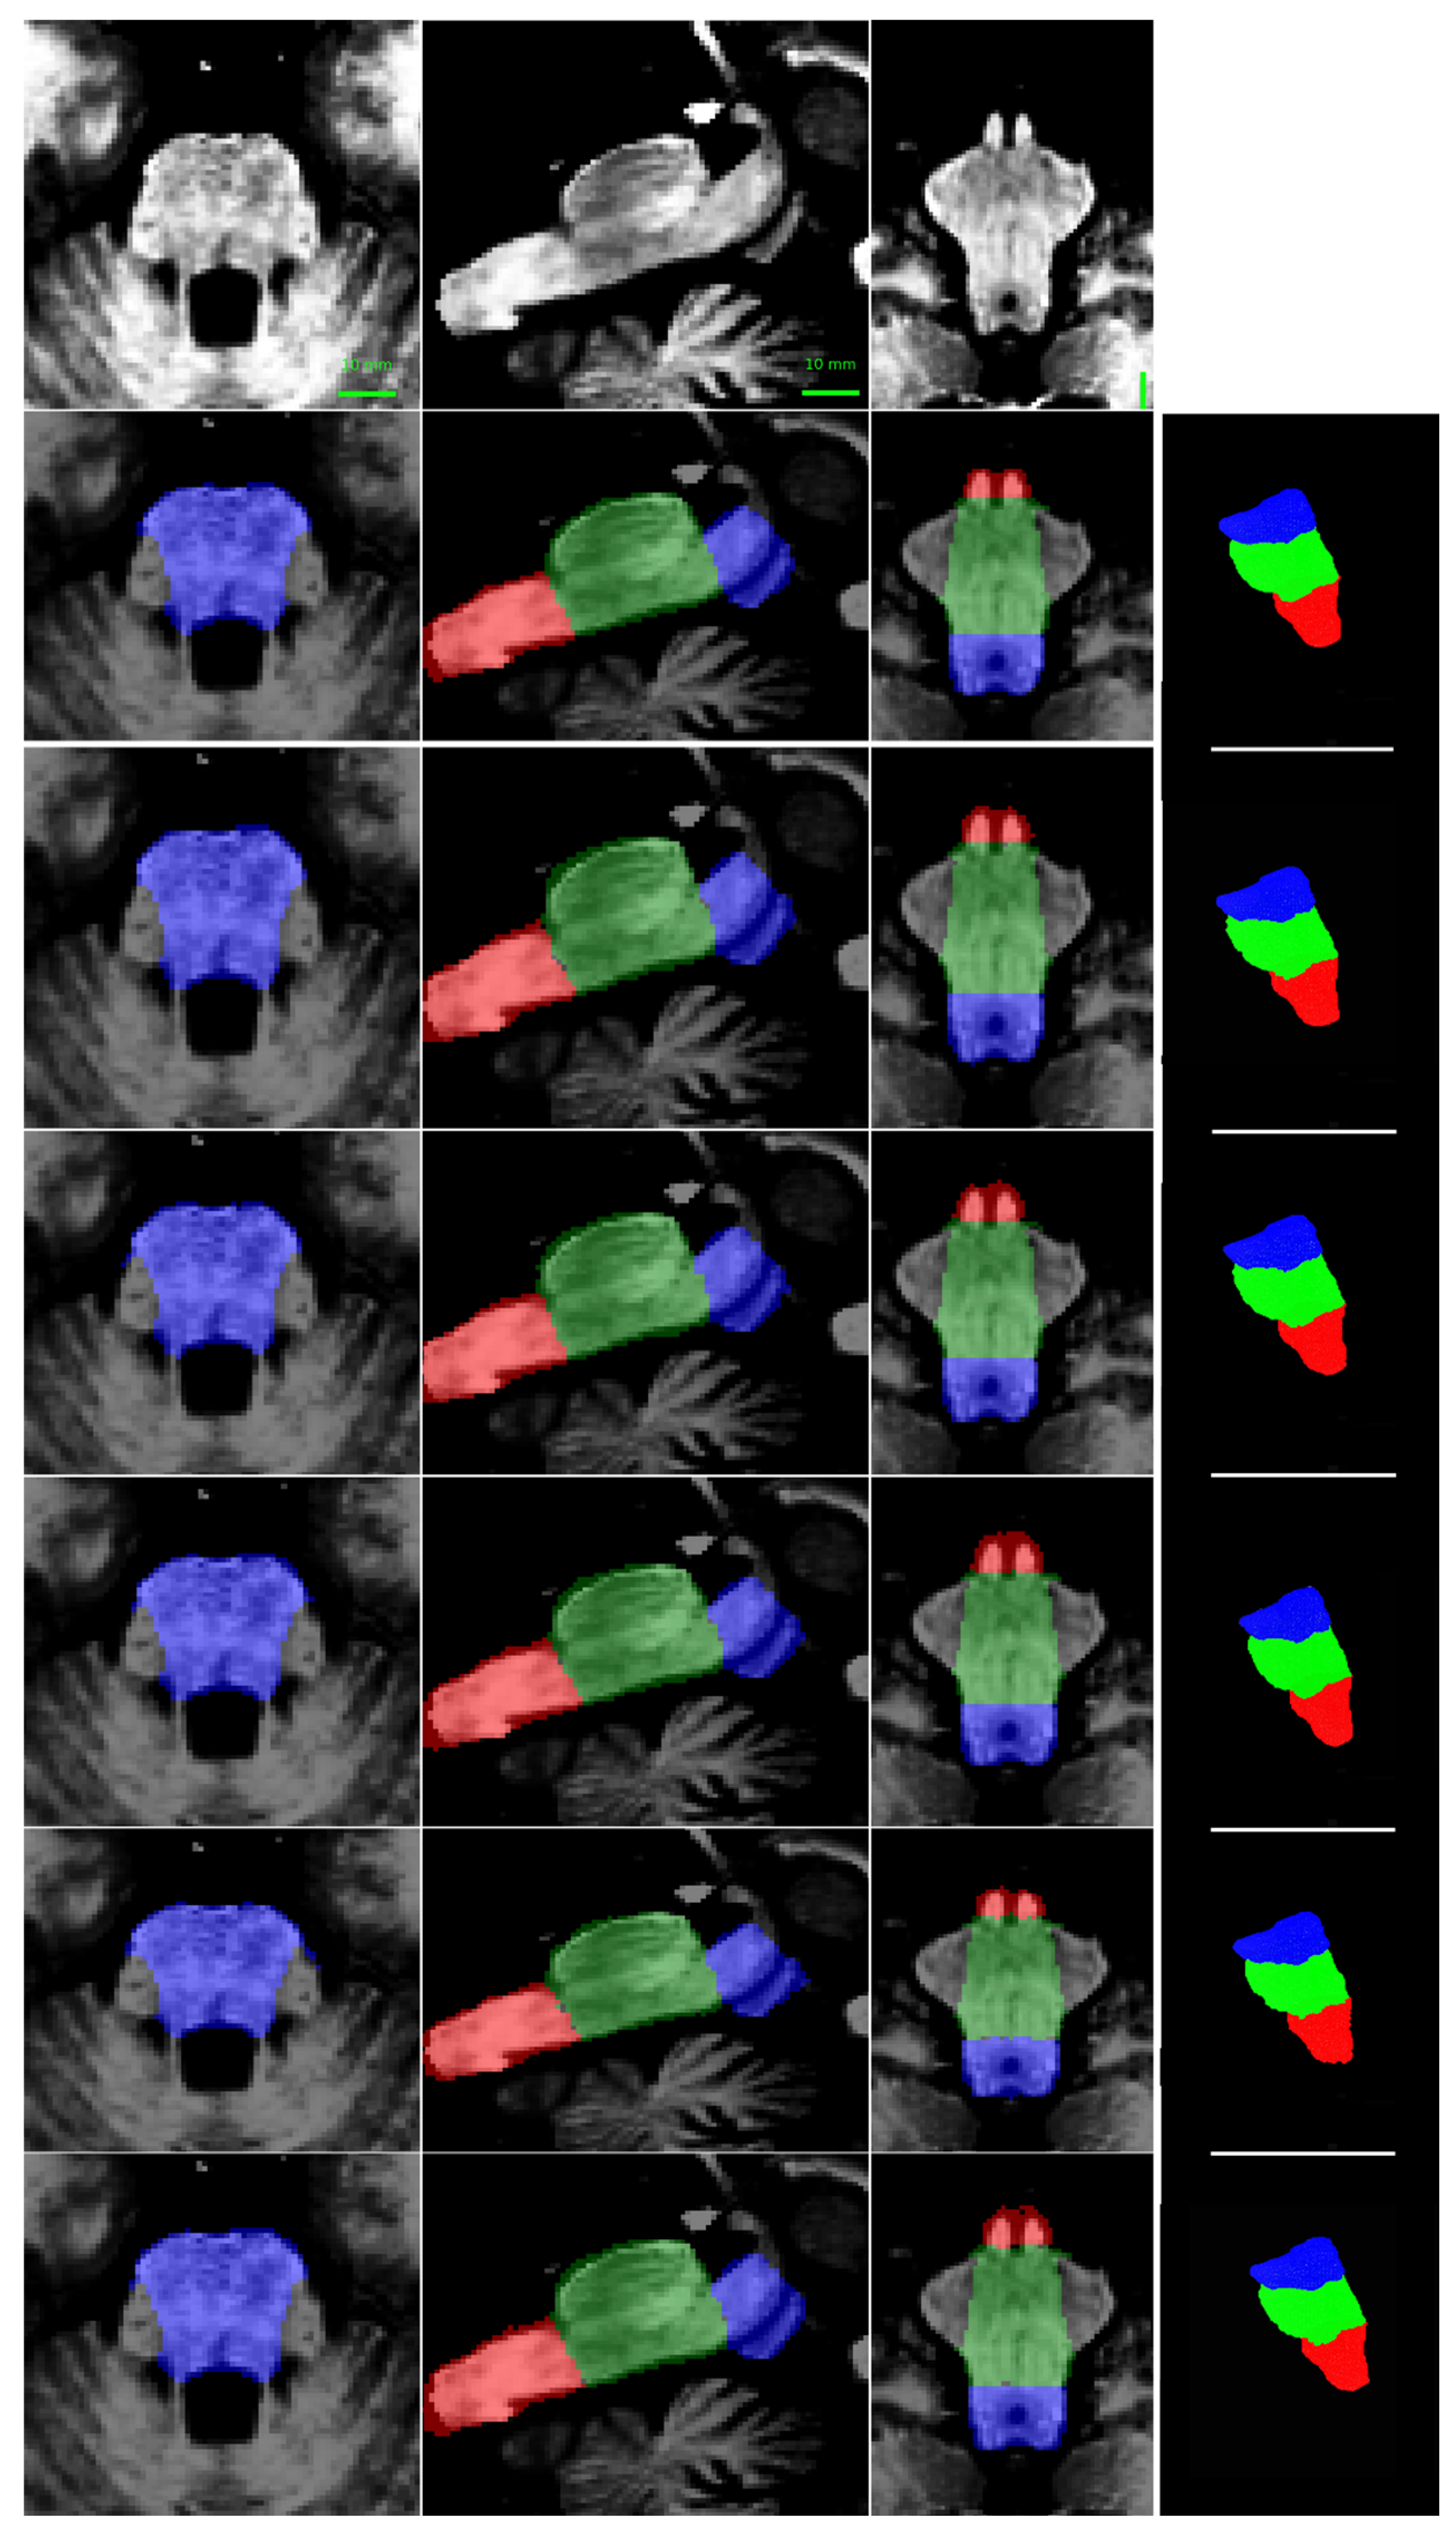
Figure 5.
Multiplanar errors for a representative case. Blue: false negatives; red: false positives. From top to bottom: multiplanar errors for the segmentation produced by this research, previous research [40], Han et al. [34], Magnusson et al. [53], and Nishimaki et al. [54]. From left to right: axial, and sagittal views.
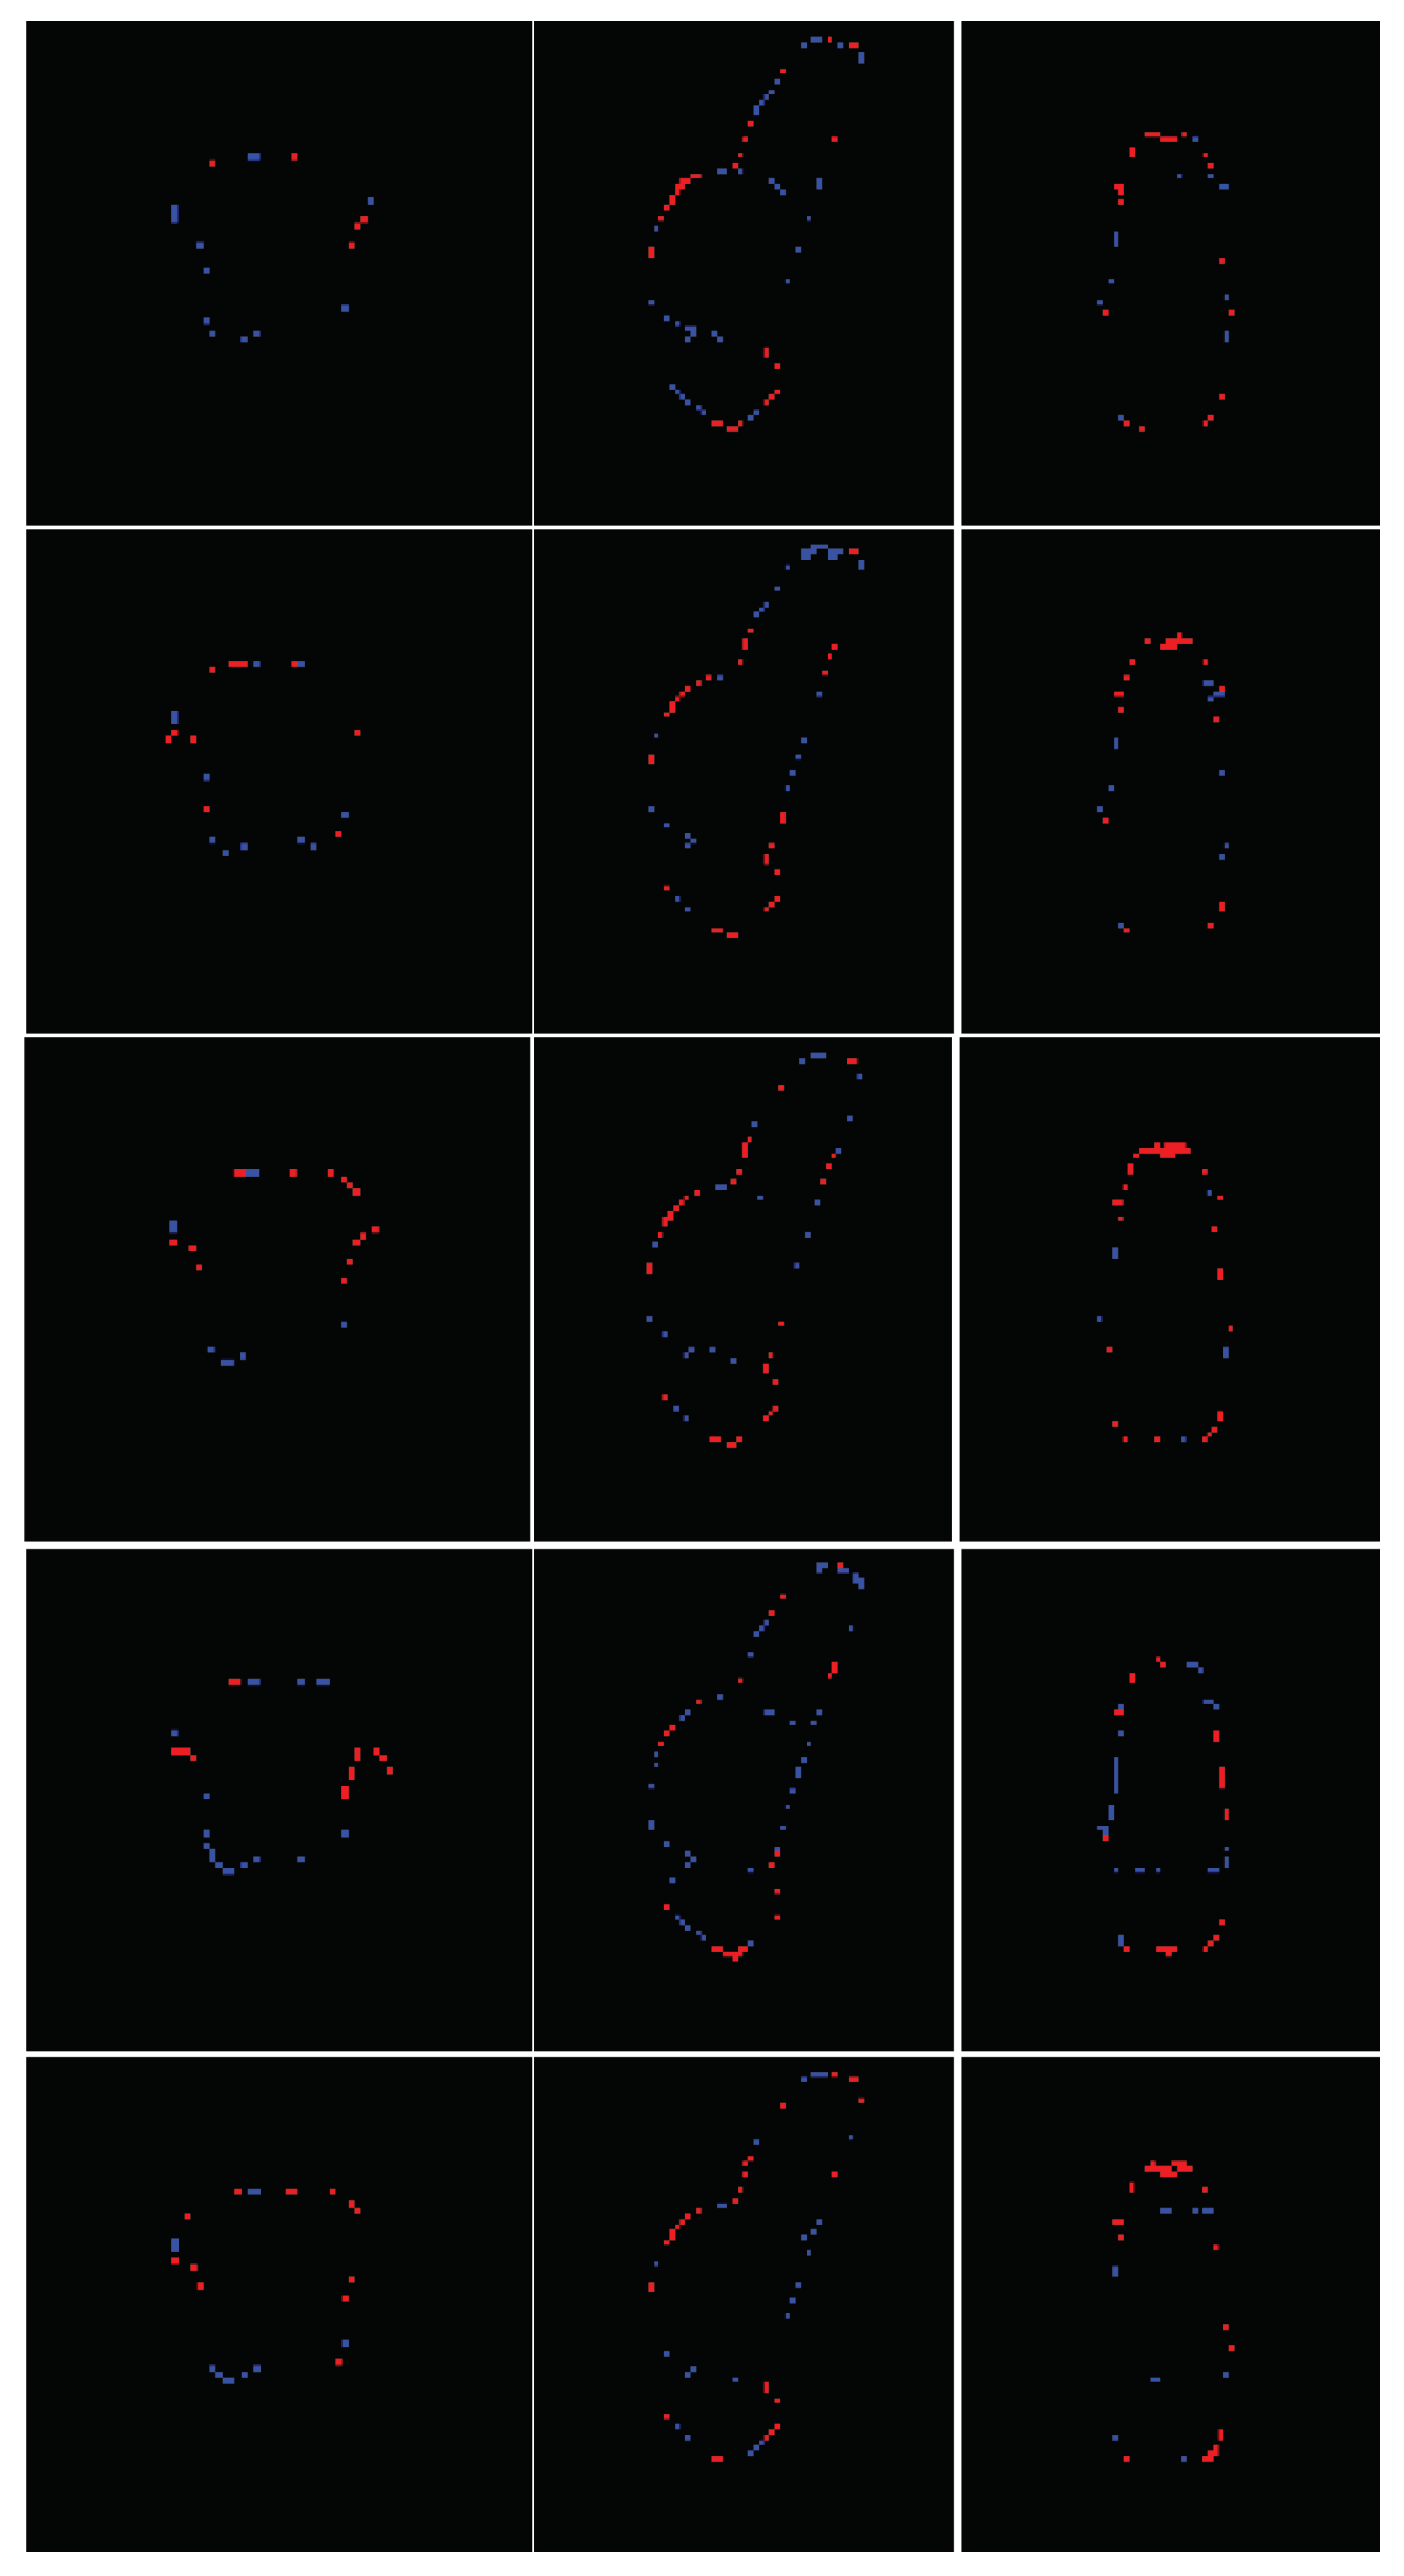

Table 1.
Demographic information of the cohort’s individuals.
| Data range | Value |
|---|---|
| Age (years) | 25 to 72 |
| SARA score (patients and preclinical) | 0.0 to 39 |
| CAG repeat | 36 to 40 |
| Evolution years (patients) | 1 to 31 |
Table 2.
Number of parameters for each model.
| Label | Number of parameters |
|---|---|
| This research | 5 254 266 |
| [40] | 8 788 376 |
| Han et al.[34] | 21 641 792 |
| Magnusson et al.[53] | 10 796 252 |
| Nishimaki et al. [54] | 22 598 862 |
Table 3.
Mean dice scores and stdev achieved for each model in the test set.
| Label | Mean DSC±stdev | ||||
|---|---|---|---|---|---|
| This research | [40] | Han et al.[34] | Magnusson et al.[53] | Nishimaki et al. [54] | |
| Mesencephalon | 0.96±0.022 | 0.92±0.019 | 0.93±0.019 | 0.89±0.031 | 0.91±0.022 |
| Pons | 0.96±0.015 | 0.94±0.014 | 0.94±0.013 | 0.91±0.029 | 0.93±0.014 |
| Medulla | 0.95±0.021 | 0.93±0.020 | 0.92±0.021 | 0.91±0.023 | 0.93±0.021 |
| Full brainstem | 0.96±0.008 | 0.95±0.008 | 0.95±0.007 | 0.93±0.013 | 0.95±0.007 |
Table 4.
Mean Intersection over Union (IoU), Haussdorf Distance (HD95), Specificity, Sensitivity, and Precision. Evaluations performed using the full brainstem.
Table 4.
Mean Intersection over Union (IoU), Haussdorf Distance (HD95), Specificity, Sensitivity, and Precision. Evaluations performed using the full brainstem.
| Measures | Score (mean value) | ||||
|---|---|---|---|---|---|
| This research | [40] | Han et al.[34] | Magnusson et al.[53] | Nishimaki et al. [54] | |
| IoU | 0.91±0.01 | 0.91±0.01 | 0.91±0.01 | 0.88±0.06 | 0.91±0.01 |
| HD95 (mm) | 2.71 | 3.02 | 2.78 | 3.29 | 2.65 |
| Specificity | 0.99±0.0007 | 0.99±0.0007 | 0.99±0.0006 | 0.99±0.001 | 0.99±0.0007 |
| Sensitivity | 0.95±0.01 | 0.94±0.02 | 0.94±0.02 | 0.92±0.05 | 0.95±0.01 |
| Precision | 0.96±0.01 | 0.96±0.01 | 0.96±0.01 | 0.94±0.03 | 0.96±0.01 |
Table 5.
Mean volumes for manifest SCA2 patients, preclinical and control subjects. P: p-values from Kruskal – Wallis test.
Table 5.
Mean volumes for manifest SCA2 patients, preclinical and control subjects. P: p-values from Kruskal – Wallis test.
| Brainstem section | Mean volumes (% TICV) | P | ||
|---|---|---|---|---|
| Patients | Preclinical | Controls | ||
| Mesencephalon | 0.4 | 0.44 | 0.48 | 0.007 |
| Pons | 0.47 | 0.76 | 0.82 | < 0.0001 |
| Medulla | 0.26 | 0.29 | 0.31 | 0.00012 |
| Whole brainstem | 1.12 | 1.49 | 1.62 | < 0.0001 |
Table 6.
Correlations of brainstem volumes (%TICV) with clinical measures: SARA scores and CAG repeats (patients+preclinical; n=19 total); disease duration (patients only; n=11).
Table 6.
Correlations of brainstem volumes (%TICV) with clinical measures: SARA scores and CAG repeats (patients+preclinical; n=19 total); disease duration (patients only; n=11).
| Brainstem section/score | SARA | Disease duration | CAG repeat | |||
|---|---|---|---|---|---|---|
| Corr | P | Corr | P | Corr | P | |
| Mesencephalon | -0.62 | <0.01 | -0.58 | 0.06 | -0.49 | <0.05 |
| Pons | -0.69 | <0.01 | -0.55 | <0.05 | -0.56 | <0.05 |
| Medulla | -0.62 | <0.01 | -0.22 | 0.50 | -0.43 | 0.06 |
| Whole brainstem | -0.71 | <0.01 | -0.37 | 0.25 | -0.55 | <0.05 |
Disclaimer/Publisher’s Note: The statements, opinions and data contained in all publications are solely those of the individual author(s) and contributor(s) and not of MDPI and/or the editor(s). MDPI and/or the editor(s) disclaim responsibility for any injury to people or property resulting from any ideas, methods, instructions or products referred to in the content. |
© 2025 by the authors. Licensee MDPI, Basel, Switzerland. This article is an open access article distributed under the terms and conditions of the Creative Commons Attribution (CC BY) license (http://creativecommons.org/licenses/by/4.0/).
Copyright: This open access article is published under a Creative Commons CC BY 4.0 license, which permit the free download, distribution, and reuse, provided that the author and preprint are cited in any reuse.


