
Submitted:
06 May 2025
Posted:
07 May 2025
You are already at the latest version
Abstract
Domestication is a translation theory in which the source text (to be translated) is matched to the foreign reader by erasing its original linguistic and cultural difference. This match aims at making the target text (translated text) more fluent. On the contrary, foreignization is a translation theory in which the foreign reader is matched to the source text. The paper explores mathematically the degree of domestication/foreignization in current translation practice of texts written in alphabetical languages. A geometrical representation of texts, based on linear combinations of deep−language parameters, allows: (a) to calculate a domestication index which measures how much domestication is applied to the source text; (b) to distinguish language families. An expansion index measures the relative spread around mean values. The paper reports statistics and results on translations of: (a) Greek New Testament books in Latin and in 35 modern languages; (b) English novels in western languages. English and French, although attributed to different language families, mathematically almost coincide. The requirement of making the target text more fluent makes domestication, with varying degree, universally adopted, so that a blind comparison of the same linguistic parameters of a text and its translation hardly indicates they refer to each other.
Keywords:
Balto−Slavic languages
; deep−language
; geometrical representation
; Germanic languages
; Greek
; Latin
; New Testament
; Romance languages
; translation
; Uralic languages
1. Introduction
Translation replaces a text in one language (source text) with an equivalent text in another language (target text). Most studies on translation report results not based on mathematical analysis of texts, as we do with a mathematical/statistical theory on alphabetical languages developed in a series of papers [1‒8]. The mathematical approach adopted by scholars [9‒13] does not consider Shannon’s communication theory [14] or the fundamental relationship that linguistic parameters show with reader’s reading skill and short–term memory, included in our theory, which unifies mathematically the study of any alphabetical language.
Of all types of translation, literary translation is maybe the most demanding and difficult because the language of literature is different from ordinary or technical language and involves many challenges on the syntactic, lexical, semantic and stylistic levels [15‒22].
In studies on translation theory, especially of literary texts, scholars mention the concept of “equivalence” (or “sameness”) between the source text (to be translated) and the target text (translated) [23‒25]. This concept, however is loosely and poorly or never mathematically defined. On the contrary, our theory can mathematically “measure” how much texts differ from each other, with a multidimensional analysis [26].
Today, there is consensus that the translator of literary texts is an active role player and the intermediary between the source text and the target text [17,27].
In relation to the translator’s role, however, two main theories of translation are today discussed: “domestication” and “foreignization” [27]. Domestication is a translation theory in which the translator tries to match the source text to the reader, mainly to reader’s reading skill and culture. Foreignization is a method in which the translator tries to match the reader to the source text, regardless of reader’s reading skill and culture. In other words, domestication neglects the foreign reality, while foreignization retains the foreignness and cultural otherness of a foreign text.
In translation to English, for example, the dominant practice is domestication [27] because translation makes the target text more fluent. This is achieved, however, by erasing the linguistic and cultural difference of the foreign text, therefore, text fluency becomes the general criterion to judge a translation.
Our mathematical theory can measure the “equivalence” of source and target texts. In [26], for example, we have shown how much J.R.R. Tolkien influenced the writings of C.S. Lewis and in [28] how much a recent English translation has modified the underlying mathematical structure of the most important Italian novel.
Out of the mathematical tools developed, to study systematically the domestication of source texts we use a vector and geometrical representation of texts, based on linear combinations of deep−language parameters [1−3]. From them, a probability of “error”, suitably defined, indicates how much a text can be confused with another text, quantified by an index giving the percentage of domestication [26,28,29]. In the present paper we define another useful index, the “expansion” index, which measures the relative spread around mean values of the ensemble of vectors of two texts in their geometrical representation.
The theory is applied to a large set of the New Testament (NT) books originally written in Greek ‒ namely the Gospels according to Matthew, Mark, Luke, John, the Book of Acts, the Epistle to the Romans, the Apocalypse, for a total of 155 chapters, according to the traditional subdivision of the original Greek texts – and their translation to Latin and to 35 modern languages, texts partially studied also in [4,6].
The rationale for considering these NT books and their modern translations is based on its great importance for many scholars of multiple disciplines, and on the use of common language, not depending on any scientific/academic discipline. These translations strictly respect the subdivision in chapters and verses of the Greek texts – as they are fixed today, see [30] for recalling how interpunctions where introduced in the original scriptio continua texts − therefore they can be studied at least at these two different levels (chapters and verses).
Notice that in this paper “translation” is indistinguishable from “language” because we deal only with one translation per language. It is curious to notice, however, that in English and in Spanish there are tens of different translations of the NT books [31].
For our analysis, as done in References [2,4], we have chosen the chapter level because the amount of text is sufficiently large to assess reliable statistics on deep−language parameters. Therefore, for each translation/language we have considered a database of samples for each translation.
Our investigation shows that these Greek texts have been largely domesticated in modern translations. Moreover, to assess that domestication can dominate also translations in modern literature, we show, with few examples taken from the English Literature, that domestication prevails over foreignization, as in Italian Literature [28].
After this introductory section, in Section 2 we report the data base of the Greek NT books, their translations and statistics of totals of linguistic parameters; in Section 3 we define the deep–language parameters; in Section 4 we recall and discuss a geometrical representation of texts; in Section 5 we calculate error probability and domestication index of texts; in Section 6 we explore the translation of the NT books from any language to any other language; in Section 7 we define and discusses the deep−language expansion factor; in Section 8 we study the domestication in translations of modern literature; in Section 9 we summarize the main results and draw a conclusion.
2. Data Base and Statistics of Totals
In this section we report the statistics of totals regarding characters, words, sentences and interpunctions (punctuation marks). We have calculated them from the digital texts (WinWord files) in the following manner: for each chapter we have counted the number of characters, words, sentences and interpunctions. Before doing so, however, we have deleted the titles, footnotes and other extraneous material present in the digital texts which, for our analysis, can be considered as “noise”.
The count is very simple, although time−consuming and does not require any understanding of the language considered. For each text block, WinWord directly provides the number of characters, words and sentences. The number of sentences, however, was first calculated by replacing periods with periods (full stops): of course, this action does not change the text, but it gives the number of these substitutions, therefore the number of periods. The same procedure was done for question marks and exclamation marks. The sum of the three totals gives the total number of sentences of the text block. The same procedure gives the total number of commas, colons and semicolons. The sum of these latter values with the total number of sentences gives the total number of interpunctions.
Table 1 lists languages of translation and language family of the New Testament books considered, together with the total number of characters, words, sentences and interpunctions. Appendix A reports the list of mathematical symbols with their meaning.
Figure 1, Figure 2 show the histograms of the values of Table 1, fitted with a log−normal probability density model, whose mean and standard deviation were calculated from the linear mean and standard deviation values (see Appendix B).
Defined the relative normalized difference between the linguistic quantity in Greek ( and that in translation (of the parameters reported in Table 1:
Table 2 shows the mean and standard deviation of . Figure 1, Figure 2, Figure 3 and Figure 4 and the synthetic statistics reported in Table 2 do show that translation of the Greek texts is not at all verbatim and quite different from language to language. All mean values are greater than the Greek value, with very large differences, especially in sentences and interpunctions. In the next section we deepen the study of these differences.
3. Deep–Language Parameters
We recall the so−called surface deep−language parameters [1,2]. These parameters are not consciously managed by a writer; therefore, they are useful to assess “equivalence” or “sameness” of texts beyond writer’s awareness. To avoid possible misunderstanding, these variables refer to the “surface” structure of texts (i.e., what we read or write), not to the “deep” structure mentioned in cognitive theory [32−35].
Let , ,andbe respectively the number of characters, words, interpunctions and word intervals per chapter:
Number of characters per word, :
Number of words per sentence, :
Number of interpunctions per word, referred to as the word interval, :
Number of word intervals per sentence, :
Table 3 reports mean and standard deviation of these parameters in the indicated translation. Notice that the values of these parameters, if calculated from the totals of Table 1, are always less or equal to those reported in Table 3 (see the proof in [28]). For example, in Greek while the value calculated from Table 1 is , as theoretically expected.
Table 3 shows a large spread compared to the original Greek values. These differences will largely affect the geometrical representation, the probability of error, the domestication index and the expansion factor, all issues discussed in the next sections
4. Geometrical Representation of Texts
The mean values reported in Table 3 can be used to model texts as vectors in the first quadrant of a Cartesian orthogonal coordinates plane, representation discussed in detail in [1−3] and here briefly recalled for reader’s benefit. This geometrical representation of texts allows to calculate the probability that a text/author can be confused with another one [26,28]. The conditional probability and the domestication index can indicate a probable influence of a text on another, as shown in [26,28]. In our case, it indicates how much a translation differs or is similar to the original text.
Let us consider the following six vectors of the indicated components of deep‒language variables ), ), ), ), ), ) and their resulting vector sum:
Notice that deciding which parameter is reported in abscissa or in ordinate is not fundamental because, once the choice is done, the numerical results will depend on it, but not comparisons and conclusions. Texts are mathematically more connected as the distance between the ending points of vector Eq. (6) decreases.
By considering the vector components and of Eq. (6), we obtain the scatterplots shown in Figure 3 where and are normalized coordinates calculated by setting Haitian at the origin and Greek at , according to the linear transformation:
From the scatterplot shown in Figure 3 we can observe the following facts.
Latin, Italian, Spanish, French and Rumanian are each other very close, very likely because they all belong to the same Romance family (languages mostly derived from Latin), with the exception of Portuguese.
Greek is largely displayed from all other languages, therefore confirming the large differences of the Greek totals compared to those of the other languages (Table 2).
Bulgarian, Czech, Croatian, Polish, Serbian, Slovak and Ukrainian are each other close, very likely because they all belong to the same Balto−Slavic family.
Chichewa and Luganda are each other close, both belonging to the Niger−Congo family; Cebuano and Tagalog are also each other very close, both belonging to the Austronesian family.
English and French, although attributed to different families, almost coincide, at least in the translations here considered (both from the Vatican website, see [2]). This coincidence, and also the small distance of English from all other Romance languages, can be partially explained by the fact that many English words and several sentence structure come French and/or from Latin, a language from which romance languages derive.
In conclusion, the geometrical representation based on the means of the deep−language parameters allows to distinguish language family and relative distances.
Now, a more refined analysis can indicate whether a text may be confused with another belonging to the same or diverse language family. The standard deviation of the four deep−language variables (Table 3) do introduce vectors scattering, therefore a text/translation can extend itself in an area around the ending point of the vector Eq. (6). In other words, a text can “overlap” with other texts and can be, therefore, mathematically confused with another one. This fact can be measured by an “error” probability and a domestication index [26,28], which depend on the relative distance between mean vectors and standard deviations, as discussed in the next section.
5. Error Probability and Domestication Index
Besides the mean vector given by Eq. (6), we can consider a further vector , due to the standard deviation of the four deep−language variables, that adds to [26]. In this case, the final vector modelling a text/translation is given by:
Now, to get some insight into this description, we consider the area of a circle centered at the ending point of . The radius is calculated as follows [26]. First, we add the variances of the deep−language variables that determine the components and of − let the total sums be , − then we calculate the average value and finally we set:
Because in calculating the coordinates and of a deep−language variable can be summed twice or more in Eq. (6), we add its standard deviation (Table 3) twice or more times before squaring and coordinates normalization, as shown in [26].
Now, we can estimate the (conditional) probability that a text is confused with another by calculating ratios of overlapping areas. This procedure is correct if we assume that the bivariate density function of the normalized coordinates , centred at , is uniform [36−38].
As discussed in [26], the hypothesis of substantial uniformity around should hold at least within 1‒sigma bounds, by noting that the coordinates are likely distributed according to a Gaussian bivariate density because the four deep−language variables, which combine in Eq. (6) linearly, can be modelled as log−normal [1]. For the central−limit theorem [36], therefore we should expect approximately a Gaussian model of the coordinates , but with a significantly larger standard deviation than that of the single deep−language variables. Therefore, in the area close to the bivariate density function should not be very peaked, hence the uniform density modelling, at least within 1‒sigma bounds.
Now we can calculate the following probabilities. Let be the common area of two 1−sigma circles (i.e., the area proportional to the joint probability of two texts), let be the area of 1−sigma circle of text 1 and the area of 1−sigma circle of text 2. Now, since probabilities are proportional to areas, we get the following relationships:
Therefore, gives the conditional probability that part of text 2 can be confused with text 1; gives the conditional probability that part of text 1 can be confused with text 2. means , therefore text 1 can be fully confused with text 2, and means , therefore text 2 can be fully confused with text 1.
We recall a synthetic parameter which highlights how much two texts can be erroneously confused with each other. The parameter is the average conditional probability of error:
Now, since in comparing two texts we can assume , we get:
If , there is no intersection between the two 1−sigma circles, the two texts cannot be each other confused, therefore there is no mathematical connection (at least at 1−sigma) involving the deep−language parameters. If the two texts can be totally confused, the two 1−sigma circles coincide.
From the conditional probability we get the domestication index [28] given by:
with the following meaning: if , then , domestication is total; if , then , foreignization is total.
Figure 4, Figure 5 and Figure 6 show 1‒sigma circles centered at mean vectors. From these figures we can calculate the error probability and the domestication index of the translations from Greek, but also the domestication index in conjectural translations from any language to any other language, discussed in the next section. Table A.2 in Appendix C reports the values of for all languages.
From Figures 4−6, we can notice the following interesting features.
Figure 4(a): the mean vectors of Latin and romance languages, except Portuguese, not only practically coincide, but they also show similar 1−sigma radii, therefore these translations spread in the same way. This is a robust result that locates and can distinguish romance languages from other families. For this language family .
Figure 4(b): Germanic languages are quite scattered; they do not show the closeness of romance languages. Curiously, English and French coincide not only according to mean vectors but also to similar spread, as Figure 6(b) shows. For this language family .
Figure 5(a): the mean vectors of Balto−Slavic languages are each other close and they also show similar 1−sigma radii, a robust result that locates this language family. For this language family .
Figure 5(b): the languages reported belong to different families and this fact can be noticed both in distance between mean vectors and diverse spread.
Figure 6(a): Chichewa and Luganda, both belonging to the Niger−Congo family, are each other very close and they show similar 1−sigma radii; the same can be said for Cebuano and Tagalog, both belonging to the Austronesian family.
In conclusion, Figures 4−6 confirm the distinction of language families according to mean vectors, and indicates that within a family the spread is similar.
Now we can calculate the domestication index. Figure 7 shows (%) versus translation language , with language order number according to Table 1. Notice that in 18 translations , hence , therefore circles do not overlap. The smallest is given by the Somali translation (language order 35).
Table A.2 (first column) in Appendix C lists the values drawn in Figure 7. From Figure 7 we can conclude that the degree of domestication of the Greek texts is very high, mostly greater than 50%. In other words, these translations are very far from being verbatim, a conclusion reached for Matthew only by considering information theory parameters [2,4−6].
Finally Figure 8 shows the scatterplot between and mean vectors distance from Greek, given by:
Before saturation (%), a linear relationship describes this relationhsip. In particular, if . Only the Somali translation is below this rather poor domestication index.
So far, we have studied how the original Greek texts were translated. The theory and analysis applied in this section, however, can be used to estimate how texts in any language might have been translated into any other language, as shown for the so−called linguistic channels [2,3]. The next section deals with this issue.
6. Translation from Any Language to Any Other Language
We have no direct translation of the NT books from a modern language to another one, for example, from English to Italian. Now, the question we wish to answer is the following: can we deduce the mathematical characteristics studied in the previous sections of this unavailable translation by considering the available translations from Greek? We propose an exercise that should give a possible answer.
In the example just mentioned, we assume that the Italian translation from Greek can be also considered as the translation (i.e., the target text) from English (i.e., the source text), and vice versa. Of course, with this hypothesis we neglect the likely “noise” introduced by the two translations from Greek. In other words, we are not sure that an Italian translator would translate the English texts as they are now in Italian. Ours may turn to be only a useful conjecture. This exercise, in any case, is useful because it can indicate how much a text can be confused with another text of different translation, therefore in this case the complement number to =100% can be interpreted in this way.
Figure 9 shows the scatterplot of (%) calculated by assuming English or Italian texts (source texts) “translated” into the other languages (target texts). The results are quite different from those shown in Figure 7 concerning the translations from Greek. Now some translations show low domestication index, hence greater similarity. The minimum % in English is given by French, a realistic and reliable indication of the strong connection between French and English, already noticed. In Italian the low value % is found in Latin, not a surprise because Italian is the romance language more directly derived from Latin.
Table A.2 in Appendix C reports (%) for any translation and Figure 10 shows the scatterplot between and by assuming any language of Table 1 as source text. English (black circles) and Italian (green circles) are explicitly distinguished to show a general trend: modern languages, for a given , are closer than Greek.
Finally, Table 4 summarizes the main findings reported in Table A.2 in Appendix C. The deep connections among texts of the same language family are evident by looking at the column . English, mathematically, seems to belong more to the Romance family than to the German family, very likely for the reason previously recalled.
In the next section we further deepen the scattering of the vectors shown by the circles drawn in Figures 4−6.
7. Deep−Language Expansion Factor
In Figures 4−6 the radius of circles varies from language to language because of deep−language parameters scattering. It is an interesting exercise to study the ratio of the radii. Let be the radius of a reference language/translation, e.g.,. Greek, and the radius of another language. We define the deep−language “expansion” factor with the ratio:
Notice that gives the ratio of variances.
Now, if the spread of two languages is identical then there is no distinction between the scattering of two texts, as it should be expected in translation with no domestication.
Figure 11 shows mean and 1−standard deviation bounds of versus translation/language. There are significant variations around . For the most diffuse language families, we get the following conditional statistics: Romance languages ; German languages ; Balto−Slavic languages In conclusion, the romance languages are the least biased (closer to ) and spread, the German ones the most biased and spread.
Table A.2 in Appendix C reports also mean value and standard deviation of for each reference language. For example, if Greek is the reference language then and ; in English and .
Figure 12 shows the scatterplot of versus assuming Greek (red circles), English (black circles), Italian (green circles) or any other language as reference (blue circles). We can notice that: (a) ranges mostly between 0.5 and 2 before saturation (); (b) moves away from 1 as increases.
Finally, Figure 13 shows the histogram of and its log−normal model (see Appendix B) for log−normal modelling), whose parameters (mean , standard deviation , median and mode have been calculated from the linear value and standard deviation . It is interesting to notice that and , therefore the range is between and , hence the ratio of variances ranges between 0.5 and 2. This seems to be a rather general result. The value found in [28] is well within this range.
In conclusion, the expansion factor varies according mainly to language family and also within a language family. Modern languages are each other more similar than they are to Greek.
So far, we have shown that the Greek NT texts are largely domesticated in modern translations and that modern versions of the same texts can be less domesticated. This find is certainly justified because the Greek texts are difficult to render in modern terms, hard to be translated verbatim. To assess, however, that domestication can also dominate the translation of modern literature, in the next section we examine few examples, taken from the English Literature, to show that domestication can prevail over foreignization, just like we showed in a sample of the Italian Literature [28].
8. Domestication of Modern Literature
To assess that domestication can also dominate the translation of modern literature, we examine, as examples, the translation of Treasure Island (R. L. Stevenson, published 1881–1882) and David Copperfield (C. Dickens, 1849–1850), novels of the English Literature.
Table 5, Table 6 report the main statistics of the English originals and the available translations (WinWord text files). The means and the standard deviations reported have been calculated by weighting each chapter with the ratio between its number of words and the number of total words, to avoid that short chapters weigh statistically as long ones. As mentioned in Section 3, means depend on how they are defined/calculated. We proved in [28] that the mean calculated from totals, the mean calculated by equally weighting chapters (i.e., if is the number of chapters, the weight is ) and the mean calculated by weighting chapters according to its number of words increase in the same order. For example, in Treasure Island, for (English) we get, respectively, , and . For David Copperfield, , and . Notice, however, that these values are very similar.
Already from Tables 5, 6 we notice large differences between the English text and its translations, depending on language. Figure 14 shows, in the same normalized plane of Figure 3, the geometrical representation of all languages. From these figures we can notice the striking difference between Treasure Island and David Copperfield.
The translations of Treasure Island are significantly closer to the original English text. Table 7, Table 8 report, respectively, the domestication index and the expansion factor . The most domesticated translation is Russian (, the least domesticated one is French (, another confirmation on the similarity between English and French. Russian is clearly very different of any other language
The alleged “translations” can show a different picture. For example, the least domesticated language for French is German not English. Italian and German show the least domesticated index; in other words, they show similar deep language parameters.
As for the expansion factor , Italian () and French () show the nearest values to unity compared to English. Russian again is very different of any other language.
Table 9, Table 10 report, respectively, the domestication index and the expansion factor for David Copperfield. Compared to Treasure Island, now the translations of David Copperfield are completely domesticated (in any language.
The alleged “translations” can show a different picture. Finnish is practically totally domesticated in any language and it is interesting to notice that the minimum domestication index (is between Italian and Spanish. As for the expansion factor , Italian () and Spanish () show the nearest values to unity compared to English. Finnish is again very different of any other language.
In conclusion, in modern literature domestication seems to depend either on the novel − see David Copperfield, whose English original is fully domesticated in any language – or on the translation language – see Treasure Island, fully domesticated only in Russian for every language.
9. Summary and Conclusion
We have shown that a geometrical representation of texts, based on linear combinations of deep−language parameters, allows to calculate a probability of “error” that indicates how much a text can be confused with another. Based on this probability, the domestication index measures the phenomenon of erasing the linguistic and cultural difference of the source text to make the target text more fluent to the intended reader.
Another useful index, the deep−language “expansion” index , measures the relative spread around mean values of two texts in their geometrical representation.
The geometrical representation allows to distinguish language family. For example, we have shown that Latin, Italian, Spanish, French and Rumanian − languages belonging to Romance family, all mostly derived from Latin – are each other near.
Bulgarian, Czech, Croatian, Polish, Serbian, Slovak and Ukrainian − all belong to the Balto−Slavic family − are also each other near.
Other less spoken alphabetical languages are clearly distinguishable from languages of different families.
English and French, although attributed to different language families, mathematically almost coincide. This coincidence, and the small distance of English from all other Romance languages, is due to the fact that many English words and some sentences construction come French and/or from Latin.
In modern literature domestication seems to depend either on the novel or on the translation language.
In conclusion, the requirement of making the target text more fluent makes domestication a choice largely prevailing over foreignization. Domestication dominates the translation of the NT books from Greek to modern languages and also within modern languages.
With varying degree, domestication seems to be a universal strategy in translation, so that a blind comparison of the same linguistic parameters of a text and its translation hardly indicates they refer to each other.
Funding
This research received no external funding.
Institutional Review Board Statement
Not applicable.
Informed Consent Statement
Not applicable.
Data Availability Statement
Data are contained within the article.
Conflicts of Interest
The author declares no conflicts of interest.
Appendix A. List of Mathematical Symbols and Definition
| Symbol | Definition |
| Total number of characters | |
| Characters per word | |
| Domestication index | |
| Expansion factor | |
| Total number of interpunctions | |
| Word interval | |
| Linear mean value | |
| Mode | |
| Median | |
| Word intervals per sentence | |
| Words per sentence | |
| Linear standard deviation | |
| Total number of sentences | |
| Total number of words | |
| Number of characters per chapter | |
| Number of words per chapter | |
| Number of sentences per chapter | |
| Number of interpunctions per chapter | |
| Natural log mean value | |
| Natural log standard deviation |
Appendix B. Log−Normal Probability Density Modelling
Let us consider a stochastic linear variable with linear mean value and standard deviation . Then, the log−normal model is given by [36]:
where the mean (Np) and (Np) are given by [38]:
The mode is given by:
The median is given by:
Now, by assuming histogram bins centered at , wih bin width , the number of samples per bin, out of total samples, is given by:
In our case, , therefore we get the modelling reported in Figures 1, 2. Table A.1 reports descriptive statistics of the totals of languages of Table 1.

Table A1.
Descriptive statistics of total number of characters (, words (), sentences ( and interpunctions (). The mode (the most probable value), the median (the value exceeded with probability 0.5) are both calculated from the log−normal model, respectively from Eqs. (A.4) and (A.5); the mean and standard deviation are calculated from the raw data (Table 1).
| Mode | 502709 | 107667 | 6777 | 18609 |
| Median | 513978 | 110043 | 6994 | 18901 |
| Mean | 519708 | 111250 | 7105 | 19049 |
| Standard deviation | 77814 | 16526 | 1271 | 2388 |
Appendix C. Domestication Index
Table A.2 reports the numerical values of the domestication index (%) and the mean and standard deviation of the expansion factor , for each reference language. Red number refer to languages with , cases with limited, maybe acceptable, domestication.
Table A2.
Domestication index (%). Red numbers refer to languages with . The last two rows give the following data: number of languages with , mean and standard deviation of considering only cases ; mean and standard deviation of the expansion factor . For example, in Greek 19 languages show ; mean, with standard deviation 26.23%. The mean expansion factor is with standard deviation .
| Gr | Lt | Es | Fr | It | Pt | Rm | Sp | Dn | En | Fn | Ge | Ic | |||||||||||||||||||||||||
| Gr | 0 | 80.72 | 75.80 | 71.83 | 84.13 | 100 | 88.43 | 79.40 | 100 | 62.55 | 80.04 | 99.70 | 100 | ||||||||||||||||||||||||
| Lt | 80.72 | 0 | 66.76 | 25.32 | 10.93 | 59.10 | 11.68 | 16.11 | 77.55 | 31.02 | 43.44 | 28.28 | 68.36 | ||||||||||||||||||||||||
| Es | 75.80 | 66.76 | 0 | 76.99 | 68.78 | 97.20 | 70.48 | 56.64 | 100 | 69.42 | 94.98 | 88.90 | 100 | ||||||||||||||||||||||||
| Fr | 71.83 | 25.32 | 76.99 | 0 | 28.93 | 90.16 | 37.18 | 31.63 | 100 | 14.90 | 37.09 | 55.60 | 97.68 | ||||||||||||||||||||||||
| It | 84.13 | 10.93 | 68.78 | 28.93 | 0 | 62.40 | 9.82 | 15.24 | 82.49 | 35.40 | 49.35 | 27.05 | 72.66 | ||||||||||||||||||||||||
| Pt | 100 | 59.10 | 97.20 | 90.16 | 62.40 | 0 | 51.32 | 70.42 | 24.26 | 91.86 | 90.10 | 49.43 | 13.21 | ||||||||||||||||||||||||
| Rm | 88.43 | 11.68 | 70.48 | 37.18 | 9.82 | 51.32 | 0 | 21.01 | 71.09 | 43.73 | 52.90 | 24.53 | 61.37 | ||||||||||||||||||||||||
| Sp | 79.40 | 16.11 | 56.64 | 31.63 | 15.24 | 70.42 | 21.01 | 0 | 89.97 | 33.11 | 58.43 | 40.18 | 80.82 | ||||||||||||||||||||||||
| Dn | 100 | 77.55 | 100 | 100 | 82.49 | 24.26 | 71.09 | 89.97 | 0 | 100 | 100 | 73.78 | 12.90 | ||||||||||||||||||||||||
| En | 62.55 | 31.02 | 69.42 | 14.90 | 35.40 | 91.86 | 43.73 | 33.11 | 100 | 0 | 42.69 | 61.33 | 98.51 | ||||||||||||||||||||||||
| Fn | 80.04 | 43.44 | 94.98 | 37.09 | 49.35 | 90.10 | 52.90 | 58.43 | 100 | 42.69 | 0 | 59.87 | 95.96 | ||||||||||||||||||||||||
| Ge | 99.70 | 28.28 | 88.90 | 55.60 | 27.05 | 49.43 | 24.53 | 40.18 | 73.78 | 61.33 | 59.87 | 0 | 61.39 | ||||||||||||||||||||||||
| Ic | 100 | 68.36 | 100 | 97.68 | 72.66 | 13.21 | 61.37 | 80.82 | 12.90 | 98.51 | 95.96 | 61.39 | 0 | ||||||||||||||||||||||||
| Nr | 100 | 58.73 | 100 | 81.56 | 65.72 | 70.66 | 59.48 | 79.77 | 83.55 | 85.61 | 58.90 | 57.03 | 75.18 | ||||||||||||||||||||||||
| Sw | 91.25 | 49.09 | 98.02 | 52.43 | 53.43 | 75.45 | 53.18 | 64.71 | 87.00 | 59.37 | 26.03 | 50.32 | 80.09 | ||||||||||||||||||||||||
| Bg | 100 | 78.88 | 100 | 100 | 83.51 | 31.22 | 73.27 | 91.25 | 14.76 | 100 | 99.01 | 73.66 | 20.30 | ||||||||||||||||||||||||
| Cz | 100 | 100 | 100 | 100 | 100 | 75.90 | 99.67 | 100 | 62.35 | 100 | 100 | 100 | 68.96 | ||||||||||||||||||||||||
| Cr | 100 | 70.26 | 100 | 95.40 | 73.45 | 20.82 | 63.91 | 81.08 | 24.51 | 96.74 | 92.70 | 60.70 | 18.15 | ||||||||||||||||||||||||
| Pl | 100 | 100 | 100 | 100 | 100 | 96.23 | 100 | 100 | 90.63 | 100 | 100 | 100 | 92.29 | ||||||||||||||||||||||||
| Rs | 100 | 51.65 | 69.17 | 79.31 | 52.35 | 42.75 | 44.67 | 51.54 | 59.32 | 79.64 | 90.01 | 52.72 | 52.17 | ||||||||||||||||||||||||
| Sr | 100 | 88.91 | 100 | 100 | 93.00 | 45.44 | 84.35 | 98.32 | 26.72 | 100 | 100 | 86.32 | 35.29 | ||||||||||||||||||||||||
| Sl | 100 | 100 | 100 | 100 | 100 | 81.86 | 100 | 100 | 70.97 | 100 | 100 | 100 | 75.41 | ||||||||||||||||||||||||
| Uk | 100 | 100 | 100 | 100 | 100 | 72.12 | 100 | 100 | 57.55 | 100 | 100 | 100 | 64.60 | ||||||||||||||||||||||||
| Et | 96.84 | 26.17 | 84.58 | 51.96 | 26.98 | 40.83 | 18.61 | 40.04 | 60.11 | 58.82 | 56.17 | 20.11 | 50.13 | ||||||||||||||||||||||||
| Hn | 93.76 | 20.87 | 76.08 | 47.27 | 20.26 | 41.17 | 10.59 | 30.99 | 60.69 | 53.67 | 57.80 | 23.81 | 51.06 | ||||||||||||||||||||||||
| Al | 60.03 | 72.20 | 24.17 | 76.68 | 75.12 | 100 | 78.34 | 63.60 | 100 | 66.60 | 94.36 | 96.05 | 100 | ||||||||||||||||||||||||
| Ar | 100 | 47.77 | 99.07 | 78.66 | 51.77 | 30.68 | 41.63 | 64.38 | 47.65 | 82.59 | 73.48 | 32.40 | 37.05 | ||||||||||||||||||||||||
| Wl | 74.49 | 95.99 | 42.21 | 100 | 98.50 | 100 | 99.23 | 91.42 | 100 | 95.06 | 100 | 100 | 100 | ||||||||||||||||||||||||
| Bs | 68.06 | 63.02 | 98.57 | 52.36 | 69.46 | 100 | 73.72 | 74.17 | 100 | 50.73 | 29.90 | 84.97 | 100 | ||||||||||||||||||||||||
| Hb | 100 | 100 | 100 | 100 | 100 | 97.84 | 100 | 100 | 91.60 | 100 | 100 | 100 | 94.38 | ||||||||||||||||||||||||
| Cb | 91.97 | 91.19 | 100 | 91.41 | 96.75 | 100 | 97.63 | 99.82 | 100 | 89.26 | 59.92 | 100 | 100 | ||||||||||||||||||||||||
| Tg | 82.08 | 71.64 | 100 | 67.57 | 78.57 | 100 | 81.00 | 85.02 | 100 | 67.18 | 33.83 | 90.31 | 100 | ||||||||||||||||||||||||
| Ch | 100 | 100 | 100 | 100 | 100 | 100 | 100 | 100 | 100 | 100 | 96.07 | 100 | 100 | ||||||||||||||||||||||||
| Lg | 100 | 99.19 | 100 | 100 | 100 | 100 | 100 | 100 | 100 | 100 | 83.49 | 100 | 100 | ||||||||||||||||||||||||
| Sm | 47.46 | 48.84 | 76.53 | 33.38 | 52.25 | 94.68 | 58.63 | 52.30 | 100 | 28.27 | 35.49 | 68.36 | 99.39 | ||||||||||||||||||||||||
| Ht | 100 | 99.14 | 100 | 100 | 100 | 62.07 | 96.14 | 100 | 50.99 | 100 | 100 | 99.90 | 57.00 | ||||||||||||||||||||||||
| Nh | 100 | 100 | 100 | 100 | 100 | 100 | 100 | 100 | 100 | 100 | 100 | 100 | 100 | ||||||||||||||||||||||||
| 19 75.19 22.01 |
30 55.09 28.16 |
20 71.72 24.95 |
24 57.30 26.67 |
28 54.94 28.13 |
28 59.97 27.53 |
30 55.92 28.89 |
28 59.33 27.32 |
23 57.41 27.16 |
25 59.92 26.21 |
27 62.67 26.23 |
27 58.03 26.65 |
27 60.53 28.76 |
|||||||||||||||||||||||||
| 0.564 0.136 |
0.801 0.193 |
0.774 0.187 |
1.079 0.260 |
0.906 0.219 |
1.100 0.265 |
0.867 0.209 |
0.898 0.217 |
1.351 0.326 |
0.927 0.223 |
0.931 0.225 |
1.215 0.293 |
1.208 0.291 |
|||||||||||||||||||||||||
| Nr | Sw | Bg | Cz | Cr | Pl | Rs | Sr | Sl | Uk | Et | Hn | ||||||||||||||||||||||||||
| Gr | 100 | 91.25 | 100 | 100 | 100 | 100 | 100 | 100 | 100 | 100 | 96.84 | 93.76 | |||||||||||||||||||||||||
| Lt | 58.73 | 49.09 | 78.88 | 100 | 70.26 | 100 | 51.65 | 88.91 | 100 | 100 | 26.17 | 20.87 | |||||||||||||||||||||||||
| Es | 100 | 98.02 | 100 | 100 | 100 | 100 | 69.17 | 100 | 100 | 100 | 84.58 | 76.08 | |||||||||||||||||||||||||
| Fr | 81.56 | 52.43 | 100 | 100 | 95.40 | 100 | 79.31 | 100 | 100 | 100 | 51.96 | 47.27 | |||||||||||||||||||||||||
| It | 65.72 | 53.43 | 83.51 | 100 | 73.45 | 100 | 52.35 | 93.00 | 100 | 100 | 26.98 | 20.26 | |||||||||||||||||||||||||
| Pt | 70.66 | 75.45 | 31.22 | 75.90 | 20.82 | 96.23 | 42.75 | 45.44 | 81.86 | 72.12 | 40.83 | 41.17 | |||||||||||||||||||||||||
| Rm | 59.48 | 53.18 | 73.27 | 99.67 | 63.91 | 100 | 44.67 | 84.35 | 100 | 100 | 18.61 | 10.59 | |||||||||||||||||||||||||
| Sp | 79.77 | 64.71 | 91.25 | 100 | 81.08 | 100 | 51.54 | 98.32 | 100 | 100 | 40.04 | 30.99 | |||||||||||||||||||||||||
| Dn | 83.55 | 87.00 | 14.76 | 62.35 | 24.51 | 90.63 | 59.32 | 26.72 | 70.97 | 57.55 | 60.11 | 60.69 | |||||||||||||||||||||||||
| En | 85.61 | 59.37 | 100 | 100 | 96.74 | 100 | 79.64 | 100 | 100 | 100 | 58.82 | 53.67 | |||||||||||||||||||||||||
| Fn | 58.90 | 26.03 | 99.01 | 100 | 92.70 | 100 | 90.01 | 100 | 100 | 100 | 56.17 | 57.80 | |||||||||||||||||||||||||
| Ge | 57.03 | 50.32 | 73.66 | 100 | 60.70 | 100 | 52.72 | 86.32 | 100 | 100 | 20.11 | 23.81 | |||||||||||||||||||||||||
| Ic | 75.18 | 80.09 | 20.30 | 68.96 | 18.15 | 92.29 | 52.17 | 35.29 | 75.41 | 64.60 | 50.13 | 51.06 | |||||||||||||||||||||||||
| Nr | 0 | 31.35 | 75.66 | 99.76 | 67.21 | 100 | 88.58 | 85.47 | 99.13 | 100 | 46.52 | 54.63 | |||||||||||||||||||||||||
| Sw | 31.35 | 0 | 82.53 | 100 | 77.00 | 100 | 84.94 | 90.44 | 99.98 | 100 | 47.93 | 53.51 | |||||||||||||||||||||||||
| Bg | 75.66 | 82.53 | 0 | 55.26 | 18.90 | 76.50 | 67.31 | 17.49 | 58.09 | 49.79 | 61.27 | 63.54 | |||||||||||||||||||||||||
| Cz | 99.76 | 100 | 55.26 | 0 | 54.58 | 44.80 | 93.78 | 40.07 | 25.91 | 25.21 | 95.31 | 95.92 | |||||||||||||||||||||||||
| Cr | 67.21 | 77.00 | 18.90 | 54.58 | 0 | 72.17 | 56.35 | 22.77 | 56.52 | 45.52 | 52.49 | 54.66 | |||||||||||||||||||||||||
| Pl | 100 | 100 | 76.50 | 44.80 | 72.17 | 0 | 100 | 64.60 | 26.91 | 69.24 | 100 | 100 | |||||||||||||||||||||||||
| Rs | 88.58 | 84.94 | 67.31 | 93.78 | 56.35 | 100 | 0 | 76.26 | 99.82 | 93.11 | 48.85 | 40.74 | |||||||||||||||||||||||||
| Sr | 85.47 | 90.44 | 17.49 | 40.07 | 22.77 | 64.60 | 76.26 | 0 | 43.58 | 32.35 | 74.05 | 75.72 | |||||||||||||||||||||||||
| Sl | 99.13 | 99.98 | 58.09 | 25.91 | 56.52 | 26.91 | 99.82 | 43.58 | 0 | 39.74 | 97.38 | 98.56 | |||||||||||||||||||||||||
| Uk | 100 | 100 | 49.79 | 25.21 | 45.52 | 69.24 | 93.11 | 32.35 | 39.74 | 0 | 96.69 | 96.88 | |||||||||||||||||||||||||
| Et | 46.52 | 47.93 | 61.27 | 95.31 | 52.49 | 100 | 48.85 | 74.05 | 97.38 | 96.69 | 0 | 10.82 | |||||||||||||||||||||||||
| Hn | 54.63 | 53.51 | 63.54 | 95.92 | 54.66 | 100 | 40.74 | 75.72 | 98.56 | 96.88 | 10.82 | 0 | |||||||||||||||||||||||||
| Al | 100 | 98.86 | 100 | 100 | 100 | 100 | 84.88 | 100 | 100 | 100 | 91.79 | 84.71 | |||||||||||||||||||||||||
| Ar | 44.57 | 54.29 | 45.79 | 88.24 | 37.02 | 99.03 | 57.92 | 60.88 | 89.83 | 89.87 | 25.21 | 32.08 | |||||||||||||||||||||||||
| Wl | 100 | 100 | 100 | 100 | 100 | 100 | 99.61 | 100 | 100 | 100 | 100 | 100 | |||||||||||||||||||||||||
| Bs | 84.12 | 47.34 | 100 | 100 | 100 | 100 | 99.98 | 100 | 100 | 100 | 79.51 | 79.26 | |||||||||||||||||||||||||
| Hb | 100 | 100 | 82.16 | 28.29 | 77.78 | 44.54 | 100 | 68.08 | 34.63 | 53.88 | 100 | 100 | |||||||||||||||||||||||||
| Cb | 95.50 | 57.21 | 100 | 100 | 100 | 100 | 100 | 100 | 100 | 100 | 98.70 | 99.23 | |||||||||||||||||||||||||
| Tg | 80.68 | 40.56 | 100 | 100 | 100 | 100 | 100 | 100 | 100 | 100 | 83.70 | 84.81 | |||||||||||||||||||||||||
| Ch | 96.35 | 74.62 | 100 | 100 | 100 | 100 | 100 | 100 | 100 | 100 | 100 | 100 | |||||||||||||||||||||||||
| Lg | 84.79 | 60.90 | 100 | 100 | 100 | 100 | 100 | 100 | 100 | 100 | 99.52 | 100 | |||||||||||||||||||||||||
| Sm | 79.27 | 54.49 | 100 | 100 | 97.80 | 100 | 87.96 | 100 | 100 | 100 | 67.55 | 65.68 | |||||||||||||||||||||||||
| Ht | 100 | 100 | 53.58 | 47.67 | 44.93 | 94.58 | 75.31 | 45.11 | 72.02 | 40.50 | 91.49 | 89.83 | |||||||||||||||||||||||||
| Nh | 100 | 97.79 | 100 | 100 | 100 | 100 | 100 | 100 | 100 | 100 | 100 | 100 | |||||||||||||||||||||||||
| 28 71.06 21.83 |
31 64.33 23.46 |
24 57.24 26.69 |
18 61.21 29.58 |
27 56.79 26.32 |
13 67.04 29.17 |
29 68.30 22.81 |
23 58.92 27.50 |
18 65.02 30.01 |
16 57.94 26.93 |
32 59.38 28.73 |
31 57.05 28.51 |
||||||||||||||||||||||||||
| 1.264 0.305 |
0.796 0.192 |
1.223 0.295 |
1.091 0.263 |
0.964 0.233 |
1.684 0.406 |
0.892 0.215 |
1.224 0.295 |
1.385 0.334 |
1.550 0.374 |
0.939 0.227 |
0.879 0.212 |
||||||||||||||||||||||||||
| Al | Ar | Wl | Bs | Hb | Cb | Tg | Ch | Lg | Sm | Ht | Nh | ||||||||||||||||||||||||||
| Gr | 60.03 | 100 | 74.49 | 68.06 | 100 | 91.97 | 82.08 | 100 | 100 | 47.46 | 100 | 100 | |||||||||||||||||||||||||
| Lt | 72.20 | 47.77 | 95.99 | 63.02 | 100 | 91.19 | 71.64 | 100 | 99.19 | 48.84 | 99.14 | 100 | |||||||||||||||||||||||||
| Es | 24.17 | 99.07 | 42.21 | 98.57 | 100 | 100 | 100 | 100 | 100 | 76.53 | 100 | 100 | |||||||||||||||||||||||||
| Fr | 76.68 | 78.66 | 100 | 52.36 | 100 | 91.41 | 67.57 | 100 | 100 | 33.38 | 100 | 100 | |||||||||||||||||||||||||
| It | 75.12 | 51.77 | 98.50 | 69.46 | 100 | 96.75 | 78.57 | 100 | 100 | 52.25 | 100 | 100 | |||||||||||||||||||||||||
| Pt | 100 | 30.68 | 100 | 100 | 97.84 | 100 | 100 | 100 | 100 | 94.68 | 62.07 | 100 | |||||||||||||||||||||||||
| Rm | 78.34 | 41.63 | 99.23 | 73.72 | 100 | 97.63 | 81.00 | 100 | 100 | 58.63 | 96.14 | 100 | |||||||||||||||||||||||||
| Sp | 63.60 | 64.38 | 91.42 | 74.17 | 100 | 99.82 | 85.02 | 100 | 100 | 52.30 | 100 | 100 | |||||||||||||||||||||||||
| Dn | 100 | 47.65 | 100 | 100 | 91.60 | 100 | 100 | 100 | 100 | 100 | 50.99 | 100 | |||||||||||||||||||||||||
| En | 66.60 | 82.59 | 95.06 | 50.73 | 100 | 89.26 | 67.18 | 100 | 100 | 28.27 | 100 | 100 | |||||||||||||||||||||||||
| Fn | 94.36 | 73.48 | 100 | 29.90 | 100 | 59.92 | 33.83 | 96.07 | 83.49 | 35.49 | 100 | 100 | |||||||||||||||||||||||||
| Ge | 96.05 | 32.40 | 100 | 84.97 | 100 | 100 | 90.31 | 100 | 100 | 68.36 | 99.90 | 100 | |||||||||||||||||||||||||
| Ic | 100 | 37.05 | 100 | 100 | 94.38 | 100 | 100 | 100 | 100 | 99.39 | 57.00 | 100 | |||||||||||||||||||||||||
| Nr | 100 | 44.57 | 100 | 84.12 | 100 | 95.50 | 80.68 | 96.35 | 84.79 | 79.27 | 100 | 100 | |||||||||||||||||||||||||
| Sw | 98.86 | 54.29 | 100 | 47.34 | 100 | 57.21 | 40.56 | 74.62 | 60.90 | 54.49 | 100 | 97.79 | |||||||||||||||||||||||||
| Bg | 100 | 45.79 | 100 | 100 | 82.16 | 100 | 100 | 100 | 100 | 100 | 53.58 | 100 | |||||||||||||||||||||||||
| Cz | 100 | 88.24 | 100 | 100 | 28.29 | 100 | 100 | 100 | 100 | 100 | 47.67 | 100 | |||||||||||||||||||||||||
| Cr | 100 | 37.02 | 100 | 100 | 77.78 | 100 | 100 | 100 | 100 | 97.80 | 44.93 | 100 | |||||||||||||||||||||||||
| Pl | 100 | 99.03 | 100 | 100 | 44.54 | 100 | 100 | 100 | 100 | 100 | 94.58 | 100 | |||||||||||||||||||||||||
| Rs | 84.88 | 57.92 | 99.61 | 99.98 | 100 | 100 | 100 | 100 | 100 | 87.96 | 75.31 | 100 | |||||||||||||||||||||||||
| Sr | 100 | 60.88 | 100 | 100 | 68.08 | 100 | 100 | 100 | 100 | 100 | 45.11 | 100 | |||||||||||||||||||||||||
| Sl | 100 | 89.83 | 100 | 100 | 34.63 | 100 | 100 | 100 | 100 | 100 | 72.02 | 100 | |||||||||||||||||||||||||
| Uk | 100 | 89.87 | 100 | 100 | 53.88 | 100 | 100 | 100 | 100 | 100 | 40.50 | 100 | |||||||||||||||||||||||||
| Et | 91.79 | 25.21 | 100 | 79.51 | 100 | 98.70 | 83.70 | 100 | 99.52 | 67.55 | 91.49 | 100 | |||||||||||||||||||||||||
| Hn | 84.71 | 32.08 | 100 | 79.26 | 100 | 99.23 | 84.81 | 100 | 100 | 65.68 | 89.83 | 100 | |||||||||||||||||||||||||
| Al | 0 | 100 | 32.78 | 95.68 | 100 | 100 | 100 | 100 | 100 | 69.43 | 100 | 100 | |||||||||||||||||||||||||
| Ar | 100 | 0 | 100 | 94.89 | 100 | 100 | 96.29 | 100 | 100 | 84.61 | 86.88 | 100 | |||||||||||||||||||||||||
| Wl | 32.78 | 100 | 0 | 100 | 100 | 100 | 100 | 100 | 100 | 92.47 | 100 | 100 | |||||||||||||||||||||||||
| Bs | 95.68 | 94.89 | 100 | 0 | 100 | 45.11 | 21.71 | 98.42 | 87.34 | 26.36 | 100 | 100 | |||||||||||||||||||||||||
| Hb | 100 | 100 | 100 | 100 | 0 | 100 | 100 | 100 | 100 | 100 | 81.40 | 100 | |||||||||||||||||||||||||
| Cb | 100 | 100 | 100 | 45.11 | 100 | 0 | 28.65 | 82.64 | 67.25 | 58.69 | 100 | 81.32 | |||||||||||||||||||||||||
| Tg | 100 | 96.29 | 100 | 21.71 | 100 | 28.65 | 0 | 89.06 | 73.98 | 41.17 | 100 | 95.74 | |||||||||||||||||||||||||
| Ch | 100 | 100 | 100 | 98.42 | 100 | 82.64 | 89.06 | 0 | 18.68 | 99.98 | 100 | 69.22 | |||||||||||||||||||||||||
| Lg | 100 | 100 | 100 | 87.34 | 100 | 67.25 | 73.98 | 18.68 | 0 | 92.36 | 100 | 68.32 | |||||||||||||||||||||||||
| Sm | 69.43 | 84.61 | 92.47 | 26.36 | 100 | 58.69 | 41.17 | 99.98 | 92.36 | 0 | 100 | 100 | |||||||||||||||||||||||||
| Ht | 100 | 86.88 | 100 | 100 | 81.40 | 100 | 100 | 100 | 100 | 100 | 0 | 100 | |||||||||||||||||||||||||
| Nh | 100 | 100 | 100 | 100 | 100 | 81.32 | 95.74 | 69.22 | 68.32 | 100 | 100 | 0 | |||||||||||||||||||||||||
| 18 70.29 26.20 |
29 61.19 26.24 |
11 74.71 32.54 |
23 66.29 27.21 |
12 62.88 29.40 |
19 75.38 26.98 |
21 66.36 26.65 |
10 72.50 33.31 |
12 69.65 29.67 |
27 63.46 25.59 |
19 67.82 25.77 |
6 68.73 32.80 |
||||||||||||||||||||||||||
| 0.773 0.186 |
1.161 0.280 |
0.866 0.209 |
0.907 0.219 |
1.441 0.348 |
1.057 0.254 |
0.980 0.236 |
1.173 0.283 |
1.049 0.253 |
0.659 0.159 |
1.356 0.327 |
1.139 0.275 |
||||||||||||||||||||||||||
References
- Matricciani, E. Deep Language Statistics of Italian throughout Seven Centuries of Literature and Empirical Connections with Miller’s 7 ∓ 2 Law and Short−Term Memory. Open J. Stat. 2019, 9, 373–406. [CrossRef]
- Matricciani, E. A Statistical Theory of Language Translation Based on Communication Theory. Open J. Stat. 2020, 10, 936–997. [CrossRef]
- Matricciani, E. Multiple Communication Channels in Literary Texts. Open J. Stat. 2022, 12, 486–520. [CrossRef]
- Matricciani, E. Linguistic Mathematical Relationships Saved or Lost in Translating Texts: Extension of the Statistical Theory of Translation and Its Application to the New Testament. Information 2022, 13, 20. [CrossRef]
- Matricciani, E. Capacity of Linguistic Communication Channels in Literary Texts: Application to Charles Dickens’ Novels. Information 2023, 14, 68. [CrossRef]
- Matricciani, E. Linguistic Communication Channels Reveal Connections between Texts: The New Testament and Greek Literature. Information 2023, 14, 405. [CrossRef]
- Matricciani, E. Is Short−Term Memory Made of Two Processing Units? Clues from Italian and English Literatures down Several Centuries. Information 2024, 15, 6. [CrossRef]
- Matricciani, E. A Mathematical Structure Underlying Sentences and Its Connection with Short–Term Memory. Appl. Math 2024, 4, 120−142. [CrossRef]
- Catford J.C.; A linguistic theory of translation. An Essay in Applied Linguistics. 1965, Oxford Univeristy Press.
- Munday, J.; Introducing Translation studies. Theories and applications, 2008, Routledge, New York.
- Proshina, Z., Theory of Translation, 2008, Far Eastern University Press.
- Warren, R. (ed.), The Art of Translation: Voices from the Field, 1989, Boston, MA: North‒eastern University Press.
- Wilss, W., Knowledge and Skills in Translator Behaviour, 1996, Amsterdam and Philadelphia: John Benjamins.
- Shannon, C.E. A Mathematical Theory of Communication, The Bell System Technical Journal, 1948, 27, p.379–423, and p. 623–656.
- Hyde, G.M., Literary Translation, Hungarian Studies in English, 1991, 22 , 39‒47.
- Yousef, T. Literary Translation: Old and New Challenges, International Journal of Arabic‒Eng lish Studies (IJAES), 2012, 13, 49‒64.
- Nũñez, K.J., Literary translation as an act of mediation between author and reader, Estudios de Traducción, 2012, 2, 21‒31.
- Bernaerts, L., De Bleeker, L., De Wilde, J., Narration and translation, Language and Literature, 2014, 23(3) 203–212. [CrossRef]
- Ghazala, H.S., Literary Translation from a Stylistic Perspective, Studies in English Language Teaching, 2015, 3, 2, 124‒145.
- Suo, X., A New Perspective on Literary Translation. Strategies Based on Skopos Theory, Theory and Practice in Language Studies, 2015, 5, 1, 176‒183, http://dx.doi.org/10.17507/tpls.0501.24.
- Munday, J. (Editor), The Routledge Companion to Translation Studies, 2009, Routledge, New York.
- Munday, J., Introducing Translation Studies.Theories and applications, 2016, Routledge, New York.
- Panou, D. Equivalence in Translation Theories: A Critical Evaluation, Theory and Practice in Language Studies, 2013, 3, 1, 1‒6.
- Saule, B., Aisulu, N. Problems of translation theory and practice: original and translated text equivalence, Procedia ‒ Social and Behavioral Sciences, 2014,136, 119‒123.
- Krein‒ Kühle, M., Translation and Equivalence, in House, J (Ed.), Translation: A Multidisciplinary Approach, 2014, Palgrave Advances in Language and Linguistics.
- Matricciani, E. Multi–Dimensional Data Analysis of Deep Language in J.R.R. Tolkien and C.S. Lewis Reveals Tight Mathematical Connections. AppliedMath 2024, 4, 927–949. [CrossRef]
- Venuti, L., The Translator’s Invisibility. A History of Translation, 1995, Routledge, New York.
- Matricciani, E. Translation Can Distort the Linguistic Parameters of Source Texts Written in Inflected Language: Multidimensional Mathematical Analysis of “The Betrothed”, a Translation in English of “I Promessi Sposi” by A. Manzoni. AppliedMath 2025, 5, 24. [CrossRef]
- Matricciani, E. Readability Indices Do Not Say It All on a Text Readability. Analytics 2023, 2, 296−314. [CrossRef]
- Parkes, Malcolm B. Pause and Effect. An Introduction to the History of Punctuation in the West, 2016, Abingdon, Routledge.
- Matricciani, E. Readability across Time and Languages: The Case of Matthew’s Gospel Translations. AppliedMath 2023, 3, 497–509. [CrossRef]
- Arana, S., Pesnot Lerousseau, J., Hagoort, P. Deep learning models to study sentence comprehension in the human brain, Language, Cognition and Neuroscience 2024, 39:8, 972−990. [CrossRef]
- Huang, H. Eight challenges in developing theory of intelligence. Frontiers in Computational Neuroscience 2024, 18:1388166. [CrossRef]
- Mayer, R.E., The Past, Present, and Future of the Cognitive Theory of Multimedia Learning, Educational Psychology Review 2024, 36:8 . [CrossRef]
- Hsu, M.J, Hsu, C.C, Chien, Y.H, Wang, W.Y, The Cognitive System of Robots Based on Deep Learning with Stable Convergence, Int. J. Fuzzy Syst. 2024, . [CrossRef]
- Papoulis, A.; Probability & Statistics, 1990, Prentice Hall, 1990.
- Lindgren, B.W. Statistical Theory, 2nd ed.; 1968, MacMillan Company: New York, NY, USA.
- Bury, K.V. Statistical Models in Applied Science, 1975, John Wiley. New York, Ny, USA.
Figure 1.
(a) Histograms of total number of characters (blue circles) with the estimated log−normal model (black circles and black line). The red vertical line indicates the Greek value in abscissa. (b) Histograms of total number of words (blue circles) with the estimated log−normal model (black circles and black line). The red vertical line indicates the Greek value in abscissa.
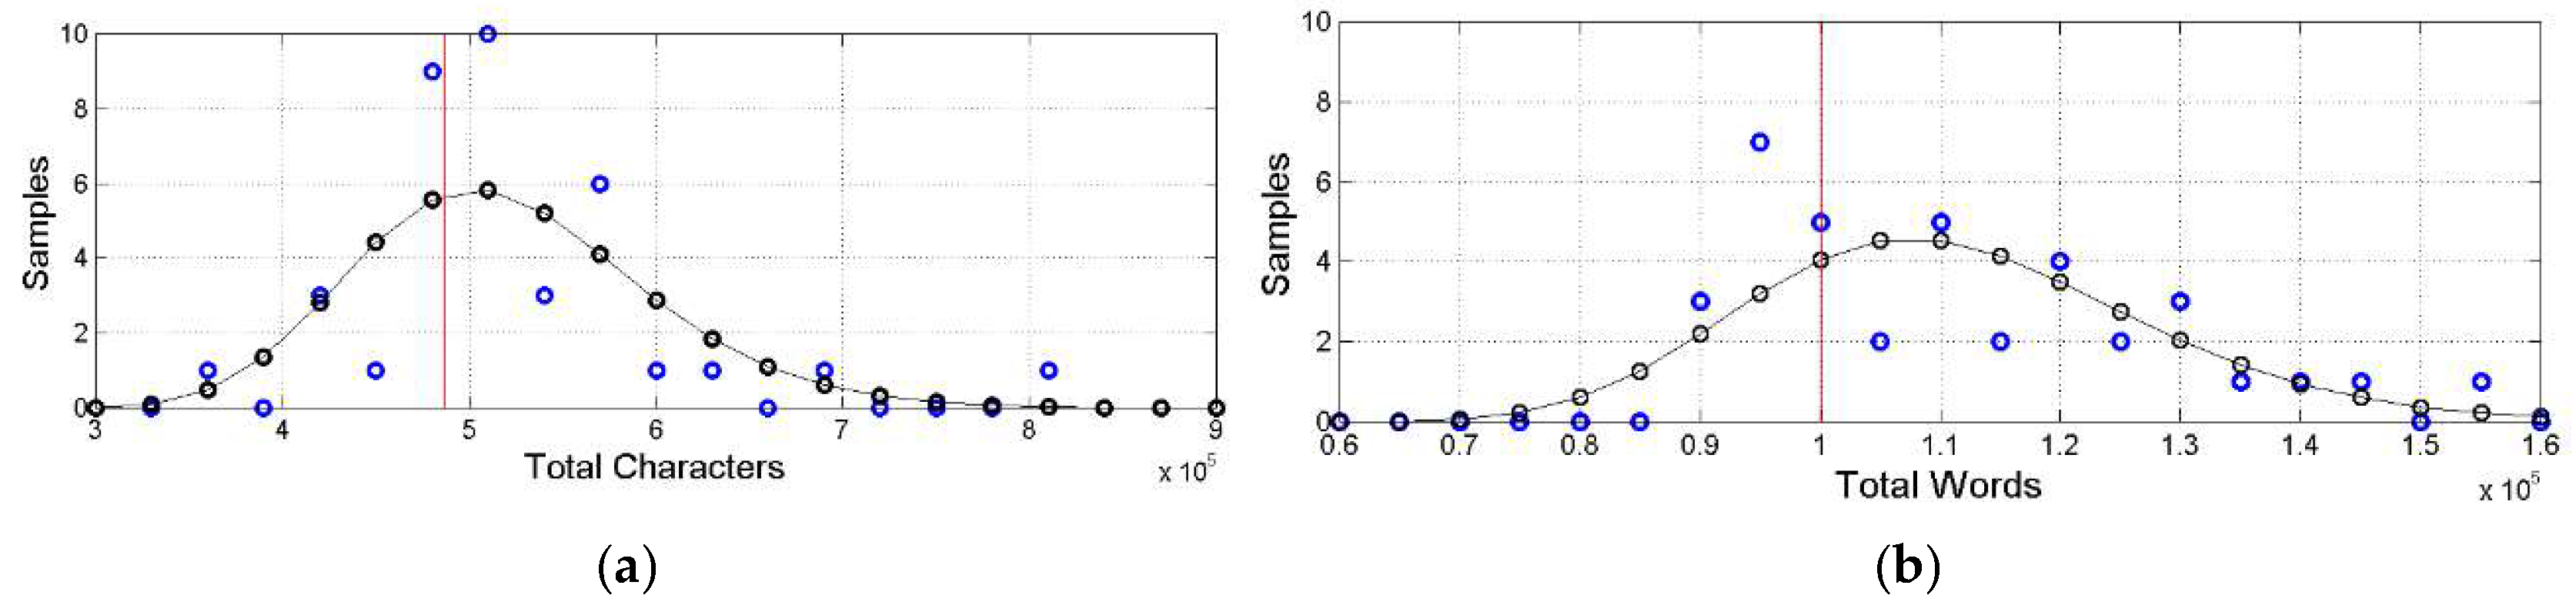
Figure 2.
(a) Histograms of total number of sentences (blue circles) with the estimated log−normal model (black circles and black line). The red vertical line indicates the Greek value in abscissa. (b) Histograms of total number of interpunctions (blue circles) with the estimated log−normal model (black circles and black line). The red vertical line indicates the Greek value in abscissa.
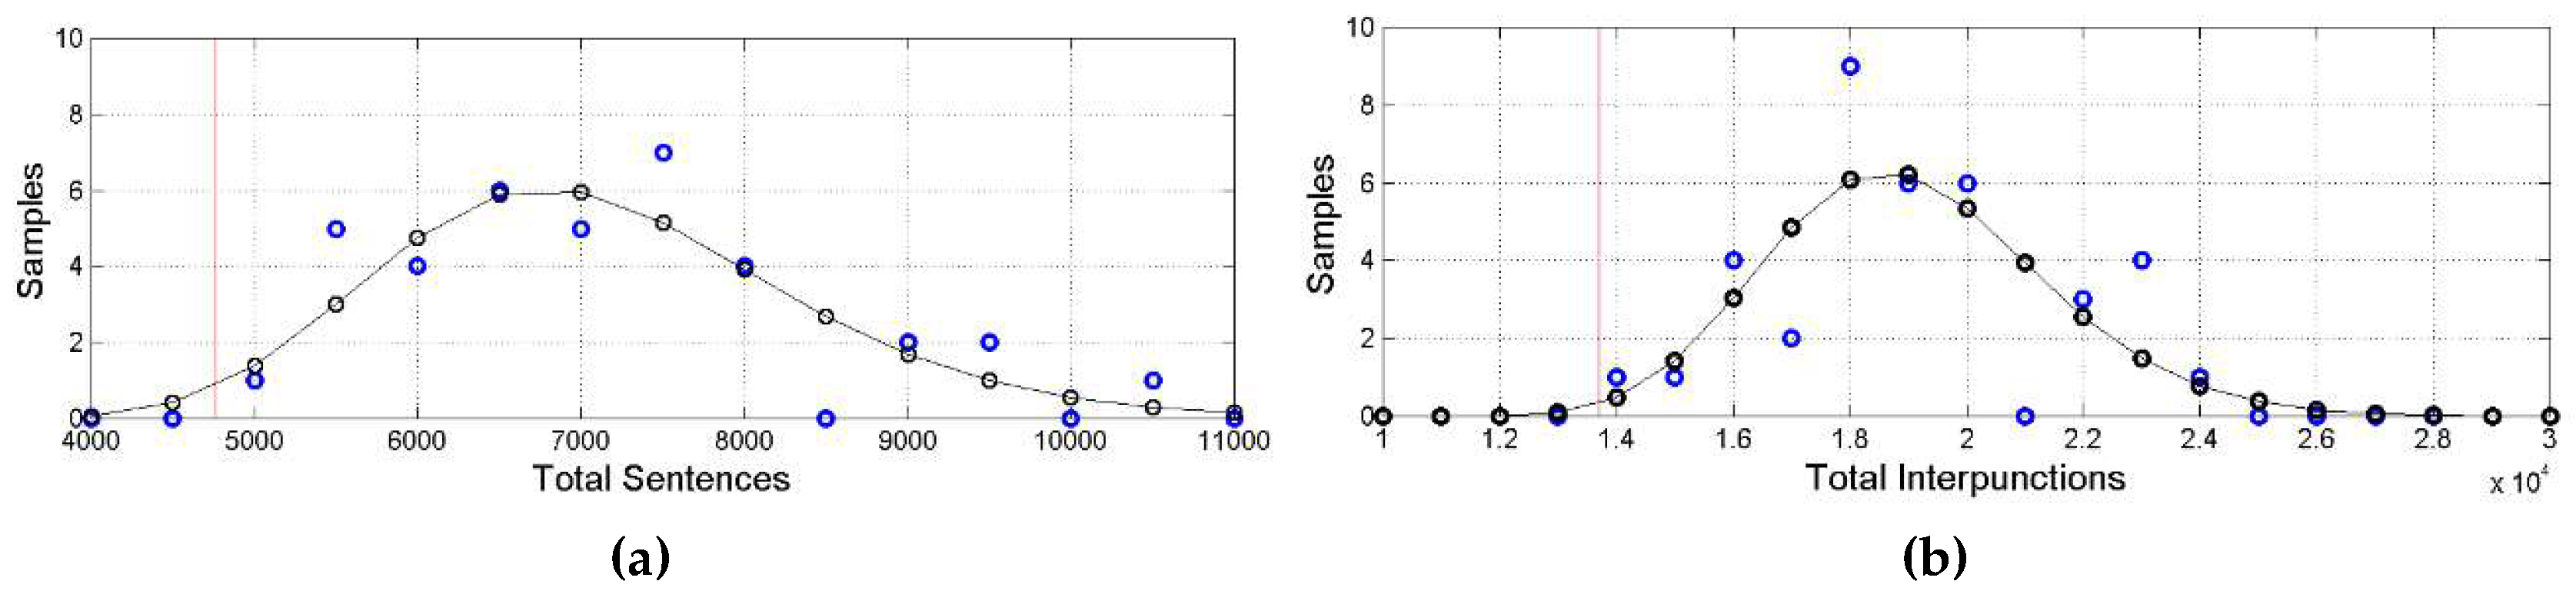
Figure 3.
Normalized coordinates and of the ending point of vector Eq. (6) calculated by setting Haitian at the origin and Greek at , according to the linear transformation Eqs. (7)(8). Greek, Gr; Latin, Lt; Esperanto, Es. Romance languages, blue symbols, key: French, square; Italian, triangle <; Portuguese >, Romanian, ^, Spanish, v. German languages, black symbols, key: Danish, circle; English, square; Finnish, triangle <; German, >; Icelandic, ^; Norwegian, v; Swedish, diamond. Balto−Slavic languages, green symbols, key: Bulgarian, circles; Czech, square; Croatian, <; Polish, >; Russian, ^; Serbian, v; Slovak, diamond; Ukrainian, hexagram. Uralic languages, magenta symbols, key: Estonian, circle; Hungarian, square. Albanian languages, Albanian, cyan circle. Armenian languages, Armenian, cyan hexagram. Celtic languages, Welsh, cyan square. Isolate languages, Basque, cyan triangle >. Semitic languages, Hebrew, cyan <. Austronesian languages, magenta symbols, key: Cebuano, triangle ^; Tagalog, v. Niger−Congo languages, cyan symbols; Chichewa, triangle ^; Luganda, v. Afro−Asiatic languages, Somali, yellow circle. French Creole languages, Haitian, yellow triangle ^. Uto−Aztecan, Nahuatl, yellow triangle v. Some languages are explicitly labelled because they share the same key color with other languages.
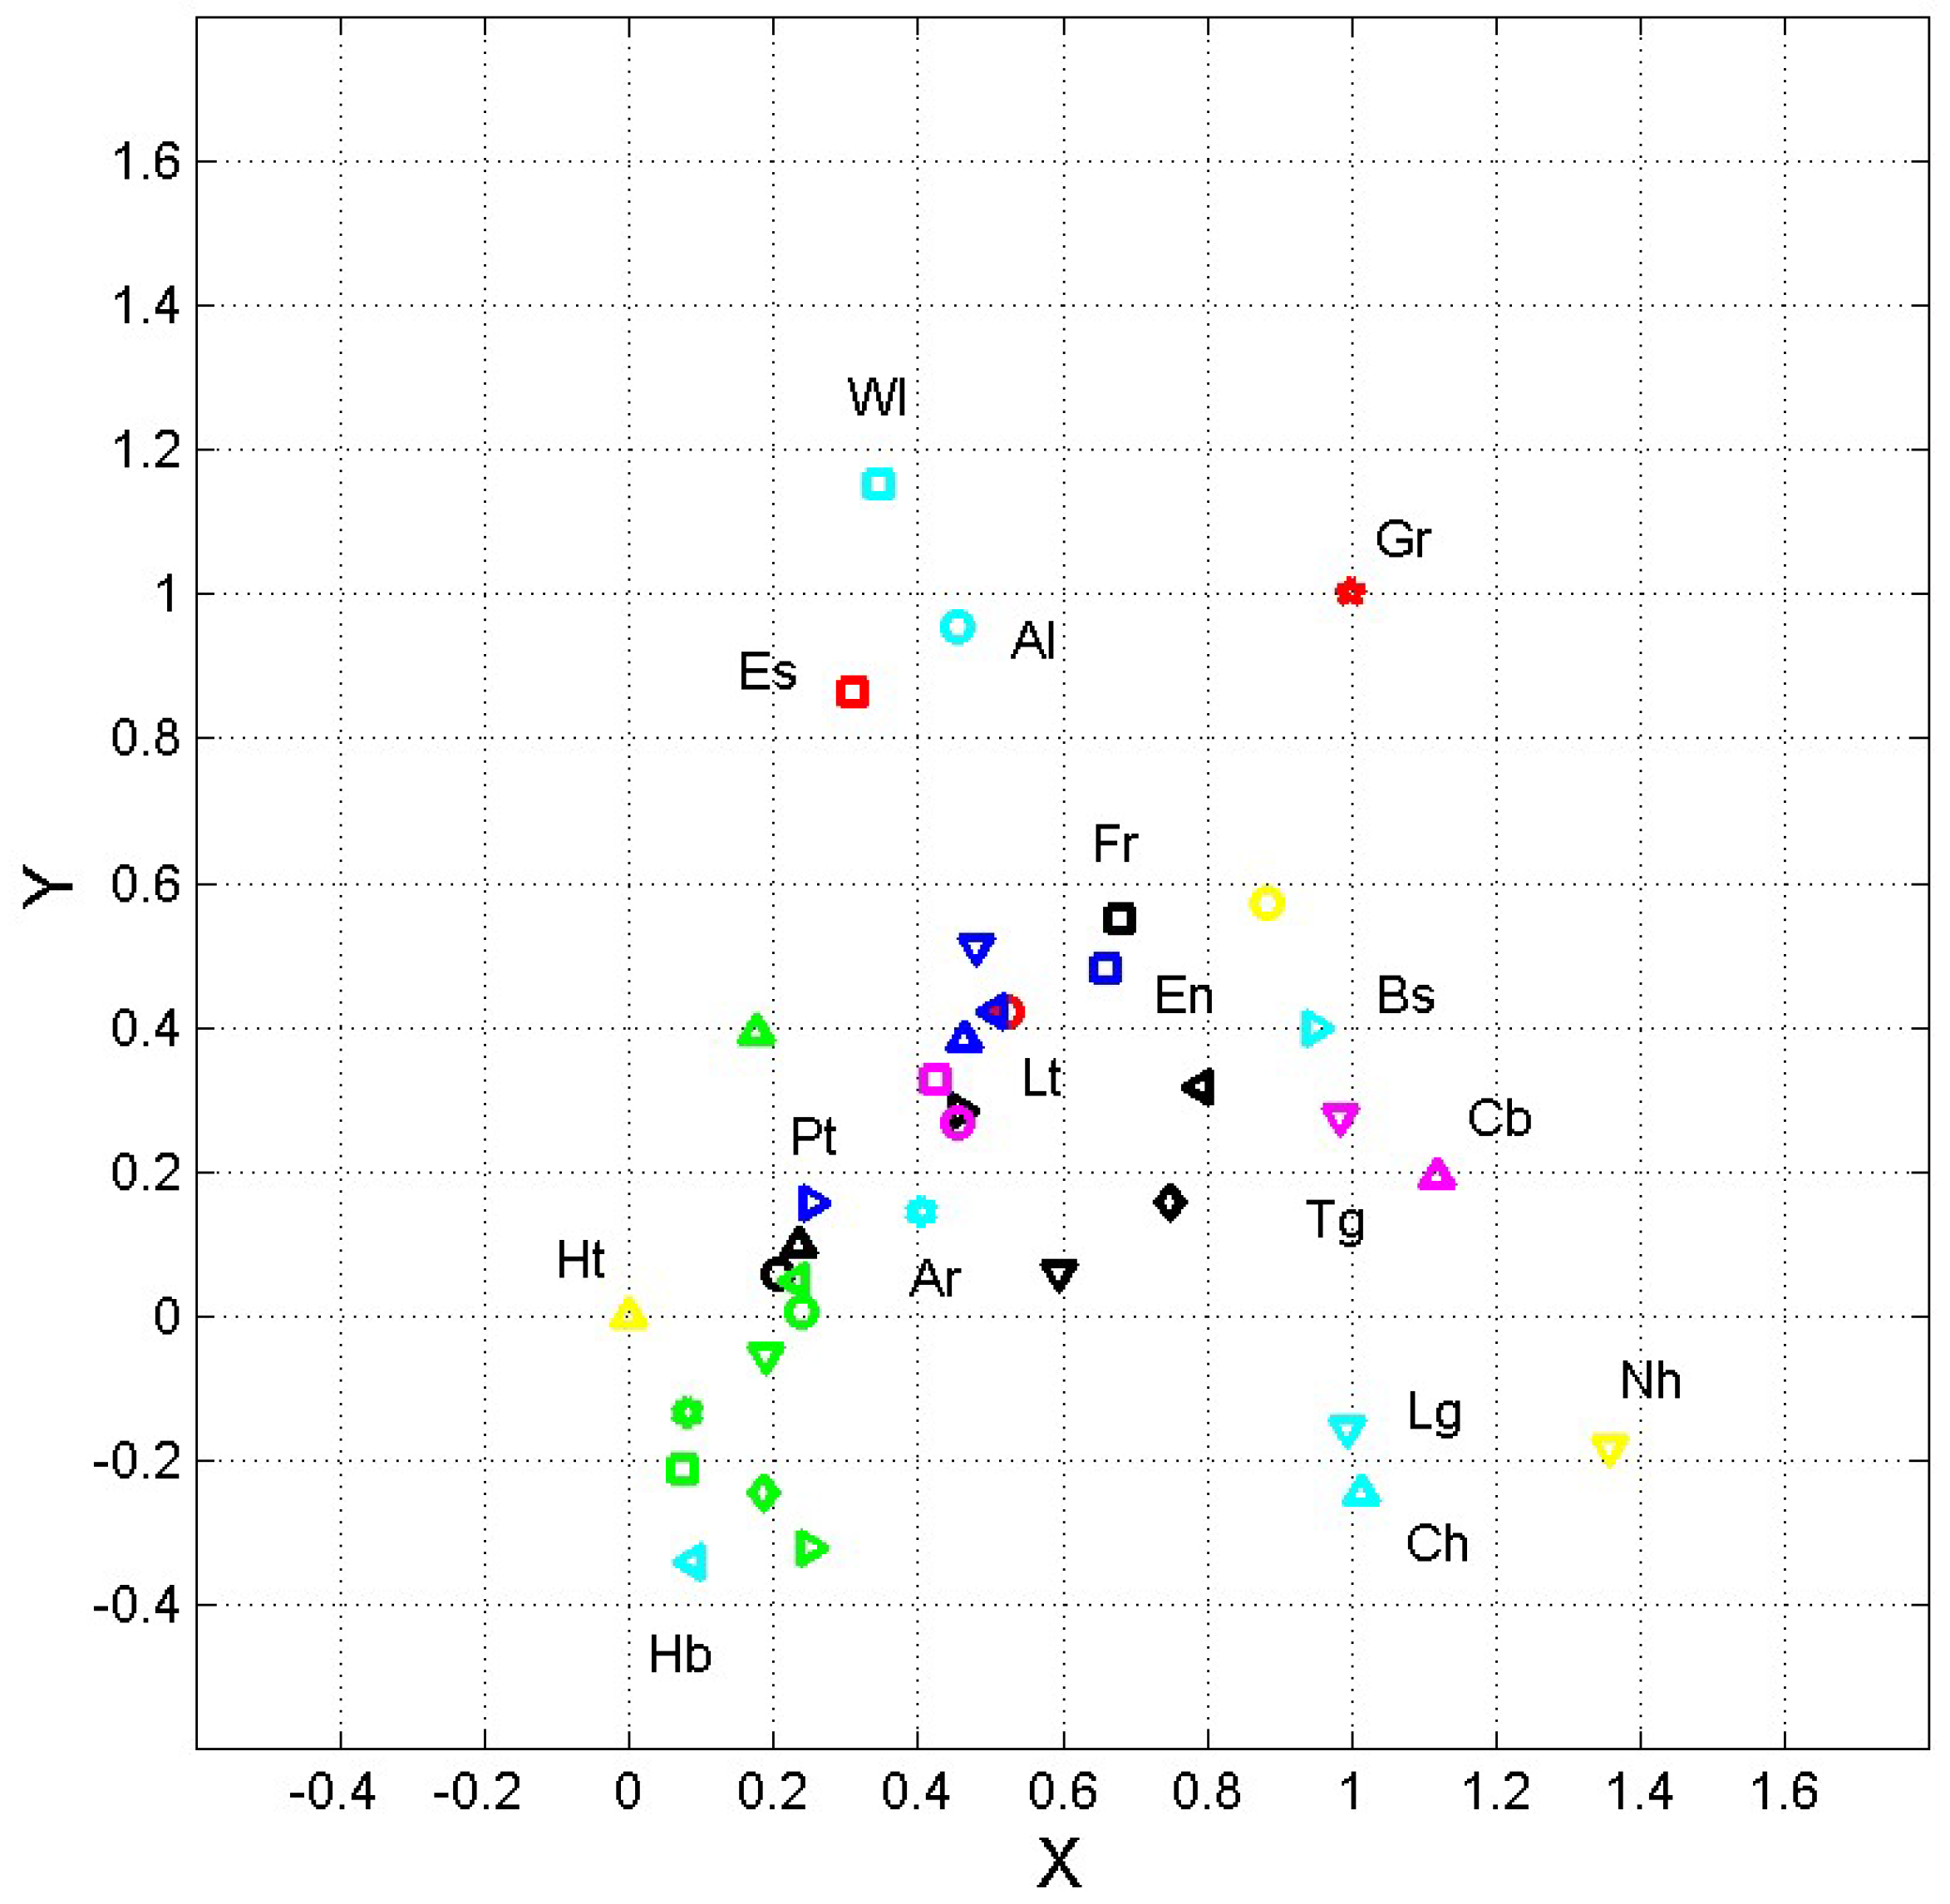
Figure 4.
Normalized coordinates and of the ending point of vector of Eq. (6) calculated by setting Haitian at the origin and Greek at , according to the linear tranformations (7)(8). Diamond represents Eq. (6); circle with same color represent 1‒sigma contour lines. (a) Color key: Gr red; Lt black; It green; Sp cyan; Fr blue; Pt magenta; Rm yellow. (b) Color key: Gr red; Ge black; Fn green; Dn cyan; En blue; Nr magenta; Sw yellow.
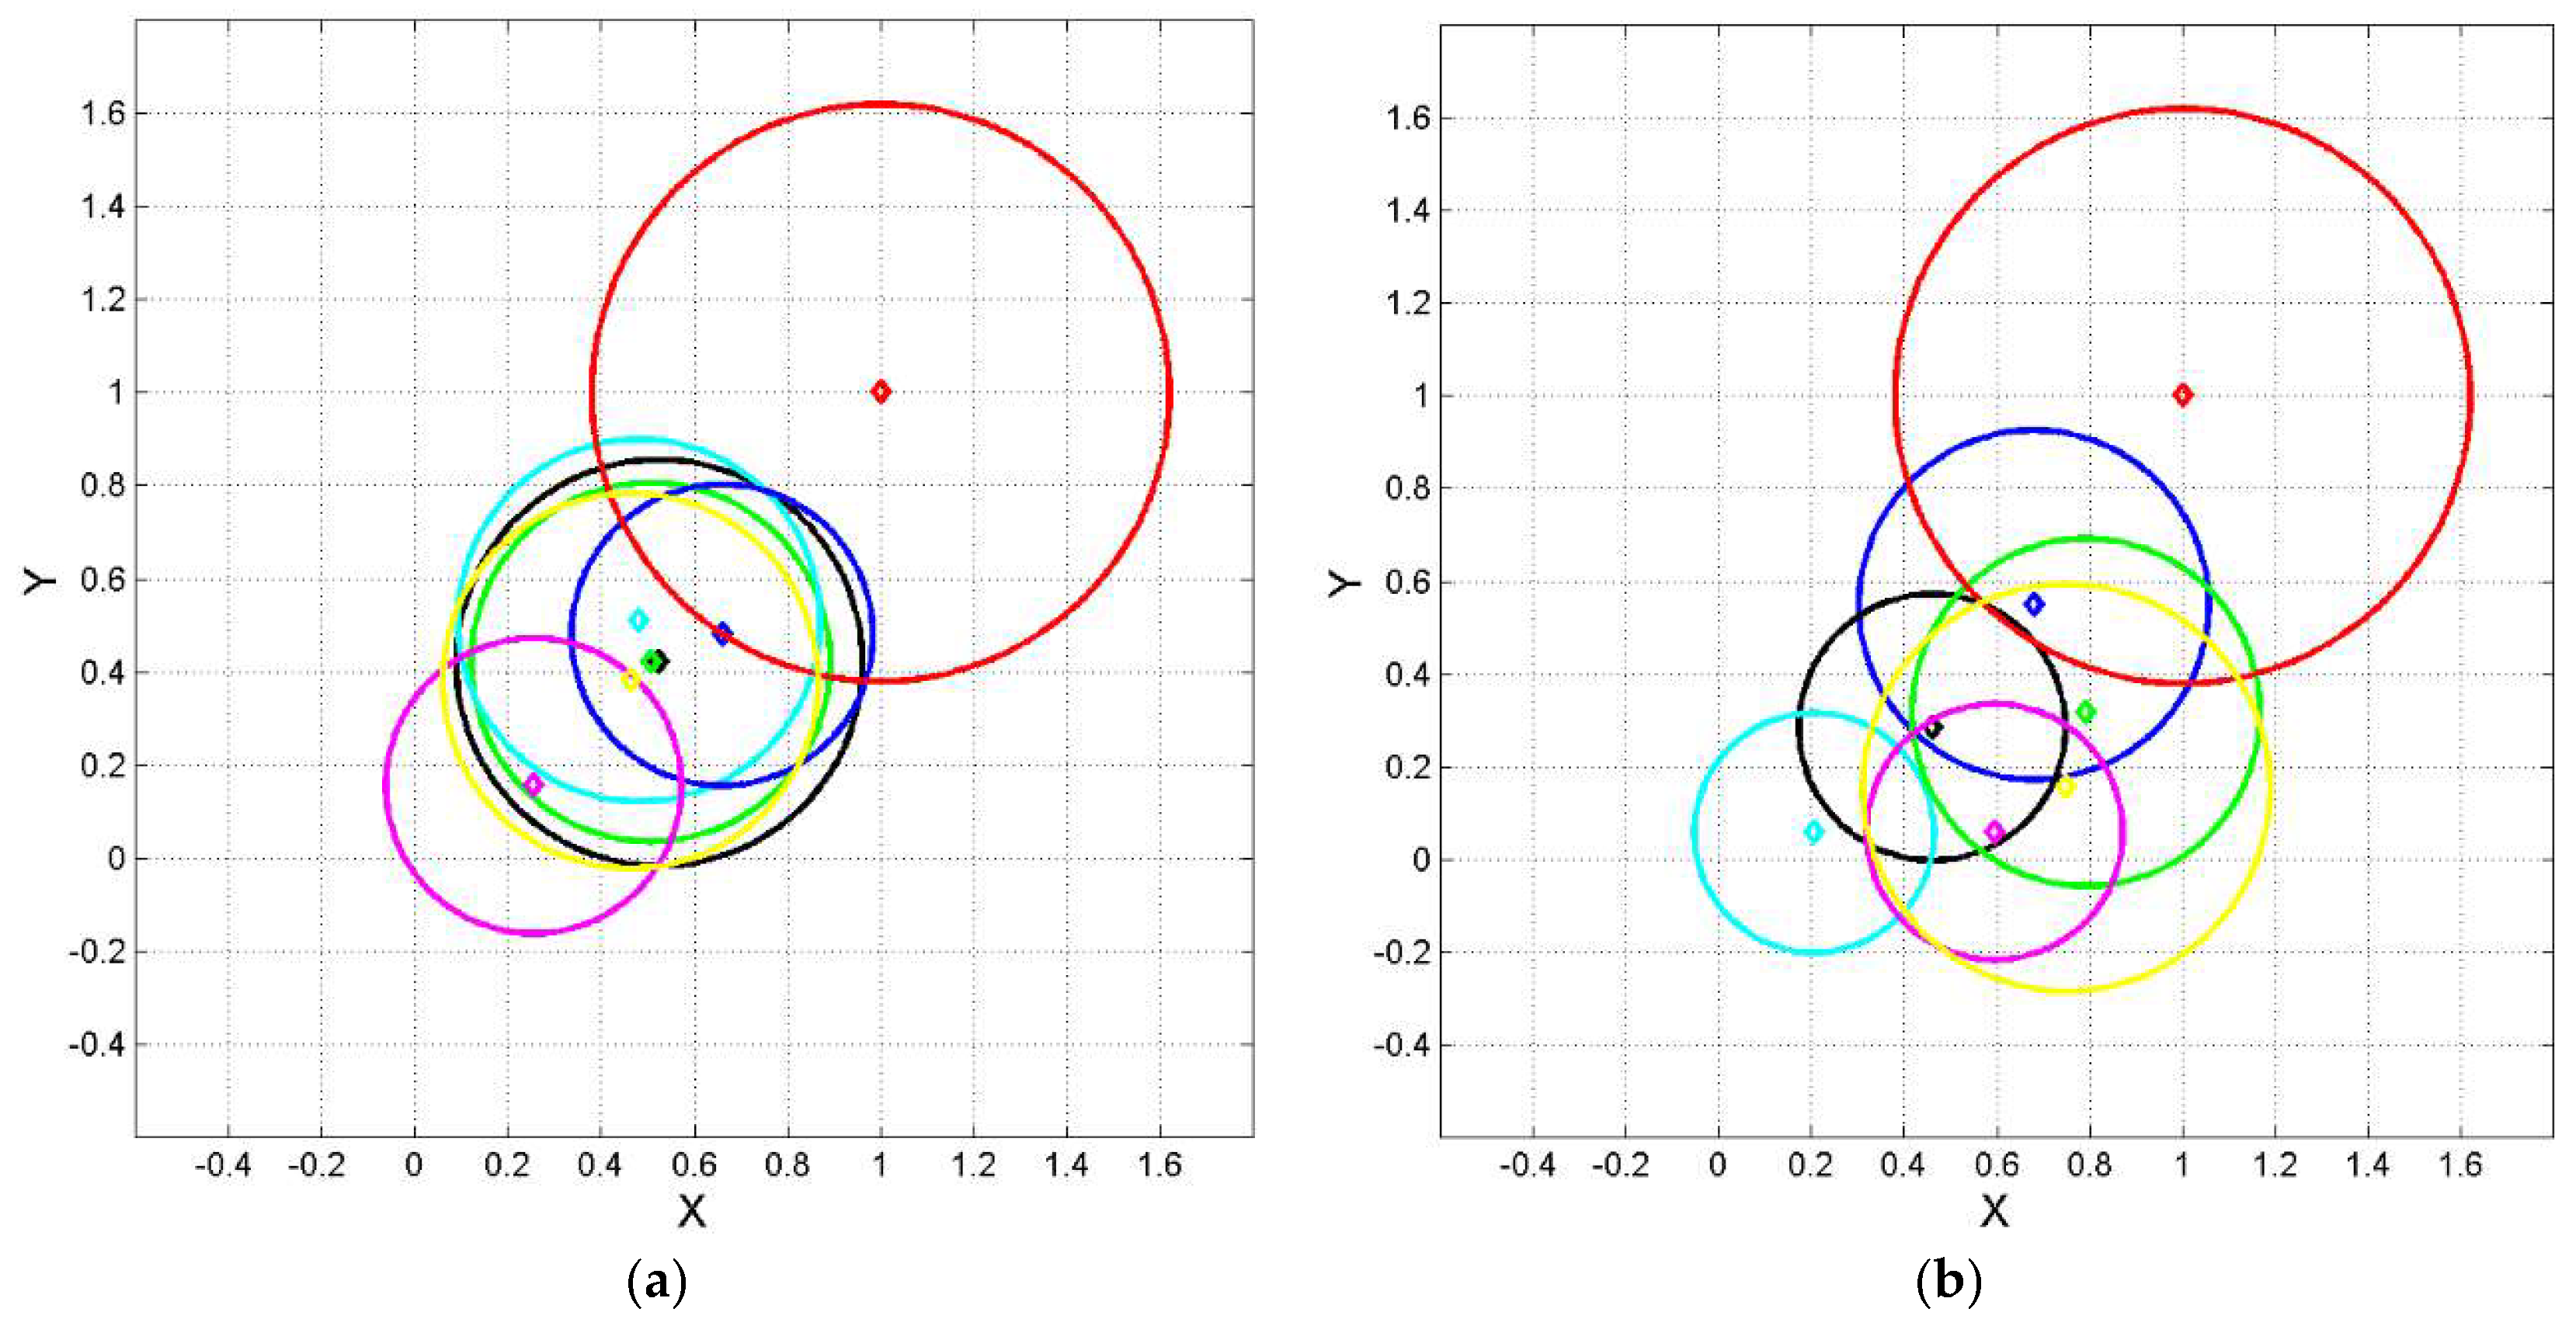
Figure 5.
Normalized coordinates and of the ending point of vector of Eq. (6) calculated by setting Haitian at the origin and Greek at , according to the linear tranformations (7)(8). Diamond represents Eq. (6); circle with same color represent 1‒sigma contour lines. (a) Color key: Gr red; Bg black dashed; Cz blue; Cr black; Pl cyan; Rs green; Sr magenta; Sl magenta dashed; Uk yellow. (b) Color key: Gr red; Al black; Wl green; Ar cyan; Hn blue; Hb magenta; Bs yellow.
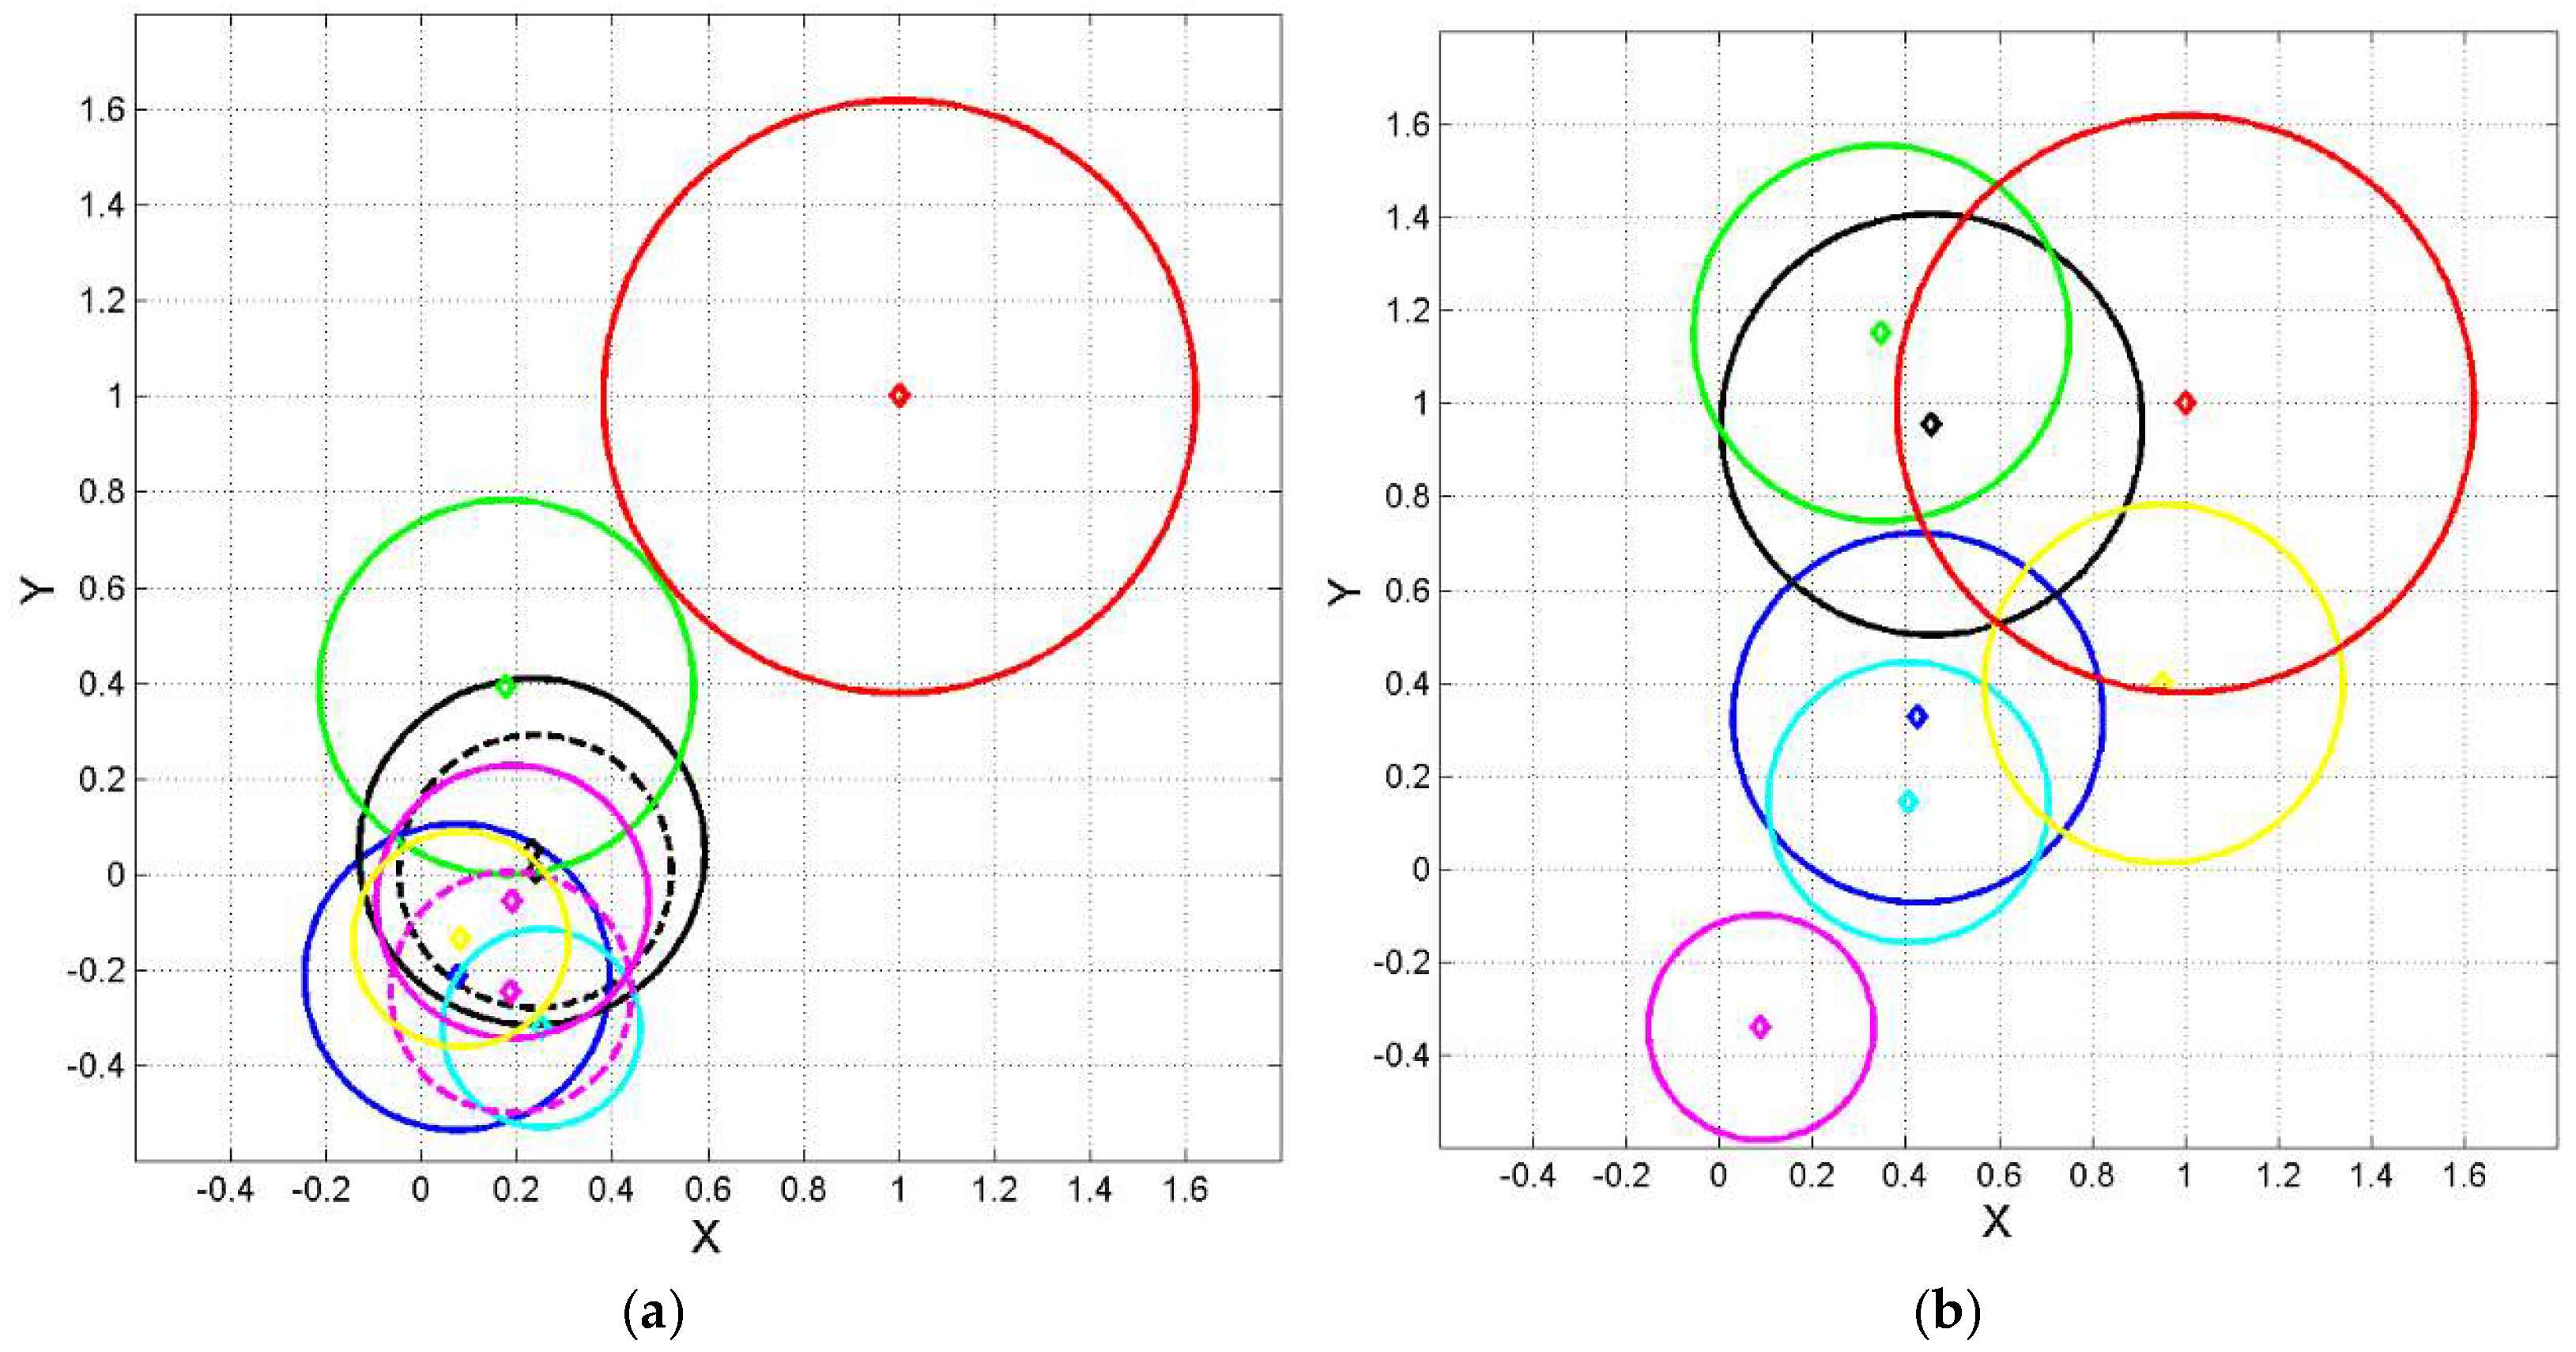
Figure 6.
Normalized coordinates and of the ending point of vector of Eq. (6) calculated by setting Haitian at the origin , magenta diamond, and Greek at , red diamond, according to the linear tranformations (7)(8). Circle with same color represent 1‒sigma contour lines. (a) Color key: black Tg; green Sm; cyan Ch; blue Cb; magenta Ht; yellow Lg; black dashed Nh. (b) Color key: English red; French blue.
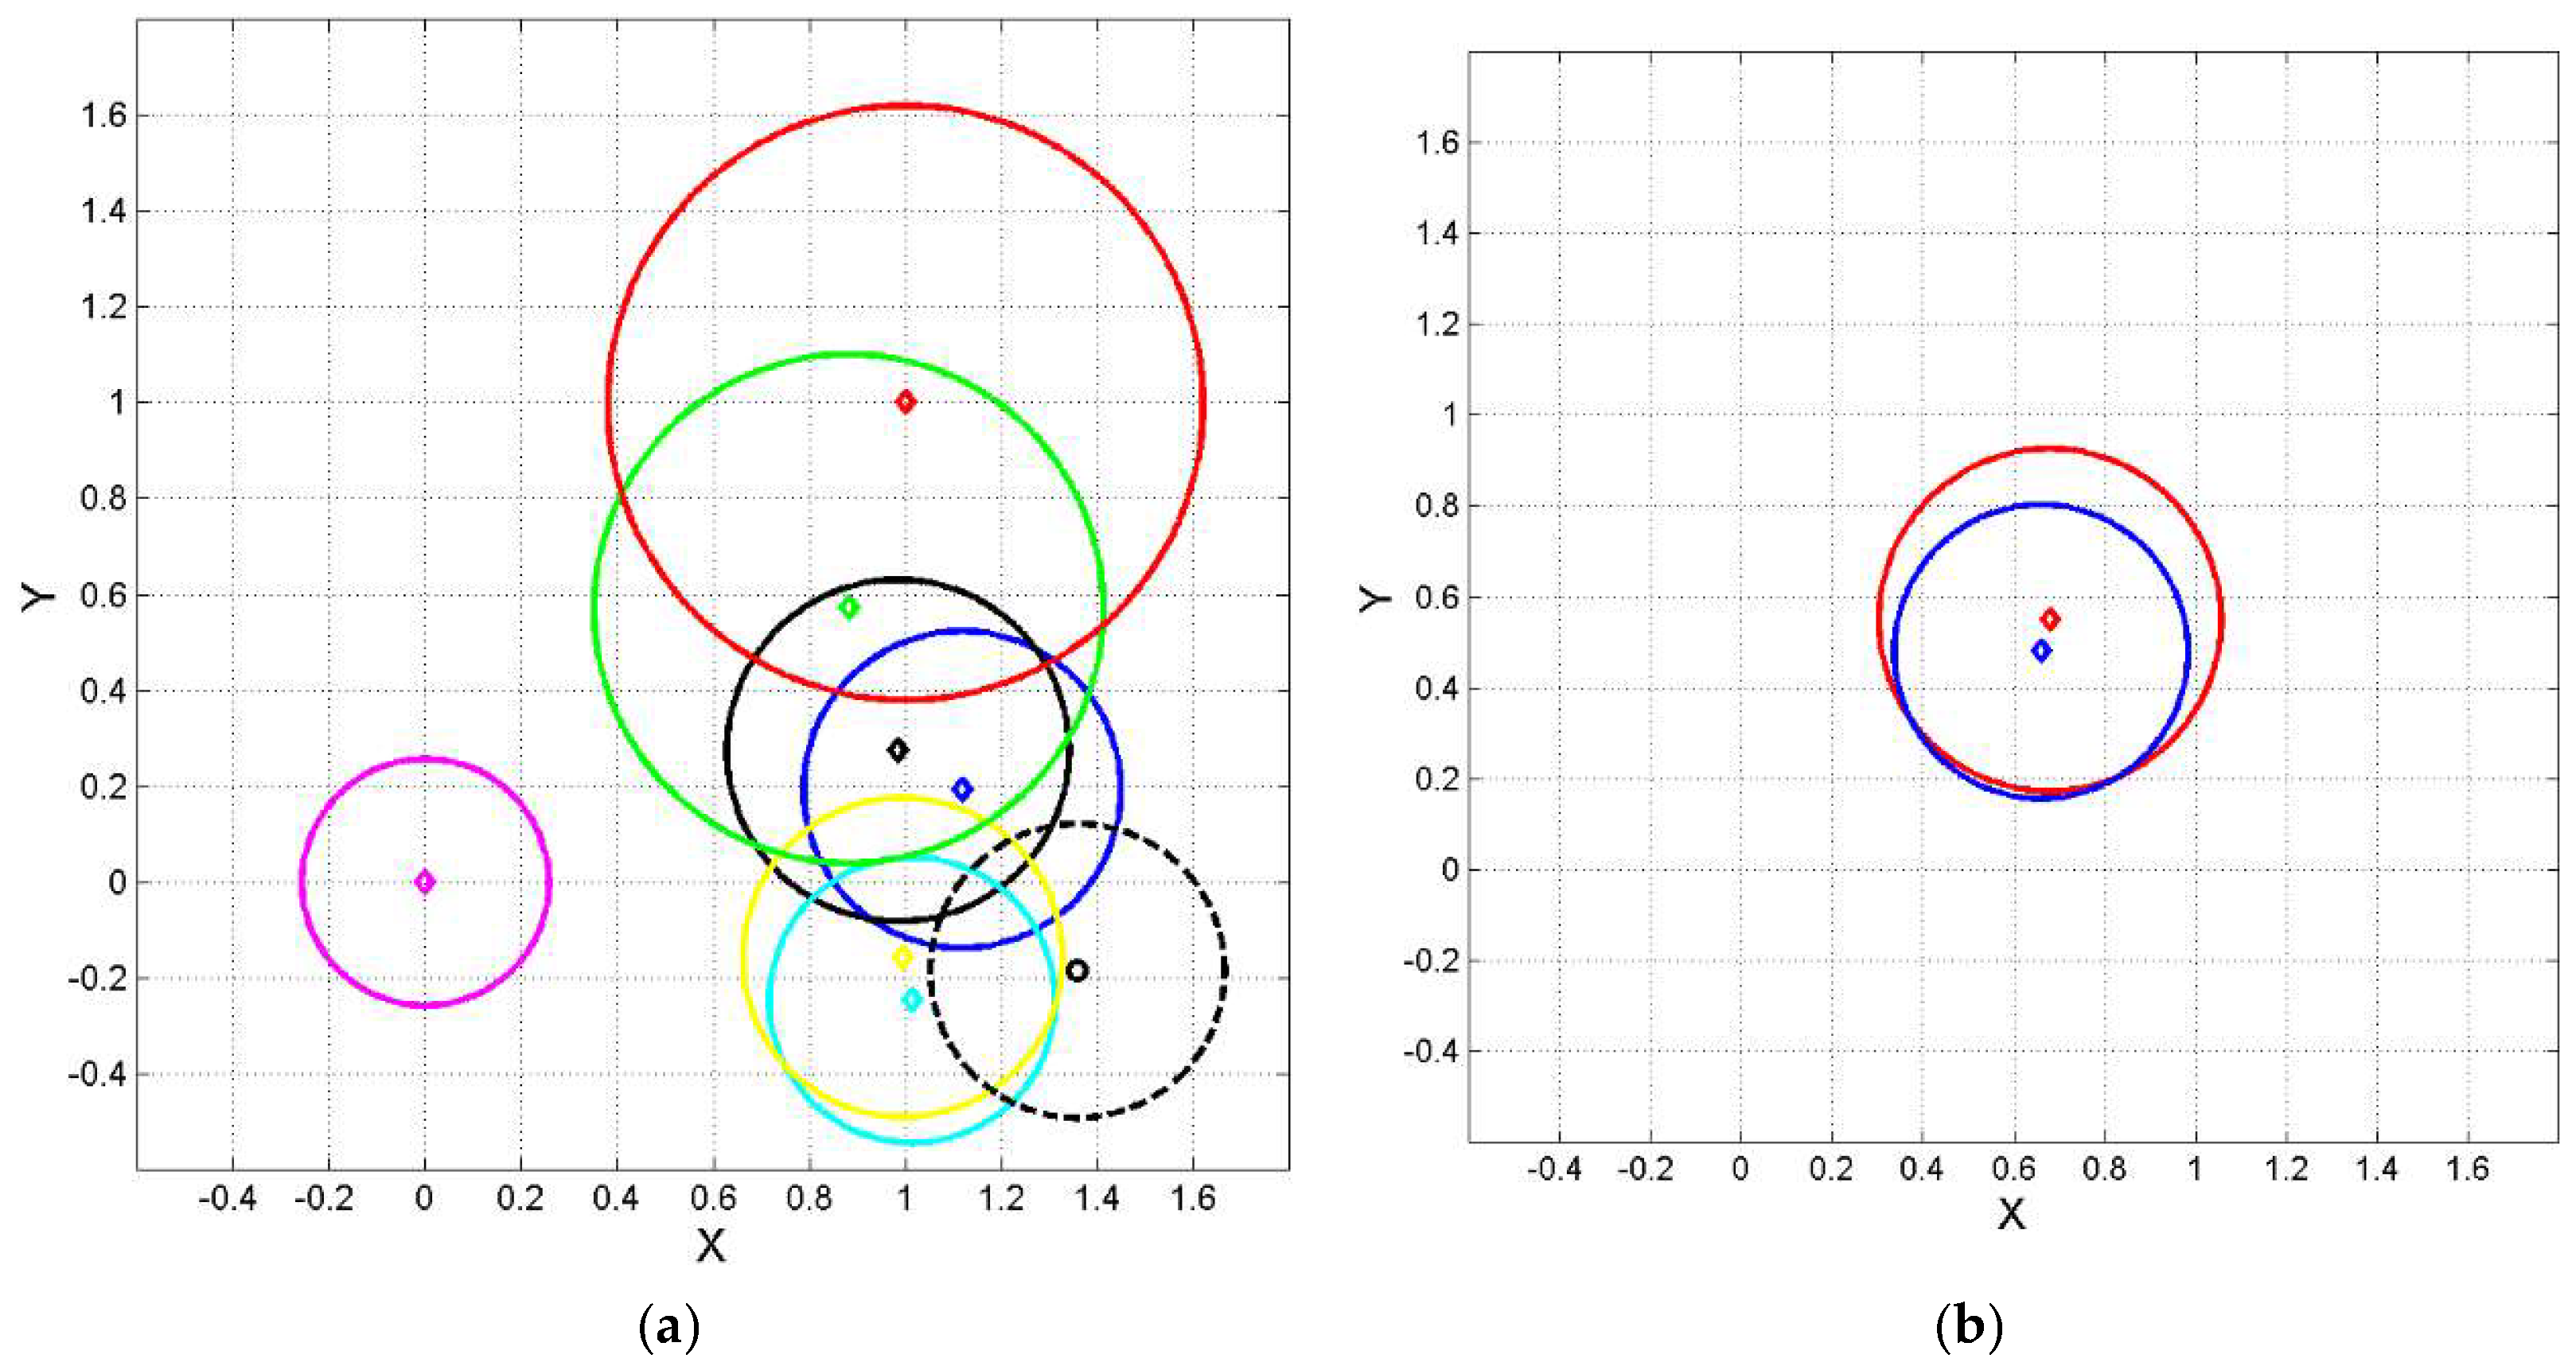
Figure 7.
Domestication index (%) versus translation language order (see Table 1).
Figure 7.
Domestication index (%) versus translation language order (see Table 1).
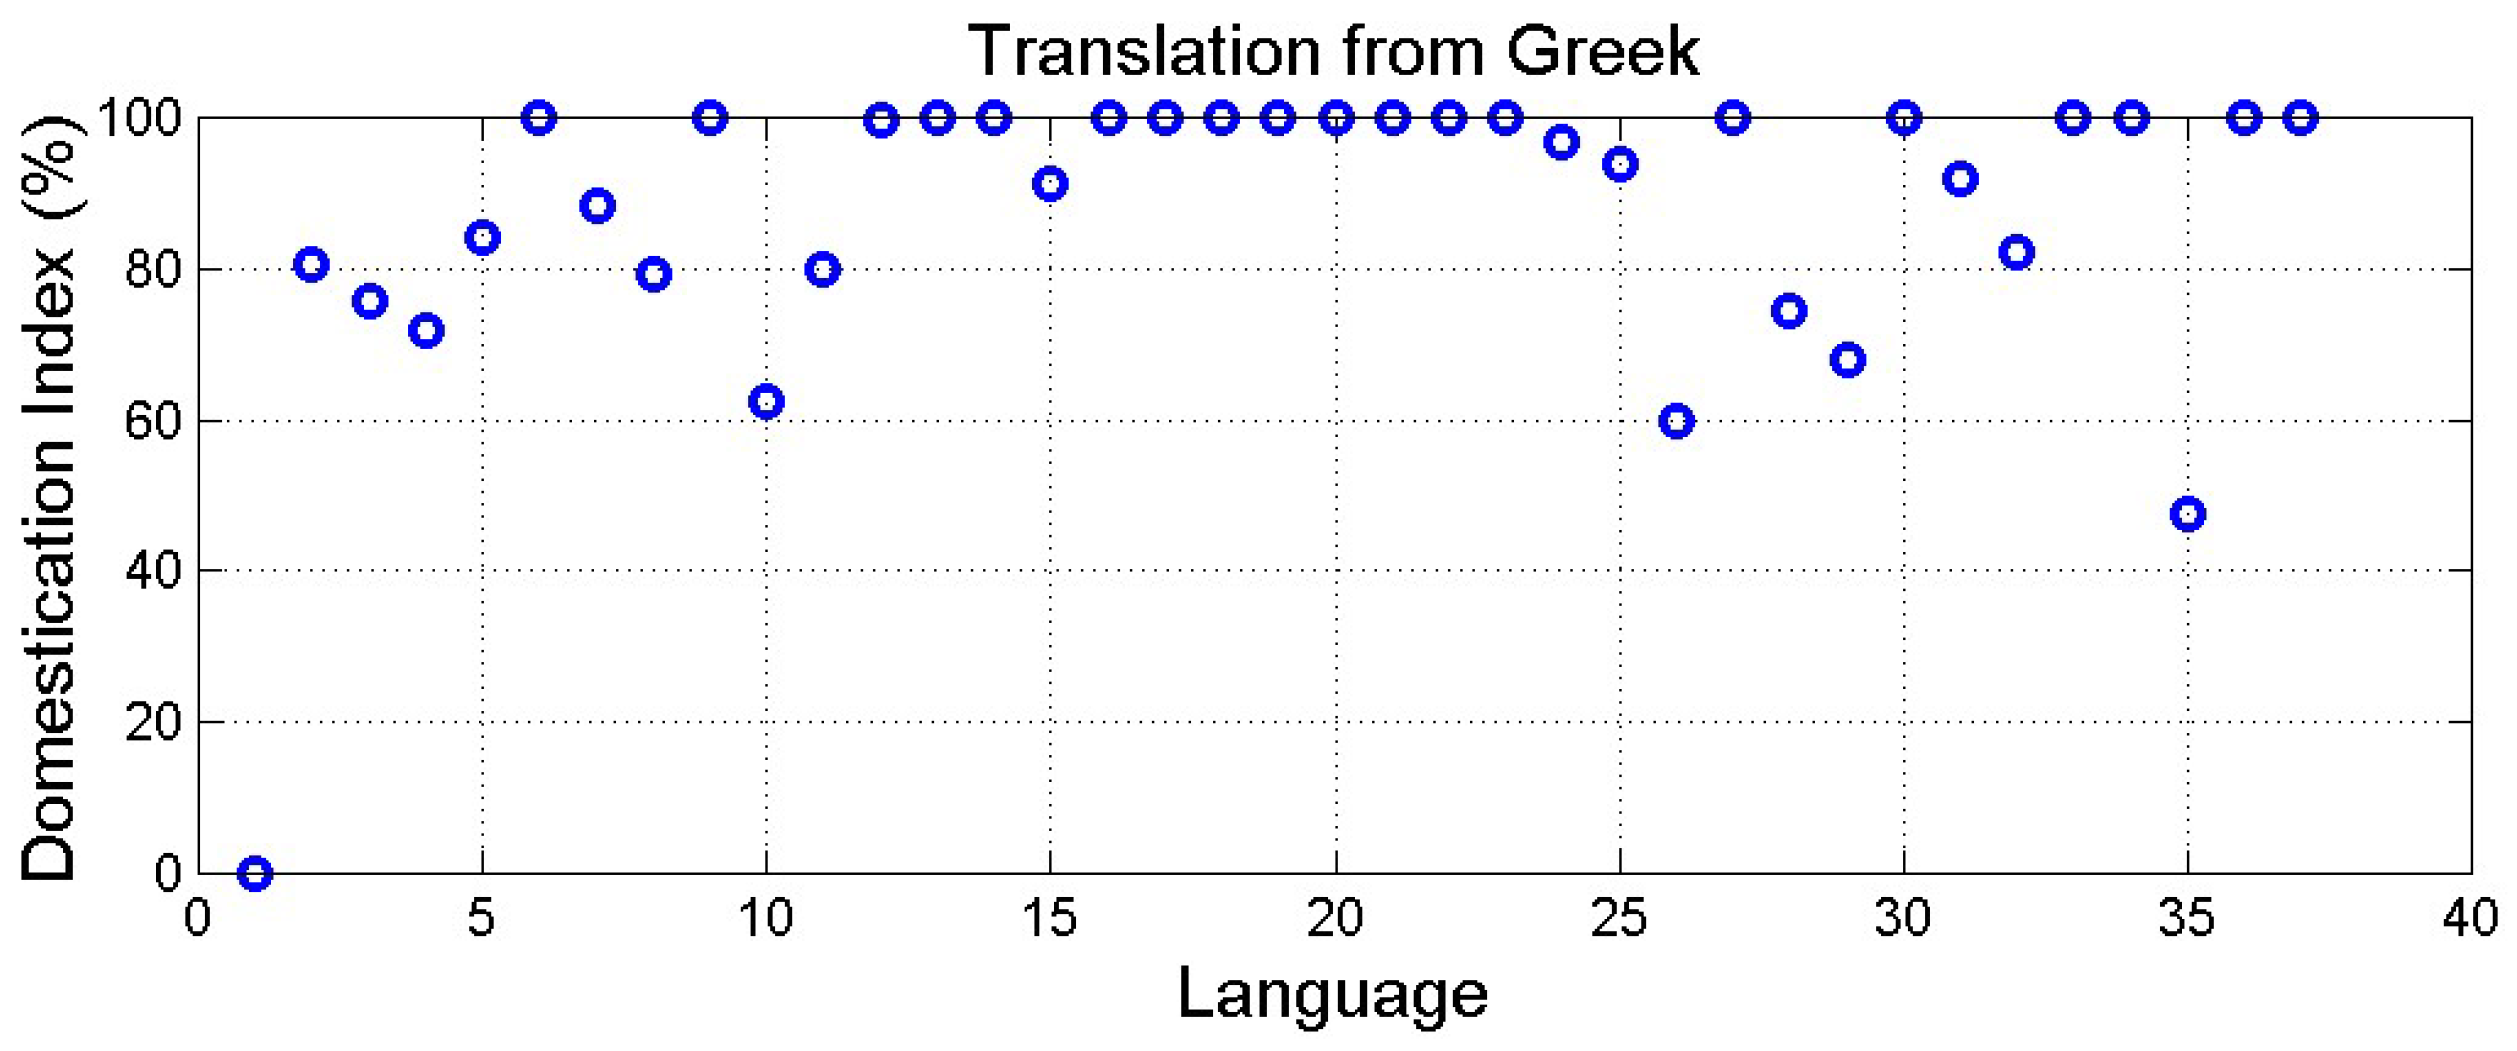
Figure 8.
Distance versus domestication index (%) of translations from Greek. The origin corresponds to Greek.
Figure 8.
Distance versus domestication index (%) of translations from Greek. The origin corresponds to Greek.
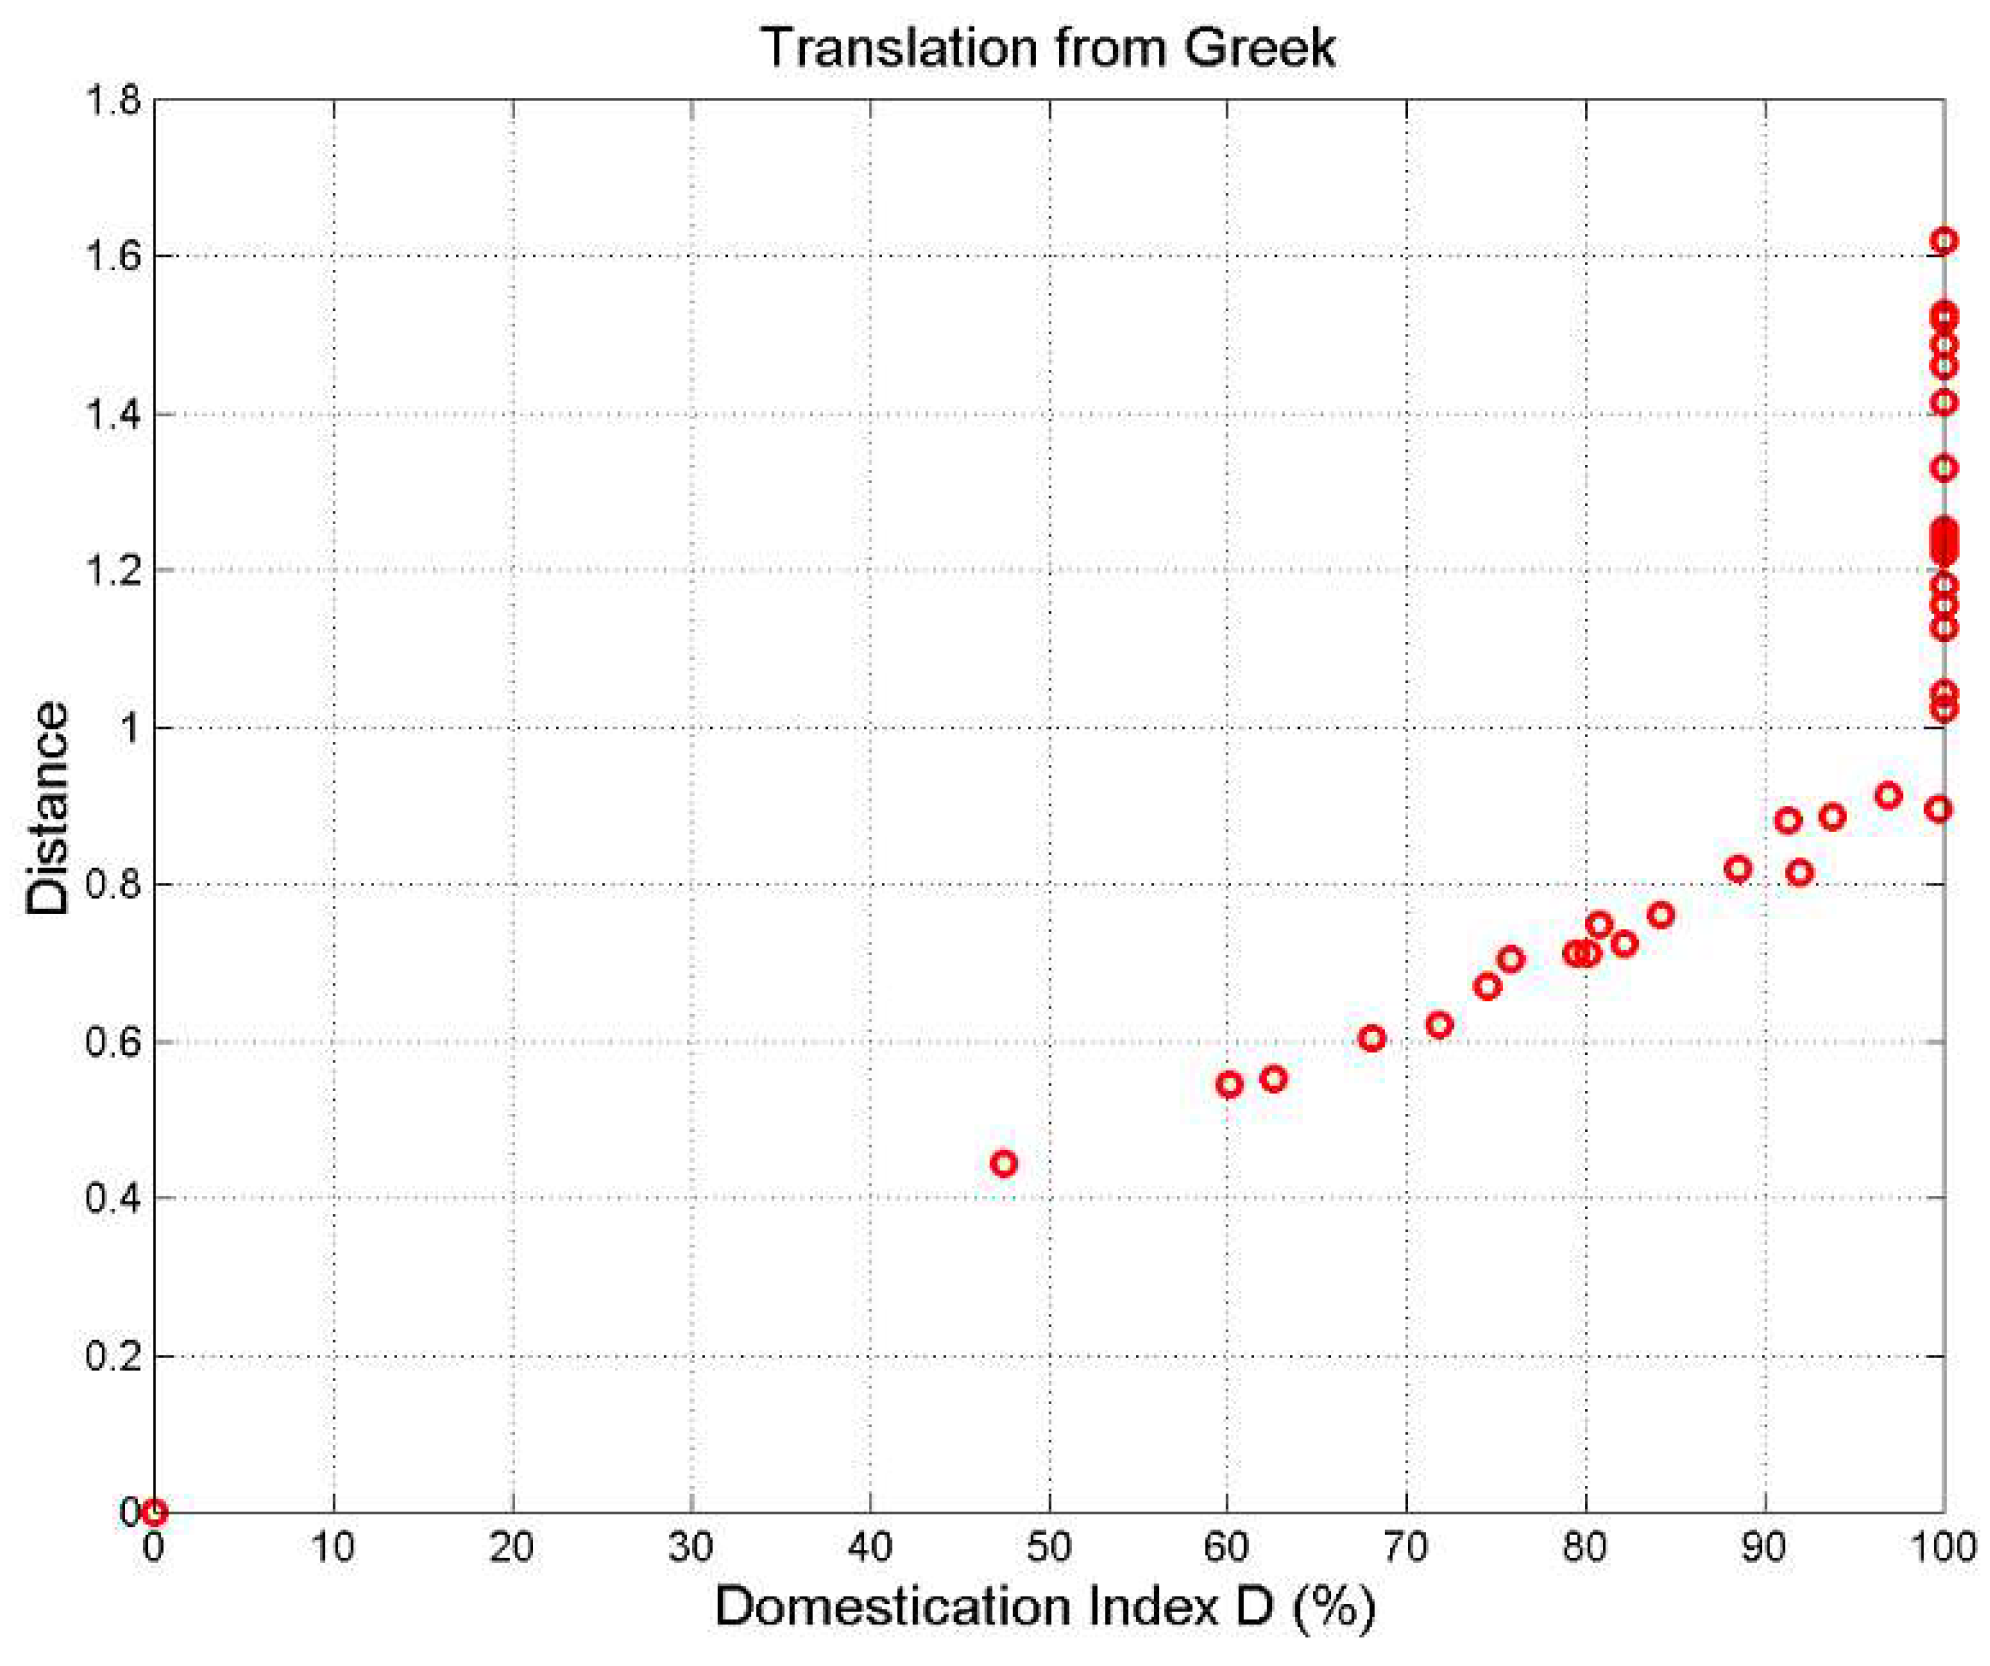
Figure 9.
Domestication index (%) of the alleged translation: (a) from English to other languages (for language order number see Table 1). English is language 10; The minimum is found in French (language 4).; (b) From Italian to other languages. Italian is language 5. The minimum is found in Romanian (language 7); Latin (language 2) is very close to Italian, .
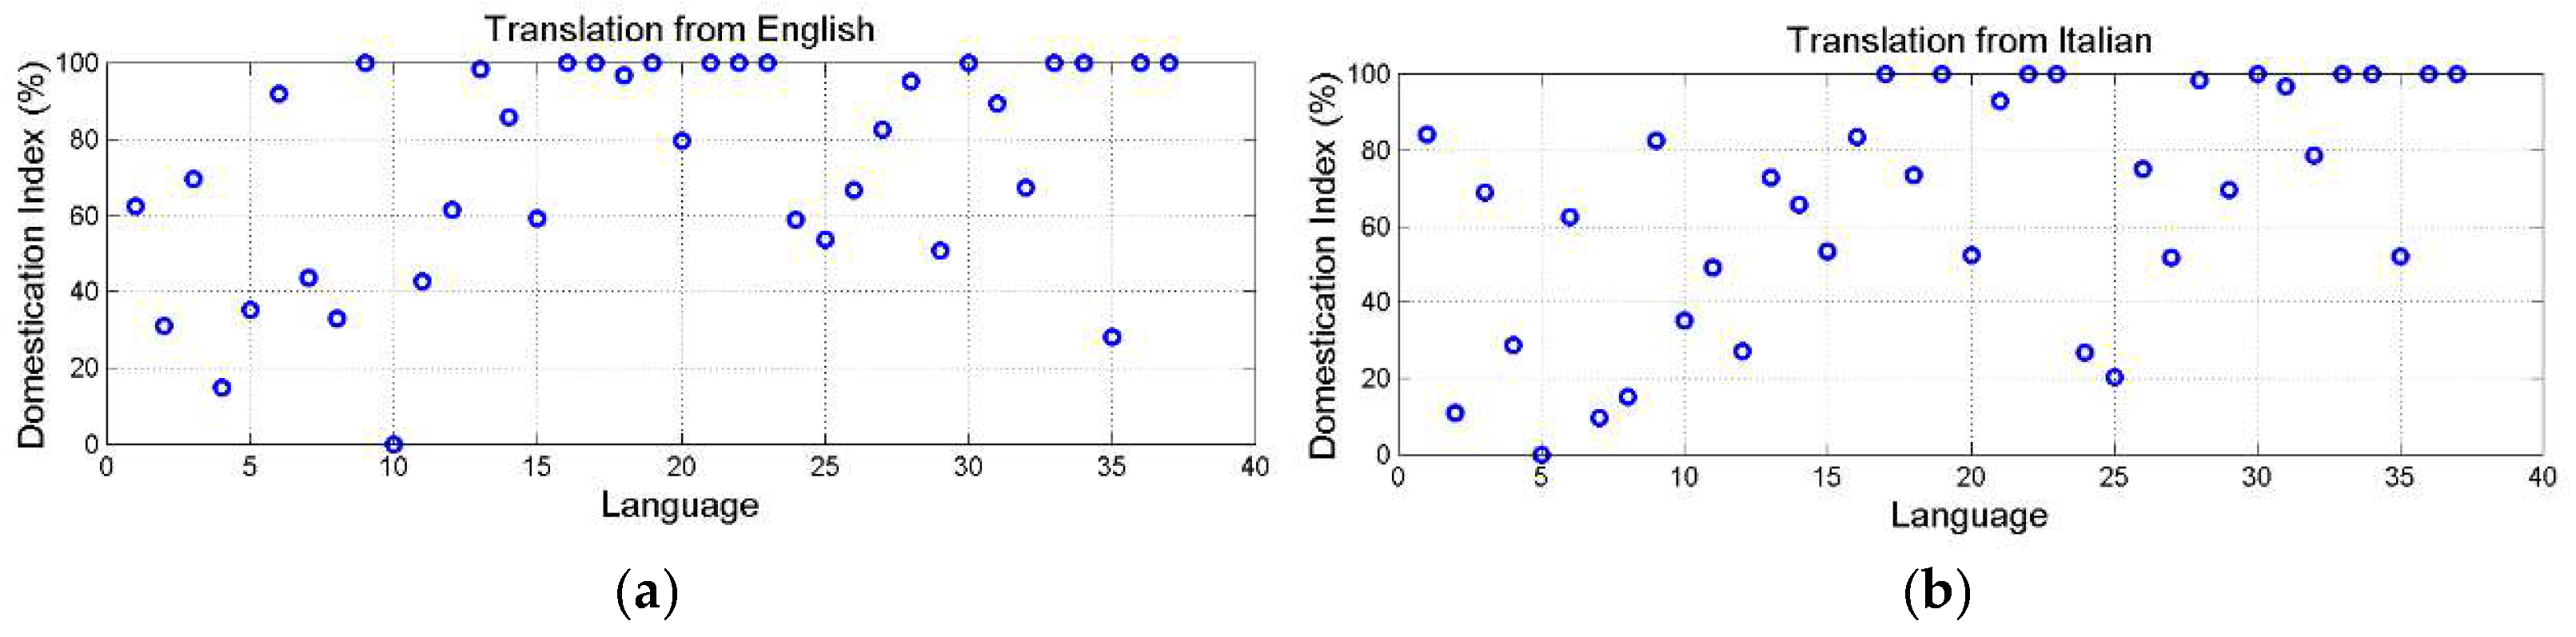
Figure 10.
Distance versus domestication index (%). The origin corresponds to the language assumed as source text. Red circles refer to Greek as source texts; black circles to English, green circles to Italian, blue to all other languages assumed as source texts.
Figure 10.
Distance versus domestication index (%). The origin corresponds to the language assumed as source text. Red circles refer to Greek as source texts; black circles to English, green circles to Italian, blue to all other languages assumed as source texts.
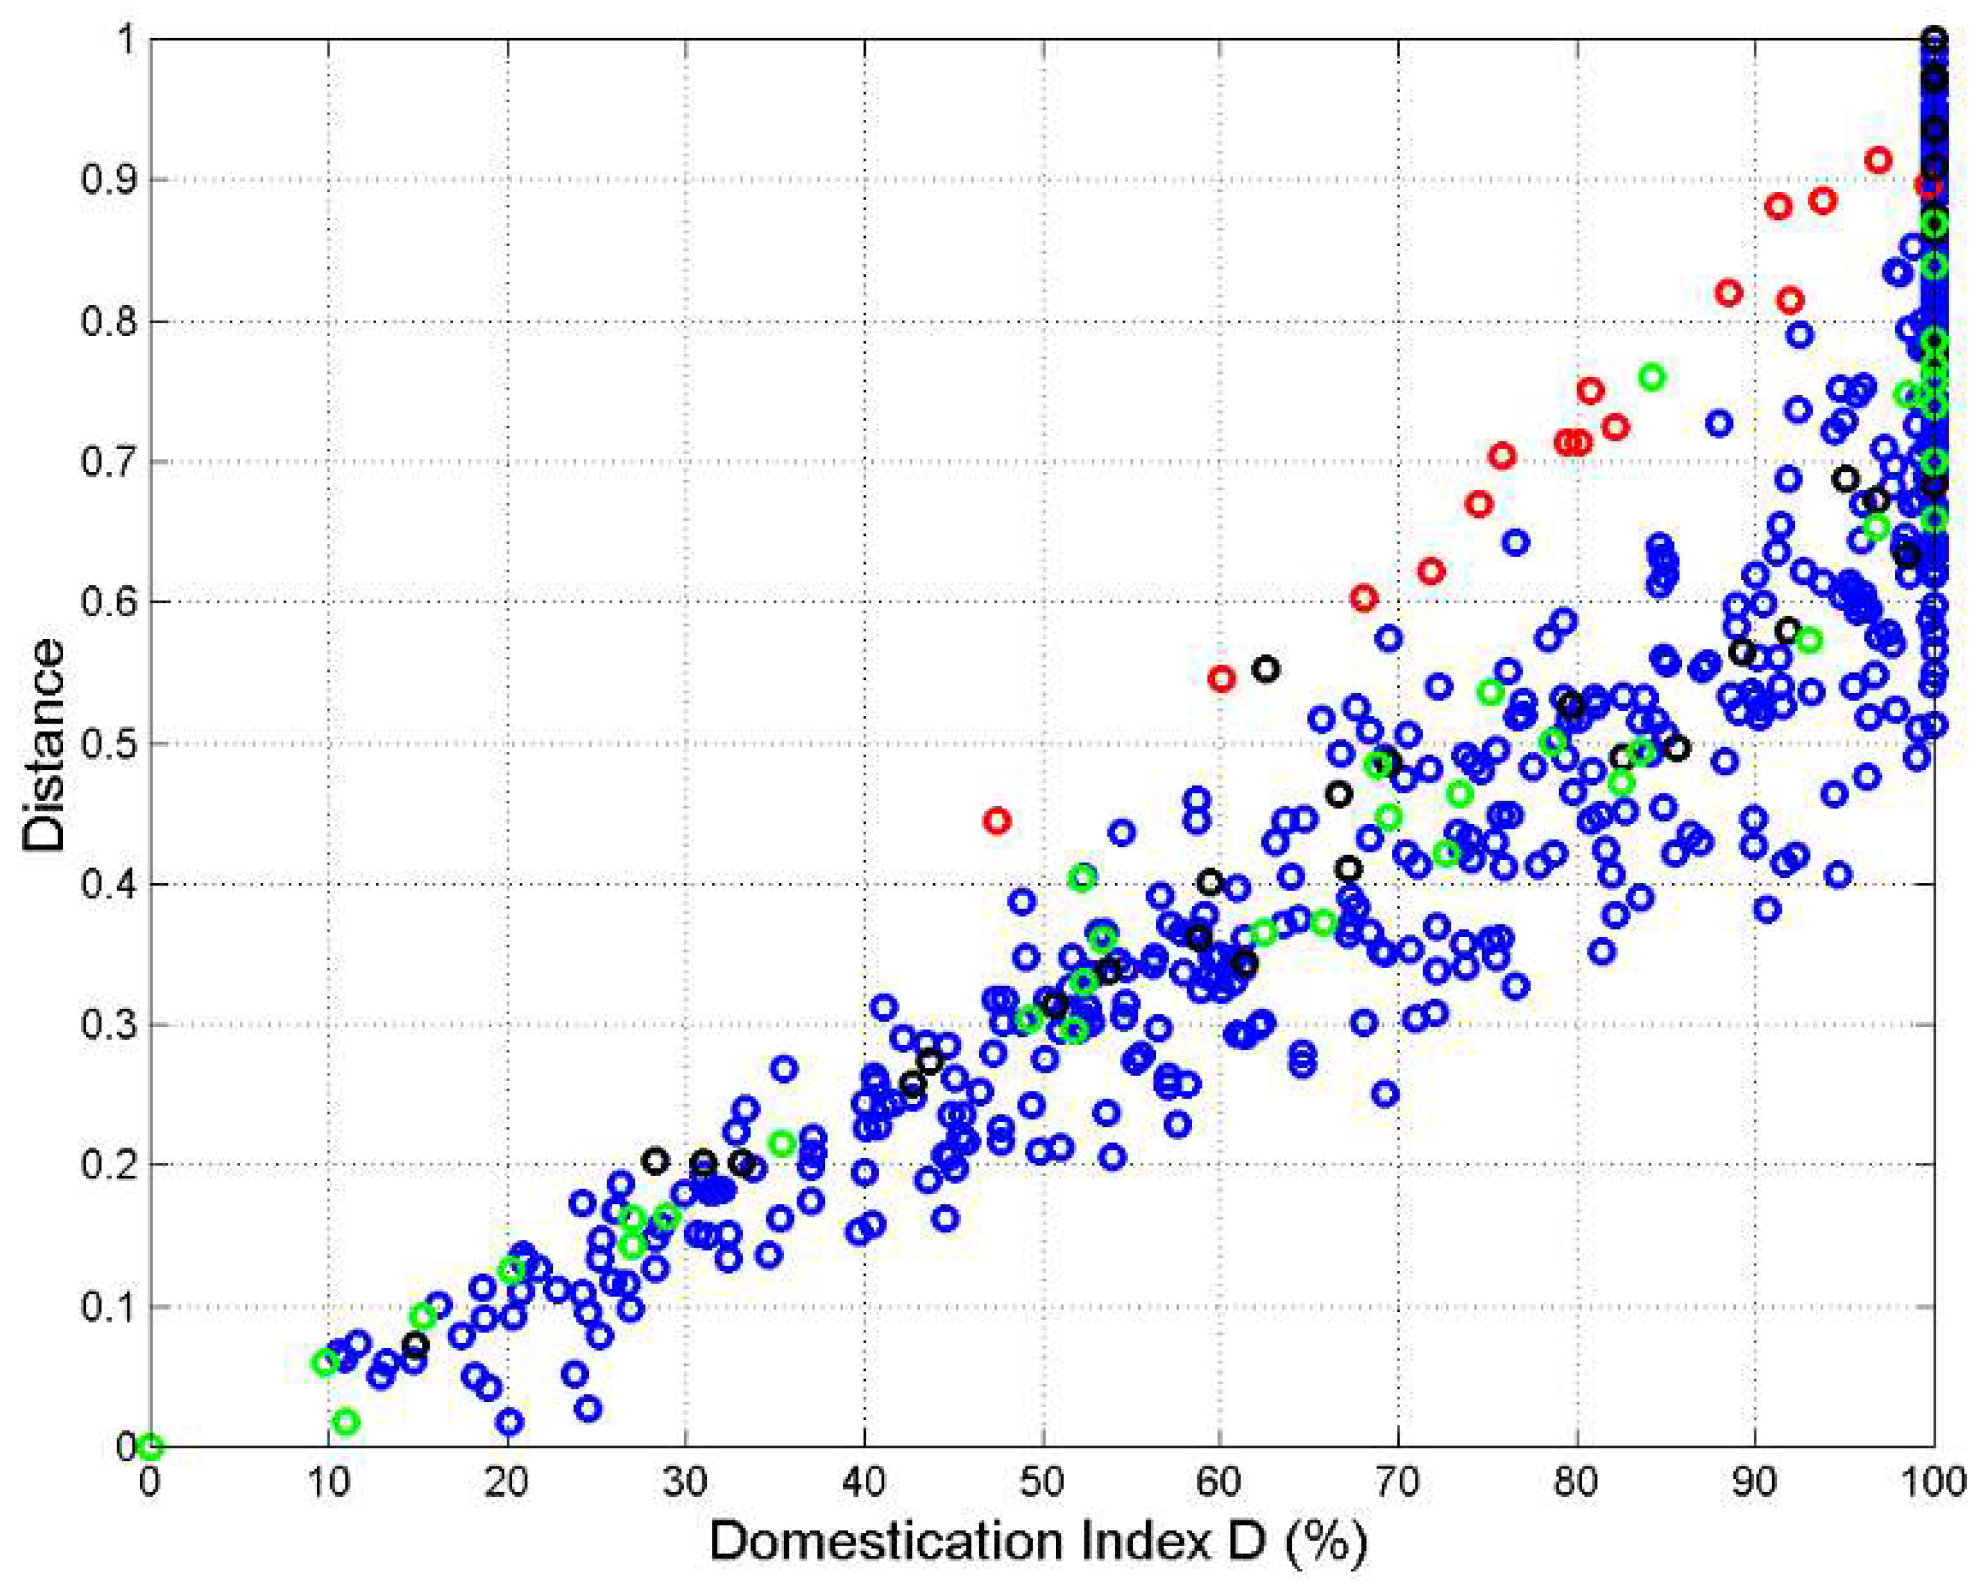
Figure 11.
Conditional mean (blue line) and 1−standard deviation bounds (magenta lines) of versus translation (for order number see Table 1. The cyan lines draw the overall mean and standard deviation bounds; samples per translation.
Figure 11.
Conditional mean (blue line) and 1−standard deviation bounds (magenta lines) of versus translation (for order number see Table 1. The cyan lines draw the overall mean and standard deviation bounds; samples per translation.
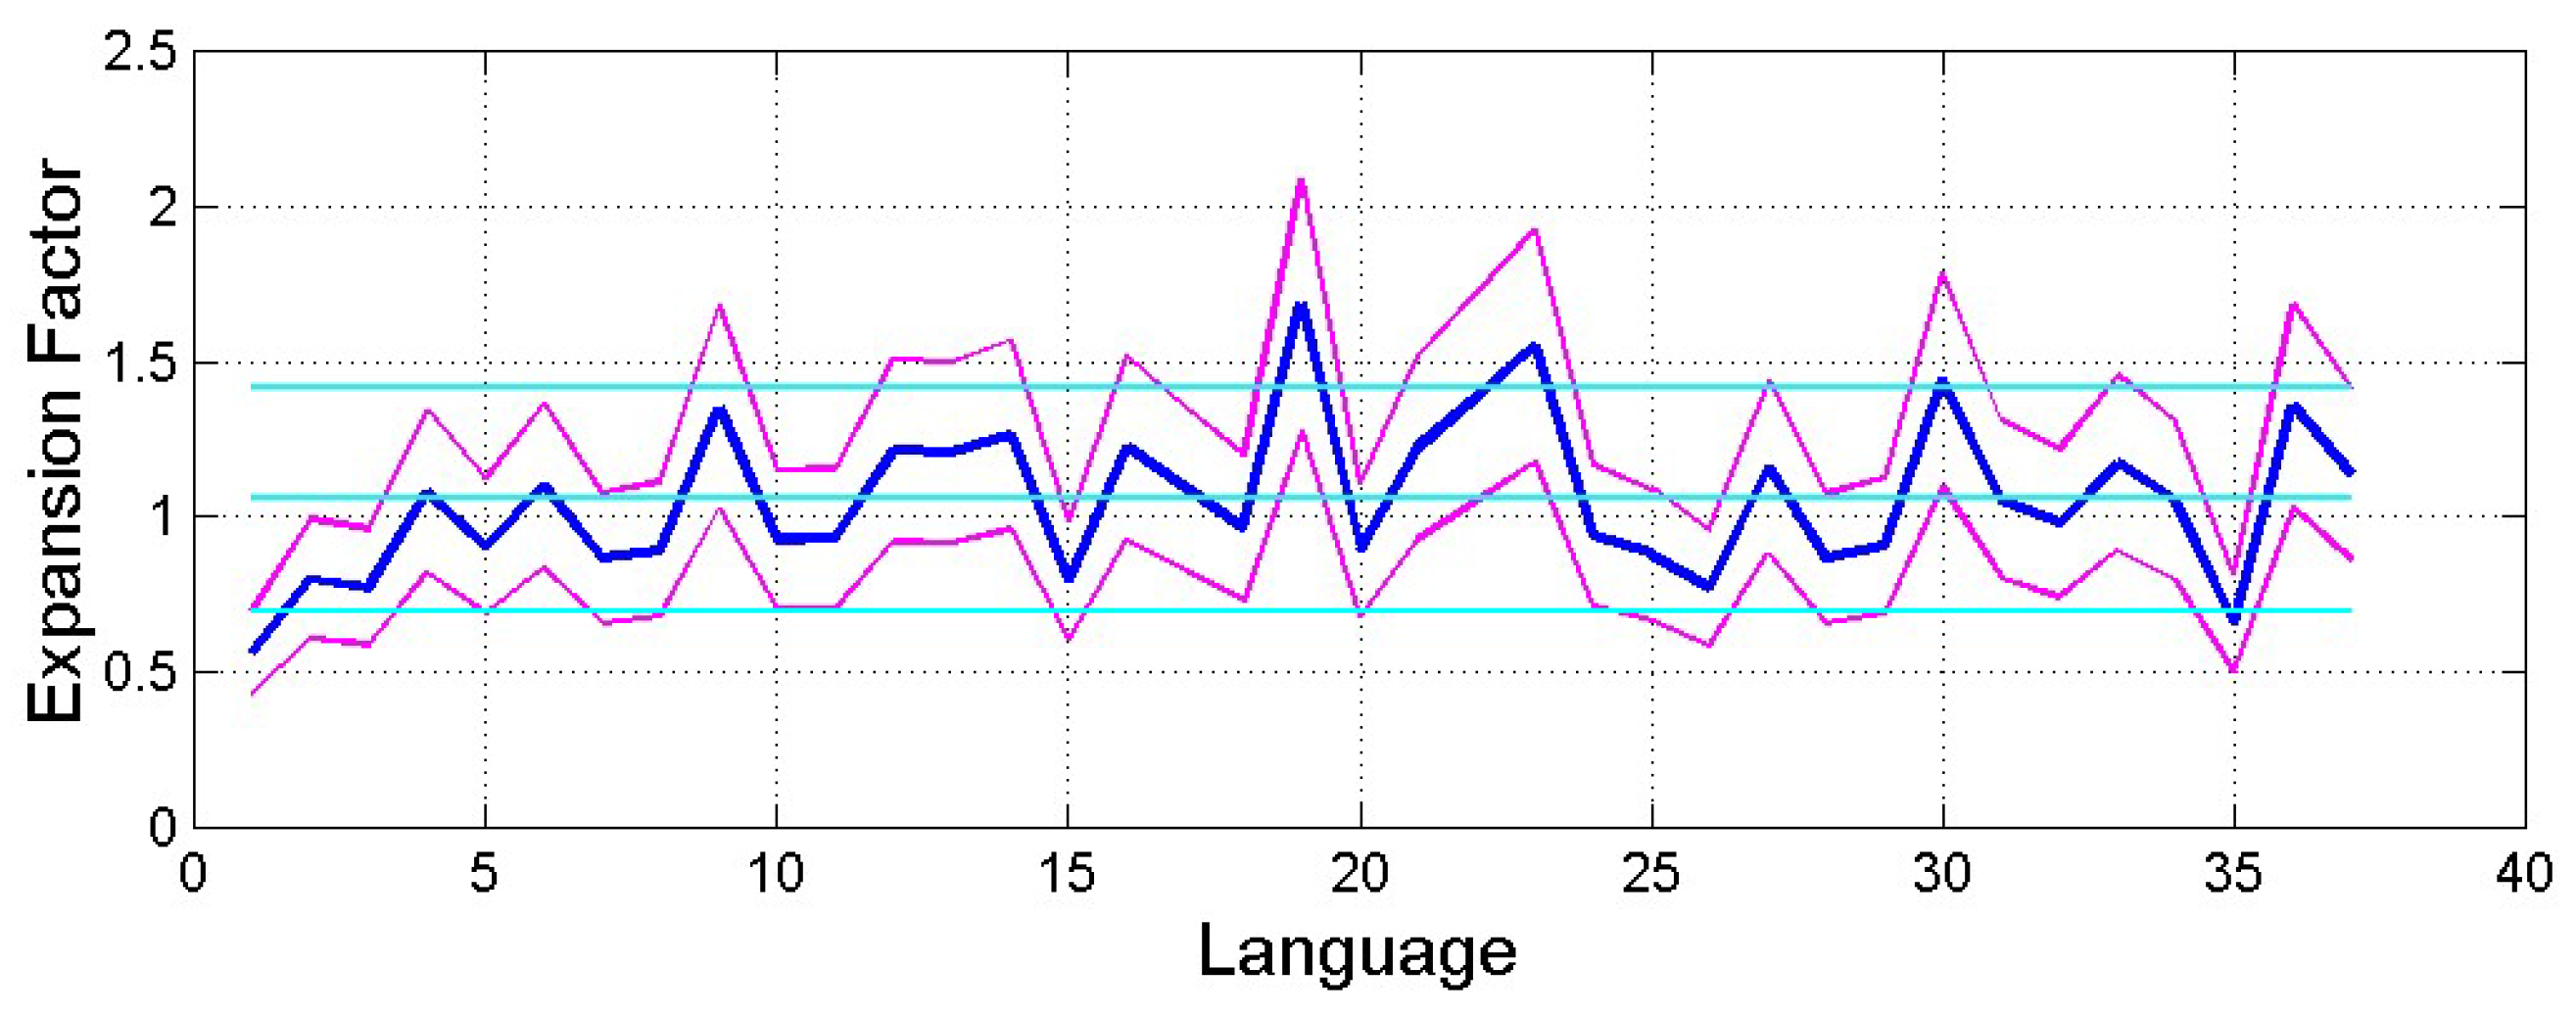
Figure 12.
Scatterplot of versus for all translations. The number of samples is . Reference language Greek, red circles; references language English, black circles; reference language Italian, green circles; all other languages, blue circles.
Figure 12.
Scatterplot of versus for all translations. The number of samples is . Reference language Greek, red circles; references language English, black circles; reference language Italian, green circles; all other languages, blue circles.
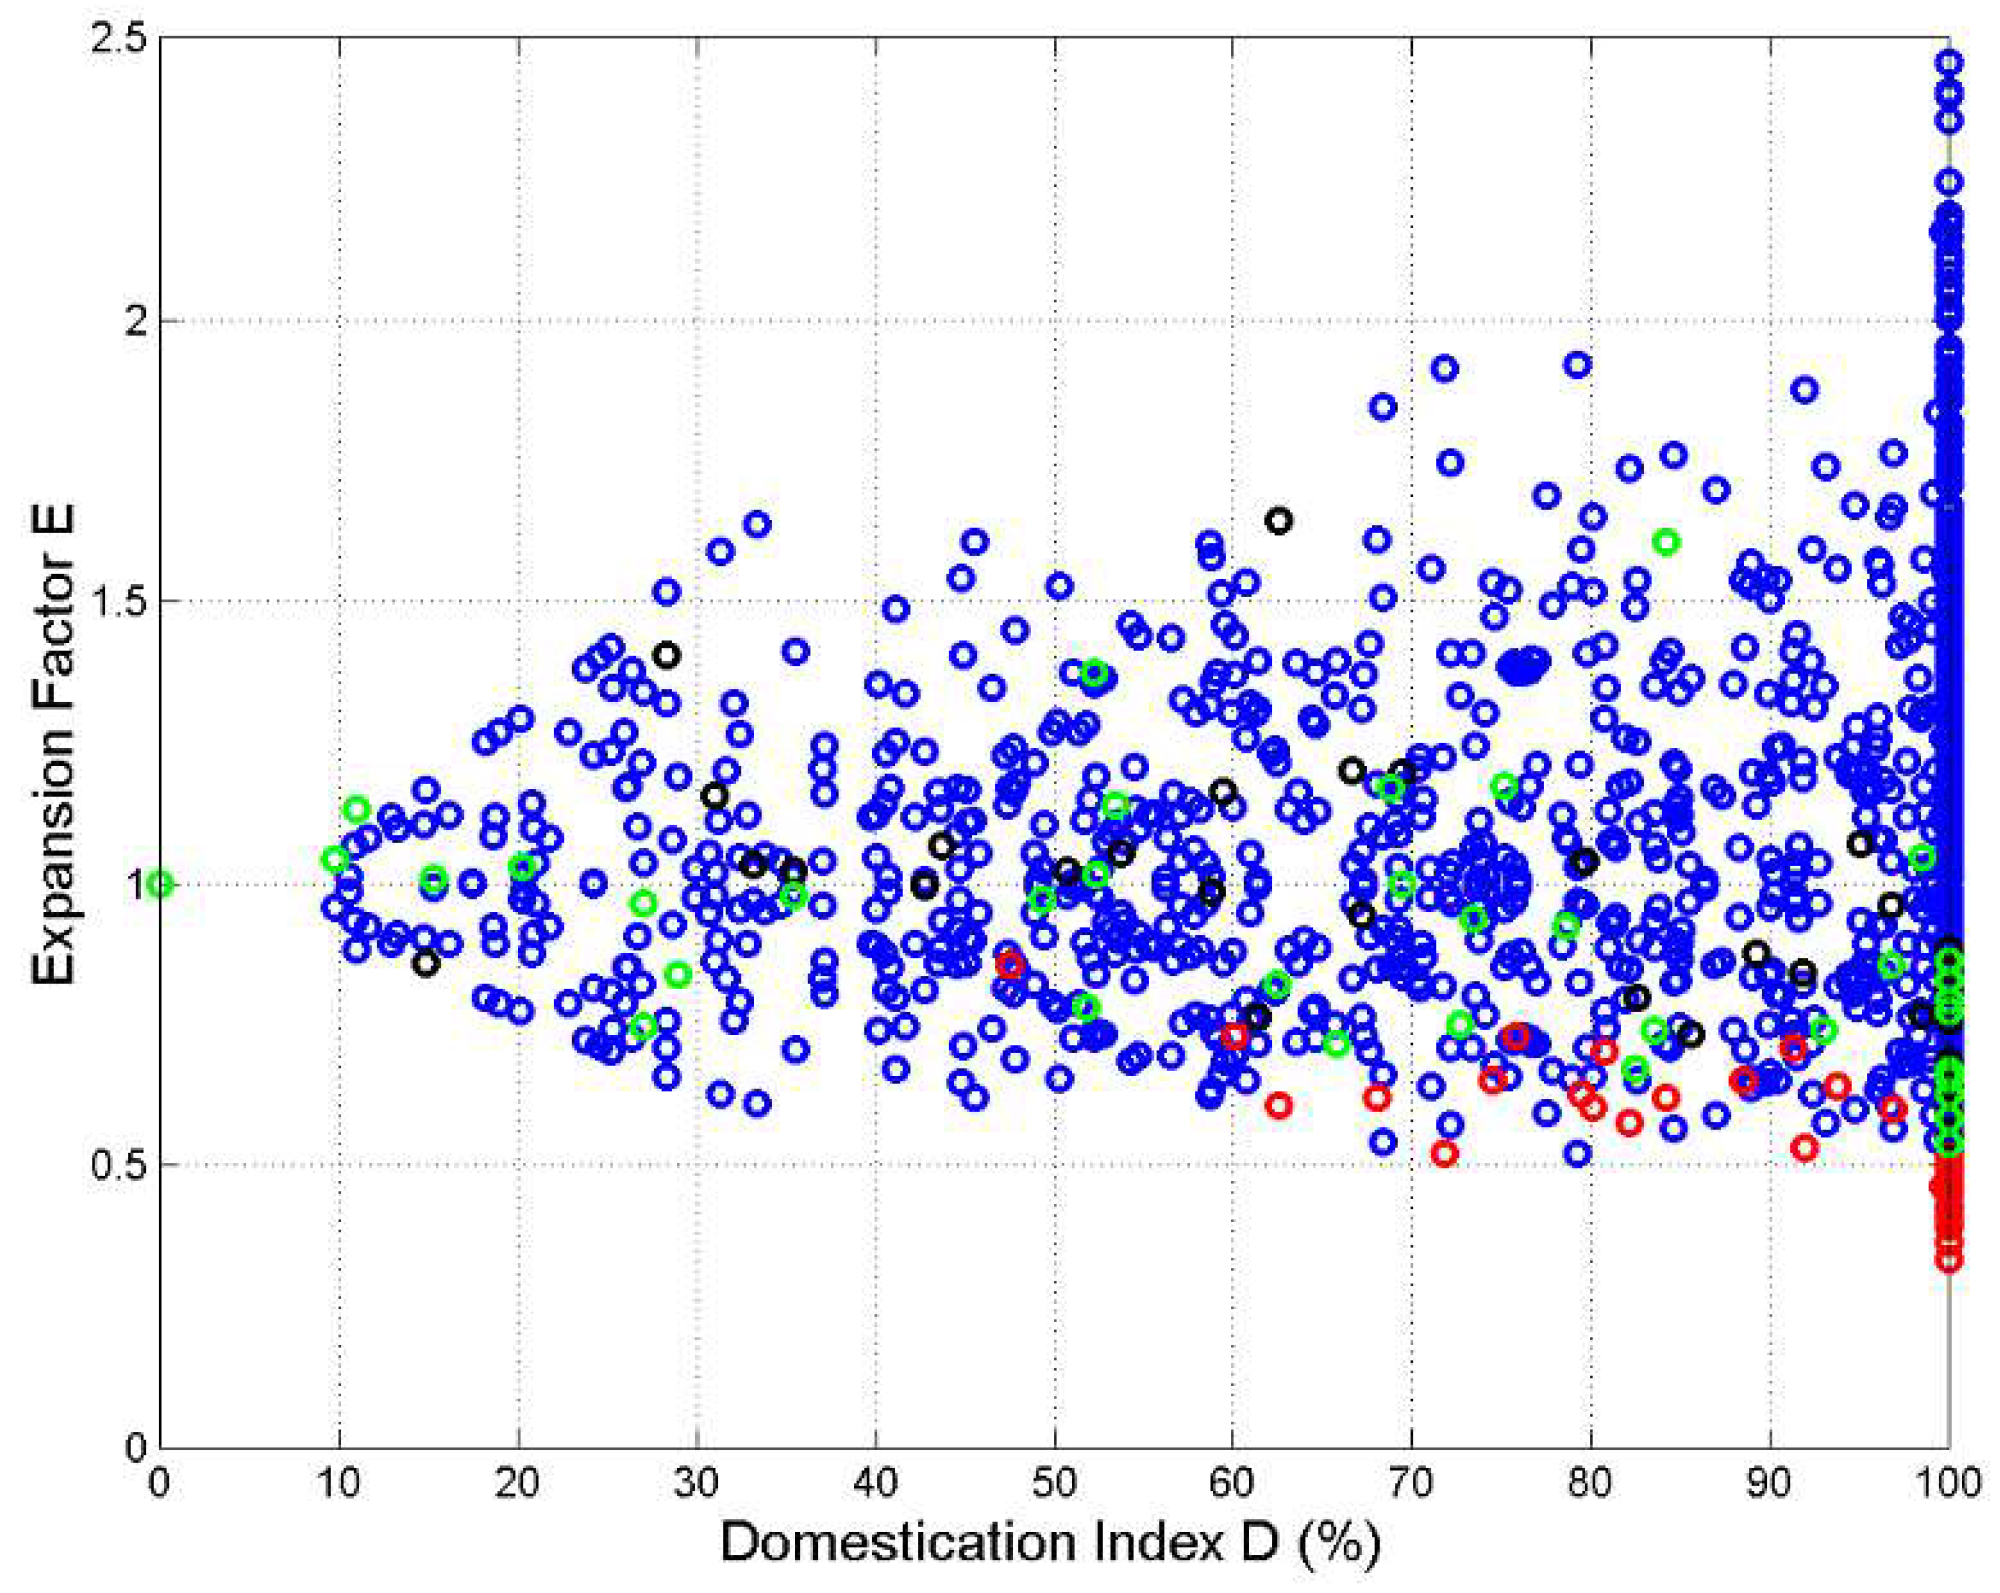
Figure 13.
Histogram of (blue circles) and its log−normal model (black line). The number of samples is
Figure 13.
Histogram of (blue circles) and its log−normal model (black line). The number of samples is
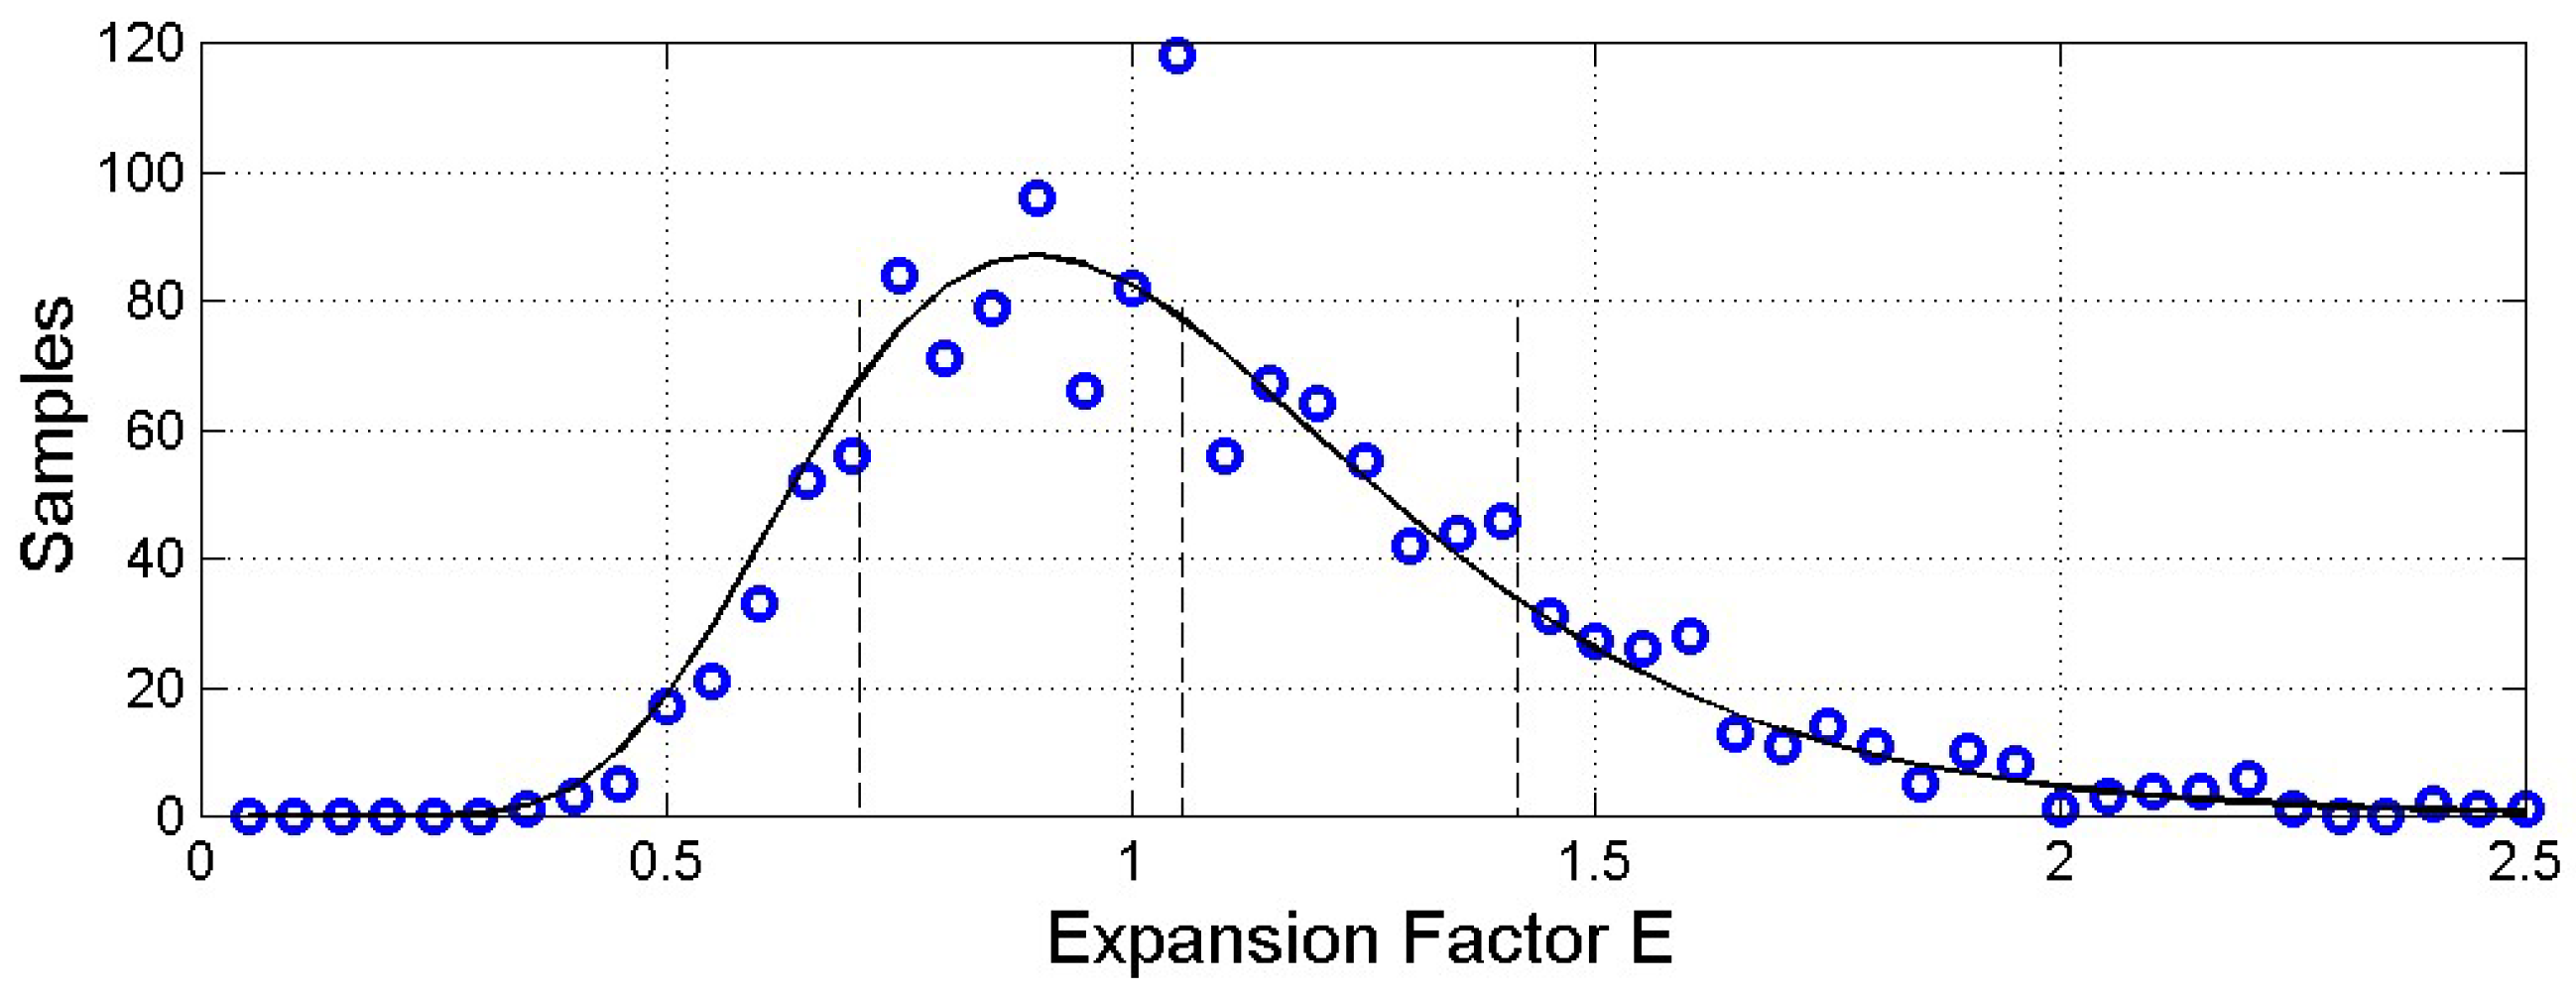
Figure 14.
Normalized coordinates and of the ending point of vector of Eq. (6) calculated by setting Haitian at the origin and Greek at , red diamond, according to the linear tranformations (7)(8). Circle with same color represent 1‒sigma contour lines discussed in Section 3.2. (a) Treasure Island; Color key: red, English; blue, French; green, Italian; magenta, German, black, Russian. (b) David Copperfield; Color key: English red; French blue, green, Italian; magenta, Spanish; black, Finnish.
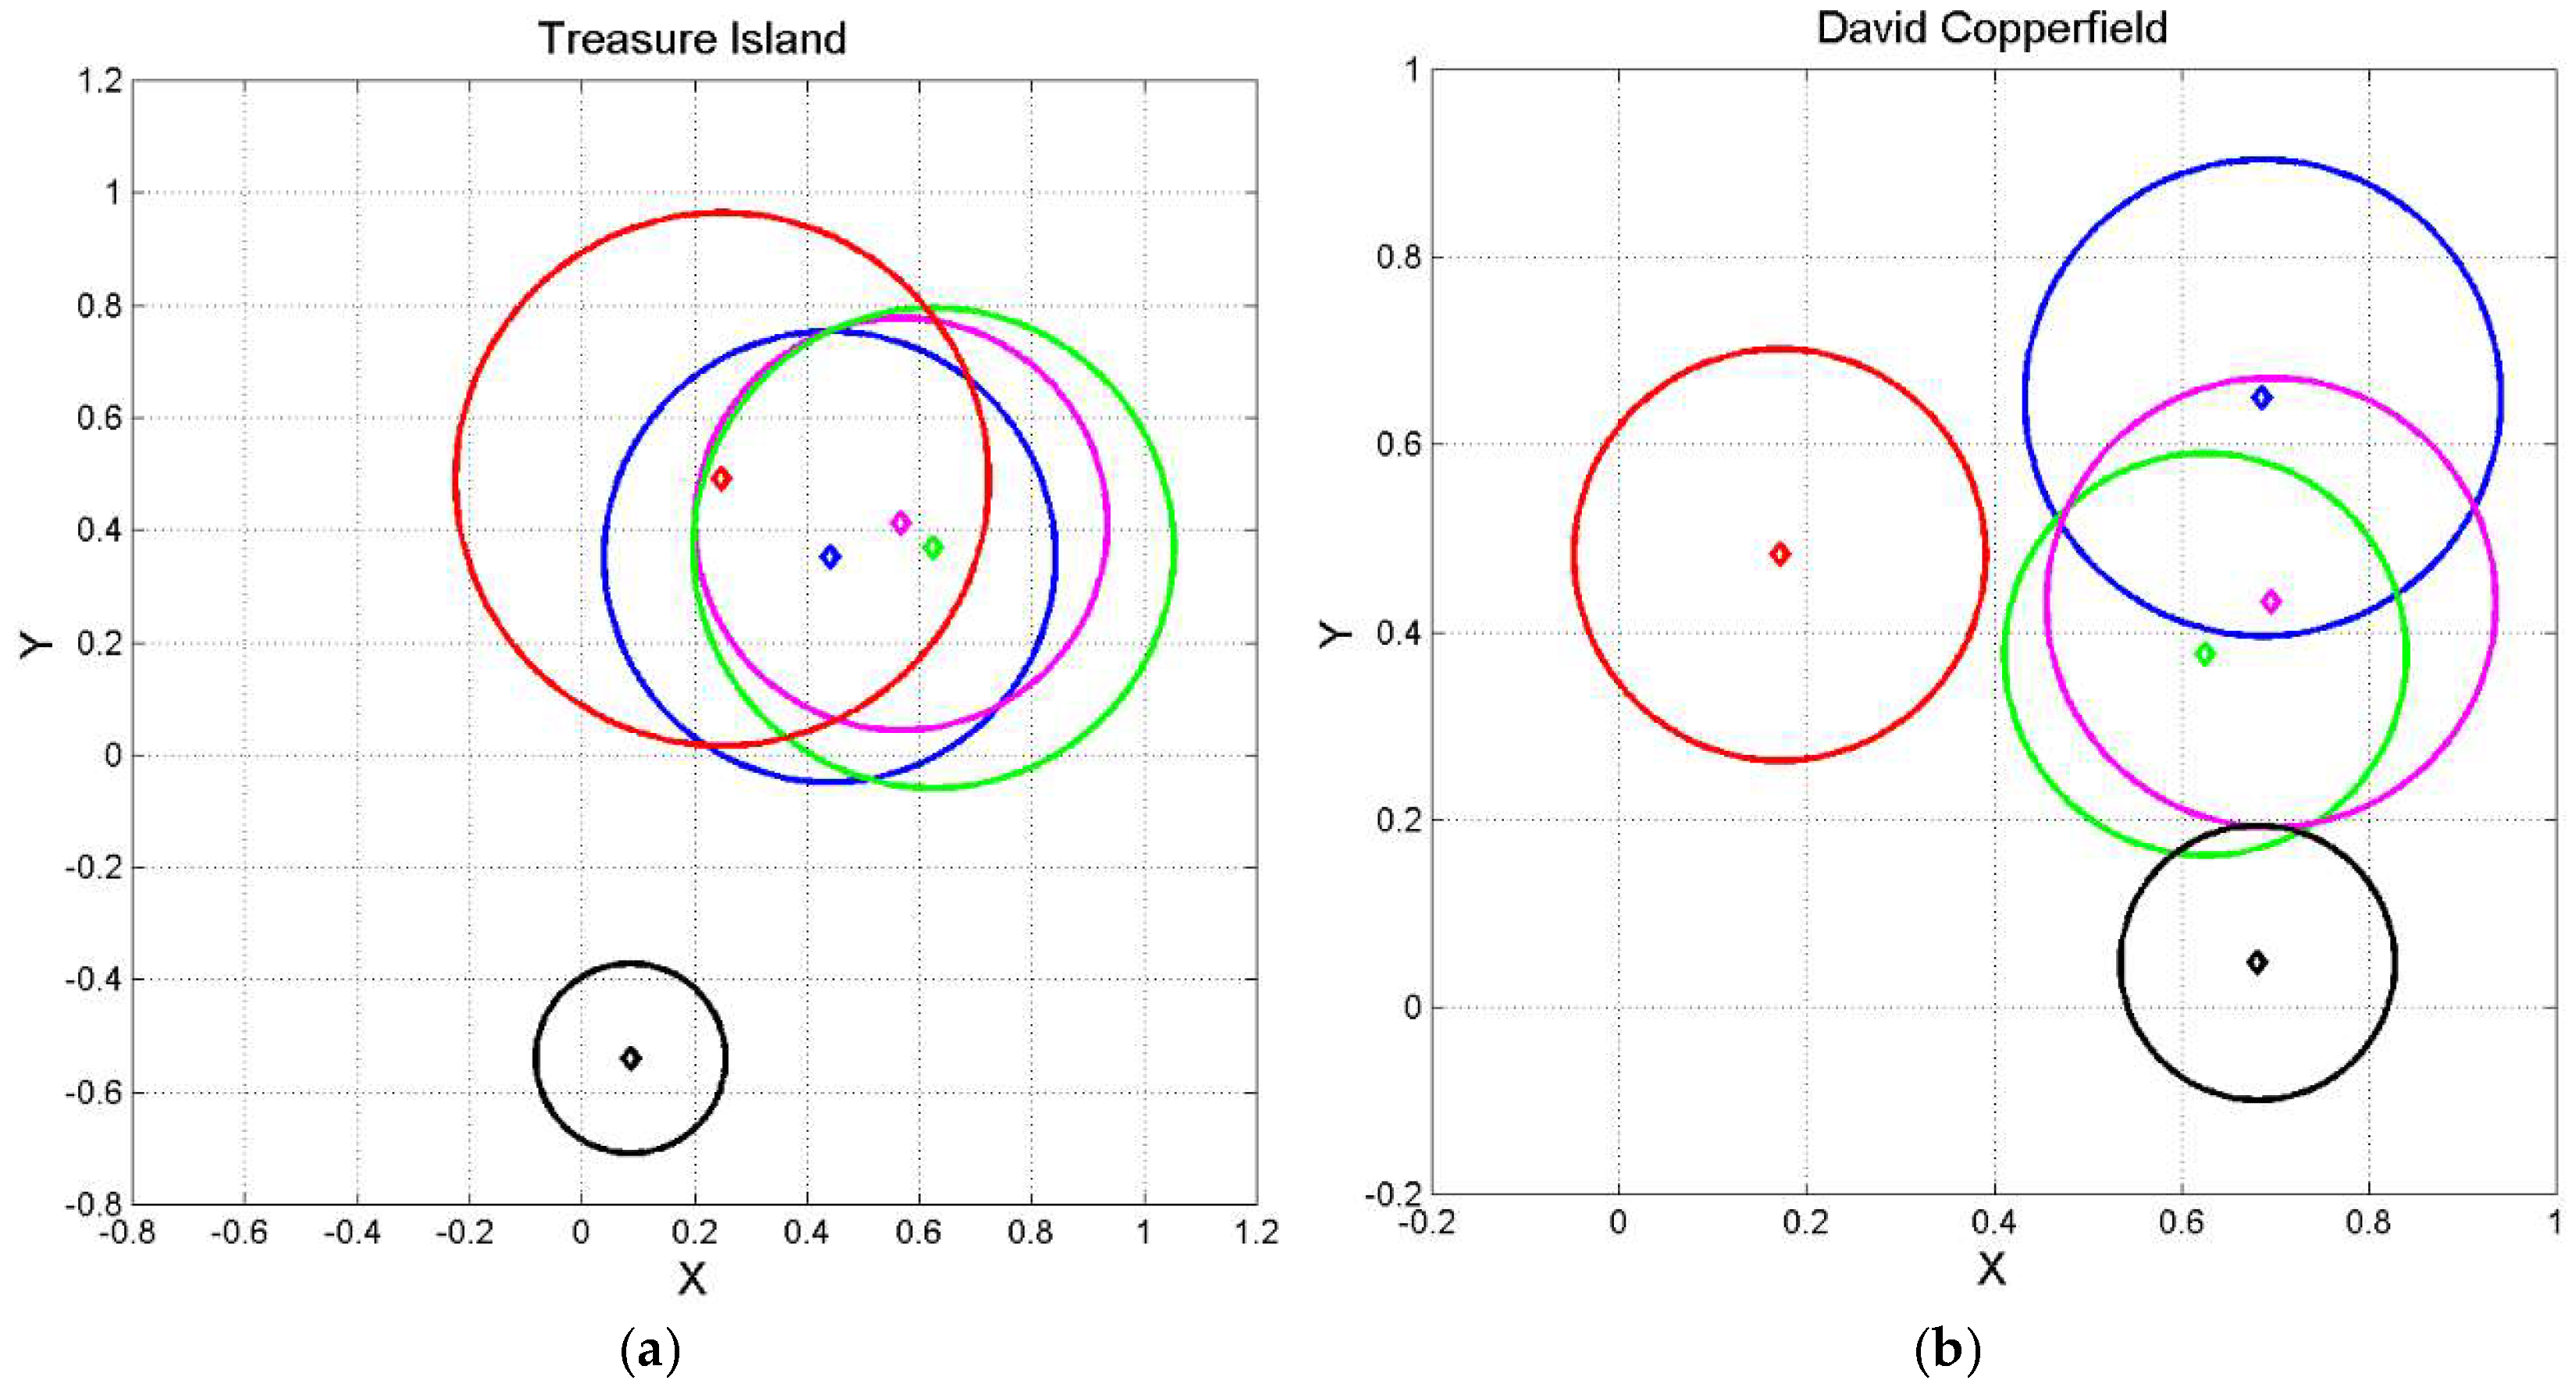
Table 1.
Language of translation and language family of the New Testament books (Matthew, Mark, Luke, John, Acts, Epistle to the Romans, Apocalypse), with total number of characters (, words (, sentences () and interpunctions (). The list concerning the genealogy of Jesus of Nazareth reported in Matthew 1.1−1.17 17 and in Luke 3.23−3.38 was deleted for not biasing the statistics of linguistic variables [2,4]. The source of the texts considered is reported in [2].
| Language | Order | Abbreviation | Language Family | |||||
| Greek | 1 | Gr | Hellenic | 486520 | 100145 | 4759 | 13698 | |
| Latin | 2 | Lt | Italic | 467025 | 90799 | 5370 | 18380 | |
| Esperanto | 3 | Es | Constructed | 492603 | 111259 | 5483 | 22552 | |
| French | 4 | Fr | Romance | 557764 | 133050 | 7258 | 17904 | |
| Italian | 5 | It | Romance | 505535 | 112943 | 6396 | 18284 | |
| Portuguese | 6 | Pt | Romance | 486005 | 109468 | 7080 | 20105 | |
| Romanian | 7 | Rm | Romance | 513876 | 118744 | 7021 | 18587 | |
| Spanish | 8 | Sp | Romance | 505610 | 117537 | 6518 | 18410 | |
| Danish | 9 | Dn | Germanic | 541675 | 131021 | 8762 | 22196 | |
| English | 10 | En | Germanic | 519043 | 122641 | 6590 | 16666 | |
| Finnish | 11 | Fn | Germanic | 563650 | 95879 | 5893 | 19725 | |
| German | 12 | Ge | Germanic | 547982 | 117269 | 7069 | 20233 | |
| Icelandic | 13 | Ic | Germanic | 472441 | 109170 | 7193 | 19577 | |
| Norwegian | 14 | Nr | Germanic | 572863 | 140844 | 9302 | 18370 | |
| Swedish | 15 | Sw | Germanic | 501352 | 118833 | 7668 | 15139 | |
| Bulgarian | 16 | Bg | Balto−Slavic | 490381 | 111444 | 7727 | 20093 | |
| Czech | 17 | Cz | Balto−Slavic | 416447 | 92533 | 7514 | 19465 | |
| Croatian | 18 | Cr | Balto−Slavic | 425905 | 97336 | 6750 | 17698 | |
| Polish | 19 | Pl | Balto−Slavic | 506663 | 99592 | 8181 | 21560 | |
| Russian | 20 | Rs | Balto−Slavic | 431913 | 92736 | 5594 | 22083 | |
| Serbian | 21 | Sr | Balto−Slavic | 441998 | 104585 | 7532 | 18251 | |
| Slovak | 22 | Sl | Balto−Slavic | 465280 | 100151 | 8023 | 19690 | |
| Ukrainian | 23 | Uk | Balto−Slavic | 488845 | 107047 | 8043 | 22761 | |
| Estonian | 24 | Et | Uralic | 495382 | 101657 | 6310 | 19029 | |
| Hungarian | 25 | Hn | Uralic | 508776 | 95837 | 5971 | 22970 | |
| Albanian | 26 | Al | Albanian | 502514 | 123625 | 5807 | 19352 | |
| Armenian | 27 | Ar | Armenian | 472196 | 100604 | 6595 | 18086 | |
| Welsh | 28 | Wl | Celtic | 527008 | 130698 | 5676 | 22585 | |
| Basque | 29 | Bs | Isolate | 588762 | 94898 | 5591 | 19312 | |
| Hebrew | 30 | Hb | Semitic | 372031 | 88478 | 7597 | 15806 | |
| Cebuano | 31 | Cb | Austronesian | 681407 | 146481 | 9221 | 16788 | |
| Tagalog | 32 | Tg | Austronesian | 618714 | 128209 | 7944 | 16405 | |
| Chichewa | 33 | Ch | Niger−Congo | 575454 | 94817 | 7560 | 15817 | |
| Luganda | 34 | Lg | Niger−Congo | 570738 | 91819 | 7073 | 16401 | |
| Somali | 35 | Sm | Afro−Asiatic | 584135 | 109686 | 6127 | 17765 | |
| Haitian | 36 | Ht | French Creole | 514579 | 152823 | 10429 | 23813 | |
| Nahuatl | 37 | Nh | Uto−Aztecan | 816108 | 121600 | 9263 | 19271 |
Table 2.
Mean and standard deviation of the normalized difference (%), Eq. (1), for the indicated linguistic parameter.
Table 2.
Mean and standard deviation of the normalized difference (%), Eq. (1), for the indicated linguistic parameter.
| Characters | Words | Sentences | Interpunctions | |
| Mean | 6.82 | 11.09 | 49.30 | 39.07 |
| Standard deviation | 15.99 | 2.14 | 26.71 | 17.43 |
Table 3.
Mean value (left number of column, ) and standard deviation (right number, ) of the the surface deep−language parameters in the indicated language of the New Testament books (Matthew, Mark, Luke, John, Acts, Epistle to the Romans, Apocalypse,), calculated from 155 samples in each language. For example, in Greek with standard deviation .
| Language | ||||
| Greek | 23.07 6.65 | 7.47 1.09 | 4.86 0.25 | 3.08 0.73 |
| Latin | 18.28 4.77 | 5.07 0.68 | 5.16 0.28 | 3.60 0.77 |
| Esperanto | 21.83 5.22 | 5.05 0.57 | 4.43 0.20 | 4.30 0.76 |
| French | 18.73 2.51 | 7.54 0.85 | 4.20 0.16 | 2.50 0.32 |
| Italian | 18.33 3.27 | 6.38 0.95 | 4.48 0.19 | 2.89 0.40 |
| Portuguese | 16.18 3.25 | 5.54 0.59 | 4.43 0.20 | 2.93 0.56 |
| Romanian | 18.00 4.19 | 6.49 0.74 | 4.34 0.19 | 2.78 0.65 |
| Spanish | 19.07 3.79 | 6.55 0.82 | 4.30 0.19 | 2.91 0.47 |
| Danish | 15.38 2.15 | 5.97 0.64 | 4.14 0.16 | 2.59 0.33 |
| English | 19.32 3.20 | 7.51 0.93 | 4.24 0.17 | 2.58 0.39 |
| Finnish | 17.44 4.09 | 4.94 0.56 | 5.90 0.31 | 3.54 0.75 |
| German | 17.23 2.77 | 5.89 0.60 | 4.68 0.19 | 2.94 0.45 |
| Icelandic | 15.72 2.58 | 5.69 0.67 | 4.34 0.18 | 2.77 0.39 |
| Norwegian | 15.21 1.43 | 7.75 0.84 | 4.08 0.13 | 1.98 0.22 |
| Swedish | 15.95 2.17 | 8.06 1.35 | 4.23 0.18 | 2.01 0.31 |
| Bulgarian | 14.97 2.61 | 5.64 0.64 | 4.41 0.19 | 2.67 0.43 |
| Czech | 13.20 3.10 | 4.89 0.65 | 4.51 0.21 | 2.71 0.61 |
| Croatian | 15.32 3.54 | 5.62 0.75 | 4.39 0.22 | 2.72 0.49 |
| Polish | 12.34 1.93 | 4.65 0.43 | 5.10 0.22 | 2.67 0.40 |
| Russian | 17.90 4.46 | 4.28 0.46 | 4.67 0.27 | 4.18 0.92 |
| Serbian | 14.46 2.42 | 5.81 0.69 | 4.24 0.20 | 2.50 0.39 |
| Slovak | 12.95 2.10 | 5.18 0.61 | 4.65 0.23 | 2.51 0.36 |
| Ukrainian | 13.81 2.18 | 4.72 0.41 | 4.56 0.26 | 2.95 0.58 |
| Estonian | 17.09 3.89 | 5.45 0.66 | 4.89 0.24 | 3.14 0.64 |
| Hungarian | 17.37 4.54 | 4.25 0.45 | 5.31 0.29 | 4.09 0.93 |
| Albanian | 22.72 4.86 | 6.52 0.78 | 4.07 0.22 | 3.48 0.61 |
| Armenian | 16.09 3.07 | 5.63 0.52 | 4.75 0.40 | 2.86 0.47 |
| Welsh | 24.27 4.75 | 5.84 0.44 | 4.04 0.15 | 4.16 0.76 |
| Basque | 18.09 4.31 | 4.99 0.52 | 6.22 0.27 | 3.63 0.81 |
| Hebrew | 12.17 2.04 | 5.65 0.59 | 4.22 0.17 | 2.16 0.33 |
| Cebuano | 16.15 1.71 | 8.82 1.01 | 4.65 0.10 | 1.85 0.22 |
| Tagalog | 16.98 3.24 | 7.92 0.82 | 4.83 0.17 | 2.16 0.44 |
| Chichewa | 12.89 1.79 | 6.18 0.87 | 6.08 0.18 | 2.10 0.25 |
| Luganda | 13.65 2.78 | 5.74 0.82 | 6.23 0.23 | 2.39 0.40 |
| Somali | 19.57 5.50 | 6.37 1.01 | 5.32 0.16 | 3.06 0.65 |
| Haitian | 14.87 1.83 | 6.55 0.71 | 3.37 0.10 | 2.28 0.26 |
| Nahuatl | 13.36 1.70 | 6.47 0.91 | 6.71 0.24 | 2.08 0.24 |
Table 4.
Synthesis of domestication index (%) in the indicated translations. The column gives the number of translations that do not overlap with the language indicated in the first column. The other columns, for the language indicated in the first column, list the languages whose is in the indicated range, and the language with minimum . In Latin, for example: 7 languages do not overlapp; 7 languages overlap (Fr, It, Rm, Sp, Ge, Et, Hn) in the range ; 5 languages overlap in the range . The language with is Rm; the 18 languages not mentioned have . The language that is mostly not connected with the other languages is Nahuatl.
| Language of | ||||
| Greek | 18 | −− | Sm | Sm |
| Latin | 7 | Fr, It, Rm, Sp, Ge, Et, Hn | En, Fn, Sw, Ar, Sm | Rm |
| Esperanto | 17 | Al | Wl | Al |
| French | 13 | Lt, It, En | Rm, Sp, Fn, Hn, Sm | En |
| Italian | 9 | Lt, Fr, Rm, Sp, Ge, Et, Hn, | En, Fn | Rm |
| Portuguese | 9 | Dn, Ic, Cr | Ge, Bg, Sr, Rs, Et, Hn, Ar | Ic |
| Romanian | 7 | Lt, It, Sp, Ge, Et, Hn | Fr, En, Rs, Ar | It |
| Spanish | 9 | Lt, It, Rm | Fr, En, Hn | It |
| Danish | 14 | Pt, Ic, Bg, Cr, Sr | Ar | Ic |
| English | 12 | Fr, Sm | Lt, It, Sp, Fn, | Fr |
| Finnish | 10 | Sw, Bs | Lt, Fr, It, En, Tg, Sm | Sw |
| German | 10 | Lt, It, Rm, Et, Hn | Pt, Sp, Ar | Et |
| Icelandic | 10 | Pt, Dn, Bg, Cr | Sr, Ar | Dn |
| Norwegian | 9 | −− | Sw, Et, Ar | Sw |
| Swedish | 6 | Fn | Lt, Nr, Et, Bs, Tg | Fn |
| Bulgarian | 14 | Dn, Ic, Cr, Sr | Pt, Uk, Ar | Dn |
| Czech | 19 | Si, Uk, Hb | Pl, Sr, Ht | Uk |
| Croatian | 10 | Pt, Dn, Ic, Bg, Sr, Hb | Uk, Ar, Ht | Bg |
| Polish | 24 | Sl | Cz, Hb | Sl |
| Russian | 8 | −− | Pt, Rm, Et, Hn | Hn |
| Serbian | 14 | Dn, Bg, Cr | Pt, Ic, Cz, Sl, Uk, Ht | Bg |
| Slovak | 19 | Pl | Sr, Uk, Hb | Pl |
| Ukrainian | 16 | Cz | Bg, Cr, Sr, Sl, Ht | Cz |
| Estonian | 5 | Lt, It, Rm, Ge, Hn, Ar | Pt, Sp, Nr, Sw, Rs | Hn |
| Hungarian | 6 | Lt, It, Rm, Ge, Et | Fr, Pt, Sp, Rs, Ar | Et |
| Albanian | 19 | Es | Wl | Es |
| Armenian | 8 | Et | Pt, Rm, Dn, Ge, Ic, Nr, Bg, Cr, Hn | Et |
| Welsh | 26 | −− | Es, Al | Al |
| Basque | 14 | Fn, Tg, Sm | Sw, Cb | Tg |
| Hebrew | 25 | Cz | Pl, Sl | Cz |
| Cebuano | 18 | Tg | Bs | Tg |
| Tagalog | 16 | Bs, Cb | Fn, Sw, Sm | Bs |
| Chichewa | 27 | Lg | −− | Lg |
| Luganda | 25 | Ch | −− | Ch |
| Somali | 10 | En, Bs | Gr, Lt, Fr, Fn, Tg, | Bs |
| Haitian | 18 | −− | Cz, Cr, Sr, Uk | Uk |
| Nahuatl | 31 | −− | −− | Lg |
Table 5.
Treasure Island. Total number of characters (, words (, sentences () and interpunctions (), mean value (left number of column, ) and standard deviation (right number, ) of the deep−language parameters in the indicated versions. Notice that the values of and here reported differ from those reported in [5], because in [5] only sentences ending with full periods were considered.
| Language | |||||||||
| English | 273,717 | 68033 | 3824 | 11503 | 18.93 4.89 | 6.05 0.93 | 4.02 0.09 | 3.09 0.38 | |
| French | 309,923 | 68818 | 4054 | 11443 | 17.80 4.08 | 6.11 0.80 | 4.50 0.14 | 2.88 0.33 | |
| German | 349,955 | 72119 | 4111 | 12294 | 18.27 3.68 | 5.96 0.74 | 4.85 0.16 | 3.05 0.36 | |
| Italian | 305,132 | 64603 | 3805 | 10077 | 17.92 4.33 | 6.52 0.86 | 4.72 0.12 | 2.72 0.37 | |
| Russian | 265,428 | 54142 | 5218 | 12006 | 10.63 1.75 | 4.53 0.31 | 4.90 0.14 | 2.34 0.26 |
Table 6.
David Copperfield. Total number of characters (, words (, sentences () and interpunctions (), mean value (left number of column, ) and standard deviation (right number, ) of the deep−language parameters in the indicated versions. Notice that the values of and here reported differ from those reported in [5], because in [5] only sentences ending with full periods were considered.
| Language | ||||||||
| English | 1,468,884 | 363,284 | 19610 | 64914 | 18.83 2.50 | 5.61 0.30 | 4.04 0.12 | 3.35 0.33 |
| French | 1,700,735 | 366,762 | 18456 | 54770 | 20.21 2.62 | 6.73 0.49 | 4.64 0.08 | 3.00 0.26 |
| Italian | 1,596,684 | 334,864 | 18919 | 52367 | 17.97 2.27 | 6.42 0.39 | 4.77 0.10 | 2.80 0.26 |
| Spanish | 1,511,564 | 338,041 | 18654 | 46938 | 18.37 2.19 | 7.24 0.56 | 4.47 0.10 | 2.53 0.19 |
| Finnish | 1,764,033 | 295,564 | 19614 | 65270 | 15.25 1.67 | 4.55 0.18 | 5.97 0.14 | 3.36 0.28 |
Table 7.
Treasure Island. Domestication index (%) in the indicated languages.
| English | French | German | Italian | Russian | ||
| English | 0 | 33.54 | 47.08 | 53.74 | 100 | |
| French | 33.54 | 0 | 23.04 | 28.16 | 100 | |
| German | 47.08 | 23.04 | 0 | 13.82 | 100 | |
| Italian | 53.74 | 28.16 | 13.82 | 0 | 100 | |
| Russian | 100 | 100 | 100 | 100 | 0 |
Table 8.
Treasure Island. Expansion factor in the indicated languages.
| English | French | German | Italian | Russian | |
| English | 1 | 1.18 | 1.29 | 1.11 | 2.80 |
| French | 0.85 | 1 | 1.09 | 0.94 | 2.38 |
| German | 0.77 | 0.91 | 1 | 0.86 | 2.17 |
| Italian | 0.90 | 1.07 | 1.16 | 1 | 2.52 |
| Russian | 0.36 | 0.42 | 0.46 | 0.40 | 1 |
Table 9.
David Copperfield. Domestication index (%) in the indicated languages.
| English | French | Italian | Spanish | Finnish | |
| English | 0 | 100 | 100 | 100 | 100 |
| French | 100 | 0 | 70.88 | 54.35 | 100 |
| Italian | 100 | 70.88 | 0 | 24.87 | 97.22 |
| Spanish | 100 | 54.35 | 24.87 | 0 | 99.94 |
| Finnish | 100 | 100 | 97.22 | 99.94 | 0 |
Table 10.
David Copperfield. Expansion factor in the indicated languages.
| English | French | Italian | Spanish | Finnish | |||
| English | 1 | 0.86 | 1.02 | 0.92 | 1.50 | ||
| French | 1.16 | 1 | 1.18 | 1.06 | 1.73 | ||
| Italian | 0.98 | 0.84 | 1 | 0.90 | 1.46 | ||
| Spanish | 1.09 | 0.94 | 1.12 | 1 | 1.64 | ||
| Finnish | 0.67 | 0.58 | 0.68 | 0.61 | 1 |
Disclaimer/Publisher’s Note: The statements, opinions and data contained in all publications are solely those of the individual author(s) and contributor(s) and not of MDPI and/or the editor(s). MDPI and/or the editor(s) disclaim responsibility for any injury to people or property resulting from any ideas, methods, instructions or products referred to in the content. |
© 2025 by the authors. Licensee MDPI, Basel, Switzerland. This article is an open access article distributed under the terms and conditions of the Creative Commons Attribution (CC BY) license (http://creativecommons.org/licenses/by/4.0/).
Copyright: This open access article is published under a Creative Commons CC BY 4.0 license, which permit the free download, distribution, and reuse, provided that the author and preprint are cited in any reuse.


